OCCUPATIONAL AWARENESS OF RURAL WOMEN WORKERS IN HEN POULTRY FARM, COIMBATORE DISTRICT, SOUTH INDIA
193
“Let the Science be your passion” International Journal of Current Research and Review (IJCRR) P-ISSN: 2231-2196 (Print) E-ISSN: 0975-5241 (e-version) Internationally Indexed, Peer Reviewed, Multidisciplinary Scientific Journal ICV: 4.18 Vol 04 / Issue 17 / September 2012 Frequency: Fortnightly Language: English Published by: Radiance Research Academy, Nagpur, MH, India
-
Upload
bharathiyaruniversity -
Category
Documents
-
view
1 -
download
0
Transcript of OCCUPATIONAL AWARENESS OF RURAL WOMEN WORKERS IN HEN POULTRY FARM, COIMBATORE DISTRICT, SOUTH INDIA

“Let the Science be your passion”
International Journal of Current Research and Review
(IJCRR)
P-ISSN: 2231-2196 (Print)
E-ISSN: 0975-5241 (e-version)
Internationally Indexed,
Peer Reviewed,
Multidisciplinary Scientific Journal
ICV: 4.18
Vol 04 / Issue 17 / September 2012
Frequency: Fortnightly
Language: English
Published by:
Radiance Research Academy,
Nagpur, MH, India

Editorial Board
Dr. Prof. Dato’ Proom Promwichit
Masterskill University, Malaysia
Dr. Nahla Salah Eldin Barakat
University of Alexandria, Alexandria, Egypt
Dr. Ann Magoufis
Ariston College, Shannon, Ireland
Dr. Pongsak Rattanachaikunsopon
Ubon Ratchathani University, Thailand
Dr. Chellappan Dinesh
International Medical University, Malaysia
Dr. R. O. Ganjiwale
Nagpur University, MH, India
Dr. Shailesh Wader
Nagpur University, MH, India
Dr. Alabi Olufemi Mobolaji
Bowen University, Iwo, Osun-State, Nigeria
Dr. Joshua Danso Owusu-Sekyere
University of Cape Coast, Cape Coast, Ghana
Dr. Okorie Ndidiamaka Hannah
University of Nigeria Nsukka, Enugu State
Dr. Parichat Phumkhachorn
Ubon Ratchathani University, Thailand
Dr. Manoj Charde
Amravati University, MH, India
Dr. Shah Murad Mastoi
Lahore Medical and Dental College, Lahore,
Pakistan
Dr. Hitesh Wadhwa
MD University, HY, India
I
J
C
R
R ISSN 0975-5241
IC Value of Journal: 4.18
“Let the science be your passion”
Vol 4 / Issue 14 / July 2012
I
J
C
R
R “Let the science be your passion”
Vol 4 / Issue 17 / September 2012

About International Journal of Current Research and Review (ijcrr)
International Journal of Current Research and Review (ijcrr) is one of the popular
fortnightly international multidisciplinary science journals. ijcrr is a peer reviewed
indexed journal which is available online and in print format as well. References
have shown that within short span of time, citations for ijcrr are increasing with noticeable pace.
Indexed in: ProQuest, Revistas Médicas Portuguesas, Index Copernicus, DOAJ,
BOAI, SOROS, NEWJOUR, ResearchGATE, Ulrich's Periodicals Directory,
EBSCO, DocStoc, PdfCast, getCITED, SkyDrive, Citebase, e-Print, WorldCat
(World's largest network of library content and services), Electronic Journals Library by University Library of Regensburg, Science Central, SciPeople.
Title suggested in: Google Scholar, Scopus, Thomson Reuters.
Aims and Scope:
Ijcrr is a fortnightly indexed international journal publishing the finest peer-
reviewed research and review articles in all fields of Science. ijcrr follows stringent
guidelines to select the manuscripts on the basis of its originality, importance,
timeliness, accessibility, grace and astonishing conclusions. ijcrr is also popular for rapid publication of accepted manuscripts.
Mission Statement:
To set a landmark by encouraging and awarding publication of quality research and review in all streams of Science.
About the editors:
ijcrr management team is very particular in selecting its editorial board members.
Editorial board members are selected on the basis of expertise, experience and their
contribution in the field of Science. Editors are selected from different countries and
every year editorial team is updated. All editorial decisions are made by a team of
full-time journal management professionals.
ijcrr Award for Best Article:
ijcrr editorial team monthly selects one ‘Best Article’ for award among published
articles.
IJCRR is official publication of Radiance Research Academy, Nagpur, India
Administrative Office: Radiance Research Academy, 148, IMSR Building, Near NIT Complex, Ayurvedic Layout, Umrer Road, Sakkardara, Nagpur, Nagpur-24, MS, India. [email protected], www.ijcrr.com
I
J
C
R
R “Let the science be your passion”
Vol 4 / Issue 17 / September 2012

INDEX
S.
N.
Title Authors Page
No. 1 AWARENESS, ATTITUDE AND PRACTICE OF
PHARMACOVIGILANCE AMONG
HEALTHCARE PROFESSIONALS AND
STUDENTS IN A TERTIARY CARE
TEACHING HOSPITAL
Apurva Agrawal,
Parul Chaturvedi
1
2 INFLUENCE OF MICROBIAL INOCULATION
ON PLANT HEIGHT OF BLUE PINE (Pinus
Wallichiana) AND HIMALAYAN CYPRESS
(Cupressus Torulosa) UNDER NURSERY
CONDITIONS
Malik A. A,
Zargar M. Y,
Najar G. R,
Mir S. A ,
Agha F.
11
3
AN OBSERVATIONAL STUDY ON
SENSORY BASED OUTDOOR PLAY
PREFERENCES IN CHILDREN AGED
BETWEEN 3 - 12 YEARS : A PRELIMINARY
STUDY
K. R. Banumathe, Vineeta
I. Ram, Alzeena Pinto,
Samuel Jonathan
20
4
TESTING INDEX VOLATILITY OF INDIAN
STOCK MARKET IN THE CONTEXT OF
FOREIGN INSTITUTIONAL INVESTOR’S
INVESTMENT
Himanshu Barot,
V. K.Sapovadia
29
5
STUDY OF LIPID PEROXIDATION,
ANTIOXIDANT STATUS AND LIPID
PROFILE IN BREAST CANCER
G.S.R.Kedari,
G.S.R.Hareesh,
A. Saseekala
46
6 PSYCHOLOGICAL STRESS AND ORAL
DISEASES – A LINK?
Little Mahendra,
Ravi David Austin,
Jaideep Mahendra,
S. Senthil Kumar
52
7 AN IN VITRO SCREENING OF GROWTH
INHIBITORY POTENTIAL OF ALLIUM
SATIVUM TOWARDS SOME MICROBES OF
SPOILAGE AND HEALTH SIGNIFICANCE
Mamta Bhatia,
Alka Sharma
61
8 IN-VITRO ESTIMATION OF FREE RADICAL
SCAVENGING ACTIVITY OF FRUIT JUICES
BY DPPH ASSAY
Singh Meenu,
Pragzna Yanamadala,
Dharmadev Bommi
68
9 CAREER, JOB SATISFACTION AND ITS
EVALUATION METHODS
Muhammad Farzanjou
75
10
DRUG RESISTANCE PROFILE OF NEW PTB
PATIENTS WITH OR WITHOUT HIV
INFECTION
Niladri Sekhar Das
81
11 BACTERIOLOGICAL APPLICATIONS OF
QUANTUM DOTS
Nithish.U.S,
Sarah Sunitha
86
I
J
C
R
R “Let the science be your passion”
Vol 4 / Issue 17 / September 2012

INDEX
S.
N.
Title Authors Page
No.
12 EFFECT OF EARLY DEFOLIATION ON THE
NODULATION AND SOME AGRONOMIC TRAITS OF SOME SELECTED COWPEA
(Vigna Unguiculata l. Walp) VARIETIES
Ogundele O. E., Awosanya
A. O. 99
13
INTERESTING FACTS ON THYMUS GLAND
CHANGES - A REVIEW
Praful S. Jevoor, Mathada V.
Ravishankar, SandhyaDharwadkar,
Amit Magadum, Somashekhar Biradar
106
14
INDIGENOUS UNCOATED AND
HYDROXYAPATITE COATED
COMMERCIALLY PURE TITANIUM FOILS
FOR GUIDED BONE REGENERATION IN
DEFECT SITES OF IMPLANTS – AN IN VITRO STUDY
Ranzani R.,
Abby Abraham,
Chakravarthy R., Lakshmi S.
112
15
OCCUPATIONAL AWARENESS OF RURAL
WOMEN WORKERS IN HEN POULTRY
FARM, COIMBATORE DISTRICT, SOUTH INDIA
Sharmila Banu A,
Gunasekaran C, SelvaKumar
V, Mohana P, Kandappan K, Elanchezhian
M
121
16 FUSION OF FIRST AND SECOND
THORACIC RIB NEAR STERNAL END
Londhe Shashikala, Kori
Rohini,
Panjakash Samreen
127
17 CONSTRUCTION OF THE MATHEMATICAL
MODEL FOR EVALUATION AND
FORECAST OF INTERURBAN PASSENGERS TRAVEL
Shkelqim Gjevori
130
18 INFECTION RISK CONTROL IN
“COMPUTER RADIOGRAPHY
IMAGING PLATE” IN DIAGNOSTIC
RADIOLOGY DEPARTMENT
Suresh sukumar,
Sushil Yadav
139
19 STRESS ANALYSIS OF SPUR GEAR USING
FINITE ELEMENT METHOD – A REVIEW
Sushil Kumar Tiwari,
Upendra Kumar Joshi
144
20 FORMULATION AND EVALUATION OF
XANTHAN GUM BASED FLOATING TABLET OF TRAMADOL
HYDROCHLORIDE
Somnath Patil,
Swati Jagdale, Shailendra Kela, Varsha Divekar
153
21 VIBRATION THRESHOLD OF UPPER LIMB
DURING ULNT1 IN INDIVIDUALS WITH TYPE II DIABETES MELLITUS AND NON
DIABETIC INDIVIDUALS
Mamta Mohan,
Ravi Shankar Reddy, Ganesh B. M.
162
22 CARDIOVASCULAR CO-MORBIDITY AND ROLE OF EXERCISE IN RHEUMATOID
ARTHRITIS: A REVIEW
Shahnawaz Anwer, Ameed Equebal
168
23 NON-HEALING SKIN ULCER IN HIV /
TUBERCULOSIS CO-INFECTION: A CASE
REPORT
Monali N. Rajurkar, Silpi
Basak
175
24 GROWTH AND CHARACTERIZATION OF
PICRIC ACID MIXED ZTS SINGLE CRYSTALS
N. Balasundari,
P. Selvarajan, S. Lincy Mary Ponmani,
D. Jencylin
182
I
J
C
R
R “Let the science be your passion”
Vol 4 / Issue 17 / September 2012

Apurva Agrawal et al Awareness, attitude and practice of Pharmacovigilance among healthcare professionals and
students in a tertiary care teaching hospital
Int J Cur Res Rev, Sept 2012 / Vol 04 (17) , Page 1
IJCRR
Vol 04 issue 17
Section: Healthcare
Category: Research
Received on:28/06/12
Revised on:15/07/12
Accepted on:28/08/12
AWARENESS, ATTITUDE AND PRACTICE OF PHARMACOVIGILANCE
AMONG HEALTHCARE PROFESSIONALS AND STUDENTS IN A TERTIARY
CARE TEACHING HOSPITAL
Apurva Agrawal1, Parul Chaturvedi
2
1Department of Pharmacology, Geetanjali Medical College, Udaipur, Rajasthan.
E-mail of Corresponding Author: [email protected]
ABSTRACT
Aims: To find out the level of awareness and attitude towards pharmacovigilance and extent of
ADR reporting in healthcare professionals & medical students.
Materials and method: A total of 799 participants including healthcare professionals and students
were asked to fill a predesigned questionnaire. It consisted of questions regarding awareness,
attitude & practice of pharmacovigilance. Data collected were analyzed using relevant statistical
tests. Awareness between healthcare professionals & students was compared using chi square
test.
Results: 70.46% of participants responded to the questionnaire. 22% of doctors and 37% of
nurses had reported ADR to any authority in last 2 years. Lack of awareness about the ADR
reporting system was the most common reason for non-reporting. Majority of healthcare
professionals and students considered ADR reporting as very important and recommended active
involvement of pharmacovigilance in medical curriculum.
Conclusion: Overall level of awareness was low both among healthcare professionals and
students. There is a great need to increase the awareness and improve the attitude of healthcare
professionals and students towards pharmacovigilance and its national programme. Regular
training sessions and awareness campaigns need to be conducted. Pharmacovigilance should be
included in the undergraduate training of MBBS, pharmacy, nursing and physiotherapy students.
Key Words: ADR reporting, healthcare professionals, medical students, Pharmacovigilance
INTRODUCTION
Pharmacovigilance as described by WHO is
detection, assessment, understanding and
prevention of adverse effects or any other drug
related problem.[1]
Adverse drug reactions
(ADRs) are associated with significant
morbidity and mortality, and are an important
cause of hospitalizations.[2]
Studies have
shown ADRs as fourth major cause of death in
USA, but such data are lacking in India.[3]
As
health care professionals are the first one who
are in contact with patients taking drugs,
spontaneous reporting by them is an effective
way to generate early signals of ADRs. It is
the most practical way to detect rare adverse
events, adverse events caused by prolonged
use of drugs and many drug-drug interactions. [4]
Thus, awareness among healthcare workers

Apurva Agrawal et al Awareness, attitude and practice of Pharmacovigilance among healthcare professionals and
students in a tertiary care teaching hospital
Int J Cur Res Rev, Sept 2012 / Vol 04 (17) , Page 2
and their attitude towards pharmacovigilance
are important determinants of ADR reporting
rate.
WHO has developed a system for reporting of
ADRs by establishment of International Drug
Monitoring Programme, coordinated by
Uppsala Monitoring Centre, Sweden. In India
also National Pharmacovigilance Programme
(NPP) was started in 2004.[5]
This programme
was relaunched in 2010 as Pharmacovigilance
Programme of India (PvPI), and is now
coordinated by the Indian Pharmacopoeia
Commission, Ghaziabad.[6]
Still
pharmacovigilance is in its infancy phase in
India and under reporting is a major problem.
Studies done in other countries also reveal
under reporting of ADRs.[7-10]
Lack of
awareness among health care professionals is
one of the reasons for under reporting. Thus,
to improve the ADR reporting rate, it is
important to improve the awareness, attitude
and practices of the healthcare professionals
regarding pharmacovigilance. The best time to
do this is during undergraduate training of
students of MBBS, pharmacy and nursing.
This will help by developing a culture of ADR
reporting in healthcare workers. Though
studies reporting the level of awareness &
practices of pharmacovigilance have been
done in other countries, [7, 8, 11, 12]
very few
studies have focused this aspect in India, and
during literature search no such study was
found from Rajasthan. Further most of the
studies have included healthcare workers, but
studies on awareness among undergraduate
students are limited. [9]
Moreover, there was
no peripheral centre of NPP in Rajasthan.
Recently a new ADR Monitoring Center
under PvPI has been established in a Medical
College of Rajasthan. [6]
Hence, the present
study was conducted to develop a baseline
data of awareness, attitude and practice of
pharmacovigilance in health care
professionals and medical students in a
Tertiary Healthcare Teaching Hospital in
Rajasthan.
MATERIALS AND METHODS
This was a cross sectional, observational,
questionnaire based study conducted in a
Tertiary Care Teaching Hospital of Rajasthan.
Duration of study was of 2 months from 1st
May 2011 to 30th
June 2011. Total 799
participants were approached, which included
health care professionals and medical
students. All healthcare professionals working
in the Hospital including clinicians,
pharmacists and nursing staff were included.
Medical students of MBBS, students of
Nursing College, Pharmacy College and
Physiotherapy College attached to the
Hospital were included in the study. All those
who denied participation in the study and
students who have not been introduced to
Pharmacology (e.g. students who were in 1st
year of their course) were excluded from the
study.
Procedure:
Approval from Institutional Ethics Committee
was taken before starting the study. All health
care professionals and students were contacted
personally. The study was explained to them
in brief. A predesigned questionnaire was
provided to them which consisted of ten
questions for assessment of awareness,
attitude and practice of pharmacovigilance and
ADR reporting. Consent of participants was
taken in written informed consent form. They
were asked to fill the questionnaire without

Apurva Agrawal et al Awareness, attitude and practice of Pharmacovigilance among healthcare professionals and
students in a tertiary care teaching hospital
Int J Cur Res Rev, Sept 2012 / Vol 04 (17) , Page 3
any assistance. It required approximately 10 to
15 minutes filling the questionnaire.
Out of total 799 participants who were asked
to fill the questionnaire, 565 (70.7%)
responded to the questionnaire. There were 11
pharmacists, only 2 responded. Therefore,
pharmacists were not included for analysis.
Thus total 563 questionnaires were analyzed.
All questionnaires were completely filled.
Data collected were analyzed and percentages
were calculated. Awareness between
healthcare professionals and students was
compared using chi square test. Practice of
ADR reporting and reasons for non-reporting
were assessed only for healthcare
professionals as Pharmacovigilance
Programme of India (PvPI) mentions only
healthcare professionals who can report the
ADR. [6]
RESULTS
Among healthcare professionals, 73%
(73/100) doctors and 57% (115/202) nurses
responded to the questionnaire. Among
students, 72.4% (210/290) MBBS students,
96% (100/104) pharmacy students, 61%
(33/54) nursing students and 84.2% (32/38)
physiotherapy students responded to the
questionnaire. 65.4% of healthcare
professionals (83.5% of doctors and 53.9% of
nurses), while 83.5% of students have ever
heard of the term “Pharmacovigilance”.
(Table 1) Awareness about this term was
different between the two groups with
statistical significance (p value < 0.001).
41.5% of healthcare professionals (58.9% of
doctors and 30.43%of nurses) and 39% of
students were able to define
Pharmacovigilance. (Table 2) No statistically
significant difference between the two groups
(p value > 0.005) was found. 39.4% of
healthcare professionals (43.8% of doctors
and 36.5% of nurses) and 31.7% of students
were aware of National Programme for
Pharmacovigilance, (Table 2) with no
statistically significant difference (p value >
0.005).
53.7% of healthcare professionals (60.3% of
doctors and 49.6% of nurses) and 57.1% of
students had the knowledge of ADR reporting.
(Table 2) No statistically significant difference
(p value > 0.005) was found. The awareness
that any healthcare professional can report
ADR was present in 43.1% of healthcare
professionals (67.1% of doctors and 27.8% of
nurses) and 48.3% of students, (Table2) with
no statistically significant difference (p value
> 0.005). 72.3% of healthcare professionals
(91.8% of doctors and 60% of nurses) and
60.8% of students were aware how to report
ADR. (Table 2) There was statistically
significant difference between two groups
with p value < 0.01. 78.1% of doctors and
62.6% of nursing staff have not reported any
ADR to any authority in last two years. Only
21.9% of doctors and 37.4% of nursing staff
have reported any ADR to any authority in
last two years. (Figure 1)
About 56% of doctors and 46% of nurses
reported lack of awareness about the reporting
system as the major cause of non-reporting of
ADR. 20.5% of doctors and 23.5% of nurses
were not sure about the reason for non-
reporting. (Table 3) 68% of healthcare
professionals (75% of doctors and 63% of
nurses) and 76.8% of students opined that
ADR reporting is very important. Only 2.6%
of healthcare professionals and 1.6% of
students considered it as waste of time.

Apurva Agrawal et al Awareness, attitude and practice of Pharmacovigilance among healthcare professionals and
students in a tertiary care teaching hospital
Int J Cur Res Rev, Sept 2012 / Vol 04 (17) , Page 4
(Figure2) 84% of healthcare professionals
(97% of doctors and 75.6% of nurses) and
84.3% of students accepted that
pharmacovigilance should be an active part of
medical curriculum. Only 5.8% of healthcare
professionals and 6.4% of students denied.
(Figure 3)
DISCUSSION
The overall awareness about
pharmacovigilance and ADR reporting was
low, both in healthcare professionals and
students. Though majority of students (83.5%)
had heard the term “Pharmacovigilance”, less
than half (39%) could define it. These students
are told about it in pharmacology but not
actively discussed. This shows that there is a
need to stress on pharmacovigilance during
undergraduate teaching. On the other hand
65% of healthcare professionals had heard this
term which is significantly lower than that of
students, but only 41% could define it. More
doctors (59%) were able to define than
nursing staff (30%). Healthcare professionals
are not exposed to pharmacology after II year
of undergraduate course, which may be
responsible for their low awareness about the
term “Pharmacovigilance”. A Nigerian study
done on community pharmacists also reported
similar results in which 55% of responders
were aware of the term “pharmacovigilance”,
but only 18% could define it. [8]
More alarming was the lack of awareness
about the national programme. More than half
of healthcare professionals and students were
not aware about the national programme
which is running since 2004 in India. If they
do not know about it, how could they be
expected to participate in it? To make the
national programme successful, it is important
to aware the healthcare professionals about it
and how it functions. This can be done by
awareness campaigns, information leaflets etc.
About half of healthcare professionals (54%)
and students (57%) were aware about ADR
reporting. The awareness that every healthcare
professional including doctor, nurse,
pharmacist and physiotherapist can report
ADR was very low, which is in accordance
with the findings of Gupta P et al.[13]
This
awareness was minimum among nurses, both
nursing staff (28%) as well as nursing students
(21%). Active involvement of paramedical
staff in spontaneous reporting is very
important, since they are in close contact with
the patients and for a longer duration as
compared to doctors.
The ultimate goal of Pharmacovigilance is that
the benefits of medicine use outweighs the
risks and thus safeguard the health of patients.
Spontaneous ADR reporting by healthcare
professionals can play an important role to
achieve this goal. In present study only about
22% of doctors and 37% of nurses had
reported ADR to any authority in last two
years. Other studies have also reported such
low levels of ADR reporting. [7-9]
Under-
reporting is a major and worldwide problem
associated with spontaneous reporting system.
A systematic review by Hazell L et al has
stated significant and widespread under-
reporting of ADRs to spontaneous reporting
systems including serious or severe ADRs. [10]
Aggressive interventions are required to
encourage the healthcare professionals for
ADR reporting. They need to be informed that
why ADR reporting is necessary and how it
can help in ensuring safe and rational use of

Apurva Agrawal et al Awareness, attitude and practice of Pharmacovigilance among healthcare professionals and
students in a tertiary care teaching hospital
Int J Cur Res Rev, Sept 2012 / Vol 04 (17) , Page 5
medicines. Prescribers can be encouraged by
providing feedback on their ADR reports,
discussion on ADR reports in academic
meetings and publishing bulletins on ADRs.
Oreagba et al have suggested that
remuneration for ADR reporting may increase
the reporting rate. [8]
Lack of awareness about the reporting system
was the most common reason stated by
responders (56% of doctors & 46% of nurses)
for non-reporting. This finding is in
accordance with that reported by other studies, [8, 9, 13]
and is understandable as there is no
well established reporting system in this
hospital and healthcare professionals are not
well aware about the national programme.
Thus to improve the reporting rate, ADR
monitoring centers should be established in all
healthcare institutions, at least at tertiary care
level. The recent Pharmacovigilance
Programme of India targets to establish such
centre in most of the Medical Colleges of
India in coming years. [6]
This may help to
improve the existing scenario. Further to
increase the awareness about ADR reporting
system, regular training sessions and
awareness campaigns should be conducted
which may help in improving ADR reporting
rate. Ramesh M et al have reported 63%
increase in ADR reporting in one year after
the launch of continuous awareness campaign. [14]
As mentioned by other studies lack of
time, complex procedure and non significant
ADR, were among the other reasons for non-
reporting in present study also. [8, 13]
Both healthcare professionals and students had
positive attitude toward ADR reporting and
majority of them considered it as very
important. Only 2.6% of healthcare
professionals and 1.6% of students considered
it as waste of time. Further majority of
responders (84%) opined that
pharmacovigilance should be taught as an
active part of medical curriculum. As medical
students are future healthcare professionals,
there is a need to actively train them, so that
pharmacovigilance becomes a part of their
medical practice. As recommended by Rehan
et al knowledge and awareness of
pharmacovigilance among prescribers can be
improved by a reinforcement training
programme at the commencement of
internship and thereafter through continuous
education programmes. [9]
The major limitation of the present study is
that the study findings could not be applied to
wider medical community as the study was
restricted to hospital setup. Therefore it is
recommended that several studies of similar
kind especially in community setup need to be
conducted to know the awareness and attitude
of healthcare professionals in community and
their practice of pharmacovigilance. This will
help to find out the present status and to
develop strategies to improve the ADR
reporting system in India.
CONCLUSION
The results of present study show lack of
awareness about pharmacovigilance in
healthcare professionals and students. ADR
reporting rate is also very low among
healthcare professionals. There is a great need
to create awareness and promote ADR
reporting among healthcare professionals.
Regular training sessions to stress the
importance of ADR reporting and the
functioning of reporting system are required.
Further awareness about the national

Apurva Agrawal et al Awareness, attitude and practice of Pharmacovigilance among healthcare professionals and
students in a tertiary care teaching hospital
Int J Cur Res Rev, Sept 2012 / Vol 04 (17) , Page 6
programme need to be increased, this will
ensure greater participation from healthcare
professionals and success of such
programmes. Pharmacovigilance should be a
part of undergraduate curriculum of not only
MBBS students but also of students of
nursing, physiotherapy and pharmacy. As
these students are future healthcare
professionals, this will help in developing a
culture of ADR reporting in the country.
ACKNOWLEDGEMENT:
We acknowledge the ICMR (Indian Council
of Medical Research), as this study was
conducted under STS 2011 (short term
studentship).
REFERENCES:
1. Tripathi KD. Essentials of medical
pharmacology. 6th ed. New Delhi:
Jaypee Brothers Medical Publishers
(P) Ltd; 2010. p. 79.
2. Classen DC, Pestonik SL, Evans RS,
Lloyd JF, Burke JP. Adverse drug
events in hospitalized patients. JAMA
1997;277(4):301-6.
3. Lazarou J, Pomeranz BH, Corey PN.
Incidence of adverse drug reactions in
hospitalized patients – a meta-analysis
of prospective studies. JAMA
1998;279:1200-5.
4. Oates JA. The science of drug therapy.
In: Brunton LL, editor. Goodman &
gilman’s the pharmacological basis of
therapeutics. 11th ed. New York:
McGraw-Hill; 2006. p. 133-5.
5. List of NPP centers [Online]. [2010?]
[cited 2011 Jan 22]; Available from:
URL:http://www.pharmacovigilance.c
o.in/nppcentreslist.html
6. Pharmacovigilance programme of
India for assuring drug safety. Central
drug standard control organization,
Directorate General of health services,
Ministry of health and family welfare,
Government of India [Online]. [cited
2011 Aug 8]; Available from: URL:
http://cdsco.nic.in/pharmacovigilance.
htm
7. Subish P, Mohammed Izham MI,
Mishra P. Evaluation of the
knowledge, attitude and practice on
adverse drug reactions and
pharmacovigilance among healthcare
professionals in a Nepalese hospital: a
preliminary study. The Internet Journal
of Pharmacology 2008;6(1).
8. Oreagba IA, Ogunleye OJ, Olayemi
SO. The knowledge, perceptions and
practice of pharmacovigilance amongst
community pharmacists in Lagos state,
south west Nigeria.
Pharmacoepidemiol Drug Saf
2011;20:30-5.
9. Rehan HS, Vasudev K, Tripathi CD.
Adverse drug reaction monitoring:
knowledge, attitude and practices of
students and prescribers. Natl Med J
India 2002;15:24-6.
10. Hazell L, Shakir SA. Under-reporting
of adverse drug reactions : a
systematic review. Drug Saf
2006;29(5):385-96.
11. Xu H, Wang Y, Liu N. A hospital-
based survey of healthcare

Apurva Agrawal et al Awareness, attitude and practice of Pharmacovigilance among healthcare professionals and
students in a tertiary care teaching hospital
Int J Cur Res Rev, Sept 2012 / Vol 04 (17) , Page 7
professionals in the awareness of
pharmacovigilance.
Pharmacoepidemiol Drug Saf 2009
Jul;18(7):624-30.
12. Ohaju-Obodo JO, Iribhogbe OI. Extent
of pharmacovigilance among resident
doctors in Edo and Lagos state of
Nigeria. Pharmacoepidemiol Drug Saf
2010;19(2):191-5.
13. Gupta P, Udupa A. Adverse drug
reaction and pharmacovigilance:
knowledge, attitude and perceptions
amongst resident doctors. J Pharm Sci
& Res 2011;3(2):1064-9.
14. Ramesh M, Parthasarathi G. Adverse
drug reactions reporting: attitude and
perceptions of medical practitioners.
Asian J Pharm Clin Res 2009;2(2):10-
4.
Table No. 1: Frequency of responders who ever heard the term “Pharmacovigilance”
S. No. Group Subgroup (n) Ever heard
‘Pharmacovigilance’
Percentage
1. Healthcare
Professionals
Doctors (73) 61 83.56
Nurses (115) 62 53.9
2. Students MBBS (210) 198 94.28
Nursing (33) 19 57.57
Pharmacy (100) 68 68
Physiotherapy (32) 28 87.5
Apurva Agrawal et al Awareness, attitude and practice of Pharmacovigilance among healthcare professionals and
students in a tertiary care teaching hospital
Int J Cur Res Rev, Sept 2012 / Vol 04 (17) , Page 8
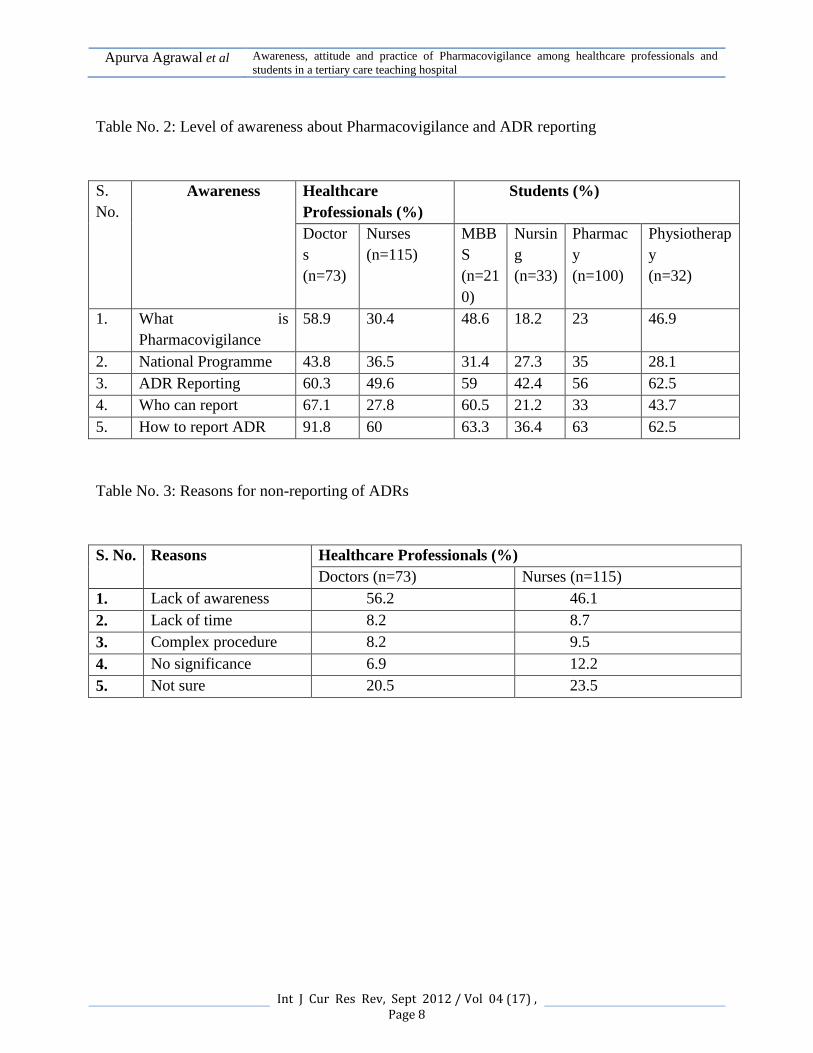
Table No. 2: Level of awareness about Pharmacovigilance and ADR reporting
S.
No.
Awareness Healthcare
Professionals (%)
Students (%)
Doctor
s
(n=73)
Nurses
(n=115)
MBB
S
(n=21
0)
Nursin
g
(n=33)
Pharmac
y
(n=100)
Physiotherap
y
(n=32)
1. What is
Pharmacovigilance
58.9 30.4 48.6 18.2 23 46.9
2. National Programme 43.8 36.5 31.4 27.3 35 28.1
3. ADR Reporting 60.3 49.6 59 42.4 56 62.5
4. Who can report 67.1 27.8 60.5 21.2 33 43.7
5. How to report ADR 91.8 60 63.3 36.4 63 62.5
Table No. 3: Reasons for non-reporting of ADRs
S. No. Reasons Healthcare Professionals (%)
Doctors (n=73) Nurses (n=115)
1. Lack of awareness 56.2 46.1
2. Lack of time 8.2 8.7
3. Complex procedure 8.2 9.5
4. No significance 6.9 12.2
5. Not sure 20.5 23.5

Apurva Agrawal et al Awareness, attitude and practice of Pharmacovigilance among healthcare professionals and
students in a tertiary care teaching hospital
Int J Cur Res Rev, Sept 2012 / Vol 04 (17) , Page 9
Figure No. 1: Frequency of ADR reported by Healthcare Professionals in last 2 years
Figure No. 2: Importance of ADR reporting in views of Healthcare Professionals & Students

Apurva Agrawal et al Awareness, attitude and practice of Pharmacovigilance among healthcare professionals and
students in a tertiary care teaching hospital
Int J Cur Res Rev, Sept 2012 / Vol 04 (17) , Page 10
Figure No. 3: Opinion of responders regarding inclusion of Pharmacovigilance in medical
curriculum

Malik A. A. et al INFLUENCE OF MICROBIAL INOCULATION ON PLANT HEIGHT OF BLUE PINE (Pinus
Wallichiana) AND HIMALAYAN CYPRESS (Cupressus Torulosa) UNDER NURSERY CONDITIONS
Int J Cur Res Rev, Sept 2012 / Vol 04 (17) , Page 11
IJCRR
Vol 04 issue 17
Section: General Science
Category: Research
Received on:17/06/12
Revised on:13/07/12
Accepted on:12/08/12
INFLUENCE OF MICROBIAL INOCULATION ON PLANT HEIGHT
OF BLUE PINE (Pinus Wallichiana) AND HIMALAYAN CYPRESS
(Cupressus Torulosa) UNDER NURSERY CONDITIONS
Malik A . A1, Zargar M.Y
2, Najar G . R
3, Mir S. A
4 , Agha F.
5
1 Division of Environmental Sciences, Skuast-Kashmir, India
2 Regional Research Station (RRS ),Wadura,Kashmir, India
3 Division of Soil Science ( FAO ) Wadura,Kashmir, India
4 Division of Agri-Stat, Skuast-Kashmir, India
5 Division of Agronomy, Skuast-Kashmir, India
ABSTRACT
A pot experiment was carried out during 2009 -2010 to study the impact of microbial inoculants
on plant height of Blue pine (Pinus wallichiana A.B. Jackson) and Himalayan cypress
(Cupressus torulosa Don) under nursery conditions. The experiment was laid in Completely
Randomized Design with three replications which comprised forty-two treatment combinations
of seven inoculants (Azotobacter sp., Azospirillum sp., Pseudomonas fluorescens, Bacillus
subtilis, Pisolithus tinctorius, Laccaria laccata and control). The growth character viz., plant
height at various intervals responded significantly to all the microbial inoculants. Maximum
plant height was recorded in Himalayan cypress (38.72 cm) as compared to Blue pine seedlings
(24.78 cm). Among microbial inoculants the two ectomycorrhizae viz., Pisolithus tinctorius and
Laccaria laccata gave best results than rest of the inoculants. It was followed by Azotobacter sp.,
Azospirillum sp., Pseudomonas fluorescens and Bacillus subtillis. Thus the two treatments viz.,
Pisolithus tinctorius and Laccaria laccata proved to be the best for the studied parameter viz.,
plant height of both the species.
Key words : Pinus wallichiana, Cupressus torulosa, Microbial inoculation, Azotobacter,
Azospirillum, Pseudomonas, Bacillus, Pisolithus, Laccaria
INTRODUCTION
The geographical area of Jammu and Kashmir
is 1,01,387 km2 excluding the area under
Pakistan and China with recorded forest area
of 20,230 km2 inside line of control. However,
recorded forest cover as per Forest Survey of
India is only 16,309 km2 (Anonymous,
2009a). Commercial forests of the state
occupy only 8,26,939 ha (Anonymous, 2005).
As per inventory records, very dense forests in
Jammu and Kashmir occupy 2,95,800 ha,
moderately dense 6,50,700 ha, open forests
have now spread over 6,84,400 ha and rest of
the recorded forests have been engulfed by
blanks and scrubs (Anonymous, 2009b). The

Malik A. A. et al INFLUENCE OF MICROBIAL INOCULATION ON PLANT HEIGHT OF BLUE PINE (Pinus
Wallichiana) AND HIMALAYAN CYPRESS (Cupressus Torulosa) UNDER NURSERY CONDITIONS
Int J Cur Res Rev, Sept 2012 / Vol 04 (17) , Page 12
growing stock of our commercial forests is
132.9 million m3 with average annual yield of
1.65 m3 ha
-1 (Anonymous, 2009b). With this
productivity annual yield of timber from
commercial forest area alone must be 27.25
million cubic feet. Contrary to this fact, we
presently import timber. Due to timber mining
more than 60 per cent of our demarcated
forests have been declared as
uncommercial/degraded (Anonymous, 2005).
Natural regeneration does not practically take
place in forests where crown density is less
than 40 per cent. Relying on natural
succession, it will take us hundreds of years to
regenerate the degraded forests to climax
stage with species like Pinus wallichiana
Jackson (kail), Cedrus deodara (Roxb.), G.
Don (Deodar), Abies pindrow Spach (silver
fir), Picea smithiana Wall. (spruce) and
Cupressus torulosa Don (Himalayan cypress)
which dominate vegetation of our forests.To
meet the huge demand and supply of timber,
fuelwood and firewood, raising of blue pine
and Himalayan cypress forests on degraded
forest patches can be a good and viable option
in future. The indiscriminate use of inorganic
fertilizers and pesticides is neither
environmentally safe nor economically
feasible. There is pressing demand for
microbial inoculants for quality seedling
production in nursery and also the
establishment of plantation to increase the
forest productivity. Bioinoculants are cost
effective, ecofriendly, cheaper and renewable
sources of plant nutrients and play a vital role
in maintaining long-term soil fertility and
sustainability. Thus, to meet the challenges
like poor regeneration, deforestation and
spread of wastelands, introduction of
microbial inoculants at the nursery stage of
forest trees has become inevitable. Although
various aspects of mycorrhizal impact of the
forest trees have been studied, no work has
been done on the impact of other microbial
inoculants on the regeneration of forest trees.
Therefore, the present study was undertaken to
determine the role of microbial inoculation on
growth attribute viz.,plant height of Blue pine
and Himalayan cypress under nursery
conditions.
MATERIALS AND METHODS
The present investigations were undertaken at
the Forest Nursery of Department of Forestry,
Faculty of Agriculture and Regional Research
Station, SKUAST-Kashmir, Wadura, Sopore
during 2009-2010.Microbial inoculants
isolated from rhizosphere of blue pine and
Himalayan cypress forest stands were used in
the studies.
Mass production of microbial inoculants
The two free living aerobic nitrogen fixing
bacteria viz., Azotobacter sp. and Azospirillum
sp. were mass cultured using nutrient medium
enriched with glucose and peptone. Plant
growth promoting rhizobacteria (PGPR) viz.,
Pseudomonas fluorescens and Bacillus subtilis
were mass propagated in King’s B nutrient
broth. The two ectomycorrhizae viz.,
Pisolithus tinctorius and Laccaria laccata
were mass multiplied in Melin Norkran’s
nutrient broth and Potato Dextrose Agar,
respectively.
Field operations
For the microbial inoculation, one year old
seedlings of blue pine and Himalayan cypress
of uniform heights and collar diameter
growing in polyethylene bags (9 x 7)
containing 1 kg potting material of soil and

Malik A. A. et al INFLUENCE OF MICROBIAL INOCULATION ON PLANT HEIGHT OF BLUE PINE (Pinus
Wallichiana) AND HIMALAYAN CYPRESS (Cupressus Torulosa) UNDER NURSERY CONDITIONS
Int J Cur Res Rev, Sept 2012 / Vol 04 (17) , Page 13
sand mixture in the ratio of 1:1 were selected.
Microbial inoculation
For inoculation, the different broth cultures of
N-fixers, P-solubilizers and ectomycorrhizal
inoculants isolated from local forest stands
were applied to the potting material (25
ml/seedling) in the month of March, 2010,
without disturbing the root system of the
seedlings.
Nursery operations
The seedlings were irrigated with rose-cans as
and when needed and maintained virtually
weed free by manual weeding
Plant growth measurement
The growth parameter viz., plant height (cm)
of both the species were measured by using
measuring tape at an interval of 2 months upto
12 months.The plant height of the seedlings at
the initial stage of the experiment were also
recorded.
Statistical analysis
The data was statistically analysed by using
O.P Stat software developed by Haryana
Agriculture University, Hisar.
Results and Discussion
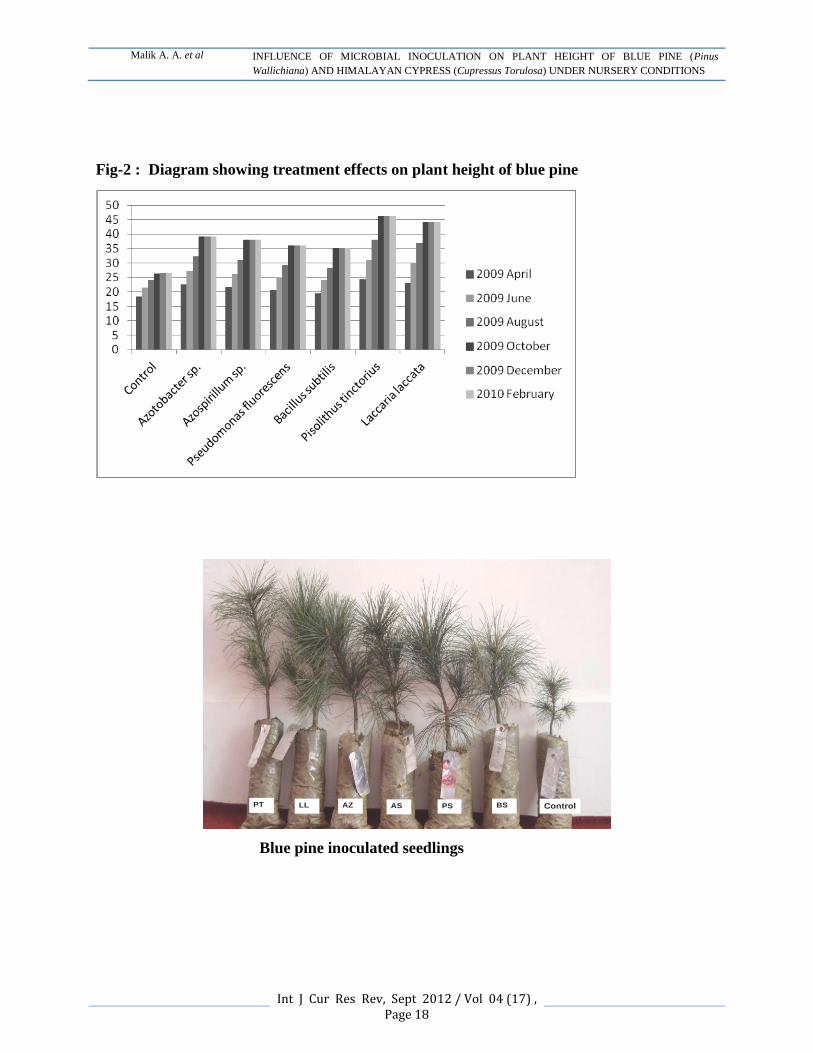
Plant height
The data on impact of various microbial
inoculants on plant height of Blue pine
seedlings indicates that mean plant height was
significantly more in response to various
treatments as compared to control (Table-
1;Fig 1, Plate-1). Azotobacter and
Azospirillum inoculation exhibited 37.17 and
36.83 per cent more plant height over control.
Similarly Pseudomonas flourescens and
Bacillus subtilis inoculation resulted in 35.56
and 33.91 per cent more plant height while as
the inoculation with two ectomycorrhizal
fungi viz., Pisolithus tinctorius and Laccaria
laccata resulted in 42.97 and 40.77 per cent
more plant height as compared to control
respectively. However, the application of
Pisolithus tinctorius showed maximum
increase (42.97%) in plant height over control,
thus proved superior over all the individual
inoculants. Moreover, there was an increasing
trend in plant height from April to October
and from December onwards till February
there was a slight increase. The interactions
between inocula and months were significant
till October and from December to February it
was non-significant. Perusal of the data
presented in Table-2,Fig 2,Plate-1 shows that
the application of various microbial inoculants
significantly enhanced the mean plant height
of the Himalayan cypress seedlings as
compared to control. Amongst various
microbial inoculants, Pisolithus tinctorius
resulted in maximum increase in plant height
over control (38.27 %). It was followed by
Laccaria laccata (35.66%), Azotobacter sp.
(28.29%), Azospirillum sp. (25.91%),
Pseudomonas fluorescens (21.76%) and
Bacillus subtilis (19.36%), respectively.
Treatment of seedlings with ectomycorrhizal
fungi viz., Pisolithus tinctorius was
significantly superior over all other
treatments. Plant height revealed a significant
increase from April to October and from
October on wards till February there was a
slight increase. Moreover, the interactions
between inocula and month’s were significant
till October and thereafter it was non-
significant. The increase in shoot height by P.
tinctorius and L. laccata could be attributed to
the production of growth promoting

Malik A. A. et al INFLUENCE OF MICROBIAL INOCULATION ON PLANT HEIGHT OF BLUE PINE (Pinus
Wallichiana) AND HIMALAYAN CYPRESS (Cupressus Torulosa) UNDER NURSERY CONDITIONS
Int J Cur Res Rev, Sept 2012 / Vol 04 (17) , Page 14
substances like auxins (Dehn, 1982) and
enhancement of water absorption and nutrient
mobilization (Dar et al., 1997) by vastly
increased surface area network of the fungal
mycelia (Myer, 1992). In case of Azotobacter
and Azospirillum sp. inoculation the increase
in shoot height could be ascribed to nitrogen
fixing ability, synthesis of growth promoting
substances like cytokinens, gibberellins,
auxins (Reynders and Vlassak, 1979;
Hartmann et al., 1983; Jain and Patriquin,
1985) and production of antifungal antibiotics
(Chahal and Chahal, 1988). However, increase
in shoot height by inoculation with
Pseudomonas fluorescens and Bacillus subtilis
could be through iron chelating siderophores
(Schippers, 1988) by releasing
phytohormones, solubilizing P and reduction
in population of deleterious microorganisms
(Weller, 1988). Further our findings are in
close conformity with the results of Oh and
Park (1989), Jeffries and Dodd (1991),
Natarajan et al. (1995) who reported that P.
tinctorius and L. laccata inoculation resulted
in enhancement of plant height of Acaccia
nilotica, Quercus serrata, Eucalyptus
camaldulensis and E. deglupta seedlings
respectively. similarly, the enhancement in
plant height with respect to Azotobacter and
Azospirillum sp. has also been reported in
Quercus serrata (Pandey et al., 1986) in peach
(Awasthi et al., 1996). Moreover, the
inoculation of clover plants with
Pseudomonas putida has also been reported to
enhance the plant height (Meyer and
Linderman, 1986). However, the maximum
increase in shoot height of Himalayan cypress
seedlings lies in the fact that Himalayan
cypress being a fast growing species, has got
an efficient root system as compared to kail
which is comparatively a slow growing
species. Moreover, the gradual decline in plant
height of both the species in the later half of
study period could be due to below freezing
soil temperatures and short growing season of
conifers.
References
1. Anonymous, 2005. Handbook of
Forest Statistics. Jammu and Kashmir
Government; Forest Department,
Srinagar, J&K, pp 10.
2. Anonymous, 2009a. Forest Survey of
India. Indian State of Forest Report
2009, 5 : 44.
3. Anonymous, 2009b. Digest of Forest
Statistics. Jammu and Kashmir
Government; Forest
4. Department, Srinagar, Jammu and
Kashmir.
5. Awasthi, R.P., Godara, R.K. and
Kainth, N.S. 1996. Interaction effect of
VA-mycorrhizae
6. and Azotobacter inoculation on peach
seedlings. Indian Journal of
Horticulture 53(1) : 8-13.
7. Chahal, P.P.K. and Chahal, V.P.S.
1988. Biological control of root-knot
nematode of brinjal
8. with Azotobacter chroococcum. In :
Advances in Plant Nematology [Eds.
M.A. Maqbool,
9. A.M. Golden, A.M. Gaffar and A.
Krusberg]. Research Centre,
University of Karachi, pp. 257-263.
10. Dar. G.H., Zargar, M.Y. and Beigh,
G.M. 1997. Biocontrol of Fusarium

Malik A. A. et al INFLUENCE OF MICROBIAL INOCULATION ON PLANT HEIGHT OF BLUE PINE (Pinus
Wallichiana) AND HIMALAYAN CYPRESS (Cupressus Torulosa) UNDER NURSERY CONDITIONS
Int J Cur Res Rev, Sept 2012 / Vol 04 (17) , Page 15
root rot in common bean (Phaseolus
vulgaris L.) by using symbiotic
Glomus masseae and Rhizobium
leguminosarum. Microbial Ecology 34
: 74-80.
11. Dehn, H.W. 1982. Interaction between
vasicular-arbuscular mycorrhizal fungi
and plant pathogens. Phytopathology
72 : 115-119.
12. Hartmann, A., Singh, M. and
Klingmuller, W. 1983. Isolation and
characterization of Azospirillum
mutants excreating high amounts of
indoleacetic acid. Canadian Journal of
Microbiology 29 : 916-923.
13. Jain, D.K. and Patriquin, D.G. 1985.
Characterization of a substance
produced by Azospirillum which
causes branching of wheat root hairs.
Canadian Journal of Microbiology 31
: 206-210.
14. Jeffries, P. and Dodd, J.C. 1991. The
use of mycorrhizal inoculants in
forestry and agriculture. In : Handbook
of Applied Mycology. [Eds D.K. Arora,
Bharat Raj, K.G. Mukerji and G.R.
Knudsen]. Marcel Dekker, New York,
USA, pp. 155-185.
15. Meyer, J.R. and Liderman, R.G. 1986.
Response of subterraneum clover to
dual inoculation with VAM fungi and
a plant growth promoting bacterium
Pseudomonas putida. Soil Biology and
Biochemistry 18 : 185-190.
16. Myer, M. 1992. Mycorrhizas, their
use as biofertilziers. The horticulturists
2 : 8-12.
17. Natarajan, K., Nagarajan, G. and
Reddy, M.S. 1995. In vitro
mycorrhization and growth response of
Acacia nilotica seedlings by
inoculation with ectomycorrhizal
fungi. Indian Journal of Microbiology
35 : 35-38.
18. Oh, K.I. and Park, W.S. 1989. The
effect of ectomycorrhizae and nitrogen
levels on the
19. growth of Quercus serrata seedlings.
Journal of Korean Forestry Society 78
: 160-167
20. Pandey, P.K., Bahl, R.K. and Rao,
P.R.T. 1986. Growth stimulating
effects of nitrogen fixing bacteria
(biofertilizer) on oak seedlings. Indian
Forester 112(1) : 75-79.
21. Reynders, L. and Vlassak, K. 1979.
Conversion of tryptophan to
indoleacetic acid by Azospirillum
brasiliense. Soil Biology and
Biochemistry 11 : 547-548.
22. Schippers, B. 1988. Biological control
of pathogens with rhizobacteria.
Phiols. Trans. R. Soc. Land. B. 318 :
283-292.
23. Weller, D.M. 1988. Biological control
of soil borne plant pathogens in the
rhizosphere with bacteria. Annual
Review of Phytopathology 26 : 379-
407.

Malik A. A. et al INFLUENCE OF MICROBIAL INOCULATION ON PLANT HEIGHT OF BLUE PINE (Pinus
Wallichiana) AND HIMALAYAN CYPRESS (Cupressus Torulosa) UNDER NURSERY CONDITIONS
Int J Cur Res Rev, Sept 2012 / Vol 04 (17) , Page 16
Table-1 : Impact of microbial inoculation on plant height (cm) of Blue pine (Pinus
wallichiana A.B. Jackson) at nursery stage
Treatment 2009 2010 Mean
April June August October December February
Control 11.30 12.70 14.82 15.31 15.33 15.33 14.13
Azotobacter sp. 14.95 18.97 22.98 26.90 22.94 22.94 22.49
Azospirillum sp. 14.20 18.35 22.42 26.40 26.43 26.43 22.37
Pseudomonas fluorescens
13.90 17.95 21.97 25.92 25.94 25.94 21.93
Bacillus subtilis 13.30 17.42 21.50 25.35 25.37 25.37 21.38
Pisolithus tinctorius
16.40 20.82 24.92 28.85 28.87 28.87 24.78
Laccaria laccata 15.87 19.90 23.94 27.82 27.84 27.84 23.86
Mean 14.27 18.01 21.79 25.22 25.24 25.24
Treatment (T) Month (M) T x M
CD (p 0.05) 0.013 0.012 0.032
SEm 0.047 0.043 0.011
Initial plant height = 9.70 cm

Malik A. A. et al INFLUENCE OF MICROBIAL INOCULATION ON PLANT HEIGHT OF BLUE PINE (Pinus
Wallichiana) AND HIMALAYAN CYPRESS (Cupressus Torulosa) UNDER NURSERY CONDITIONS
Int J Cur Res Rev, Sept 2012 / Vol 04 (17) , Page 17
Fig-1 : Diagram showing treatment effects on plant height of cypress
Table-2 : Impact of microbial inoculation on plant height (cm) of Himalayan cypress
(Cupressus torulosa Don) at nursery stage
Treatment 2009 2010 Mean
April June August October December February
Control 18.33 21.40 24.26 26.46 26.48 26.48 23.90
Azotobacter sp. 22.66 27.23 32.30 39.26 39.28 39.28 33.33
Azospirillum sp. 21.75 26.17 31.10 38.18 38.19 38.19 32.26
Pseudomonas fluorescens
20.58 25.10 29.20 36.13 36.15 36.15 30.55
Bacillus subtilis 19.58 24.23 28.43 35.20 35.21 35.21 29.64
Pisolithus tinctorius
24.40 31.06 38.13 46.23 46.25 46.25 38.72
Laccaria laccata 23.15 30.06 36.96 44.23 44.25 44.27 37.15
Mean 21.49 26.46 31.48 37.95 37.97 37.97
Treatment (T) Month (M) T x M
CD (p 0.05) 0.067 0.062 0.016
SEm 0.024 0.022 0.058
Initial plant height = 17.00 cm
Malik A. A. et al INFLUENCE OF MICROBIAL INOCULATION ON PLANT HEIGHT OF BLUE PINE (Pinus
Wallichiana) AND HIMALAYAN CYPRESS (Cupressus Torulosa) UNDER NURSERY CONDITIONS
Int J Cur Res Rev, Sept 2012 / Vol 04 (17) , Page 18
Fig-2 : Diagram showing treatment effects on plant height of blue pine
ControlBSPSASAZLLPT
Blue pine inoculated seedlings

Malik A. A. et al INFLUENCE OF MICROBIAL INOCULATION ON PLANT HEIGHT OF BLUE PINE (Pinus
Wallichiana) AND HIMALAYAN CYPRESS (Cupressus Torulosa) UNDER NURSERY CONDITIONS
Int J Cur Res Rev, Sept 2012 / Vol 04 (17) , Page 19
ControlBSPSASAZLLPT
Himalayan cypress inoculated seedlings
Plate-1 :Growth of Pinus wallichiana and Cupress torulosa seedlings in response to
microbial inoculations at nursery stage
PT = Pisolithus tinctorius; LL = Laccaria laccata; AZ = Azotobacter sp.;
AS = Azospirillum sp.; PS = Pseudomonas fluorescens; BS = Bacillus subtilis

K. R. Banumathe et al AN OBSERVATIONAL STUDY ON SENSORY BASED OUTDOOR PLAY PREFERENCES IN
CHILDREN AGED BETWEEN 3 - 12 YEARS : A PRELIMINARY STUDY
Int J Cur Res Rev, Sept 2012 / Vol 04 (17) ,
Page 20
IJCRR
Vol 04 issue 17
Section: Healthcare
Category: Research
Received on:30/06/12
Revised on:15/07/12
Accepted on:25/08/12
AN OBSERVATIONAL STUDY ON SENSORY BASED
OUTDOOR PLAY PREFERENCES IN CHILDREN AGED
BETWEEN 3 - 12 YEARS : A PRELIMINARY STUDY 1K. R. Banumathe,
2Vineeta I. Ram,
3Alzeena Pinto,
4Samuel Jonathan
1Assistant Professor, Department of Occupational Therapy, Manipal
College of Allied Health Sciences, Manipal University, Manipal, KA,
India. 2,3,4
Occupational Therapist, Manipal, KA, India.
E-mail of corresponding authors: [email protected]
ABSTRACT
Aim: To find sensory based outdoor play preferences of children between the ages 3 -12 years.
Method: 90 normal children were observed by 3 raters for 30 minutes minimum, while engaged
in free play at outdoor playgrounds. Play preferences were observed for the affinity towards
certain sensory components; tactile, auditory, vestibular and proprioception. The most
observable sensory based play preferences were noted for quality and frequency and the children
were scored on a 7 point Likert scale. The data was then grouped by age into 3 groups, 1, 2 and
3; 3.1 to 6 years, 7.1 to 9 years and 10.1 to 12 years respectively and analyzed using SPSS,
version 16. Results: On analysis of data between the groups showed that there was significant
difference at p<0.05 levels for tactile, auditory and proprioceptive except vestibular based play
preferences at p>0.05 levels. Auditory based play preferences showed a significant difference at
p<0.05 level to other preferences for group 1. Group 2 showed significant difference between all
sensory based play preferences at p< 0.05 levels and for group 3, no significant difference
between auditory and tactile based play preferences at p>0.05 levels and significant difference
between the rest of the components at p<0.05 levels. It also inferred tactile and auditory based
play preferences decrease while proprioceptive and vestibular based play preferences increase
with the increase in age. Conclusion: These findings proved that sensory based outdoor play
preferences of children exist and differ between the ages 3 to 12 years.
Key Words: Play preferences, Sensory Based Play, Outdoor Play Preferences
Introduction
Play is a child’s primary and most important
occupation1.It has historically been regarded
by occupational therapists as both an indicator
of development and a means of intervention2.
Many occupational therapists feel that the
common themes in play include intrinsic
motivation, internal reality, and internal locus
of control, are needed for a child to engage in
playful behaviors and interactions. When
these are present, a child is self-motivated to
engage in a play activity, is free from rules,
procedures or guidelines to follow during the
play, and is able to self-direct play3. If a child
has a deficit in his or her ability to be
intrinsically motivated, to suspend reality, to
have an internal locus of control, to be happy,
energetic or playful, or has an inability to

K. R. Banumathe et al AN OBSERVATIONAL STUDY ON SENSORY BASED OUTDOOR PLAY PREFERENCES IN
CHILDREN AGED BETWEEN 3 - 12 YEARS : A PRELIMINARY STUDY
Int J Cur Res Rev, Sept 2012 / Vol 04 (17) ,
Page 21
process sensory information from play
experiences, then a child’s development may
be stifled4. Taking this into consideration, how
children make play choices and assign
meaning to the experience of this occupation
is an important area of study for occupational
therapists, to better understand this occupation
and the use of play within practice5.
Significant research has been accumulated on
play preference with regard to gender and age;
less research exists on the relation of play
preferences to the ability4.Research on the
meaning of play for children or on children’s
perspective and rationale for their play choices
remains scarce6.
A study on Children’s perceptions of play
experiences and the development of play
preferences, found that it would be beneficial
for therapists to understand the long-term
implications of play choices in children and
their impact on development over time. Also
suggested the relationship between a
children’s sensory processing and his or her
specific play choices could be an important
area for further study4.
Based on this, and related literature, this
preliminary study was undertaken to further
understand, explore and describe the
relationship between sensory processing and
play preferences which in turn will improve
the use of play in pediatrics evaluation and
intervention with the following research
question:
Do children between the ages 3 and 12 years
have sensory based play preferences?
Aim
The aim of this study is to find sensory based
outdoor play preferences of children between
3 and 12 years of age.
Objectives
To observe children between 3 -12 years
playing in an outdoor playground.
To identify the sensory based play
preferences among these children.
Research Hypothesis
Null Hypothesis
There will not be any significant difference in
sensory based play preferences for children
between the ages 3 and12.
Methodology
Pilot Study
A pilot study was conducted initially to check
if sensory based play preferences are present
and can be assessed. It is also to assess the
reliability of scores of the three raters. This
was done by each rater observing the same
five children individually in an open
playground with common play equipment
such as swings, slides; see saw, monkey bars,
the merry go round and sand pits for duration
of 30 minutes each. Observations were noted
by the 3 raters separately and were scored
using the 7 point Likert scale.
Inclusion Criteria
Normal children of both boys and girls
aged between 3 to 12 years.
Exclusion Criteria
Children with any physical or mental
disability.
Children who played for less than 30
minutes.

K. R. Banumathe et al AN OBSERVATIONAL STUDY ON SENSORY BASED OUTDOOR PLAY PREFERENCES IN
CHILDREN AGED BETWEEN 3 - 12 YEARS : A PRELIMINARY STUDY
Int J Cur Res Rev, Sept 2012 / Vol 04 (17) ,
Page 22
Setting
Two outdoor playgrounds with similar
types of play equipment such as slides,
swings, see-saw, monkey bars, sand pits
and merry go rounds.
Sample Size
90 children
Study Design
Observational Study
Tool
A stop watch
Scoring Criteria
7 point Likert’s scale
Procedure
Children who came with their parents
were selected randomly for the study;
oral consent was taken prior to the
study from the children’s parents along
with the child’s details demographic,
physical and mental health.
Three investigators directly observe
the spontaneous play of an individual
child in a playground for 30 minutes
minimum from a suitable vantage
point with the children being unaware
of the observers.
Using the 7- point Likert scale as the
tool of measure, each observer
evaluated the same individual child
independently using the definitions
mentioned before in the Operational
definitions as a reference.
The average of each observer’s score
for each variable was taken following
which the data was analyzed.
Data Analysis
The results were analyzed at p<0.05 level of
significance. Using SPSS version 16, the
following tests such as Descriptive analysis in
order to summarize the data and compute
means and standard deviations, ANOVA to
compare the means of play preferences among
the age group and within the age group, POST
HOC to analyze which type of play preference
is significantly difference among the age
group and within the age group was used.
Results
As mentioned in the procedure, sensory based
play preferences were observed for normal
children for the affinity towards certain
sensory components such as Tactile, Auditory,
Vestibular and Proprioception. These
components were observed and noted for the
type of play they engaged in, the time period
for which they took part in such, and joy
manifestation. The most observable sensory
based behaviors were noted and the quality
and frequency at which they occurred. Based
on these factors, the raters scored the children
using Likert’s scale.
Three raters examined and grouped the data
under three groups 1,2 and 3 according to age,
3.1 to 6, 7.1 to 9 and 10.1 to 12 years
respectively and calculated the mean for each
sample which was rounded off to the nearest
whole number, the and the results were then
analyzed as follows:
Tactile based play preferences between the
3 age groups
For tactile based play preferences, the mean
scores obtained were 6.1892, ±.84452 for
group 1, 5.322, ±.79108 for group 2 and
5.0909, ±.52636, for group 3. The mean
difference obtained with the group was tested
for significance using ANOVA and the ‘F’
score 18.075 which was significant at p< 0.05
levels. The Post HOC further revealed a
significant difference between the groups 1
and 2 and groups 1 and 3 at p<0.05 levels;

K. R. Banumathe et al AN OBSERVATIONAL STUDY ON SENSORY BASED OUTDOOR PLAY PREFERENCES IN
CHILDREN AGED BETWEEN 3 - 12 YEARS : A PRELIMINARY STUDY
Int J Cur Res Rev, Sept 2012 / Vol 04 (17) ,
Page 23
however no significant difference was seen at
p>0.05 levels when the groups 2 and 3 were
compared.
Auditory based play preferences between
the 3 age groups
For auditory based play preferences, the mean
scores obtained were 5.3514, ± .75337 for
group1, 4.8065, ±.47745 for group 2 and,
4.8182, ±.39477, for group 3. The mean
difference obtained with the group was tested
for significance using ANOVA and the ‘F’
score 9.052 which was significant at p<0.05
levels. The Post HOC further revealed a
significant difference between the groups 1
and 2 and groups 1 and 3 at p<0.05 levels;
however no significant difference was seen at
p>0.05 levels when the groups 2 and 3 were
compared.
Proprioceptive based play preferences
between the 3 age groups
For proprioceptive based play preferences, the
mean scores obtained were 6.3243, ± .70923
for group1, 6.8710, ±.34078 for group 2 and,
4.8182, ±.39477, for group 3. The mean
difference obtained with the group was tested
for significance using ANOVA and the ‘F’
score 12.844 which was significant at p<0.05
levels. The Post HOC further revealed a
significant difference between the groups 1
and 2 and groups 1 and 3 at p<0.05 levels;
however no significant difference was seen at
p>0.05 levels when the groups 2 and 3 were
compared.
Vestibular based play preferences between
the 3 age groups
For vestibular based play preferences, the
mean scores obtained were 6.2973, ± .61756
for group1, 6.3548, ±.66073 for group 2 and,
6.5000, ±.51177 for group 3. The mean
difference obtained with the group was tested
for significance using ANOVA and the ‘F’
score .772 which was not significant at p>0.05
levels. The Post HOC revealed no significant
difference between the groups 1 and 2 and 3 at
p>0.05 levels.
Play preferences within group 1
The mean scores obtained for tactile based
play preferences 6.1892,±.84452,auditory
based play preferences
5.3514,±.75337,proprioceptive based play
6.3243,.70923 and vestibular based play
preferences 6.2937,.61756.We used ANOVA
to find the significant difference between
these mean values, with the ‘F’ score being
14.663,we found that they were significantly
different at the p<0.05 levels. On further
analysis using the Post HOC revealed that
auditory based play preferences when
compared to the other sensory play
preferences considered for this project shows
a significant difference at p<0.05 levels. There
was no significant difference between tactile,
proprioceptive and vestibular based play
preferences at p>0.05 levels.
Play preferences within group 2
The mean scores obtained for tactile based
play preferences 5.3226, ±.79108,auditory
based play preferences 4.8065,±.47745,
proprioceptive based play 6.8710, .34078 and
vestibular based play preferences
6.3548,±.66073. We used ANOVA to find the
significant difference between these mean
values, with the ‘F’ score being 72.287, we
found that they were significantly different at
p <0.05 levels. On further analysis using the
Post HOC shows a significant difference
between all sensory based play preferences
considered at p<0.05 levels.

K. R. Banumathe et al AN OBSERVATIONAL STUDY ON SENSORY BASED OUTDOOR PLAY PREFERENCES IN
CHILDREN AGED BETWEEN 3 - 12 YEARS : A PRELIMINARY STUDY
Int J Cur Res Rev, Sept 2012 / Vol 04 (17) ,
Page 24
Play preferences within group 3
The mean scores obtained for tactile based
play preferences 5.0909, ±.52636, auditory
based play preferences 4.8182, ±.39477,
proprioceptive based play 6.9091, ±29424 and
vestibular based play preferences 6.5000,
±.51177. We used ANOVA to find the
significant difference between these mean
values, with the ‘F’ score being 119.504,we
found that they were significantly different at
P<0.05 levels. On further analysis using the
Post HOC shows no significant difference
between auditory and tactile based play
preferences at P>0.05 levels however there is
a significant difference between the rest of the
components at P<0.05 levels.
Discussion
The purpose of our study was to better
understand play and play preferences and as a
preliminary study to assess the feasibility of
studying sensory based play preferences.
From these results we may infer that play
preferences may be sensory based in children
between the ages 3-12 years. This clearly
answers our research question and satisfies
our aim and objectives as mentioned before.
Our inference that sensory based play
preferences change with age may be further
supported by these statements ‘Outdoor play
preferences have been shown to change with
age’, as reported by Scarlett et al., 2005 and
‘Children’s play preferences are influenced by
age and developmental status’ as found by
Case Smith and Kuhaneck, 2008 in their
studies.
We observed that tactile and auditory based
play preferences decrease with the increase in
age, while proprioceptive and vestibular based
play preferences increase with the increase in
age. We also had the opportunity to observe
free play and the changes that influence play
in terms of social, cognitive and physical
components with regard to age and
development. As mentioned in the literature
review supported by statements from
Morrison CD et al., 2001 and Bundy AC,
2002, we chose to observe free play in order
to proceed with our study with regard to
common themes in play, which included
intrinsic motivation. While we believe these
statements hold true, we also feel, on
observation that we must also consider other
influences such as social influences that may
motivate children to engage in play, especially
in older children. As this was a preliminary
study, we feel there is a further need to
explore this area using more standardized
methods.
Implications
The implications of this study are threefold;
1. Our results show play preferences may be
sensory based.
2. The results may support giving sensory
based play across the ages according to the
found age group preferences in clinical
practice in order to increase the quality of play
as therapy, by increasing intrinsic motivation
and the internal locus of control and as Ayers
suggested, to support children enhance their
development through active exploration of the
environment and receiving various sensory
inputs through manipulation of materials.
3. As this study was a preliminary one, and
our results support our research question. This
study may be used as a baseline or guide for
further studies in this important area.
Limitations and Recommendations
As this study is a preliminary study, the results
open a broad window for future studies to give

K. R. Banumathe et al AN OBSERVATIONAL STUDY ON SENSORY BASED OUTDOOR PLAY PREFERENCES IN
CHILDREN AGED BETWEEN 3 - 12 YEARS : A PRELIMINARY STUDY
Int J Cur Res Rev, Sept 2012 / Vol 04 (17) ,
Page 25
a better perspective on the relationship
between sensory based play preferences of
children with regard to their developmental
age. Population for the study was taken only
based on the parental information and no
standardized screening tool was used. For
future studies, more standardized screening
tool can be used.
The sample size was small, and was restricted
to Manipal area alone, so further studies can
be considered by including other different
regions.
The raters for this study were not blinded and
the unavailability of an expert in the field of
observation which could influence the study
results. Prospective studies in this field can
improvise on the above mentioned limitations.
If the play behavior was videotaped and
assessed it would have been more
standardized. Time constraints on the children
playing may also influence the nature of the
play in turn influence the inclusion of the
subject and quality of play. This can be
considered for future research as it will
influence the study results. Further study can
be focused on indoor play preferences as it is
feasible for practice in indoor based clinical
settings.
Conclusion
From the outcome of this study, we can reject
the null hypothesis. The results have proved
that there is a significant difference in the
sensory based outdoor play preferences of
children between the ages 3 to 12 years. The
tactile and auditory based play preferences
decrease with the increase in age, while
proprioceptive and vestibular based play
preferences increase with the increase in age.
This implies the need for considering the play
preferences in clinical practice to improve the
quality of play as therapy.
Acknowledgements
We would like to take this opportunity to offer
our sincere gratitude to Mr. Shovan Saha,
HOD and Mr. Shashidhar Rao, Dept. of
Occupational Therapy, & Mr. Hari Prakash,
Dept. of Speech & Hearing, Manipal for their
constant support and encouragement. Authors
acknowledge the immense help received from
the scholars whose articles are cited and
included in references of this manuscript. The
authors are also grateful to authors / editors /
publishers of all those articles, journals and
books from where the literature for this article
has been reviewed and discussed.
References
1. Bundy AC. Play Theory and Sensory
Integration. In: Bundy AC, Lane SJ, Murray
EA editors. Sensory Integration Theory and
Practice. 2nd ed. Philadelphia: FA Davis;
2002. p. 227-40.
2. Parham L, Primeau L. Play and occupational
therapy. In: Parham LD, Fazio L, editors. Play
in occupational therapy for children. St. Louis:
Mosby; 1997. p. 02–21.
3. Morrison CD, Metzger P. Play. In: Schrefer J,
White K, Mosby L, editors. Occupational
Therapy for Children. 4th ed. St. Louis:
Mosby; 2001. p.528-40.
4. Miller E, Kuhaneck H. Children’s perceptions
of play experiences and the development of
play preferences: A qualitative study.
American Journal of Occupational Therapy
2008; 62:407-15.
5. Couch KJ, Deitz JC, Kanny EM. The role of
play in pediatric Occupational therapy. Am J
of Occupational Therapy1998; 52: 111–17.
6. Smith CJ, Kuhaneck H. Play preferences of
typically developing children and children
with developmental delays between the ages 3
and 7 years. Occupational Therapy J of
Research 2008; 1:19-20.

K. R. Banumathe et al AN OBSERVATIONAL STUDY ON SENSORY BASED OUTDOOR PLAY PREFERENCES IN
CHILDREN AGED BETWEEN 3 - 12 YEARS : A PRELIMINARY STUDY
Int J Cur Res Rev, Sept 2012 / Vol 04 (17) ,
Page 26
Tables
Table 1: Descriptive Analysis of Play Preferences among All Age Groups
Type of Play
Age groups
(in years)
n
Mean
Standard
Deviation
Tactile 3.1-6 37 6.1892 .84452
7.1-9 31 5.3226 .79108
10.1-12 22 5.0909 .52636
Total 90 5.6222 .89415
Auditory 3.1-6 37 5.3514 .75337
7.1-9 31 4.8065 .47745
10.1-12 22 4. 8182 .39477
Total 90 5.0333 .64390
Proprioceptive 3.1-6 37 6.3243 .70923
7.1-9 31 6.8710 .34078
10.1-12 22 6.9091 .29424
Total 90 6.6556 .58369
Vestibular 3.1-6 37 6.2973 .61756
7.1-9 31 6.3548 .66073
10.1-12 22 6.5000 .51177
Total 90 6.3667 .60800
There are differences between the mean scores for each sensory based play preferences with
relationship to the 3 age groups.
Graph 1 – Comparison of the mean scores of all play preferences among all 3 age groups
Table 2: Comparison of Play Preferences among the Age Groups (ANOVA)

K. R. Banumathe et al AN OBSERVATIONAL STUDY ON SENSORY BASED OUTDOOR PLAY PREFERENCES IN
CHILDREN AGED BETWEEN 3 - 12 YEARS : A PRELIMINARY STUDY
Int J Cur Res Rev, Sept 2012 / Vol 04 (17) ,
Page 27
Type of Play Age Group F p
Tactile
3.1 to 6 years
7.1 to 9 years
10.1 to 12
years.
18.075 .000*
Auditory 9.052 .000*
Proprioceptive 12.844 .000*
Vestibular .772 .465
*- significant at p< 0.05 level
There is significant difference between the 3 age groups with relation to sensory based play
preferences
Table 3: Comparison of Play Preferences between the 3 Age Groups (Post Hoc).
Type of Play Age Group P
Tactile
Group 1-2 .000*
Group 2-3 .832
Group 3-1 .000*
Auditory
Group 1-2 .000*
Group 2-3 1.000
Group 3-1 .004*
Proprioceptive
Group 1-2 .000*
Group 2-3 1.000
Group 3-1 .000*
Vestibular
Group 1-2 .465
Group 2-3 1.000
Group 3-1 .660
*- significant at p< 0.05 level
Note: Group: 1 - 3.1 to 6 years, 2 - 7.1 to 9 years, 3- 10.1 to 12 years.
There are differences in sensory based play preferences between the 3 age groups.
Table 4: Comparison of Play Preferences within the Age Groups (ANOVA)
Age
Groups Play Preferences F p
3.1 – 6
years
Tactile
14.663 .000* Auditory
Proprioceptive
Vestibular
7.1 – 9
years
Tactile
78.287 .000* Auditory
Proprioceptive
Vestibular
10.1 – 12
years
Tactile
119.504 .000* Auditory
Proprioceptive
Vestibular
*- significant at p< 0.05 level

K. R. Banumathe et al AN OBSERVATIONAL STUDY ON SENSORY BASED OUTDOOR PLAY PREFERENCES IN
CHILDREN AGED BETWEEN 3 - 12 YEARS : A PRELIMINARY STUDY
Int J Cur Res Rev, Sept 2012 / Vol 04 (17) ,
Page 28
There is significant difference among the play preferences within each age group.
Table 5: Comparison between Play Preferences within Each Age Group (Post Hoc).
Age group Play Preference P
3.1 – 6 years
Tactile – Auditory .000*
Tactile – Proprioceptive 1.000
Tactile – Vestibular 1.000
Auditory – Proprioceptive .000*
Auditory – Vestibular .000*
Vestibular – Proprioceptive 1.000
7.1 – 9 years
Tactile – Auditory .005*
Tactile – Proprioceptive .000*
Tactile – Vestibular .000*
Auditory – Proprioceptive .000*
Auditory – Vestibular .000*
Vestibular – Proprioceptive .005*
10.1 – 12
years
Tactile – Auditory .263
Tactile – Proprioceptive .000*
Tactile – Vestibular .000*
Auditory – Proprioceptive .000*
Auditory – Vestibular .000*
Vestibular – Proprioceptive .017*
*- significant at p< 0.05 level
There are differences in sensory based play preferences for each component between each of the
3 age groups

Himanshu Barot et al TESTING INDEX VOLATILITY OF INDIAN STOCK MARKET IN THE CONTEXT OF FOREIGN
INSTITUTIONAL INVESTOR’S INVESTMENT
Int J Cur Res Rev, Sept 2012 / Vol 04 (17) ,
Page 29
IJCRR
Vol 04 issue 17
Section: Management
Category: Research
Received on:23/06/12
Revised on:17/07/12
Accepted on:20/08/12
TESTING INDEX VOLATILITY OF INDIAN STOCK MARKET IN
THE CONTEXT OF FOREIGN INSTITUTIONAL INVESTOR’S
INVESTMENT
1Himanshu Barot,
2V.K.Sapovadia
1Asst. Professor, Faculty of Management, SRI Campus, Mehsana, India
2Executive Director, Shanti Business School, Ahmedabad, India
E-mail of corresponding authors: [email protected]
ABSTRACT
Indian stock market has seen an unprecedented growth in the last few years. Since year 2002,
Indian market has grown from a much volatile conditions to growth phenomena; this has been
due to not only the domestic market but also the international investors. FIIs investment is
considered to be one of the key influencing factors after the economic fundamentals. From 1993
reforms in the Indian Capital market on liberalisation of the FII flows has a considerable impact
on Indian stock market. The main objective of the study is to test index volatility of Indian stock
market in the contest of FII’s net investment in equity and for this two net change in indices have
been considered i.e. BSE Sensex and S&P CNX Nifty on annual basis from January 2000 to
December 2011. The empirical result found through statistical tests like correlation, regression
and t-test which reveals that significant relation between all three variables and result found that
2008 and 2011 were one of the worst years for Indian markets which make it the worst performer
in Asia. Global financial recession in 2007 and slowing growth, rising inflation, and policy
paralysis have blown the Indian markets off course in 2011. In 2008, the sub-prime crisis and
Lehman brothers collapse crippled the global markets when 2011 saw high inflation rate
dampening the market spirit. The Great Indian Dream seems to be coming to a close as most of
the FIIs are pulling out of Indian markets. The FIIs were net sellers in year 2008 and 2011,
pulling out their positions form the Indian market which leads to conclude that the FII is one of
the key movers on volatility of Indian stock market and FII’s investment is not negligible for
Indian Capital Market.
Keywords: FII, Index, volatility, BSE Sensex, S&P CNX Nifty, Inflation
Introduction
A well-developed stock market has its impact
on the development of economy. It provides
investors with an array of assets with varying
degree of risk, return and liquidity. This
increased choice of assets and the existence of
a vibrant stock market provide savers with
more liquidity and options, thereby inducing
more savings. Increased competition from
foreign financial institutions also paves the
way for the derivatives’ market. All this,
according to the mainstream belief,
encourages more savings in equity related
instruments. This, in turn, raises the domestic
savings rate and improves capital formation.

Himanshu Barot et al TESTING INDEX VOLATILITY OF INDIAN STOCK MARKET IN THE CONTEXT OF FOREIGN
INSTITUTIONAL INVESTOR’S INVESTMENT
Int J Cur Res Rev, Sept 2012 / Vol 04 (17) ,
Page 30
Foreign Institutional Investors
FII or the Foreign Institutional Investors are
basically referred to investors who are
organized in the form of an institution or
entity and indulge in investing funds in the
financial market of a foreign country, i.e.
different from where the entity was originally
registered or incorporated.
In India, FII can invest their funds in the
country only under the norms prescribed by
Security and Exchange Board of India (SEBI).
FII’s investment includes mutual funds,
investment trust, asset management company,
nominee company, bank, university funds,
endowments, foundations, charitable trusts,
charitable societies, overseas pension funds
etc.
It was in July 1991 that the New Economic
Policy was unveiled that ushered in an era of
Liberalization Privatization and Globalization
(LPG) for the Indian economy. In September
1992 and 1993, India opened its stock market
for foreign investors, which facilitated receipt
of funds from foreign institutional investors in
the form of equities. The enactment led to
sweeping changes where various restrictions
imposed on investments by the foreign
investors in India were eased. SEBI opened a
new path for the foreigners to invest in India
by simplifying many terms and conditions due
to which a large number of foreign investors
flocked towards India.
Number of Foreign Institutional Investors
(FIIs)
One of the most important features of the
development of stock market in India in the
last 20 years has been the growing
participation of FIIs. Since September, 1992
when FIIs were allowed to invest in India, the
no. of FIIs has grown over a period of time.
The net addition in SEBI registered FIIs failed
to keep up the momentum seen in 2007-08
and 2008-09 wherein there was addition of
322 and 316 FIIs respectively. There was a net
addition of 78 SEBI registered FIIs in 2009-10
which took their total number to 1,713 at end
March 2010 compared to that of 1,635 at the
end of March 2009 (Table I and Chart II).
Trends in Investment of Foreign
Institutional Investors
This is not unusual as most of the developing
economies might be experiencing the same
patterns. The increasing role of FIIs has
brought in the development of our stock
markets as well such as expansion of the
business in securities, increased depth and
breadth of the market, etc.
FIIs contribute to almost 13% of the entire
market capitalization at National Stock
Exchange in India. If we talk of FIIs
investment, this has been continuously grown
over years except 1998-99 and 2008-09 when
FIIs sold more than they purchased in Indian
stock market. (Table II)
The gross purchases of debt and equity by FIIs
increased by 17.27 percent to Rs. 9,92,599
crore in 2010-11 from Rs. 8,46,438 crore in
2009-10 (Table II). The combined gross sales
by FIIs increased by 20.23 percent Rs.
8,46,161 crore from Rs. 7,03,780 crore during
the same period in previous year. The total net
inflow of FII was increased by 2.65 percent
Rs. 1,46,438 crore in 2010-11 as against an
inflow of FII was Rs. 1,42,658 crore in 2009-

Himanshu Barot et al TESTING INDEX VOLATILITY OF INDIAN STOCK MARKET IN THE CONTEXT OF FOREIGN
INSTITUTIONAL INVESTOR’S INVESTMENT
Int J Cur Res Rev, Sept 2012 / Vol 04 (17) ,
Page 31
10. This was the highest net inflow for any
financial year so far.
Cumulative investment by FIIs at acquisition
cost, which was USD 89.3 billion at the end of
March 2010, increased to USD 121.5 billion at
the end of March 2011 (Figure 2). Because of
their war chests of money, the role of FIIs
can’t be ignored. FIIs have dynamic portfolios
across countries which they use to restructure
and rebalance depending on the market
conditions, definitely, with a motive to
increase their gains. Because of their size of
investment in any market, they have the
ability to make or break the fortunes of any
market.
Foreign Institutional Investments- Equity
and Debt
FIIs were allowed to invest in the Indian
Capital Market from September 1992.
Investments by them, however, were first
made in January 1993. Till December 1998,
investments were related to equity only as the
Indian gilts market opened up for FII
investment in April 1998. FIIs’ investment in
debt started from January 1999. Foreign
Institutional Investors (FIIs) continued to
invest large funds in the Indian securities
market. For two consecutive years in 2004-05
and 2005-06, net investment in equity showed
year-on-year increase of 10%.
After experiencing a net outflow of Rs
477,070 million in equity instruments in 2008-
09, FIIs scaled record equity investment in
2010-11 which stood at Rs 1,105,297 million.
(Table III) The net investments by FIIs in the
debt segment also bounced back in 2010-11
with a staggering all-time high of Rs 421,451
million compared to that of Rs 18,950 and Rs
324,380 in 2008-09 and 2009-10 respectively.
Review of Literature
Many empirical studies have been conducted
to examine the relationship between stock
prices and buying of equity by FIIs in Indian
stock market.
Purnendra Verma (2001)2 studied the impact
of FII on Indian Capital Market from 1993 to
2001 and found that there is significant effect
of FIIs on Nifty and no significant effect on
BSE Sensex, but in both the cases the co-
efficient of correlation is low and very low so
the effect are less and very less respectively.
Study concluded that FII did not have any
significant impact on the Indian Capital
Market.
T. N. Aravind, et al. (2008)3 examined the
study on FII’s influence on Indian stock
market for the period of 2003 to 2008 and
concluded that in Oct. 2007, speculation about
governments plan to control P-Notes had
caused the biggest fall in Indian stock market.
And they have proved that there is a direct
relationship between the FII’s money flow and
the movement of Sensex.
Prasanna P.K. (2008)4 examined the
contribution of FIIs in SENSEX base
companies for the period of 2001 to 2006 and
found that foreign investors invested more in
companies with a higher volume of shares
owned by the general public. The promoters’
holdings and the foreign investments are
inversely related. Study argued that the
foreign institutional investors withdraw their
money when the stock market performance
starts slowing down.
Dr. Rahul Singh, et al. (2008)5 studied of
FIIs investment flow and SENSEX movement
for period from January, 2004 to December,
2007 and proved with empirically that there is
a negative correlation between the net FIIs and

Himanshu Barot et al TESTING INDEX VOLATILITY OF INDIAN STOCK MARKET IN THE CONTEXT OF FOREIGN
INSTITUTIONAL INVESTOR’S INVESTMENT
Int J Cur Res Rev, Sept 2012 / Vol 04 (17) ,
Page 32
volatility in SENSEX. And with respect to net
FIIs inflows and returns on SENSEX have a
positive and significant correlation.
Soumita Patra, et al. (2009)6 conducted the
study on impact of FIIs flow on the BSE
SENSEX and Nifty between 1997 and 2008
and proved that there is no significant
relationship between FII and SENSEX
excluding years 2003 and 2004 where FII and
Nifty there is no significant relation.
Gaurav Agrawal, et al. (2010)7 investigated
the causal relationship between Nifty and FIIs
net investment for the period January, 1999
to February, 2009 using daily data and
through application of correlation test, found
that Nifty is positively correlated to FIIs.
Madan Sabnavis, et al. (2010)8 analyzed
implications of FIIs inflow in Economic
Studies from January to September 2010 and
empirically proved that the coefficient of
correlation is quite strong between FIIs flows
and SENSEX movement which means there is
a significant relationship.
A.Q.Khan and Sana Ikram (2010)9 tested
the efficiency in relation to the impact of FIIs
largely on the Indian Capital Market during
the period 2000 to 2010 and proved that there
is a significant relation between the movement
of FII and the two major stock exchanges of
India that is the BSE and NSE. However the
coefficient of correlation is a low degree of
positive correlation indicating that the effect is
not very strong. The study concluded that the
FIIs investment has a significant impact on
Indian Capital Market and the Indian Capital
Market is Semi-strong form efficient in
relation to the impact of FIIs investment on
Indian Capital Market.
Narendra Singh Bohra and Akash Dutt
(2011)10
studied data from 2000 to 2009 and
found that there is a positive correlation
between stock market and investment of FII’s
in a relation that Sensex follows the
investment behavior of FII’s and in the case of
individual group securities FII’s had shown a
positive correlation in less regulated and high
capitalized securities in the market to earn
high equity yield. And study suggest to the
policy implication that the authorities can
focus on domestic economic policies to
stabilize the stock market.
M. Anuradha Reddy (2011)11
examined the
FIIs investment behavior and its relationship
between SENSEX movement during years
2000 to 2011 (May, 31) and found that the
FIIs are influencing the Sensex movement and
proved evidently there is a significant relation
between FIIs flow and Sensex movement.
Ravi Akula (2011)12
conducted the study on
trends in foreign institutional investment in
India for the period of 2006 to 2010, and
observed that the FIIs investment has shown
significant improvement in the liquidity of
stock prices of both BSE and NSE. Study
argued that there is a high degree of positive
co-efficient of correlation between FIIs
investment and market capitalisation which
reveals that the liquidity and volatility in
indices are highly influenced by FIIs flows.
Dr. Ambuj Gupta (2011)13
examined the
relationship between Indian Stock Market and
FIIs investment in India for the period from
April 2006 to February, 2011 and proved
through tests that there is a positive
relationship between stock market and FIIs
investment which means when FIIs
purchase/sell, there is an influence on the
stock market. Consequently, either the stock
market rise or fall on account of FIIs
activities.

Himanshu Barot et al TESTING INDEX VOLATILITY OF INDIAN STOCK MARKET IN THE CONTEXT OF FOREIGN
INSTITUTIONAL INVESTOR’S INVESTMENT
Int J Cur Res Rev, Sept 2012 / Vol 04 (17) ,
Page 33
Statement of Problem
The growing participation of FIIs in Indian
stock market has raised eyebrows of many
Indians. Their influence on stock markets in
India has been widely debated and remained a
hot topic in media. Some of the market
pundits believe that FIIs are responsible for
rise or fall in the Indian stock market. This
raises a question as to whether FIIs are really a
cause or effect of the rise or fall in the Indian
stock market. In this paper the Researchers
make an earnest attempt to study the
relationship between FII’s Investment &
Indian Stock Market. For the purpose, two
major stock indices viz. NSE and BSE have
been selected. There are certain other
significant factors also, which influence Stock
market like inflation, government policies,
budgets, economic factors etc. However, in
this paper only one independent variable i.e.
FII’s investment has been taken.
Research Gap
There are contradictory findings by various
researchers regarding the causal relationship
between FIIs investment and stock market
movement in India. Therefore, there is a need
to investigate whether FIIs are the cause or
effect on stock market volatility in India.
Scope of the Study
The present study tests impact of FII’s
investment on Indian Stock Market. With
India emerging to be one of the leading
destinations for Foreign Investments, the role
and importance of FII’s in the last few years
has increased manifold as a result of
globalization of the markets. This study covers
the period of 12 years i.e.; from 2000 to 2011.
The FII’s are emerging to be a key driver in
the movement of stock index and it is
imperative to study the relation in order to
develop an understanding about the efficiency
of the market. In the last decade FII had a
significant impact on the unprecedented
growth in the Sensex and also in its downfall
due to the financial recession of 2007. An
attempt is made to carve out a clear picture of
the impact of FII’s investment on Indian
bourses and also determine the market trend
relating to inflows and outflows of FIIs.
Objectives
1. To assess the growth and development of
Indian Stock Market
2. To develop an understanding about the
concept and role of Foreign Institutional
Investors (FIIs) in India.
3. To study the relationship between FII’s
investment and Indian Stock Market
4. To test the impact of FIIs investment on
Indian Capital Market
Hypothesis
A. Testing Index Volatility of BSE Sensex
with FIIs investment
H0: FII’s investment has significant relation
with Volatility of BSE Sensex
H1: FII’s investment has no significant
relation with Volatility of BSE Sensex
B. Testing Index Volatility of S&P CNX
Nifty with FIIs investment
H0: FII’s investment has significant relation
with Volatility of S&P CNX Nifty
H1: FII’s investment has no significant
relation with Volatility of S&P CNX
Nifty
C. Testing the impact of FIIs investment on
Indian Capital Market
H0: FIIs investment has significant impact on
the Indian Capital Market

Himanshu Barot et al TESTING INDEX VOLATILITY OF INDIAN STOCK MARKET IN THE CONTEXT OF FOREIGN
INSTITUTIONAL INVESTOR’S INVESTMENT
Int J Cur Res Rev, Sept 2012 / Vol 04 (17) ,
Page 34
H1: FIIs investment has no significant impact
on the Indian Capital Market
RESEARCH METHODOLOGY
Data Collection Method
The data analyzed in this paper has been
collected from the reliable source i.e. from the
Handbook of Statistics and Bulletin published
by the Securities Exchange Board of India
(SEBI) and Reserve Bank of India (RBI),
Indian Securities Market Review, NSE fact
book from 2000 to 2010 and internet. The
sample consists of yearly net changes in two
major stock indices of India viz. BSE Sensex
and S&P CNX Nifty, and yearly FII’s Net
investment in India as on January, 2000 to
December, 2011. The data collected is
compiled in the form of tables and graphs and
scrutinized through statistical tools and
techniques.
Hypothesis Testing Technique
In this paper, researchers test index volatility
of Indian stock market. And for this two major
stock indices have been taken i.e. BSE Sensex
and S&P CNX Nifty. There may be other
factors also on which stock market may
depend like inflation, government policies,
budgets, FDI, economic and political
conditions etc. But in this study only one
variable i.e. FII have been selected in order to
study its relation with stock market volatility.
In this paper the concept of correlation and
regression is being. Moreover, t-test is being
employed here (as the numbers of
observations are less than 30).
Analysis and Result
Analysis and Result based on Graph
The Charts or Graphical analysis are based on
Table-IV. Charts are the best medium through
which the study shows the trends of the
market. Here with the help of the graphs the
study has analyzed the comparative trend of
Net FII’s investment in equity with net
changes in two major stock indices of Indian
Stock Market i.e. Sensex and S&P CNX Nifty
and the market’s prime movers spent to move
each point in Sensex and Nifty. These graphs
also show the relationship between all the
three variables i.e. NSE, BSE and FII.
Through this study can analyze the impact of
FII’s investment on Indian Stock Market as
well as Indian Capital Market.
The figures in Table - IV have been depicted
in the Figure 4, 5 and 6. From the Figure 4, 5
and 6 study can analyze the comparative trend
of FII’s net investment in equity and net
change in Indian Stock Market indices for the
period 2000- 2011. A business Standard
Research Bureau study of monthly inflows
data since 2001 shows the market’s prime
movers have spent between Rs 5 crore to Rs
50 crore to move each point in Sensex.14
The
charts shows that there is an increase in net
investment in 2002-05 due to which Sensex
and Nifty also rises, then there was a sharp fall
in the year 2006. After that there was a steep
increase in net investment in the year 2007.
This was the best period in Indian Stock
Market where stock prices were at a record
high and the market was bullish.
Foreign investors have been net buyers in 10
of 12 calendars years since 2000. They have
been net sellers in 2008, when the sub-prime
crisis and Lehman brothers collapse crippled

Himanshu Barot et al TESTING INDEX VOLATILITY OF INDIAN STOCK MARKET IN THE CONTEXT OF FOREIGN
INSTITUTIONAL INVESTOR’S INVESTMENT
Int J Cur Res Rev, Sept 2012 / Vol 04 (17) ,
Page 35
the global markets. That year they spent Rs 5
crore and Rs 16.78 crore for each of the
10667.96 points the Sensex and 3177.60
points the Nifty lost. And in calendar year
2011, Delivery-based buying in the secondary
market has hit a four-year low, down 25 per
cent over the past 12 months, as investors
preferred to stay away from a gloomy equity
market. So, too, for risk appetite, with average
trading volume on the BSE and NSE down 23
per cent over the level a year before. The
market was volatile and the reduction in the
FII’s investment was one of the causes of
volatility. FIIs has pulled out around Rs
53,309.7 crore and Rs 3417.70 crore from the
Indian stock market and the withdrawal led to
a fall by approximately 51 percent and 24.64
percent in Sensex and 20 percent and 24.62
percent in Nifty in 2008 and 2011
respectively. The post-Lehman recovery that
started in April 2009 and got an upward push
with return of the UPA government at the
center, was even more expensive, at Rs 22.7
crore per point in the Sensex.14
In terms of cost per point in Sensex and Nifty,
2004 was the most expensive for FII, when
they spent Rs. 38.05 crore and Rs. 138.83
crore for every point in Sensex and Nifty
respectively. In year, 2010, was next on the
list, with every Sensex and Nifty point costing
Rs. 34.94 crore and Rs. 113.60 crore
respectively when in last year, 2011 again it
bounce backed Rs. 0.68 crore and Rs. 2.26
crore for cost per point in Sensex and Nifty
respectively.
2011 was one of the worst years for Indian
markets as it fell more than 20% on a Year on
Year basis, which makes it the worst
performer of 2011 in Asia. Slowing growth,
rising inflation, and policy paralysis have
blown the Indian markets off course in 2011.
2011 saw high inflation rate dampening the
market spirit. Headline inflation, as measured
by wholesale price index (WPI), has been
above the 9% mark since December 2010.
This in turn led the RBI action of hiking the
repo and reverse repo rates consistently 11
times. And now the Interest rate cycle in India
is at the verge of peaking out. However, even
if this action by RBI could not tame inflation
immediately it helped in reducing the growth
story of India. The hike in interest rate,
inflation and lack of demand in global markets
put huge pressure on Indian markets. The IIP
data too saw some shameful numbers with
October 2011 IIP registering a negative
growth of 5.1%. The GDP growth of India
was revised down to 7.6 % for the FY 12 by
RBI. Indian Rupee too witnessed huge
depreciation in value this year. USD/INR
crossed 54 levels in December 2011. RBI's
move to bring down speculation in the
FOREX market has imparted some stability to
the rupee. But the move has negatively
affected the foreign inflows. The Great Indian
Dream seems to be coming to a close as most
of the FIIs are pulling out of Indian markets.
The FIIs were net sellers this year pulling out
their positions.
In Figure 4an interesting correlation can be
observed between FII and Sensex as Sensex
rises with the increase in FII inflows and falls
with the decrease in FII inflows. Also the gap
between the FII and Sensex is very low
indicating the huge impact and contribution of
FII in the movement of the BSE Sensex.
Figure 5 also shows co-relation between FII’s
investment and S&P CNX Nifty as the index
of Nifty rises with the rise in FII’s investment

Himanshu Barot et al TESTING INDEX VOLATILITY OF INDIAN STOCK MARKET IN THE CONTEXT OF FOREIGN
INSTITUTIONAL INVESTOR’S INVESTMENT
Int J Cur Res Rev, Sept 2012 / Vol 04 (17) ,
Page 36
and falls with the fall in FII’s investment. This
shows that the FII’s investment is having a
significant effect over the indices of Nifty.
Figure 6 shows the relationship of FII’s
investment with the BSE Sensex and S&P
CNX Nifty. From this it can be seen very
clearly that the peaks and the troughs of FII
coincide with the peaks and troughs of Sensex
and S&P CNX Nifty. From all this it can be
analyzed that the FII influence the Indian
Stock as well as Indian capital market. The
graphical analysis indicates the relation is
positively correlated and all three appear to be
moving in tandem. The rise and peak of all the
three curves appear closely related. While the
curves for BSE and Nifty are overlapping each
other that of FII investments seems to be
following the same pattern or trend. It
highlights the significant role and proportion
of FII on the movement of stock market and
also raises certain questions on the basis of
past performance. The role is so prominent
that withdrawal leads to a massive fall and
increase in investment leads to a
corresponding rise. Hence, our markets
seemed to be reliant and dependent on FII’s
raising questions about stability and reliability
from the point of view of domestic investors.
Analysis and Result based on Hypothesis
This study employs the technique of
correlation and regression between FII &
Sensex and FII and S&P CNX Nifty in order
to test the index volatility of Indian stock
market in the context of FII’s investment. First
of all, the relationship between these three
variables viz; NSE, BSE and FII should be
analyzed. In the present study, data has been
taken on annual basis and it may be so that the
data on monthly or daily basis may provide
different result.
Correlation, Regression and T-Test
Analysis
Correlation and regression is being calculated
in this study in order to analyze the result and
t-test is being employed here in order to test
the statistical significance of the results
calculated which is depicted in Table V, VI
and VII.
In Table- V Karl-Pearsons’ Product Moment
Correlation is being calculated which is a
simple correlation and shows the relationship
between one dependent variable and one
independent variable. Here, FII is taken as an
independent variable and Sensex and S&P
CNX Nifty are being taken as dependent
variables, which are taken one by one for the
purpose of calculation.
The above table indicates that the correlation
between Sensex and FII’s investment is 0.839
which shows high degree of positive
correlation. The R-square is 0.704 which
means 70.4% of the variance in the variables
is explained by this relationship. According to
t-test the calculated value at 5% significance
level if 0.053 which lies between the critical
values + 2.20 reveals that study is not able to
reject the Hull Hypothesis. Hence there is
significant relation between FII and Sensex.
The above table also shows the correlation of
coefficient 0.844 of Nifty with FII which
indicates there is strong positive correlation.
The R-square is 0.712 which implies that
71.2% of the variance in the variables is
explained by this relationship. The calculated
t-value is 0.048 which lies within the critical
values + 2.20 leads not able to reject the Null
Hypothesis. Hence there is relation between
Nifty and FII.

Himanshu Barot et al TESTING INDEX VOLATILITY OF INDIAN STOCK MARKET IN THE CONTEXT OF FOREIGN
INSTITUTIONAL INVESTOR’S INVESTMENT
Int J Cur Res Rev, Sept 2012 / Vol 04 (17) ,
Page 37
It is further observed from above table that
correlation coefficient between BSE Sensex
and S&P CNX Nifty is 0.997 that is a very
strong positive correlation. And R-square is
0.995 which reveals 99.5% of the variance in
the variable is examined. The calculated t
value is 0.712 which lies between critical
values + 2.16 which empirically proved that
the study can not able to accept the
Alternative Hypothesis. Hence there is a
significant relation of Sensex with Nifty.
Table VI highlights that there is a linear
relationship between the variables. It is
observed that the value of the slope is 0.098
signifying that for every unit change in X that
stands for FII there is a 0.098 unit change in Y
or Sensex. On the other hand the intercept is at
-1907.21 which seem that FII is playing
hottest role in the volatility of Sensex. There
are numbers of indicators which influence in
the index volatility of Sensex but FII is one of
most influencing factor towards index
volatility. Significance value is calculated as
0.000649, which is less than the critical value
of 0.05 which means not able to accept the
Alternative Hypothesis. Hence there is an
impact of the FII on the movement of the
Sensex.
Table VII highlights that there is linear
relationship between the variables analyzed. It
is observed that the value of slope is 0.030,
which reveals that for every unit change in FII
the value of Nifty is moved by 0.030. On the
other hand the intercept at -561.31 indicating
the role of FII in the movement of Nifty. It
means that if the value of FII is zero then the
value of NSE or Nifty would be affected by -
561.31 units. The significance value is
calculated at 0.000555, which is less than the
critical value of 0.05. Again it leads to the
acceptance of Null Hypothesis. Hence there is
an impact of FII on the volatility of Nifty
Index.
The both the tables VI & VII support fail to
reject the Null Hypothesis which signifies that
there is strong relation of FII with volatility of
BSE Sensex and S&P CNX Nifty, the effect is
slightly more pronounced Nifty. It leads to
conclusion that FII’s investment has
significant impact on Indian Capital Market.
Conclusion
Through the statistical tests, data analysis and
graphical presentation it has been found that
there is significant relation between the FII’s
net investment in equity and volatility in BSE
Sensex and S&P CNX Nifty as well as
between two indices BSE Sensex and S&P
CNX Nifty. Hence it is referred that every
movement of FII’s investment there is an
instant reaction in the Indian Capital Market.
The other factors are also influencing on
movement of the stock exchanges. The macro
factors in the form of the change in the interest
rate, inflation and demand and supply in the
global market which Indian market has faced
in year 2011. Moreover the sovereign debt
crisis in Europe took the center stage in
pulling the global market down. The factor
might be micro in terms to relating
profitability and operations of the listed
companies or the economic health of the
nation. While exploring the impact on
volatility in the stock exchanges it should be
kept in mind that FII flows are major drivers
of stock markets in India and hence a sudden
reversal of flows may harm the stability of its
markets it was seen in financial recession in
year 2007 and 2011 where the FII is the net
buyer from 2000 to 2011 excluding two years

Himanshu Barot et al TESTING INDEX VOLATILITY OF INDIAN STOCK MARKET IN THE CONTEXT OF FOREIGN
INSTITUTIONAL INVESTOR’S INVESTMENT
Int J Cur Res Rev, Sept 2012 / Vol 04 (17) ,
Page 38
2008 and 2011 which leads the heavy
investment and selling attitude of FII’s
causing a major hurdle in stabilization of
market sentiments.
Suggestions
The investment scenario in India has been
witnessing turbulent times due to high
inflation, poor policy implementation by the
government. The problems were further
accentuated by the Euro zone crisis and pull
backed investment by the FIIs leading to a
more than 24% decline in Indian Equities in
2011. Strong policy decisions from the
government’s side will make India an
attractive investment destination which may
attract more FII investments for growth of
Indian stock market and making the rupee
stronger. There is no doubt FIIs are
influencing the volatility on indices of stock
exchanges to a greater extent. But the role and
effect of the FII on the Indian economy should
be duly monitored and regulated by
government agencies as our economy is still in
the developing stage. It is imperative to ensure
that the domestic investors are protected from
the established foreign players.
Acknowledgment
Authors acknowledge the immense help
received from the scholars whose articles are
cited and included in references of this
manuscript. The authors are also grateful to
authors / editors / publishers of all those
articles, journals and books from where the
literature for this article has been reviewed
and discussed.
References
[1] Link Model, developed by Narendra
Singh Bohra available in “FIIs Investment
in Indian Capital Market: A Study of Last
one Decade”, International Research
Journal of Finance and Economics, Issue
68 (2011), pp .103
[2] Purnendra Verma (2001), “Impact of FII
on Capital Market – An Empirical study
on Indian Capital Market”, pp. 1-19,
retrieved from
www.scribd.comdoc6988166Impact-of-
Fii-On (07/12/2011)
[3] Aravind, T. N, et al. (2008) “FII’s
Influence in Indian Stock Market”,
retrieved from
http://www.coolavenues.com/know/fin/sub
y-stock-1.php (10/12/2011)
[4] Prasanna P.K. (2008), “Foreign
Institutional Investors: Investment
Preference in India”, Journal of
Administration & Governance, Vol. 3, No.
2, pp. 40-51
[5] Dr. Rahul Singh, et al. (2008), “A Study
of FII Investment Flow and SENSEX
Movement”, pp. 1-11, retrieved from
www.google.com (07/12/2011)
[6] Soumita Patra, et al. (2009), “Impact of
FII Flow on the BSE SENSEX and Nifty”,
pp. 1-42, retrieved from
http://www.slideshare.net/skyranger_007/i
mpact-of-fii-on-sensex-nifty/download
(07/12/2011)
[7] Gaurav Agrawal, et al. (2010),
“Investigation of Causality between FIIs
Investment and Stock Market Return”,
International Research Journal of Finance
and Economics, Issue 40, pp. 100-112
[8] Madan Sabnavis, et al. (2010),
“Implication of FII Inflows”, Economic
Studies: CARE Ratings, pp. 1-5, retrieved

Himanshu Barot et al TESTING INDEX VOLATILITY OF INDIAN STOCK MARKET IN THE CONTEXT OF FOREIGN
INSTITUTIONAL INVESTOR’S INVESTMENT
Int J Cur Res Rev, Sept 2012 / Vol 04 (17) ,
Page 39
from
http://www.careratings.comarchive38915.
pdf (07/12/2011)
[9] A.Q.Khan and Sana Ikram (2010),
“Testing Semi-Strong Form of Efficient
Market Hypothesis in Relation to the
Impact of FIIs Investments in Indian
Capital Market”, International Journal of
Trade, Economics and Finance, Vol. 1,
No. 4, pp. 373-379
[10 Narendra Singh Bohra and Akash Dutt
(2011), “FIIs Investment in Indian Capital
Market: A Study of Last one Decade”,
International Research Journal of Finance
and Economics, Issue 68, pp .103-116
[11] M. Anuradha Reddy (2011), “SENSEX
Movement and FII Flows – A Study”, pp.
1-12, retrieved from
http://www.wbiconpro.com306-
Venkat.pdf (07/12/2011)
[12] Ravi Akula (2011), “An Overview of
Foreign Institutional Investment in
India”, Indian Journal of Commerce &
Management Studies, Vol. 2, Issue 1, pp.
100-104
[13] Dr. Ambuj Gupta (2011), “Does the
Stock Market Rise or Fall Due to FIIs in
India”, International Referred Research
Journal, Vol. 2, Issue 2, pp. 99-107
[14] N S Subramanian & Sameer
Mulgaonkar (2011), “FIIS get more
bang for bug this year”, Business
Standard: Smart Investor, pp. 1 and 4
(14/12/2011)
[15] http://www.sebi.gov.in
[16] http://www.nseindia.com
[17] http://www.bseindia.com
[18] http://www.rbi.org.in
[19] http://www.moneycontrol.com
[20] http://www.business-standard.com
[21] http://www.google.com
[22] SEBI handbook of statistics on the Indian
Securities Market 2009, 2010
[23] RBI handbook of statistics on the Indian
Economy 2009-10, 2010-11
[24] SEBI Annual Report 2009-10, 2010-11
[25] Indian Securities Market Review, from
2000 to 2010
[26] NSE factbook from 2000 to 2011

Himanshu Barot et al TESTING INDEX VOLATILITY OF INDIAN STOCK MARKET IN THE CONTEXT OF FOREIGN
INSTITUTIONAL INVESTOR’S INVESTMENT
Int J Cur Res Rev, Sept 2012 / Vol 04 (17) ,
Page 40
Figure 1: Link Model: Portfolio Investment and Economic Development1
Table - I: SEBI Registered FIIs in India
Year FII at end of March Net Additions of FIIs
(1) (2) (3)
1993-94 3 3
1994-95 156 153
1995-96 353 197
1996-97 439 86
1997-98 496 57
1998-99 450 -46
1999-00 506 56
2000-01 527 21
2001-02 490 -37
2002-03 502 12
2003-04 540 38
2004-05 685 145
2005-06 882 197
2006-07 997 115
2007-08 1,319 322
2008-09 1,635 316
2009-10 1,713 78
Source: ISMR 2010

Himanshu Barot et al TESTING INDEX VOLATILITY OF INDIAN STOCK MARKET IN THE CONTEXT OF FOREIGN
INSTITUTIONAL INVESTOR’S INVESTMENT
Int J Cur Res Rev, Sept 2012 / Vol 04 (17) ,
Page 41
Table - II: Trends in Investment of Foreign Institutional Investors
Year Purchases
(Rs Cr.)
Sales
(Rs Cr.)
Net Investment
(Rs Cr.)
Net Investment
(US$ mn.)
Cumulative
Net Investment
(US$ mn.)
(1) (2) (3) (4) (5) (6)
1992-93 18 4 13 4 4
1993-94 5,593 467 5,127 1,634 1,638
1994-95 7,631 2,835 4,796 1,528 3,167
1995-96 9,694 2,752 6,942 2,036 5,202
1996-97 15,554 6,980 8,575 2,432 7,635
1997-98 18,695 12,737 5,958 1,650 9,285
1998-99 16,116 17,699 -1,584 -386 8,899
1999-00 56,857 46,735 10,122 2,474 11,373
2000-01 74,051 64,118 9,933 2,160 13,532
2001-02 50,071 41,308 8,763 1,839 15,372
2002-03 47,062 44,372 2,689 566 15,937
2003-04 1,44,855 99,091 45,764 10,005 25,943
2004-05 2,16,951 1,71,071 45,880 10,352 36,294
2005-06 3,46,976 3,05,509 41,467 9,363 45,657
2006-07 5,20,506 4,89,665 30,841 6,821 52,478
2007-08 9,48,018 8,81,839 66,179 16,442 68,919
2008-09 6,14,576 6,60,386 -45,811 -9,837 59,082
2009-10 8,46,438 7,03,780 1,42,658 30,253 89,335
2010-11 9,92,599 8,46,161 1,46,438 32,226 1,21,561
Source: SEBI. Annual Report 2010-11
Figure 2: Trends in Foreign Institutional Investment

Himanshu Barot et al TESTING INDEX VOLATILITY OF INDIAN STOCK MARKET IN THE CONTEXT OF FOREIGN
INSTITUTIONAL INVESTOR’S INVESTMENT
Int J Cur Res Rev, Sept 2012 / Vol 04 (17) ,
Page 42
Source: SEBI, Annual Report 2010-11
Figure 3: Number of FIIs and Net Investments
Source: ISMR 2010
Table – III: Net Investments by FIIs in Equity and Debt (Rs million)
Year Net Investment in Equity Net Investment in Debt
(1) (2) (3)
2001-02 80,670 6,850
2002-03 25,280 600
2003-04 399,600 58,050
2004-05 441,230 17,590
2005-06 488,010 -73,340
2006-07 252,360 56,050
2007-08 534,040 1,27,750
2008-09 -4,77,060 18,950
2009-10 1,102,200 3,24,380
2010-11 1,105,297 4,21,451
Source: ISMR 2010, www.moneycontrol.com

Himanshu Barot et al TESTING INDEX VOLATILITY OF INDIAN STOCK MARKET IN THE CONTEXT OF FOREIGN
INSTITUTIONAL INVESTOR’S INVESTMENT
Int J Cur Res Rev, Sept 2012 / Vol 04 (17) ,
Page 43
Table - IV: Movement of Net BSE Sensex, Net S&P CNX Nifty and Net FII in Equity
Year Net BSE
Sensex
Net S&P
CNX Nifty
Net FII in
Equity
(Rs. in Crores)
Cost of 1 point
of Sensex Rs.
cr
Cost of 1 point
of Nifty Rs. cr
(1) (2) (3) (4) (5) (6)
2000 -1,237.42 -218.60 6,386 -5.16 -29.21
2001 -728.32 -204.45 13,026.5 -17.89 -63.71
2002 115.27 34.65 3,629 31.48 104.73
2003 2,455.11 786.15 30,458 12.41 38.74
2004 730.21 200.15 27,787 38.05 138.83
2005 2,771.44 756.55 30,845 11.13 40.77
2006 4,364.42 1,129.60 18,586 4.26 16.45
2007 6,459.22 2,172.35 64,836 10.04 29.85
2008 -10,677.96 -3,177.60 -53,309.7 4.99 16.78
2009 7,744.26 2,237.75 89,574 11.57 40.03
2010 3,035.64 933.60 1,06,053.1 34.94 113.60
2011 -5,054.09 -1,510.20 -3,417.70 0.68 2.26
Source: www.bseindia.com, www.nseindia.com, ISMR 2000 to 2011 and SEBI handbook 2010
Figure 4: Net FII V/s Net BSE Sensex
Source: Data compiled from table IV

Himanshu Barot et al TESTING INDEX VOLATILITY OF INDIAN STOCK MARKET IN THE CONTEXT OF FOREIGN
INSTITUTIONAL INVESTOR’S INVESTMENT
Int J Cur Res Rev, Sept 2012 / Vol 04 (17) ,
Page 44
Figure 5: Net FII V/s Net S&P CNX Nifty
Source: Data compiled from table IV
Figure 6: Net FII V/s Net BSE Sensex and Net S&P CNX Nifty
Source: Data compiled from table IV
Table – V: Karl-Pearsons’ Product Moment Correlation Coefficient (2000-2011)
Indices Coefficient of
Correlation (r) R-square
t- Value
(Significance at 5%)
Sensex & FII 0.839 0.704 0.053
S&P CNX Nifty & FII 0.844 0.712 0.048
Sensex & S&P CNX
Nifty
0.997 0.995 0.712
Source: Data compiled from Appendix 1

Himanshu Barot et al TESTING INDEX VOLATILITY OF INDIAN STOCK MARKET IN THE CONTEXT OF FOREIGN
INSTITUTIONAL INVESTOR’S INVESTMENT
Int J Cur Res Rev, Sept 2012 / Vol 04 (17) ,
Page 45
Table – VI: Regression Analysis of BSE Sensex with FII
Linear Model Coefficient p-value
(at 5% significance) Values Std. Error
Intercept
Slope
-1907.21
0.098
1000.598
0.020
0.0858
0.000649
Source: Data compiled from Appendix 1
Table – VII: Regression Analysis of S&P CNX Nifty with FII
Linear Model Coefficient p-value
(at 5% significance) Values Std. Error
Intercept
Slope
-561.31
0.030
294.3346
0.006
0.0856
0.000555
Source: Data compiled from Appendix 1

G.S.R.Kedari et al STUDY OF LIPID PEROXIDATION, ANTIOXIDANT STATUS AND LIPID PROFILE IN
BREAST CANCER
Int J Cur Res Rev, Sept 2012 / Vol 04 (17) ,
Page 46
IJCRR
Vol 04 issue 17
Section: Healthcare
Category: Research
Received on:30/06/12
Revised on:23/07/12
Accepted on:12/08/12
STUDY OF LIPID PEROXIDATION, ANTIOXIDANT STATUS
AND LIPID PROFILE IN BREAST CANCER
G.S.R.Kedari1, G.S.R.Hareesh
2, A. Saseekala
3
1Department of Biochemistry, Saveetha Medical College, Thandalam,
Chennai, India 2Department of Surgery, Rajiv Gandhi Institute of Medical Sciences,
Kadapa, A.P., India 3Department of Biochemistry, Sri Venkateswara Medical College,
Tirupati, A.P.,India E-mail of corresponding authors: [email protected]
ABSTRACT
Objective: Breast cancer is the commonest malignancy in women in India and western
countries. Increased production of oxygen free radicals exhaust the antioxidant levels in
the body leading to the development of oxidative stress which results in the production
of cancer. The reasons for alteration of lipid profile in breast cancer is not clearly
understood. The aim of our present study is to evaluate the role of oxidative stress and
also the status of serum lipid profile in breast cancer patients.
Methods: The role of oxidative stress in breast cancer patients were evaluated by
estimating the levels of lipid peroxidation assessing plasma Malondialdehyde(MDA)
levels and antioxidant status by reduced glutathione(GSH), Vitamin-C in blood. We also
tried to assess lipid profile by estimating Serum total cholesterol, triglycerides, HDL
cholesterol and LDL cholesterol. For this, we have taken 50 cases of breast cancer
patients compared with 50 age matched control women.
Results: There were significant increase in the levels of MDA and significant decreases
in the levels of antioxidants like GSH and Vitamin-C in breast cancer patients when
compared with controls. There were also significant increase in the levels of Serum total
cholesterol, triglycerides and LDL cholesterol and no statistical significant difference was
observed with HDL cholesterol in cases when compared with controls.
Conclusion: Our results indicate that oxidative stress and alterations in lipid profile are
associated with the development of breast cancer and the need for modification of
lifestyle for the reduction of breast cancer development.
Keywords: Oxidative stress, Malondialdehyde, Reduced glutathione (GSH) and Vitamin-C
INTRODUCTION
Breast cancer is one of the most common
neoplasm’s in women and is a leading
cause of cancer related deaths worldwide.
The aetiology of breast cancer is
multifactorial. Epidemiologic studies have
identified many risk factors that increase
the chance of a woman developing breast
cancer include early age at menarche, late
age of menopause, null parity, obesity, oral

G.S.R.Kedari et al STUDY OF LIPID PEROXIDATION, ANTIOXIDANT STATUS AND LIPID PROFILE IN
BREAST CANCER
Int J Cur Res Rev, Sept 2012 / Vol 04 (17) ,
Page 47
contraception, hormone replacement therapy,
diet, family history, prior history of benign
breast disease and lactation. The common
denominator for many of these risk factors
is their effect on the level and duration of
exposure to endogenous or exogenous
estrogens.
Oxidative stress is implicated in the
pathogenesis of a variety of human
diseases(1). Oxidative damage occurs to
biomolecules like lipids, proteins,
carbohydrates and nucleic acids and other
extracellular components like collagen and
hyaluronic acid which are very
deleterious(2 )resulting in lipid peroxidation,
mutagenesis and carcinogenesis. However,
the body’s defense mechanisms play an
important role in the form of antioxidants
that help to minimize the damages which
are caused by oxidative stress. Antioxidants
are compounds that dispose, scavenge and
suppress the formation of free radicals or
oppose their actions. Oxidative stress
occurs when there is an imbalance
between reactive oxygen species(ROS) and
antioxidants reaction capacity which
stimulate the development of a disease
such as breast cancer(3).Several case
control studies have reported a relationship
with antioxidant status(4,5) and a reduction
in antioxidant level due to the presence of
free radicals may increase risk of breast
cancer. The neoplastic disease is related to
new growth where there is greater
utilization of lipids including total
cholesterol, lipoproteins, and triglycerides for
new membrane biogenesis. Cells fulfill
these requirements either from circulation,
by synthesis through the metabolism or
from degradation of major lipoprotein
fractions like VLDL, LDL or HDL(6). The
aim of our study was to evaluate the role
of lipid peroxidation in breast cancer by
estimating the plasma MDA levels and the
role of enzymatic and non enzymatic
antioxidants by estimating reduced
glutathione and vitamin-C and also to
evaluate the relationship between the lipid
profile and breast cancer.
MATERIALS AND METHODS
The present study was conducted in the
department of biochemistry and department
of general surgery in Saveetha medical
college and S.V. Medical college,
Tirupati.50 newly diagnosed cases of
breast cancer belonging to age group of
30-70 years were included in this study.
Out of cases,43 were having ductal
carcinoma and 6 patients were having
lobular carcinoma and 1 was having mixed
carcinoma(both ductal and lobular).75 age
matched women who have no history of
breast diseases were taken as controls. All
the subjects were not using any kind of
hormonal therapy and they had no any
other diseases like Diabetes mellitus, liver
diseases and thyroid disorders. Informed
consent was obtained from all the subjects.
Due permission was obtained from Ethical
clearance committee for this study. 10ml of
fasting blood samples were collected by
venipuncture and for the separation of
sera, 5ml of blood was centrifuged at
3000rpm for 5min and the remaining 5ml
of blood was taken into a plain vial
containing EDTA and was centrifuged at
3000rpm for 10min for the separation of
plasma. The plasma MDA levels were
estimated by using thiobarbituric acid
reacting substances(TBARS) by the method

G.S.R.Kedari et al STUDY OF LIPID PEROXIDATION, ANTIOXIDANT STATUS AND LIPID PROFILE IN
BREAST CANCER
Int J Cur Res Rev, Sept 2012 / Vol 04 (17) ,
Page 48
of Yagi(7) and Sinnhuber et al(8).Reduced
glutathione was determined by the method
of Beutler et al(9). The activity of
Ascorbic acid was determined by the
method of Tietz(10).Serum was used for
the estimation of lipid profile. Total
cholesterol and triglycerides were estimated
by enzymatic methods(11,12).HDL
cholesterol(HDL-C) was estimated by
phosphotungstic acid precipitation followed
by enzymatic analysis in supernatant
fraction(13) and LDL-cholesterol was
determined by using Friedwald’s
equation(14). All the results were
expressed as mean ± SD and statistical
comparisons were done using student t-test
using the SPSS package.
RESULTS
Comparison of levels of MDA, enzymatic
and non-enzymatic antioxidants in cases
and controls discussed in table 1. Comparison
of levels of Serum lipid profile in cases
and controls discussed in table 2.
Evaluation of oxidative stress is done
based on the levels of MDA and
statistically significant increase in the level
of MDA was observed in breast cancer
patients when compared to controls.
Statistically significant decreases were
observed in the levels of antioxidants like
GSH and Vitamin-C in cases when
compared to controls. There were also
significant increases in the levels of serum
total cholesterol, triglycerides and LDL
cholesterol in cases when compared to
controls. There was no statistical
significant difference in the levels of HDL
in cases when compared with controls.
DISCUSSION
Damage to the breast epithelium by
oxygen free radicals can lead to fibroblast
proliferation, epithelial hyperplasia, cellular
atypia and breast cancer. Studies have
shown increased lipid peroxidation in solid
tumors(15,16).The significant rise in the
MDA levels in breast cancer confirms that
it is associated with an increased
production of reactive oxygen
species(ROS) and free radicals. Lipid
peroxidation is a chain reaction which
provides a continuous supply of free
radicals that initiate further
peroxidation(17). We also observed a
significant decrease in the levels of
reduced glutathione in the cases as
compared to the controls. The intracellular
depletion of reduced glutathione can be
either due to the formation of a direct
complex with a electrophilic agent or due
to the inhibition of synthesis or due to the
subjection of the cell to oxidative
stress(18). When a cell is subjected to
oxidative stress, there is increased
utilization of glutathione, thus leading to its
depletion. Many enzymes are GSH
dependent and their activity may be
regulated by the thiol disulphide exchange.
They are thus dependent on the GSH
status. Glutathione –S- transferase (GST) is
reduced in diabetics which are dimeric,
mainly cytosolic enzymes that have
extensive ligand binding properties in
addition to their catalytic role in
detoxification(19,20). This reduction is due
to the reduced levels of GSH.
There is also a decrease in the levels of
non-enzymatic anti-oxidants such as Vit-C,
which states that there is an increased

G.S.R.Kedari et al STUDY OF LIPID PEROXIDATION, ANTIOXIDANT STATUS AND LIPID PROFILE IN
BREAST CANCER
Int J Cur Res Rev, Sept 2012 / Vol 04 (17) ,
Page 49
defense mechanism against oxidative
damage in breast
cancer. The decrease in the levels of these
non-enzymatic antioxidant parameters may
be due to an increased turnover for
preventing oxidative damage in these
patients, thus suggesting an increased
defense against oxidative damage. Our
results support the researchers who
reported decreases in the antioxidant level
and increases in lipid peroxidation
level(21,22).Several other researchers
showed over expression of
antioxidants(16,23).
In the present study, there is significant
increase in the levels of serum total
cholesterol, LDL cholesterol and
triglycerides in the breast cancer patients
when compared with normal subjects and
there is no significant difference in the
levels of HDL cholesterol . The patho
physiological mechanism for lipid
alterations underlying is not well
understood. Lipids are major cell membrane
components essential for various biological
functions including cell growth and
division of normal and malignant tissues.
Low levels of cholesterol in the
proliferating tissues and in blood
compartments could be due to the process
of carcinogenesis. The raised plasma
concentrations of theses parameters in
patients with breast cancer may be due to
an increased rate of lipid absorption as the
fat splitting enzymes, lipases, were also
found to be increased in the patients(24).
In conclusion, the present study
demonstrated high oxidative stress, low
antioxidant status with rise in plasma lipid
levels except HDL in breast cancer
patients which shows the need to adopt a
healthy lifestyle to reduce oxidative stress
with consumption of diet rich in
antioxidant nutrients to prevent breast
cancer.
ACKNOWLEDGEMENTS
Authors acknowledge the immense help
received from the scholars whose articles
are cited and included in references of this
manuscript. The authors are also grateful to
authors/editors/publishers of all those
articles, journals and books from where the
literature for this article has been reviewed
and discussed.
REFERENCES
1. Beck MM, Levander OA. Dietary
oxidative stress and potentiation of viral
infection. Annu Rev Nutr,1998; 18: 93-
116.
2. Frei B. Reactive oxygen species and
antioxidant vitamins: mechanisms of
action. Am J Med,1994; 97: S5-S13.
3. Aghvami T, Djalali M, Kesharvarz A, et
al. Plasma level of antioxidant vitamins
and lipid peroxidation in breast cancer
patients. Iran J Publ Health,2006; 35: 42-
7.
4. Ching S, Ingra D, Hahnel R, Beilby J,
Rossie E. Serum levels of micronutrients,
antioxidants and total antioxidant status
predict risk of breast cancer in a case
control study. J Nutr, 2002; 132: 303-6.
5. Do MH, Lee SS, Jung PJ, Lee MH. Intake
of dietary fat and vitamin in relation to
breast cancer risk in Korean women: a
case control study. J Korean Med
Sci,2003; 18: 534-40.
6. M.I.Qadir, S.A.Malik. Plasma lipid profile
in gynecologic cancers.
Eur.J.Gynaec.oncol, 2008; 29: 158-161.

G.S.R.Kedari et al STUDY OF LIPID PEROXIDATION, ANTIOXIDANT STATUS AND LIPID PROFILE IN
BREAST CANCER
Int J Cur Res Rev, Sept 2012 / Vol 04 (17) ,
Page 50
7. Yagi K. Lipid peroxides and human
diseases. Chem Phys Lipids, 1978; 45:
337-351.
8. Sinnhuber RO, Yu TC. Characterization
of red pigment formed in thiobarbituric
acid determination of oxidative rancidity.
Food Res,1958; 23: 626-630.
9. Beutler E, Duron O, Kelly BM. Improved
method for determination of blood
glutathione. J Lab Clin Med, 1963;61:882-
888.
10. Tietz NW(Ed). Textbook of Clinical
Chemistry. W.B.Saunders Company,
Philadelphia, London, Toronto.2004;
pp.960-962.
11. Alian CC,Poon LS, Chan CSG. Enzymatic
determination of total serum cholesterol.
Clinical Chemistry.1974; 20; 470-475.
12. Bucolo G, David H. Quantitative
determination of serum triglycerides by
the use of enzymes. Clinical chemistry.
1973;19:476-482.
13. Burstein M, Scholnick HR, Morfin R.
Rapid method for the isolation of
lipoproteins from human serum by
precipitation with polyamines. Journal of
lipid research,1970;2:583-595.
14. Friedewald WT, Levy RI, Fredrickson DS.
Estimation of the concentration of low
density lipoprotein cholesterol in plasma
without the use of preparatory
centrifuge. Clin Chem 1972; 18: 499-503.
15. Zieba M, Nowak D, Suwalski M,et al.
Enhanced lipid peroxidation in cancer
tissue homogenates in non small cell
lung cancer.Monaldi Arch Chest Dis
2001;56:110-4.
16. Skrzydlewska E, Stankiewicz A,
Sulkowska M, Sulkowski S, Kasacka I.
Antioxidant status and lipid peroxidation
in colorectal cancer. J Toxicol Environ
Health 2001;64:213-22.
17. Murray RK, Granner DK, Rodwell VW.
Harper’s Illustrated Biochemistry. 27th
Edn.2006.Mc Graw Hill Lange
International Edition.pp128-129.
18. Deneke SM, Farberg TZ. Regulation of
cellular glutathione lung cells.
Mol.Physiol,1994 ;1163-1173.
19. Listowsky I,Abramovitz M, Homma H et
al. Intracellular binding and transport of
hormones and Xenobiotics by
glutathione-S-transferase. Drug Metab
Res,1988;19:305-318.
20. Ketley JN, Habig WH, Jacoby WB.
Binding of non substrate ligands to
glutathione-s-transferases. J Biol
Chem,1976;250:8670-8673.
21. Gonenc A, Erten D, Aslan S, et al. Lipid
peroxidation andantioxidant status in
blood and tissue of malignant breast
tumor and benign breast disease. Cell
Biol Int 2006;30:376-80.
22. Yeh CC, Hou MF, Tsai SM, et al.
Superoxide anion radical, lipid peroxides
and antioxidant status in the blood of
patients with breast cancer. Clin Chim
Acta 2005;361:104-11.
23. Iscan M, Coban T, Cok I, et al. The
organochlorine pesticide residues and
antioxidant enzyme activities in human
breast tumors: is there any association?
Breast Cancer Res Treat, 2002;72:173.
24. Basu T.K and Williams D.C. Plasma
and body lipids in patients with
carcinoma of the
breast.Oncol.,1975;31:172.

G.S.R.Kedari et al STUDY OF LIPID PEROXIDATION, ANTIOXIDANT STATUS AND LIPID PROFILE IN
BREAST CANCER
Int J Cur Res Rev, Sept 2012 / Vol 04 (17) ,
Page 51
TABLE 1
Comparison of levels of MDA, enzymatic and non-enzymatic antioxidants in cases and
controls
Parameters Cases(n=50) Controls(n=50) P value
MDA
(nmol /ml)
7.98±0.13 2.16±0.12 <0.001
(highly significant)
GSH
(mg/g Hb)
8.46±0.21 14.76±0.13 <0.001
(highly significant
Vitamin-C
(mg/dl)
0.58±0.16 2.14±0.19 <0.001
(highly significant)
TABLE 2
Comparison of levels of Serum lipid profile in cases and controls
Parameters Cases(n=50) Controls(n=50) P value
Total cholesterol
(mg/dl)
213.72±9.31 154.15±6.68 <0.001
(highly significant)
Triglycerides
(mg/dl)
186.64±5.61 158.26±6.31 <0.05
(significant)
LDL Cholesterol
(mg/dl)
112.42±4.12 76.86±4.05 <0.05
(significant)
HDL Cholesterol
(mg/dl)
52.24±3.32 51.62±4.23 >0.05
( not significant)

Little Mahendra et al PSYCHOLOGICAL STRESS AND ORAL DISEASES – A LINK?
Int J Cur Res Rev, Sept 2012 / Vol 04 (17) ,
Page 52
IJCRR
Vol 04 issue 17
Section: Healthcare
Category: Review
Received on:23/06/12
Revised on:30/07/12
Accepted on:12/08/12
PSYCHOLOGICAL STRESS AND ORAL DISEASES – A LINK?
Little Mahendra1, Ravi David Austin
2, Jaideep Mahendra
3, S. Senthil
Kumar4
1A. P., Dept. of Periodontology, Raja Muthaiah Dental College and
Hospital, Annamalai University, Tamil Nadu, India. 2Dean, Raja Muthaiah Dental College and Hospital, Annamalai University,
Chidambaram, Tamil Nadu, India 3Department of Periodontology, Meenakshi Ammal Dental College,
Meenakshi Academy of Higher Education and Research, Chennai, India 4Dept. of Periodontology, Raja Muthaiah Dental College and Hospital
Annamalai University, India E-mail of corresponding authors: [email protected]
ABSTRACT
The relationship between stress and any disease is explained by hormonal modifications and behavioural
changes induced by the stress. Periodontitis is a chronic bacterial infection that involves the gingiva and
the periodontal supporting structures of the tooth. Several studies have shown significant associations
between stress factors and periodontal disease. The purpose of the present review article is to present
findings, which show that a lot of prospective studies are still needed for a more defined role of stress and
periodontal disease.
Keywords: Immune system; periodontal disease; Stress.
Introduction:
Epidemiologic studies and clinical
observations suggest that negative life events
and psychological factors may contribute to an
increased susceptibility to periodontal disease.
Stress a term continually being redefined in
the scientific study of disease and illness, is
nevertheless a confirmed and important factor
in the etiology and maintenance of many
inflammatory diseases, including periodontal
disease. stress is an attempt to understand how
the body regulates itself to maintain smooth,
adaptive and homeostatic functioning when
confronted with disruptive endogenous or
exogenous forces. Hippocrates thought of
health as a harmonious balance of the
elements comprising the quality of life while
disease represented disruption or disharmony
among those elements. In the seventeenth
century, Sydenharm suggested that
pathological states represented diseases of
adaptation failure of the adaptive processes to
restore wellbeing. Cannon elaborated how
fight or flight mechanisms represented
adaptive efforts by the body to re-establish
homeostasis, a term he introduced to describe
a dynamic internal physiological equilibrium
which the body sought to maintain along both
physical and emotional dimensions.
Hans Selye, the father of stress theory,
describes stress as, “Everybody knows what it
is, no one knows what it is. It is the
nonspecific response of the body to any
demand put upon it and stress is the spice of
life” (1). While Stress is defined as a state
induced by a stimulus that manifests itself by
virtue of one’s cognitive interpretation (2), the

Little Mahendra et al PSYCHOLOGICAL STRESS AND ORAL DISEASES – A LINK?
Int J Cur Res Rev, Sept 2012 / Vol 04 (17) ,
Page 53
stimulus itself is considered a stressor.
Accordingly, a stressor is any stimulus that
evokes stress, whereas stress reactions are the
observable consequences of the stressors.
Several studies have demonstrated the
relationship between psychological stress and
diseases, from common cold (3) to
cardiovascular disorders (4); from asthma (5)
to rheumatoid arthritis (6). Periodontal disease
being multifactoral with a complex interaction
between bacterial infection and host
responses, there is a reasonable amount of
research indicating the association between
periodontitis with psychosocial stress, distress,
and depression (7, 8).
When demands imposed by events exceed a
person’s ability to cope, a psychological stress
response composed of negative cognitive and
emotional state is elicited (9). Substantial
literature both in humans and animals support
association between psychological stress and
suppression of immune responses (10). While
stress can directly influence immune function
through the activation of neuro-endocrinal
pathways that lead to release of hormones and
neurotransmitters, such as cortisol and
catecholamines (11); it can also alter immune
responses through the adoption of coping
behaviors, such as smoking or drinking
alcohol, which are known to compromise
immunity (12).
Pathways between Stress and the Immune
System:
How can stress affect the immune response?
In 1936, Hans Selye defined stress
physiologically as the state in which the
sympatho-adreno-medullary system and the
limbic-hypothalamic-pituitary-adrenal axis
(HPA) are co-activated (13). A bidirectional
communication pathway exits between the
CNS and the immune system that modulates
both the cellular and humoral immunity (14).
First, stress induces the sympathetic fibers
which descend from the brain into both
primary (bone marrow and thymus) and
secondary (spleen and lymph nodes) lymphoid
tissues (15) to release a wide variety of
substances that influence immune responses
by binding to receptors on white blood cells
(14, 15). Though all lymphocytes have
adrenergic receptors, differential density and
sensitivity of adrenergic receptors on
lymphocytes may affect responsiveness to
stress among cell subsets. For example,
natural killer cells have both high-density and
high affinity β2-adrenergic receptors, B cells
have high density but lower affinity, and T
cells have the lowest density (16, 17).Second,
the stress activates the hypothalamic–
pituitary–adrenal axis, the sympathetic–
adrenal–medullary axis or locus coeruleus-
norepinephrine system, to induce secretion of
adrenal hormones epinephrine,
norepinephrine, and cortisol (13, 15); and also
the pituitary hormones prolactin and growth
hormone; and the brain peptides melatonin, β-
endorphin, and enkephalin. These substances
bind to specific receptors on white blood cells
and have diverse regulatory effects on their
distribution and function (18).Communication
between the neuro-endocrine (hypothalamic-
pituitary-adrenal) and immune inflammatory
systems functions as a feedback loop that
regulates the immune components of the
inflammatory response. For example, a
negative feed back loop functions such that
activation of the immune system, associated
with increases in levels of circulating
cytokines (e.g. interleukin-1 and interleukin-
6), increases activity in the corticotrophin

Little Mahendra et al PSYCHOLOGICAL STRESS AND ORAL DISEASES – A LINK?
Int J Cur Res Rev, Sept 2012 / Vol 04 (17) ,
Page 54
releasing hormone/hypothalamic-pituitary-
adrenal system yielding increased levels of
circulating adreno-corticotropic hormone and
cortisol – major modulators of the stress
system (19).
Connection between Stress and
Periodontitis:
Stress can be viewed as a process with both
psychological and physiological components.
Pollman and Dietrich (1979), Moulton et al
(1952) pointed out that stress may affect
periodontium directly or indirectly (7). While
the psychosocial stressors initiate cascade of
events through the hypothalamic-pituitary-
adrenal axis, the autonomic nervous system
and the central nervous system, it enhances
the likelihood of infection and specifically,
periodontal disease (8, 20).While cortisol has
been called the hormone of stress, serum
cortisol level increases during challenging or
unpleasant situation (21, 22). Cortisol being
an immunosuppressant influences not only the
inflammatory cells, chemotaxis etc., but also
the pro-inflammatory cytokines like
interleukin-6 (IL-6), interleukin-1 receptor
antagonist (IL-1ra) (23, 24, 25). It is always
being studied that stress causes activation of
neuro-endocrinal pathways with release of
cortisol, which in turn suppresses the
immunity. And in such an environment the
progression of periodontal infection by the
pathogen is unhampered (7). Though this
relation gives a link between stress and
periodontal disease, this holds good for other
inflammatory diseases as well. Though the
periodontitis is initiated by the pathogens, the
mediators of connective tissue breakdown are
produced by host-derived enzymes called
Matrix metalloproteinases (MMPs) (26). They
are zinc and calcium dependent proteolytic
enzymes responsible for remodeling and
degradation of extracellular matrix (27). The
homeostasis of extracellular matrices depends
on the release of MMPs from cells such as
fibroblasts and macrophages, and the presence
of tissue inhibitors of matrix
metalloproteinases (TIMPs), which are
distributed widely in tissues and fluids (28).
While the MMP gene family encodes nine or
more metal-dependent endopeptidases, eight
human MMPs have been cloned and
sequenced, of which MMP-1 cleaves fibrillar
collagen types I, II, and III (27) that constitute
the gingival and periodontal connective tissue.
While MMP-1 is implicated to play an
important role in the initiation of collagen
degradation in periodontal disease, MMP-8 is
thought to play an important role in
periodontal tissue destruction (29).
Very few in-vitro studies, using exogenous
steroids, have shown the effects of
corticosteroids on the expression of MMPs
and TIMPs in fibroblasts (30, 31). A study by
Cury PR et al. (31) showed that
hydrocortisone produced a dose-dependent
regulation of MMP and TIMP expression, by
significantly up-regulating mRNA expression
of MMP-1, -2, -7, and -11 and TIMP-1 in
human gingival fibroblasts. When Pubmed
was searched for studies where endogenous
cortisol, due to stress, induced expression of
MMPs and TIMPs in fibroblasts, none were
found.
Significant Reviews:
Several studies have demonstrated a
relationship between psychological stress and
inflammatory diseases such as rheumatoid
arthritis, osteoarthritis etc., (20, 32, 33) and
periodontitis (7, 8).Gerard J. Linden et al.

Little Mahendra et al PSYCHOLOGICAL STRESS AND ORAL DISEASES – A LINK?
Int J Cur Res Rev, Sept 2012 / Vol 04 (17) ,
Page 55
(34) examined the association between
occupational stress and the progression of
periodontitis in employed adults and
suggested that occupational stress may have a
relationship to the progression of
periodontitis. Torbjørn Breivik et al. (35)
reviewed studies to find effects of emotional
stress on immunity, gingivitis and
periodontitis, and noted that emotional
stressors and the nervous and neuro-endocrine
responses to psychological stressors may
modulate the immune response to bacteria,
and thus expected stress to influence the
progression and course of gingivitis and
periodontitis.In a case-control study, Moss et
al. (36) explored the association between
social factors and adult periodontitis by
comparing self-reported information for daily
strains and symptoms of depression. They
found that an elevated Depression score may
be a marker for social isolation, which could
play a role in immune function during periods
of social strain. Croucher R et al. (37) also in
a case-control study investigated the role of
life-events in periodontitis. The results
showed that periodontitis was associated with
the negative impact of life-events, the number
of negative life-events, high levels of dental
plaque, tobacco smoking and unemployment.
Genco RJ, Ho AW, Jeffrey Kopman et al. (38),
Genco RJ, Ho AW, Grossi SG et al. (8)
evaluated the association of stress, distress,
and coping behaviors with periodontal
disease. They found that subjects with
financial strain and inadequate coping had
greater attachment and alveolar bone loss, in
contrast to subjects with financial strain and
good coping. Salivary cortisol levels were
higher in a test group exhibiting severe
periodontitis, as compared to a control group
consisting of those with little or no periodontal
disease. Renate Deinzer et al. (39, 40)
analyzed the effects of academic stress on
periodontal health of medical students and
found that psychological stress was a
significant risk factor for periodontal
inflammation. Elter et al. (41) found that
clinical depression may have a negative effect
on periodontal treatment outcome in health
maintenance organization (HMO) patients.
Study by Hugoson A, Ljungquist B, Breivik T
(42) revealed that, in addition to increased
age, oral hygiene status, and smoking, the
negative life events like, loss of a spouse
(being a widow or widower) and the
personality trait of exercising extreme external
control were also associated with severe
periodontal disease. Aleksejuniené t al. (43)
tested the hypothesis that psychosocial stress
and lifestyle are related to periodontal status.
Although the pathway between psychosocial
stress and remaining periodontal support was
not empirically supported, the researchers
concluded that there was reason to believe that
such link was likely. Wimmer G et al. (44)
examined the influence of different coping
behaviors on a non-surgical periodontal
therapy and on the course of periodontal
disease. They found patients with a defensive
coping style had statistically significant poorer
attachment values (P= 0.000) after 2 years
compared to patients with other coping
behaviors. The number of sites with severe
advanced CAL (>5mm) was significantly
correlated with a suppressive coping style
(P=0.0001).Alexander Saletu et al. (45)
investigated the relationship between
periodontitis and psychopathology utilizing
psychometry, both observer-rating scales and
self-rating scales. Partial correlation analyses

Little Mahendra et al PSYCHOLOGICAL STRESS AND ORAL DISEASES – A LINK?
Int J Cur Res Rev, Sept 2012 / Vol 04 (17) ,
Page 56
between psychometric measures and dental
variables revealed positive correlations of
periodontal disease severity/CAL with the
depression/anxiety, subjective well-being and
complaints scores, and a negative correlation
with quality of life. R. Akhter et al. (46)
designed a study to identify possible
relationship between stress and periodontal
disease in residents of a rural Japan and found
subjects who felt job stress and those who felt
stress due to self health were more prone to
have periodontal disease than were those who
never or only rarely felt such stress. Vettore et
al. (47) in a case-control study investigated
the relationship of stress and anxiety with
periodontal clinical characteristics. They
found the frequency of moderate clinical
attachment loss (4-6 mm) and moderate
probing pocket depth (4-6 mm) significantly
associated with higher trait anxiety scores,
after adjusting for socioeconomic data and
cigarette consumption. J.B. Hilgert, F.N.
Hugo D.R. Bandeira and M.C. Bozzetti (48)
evaluated the extent and severity of chronic
periodontitis and its association with the levels
of salivary cortisol and the scores obtained
with a stress questionnaire in a population
aged 50 years. They found that the cortisol
levels were positively associated with the
extent and severity of Periodontitis. Fernando
N. Hugo, Juliana B. Hilgert et al (49)
evaluated the effects of stress, depression, and
cortisol levels in dental plaque accumulation
and gingivitis in a population of individuals
aged ≥50 years. They found that stress was a
significant risk indicator of elevated levels of
plaque and gingivitis, whereas cortisol was a
risk indicator of plaque. Amy E Rosania (50)
did a cross-sectional pilot study to explore the
associations between psychological factors,
markers of periodontal disease, psycho-neuro-
immunologic variables, and behavior. She
found that stress, depression, and salivary
cortisol correlated with measures of
periodontal disease. In addition, oral care
neglect during periods of stress and depression
was associated with loss of attachment and
missing teeth.
Conclusion:
Stress can be a risk factor for periodontitis, on
one hand in stress the person’s oral hygiene
habits are altered causing accumulation of
plaque and on the other it reduces the
immunity of person through its endocrinal
connections. Many studies have shown a
positive relationship was observed between
stress and periodontal disease, further
representative research is needed to determine
the impact of stress/psychological factors as
risk factors for periodontal disease.
References:
1. Stephan Rechtschaffen, Marc Cohen.
Vitality and Wellness. Dell Publications,
1999.
2. Kirtz S, and Moos, Physiological effects
of social environments. Psychosom Med
1974:36:96.
3. Sheldon Cohen, David Tyrell, and Andrew
Smith. Psychological stress and
susceptibility to the common cold. N Engl
J Med 1991:325(9):606-612.
4. Joel E. Dimsdale. Psychological Stress
and Cardiovascular Disease. Journal of
the American College of Cardiology
2008:51(13):1237–46.
5. Thomas Ritz, Andrew Steptoe, Stephen
Dewilde, And Marco Costa. Emotions and
Stress Increase Respiratory Resistance in

Little Mahendra et al PSYCHOLOGICAL STRESS AND ORAL DISEASES – A LINK?
Int J Cur Res Rev, Sept 2012 / Vol 04 (17) ,
Page 57
Asthma. Psychosomatic Medicine
2000:62:401–412.
6. Zautra AJ, Hoffman J, Potter P, Matt KS,
Yocum D, Castro L. Examination of
changes in interpersonal stress as a factor
indisease exacerbations among women
with rheumatoid arthritis.Ann Behav Med
1997:19:279-286.
7. Da Silva AM, Newman HN, Oakley DA.
Psychosocial factors in inflammatory
periodontal diseases- A review. J Clin
Periodontol 1995:22:516-526
8. Genco RJ, Ho AW, Grossi SG, Dunford
RG, Tedesco LA. Relationship of stress,
distress, and inadequate coping behaviors
to periodontal disease. J Periodontol
1999:70:711-723.
9. Lazarus RS, Folkman S. Stress appraisal
and coping. New York: Springer, 1984.
10. Suzanne C. Segerstrom and Gregory E.
Miller. Psychological Stress and the
Human Immune System: A Meta-Analytic
Study of 30 Years of Inquiry. Psychol Bull.
2004:130(4):601–630.
11. Susan Ayers, Andrew Baum, Chris
McManus. Cambridge handbook of
psychology, health and medicine.
Cambridge University Press, 2007.
12. Kiecolt-Glaser, JK and Glaser, R.
Methodological issues in behavioral
immunology research with humans. Brain
Behaviour and Immunity. 1988:2:67-78.
13. Chrousos GP. The hypothalamic-pituitary-
adrenal axis and immune-mediated
inflammation. N Engl J Med 1995:
332:1351–62.
14. Ader R, Cohen N, Felten D. January 14).
Psychoneuroimmunology: Interactions
between the nervous system and the
immune system. Lancet 1995:345:99–103
15. Felten SY, Felten D. Neural-immune
interaction. Progress in Brain Research
1994:100:157–162.
16. Anstead MI, Hunt TA, Carlson SL, Burki
NK. Variability of peripheral blood
lymphocyte beta-2-adrenergic receptor
density in humans. American Journal of
Respiratory and Critical Care Medicine
1998:157:990–992.
17. Landmann R. Beta-adrenergic receptors in
human leukocyte sub-populations.
European Journal of Clinical Investigation
1992:22:30–36.
18. Ader, R., Felten, D. L., & Cohen, N.
Psychoneuroimmunology (3rd ed.). San
Diego, CA:Academic Press, 2001
19. Walker JG, Littlejohn GO, McMurray NE,
Cutolo M. Stress system response and
rheumatoid arthritis: a multilevel
approach. Rheumatology 1999: 38: 1050–
1057.
20. Alex J. Zautra and Bruce W. Smith.,
Depression and Reactivity to Stress in
Older Women With Rheumatoid Arthritis
and Osteoarthritis. Psychosomatic
Medicine 2001:63:687–696.
21. Kennon T. Francis, Psychological
Correlates of Serum Indicators of Stress in
Man: A Longitudinal Study.
Psychosomatic Medicine 1979:41(8):617-
628.
22. Taiki Takahashi, Koki Ikeda, Miho
Ishikawa, Nozomi Kitamura, Takafumi
Tsukasaki, Daisuke Nakama & Tatsuya
Kameda. Anxiety, reactivity, and social
stress-induced cortisol elevation in
humans. Neuroendocrinology
2005:26(4):351-354.
23. Sabine R. Kunz-Ebrecht, Vidya
Mohamed-Ali, Pamela J. Feldman,

Little Mahendra et al PSYCHOLOGICAL STRESS AND ORAL DISEASES – A LINK?
Int J Cur Res Rev, Sept 2012 / Vol 04 (17) ,
Page 58
Clemens Kirschbaum and Andrew
Steptoe., Cortisol responses to mild
psychological stress are inversely
associated with proinflammatory
cytokines. Brain, Behavior, and Immunity
2003:17:373–383.
24. Laura Redwine et al., Differential Immune
Cell Chemotaxis Responses to Acute
Psychological Stress in Alzheimer
Caregivers Compared to Non-caregiver
Controls. Psychosomatic Medicine
2004:66:770–775.
25. Suzanne C. Segerstrom and Gregory E.
Miller., Psychological Stress and the
Human Immune System: A Meta-Analytic
Study of 30 Years of Inquiry.
Psychological Bulletin 2004:130(4):601–
630.
26. Page RC. The role of inflammatory
mediators in the pathogenesis of
periodontal disease. J Periodon Res
1991:26:230-242.
27. H. Birkedal-Hansen, W.G.I. Moore, M.K.
Bodden, L.J. Windsor, B. Birkedal-
Hansen, A. DeCarlo and J.A. Engler.
Matrix Metalloproteinases: A Review.
Crit. Rev. Oral Biol. Med. 1993: 4:197.
28. J. Verstappen and J.W. Von den Hoff.
Tissue Inhibitors of Metalloproteinases
(TIMPs): Their Biological Functions and
Involvement in Oral Disease. J Dent Res
2006: 85:1074.
29. Toshifumi Aiba, Nagako Akeno, Tetsuya
Kawane, Hiroshi Okamoto and Noboru
Horiuchi. Matrix metalloproteinases-1 and
-8 and TIMP-1 mRNA levels in normal
and diseased human gingivae. Eur J Oral
Sci 2007:104(5-6): 562-569.
30. M. Kylmaniemil, A. Oikarinen, K.
Oikarinen, and T. Salo. Effects of
Dexamethasone and Cell Proliferation on
the Expression of Matrix
Metalloproteinases in Human Mucosal
Normal and Malignant Cells. J Dent Res
1996: 75(3): 919-926.
31. Cury PR, Araújo VC, Canavez F, Furuse
C, Araújo NS. Hydrocortisone affects the
expression of matrix metalloproteinases
(MMP-1, -2, -3, -7, and -11) and tissue
inhibitor of matrix metalloproteinases
(TIMP-1) in human gingival fibroblasts. J
Periodontol. 2007:78(7):1309-1315.
32. Sheldon Cohen and Gail M. Williamson.,
Stress and Infectious Disease in Humans.
Psychol Bull.1991:109(l): 5-24.
33. Ballieux RE., Impact of mental stress on
the immune response. J Clin Periodontol
1991: 18: 427-430.
34. Gerard J. Linden et al., Stress and the
progression of periodontal disease. J Clin
Periodontol 1996:23 (7): 675 – 680.
35. Torbjørn Breivik, Per S. Thrane, Robert
Murison and Per Gjermo., Emotional
stress effects on immunity, gingivitis and
periodontitis. European Journal of Oral
Sciences 1996:104 (4):327–334.
36. Moss ME et al., Exploratory case-control
analysis of psychosocial factors and adult
periodontitis. J Periodontol. 1996:
67(10):1060-69.
37. Croucher R, Marcenes WS, Torres MC,
Hughes F, Sheiham A ., The relationship
between life-events and periodontitis A
case-control study., J Clin Periodontol.
1997:24(1):39-43.
38. Genco RJ, Ho AW, Jeffrey Kopman,
Grossi SG, Dunford RG, Tedesco LA.,
Models to evaluate the role of stress in
periodontal disease. Ann Periodontol.
1998: 3(1):288-302.

Little Mahendra et al PSYCHOLOGICAL STRESS AND ORAL DISEASES – A LINK?
Int J Cur Res Rev, Sept 2012 / Vol 04 (17) ,
Page 59
39. Renate Deinzer, Stefan Rüttermann, Ole
Möbes Armin Herforth., Increase in
gingival inflammation under academic
stress. J Clin Periodontol. 1998:
25(5):431–433.
40. Renate Deinzer, Daniel Hilpert, Katharina
Bach, Michael Schawacht and Armin
Herforth., Effects of academic stress on
oral hygiene – a potential link between
stress and plaque-associated disease? J
Clin Periodontol. 200:8(5): 459 – 464.
41. Elter JR, White BA, Gaynes BN, Bader
JD. Relationship of clinical depression to
periodontal treatment outcome. J
Periodontol.2002:73(4):441-9.
42. Hugoson A, Ljungquist B, Breivik T., The
relationship of some negative events and
psychological factors to periodontal
disease in an adult Swedish population 50
to 80 years of age. J Clin Periodontol.
2002:29(3):247-53.
43. Aleksejuniené J, Holst D, Eriksen HM,
Gjermo P., Psychosocial stress, lifestyle
and periodontal health. J Clin Periodontol.
2002:29(4):326-35
44. Wimmer G, Köhldorfer G, Mischak I,
Lorenzoni M, Kallus KW., Coping with
stress: its influence on periodontal
therapy. J Periodontol. 2005:76(1):90-8.
45. Alexander Saletu, Helene Pirker-Frühauf,
Franziska Saletu, Leopold Linzmayer,
Peter Anderer and Michael Matejka.,
Controlled clinical and psychometric
studies on the relation between
periodontitis and depressive mood. J Clin
Periodontol. 2005:32(12):1219–1225.
46. R. Akhter, M. A. Hannan, R. Okhubo, M.
Morita., Relationship between stress factor
and periodontal disease in a rural area
population in Japan. Eur J Med Res
2005:10:352-357.
47. Vettore MV, Leão AT, Monteiro Da Silva
AM, Quintanilha RS, Lamarca GA. The
relationship of stress and anxiety with
chronic periodontitis. J Clin Periodontol.
2003: 30(5):394-402.
48. J.B. Hilgert, F.N. Hugo D.R. Bandeira and
M.C. Bozzetti., Stress, Cortisol, and
Periodontitis in a Population Aged 50
Years and Over. J Dent Res
2006:85(4):324-328.
49. Fernando N. Hugo, Juliana B. Hilgert et
al., Chronic stress, depression, and cortisol
levels as risk indicators of elevated plaque
and gingivitis levels in individuals aged 50
years and older. J Periodontol. 2006:
77(6):1008-1014.
50. Amy E. Rosania, B.S., Thesis work: “The
Relationships between Stress, Depression,
and the Progression of Periodontal
Disease.” 2007., Department of
Psychology, Bates College, Maine, USA.

Little Mahendra et al PSYCHOLOGICAL STRESS AND ORAL DISEASES – A LINK?
Int J Cur Res Rev, Sept 2012 / Vol 04 (17) ,
Page 60
(FIGURE- 1) Pathways between Stress and the Immune System

Mamta Bhatia et al AN IN VITRO SCREENING OF GROWTH INHIBITORY POTENTIAL OF ALLIUM SATIVUM
TOWARDS SOME MICROBES OF SPOILAGE AND HEALTH SIGNIFICANCE
Int J Cur Res Rev, Sept 2012 / Vol 04 (17) ,
Page 61
IJCRR
Vol 04 issue 17
Section: Technology
Category: Research
Received on:13/06/12
Revised on:23/07/12
Accepted on:12/08/12
AN IN VITRO SCREENING OF GROWTH INHIBITORY POTENTIAL
OF ALLIUM SATIVUM TOWARDS SOME MICROBES OF SPOILAGE
AND HEALTH SIGNIFICANCE
Mamta Bhatia, Alka Sharma
Department of Food Technology, Guru Jambheshwar University of Science
and Technology, Hisar, Haryana, India.
Email of corresponding author:[email protected]
ABSTRACT
The use of Allium sativum (garlic) as a cure and condiment predates written history. In present
study aqueous extract, crude juice, essential oil and powdered form of Allium sativum were
screened for their inhibitory potential towards some food borne pathogens, in culture media. Test
microbes included: Bacillus cereus, Enterococcus faecalis, Escherichia coli, Psuedomonas
aeruginosa, Psuedomonas alkaligenes, Shigella sonnei and Staphylococcus aureus. Spice agar
method was opted for investigating antibacterial activity of powdered spice samples. Agar well
assay and broth dilution techniques were followed for determining growth inhibitory potentials
of aqueous extract, crude juice and essential oil. Results revealed that essential oil most
effectively inhibited bacterial strains followed by crude juice, while aqueous extract and
powdered forms remained ineffective in arresting the growth of test bacteria.
Keywords: Antibacterial, Antimicrobial, Allium sativum, essential oil, garlic, spices.
Introduction
Foods, by their very nature need to be
nutritious and microbiologically stable. To
ensure that food is safe and can be stored in a
satisfactory state, it is necessary to either
destroy the microorganisms present, or
manipulate the food so that microbial growth
is prevented or hindered. Resurgence in the
use of natural herbal alternatives instead of
synthetic preservatives to increase the shelf
life of food commodoties has brought the use
of aromatic plants to the forefront of
investigations. Allium sativum, is one of the
world’s most popular spices, and is used
extensively from India to America, in French
aioli, Greek skordalia, Indian korma, Turkish
cacik and Vietnamese pho bo. Since ancient
times, it has been used as a cure as well as
food. Pliny the elder, a Roman naturalist,
described in his Historia Naturalis how A.
sativum could be used for gastrointestinal
disorders, dog and snake bites, scorpion
stings, asthama, madness, convulsions and
tumours. Components from A. sativum
modulate the cardiovascular and immune
systems. Alongwith medicinal properties, it is
known to have antiviral1,2
and antiprotozoal3,4
activities. Encouraged by these results, an in
vitro trial was carried out to evaluate different
forms of A. sativum viz. aqueous extract,
crude juice, essential oil and powdered form,
for their antimicrobial potencies, against seven
food borne pathogens.

Mamta Bhatia et al AN IN VITRO SCREENING OF GROWTH INHIBITORY POTENTIAL OF ALLIUM SATIVUM
TOWARDS SOME MICROBES OF SPOILAGE AND HEALTH SIGNIFICANCE
Int J Cur Res Rev, Sept 2012 / Vol 04 (17) ,
Page 62
Materials and Methods
Procurement of spice samples
Fresh bulbs of A. sativum purchased in the
amounts of 1 kg, from grocery shop, local
market, Hisar, India. The spice samples were
washed with clean water followed by distilled
water to remove extraneous matter. The outer
coverings of A. sativum bulbs/clove were
peeled off manually with the help of knife.
For the extraction of crude juice, peeled
cloves of A. sativum were sliced into thin
pieces and were crushed in pestle-mortar to
get a thick paste. Thick pastes of spice
samples were passed through sieve cloth.
Filtrates thus obtained were sterilized by
passing through syringe filter assembly having
membrane filters of pore size 0.45 um under
aseptic conditions. Crude extract thus obtained
was stored in sterilized glass vials at 4+1° C
and was used at various concentration levels
within the 2 h. of their preparation.
To get the powdered form, peeled cloves of A.
sativum were dried in shade for 5 days
followed by their grinding in the laboratory
grinder and were kept in airtight containers till
further use.
Essential oil of A.sativum was procured from
Aroma Chemicals Pvt. Limited, Delhi, India,
stored in the dark amber colored, screw
capped glass bottle and was kept away from
light to avoid physicochemical changes in its
composition. Purity of the essential oil was
assured by the company to be more than
99.0%.
Chemicals and culture media
Ethyl violet azide dextrose agar, Ethyl violet
azide dextrose broth, MacConkey broth,
MacConkey agar, Nutrient agar and Nutrient
broth were obtained from Hi-Media Pvt. Ltd,
India. Dimethylsulphoxide (DMSO) and
Sodium chloride (NaCl) were obtained from
Central drug house Pvt. Limited, India.
Bacterial cultures
All the pure bacterial cultures viz. Bacillus
cereus (MTCC 430), Enterococcus faecalis
(MTCC 439), Escherichia coli (MTCC 1687),
Psuedomonas aeruginosa (MTCC 1688),
Psuedomonas alkaligenes (MTCC 405),
Shigella sonnei (MTCC 2957) and
Staphylococcus aureus (MTCC 5021) were
obtained from Microbial Type Culture
Collection (MTCC), Institute of Microbial
Technology (IMTECH), Chandigarh, India.
The reference bacterial strains were
maintained on their respective media slants,
subcultured bimonthly to maintain their
viability and were stored at 4+1° C. Culture
media, incubation temperatures and duration
of incubation of reference bacterial strains are
presented in Table 1.
Inoculum preparation
A flamed sterile wire loop was used to
dislodge the lawns of test bacterial strains
from their respective pure culture slants (24h.
old) with 10 ml of sterilized normal saline
(NaCl, 0.85% (w/v)) solution under aseptic
conditions. Bacterial suspensions were
adjusted with the same solution to contain
approximately 1×10⁷
cfu /ml and were utilized
the same day.
Prepearation of aqueous extract
Aqueous extract of dried and powdered bulbs
was prepared. Powdered spice sample was
steeped overnight (temperature: 24-27°C) in
sterilized distilled water in a ratio of 1:1 (w:
v), followed by their homogenization in a

Mamta Bhatia et al AN IN VITRO SCREENING OF GROWTH INHIBITORY POTENTIAL OF ALLIUM SATIVUM
TOWARDS SOME MICROBES OF SPOILAGE AND HEALTH SIGNIFICANCE
Int J Cur Res Rev, Sept 2012 / Vol 04 (17) ,
Page 63
blender at high speed for 2 min. The
homogenized spice mixture was filtered
through Whatmann No. 1 filter paper. Filtrate
thus obtained, was sterilized by passing
through syringe filters containing 0.45 um
pore size membrane filters under aseptic
conditions, collected in sterilized glass vial
and was stored at 4+1° C. This aqueous
extract was further used within the 2 h. of its
preparation.
Preliminary screening of antibacterial
activities of aqueous extract, crude juice
and essential oil
Agar-well diffusion technique was followed5.
Freshly prepared inoculum (100 ul) of each
reference bacterial strain was poured in plates
with 20 ml of appropriate media. The
petriplates seeded with bacterial strains were
kept undisturbed for 30 min. for proper
solidification and setting of agar to facilitate
uniform digging of wells. Sterile cork borer
(diameter: 8 mm) was used to bore wells in
the solidified media plates previously seeded
with bacterial inocula. Subsequently, different
volumes of test substances were introduced
into the wells of agar plates. Sterilized DMSO,
instead of crude juice and essential oil served
as negative control. These plates were allowed
to stand at room temperature for at least 1 h.
for the even diffusion of poured components
and were incubated without inversion at their
respective incubation temperatures in
incubator for 24-48 h. After incubation, zones
of inhibition formed around the wells were
measured in millimeters (mm) and results
were expressed as the net zone of inhibition
which represented the subtraction of the
diameter of the well (8 mm) from the
measured zone.
Mnimum inhibitory concentrations (MIC)
of crude juice and essential oil
MIC values of crude juice and essential oil
were determined by broth dilution method6.
The media (broth) containing 2000 ul/ml of
test substance was serially diluted twofold
each with the media (broth) to give
concentrations of 1000, 500, 250, 125, 62.50,
31.25, 15.62, 7.81, 3.90, 1.95, 0.97, 0.48, 0.24,
0.12, 0.06 ul/ml. Sterilized DMSO, instead of
crude juice and essential oil, served as
negative control. To the diluted solution, 100
ul of freshly prepared inoculum of each
bacterial strain was added. These mixtures
were incubated in the B.O.D. incubator at
suitable incubation temperatures of microbes,
for appropriate incubation periods. After the
completion of incubation, 100 ul of the above
mixture was evenly spread on the surface of
solidified media petriplates with the help of
sterile bent glass rod. These petriplates were
incubated in an inverted position to observe
the minimum concentration of test substances,
at which visible growth of the reference
microbes was completely inhibited.
Antibacterial activity of powdered form
Antibacterial activity of powdered form of
spice sample was examined in culture media
using spice agar method7. Erelenmeyer flasks
(100 ml capacity) containing 20 ml of
appropriate media (containing agar) and
powdered spice at different concentrations
(0.1, 0.2, 0.4, 0.6, 0.8, 1.0, 1.5, 2.0, 2.5, 3.0,
3.5, 4.0, 4.5, 5.0, 5.5, 6.0 (%, w/v) were
autoclaved at 121° C for 20 minutes. After
autoclaving, spice agar mixtures (cooled but
still molten) were poured into sterilized
petriplates under aseptic conditions and these
plates were kept undisturbed for 30 min. for

Mamta Bhatia et al AN IN VITRO SCREENING OF GROWTH INHIBITORY POTENTIAL OF ALLIUM SATIVUM
TOWARDS SOME MICROBES OF SPOILAGE AND HEALTH SIGNIFICANCE
Int J Cur Res Rev, Sept 2012 / Vol 04 (17) ,
Page 64
proper setting of agar. Freshly prepared
inoculum of each test microbe at 100 ul level
was evenly spread over the entire surface of
the respective solidified media in petriplate
using a sterile bent glass rod. Seeded
petriplates were incubated in incubator at
appropriate temperatures and were examined
for bacterial growth at 12 h. intervals,
throughout the incubation period of 30 days.
A similar experiment was carried out without
any spice sample that served as control. The
time for initiation of microbial growth on
control (without spice samples) and media
supplemented with different concentrations of
spice were recorded.
Statistical analysis:
All the experiments were performed in
triplicates with two independent trials and the
results obtained were highly reproducible.
Values of growth inhibitory zones are mean
±SD (n=3) of three replicates.
Results
Zone inhibition assay results (Table 2)
revealed that seeded petriplates with DMSO
and aqueous extract of A. sativum, did not
display growth inhibitory zones towards any
bacterial strain under observation. Crude juice
at 100 ul/well level exhibited inhibitory circles
towards B. cereus, P.aeruginosa and S.
aureus. On the other hand, essential oil of A.
sativum, at 10ul/well exhibited distinct zones
of inhibition towards all the bacterial strains
under investigation. The diameter of
inhibitory zones varied with the type of
bacterial strains and test substances implicated
in the study. Crude juice exhibited widest
diameter of inhibitory zone towards S.aureus,
while essential oil produced broadest
inhibitory circle towards B.cereus. It was also
observed that g+ve bacterial strains gave
wider inhibitory zones towards test substances
as compared to g-ve bacterial strains. On the
basis of diameter of growth inhibitory zones,
sensitivity of microbes in descending order
towards test substances may be put in the
following manner:
Essential oil:
B.cereus>S.aureus>P.aeruginosa>P.alkalige
nes>S.sonnei>E.faecalis>E.coli.
Crude juice:
S.aureus>B.cereus>P.aeruginosa=E.coli=E.f
aecalis=P.alkaligenes=S.sonnei.
Results of broth dilution technique depicted
that crude juice and essential oil of A. sativum
effctively inhibited all the bacterial strains
(Table 3). MIC values of essential oil towards
bacterial strains ranged from 62.50-500.00
(ul/ml), whereas, that of crude juice ranged
from 125.00-500.00 (ul/ml), thereby
indicating the higher susceptibility of the
microbes towards former. It was noticed that
higher concentrations of crude juice and
essential oils were required to inhibit g-ve
bacterial strains.
Dried and powdered bulbs of A. sativum at all
the concentration levels i.e. 0.0, 0.1, 0.2, 0.4,
0.6,0.8, 1.0, 1.5, 2.0, 2.5, 3.0, 3.5, 4.0, 4.5, 5.0,
5.5, 6.0 (%, w/v), remained ineffective in
arresting bacterial strains, and visible growth
of all the microbes was noticed on 2nd
day of
incubation, as in control set of petriplates,
without any spice sample.
Discussion
Functional properties of aromatic plant/spices
etc. are contained in their volatile aromatic
secrections commonly known as essential
oils8. A. sativum bulbs have 0.1%-0.25%

Mamta Bhatia et al AN IN VITRO SCREENING OF GROWTH INHIBITORY POTENTIAL OF ALLIUM SATIVUM
TOWARDS SOME MICROBES OF SPOILAGE AND HEALTH SIGNIFICANCE
Int J Cur Res Rev, Sept 2012 / Vol 04 (17) ,
Page 65
essential oil, which is composed of 60%
diallyl disulphide (Allicin), 20% diallyl
trisulphide, 6% allyl propyl disulphide and
diallyl sulphide9. The inhibitory activity of
essential oil of A. sativum is widely attributed
to diallyl disulphide (Allicin). Allicin is highly
volatile and is formed by the action of enzyme
allinase on alliin (an odourless precursor),
when fresh cloves/bulbs of A. sativum are cut
or bruised10
. The mode of action of allicin to
inhbit growth of bacterial strains is not yet
well understood however, it may involve:
hydrophobic and hydrogen bonding of active
components of essential oil to membrane
proteins, perturbation of membrane
permeability, leakage of ions and other cell
contents, inhibition of membrane embedded
enzymes, destruction of electrons transport
systems, disruption of proton motive force
(PMF) and coagulation of cell contents
leading to death. The ineffectivity of
aqueous extract and powderd form of A.
sativum bulbs towards test microbes in the
present experiment may be attributed to the
loss of allicin during drying of cloves/bulbs
under ambient conditions.
The greater susceptibility of g+ve bacterial
strains towards crude juice and essential oil of
A. sativum may be due to the absence of an
outer membrane in their cell membrane which
makes them more sensitive to external
environmental changes such as temperature,
pH , natural extracts, essential oils and other
antimicrobial substances. On the other hand,
the lipopolysacharides in the cell membrane of
g-ve bacteria could provide a barrier to many
antimicrobial agents, rendering these bacteria
more resistant to certain agents than g+ve
bacteria. It is worth mentioning here that
crude extract more effectively arrested
microbes during broth dilution technique than
zone inhibition assay. This may be attributed
to the direct contact of the microbes with
liquid media which might have allowed the
easy and quick diffusion of antimicrobial
components of crude juice to the target site.
Conclusion
Present in vitro study indicates that essential
oil of A. sativum inhibited food borne
pathogens most effectively and may be
considered for food preservation. Further
studies should be undertaken to elucidate the
safety, stability and organoleptic aspects of
essential oil and its precise mode of action.
Interactions of essential oil components with
different food matrices during various food
processing treatments must be the focal area
of research before their commercialization as
‘biopreservatives’.
References
1. Weber ND, Anderson DO, North JA,
Murray BK, Lawson LD, Hughes BG. In
vitro virucidal activity of Allium sativum
(garlic) extract and compounds. Planta Med
1992; 58: 417–23.
2. Shoji S, Furuishi K, Yanase R, Miyazaka
T, Kino M. Allyl compounds selectively
killed human deficiency virus-type 1-
infected cells. Biochem Biophys Res
Commun 1993; 194: 610–21.
3. Lun ZR, Burri C, Menzinger M, Kaminsky
R. Antiparasitic activity of diallyl trisulfide

Mamta Bhatia et al AN IN VITRO SCREENING OF GROWTH INHIBITORY POTENTIAL OF ALLIUM SATIVUM
TOWARDS SOME MICROBES OF SPOILAGE AND HEALTH SIGNIFICANCE
Int J Cur Res Rev, Sept 2012 / Vol 04 (17) ,
Page 66
(Dasuansu) on human and animal
pathogenic protozoa (Trypanosoma sp.,
Entamoeba histolyica and Giardia lamblia)
in vitro. Ann Soc Belg Med Trop 1994;
74:51–9.
4. Reuter HD, Koch HP, Lawson LD. 1996.
Therapeutic effects and applications of
garlic and its preparations. In: Koch
HP,Lawson LD (eds) Garlic: the science
and therapeutic application of Allium
sativum L. and related species. Williams
and Wilkins, Baltimore, pp 135–213.
5. Iroegbu CU, Nkere. Evaluation of the
antibacterial properties of Picralima nitida
stembark extracts. International J Mol Med
Adv Sci 2005; 1: 182-9.
6. Kim HO, Park SW and Park HD.
Inactivation of Escherichia coli 0157:H7
by cinnamic aldehyde purified from
Cinnamomum cassia shoot. J Food Micro
2004; 21:105-10.
7. Azzouz MA, Bullerman LB. Comparative
antimycotic effects of selected herbs,
spices, plant components and commercial
antifungal agents. J Food Prot 1982; 45:
1298-1301.
8. Pruthi JS. Spices and Condiments. National
Book Trust, New Delhi, India, 1976; pp.
117–21.
9. Stoll V, Seebeck E. Allium compounds. I.
Alliin the true mother compound of garlic
oil. Helv Chem Acta 1948 ; 31:189.
10. Lawson LD. The composition and
chemistry of garlic cloves and processed
garlic. In: Koch HP, Lawson LD (eds)
Garlic: the science and therapeutic
application of Allium sativum L. and related
species. Williams and Wilkins, Baltimore,
1996; pp 37–107.
Table 1: Bacterial strains tested
Bacterial strains Strain
number
Media used Temperature of
incubation
Time period of incubation
Bacillus cereus MTCC 430
Nutrient agar, Nutrient broth
300 C 24-48 h.
Enterococcus
faecalis
MTCC
439
Ethylviolet azide dextrose
agar, Ethylviolet azide
dextrose broth
450 C 24-48 h.
Escherichia coli MTCC 1687
MacConkey agar, MacConkeybroth
450 C 24-48 h.
Psuedomonas
aeruginosa
MTCC
424
Nutrient agar, Nutrient
broth
320 C 24-48 h.
Psuedomonas
alkaligenes
MTCC 405
Nutrient agar, Nutrient broth
320 C 24-48 h.
Shigella sonnei MTCC
2957
Nutrient agar, Nutrient
broth
320 C 24-48 h.
Staphylococcus
aureus
MTCC 5021
Nutrient agar, Nutrient broth
370 C 24-48 h.

Mamta Bhatia et al AN IN VITRO SCREENING OF GROWTH INHIBITORY POTENTIAL OF ALLIUM SATIVUM
TOWARDS SOME MICROBES OF SPOILAGE AND HEALTH SIGNIFICANCE
Int J Cur Res Rev, Sept 2012 / Vol 04 (17) ,
Page 67
Table 2: Inhibitory effect of aqueous extract essential oil and crude juice of A. sativum on
bacterial strains
Results are expressed as mean±SD (n=3); DMSO: Dimethylsulphoxide
Table 3: Minimum inhibitory concentrations of different forms of A. sativum against
bacterial strains
Test
Substances
Bacterial strains
B.cereus E.faecalis E.coli P.aeruginosa P.alkaligenes S.sonnei S.aureus
Essential
oil
(ul/ml)
62.50 250.00 500.00 250.00 250.00 250.00 125.00
Crude
juice
(ul/ml)
500.00 1000.00 2000.00 1000.00 2000.00 1000.00 500.00
DMSO
(ul/ml) ND ND ND ND ND ND ND
ND: Not Detected; DMSO: Dimethylsulphoxide
Bacterial
strains
Zones of Inhibition (mm)
DMS
O
(10
ul)
Essential
oil
(10 ul)
Aqueous extract Crude juice
(80 ul) (100
ul)
(80 ul) (100 ul)
B.cereus 0.00 28.00±0.32 0.00 0.00 0.00 12.00±0.24
E.faecalis 0.00 5.10±0.07
0.00 0.00 0.00 0.00±0.00
E.coli 0.00 4.00±0.23
0.00 0.00 0.00 0.00±0.00
P.aeruginosa 0.00 19.00±0.10
0.00 0.00 0.00 9.00±0.06
P.alkaligenes 0.00 16.00±0.13
0.00 0.00 0.00 0.00±0.00
S.sonnei 0.00 15.10±0.08
0.00 0.00 0.00 0.00±0.00
S.aureus 0.00 19.20±0.17
0.00 0.00 0.00 16.10±0.09

Singh Meenu et al IN-VITRO ESTIMATION OF FREE RADICAL SCAVENGING ACTIVITY OF FRUIT JUICES BY
DPPH ASSAY
Int J Cur Res Rev, Sept 2012 / Vol 04 (17) ,
Page 68
IJCRR
Vol 04 issue 17
Section: Healthcare
Category: Research
Received on:03/06/12
Revised on:23/07/12
Accepted on:12/08/12
IN-VITRO ESTIMATION OF FREE RADICAL SCAVENGING
ACTIVITY OF FRUIT JUICES BY DPPH ASSAY
Singh Meenu, Pragzna Yanamadala, Dharmadev Bommi
Department of Pharmacology, CMR College of Pharmacy, Kandlakoya
(V), Hyderabad, A.P. India
Email of corresponding author: [email protected]
ABSTRACT
Objective: A number of different beverage products claim to have antioxidant potency due to
their perceived high content of polyphenols. The present study was designed to evaluate the in
vitro estimation of free radical scavenging activity of three different fruit juices as follows:
Grapes, Guava and Pineapple available in local market.
Method: Above mentioned fruit juices were screened for their free radical scavenging property
using diphenyl picryl hydrazyl (DPPH) radicals. The absorbance of these fruit juices at 517nm is
found by using UV-spectroscopy at various time intervals such as 15 minutes, 30 minutes and 24
hours respectively. Then the absorbance was compared with each other and better antioxidant
activity of the fruit juices was estimated.
Results: The results obtained from the DPPH assay demonstrated that Grapes juice had better
antioxidant activity than Pineapple and Guava juices.
Conclusions: The present research demonstrates that although a number of popular beverages
have evidence of antioxidant activity, there are clear differences in antioxidant potency. Some
beverages with lower potency would need to be consumed in much larger amounts to equal the
antioxidant potency of Grapes juice.
Keywords: Anti-oxidant activity, DPPH (diphenyl picryl hydrazyl), Grapes, Guava, Pineapple.
INTRODUCTION
Clinical trials and epidemiological studies have
established an inverse correlation between the
intake of fruits and vegetables and the
occurrence of diseases such as inflammation,
cardiovascular disease, cancer, and aging-
related disorders 1. The defensive effects of
natural antioxidants in fruit and vegetables are
related to three major groups; vitamin,
phenolics and carotenoids and are believed to
be the effective nutrients in the prevention of
these oxidative stress related diseases 2,3
. There
is therefore a parallel increase in the use of
methods for estimating the efficiency of such
substances as antioxidants 4,5
. One such method
that is currently popular is based upon the use
of the stable free radical 2,2-di(4-
tertoctylphenyl)- 1-picrylhydrazyl (DPPH)
which was an easy and accurate method with
regard to measuring the antioxidant capacity of
fruit and vegetable juices or extracts 4.
Pineapple fruit is considered a highly nutritious
fruit because it contains a high level of vitamin
C, a natural antioxidant which may inhibit the

Singh Meenu et al IN-VITRO ESTIMATION OF FREE RADICAL SCAVENGING ACTIVITY OF FRUIT JUICES BY
DPPH ASSAY
Int J Cur Res Rev, Sept 2012 / Vol 04 (17) ,
Page 69
development of major clinical conditions
including heart disease and certain cancers 6.
The fruit also contains phenolic compounds
and β-carotene 7,8
, which constitute natural
sources of antioxidants. Guava (Psidium
guajava L.) fruit is considered a highly
nutritious fruit because it contains a high level
of ascorbic acid (50–300 mg/100 g fresh
weight), which is three to six times higher than
oranges. Phenolic compounds such as
myricetin and apigenin 9, ellagic acid, and
anthocyanins 10
are also at high levels in guava
fruit.
The grapes has been well recognized
worldwide for over 2,000 years as one among
the edible sweet fruits and recognized for its
wide spectrum of biological properties.
Resveratrol (3,5,40-trans-trihydroxystilbene)
is a natural phytoalexin abundantly found in
grapes and red wine, which has potent
antioxidant property 11
. Thus, red fruit juices
such as grapes and others like guava and
pineapple have received attention due to their
antioxidant activity.
Whereas there are numerous phytochemicals
consumed in our diet, polyphenols constitute
the largest group and have attracted much
attention due to their antioxidant properties 12
.
In fact, the potential health benefits of plant
foods are commonly linked to their
polyphenol content. Currently, there are a
number of commercial ready-to-drink (RTD)
polyphenol-rich beverages, which base their
marketing strategies on antioxidant potency.
However, to the best of our knowledge, data
on the direct comparison of antioxidant
activity of these widely available leading
beverage products have not been obtained. It
is of great interest to the general public to
know the antioxidant capacity of the
beverages that they consume. However, it
should be cautioned that because of the
inherent complexity of food matrices, the use
of one antioxidant capacity method to
determine antioxidant potency is ineffective.
This is because antioxidants respond to
different reactive species in different tests,
which is partially attributed to multiple
reaction mechanisms and reaction phases 13,14
.
The aim of the current study was to compare
the antioxidant activity of three marketed fruit
juices i.e., Grapes, Guava and Pineapple juices
by DPPH assay.
MATERIALS AND METHODS
Ready-to-Drink Polyphenol-Enriched
Beverages
The following preparations are obtained from
the local provisional market of Hyderabad:
Grape, Guava and Pineapple of “Real
Company”. All fruit juices were analyzed in
late March or early April prior to their
expiration dates as stated on their packages.
All beverages were kept at storage conditions
as specified on their labels prior to analyses.
Analysis of Ascorbic acid content (AAC)
The AAC was determined by the iodine
titration method 15
or the RP-HPLC method:
Waters C-18 column (3.9×150 mm, 5µm
particle size), mobile phase 5% acetic acid (Sd
Fine Chem Limited, Mumbai), flow-rate 0.5
mL/min and 254 nm detection wavelength.
Analysis of Total phenol content (TPC)
TPC was determined using the Folin-
Ciocalteu’s reagent 16
(LOBACHEMIE,
Mumbai). Samples (0.3 mL, triplicate) were

Singh Meenu et al IN-VITRO ESTIMATION OF FREE RADICAL SCAVENGING ACTIVITY OF FRUIT JUICES BY
DPPH ASSAY
Int J Cur Res Rev, Sept 2012 / Vol 04 (17) ,
Page 70
introduced into test tubes followed by 1.5 mL
of Folin-Ciocalteu’s reagent (diluted 10 times
with water) and 1.2 mL of sodium carbonate,
7.5%w/v (Virat Lab, Hyderabad). The tubes
were vortexed, covered with parafilm and
allowed to stand for 30 min. Absorption at 765
nm was measured. If the sample absorbance
exceeded 1, the sample was appropriately
diluted to give reading less than 1. Total
phenol contents were expressed in gallic acid
equivalents (mg per 100 g fresh fruit).
Free Radical Scavenging Capacity:
The free radical scavenging capacity was
analyzed by the DPPH assay 17,18
. 2,2-
diphenyl-1-picrylhydrazy, DPPH (Santa cruz
biotechnology, Inc) is a radical generating
substance that is widely used to monitor the
free radical scavenging abilities (the ability of
a compound to donate an electron) of various
antioxidants. The DPPH radical has a deep
violet color due to its impaired electron, and
radical scavenging can be followed
spectrophotometrically by the loss of
absorbance at 517 nm, as the pale yellow non
radical form is produced 19
. The DPPH assay
was typically run by the following procedure:
In this method five dilutions of each fruit juice
with two replicates were analyzed. Reaction
solution was prepared by mixing 50 µL of
diluted fruit juice with 300 µL of methanolic
DPPH solution (1mM) and the final volume
was brought to 3 mL with methanol (Sd Fine
Chem Limited, Mumbai). The solution was
kept in dark at room temperature for 15
minutes. The absorbance (Ajuice) was read
against the prepared blank (50 µL diluted fruit
juice, 2950 µL methanol) at 517nm. A DPPH
blank solution was prepared (300 µL of 1mM
DPPH solution, 2.7 mL of methanol) and
measured. Percent inhibition of DPPH radical
was calculated for each dilution of juice
according to formula:
% Inhibition = [(ADPPH-Ajuice)/ADPPH×100]
Where ADPPH is the absorbance value of the
DPPH blank solution, Ajuice is the absorbance
value of the sample solution. IC50, the
concentration of antioxidant required for 50%
scavenging of DPPH radical in the specified
time period was derived from the % Inhibition
vs Concentration plot. Results are shown in
table and graphs.
Each category of the juice sample contained
the extract optimized for total phenolics,
ascorbic acid content and IC50 values
respectively. Each value is the mean ±
Standard deviation (n = 3). Means in the same
row bearing different letters are significantly
different (p<0.05) as analysed by the scheffe
test.
RESULTS
The results of total phenolic, ascorbic acid
contents and IC50 of different fruit juices are
summarized in Table 1. From the table the
total phenolic content was found to be highest
in Grapes juice 116.73 ± 0.14 mg/100g
followed by Pineapple juice 95.20 ± 1.10
mg/100g and lowest in Guava 79 ± 0.06
mg/100g. The change in colorization from
violet to yellow and subsequent fall in
absorbance of the stable radical DPPH was
measured at 517nm for various concentrations
i.e. 50-250 μg/mL. The IC50 value for each
fruit extract defined as the concentration of
extract causing 50% inhibition of absorbance
was calculated, since IC50 is a measure of
inhibitory concentration, a lower IC50 value
would reflect greater antioxidant activity of
the sample. Antioxidant activity among the

Singh Meenu et al IN-VITRO ESTIMATION OF FREE RADICAL SCAVENGING ACTIVITY OF FRUIT JUICES BY
DPPH ASSAY
Int J Cur Res Rev, Sept 2012 / Vol 04 (17) ,
Page 71
fruit samples was found to be maximum in
Grapes having lowest IC50 value of 0.79 ±
0.34 mg/mL and minimum in Guava having
highest IC50 1.71 ± 0.61 mg/mL as lower IC50
value would reflect greater antioxidant activity
of the sample.
DISCUSSION
A polyphenol-rich food with health benefits
has become a more common element in food
marketing these days. The public is highly
aware of the term “antioxidant”, which has
been defined by the Institute of Medicine of
the National Academy of Sciences as follows:
“a substance in foods that significantly
decreases the adverse effects of reactive
species, such as reactive oxygen and nitrogen
species, on normal physiologic function in
humans.” Therefore, the marketing of many
so-called “superfoods” is commonly based on
their antioxidant potential. Multiple assays
with different sensitivities and specificities for
antioxidant activity are being used separately
to justify health claims. Consumers have a
difficult time distinguishing among the
various antioxidant claims for widely
available antioxidant beverages. Therefore,
the present study was significant in comparing
the most commonly available brands of
beverages for antioxidant activity using the
well-known and established laboratory
methods for determining antioxidant capacity.
Grapes juice had the highest antioxidant
capacity and the most complete antioxidant
coverage in vitro which may be contributed to
its constituent, phytoalexin. The present
research demonstrates that although a number
of popular beverages have evidence of
antioxidant activity in vitro, there are clear
differences in antioxidant potency.
The bleaching of the DPPH solution increases
regularly with increasing amount of fruit in a
given volume of solution. The bleaching
action is mainly attributed to the presence of
polyphenols and ascorbic acid extracted into
the solution. The total phenolic content, IC50,
and the ascorbic acid content of the fruit juices
are summarized in Table 1, Graphs 1, 2 and 3.
For a given amount of fruit, the higher the
absorbance, the better is the reducing power.
Correlation of IC50 with reducing power:
DPPH assay measures the ability of the extract
to donate hydrogen to the radical. In DPPH
assay the lower the IC50 the better it is able to
scavenge the radicals, particularly peroxy
radicals which are the propagators of the
autoxidation of lipid molecules and thereby
break the free radical chain reaction 20
. It is
observed that grapes having low IC50, is a very
potent radical scavenger. In terms of reducing
power, grape rank highest but guava is
significantly lower than that of pineapple. The
high antioxidant potential (as characterized by
low IC50 and high reducing power) of grape is
attributed to its high TPC and AAC. The low
antioxidant potential of guava (IC50 = 1.71 ±
0.61 mg/mL) is due its low TPC and AAC.
Pineapple in spite of its relatively high TPC
has low antioxidant potential (IC50 = 0.83 ±
0.24 mg/mL). Three possible reasons may be
able to account for this: First, it has been
reported that 21
reaction of DPPH with certain
phenols such as eugenol and its derivatives is
reversible, resulting in low readings for
antioxidant activity (% disappearance). The
second possible reason could be due to the
slow rate of the reaction between DPPH and
the substrate molecules 13
.The third possible
explanation (for the relatively low reducing
power) could be that certain phenols in the

Singh Meenu et al IN-VITRO ESTIMATION OF FREE RADICAL SCAVENGING ACTIVITY OF FRUIT JUICES BY
DPPH ASSAY
Int J Cur Res Rev, Sept 2012 / Vol 04 (17) ,
Page 72
pineapple juice have a higher redox potential
than that of other fruit juices. To clarify this
anomaly further work is necessary. Finally, it
is also observed that the antioxidant potential
correlates well with AEAC.
CONCLUSION
For a body to maintain antioxidant level,
external supplementation is necessary for
healthy living. From the present research the
order of the antioxidant activity in the fruit
juices was found to be
Grapes>Pineapple>Guava. These fruits can be
used as alternative source of natural
antioxidant rather than synthetic antioxidant
like BHT (Butylated hydroxytoluene) and
BHA (Butylated hydroxyanisole) because of
carcinogenicity.
ACKNOWLEDGEMENT
We thank everyone who supported this study.
REFERENCES
1. Swartzberg J, Margen S. Eat, Drink, and
be Healthy-The HarVard Medical School
Guide to Healthy Eating. Am J Epidemiol
2001;154(12):1160.
2. Ames BN, Gold LS, Willet WC. The
causes and prevention of cancer. Proc Natl
Acad Sci USA 1995;92:5258-5265.
3. Kaur C, Kapoor HC. Antioxidants in fruits
and vegetables-the millennium’s health.
Int J Food Sci Technol 2001;36(7):703-
725.
4. Sanchez-Moreno C. Review: Methods
used to evaluate the free radical
scavenging activity in foods and biological
systems. Food Sci Tech Int 2002;8(3):121-
137.
5. Schwarz K, Bertelsen G, Nissen LR,
Gardner PT, Heinonen MI, Hopia A, et al.
Investigation of plant extracts for the
protection of processed foods against lipid
oxidation. Comparison of antioxidant
assays based on radical scavenging, lipid
oxidation and analysis of the principal
antioxidant compounds. Eur Food Res
Technol 2001;212:319-328.
6. Diplock AT. Antioxidants and disease
prevention. Molecular Aspects of
Medicine 1994;15:293-376.
7. Gardner PT, White TAC, McPhail DB,
Duthie GG. The relative contributions of
vitamin C, carotenoids and phenolics to
the antioxidant potential of fruit juices.
Food Chemistry 2000;68:471-474.
8. Charoensiri R, Kongkachuichai R,
Suknicom S, Sungpuag P. Betacarotene,
lycopene, and alpha-tocopherol contents of
selected Thai fruits. Food Chemistry
2009;113:202-207.
9. Miean KH, Mohamed S. Flavonoid
(myricetin, quercetin, kaempferol, luteolin,
and apigenin) content of edible tropical
plants. Journal of Agricultural and Food
Chemistry 2001;49:3106–3112.
10. Misra K, Seshadri TR. Chemical
components of the fruits of Psidium
guajava. Phytochemistry 1968;7:641–645.

Singh Meenu et al IN-VITRO ESTIMATION OF FREE RADICAL SCAVENGING ACTIVITY OF FRUIT JUICES BY
DPPH ASSAY
Int J Cur Res Rev, Sept 2012 / Vol 04 (17) ,
Page 73
11. Yadav M, Jain S, Bhardwaj A, Nagpal R,
Puniya M, Tomar R, et al. Biological and
Medicinal Properties of Grapes and Their
Bioactive Constituents: an Update. J Med
Food 2009;12(3):473-484.
12. Proteggente AR, Pannala AS, Paganga G,
Van Buren L, Wagner E, Wiseman S, et
al. The antioxidant activity of regularly
consumed fruit and vegetables reflects
their phenolic and vitamin C composition.
Free Radical Res 2002;36:217-233.
13. Huang D, Ou B, Prior RL. The chemistry
behind antioxidant capacity assays. J
Agric Food Chem 2005;53:1841-1856.
14. Prior RL, Wu X, Schaich K. Standardized
methods for the determination of
antioxidant capacity and phenolics in
foods and dietary supplements. J Agric
Food Chem 2005;53:4290-4302.
15. Suntornsuk L, Kritsanapun W,
Nilkamhank S, Paochom, A. Quantitation
of vitamin C content in herbal juice using
direct titration. Journal of Pharmaceutical
and Biochemical Analysis 2002;28:849-
855.
16. Singleton VL, Rossi JA. Colorimetry of
total phenolics with phosphomolybdic–
phosphotungstic acid reagents. American
Journal of Enology and Viticulture 1965;
16:144-158.
17. Malterud KE, Farbrot TL, Huse AE, Sund
RB. Antioxidant and radical scavenging
effects of anthraquinones and anthrones.
Pharmacology 1993;47:77-85.
18. Nenseter MS, Halvorsen B, Rosvold Q,
Rustan AC, Drevon CA. Paracetamol
inhibits copper ion-induced, azo
compound initiated, and mononuclear
cells-mediated-oxidative modification of
LDL. Arterioscler Thromb Vasc Biol
1995;15:1338-1344.
19. Seeram NP, Aviram M, Zhang Y, Henning
SM, Feng L, Dreher M, et al. Comparison
of Antioxidant Potency of Commonly
Consumed Polyphenol-Rich Beverages in
the United States. J Agric Food Chem
2008; 56:1415-1422.
20. Frankel EN. Recent advances in lipid
oxidation. Journal of the Science of Food
and Agriculture 1991; 54:495-511.
21. Bondet V, Brand-Williams W, Berset C.
Kinetic and mechanisms of antioxidant
activity using the DPPH free radical
method. LWT-Food Science and
Technology 1997;30 (6):609-615.

Singh Meenu et al IN-VITRO ESTIMATION OF FREE RADICAL SCAVENGING ACTIVITY OF FRUIT JUICES BY
DPPH ASSAY
Int J Cur Res Rev, Sept 2012 / Vol 04 (17) ,
Page 74
Table 1: Table showing total phenolic content,
ascorbic acid content and IC50 of fruit juices
of the Real company.
Sl.
No.
Fruit
juices
TPC
(mg/100g)
AAC
(mg/100g)
IC50
(mg/mL)
1 Grapes 116.73 ±
0.14a
144 ±
1.02c
0.79 ±
0.34b
2 Guava 79 ± 0.06b
132 ±
0.62a
1.71 ±
0.61a
3 Pineapple 95.20 ±
1.10a
98 ± 0.3b
0.83 ±
0.24c
Graph 1: Total phenolic content of the three
fruit juices of the Real Company
Graph 2: Ascorbic acid content of the three
fruit juices of the Real company
Graph 3: IC50 values of the three fruit juices of
the Real company

Muhammad Farzanjou
CAREER, JOB SATISFACTION AND ITS EVALUATION METHODS
Int J Cur Res Rev, Sept 2012 / Vol 04 (17) ,
Page 75
IJCRR
Vol 04 issue 17
Section: Management
Category: Review
Received on: 13/06/12
Revised on: 23/07/12
Accepted on: 10/08/12
CAREER, JOB SATISFACTION AND ITS EVALUATION
METHODS
Muhammad Farzanjou
Technical and Vocational Faculty of Shahid Bahonar, Technical and
Vocational University, Zahedan, Iran
Email of corresponding author: [email protected]
ABSTRACT
Job is among the issue that has often been engaged by human mind, governments and nations.
Although job and occupation is apparently associated with economic-subsistence aspect of
humans, it is closely linked to their personal, familial, social, political and cultural dimensions.
Job satisfaction is a filed within which social psychological, sociological, economic and political
and educational sciences perspectives have been mentioned. Today, there are thousands of job
and professions in each country which people are involved in and thereby continue their life.
What always attracts the attention of psychologists and social sciences thinkers are people's job
satisfaction and the effects of this satisfaction in their spirits and working productivity. If one is
not interested in his / her job, one's creativity and talent will not be flourished in one's work field
and then will be affected by fatigue, depression and frustration and his/her work will be
inconclusive, and hereby the community will be affected. This article aims to consider this issue.
Keywords: job, job satisfaction, factors of job satisfaction, methods of assessment
INTRODUCTION
Definition of Job
Job literally means gets someone to work and
what is the cause of engagement. The
individuals will actively participate in the
production processes and services through
employment and then receive cash or material
rewards (1). Job and work is a physical or
intellectual activity which is directed on
production and services. Generally, job is an
activity which is asked for and hence is paid
by (2). In summary, it can be said that job is
the work a person is involved with and
through which perform his/her duties and gain
his livelihood. In another definition, job is a
group of similar positions in an institution,
office or workshop in which the quailed
people are able to take this opportunity and
carry out their duties (3).
Definition of Job Satisfaction
Job satisfaction is a set of feelings and beliefs
that people have about their current jobs (4).
Job satisfaction is one of the important factors
in job success, a factor that increases
efficiency and also feeling of personal
satisfaction (5). Job satisfaction means to be
interested in the situations and requirements of
a job, a situation in which a work is done and
the reward for which is received (6).
According to the above-mentioned contents, it
can be indicated that job satisfaction is
feelings of fulfillment and satisfaction one
have of him/herself and the pleasure is

Muhammad Farzanjou
CAREER, JOB SATISFACTION AND ITS EVALUATION METHODS
Int J Cur Res Rev, Sept 2012 / Vol 04 (17) ,
Page 76
therefore achieved and consequently will be
encouraged and attached to his/her job. Job
satisfaction is a desirable, emotional and
positive state that is resulted from job
assessment or job experiences. It is a concept
that has various dimensions, aspects and
factors which must be taken into consideration
as a whole. Of these factors are the
characteristics of employer and employee,
type of work, work environment and human
relations in working (7).
V. E. Fisher and J.V.Hanna maintain that jib
satisfaction is an internal factor and believes
that it is a type of emotional compatibility
with job and job conditions, that is if the
regarded job provides the satisfaction and
desirable pleasure, he/she will be happy with
his/her job, and conversely, if the regarded job
does not provide the satisfaction and desirable
pleasure, he/she will be disappointed and is
going to change it (8).
R. Hoppock maintains that job satisfaction is a
complex and multi-dimensional concept and is
associated with mental, physical and social
factors. Only one factor is not led to job
satisfaction, but a specific combination of a
set of various factors cause an employer is
satisfied with his/her job in a specific moment
of time, and tell him/herself that he/she is
satisfied with his/her job and enjoys it (9).
it is found out from the above0definitions
about job satisfaction that this concepts
accounts for the positive and feelings and
attitudes which one has towards his/her job.
When it is said that someone has high levels
of job satisfaction (10), it means he/she
generally likes his/her job and considers a
great value for it and takes it into account as a
positive issue, in short, he has a good and
desirable feeling towards it (11).
Factors of Choosing Job
Job is an issue that is not randomly chosen,
but it requires many factors, including:
Physical Condition
Each job requires a certain physical
characteristics. A great size and strength is
required in some jobs, while these features
may prevent doing some tasks in some jobs.
Also, having hand and foot health is necessary
in some jobs, while in others, lacking or
defecting limbs and other organs does not
create any problem.
Talent
One of the important factors in job selection
and continuing a successful employment is
talent. Talent means being equipped with,
readiness and ability to perform a certain job,
that is one's innate ability that helps him learn
and accelerates it. Hence, talent predict the
method and amounts of learning in various
fields in the future, and the one who is gifted
in a certain area will be more benefitted with
his/her experiences in that regard.
Interest
Interest means having desire, willingness and
desire to acquire something. Also, the pleasant
feeling, desire or curiosity towards something
or concept is called interest. Interest is an
important impetus for effort and human's
activity. Success in any job requires having
interest.
Personal and Social Facilities
In addition to the above-mentioned materials,
other factors such as personality, realism,
environmental facilities and community needs
has an important effect in choosing job (12).
In short, it can be said that personal factors
(such as physical status, talent, interest and
personality traits), social factors (such as
family pressure, social and cultural values, the

Muhammad Farzanjou
CAREER, JOB SATISFACTION AND ITS EVALUATION METHODS
Int J Cur Res Rev, Sept 2012 / Vol 04 (17) ,
Page 77
amount of facilities in a community and the
opportunities that are available to individuals),
economic factors (such as poverty and
unemployment) as well as inheritance and
gender are effective in job selection.
Factors of Job Satisfaction
Researchers have long been in search of
fundamental causes of job selection in offices
and organizations. They have been able to
achieve a string of constant factors associated
with job satisfaction; however, not a
comprehensive empirical model has yet been
achieved. Several factors can be briefly
pointed out that are more important in this
field. W. Porter and M. Steers pointed out to
four factors as follows:
Overall factors of organization: i.e.
variables those are widely applicable to
most employees, such as salary and
promotion opportunities.
The immediate causes of occupational
environment: variables representing
occupational groups, such as supervision
method and quality of relationship with
colleagues, working conditions and
workplace.
Content factors or actual occupational
activities, such as occupation territory (of
diversity, autonomy and responsibility)
and role clarity.
Individual factors: the characteristics that
make a person distinct from another as
well as age, duration of service and
character (self-confidence, determination
and maturity) (13).
E.A.Locke summarizes the most important
factors influencing job satisfaction as follows:
Mental precarious work that a person can
be successfully compatible with (success
in coping with the work).
Personal interest to the job itself in that
the more one is interested in a job, the
more would be his/her satisfaction.
A work that is not physically too boring,
that is the more is a person tired, the less
will be his/her satisfaction and the less
one is tired, the more will be his/her
satisfaction.
Reward for performance would be fair,
informative and consistent with one's
demand.
Working conditions that would be
consistent with physical needs and
contribute to career goals.
Feeling of self-esteem from the
employed, the more one feels respect
from others, the more will be his/her
satisfaction.
Factors in workplace that facilitate the
need for occupational values, such as
increased pay and promotion (14).
Results of having job satisfaction
Being aware of significant results of job
satisfaction is as important as being aware of
what leads to satisfaction. These results are
as follows:
Satisfaction and Service Renunciation
Job satisfaction and service renunciation is
related with each other. V.H.Vroom found
out that the correlation range between these
two variables in various studies is from 25%
to 42%.
Revisionists in recent decades, which studied
the relationship between job satisfaction and
job renunciation, reported that there is a

Muhammad Farzanjou
CAREER, JOB SATISFACTION AND ITS EVALUATION METHODS
Int J Cur Res Rev, Sept 2012 / Vol 04 (17) ,
Page 78
negative relationship between them, that is;
if employees are satisfied with their job, they
will not leave their job and vice versa, that is
if they are not satisfied with their job, they
will leave their job. A relatively similar
report was presented by Lock in 1976.
Job Satisfaction and absence in working
The evidence shows that there is a balanced
and an inverse relationship between job
satisfaction and absence of employees from
their workplace. Vroom showed in various
studies that the compatibility range is from
14% to 38%. This study was confirmed by
Porter and Stirz, etc.
Satisfaction and Performance
One of the most controversial issues in the
field of job satisfaction is its relationship
with performance. Three hypotheses have
been proposed in this regard.
1. Satisfaction is led to performance.
2. Performance is led to satisfaction.
3. Reward acts as an intermediate between
performance and satisfaction.
The first two hypotheses are weakly
supported, but the third one, based on which
reward acts as an intermediate between
performance and satisfaction, has been more
strongly supported. Prior performance is
resulted in receiving internal reward (feeling
of personal prosperity) and external reward
(wage and promotion). This reward, by itself,
enhances one's performance in the future and
also is effective in increasing one's job
satisfaction.
Vroom found out in his studies that there is a
positive relationship between job satisfaction
and amount of efficiency and performance.
Steers and Porter mentioned in their books
that the more an employee and worker's
occupational motivation and the more their
attitude towards their jobs (that is, to be more
satisfied with his/her job), the more will be
their performance and vice versa, that is, the
less is motivation and positive attitude
towards one's job (the less job satisfaction),
the less will be one's performance.
The Effect of Satisfaction on Organization
The analyses indicate that when employees of
an organization are satisfied with their jobs,
their organization are faced with positive
effects and acts as an effective and useful
organization.
In addition to above-mentioned issues, job
satisfaction has some other results. The
employees who are entirely satisfied are less
intended to submit complaint and are more
acquired with physical and mental health and
have a more longitude; they learn new duties
related to their job more swiftly and are
acquired with less occupational accidents (15).
Suggestions
According to the above contents, the
following works are suggested for increasing
job satisfaction in an organization:
Making employees interested in their job to
flourish creativity and innovation.
Preventing from depression and frustration
in employees.
Creating factors that increase efficiency
and satisfaction in organization.
Creating significant motivation and interest
for the effort and willingness of people to
successfully perform the job
Being respected from other people to
provide greater satisfaction.

Muhammad Farzanjou
CAREER, JOB SATISFACTION AND ITS EVALUATION METHODS
Int J Cur Res Rev, Sept 2012 / Vol 04 (17) ,
Page 79
CONCLUSION
By reflecting and hesitating on what was
mentioned and by considering the strategic
issues and the coherent guidance of
organization, which reminiscent of
undeniable and important role of managers
which is certainly highly effective in victory
or defeat of programs, creating " job
satisfaction" in a person depends on various
factors which together are achieved to
optimal result, and somehow lack of one
factor in a person is led to one's job
dissatisfaction; factors such as income level,
nature of work and its social status,
organizational prestige and authenticity of
job promotion, job security, lack of role
ambiguity, physical working condition,
structure and organizational culture and
relationship with colleagues, paying
attention to one's personality traits,
performance evaluation, fitness, flexibility
and innovation. Finally, it can be said that
job satisfaction is totally a positive and
pleasant feeling that one has about his/her
job. More generally, scientists maintain that
social factors, working environment and the
nature of working are effective in job
satisfaction. All theories of job satisfaction
somehow emphasize on meeting people's
needs, whether physical or mental and takes
the demands and expectations of employees
as an important thing.
REFERENCES
1. Abdollah Shafiabadi, "professional and
career counseling and guidance", Roshd
Publications, P. 3, Tehran, Iran, 1997.
2. Boures. A. Shertzer, "occupational life
planning and review", translated by
Zandipour, P. 207, Tehran, Iran, 1990.
3. Abdollah Shafiabadi," Professional ad
career guidance and counseling", Roshd
Publications, P. 40, Tehran, Iran, 1997.
4. George. M. Jennifer & Jones. R.
Gareth,”Organizational Behavior
Understanding and managing”, Addison
Wesley, P. 74, New York,U.S.A,1999.
5. Abdollah Shafiabadi,"Professional ad
career guidance and counseling", Roshd
Publications, P. 123, Tehran, Iran, 1997.
6. Boures. A. Shertzer, "occupational life
planning and review", translated by
Zandipour, P. 207, Tehran, Iran, 1990.
7. Hellriegel. Don, Woodman. W.
Richard,” Organizational Behavior”
,South - Western College Publishing An
International Thomson Publishing
Company,P. 53-55, 1996.
8. Gholam Abbas Tavasoli, "working and
occupation sociology", SAMT
Publications, PP. 166-170, Tehran, Iran,
1996.
9. Khadijeh Safiri, "sociology of women
employment", Tabyan Publications, P.
76, Tehran, Iran, 1998.
10. Abbas Mahmoudzade, Armen
Mehroujan, "organizational behavior of
contingency perspective", Allameh
Tabatabaie University Press, P. 274,
Tehran, Iran, 1996.
11. Abdollah Shafiabadi, "career and
academic guidance", publication center
and Payam Nour University Press,
Tehran, Iran, 1991.
12. Abbas Mahmoudzade, Armen
Mehroujan, "organizational behavior of
contingency perspective", Allameh
Tabatabaie University Press, P. 374,
Tehran, Iran, 1996.

Muhammad Farzanjou
CAREER, JOB SATISFACTION AND ITS EVALUATION METHODS
Int J Cur Res Rev, Sept 2012 / Vol 04 (17) ,
Page 80
13. Iraj Soltani, "Productivity of Human
Resources", Arkan Publications, Isfahan,
Iran, 2006.
14. Leap. L. Terry, Crion. D. Michael,
“Personal Human Resource
Management”, Macmillan Publishing, P.
366-367, New York, 1989.
15. Norollah Khalilzade, "Study of the
factors effective in job satisfaction and
dissatisfaction of students and teachers of
Payame Nour University of Oroumieh",
Faculty of Psychology and Educational
Sciences, Tehran University, PP. 21-25,
Tehran, Iran, 1997.

Niladri Sekhar Das DRUG RESISTANCE PROFILE OF NEW PTB PATIENTS WITH OR WITHOUT HIV INFECTION
Int J Cur Res Rev, Sept 2012 / Vol 04 (17) ,
Page 81
IJCRR
Vol 04 issue 17
Section: Healthcare
Category: Research
Received on: 20/06/12
Revised on: 23/07/12
Accepted on: 11/08/12
DRUG RESISTANCE PROFILE OF NEW PTB PATIENTS WITH
OR WITHOUT HIV INFECTION
Niladri Sekhar Das
College of Medicine and JNM Hospital, West Bengal University of Health
Sciences, Nadia, West Bengal, India
Email of corresponding author: [email protected]
ABSTRACT
Tuberculosis is the commonest opportunistic infection in persons infected with human
immunodeficiency virus (HIV). HIV is the most powerful risk factor for reactivation of latent
tuberculosis infection to active disease. Emergence of drug resistant isolates of M. tuberculosis
(Mtb) highlights the need for continuous monitoring of drug resistance to anti tuberculosis drugs.
The aim of our study was to see the anti tubercular drug resistance profile of M.tb in HIV
seropositive and seronegative patients.
Material and methods: We enrolled 100 new pulmonary tuberculosis (PTB) patients. This study
was carried out at Department of Microbiology MGIMS, Sevagram, Wardha Maharashtra from
2007-2009. For every patient staining and culture was done from sputum sample by conventional
method. After the identification of isolates as M.tb drug sensitivity testing was done. HIV
antibody status was identified in every patient by using rapid and ELISA test. Results were
analyzed using SPSS software.
Results: There were 8 patients who were HIV seropositive out of total 35 culture positive cases.
No resistant patterns were detetected in case of HIV +ve patients with TB infection. Out of 27
HIV seronegative cases with TB infection, 4 cases showed mono-resistant to streptomycin. No
multi drug resistant (MDR) strain was detected, neither in HIV positive nor in HIV negative
cases.
Conclusion: HIV infection may not be associated with drug resistant tuberculosis. However due
to high prevalence of HIV–TB infection in the country, monitoring of drug resistance in M.
tuberculoisis isolates needs prioritization to ensure success in national tuberculosis control
programme.
Key words: Human immunodeficiency virus (HIV), Pulmonary tuberculosis (PTB),
Mycobacterium tuberculosis (Mtb), Multi drug resistant (MDR)
INTRODUCTION
Tuberculosis (TB) is one of the most serious
diseases that physicians have recognized and
grappled with through the millennia due to its
high risk of person to person transmission,
morbidity, and mortality. Currently there are
9.2 million new cases of tuberculosis every
year with 1.7 million deaths occurring
worldwide1. Despite the discovery of the
tubercle bacillus more than a hundred years
ago, and all the advances in our knowledge of
the disease made since then, tuberculosis still

Niladri Sekhar Das DRUG RESISTANCE PROFILE OF NEW PTB PATIENTS WITH OR WITHOUT HIV INFECTION
Int J Cur Res Rev, Sept 2012 / Vol 04 (17) ,
Page 82
remains one of the major health problems
facing mankind, particularly in developing
countries. In India each year, 1.9 million new
cases of TB occur in the country, of which
about 0.8 million are infectious new smear
positive pulmonary TB cases2. The situation is
expected to worsen due to the emergence of
multi-drug resistant tuberculosis (MDRTB).
Development of drug resistance in M.
tuberculosis isolates may adversely impact the
management of the disease. Inadequate
therapies and indiscriminate use of antibiotics
causes such emergence of multi drug resistant
bacilli and HIV/AIDS pandemic resulting in
accumulation of pool of individuals who are
more susceptible to TB have worsened the
TB scenario. A High HIV seroprevalence
among newly diagnosed TB patients has been
reported in India.3, 4
.
On the global situation of drug resistance in
M.tb , first comprehensive study was
conducted by the Research and Surveillance
unit, Global TB Programme, WHO5 and was
observed that, the rates of acquired resistance
were invariably higher than primary resistance
for each drug and multi drug resistance was
more common when resistance was acquired
rather than when it was primary. The
increasing prevalence of multidrug resistance
in several parts of the world including India
has been one of the major reasons for
declaring tuberculosis control as a global
emergency by WHO6,7
.
Several outbreaks of MDR-TB showed the
importance of continuous monitoring of drug
resistance for treatment of TB patients and
initiating adequate public health measures.
The present study was undertaken with the
objective of comparing the anti TB drug
resistance profile of MTB isolates in new PTB
patients with or without HIV infection.
MATERIAL AND METHODS
Among 100 suspected tuberculosis patients
study was done at Microbiology Laboratory in
MGIMS, Sevagram between 2007 to 2009
with due permission from the institutional
ethical committee.
Sputum was collected from each individual,
smear was made and staining was done by
Ziehl–Neelson method. For isolation rest of
the sample was decontaminated by NALC-
NaOH method8 and inoculation was done on 2
LJ slopes. LJ bottles were observed weekly till
the colonies grew sufficiently for
identification whereas negative LJ culture was
noted if there was no growth after incubation
at 370c for 8 wks. Isolates were identified later
by conventional biochemical methods9
After the identification of the strain as MTB,
drug sensitivity testing was performed against
1st line drugs by LJ proportion method
described by Canetti et al 1969 10.
For Drug
sensitivity testing stock and working
concentration of drugs were made according
to Guidelines of TRC manual 200611
. The
concentration of drugs used were
Streptomycin 4 µg/ml, INH 0.2 µg/ml,
Rifampicin 40 µg/ml and Ethambutol 2 µg/ml.
Before drug sensitivity testing by LJ
proportion method, drug containing LJ slopes
was made.
At first preparation of standard suspension 11
and dilution was made. 0.1 ml of each of the
two bacterial dilutions, 10–3
mg/ml and 10–5
mg/ml were inoculated on two slopes of L J
medium without drug and one slope of
medium with drug. The standard strain of
M.tuberculosis, H37Rv was tested with each

Niladri Sekhar Das DRUG RESISTANCE PROFILE OF NEW PTB PATIENTS WITH OR WITHOUT HIV INFECTION
Int J Cur Res Rev, Sept 2012 / Vol 04 (17) ,
Page 83
batch of sensitivity testing. All the LJ slopes
for DST were placed in the incubator at 37 °C.
Reading and reporting of the LJ slopes were
done according to the reference10
Detection of
HIV status in every patient was done by rapid
method (TRIDOT) using serum which was
collected in a plain bulb. If any sample was
found to be positive by rapid method,
confirmation was done by ELISA
(Vironostika) confirmed by second ELISA at
NARI Pune.
RESULTS
We got 35 total MTB isolates no NTM (Non
tubercular mycobacterium) was isolated.
Among 35 MTB isolates 87.9 percent (29/33)
from smear positive and 9 percent (6/67) from
smear negative patients were obtained.
Of these 8 isolates were HIV seropositive and
27 HIV seronegative (Table no 1). Among the
35 total MTB isolates, monoresistant was
found with Streptomycin that was 11.4% only
in HIV seronegative patients (Table no 1).
Resistance to any 1st line drug was seen
(7/35), in 20% isolates. Drug resistance to at
least one drug was found in (7/27), 25.9%
isolates in HIV seronegative cases whereas no
resistant strain was isolated even for a single
drug in HIV+ve cases however in HIV
seropositive cases we got (8/8), 100% isolates
sensitive to all four drugs. The prevalence of
polyresistance (resistance to two or more
drugs, but not both isoniazid and refampicin)
was found to be (3/27), 11.11% only in HIV
seronegative with TB infective patients.
Neither individual drug resistance nor the
MDR or polyresistance was found to differ
significantly in the HIV infected and
uninfected TB patients.
DISCUSSION
Emergence and spread of drug resistance in
M.tuberculosis is a serious threat to
tuberculosis control programme because
patients with drug resistance bacilli respond
less readily to therapy than those with
sensitive bacilli, resulting in preferential
spread of the drug resistant bacilli in the
community.
Drug resistance develops either due to
infection with a resistant strain, or as a result
of inadequate treatment such as when a patient
is exposed to a single drug, or because of
selective drug intake, poor compliance, use of
inappropriate non-standardized treatment
regimens, irregular drug supply, poor drug
quality, or rarely erratic absorption of
medications 12
. Though the development of
drug resistance in India was noted since the
beginning of the chemotherapeutic era, it was
based on clinical perception and several
isolated reports, which failed to give an idea
of the national situation as a whole.
In this direction the first definite step was
taken in 1965-67, when the ICMR conducted
two surveys to estimate the prevalence of drug
resistance13
. In this study resistance to
Isoniazid ranged from 11-20 per cent, to
Streptomycin 8-20 per cent and to both drugs
4-11 per cent. The second study showed
resistance to Isoniazid from 15-69 per cent, to
Streptomycin 12-63 per cent and to both drugs
from 5-58 per cent. However these studies
were carried out in the pre-Rifampicin era.
Subsequently after about two decades
(1980’s), 11 other studies from different parts
of the country reported similar resistance to
Isoniazid and Streptomycin like those in the
earlier studies with the notable exception of
Rifampicin resistance being observed in 10 of

Niladri Sekhar Das DRUG RESISTANCE PROFILE OF NEW PTB PATIENTS WITH OR WITHOUT HIV INFECTION
Int J Cur Res Rev, Sept 2012 / Vol 04 (17) ,
Page 84
the 11 publications and the level of MDRTB
in all the centers was observed but it was less
than 5 per cent. According to third Global
Report total prevalence of drug resistance
among new cases in India (Wardha) was
19.8% and MDR was 0.5 %. Several small
surveys conducted across the country have
shown the prevalence rates of MDR-TB in the
country at around 3% among new cases, and
12% among retreatment cases. A large scale
population based survey in the states of
Gujarat and Maharashtra has also indicated
similar resistance levels (new- 3% and
retreatment- 12-17%) 13.
We found that
prevalence of resistance to isoniazid and
streptomycin was 0 and 11.4 percent and that
to both drugs were 2.8%. The issue of whether
infection with HIV is a risk factor for drug
resistant tuberculosis still remains unanswered
since results of some studies supported this
hypothesis while some did not. A study
conducted in newyork city 14
revealed that
HIV infected TB patients were significantly
more likely to develop resistance to at least
one drug and MDR than those without HIV
infection.
No significant difference was found in drug
resistance between HIV seropositive and HIV
seronegative tuberculosis patients in our
study, which is in accordance with the
findings from other studies in Europe 15, 16
.
In conclusion, we didn’t find any kind of drug
resistance in anti-tubercular drug especially in
case of HIV seropositive cases. In view of the
conflicting results from other studies and high
prevalence of HIV-TB in our country, we feel
that time to time monitoring of anti-
tuberculosis drug resistance pattern in TB
patients in general and HIV seropositive
tuberculosis patients in particular would
provide important data, which may be crucial
for the control of tuberculosis.
ACKNOWLEDGEMENTS
I want to acknowledge the persons who helped
me during the research work.
1. Dr. D.C Thamke, Professor, Department of
microbiology, MGIMS sevagram.
2. Mr Padmakar Dhone, Senior Lab
technician, Department of microbiology,
MGIMS sevagram
I also want to acknowledge the immense help
received from the scholars whose articles are
cited and included in references of this
manuscript and also grateful to
authors/editors/publishers of all those articles,
journals and books from where the literature
for this article has been reviewed and
discussed. We did this research work from the
departmental funding.
REFERENCES
1. Global tuberculosis control: surveillance,
planning, financing: WHO report 2008.
Geneva: World Health Organization
(WHO/HTM/TB/2008.393).
2. TB India 2008. RNTCP Status Report.
3. Paranjape R S ,Tripathy SP, Menon PA,
Mehendale SM, khatavkar P, Joshi DR.et al.
Increasing trend of HIV seroprevalence among
pulmonary tuberculosis patients in Pune, India
.indian J Med res 1997;106: 207-11
4. Tripathy S, Joshi DR, Mehendale SM , Menon
P, Joshi AN, Ghorpade SV, et al.Sentinel
surveillance for HIV infection tuberculosis
patients in India. Indian J tuberc 2002; 49: 17-
20.
5. Cohn DL, Bustreo F, Raviglione MC. (1997).
Drug resistant tuberculosis: review of the
worldwide situation and the WHO/IUATLD
global surveillance project. Clin Infect Dis
1997; 24(1): 121-130.

Niladri Sekhar Das DRUG RESISTANCE PROFILE OF NEW PTB PATIENTS WITH OR WITHOUT HIV INFECTION
Int J Cur Res Rev, Sept 2012 / Vol 04 (17) ,
Page 85
6. Anti tuberculosis drug resistance in the world.
The WHO/ WATLD global project on anti
tuberculosis surveillance
.Geneva,Switzerland;1997.WHO/TB/97.229.
7. Anti tuberculosis drug resistance in the world
,report No.2.WHO/CDS/TB/2000.278
8. Procedure for isolation and identification of
mycobacterium CDC manual1975.
9. Laboratory services in tuberculosis control
.Part 3-Culture /WHO/98.258,1998.
10. Canetti, G., Fox, W., Khomenko, A., Mahler,
H.T., Menon, N.K., Mitchison, D.A., et al.
Advances in techniques of testing
mycobacterial drug sensitivity, and the use of
sensitivity tests in tuberculosis control
programmes. Bulletin of the World Health
Organisation, 1969. 41, 21-43.
11. Bacteriological methods and Laboratory
diagnosis of Tuberculosis TRC Chennai
2006.
12. Behera D. Drug Resistant Tuberculosis In India
– Is it a matter of concern? Ind J Tuberc 2007;
54:105-109.
13. Multi-drug resistant and Extensively drug
resistant TB in India, Consensus statement on
the problem, prevention, management and
control, From the consultative meeting of
national experts organized by the TB
Research Centre, ICMR, Govt. of India, on
14-15 September 2007.
14. Gordin FM, Nelson ET,Matts JP, Cohn DL,
Ernst J,Benator D,et al. The impact of human
immunodeficiency virus infection on drug
resistant tuberculosis. Am J.Respir Crit care
Med 1996; 154: 1478-83.
15. Migliori GB, Centis R, Fattorini L, Besozzi
G, Saltini C, Scarparo C, et al.
Mycobacterium tuberculosis complex drug
resistance in Italy. Emerg Infect Dis
2004;10:752-3
16. Shafer RW, Chirgwin KD, Glat AE, Dahdouh
MA, Landesman SH, Suster B. HIV
prevalence , immunosuppression , and drug
resistance in patients with tuberculosis in an
area endemic for AIDS.AIDS 1991;5:399-
405.
Table No 1.Drug resistance pattern of M.
tuberculosis isolates to primary anti-
tuberculosis drugs
Total
(n=35)
HIV+ve
(n=8)
HIV-ve (n=27)
Any resistance
H 1(2.8%) 0 1(3.7%)
S 7(20%) 0 7(25%)
E 3(8.5%) 0 3(11.11%)
R 0 0 0
Mono resistance
H 0 0 0
S 4(11.4
%)
0 4(14.9%)
E 0 0 0
R 0 0 0
Multidrug resistance
HR
±S±
E
0 0 0
H= INH, S=Streptomycin, E= Ethambutol,
R=Rifampicin.

Nithish.U.S et al. BACTERIOLOGICAL APPLICATIONS OF QUANTUM DOTS
Int J Cur Res Rev, Sept 2012 / Vol 04 (17) ,
Page 86
IJCRR
Vol 04 issue 17
Section: Technology
Category: Research
Received on: 03/06/12
Revised on: 23/07/12
Accepted on: 12/08/12
BACTERIOLOGICAL APPLICATIONS OF QUANTUM DOTS
Nithish.U.S, Sarah Sunitha
Department of Biotechnology, PES Institute of Technology, Bangalore,
India
Email of corresponding author: [email protected]
ABSTRACT
Quantum Dots are nanocrystals which are fluorescent in nature and their unique optical
properties depend on their size. Quantum Dots have replaced conventional fluorophores which
have disadvantages like photobleaching, narrow absorption spectra, stability and short period of
fluorescence. Due to the possibility of conjugating the Quantum Dots to various types of bio
molecules like streptavidin, antibodies, mannose etc there have been numerous applications in
the detection, enumeration and differentiation of various bacteria. Quantum Dots can be applied
to various matrices like food, water, tissue and blood samples. Quantum Dots have been used to
detect pathogenic bacteria like E.coli, Staphylococcus aureus, Salmonella typhimurium, Bacillus
anthracis, Listeria monocytogenes and Mycobacterium tuberculosis. Quantum dots can detect
bacteria at the levels of 103- 10 CFU/ml in contaminated water samples. The minimum time for
detection of bacteria using Quantum Dots ranges from 15 minutes to 2 hours. The major
hindrance in using the Quantum Dots is its cost of production. This review summarises the
properties, synthesis and applications of Quantum dots in the detection of bacteria which can
have major implications in food and water safety evaluation, diagnosis of bacterial diseases and
environmental enumeration of bacteria.
Keywords: Quantum Dots, Optical properties, Detection, Enumeration
INTRODUCTION
Quantum Dots (QD) are highly crystalline
semiconductor nanocrystals. These are
crystals whose dimension is less than that of
the Exiton Bohr radius [1]. Due to their
nanoscale size; they have discrete electronic
energy state giving rise to unique optical and
electronic properties. They also possess the
property of size dependent photo-emission
which is due to the phenomenon of Quantum
Confinement [2]. Their stability against
photobleaching has attracted many researchers
to develop bio-imaging and Quantum
computing techniques. Due to their unique
properties they have wide range of
applications in electronics, computing and
biology. QDs are made up of elements like
Cadmium, Selenium, Indium, Tellurium,
Phosphorous, Sulphur etc. These elements
make up the core of a Quantum dot, which are
then coated with a shell made of material of
higher band energy. The outer shell also forms
a protective layer on the Quantum dots. To
make QDs biologically compatible one or
more layer of organic polymers are added and
are conjugated with organic ligands. The

Nithish.U.S et al. BACTERIOLOGICAL APPLICATIONS OF QUANTUM DOTS
Int J Cur Res Rev, Sept 2012 / Vol 04 (17) ,
Page 87
diameter of QDs varies from 1-20nm which
consists of 100-100,000 atoms [2]. Due to
their distinctive properties, QDs have
improved the sensitivity of cellular analysis
and molecular detection by few folds.
The Quantum Dots were first studied by A.I.
Ekimov and A.A. Onushchenko [3]. The size
of microscopic CuCl crystals grown in
transparent dielectric matrix varied from tens
to hundreds of angstroms. Later high quality
CdSe, CdS and CdTe semiconductor
nanocrystals were synthesized based on
pyrolysis of organometallic reagents [4]. The
particles sizes were as small as 20 angstroms
in diameter. Syntheisis of water soluble
Quantum dots paved way for their conjugation
to bio molecules and thereby opened up
different applications in biology [5, 6].
In Quantum Dots, the energy levels of the
valence electrons are discrete and have large
differences. Thus they show the characteristics
of an atom and hence they are also called
artificial atoms [8]. The reduction in the size
of the crystal brings the valence electrons
closer thereby increasing their overall energy.
This leads to splitting up of different electron
levels giving it a discrete electron energy level
system and also increasing their band gaps.
This results in merging of valence band and
conduction band making it a very good
conductor of electricity. The splitting of
energy level leads to excitement of the
electron by absorption of energy and transition
to higher energy levels. But these electrons
return to their ground state by emitting a
photon of energy either equal or lesser than
that of the absorbed energy. The emitted
photon has lesser energy when the electron
rests in a metastable level for a brief period of
time. This gives QDs their fluorescent
property making them applicable in imaging
and detection of molecules or cells. Thus, as
the size reduces, the gap between energy
levels broadens up and the electron has to
return from a much higher level which
increases the emitted photon energy.
Therefore as the size reduces, the emitted
photon shifts from the red region of visible
light spectra to the blue region. This gives rise
to the unique fluorescent emission of the
Quantum Dots.
PROPERTIES
The exceptional properties of the Quantum
Dots like photo stability, broad range of
absorption spectra, ease in change of emission
spectra, sensitivity, brightness and ability of
coupling with biological molecules, make
them very useful in the field of biological
imaging of different types of cells. Quantum
Dots emitting different colours can be excited
by monochromatic light. The time taken to
fluoresce upon excitation is very less
compared to conventional fluorophores and
this property lasts longer for a given Quantum
Dot. The Quantum Dots are very stable and
resistant to photobleaching and overcome the
disadvantages exhibited by fluorophores,
which are important for imaging applications.
SYNTHESIS
QDs can be synthesized by colloidal synthesis,
E-field method or by fabrication through
etching or self-assembly.
Colloidal chemistry method
This method is also called Hot-Injection
method [2].Here Quantum Dots are prepared
as a batch by quickly adding appropriate
amount of precursors into hot solvent and

Nithish.U.S et al. BACTERIOLOGICAL APPLICATIONS OF QUANTUM DOTS
Int J Cur Res Rev, Sept 2012 / Vol 04 (17) ,
Page 88
organic ligand system. First the precursors are
decomposed to monomers by chemical or
physical means like temperature. This results
in nucleation process where the monomers
starts binding to each other. This reaction is
fast in the beginning and slows down in the
end due to change in concentration.
E-field technique
In this method, Quantum Dots are synthesised
between the interfaces of heterojunction of
monomers [8]. On applying an electric field
on the interface, 2D Electron Gas [2DEG] is
created. Later these charges are confined to
the interface by external devices. Thus the
voltage and the 2DEG permit rearrangement
of atoms, finally giving a Quantum Dot at the
interface.
Fabrication
Etching or Lithographic method
In this method, first a Quantum Well or
Double Barrier Heterostructure [DBH] are
grown by the Epitaxial Method. Then pillars
are etched out of it and they are further etched
to give nanocrystals like Quantum Dots [8].
These pillars have the dimension of a
Quantum Wire, which is then metalized on
each terminal. Application of electric current
on the terminals of Quantum Wire leads to the
breakdown of the Quantum Wire and
formation of Quantum Dots.
Self-assembly growth technique
Here Quantum Dots are formed as an out
growth in the Epitaxial technique [8]. The
effect is similar to the condensation of water
droplets on cold surface. Generally, the
epitaxial growth proceeds by forming a layer
of atoms at once. But lattice mismatch and
difference in surface energy between the
atoms induces the formation of islands, thus
Quantum Dots are formed.
It is seen that bare Quantum Dots are
unsuitable for biological application. This is
because; they are insoluble in water and toxic
due to their heavy metal composition, small
size and active surface [9]. To overcome these
problems, the surface of Quantum Dots is
treated with stabilizing and coating
substances. Most of the coating substances are
organic polymers [10] which are amphiphilic
in nature, also making them water soluble and
easy to apply for biological analysis by
conjugating with proteins, antibodies and
other molecules. Additionally, it is observed
that coating provides better photo stability
[11]. It is also seen that some bio molecules
like proteins can be effective nucleating and
stabilizing agents for Quantum Dots [12].
APPLICATIONS OF QUANTUM DOTS
IN BACTERIOLOGY
The superior optical properties of Quantum
Dots entail them for numerous applications in
labelling of cells. They are highly suitable for
labelling, as the intense emission of light helps
in detection of even a small number of the
cells. They find applications in enumeration of
bacterial cells in various matrices, detection of
pathogens, food contaminants, and in the
study of micro flora in bio films.
Enumeration
Here the number of bacterial cells can be
enumerated by relating the intensity of light
emitted by the Quantum Dots to the cell count.
For example, Alteromonas species inhabiting
the surface of small marine animals like

Nithish.U.S et al. BACTERIOLOGICAL APPLICATIONS OF QUANTUM DOTS
Int J Cur Res Rev, Sept 2012 / Vol 04 (17) ,
Page 89
Copepods were enumerated using QDs [13].
The CdSe Quantum Dots were conjugated
with streptavidin so that QD can specifically
bind to the anti-antibody against Alteromonas
species. It is also possible to detect wide range
of bacteria from a sample such as sewage
water using water soluble Quantum Dots [14].
Quantum Dots can also be used to detect a
particular strain of a bacterial species as
supported from the result of an experiment
where mannose conjugated CdS Quantum
Dots could detect a strain Escherichia coli
producing FimHlectin which binds
specifically to mannose [15]. In a study on
fluorescence detection of count of Escherichia
coli and Staphylococcus aureus using
Quantum Dots, spectrofluorometer was used
for roughly counting the cells [16]. The low
detection limit for this method was in order of
102CFU/ml. In a different study the same
detection limit was obtained when the
Quantum Dots were labelled to bacteria
covalently using glutaraldehyde [17]. It was
also seen that there was a linear relationship
between fluorescence intensity and total
bacterial count. By using Quantum Dots it is
possible to distinguish between wild type and
auxotrophic strain of a bacteria belonging to
same species. This technique involves
conjugating Quantum Dots with the
biomolecule needed for bacterial growth but
which cannot be synthesized by the bacteria.
This method is applied for detection of purine
auxotrophs of Bacillus subtilis and
Escherichia coli where Quantum Dots
conjugated with AMP were taken up
preferentially by purine-auxotrophs rather
than the wild type [18]. The Quantum Dots
can also be coupled to the antibodies used in
ELISA which can give us an intense signal
even in a minute concentration of antigen.
This method was applied for detection of
Escherichia coli in water samples where the
target bacteria were separated by antibody
coated magnetic beads and then detected by
ELISA using Quantum Dots conjugated to
secondary antibodies [19]. Thus Quantum Dot
based enumeration of bacteria can be rapid
and sensitive compared to the conventional
methods.
Detection of pathogens
Quantum Dots have better optical properties
than other dyes or fluorophores; it is widely
applicable in detecting pathogens from various
clinical samples and to detect a particular
pathogen from a cluster of bacteria. There are
number of studies where Escherichia coli and
Salmonella typhimurium were detected
simultaneously using antibodies against these
two species and conjugating different
antibodies with Quantum Dots emitting light
of different wavelength [20]. Multiplexed
detection was also applied for Escherichia coli
and Salmonella enteritidis [21]. Denatured
Bovine serum albumin stabilized Quantum
Dots were conjugated to secondary antibodies
for detection of Escherichia coli and Listeria
monocytogenes [22]. This type of conjugation
to the secondary antibodies gives us an
advantage of universal usage of the antibody
for the detection, ease in their production and
circumventing the tedious process of labelling
individual primary antibodies. The
interactions between antibody and antigen are
weak and these are further weakened by
conjugation of bulk substance like Quantum
Dot. This reduces the staining property of
Quantum Dots conjugated to antibodies,
hence, it is preferred to conjugate small

Nithish.U.S et al. BACTERIOLOGICAL APPLICATIONS OF QUANTUM DOTS
Int J Cur Res Rev, Sept 2012 / Vol 04 (17) ,
Page 90
molecules like biotin to antibody and then
bind them to Quantum Dots conjugated to
streptavidin. The above method was also
adopted for detection of E.coli [23] and
Listeria monocytogenes where the limit of
detection was found to be 2-3 CFU/ml with a
detection time of 1.5 hrs. [24]. In another
study Mycobacterium bovis BCG and
Mycobacterium tuberculosis was detected
using genus specific antibody and biotinylated
anti-antibody which would bind to
streptavidin coated Quantum Dots [25]. The
result gave a limit of detection of 103 bacteria
/ ml. This method was also applied for
detection of Escherichia coliO157:H7 strain
with a limit of detection of 103 CFU/ml with a
detection time less than 2hrs [26]. In one of
the studies Escherichia coli was imaged using
organic acid stabilized Quantum Dots [27].
Here the Quantum Dots were internalized by
the bacteria giving rise to fluorescence signal.
It was found that none of the other bacteria
interfered with the test. Quantum Dot labelling
of the cells also aids Flow cytometric
separation and analysis of pathogenic bacteria
from other non-pathogenic ones. This method
is a fast and effective technique for separation.
In a study pathogenic Escherichia coli strain
O157:H7 were separated from non-pathogenic
bacteria using Quantum Dots and Flow
cytometer [28]. The limit of detection was 1%
of the pathogenic strain in the mixture of cells.
It is also possible for detection of strain and
metabolism specific bacteria using Quantum
Dots conjugated to a biomolecule which might
bind to the receptor on the particular strain or
may be used as a substrate for a metabolic
pathway [29].
In another study different antibodies are
conjugated to Quantum Dots of different
emission peaks for multiplexed analysis of
Bacillus anthracis spores and Yersinia pestis
by Flow cytometry [30]. It also possible to
detect one spores of Bacillus anthracis from
other similar bacterial spores by conjugating
Quantum Dots by BABA peptides [31] or a
short peptide chain from gamma-phage lysine
protein [32]. This analysis can be performed
using methods like Flowcytometry, Confocal
laser scanning microscopy and
Spectrofluorometer with single cell resolution.
An innovative yet specific method of labelling
bacteria is using phage conjugated with
Quantum Dots. This method can be used for
recognising both slow growing and highly
infectious bacteria. This method was studied
for detection of Escherichia coli using
biotinylated phage and streptavidin coated
Quantum Dots [33]. Quantum Dots coated
with zinc [II]-dipicolylamine could detect only
mutant and pathogenic Escherichia coli that
lacks O-antigen and could also facilitate in
vivo optical imaging of the infection in the
animal [34]. It is also possible to identify the
bacterial species by detecting the species
specific DNA sequence. In this method of
detection the Quantum Dots are made to bind
to a probe which is complementary to the
species specific DNA sequence. In a study this
method was used for detection of
Mycobacterium tuberculosis and
Mycobacterium avium subsp paratuberculosis
where the biotinylated probe hybridized with
the DNA was detected by streptavidin coated
Quantum Dots [35]. This method was 70 to
90% accurate compared to real time PCR and
had a limit of detection of 12.5 ng of DNA in
20µl. This technique can be implied in
diagnostic assay for rapid, specific and
sensitive method of pathogen detection. In

Nithish.U.S et al. BACTERIOLOGICAL APPLICATIONS OF QUANTUM DOTS
Int J Cur Res Rev, Sept 2012 / Vol 04 (17) ,
Page 91
another study Quantum Dots based molecular
beacons were used to detect the antibiotic
resistant β-lactamase genes in pUC18 of
Escherichia coli [36]. The mechanism of
detection used in the study was a single step
FISH, which gave an excellent signal on genes
in the plasmid. There was an attempt to use
ferrichrome conjugated to Quantum Dots for
detection of bacteria with receptors for ferrous
ions [37]. This method was successful in
detecting Pseudomonas fluorescens having
ferrous receptors.
Detection of bacterial food contaminants
Many bacterial infections are spread by
contaminated food. Thus, detection of
bacterial contaminants in food is important to
monitor outbreaks of food borne infections.
Three food-borne pathogens namely
Salmonella typhimurium, Shigella flexneri and
Escherichia coli were detected by antibodies
against each bacteria which was conjugated to
Quantum Dots of different emission
wavelength [38]. The same method of
antibody conjugated Quantum Dots were
developed for specific detection of
Staphylococcus aureus in food and
environment [39]. The bacteria were detected
under a fluorescent microscope and limit of
detection was found to be 900 CFU/ml. Most
of the contaminants are found in meats, thus
Quantum Dots can be used to analyse
contaminant in meat sample. In a recent study,
Quantum Dots were used to detect pathogens
like Escherichia coli and Salmonella in
ground beef by conjugating Quantum Dots to
specific antibodies against the pathogens [40].
In a study chicken carcass wash water was
used as a sample for detecting Salmonella
typhimurium contaminant in chicken meat
[41]. Here contaminant was separated from
sample with antibody conjugated magnetic
beads and then reacted to biotin tagged
secondary antibody which binds to
streptavidin coated Quantum Dots. In this
method the limit of detection was in order of
103 CFU/ml. Also there has been a report of
use of indirect immunofluorescence coupled
to Quantum Dots for labelling and detection
specific bacterial serotype of pathogen Vibrio
parahaemolyticus attached to small marine
animals which are pathogen carriers [42]. This
method can also be extended for detection of
other Vibrio species like Vibrio cholerae.
With the use of Quantum Dots in biosensors
and microarrays, the size of the instrument
have been reduced and also permitted for
automation thus increasing rapidity and
sensitivity of the test. These techniques have
been used in assaying Salmonellae [43].
Nowadays array systems have been developed
for rapid and sensitive detection of bacteria as
indicated by a study where Escherichia coli
O157:H7 was detected using Quantum Dots
conjugated to antibody and the concept of
sandwich ELISA [44]. The above method
gave a limit of detection of below 10 CFU/ml.
Escherichia coli was also detected using
Pathogen Type of QD Reference
Escherichia coli Primary Antibody-QD, Secondary Antibody-QD, Streptavidin-
QD
21, 23, 24, 28
Salmonella typhimurium,
Salmonella enteritidis
Primary Antibody-QD, 21, 22
Listeria monocytogenes Secondary Antibody-QD, Streptavidin-QD 23, 25
Mycobacterium tuberculosis Streptavidin-QD 26,35
Bacillus anthracis Primary Antibody-QD, Peptide-QD 30,31
Yersinia pestis Primary Antibody-QD 30
Table 1: List of some important pathogenic bacteria detected using Quantum Dots

Nithish.U.S et al. BACTERIOLOGICAL APPLICATIONS OF QUANTUM DOTS
Int J Cur Res Rev, Sept 2012 / Vol 04 (17) ,
Page 92
colistin-functionalised Quantum Dots which
gave a limit of detecting as low as 28cells/ml
[45] with a short analysis time of 15 min.
excluding preparation and photoactivation
time.
Detection of bacteria in Oral bio films
It is observed that many bacteria exhibit a
symbiotic relationship between each other.
These bacteria form biofilm which is a
complex cluster of bacteria. These biofilms
are found widely in our environment and also
in our body like mouth etc. It is desirable to
study symbiosis for evolutionary studies.
Quantum Dots can be used for specific
detection of bacteria in oral biofilms. This
method has been used in a study where
specific human oral bacteria namely
Streptococcus gordonii DL1, Streptococcus
mutans UA159 and Veillonella spp. strain R1
were detected in a biofilm in vivo and in vitro
[46]. Here immunofluorescence method of
imaging was used, and this method does not
depend on detection of bacteria based on their
morphology, which makes this rapid
technique amenable to automation, enabling
the detection from numerous samples. These
studies also give an insight on the spatial
relationship between bacteria and interspecies
interaction in biofilm. Presence of specific
gene in the biofilm can give a large insight on
the species of the bacteria and also function of
that gene in the biofilm. In a report Bacillus
spoOA gene was analysed in a biofilm using
DNA-Quantum Dots system [47]. The
hybridization of target DNA to the probe was
detected using flowcytometer and had a limit
of detection of 0.02 nM. It has been observed
that biofilms made of Streptococcus sp. and
Veillonella sp. are formed in early stage of the
plaque. These results were confirmed by using
Quantum Dot based immunofluorescence on
the enamel surface [48].
TOXICITY OF QUANTUM DOTS TO
BACTERIA
We have seen the brighter side of the
Quantum Dots but it has been demonstrated
that these nanoparticles are toxic to living
cells including bacteria. Formation of reactive
oxygen species by the interaction of Quantum
Dots with other bio molecules or release of the
heavy metal ions which constitute the
Quantum Dots have been the mechanism of
inducing toxicity to the cells. The toxicity of
Quantum Dots on four different strains of
bacteria namely Pseudomonas aeruginosa,
Staphylococcus aureus, Bacillus subtilis and
Escherichia coli were studied [49]. The result
indicated that Gram-positive strains were
more resistant to the toxicity than the Gram-
negative bacteria. This might be due to large
amount of peptidoglycan on cell wall of
Gram-positive bacteria. The study also
indicated that Gram-positive bacteria
previously exposed to Quantum Dot showed
lack of reproducibility.
CONCLUSION
Today, the major hindrance for using
Quantum Dots in bacteriological applications
is its toxicity. It is suggested that by
eliminating the heavy elements from Quantum
Dots, the toxicity can be reduced. Thus new
Heavy Metal-free Quantum Dots like carbon
quantum Dots are being produced [50]. But
their effective usage is still under research.
The cost of production of Quantum Dots is
also topic of concern when they have to be
mass produced and used as diagnosis &

Nithish.U.S et al. BACTERIOLOGICAL APPLICATIONS OF QUANTUM DOTS
Int J Cur Res Rev, Sept 2012 / Vol 04 (17) ,
Page 93
analysing tools. Many methods for
synthesizing biocompatible Quantum Dots
using bacterial cells like Escherichia coli have
been proposed [51]. The efficacy of these
Quantum Dots in various applications will
have to be proved. In conclusion, it can be
said that Quantum Dot based techniques are
rapid, sensitive and reliable tools for the
enumeration, detection and differentiation of
Bacteria.
REFERENCES
1. Poole CP, Owens FJ (2009) Introduction
to nanotechnology. John Wiley & Sons
INC, Delhi.
2. Guan J (2008) Synthesis and Structural
Characterization of ZnTe/ZnSeCore/Shell
Tunable Quantum Dots. Dissertation,
Massachusetts Institute of Technology.
3. Ekimov AI, Onushchenko AA (1982)
Quantum size effect in three-dimensional
microscopic semiconductor crystals.
Journal of Experimental and Theoritical
Physics 34: 345-349.
4. Murray CB, Norris DJ, Bawendi MG
(1993) Synthesis and Characterization of
Nearly MonodisperseCdE [E=S,Se,Te]
Semiconductors Nanocrystallites. Journal
of the American Chemical Society115:
8706- 8715.
5. Bruchez M. Jr., Moronne M, Gin P,
Weiss S, Alivisatos A.P (1998)
Semiconductor nanocrystals as
fluorescent biological labels. Science281:
2013-2016.
6. Chan WCW, Nie S (1998) Quantum dot
bioconjugates for ultrasensitive
nonisotopic detection. Science 281: 2016-
2018.
7. Rizvi SB, Ghaderi S, Keshtgar Mo,
Seifalian AM (2010) Semiconductor
quantum dots as fluorescent probes for in
vitro and in vivo bio-molecular and
cellular imaging. Nano Reviews. DOI:
10.3402/nano.v1i0.5161
8. Boxberg F and Tulkki J (2004) Quantum
Dots: Phenomenology, Photonic and
Electronic Properties, Modeling and
Technology. In: Akhlesh L [ed]
Handbook of nanotechnology: Nanometer
Structures Theory, Modeling, and
Simulation. SPIE Press, Bellingham, pp
107-137.
9. Su Y, Hu Mi, Fan C, He Y, Li Q, Li W, et
al. (2010) The cytotoxicity of CdTe
quantum dots and the relative
contributions from released cadmium ions
and nanoparticle properties.
Biomaterials31: 4829-4834.
10. Wang Y, Chen L (2011)Nanomedicine
Quantum dots, lighting up the research
and development of nanomedicine.
Nanotechnology, Biology, and Medicine
7: 385– 402.
11. Hanaki KI, Momo A, Oku T, Komoto A,
Maenosono S, Yamaguchi Y et al. (2003)
Semiconductor quantum dot/albumin
complex is a long-lifeand highly
photostable endosome marker.
Biochemical Biophysical Research
Communication. 302: 496-501.
12. Mansur HS, Gonzàlez JC, Mansur AAP
(2011) Biomolecule-quantum dot systems
for bioconjugation applications. Colloids
and Surfaces B: Biointerfaces84: 360-
368.
13. Beckman EM, Kawaguchi T, Chandler
GT, Decho AW (2008) Development of
amicroplate-based flourescence

Nithish.U.S et al. BACTERIOLOGICAL APPLICATIONS OF QUANTUM DOTS
Int J Cur Res Rev, Sept 2012 / Vol 04 (17) ,
Page 94
immunoassays using quantum dot
streptavidin conjugates for enumeration
of putative marine bacteria, Alteromonas
sp., associated with a benthic harpacticoid
copepod. Journal of Microbiological
Methods75: 441–444.
14. Mandal TK, Parvin N (2011) Rapid
detection of bacteria by carbon quantum
dots. Journal of Biomedical
Nanotechnology 7: 846-848.
15. Mukhopadhyay B, Martins MB,
Karamanska R, Russell DA, Field RA
(2009) Bacterial detection using
carbohydrate-functionalised CdS
quantum dots: a model a study exploiting
E.coli recognition of mannosides.
Tetrahedron Letters50: 886-889.
16. Xue X, Pan J, Xie H, Wang J, Zhang S
(2009) Fluorescence detection of total
count of Escherichia coli and
Staphylococcus aureus on water-soluble
CdSe quantum dots coupled with
bacteria. Talanta77: 1808-1813.
17. Fu X, Huang K, Liu S (2010) A rapid and
universal bacteria-counting approach
using CdSe/ZnS/SiO2 composite
nanoparticles as fluorescence
probe.Analytical and Bioanalytical
Chemistry395: 1397-1404.
18. Kloepfer JA, Mielke RE, Nadeau JL
(2005) Uptake of CdSe and CdSe/ZnS
Quantum Dots into bacteria via Purine-
Dependent Mechanisms. Applied and
Environmental Microbiology71: 2548-
2557.
19. Dudak FC, BoyacİH (2008)Enumeration
of Immunomagnetically Captured
Escherichia Coli in Water Samples Using
Quantum Dot-Labeled Antibodies.
Journal of Rapid Methods & Automation
in Microbiology16: 122-131.
20. Yang L, Li Y (2006) Simultaneous
detection of Escherichia coli o157:H7
and Salmonella typhimurium using
quantum dots as fluorescence
labels.Analyst 131: 394- 401.
21. Dudak FC, Boyaci IH (2009) Multiplex
Detection of Escherichia coli And
Salmonella enteritidis By Using Quantum
Dot-Labeled Antibodies. Journal of Rapid
Methods and Automation in
Microbiology 17: 315-327.
22. Kuo YC, Wang Q, Ruengruglikit C, Yu
H, Huang Q (2008) Antibody-Conjugated
CdTe Quantum Dots for Escherichia coli
Detection. The Journal of Physical
Chemistry 112: 4818- 4824.
23. Hahn MA, Tabb JS, Krauss TD (2005)
Detection of Single Bacterial Pathogens
with Semiconductor Quantum
Dots.Analytical Chemistry77: 4861-
4869.
24. Wang H, Li Y, Slavik M (2007) Rapid
detection of Listeria monocytogenesusing
quantum dots and nanobeads-based
optical biosensors 15: 67-76.
25. Liandris E, Gazouli M, Andreadou M,
Sechi LA, Rosu V, Ikonomopoulos J
(2011) Detection of Pathogenic
Mycobacteria Based on Functionalized
Quantum Dots Coupled with
Immunomagnetic Separation. PloS ONE
6: e20026.
26. Su XL, Li Y (2004) Quantum Dot
Biolabeling Coupled with
Immunomagnetic Separation for
Detection of Escherichia coli O157:H7.
Analytical Chemistry 76: 4806- 4810.

Nithish.U.S et al. BACTERIOLOGICAL APPLICATIONS OF QUANTUM DOTS
Int J Cur Res Rev, Sept 2012 / Vol 04 (17) ,
Page 95
27. Hirschey MD, Han YJ, Stucky GD,
Butler A (2006) Imaging Escherichia coli
using functionalized core/shell CdSe/CdS
quantum dots. Journal of Biological
Inorganic Chemistry 11: 663- 669.
28. Hahn MA, Keng PC, Krauss TD (2008)
Flow Cytometric Analysis to Detect
Pathogens in Bacterial Cell Mixtures
Using Semiconductor Quantum Dots.
Analytical Chemistry 80: 864- 872.
29. Kloepfer JA, Mielke RE, Wong MS,
Nealson KH, Stucky G, Nadeaul J.L
(2003) Quantum Dots as Strain- and
Metabolism-Specific Microbiological
Labels. Applied and Environmental
Microbiology69: 4205- 4213.
30. Zahavy E, Heleg-Shabtai V, Zafrani Y,
Marciano D, Yitzhaki S (2010)
Application of Fluorescent Nanocrystals
[q-dots] for the Detection of Pathogenic
Bacteria by Flow-Cytometric. Journal of
Fluorescence 20: 389-399.
31. Park TJ, Park JP, Seo GM, Chai YG, Lee
SY (2006) Rapid and Accurate Detection
of Bacillus anthracis Spores Using
Peptide-Quantum Dot Conjugates 16:
1713- 1719.
32. Sainathrao S, Mohan KVK, Atreya C
(2009) Gamma-phage lysinPlyG
sequence-based synthetic peptides
coupled with Qdot-nanocrystals are
useful for developing detection methods
for Bacillus anthracisby using its
surrogates, B. anthracis-Sterne and B.
cereus-4342. BMC Biotechnology 9: 67.
33. Edgar R, McKinstry M, Hwang J,
Oppenheim AB, Fekete RA, Giulian G et
al. (2006) High-sensitivity bacterial
detection using biotin-tagged phage and
quantum-dot nanocomplexes.
Proceedings of the National Academy of
Sciences 103: 4841- 4845.
34. Leevy WM, Lambert TN, Johnson JR,
Morris J, Smith BD (2008) Quantum dot
probes for bacteria distinguishEscherichia
coli mutants and permit in vivo imaging.
Chemical Communication 20: 2331-2333.
35. Gazouli M, Liandris E, Andreadou M,
Sechi LA, Masala S, Paccagnini D et al.
(2010) Specific Detection of Unamplified
Mycobacterial DNA by Use of
Fluorescent Semiconductor Quantum
Dots and Magnetic Beads. Journal of
Clinical Microbiology 48: 2830- 2835.
36. Wu SM, Tiana ZQ, Zhanga ZL, Huanga
BH, Jianga P, Xieb ZX et al. (2010)
Direct fluorescence in situ hybridization
(FISH) in Escherichia coli with a target-
specific quantum dot-based molecular
beacon. Biosensors and Bioelectronics
26: 491-496.
37. Wu SM, Zhang ZL, Wang XD, Zhang
MX, Peng J, Xie ZX (2009) Quantum
Dot-FerrichromeBioprobes for
Recognition of Pseudomonas fluorescens.
Journal of Physical Chemistry 113: 9169-
9174.
38. Zhao Y, Ye M, Chao Q, Jia N, Ge Y,
Shen H (2009) Simultaneous Detection of
Multifood-Borne Pathogenic Bacteria
Based on Functionalized Quantum Dots
Coupled with Immunomagnetic
Separation in Food Samples. Journal of
Agricultural and Food Chemistry 57: 517-
524.
39. Wang X, Du Y, Li Y, Li D, Sun R (2011)
Fluorescent Identification and Detection
of Staphylococcus aureuswith
Carboxymethyl Chitosan/CdS Quantum
Dots Bioconjugates. Journal of

Nithish.U.S et al. BACTERIOLOGICAL APPLICATIONS OF QUANTUM DOTS
Int J Cur Res Rev, Sept 2012 / Vol 04 (17) ,
Page 96
Biomaterials Science. Polymer Edition
22: 1881-1893.
40. Yang L, Li Y (2005) Quantum Dots as
Fluorescent Labels for Quantitative
Detection of SalmonellaTyphimurium in
Chicken Carcass Wash Water. Journal of
Food Protection 68: 1241-1245.
41. Wang L, Wu CS, Fan X, Mustapha A
(2012) Detection of Escherichia coli
O157:H7 and Salmonella in ground beef
by a bead-free quantum dot- facilitated
isolation method. International Journal of
Food Microbiology 156: 83-87.
42. Decho AW, Beckman EM, Chandler GT,
Kawaguchi T (2008) Application of
photostable quantum dots for indirect
immunoflourescent detection of specific
bacterial serotypes on small marine
animals. Nanotechnology 19: 235102.
43. Goldschmidt MC (2006) The Use of
Biosensor and Microarray Techniques in
the Rapid Detection and Identification of
Salmonellae. Journal of AOAC
International 89: 530- 537.
44. Sanvicens N, Pascual N, Fernández-
Argüelles MT, Adrian J, Costa-Fernández
JM, Sánchez-Baeza F et al. (2011)
Quantum dot-based array for sensitive
detection of Escherichia coli. Analytical
and Bioanalytical Chemistry 399: 2755-
2762.
45. Carrillo-Carrión C, Simonet BM,
Valcárcel M (2011) Colistin-
functionalised CdSe/ZnS quantum dots as
fluorescent probe for the rapid detection
of Escherichia coli. Biosensors and
Bioelectronics 26: 4368-4374.
46. Chalmers NI, Palmer RJ Jr, Du-Thumm
L, Sullivan R, Shi W, Kolenbrander PE
(2006) Use of Quantum Dot Luminescent
Probes To Achieve Simgle-Cell
Resolution of Human Oral Bacteria in
Biofilms. Applied and Environmental
Microbiology 73: 630-636.
47. Lee J, Kim IS, Yu HW (2010) Flow
Cytometric Detection of Bacillus spoOA
Gene in Biofilm Using Quantum Dot
Labeling. Analytical Chemistry 82: 2836-
2843.
48. Chalmers NI, Palmer RJ Jr, Cisar JO,
Kolenbrander PE (2008) Characterization
of a Streptococcus sp.-Veillonella sp.
Community Micromanipulated from
Dental Plaque. Journal of Bacteriology
190: 8145-8154.
49. Dumas EM, Ozenne V, Mielke RE,
Nadeau JL (2009) Toxicity of CdTe
Quantum Dots in Bacterial Strains. IEEE
Transaction on Nanobioscience 8: 58-64.
50. Geszke M, Murias M, Balan L, Medjahdi
G, Korczynski J, Moritz M, et al. (2011)
Folic acid-conjugated core/shell
ZnS:Mn/ZnS quantum dots as targeted
probes for two photon fluorescence
imaging of cancer cells.
ActaBiomaterialia 7: 1327- 1338.
51. Bao H, Lu Z, Cui X, Qaio Y, Guo J,
Anderson JM, et al. (2010) Extracellular
microbial synthesis of biocompatible
CdTe quantum dots. ActaBiomaterialia 6:
3534-3541.

Nithish.U.S et al. BACTERIOLOGICAL APPLICATIONS OF QUANTUM DOTS
Int J Cur Res Rev, Sept 2012 / Vol 04 (17) ,
Page 97
Fig 1: Schematic diagram of a Quantum Dot with an inorganic coating and conjugated bio molecules
Fig 2: Variation of emission wavelength of Quantum Dots with their size. Adapted from [7].

Nithish.U.S et al. BACTERIOLOGICAL APPLICATIONS OF QUANTUM DOTS
Int J Cur Res Rev, Sept 2012 / Vol 04 (17) ,
Page 98
Fig 3: Image of Escherichia coli using organic acid stabilized Quantum Dots with emission wavelength ranging from 540-630 nm. [Bar-
2µm] Reproduced with permission [28].
Fig 4: Detection of food-borne pathogens using Quantum Dots antibody conjugation complex, a- Salmonella typhimurium bound
to Quantum Dot emitting 620 nm light, b- Shigellaflexneri bound to Quantum Dot emitting 560 nm light, and c- Escherichia coli
O157:H7 bound to Quantum Dot emitting 520 nm light and d- Multiplexed detection of all test bacteria with their respective
antibody coated Quantum Dots. Reproduced with permission [38].

Ogundele O. E. et al. EFFECT OF EARLY DEFOLIATION ON THE NODULATION AND SOME AGRONOMIC TRAITS OF
SOME SELECTED COWPEA (Vigna Unguiculata l. Walp) VARIETIES
Int J Cur Res Rev, Sept 2012 / Vol 04 (17) ,
Page 99
IJCRR
Vol 04 issue 17
Section: General Science
Category: Research
Received on: 10/06/12
Revised on: 23/07/12
Accepted on: 12/08/12
EFFECT OF EARLY DEFOLIATION ON THE NODULATION
AND SOME AGRONOMIC TRAITS OF SOME SELECTED
COWPEA (Vigna Unguiculata l. Walp) VARIETIES
Ogundele O. E., Awosanya A. O.
Department of Biological Sciences, Tai Solarin University of Education,
Ijagun, Ijebu-Ode, Ogun State, Nigeria.
Email of corresponding author: [email protected]
ABSTRACT
This study investigated the effect of defoliation at emergence of cotyledons, 2 weeks and 4
weeks after planting on the number of nodules, nodule diameter, total nodule weight, nodule
efficiency, root length and plant height of two improved varieties and one local variety of Vigna
unguiculata (L.) Walp. Defoliation treatments were carried out in triplicates using the CRD.
Plants were raised in pots and data collected after 6 weeks. This study simulated early defoliation
of the crop as evidenced in pest attack, disease infection and/or grazing animals and significantly
reduced nodule number (P<0.001), nodule diameter (P<0.002) and total nodule weight
(P<0.001). Change in nodule pigmentation was also observed. The effect of reduction in nodule
characters was observed to culminate in a corresponding decrease in agronomic traits such as
plant height (P<0.001) and root length (P<0.001). To reduce the effect of early defoliation on
cowpea, farmers should plan the crop’s sowing so that its early growth stage would escape the
season of dominance of its major defoliators.
Keywords:agronomic, defoliation, cotyledons, nodulation, Vigna unguiculata
INTRODUCTION
The problem of maintaining soil fertility in
time past had led to the use of manure and
fertilizers. However, these methods were
constrained by erosion which leads to the
washing away of the nutrients in the top soil.
Alternative methods have since been used by
planting legumes such as cowpea to maintain
soil fertility and at the same time prevent soil
erosion. Crop farmers now focus on legumes
for the aforementioned benefits they attract
and their ability to form association with
bacteria that can fix nitrogen to the soil.
Consequently, productivity is improved in
terms of quality and quantity.
Cowpea, a staple food with high protein,
mineral and vitamin content is also valued for
improving soil fertility through the formation
of root nodules for nitrogen fixation. It plays
an important role in agriculture by providing
soil nitrogen. The symbiosis can help relieve
the requirement for added nitrogenous
fertilizer of other crops that are intercropped
with cowpea. The legume is known for its
symbiotic association with Rhizobium bacteria
enabling it to fix atmospheric nitrogen (Laity
et al., 2003). Bacteria of the genus Rhizobium
play a very important part in agriculture by
inducing nitrogen-fixing nodules on the roots
of legumes such as cowpea.

Ogundele O. E. et al. EFFECT OF EARLY DEFOLIATION ON THE NODULATION AND SOME AGRONOMIC TRAITS OF
SOME SELECTED COWPEA (Vigna Unguiculata l. Walp) VARIETIES
Int J Cur Res Rev, Sept 2012 / Vol 04 (17) ,
Page 100
However, the growth of cowpea is limited by
numerous biotic (diseases, insects and other
pests) and abiotic factors that can cause
serious devastation (Rahman et al., 2008).
Several foliage defoliators, including insect
pests have been reported to cause severe
defoliation of cowpea. Aphids (Aphis
craccivora) attack cowpea especially at the
early vegetative stage (IITA, 2000) while a
considerable number of insects belonging to
Acrididae and Lepidopteran larvae have been
reported feeding on cowpea leaves,
“skeletonizing” and sometimes defoliating the
entire plant. Other foliage defoliators of
cowpea belong to the family Chrysomelidae
(Allen et al., 1996).
Several studies in crop defoliation have
received attention in the last four decades
using various crops. Studies have also been
carried out to determine the effects of
defoliation at the different growth stages on
yields of crops, as it simulates pests and
disease damages. Some studies (DeBeer,
1983; Schneiter et al.,1987; Schneiter and
Johnson, 1994) described an interaction
between the severity of damage (percentage
defoliation) and the growth stage at which this
occur.
Some of the earlier studies on defoliation of
cowpea were particular about defoliation at
the different growth stages (Rahman et al.,
2008) and situations peculiar to America and
Europe. There is probably little or no
information on cowpea defoliation at the
vegetative stage in Nigeria where the crop is
largely grown.
Defoliation as it may be caused by pests and
disease conditions affects the growth of the
entire plant. Perhaps nodulation of the crop is
also affected by the defoliation thereby having
a great impact on nitrogen fixation and
consequently crop productivity. This study
was therefore conducted to determine the
effects of defoliation at the vegetative stage of
growth on the nodulation of some selected
varieties of cowpea Vigna unguiculata (L.)
Walp. in the South-Western part of Nigeria.
MATERIALS AND METHODS
Cowpea Varieties
Two improved varieties of Vigna unguiculata
(L.) Walp. (IT89KD-288 and Damila) from
IITA and a local variety (Mata) in Nigeria
were used for the research.
Preparation of Experimental Pots
The experiment was a completely randomised
design with 36 experimental pots arranged in
greenhouse. The experiment was carried out at
the botanical garden of the biological sciences
department in Tai Solarin University of
Education, Ijagun, Nigeria between March and
April.
The experimental pots were perforated at the
base to allow for proper drainage. Loamy soil
from the botanical garden was used.
Planting
Three hand-picked healthy seeds were planted
in each pot and later thinned to one after
germination. Cultural practices such as weed
control were also carried out regularly.
Treatments
There were 4 treatments including the control
for each variety. The treatments were:
Defoliation immediately after emergence of
cotyledons;
Defoliation 2 weeks after planting;
Defoliation 4 weeks after planting;
No defoliation (control)
Each treatment was done in triplicates.

Ogundele O. E. et al. EFFECT OF EARLY DEFOLIATION ON THE NODULATION AND SOME AGRONOMIC TRAITS OF
SOME SELECTED COWPEA (Vigna Unguiculata l. Walp) VARIETIES
Int J Cur Res Rev, Sept 2012 / Vol 04 (17) ,
Page 101
Data Collection
Data were collected 6 weeks after planting. In
determining the number of nodules, each pot
was carefully emptied and the soil on the root
was gently washed with water. Root nodules
were physically counted with the aid of hand
lens.
The nodules present on the roots of each plant
were collected and weighed with electric
weighing balance to obtain the total nodule
weight. Nodule diameter was measured with
the aid of a micrometer screw gauge. Nodule
efficiency was determined by examining the
root nodules of each plant to check for the
presence of the reddish-pink pigment
(leghaemoglobin), which indicates a
functional or efficient nodule.
Plant height and root length were measured
using meter rule. Dry mass of shoot was
measured using an electric weighing balance
after shoots had been oven-dried at 60OC for
72hours.
Data Analysis
Analysis of data was done using ANOVA
with Genstat® statistical package.
RESULTS
The effect of defoliation on the number of
nodules was highly significant in the three
varieties used (P<0.001). Similar results were
obtained for total nodule weight, nodule
diameter, root length and plant height with
P<0.001, P<0.002, P<0.001, P<0.001
respectively. In figure 1, earliest defoliation
treatments significantly inhibited nodule
formation and consequently reduced nodule
numbers. Similarly, Defoliation 2 weeks after
planting and 4 weeks after planting still had
significant reduction on the nodule numbers
but not as pronounced as the earliest
defoliation.
Defoliation immediately after emergence of
cotyledons, at week 2 and week 4 reduced
nodule diameter relatively only in IT89KD-
288. Mata and Damila showed significant
reduction of nodule diameter only in those
defoliated at week 4 (Figure 2). Figure 3
shows that defoliation immediately after
emergence of cotyledons reduced plant height
>50% in all the three varieties. However,
week 4 treatments mildly reduced height of
IT89KD-288 and Mata which are the erect
type. The total nodule weight was
significantly reduced in all three varieties
when treatment was applied immediately after
emergence of cotyledons and 2 weeks after
planting. However total nodule weights were
severely reduced in IT89KD-288 when
treatments were applied 4 weeks after planting
(Table 1). Table 2 shows that nodules of the
plants defoliated after emergence of
cotyledons and 2 weeks after planting had
green pigment indicating lack of
leghaemoglobin. In week 4 treatments, only
nodules of the two improved varieties showed
traces of leghaemoglobin with pale pink
pigmentation. There was a relative reduction
in root length in treatments with earlier
defoliations. Only the root length of Mata, the
local variety was slightly reduced in week 4
treatment (Table 3).
DISCUSSION
Early defoliation had negative effect on
nodule characters (such as nodule numbers,
nodule diameter, total nodule weight and
nodule pigmentation), root length and plant
height. However, the severity of the effect
depends on the time of defoliation. Earliest
form of defoliation (immediately after
emergence of cotyledons) produced the most
severe reduction in nodulation, nodule

Ogundele O. E. et al. EFFECT OF EARLY DEFOLIATION ON THE NODULATION AND SOME AGRONOMIC TRAITS OF
SOME SELECTED COWPEA (Vigna Unguiculata l. Walp) VARIETIES
Int J Cur Res Rev, Sept 2012 / Vol 04 (17) ,
Page 102
characters and other traits studied. Defoliation
at week 4 produced severe and mild reduction
on all the traits studied. The result of this
study is in agreement with the observations of
Muro et al.,(2001) that showed that the effect
of defoliation depends on foliar surface area
eliminated and on growth periods at which
this takes place.
The significant reduction in nodule characters
as a result of defoliation treatments suggests
that there is a relationship between foliar
surface area and nodulation process in
cowpea. Loss or reduction of foliage parts
hinders photosynthesis. Perhaps, the
cotyledons and leaves supply food and some
necessary precursors for the initiation of
nodulation. Anonymous (2009) also reported
similar observations using soybean seedlings
and clover seedlings when it noted that the
product of photosynthesis and cotyledons
supply essential factors for nodulation and that
cotyledon removal soon after germination
delays, reduces or prevents infection of root
hairs for nodulation.
Foliage removal immediately after emergence
caused stunting in the plants while the
removal of the foliage parts at week 2 and
week 4 only caused slight reduction in plant
height when compared with the control. The
stunting may not be unconnected with the
inhibition of gibberellins production which
stimulates growth in apices of young plants
and their inability to synthesize enough
carbohydrate through photosynthesis, which is
necessary for plant growth and development.
This is corroborated by the findings of Mondal
et al., (1978) and Selter et a.,(1980) that
suggested that defoliation alters hormone
balance, starch, sugar, protein and chlorophyll
concentration of plants.
Change in nodule pigmentation observed in
defoliated plants suggests that photosynthesis
and nitrogen fixation are inter-related
processes. The greenish content of nodules of
defoliated plants at the time of data collection
points to the fact that the nodules, though
formed, were not only reduced in number and
diameter, but also non-functional and
inefficient. This observation is supported by
Hartwig and Nosberger (1994) that defoliation
causes dramatic decrease in nitrogenase
activity.
CONCLUSION AND RECOMMENDATION
Cowpea helps to increase the nitrogen pool of
the soil, improving its fertility and enhancing
agricultural productivity. Early defoliation of
the crop as it may be caused by pest attack,
disease infection and/or grazing animals has
been revealed by this study and others to
severely reduce nodule characters such as
nodule numbers, nodule diameter, total nodule
weight and nodule efficiency. The effect of
this reduction in nodule characters was
observed to culminate in a corresponding
decrease in other traits such as plant height
and root length in similar manner. This in turn
tends to undermine the potential of cowpea to
serve as Africa’s cheapest source of soil
nitrate. To reduce or eliminate the effect of
defoliation on cowpea, farmers are advised to
plan the crop’s sowing such that its early
growth stage should escape the season of
dominance of its major defoliators. Further
research works should be conducted to
discover other ways of preventing foliage loss
apart from the use of pesticides and breeding
for varieties with higher leaf surface area.
Finally, cowpea breeders should make attempt
in their future work to breed varieties that are
tolerant to pest attack and disease-resistant.

Ogundele O. E. et al. EFFECT OF EARLY DEFOLIATION ON THE NODULATION AND SOME AGRONOMIC TRAITS OF
SOME SELECTED COWPEA (Vigna Unguiculata l. Walp) VARIETIES
Int J Cur Res Rev, Sept 2012 / Vol 04 (17) ,
Page 103
This may also help to limit the effect of early
defoliation on the nodulation of the crop.
ACKNOWLEDGEMENT
IITA for providing the two improved
varieties of cowpea used for this research
REFERENCES
1. Allen D J, Ampofo J K O, Wortman C S
(1996). Pests, diseases and Nutritional
disorders of the common bean in Africa. A
field guide. The Netherlands, CTA, 132pp.
Anonymous 2009. Rhizobium and Legume
Root Nodulation.
Http://www.microbiologyprocedure.com/r
hizobium-and-legume-root-
Nodulation/temperature-and-light.html.
2. DeBeer J P (1983) Hail damage simulation
by leaf area removal at different growth
stage of sunflower. Gewasproduksie. 12:
110-112.
3. Hartwig U A and Nosberger J (1994). Plant
and soil 16(1): 109-114. IITA, 2000.
Crops and farming systems.
Http://www.iita.org/crop/cowpea.htm
4. Laity F, Diouf D and Fall M A (2003).
Genetic diversity in cowpea varieties
determined by ARA and RAPD
techniques. Afr. J. Biotechnol. 2: 48-50
5. Mondal M H, Brun W A, Brenner M L
(1978). Effect of sink removal on
photosynthesis and senescence in leaves of
soya beans plants. Plant physiology. 61:
394-397
6. Muro J, Irigoyen I, Militino A F, Lamsfus
C (2001). Defoliation effects on sunflower
yield reduction. Agronomy Journal. 93:
634-637.
7. Rahman S A, Ibrahim U and Ajayi F A
(2008). Effect of defoliation at different
growth stages on yield and profitability of
cowpea (Vigna unguiculata L. Walp.) E. J.
Env. Agric. & Food Chem. 7(9): 3248-325
8. Schneiter A A, Johnson B L (1994).
Response of sunflower plants of physical
injury. Can. J. Plant Science. 74: 763-766.
9. Schneiter A A, Jones J M, Hammond J J
(1987). Simulated hail research in
sunflower defoliation. Agronomy Journal.
79: 431-434.
10. Selter T L, Brun W A, Brenner M L
(1980). Effect of obstructed translocation
of leaf abiscic acid and associated stomatal
closure and photosynthesis decline. Plant
physiol. 65: 1111-1115.
11. Shibbles R, Secor J, Ford D M (1987).
Carbon assimilation and metabolism.
Agronomy. 16: 535-588.

Ogundele O. E. et al. EFFECT OF EARLY DEFOLIATION ON THE NODULATION AND SOME AGRONOMIC TRAITS OF
SOME SELECTED COWPEA (Vigna Unguiculata l. Walp) VARIETIES
Int J Cur Res Rev, Sept 2012 / Vol 04 (17) ,
Page 104
*WAP – Weeks after planting
Figure 2 Effect of defoliation on nodule diameter
*WAP – Weeks after planting Figure 1 Effect of defoliation on number of nodules

Ogundele O. E. et al. EFFECT OF EARLY DEFOLIATION ON THE NODULATION AND SOME AGRONOMIC TRAITS OF
SOME SELECTED COWPEA (Vigna Unguiculata l. Walp) VARIETIES
Int J Cur Res Rev, Sept 2012 / Vol 04 (17) ,
Page 105
Table 1: Total nodule weight at 6th
week (g)
Variety Defoliation at emergence of
cotyledons
Defoliation 2 weeks
after planting
Defoliation 4 weeks
after planting
Control
IT89KD-288 0.067 0.083 0.667 8.063
Mata 0.325 0.400 4.280 6.333
Damila 0.075 0.050 3.737 7.297
Table 2: Nodule pigmentation at 6th
week
Variety Defoliation at emergence of
cotyledons
Defoliation 2 weeks
after planting
Defoliation 4 weeks
after planting
Control
IT89KD-288 Green Green Pale pink Pink
Mata Green Green Green Pink
Damila Green Green Pale pink Pink
Table 3: Root length at 6th
week (cm)
Variety Defoliation at emergence of
cotyledons
Defoliation 2 weeks
after planting
Defoliation 4 weeks
after planting
Control
IT89KD-288 5.0 14.1 25.3 37.5
Mata 9.0 10.2 31.9 38.0
Damila 6.7 10.3 15.7 39.5
*WAP – Weeks after planting Figure 3 Effect of defoliation on plant height

Praful S. Jevoor et al. INTERESTING FACTS ON THYMUS GLAND CHANGES-A REVIEW
Int J Cur Res Rev, Sept 2012 / Vol 04 (17) ,
Page 106
IJCRR
Vol 04 issue 17
Section: Healthcare
Category: Review
Received on: 10/06/12
Revised on: 13/07/12
Accepted on: 12/08/12
INTERESTING FACTS ON THYMUS GLAND CHANGES - A REVIEW
Praful S. Jevoor1, Mathada V.Ravishankar
1, Sandhya Dharwadkar
2, Amit
Magadum1, Somashekhar Biradar
2
1Department of Anatomy, J.N. Medical College, K.L.E. University, Belgaum
2Dept. of Anatomy, USM-KLE International Medical Programme, Belgaum
Email of corresponding author: [email protected]
ABSTRACT
In most of the cadavers procured for the dissections in the department of anatomy belongs to
male adult cadavers, which were devoid of active thymus gland and often the gross features of
this gland was ignored because of its remnants were found with variable degree of shape and
sizes. During dissections in most of the cadavers we have often noticed the morphology of most
thymus remnant from simple flat mass to a well defined solid mass of thymic tissue. To test our
curiosity on microscopic studies we have noticed features like, abundant number of discrete
lymphocytes along with Hassall’s corpuscles were appreciated under hematoxylin and eosin
staining. The thymus being a central lymphoid organ develops from endoderm of third
pharyngeal pouch along with the parathyroid gland. It remains active till the age of 14 years and
later shows gradual inclination towards its involution as conventionally it is believed to be an
involuting organ with advancing age. Thymus being an important immune competent organ
which has created a curiosity regarding its changes from advancing age to number of invasive
and non invasive experimental studies, such interesting facts were considered to drag the
attention of involuting organ.
Key Words - Acetylcholine, Adipocytes, Hassall’s corpuscles, Immunosenescence
INTRODUCTION
Thymus is a central lymphoid organ located in
the superior mediastinum; many times it was
ignored during the dissections of adult
cadavers practical point of view its
morphology was less stressed as it is replaced
by the fatty tissue in most of the adult
cadavers. Immunologically it is considered to
be an important gland which programs the
stem cells which are originating from bone
marrow for its specific antigen activity.
Regarding the involution of the thymus gland
and its significance is sited in the texts of
histology, this organ created curiosity in
connection with its versatile changes in
different age, sex and disease conditions, such
as immune deficient ailments varying from
opportunistic susceptibility of body to simple
viral infections to life threatening condition
like acquired immunodeficiency syndrome
(AIDS). The thymus arises from the third
pharyngeal pouch of thymic primordia at the
end of the fourth week in the form of
endodermal proliferations, these endodermal
proliferation forms a hallow tubes that invade
the underlying mesoderm which later
transforms into solid branching cords, these
cords are the primordia of the polyhedral

Praful S. Jevoor et al. INTERESTING FACTS ON THYMUS GLAND CHANGES-A REVIEW
Int J Cur Res Rev, Sept 2012 / Vol 04 (17) ,
Page 107
thymic lobules. The whorl like Hassall’s
corpuscles within the medulla apparently
arises from the ectodermal cells of the third
pharyngeal cleft shortly after the formation of
thymus is subsequently infiltrated by
lymphocytes. As the thymus is developed
along with many structures in the primitive
pharyngeal floor during the fetal life, often it
tend to take a different pathway and
destination with or without influencing its
accompanied structures 1,2
. Such rare
incidence of embedded thymic follicles within
the section of thyroid gland was accidentally
found during the histopathological
investigations showing its diverse destination3.
The congenital anomaly like digeorge
syndrome is often associated with
maldevelopment of thymus gland. The thymus
is highly active during the perinatal period and
continues to grow throughout childhood
reaching its maximum size at puberty and later
on the gland involutes rapidly which is
replaced subsequently with fatty tissue4. The
importance of the thymus often reviewed in
adults with the suspected clinical locomotors
functions, most of such signs and symptoms
are often proved with persistent activity of
thymus. In case of adults the thymus often
start producing its antigens against own body
components which can lead to condition like
myasthenia gravis this condition can be
handled effectively by thymectomy 5. During
routine dissections in most of the cadaveric
gross thymic remnant was noticed as a mass
resembling the original gland as shown in the
photo legend (1) and its microscopic
appearance has shown in the photo legend (2).
DISCUSSION
If we observe the whole life span of an
individual as the age advances some of the
bodily organs are showing obvious changes
from simple atrophy to involution, often these
changes are so subtle that the functional
derangements are correlated with advanced
structural changes in number of organs.
During the early period of post natal life
thymus gland plays a significant role of
programming the cells which are reaching
the gland for their charged specific tasks, such
cells are destined to be involved in immune
mechanism, our body defense activities are
influenced by factors like age, sex,
environment, food, nutritional status, genetic
factor, hormonal status etc. During the
dissections in most of the male cadavers often
we have noticed and collected a lobulated
mass situated at the upper and anterior part of
the pericardium in the region of superior
mediastinum(Photo legend-1), where usual
thymus gland is situated. Such mass was
studied thoroughly from out side and was later
subjected to histological tissue processing,
embedding, microtome sectioning and it was
stained with hematoxylin and eosin, later on
microscopic analysis it has shown a classical
involuntary changes in most of the areas
which resembles the thymic tissue and the
Hassall’s corpuscles (Photo legend-2) were
sparsely spread among dense fatty tissue
along with large number of scattered
lymphocytes. These findings have confirmed
that it is an involuted thymic remnant.
Thymus gland shows a linear increase in its
weight as the age advances till the 16 years of
age, later it undergoes gradual loss in its gross
weight 6. Thymus is being a primary lymphoid
organ plays an important role in the
development of other secondary lymphoid
organs. This fact can be realized by the non-
development or immature development of

Praful S. Jevoor et al. INTERESTING FACTS ON THYMUS GLAND CHANGES-A REVIEW
Int J Cur Res Rev, Sept 2012 / Vol 04 (17) ,
Page 108
other secondary lymphoid organs followed by
thymectomy during the early postnatal life,
such dependent activity makes one to become
more susceptible to infections from simple to
complex nature. The activity of thymus begins
in the early fetal life itself as a source of
production of diversified T cell production
which is further boosted in the early stages of
post natal life, but its function declines as the
age advances. The neonatal thymectomy
results in reduced number of T cell counts in
short and long term complications which
shows its indispensable functional
significance through infection prone attitude
in infants with advancing ageing process.7 The
developmental anomalies like digeorge
syndrome often associated with the absence of
thymus gland, during such situations clinical
trials associated with the transplantation of the
thymus gland in early childhood was found
with formation of new T-cells after a span of 5
months suggesting immune reconstitution
which was able to render an essential support
for host to fight against the entry of foreign
bodies 8,9
.It is commonly seen that the
advanced ageing process affects all aspects of
immune system followed by thymectomy
during infancy a particular type of “ T “cell
activity in an individual is often characterized
by lower CD4 +
and CD8+
cell number and
diversity. The removal of thymus in infancy
results in premature onset of decline in
immune competency, often such individuals
are susceptible for infectious diseases, such
clinical findings shows premature signs of
immune aging and Immunosenescence which
was experimentally correlated with the
consequence of thymectomy in the early
postnatal period 10
. There are some
experimental results correlating that the early
thymectomy in case of the female rats are
showing the precautious sexual maturity but
the same procedure in case of the male rats
showing no significant effects 11
.
A prospective randomized study treatment
with growth hormone in HIV infected adults
were showing changes in the body in the form
of increased thymic mass along with increase
T cell receptor rearrangement, such studies are
indicating that the growth hormone is an
important factor which can regulate the T cell
development which can reverses the adverse
influence on thymo-poiesis in rodents. The
thymus being a primary site of de novo cell
production it will modulate the recovery in
immune deficient cells, which supports the
hypothesis of enhancement of thymus activity
by growth hormone administration in immune
deficient conditions. The possibility of the
functional reinstate of the thymus was
observed in a condition where the growth
hormone treatment can revive the thymic
function by enhancing the thymo-poiesis 12
.
Such immune reconstitution studies can
support the highly virulent HIV infections
which are targeting the thymus where it shows
a strong correlation associated with reversible
changes in the remnants of thymus gland 13, 14
.
The age factor of an individual and the
capacity of thymus reversibility are seems to
be interdependent one where the immune
modification process shows difference in
childhood and adulthood 15
. A relatively
common clinical condition where the
derangement in functional activity of the
primary lymphoid organ due to autoimmune
factors targets the normal neuromuscular
mechanisms leading to condition like
myasthenia gravis where the surgical evidence
of thymectomy and its clinical impact on the

Praful S. Jevoor et al. INTERESTING FACTS ON THYMUS GLAND CHANGES-A REVIEW
Int J Cur Res Rev, Sept 2012 / Vol 04 (17) ,
Page 109
prognosis of the myasthenia patients have
shown that the thymus is profoundly involved
in pathogenesis by synthesizing
autoantibodies against acetylcholine (Ach)
receptors. In more than 70% of all the
myasthenics the thymus gland shows
lymphofollicular hyperplasia, where the
thymectomy appears to be one of the most
rewarding therapeutic measure16
. Though the
thymus is showing its involution process in
either sex, indeed as the age advances the
gland is obviously showing some
discrimination. These changes could be due to
different hormones involved in driving the
advance age related changes in an individual.
Stage like pregnancy has overall influence on
the body of an individual which was studied in
mammals has shown that the thymus loses its
weight and cellularity with a marked
involuntary changes in the cortical portion.
The increase in the levels of hormones in
pregnancy is generally believed to be one of
the causative factors for its altered
morphology and function. The thymus cortical
part is the site of the cell trafficking in and out
of the thymus, the small MER (Medulla
termed epithelial medullary ring) seen in
virgin mice with the advancing age, where the
MER will enlarge and much more expansion
is seen in its size during pregnancy. In the
later stages of pregnancy the cortical epithelial
cells appears too effete and most of the
macrophages become heavily laden with
apoptotic cells followed by drastic changes in
the thymic microcirculation which could
affect the secretion of cytokines and other
products of the thymus 17
.
The collection of thymus in diversified age
group of people and when they were subjected
to micro anatomical studies have found that
during the biopsies obtained from the patients
immediately prior to partial thyroidectomy for
nontoxic nodular goiter, on its microscopic
examination 50% of the glandular cell activity
declination was recognized especially in late
adolescent individuals and 10% in case of late
middle aged individuals. In men the age
involution is linear whereas in women it is
biphasic. In humans during second and third
decades the proportion of the gland
parenchyma is relatively less in women when
compared to men. But with advanced ageing
process there is a little sex difference where
the medulla shows a continuous linear
involution which is similar in both the sex.
But with respect to cortical part of the thymus
in case of men which has shown accelerated
atrophy in contrast with the changes in age
matched women. Probably the sex related
changes in the thymus attributed to hormonal
levels in the body which were experimentally
correlated 18
. The number of invasive and
investigative studies were showing some
interesting structural changes in many organs
with the help of improved scanning techniques
where the drastic revolution in the field of
radio diagnostics has helped us to understand
and correlate the structural and functional
changes of many more organs19,20
.
CONCLUSION
Thymic parenchyma atrophies with advancing
age and it is replaced by fatty tissue it may be
diffuse or focal. The thymic remnants are
showing wide changes from infancy to
adulthood, in different sex, stressful and
disease status of the body. Unlike our
conventional thoughts its capability of
functional and structural reversibility in
immune deficient adults certainly taps
possibility of its functional revival, where the

Praful S. Jevoor et al. INTERESTING FACTS ON THYMUS GLAND CHANGES-A REVIEW
Int J Cur Res Rev, Sept 2012 / Vol 04 (17) ,
Page 110
thymus gland is showing its versatile
morphological and histological pattern in the
body is associated with a wide range of
immune mediated response. Indeed such
peculiar experimental out come makes one to
go further in the direction of the research
related to immune modulation where the
thymus stands as a peculiar and interesting
organ.
COMPETING INTERESTS
Here the authors declare that they don’t have
any competing interests.
ACKNOWLEDGEMENT
The author would like to acknowledge the
support provided by Dept. of Anatomy, JN
medical college, KLE University, Belgaum.
FUNDING
This work has not utilized any funding or
financial aid from any of the sources.
REFERENCE
1. Sadler T W. Langmans medical
embryology,Chapter 16,Head and neck,11th
edition, Lippincott’s Williams and
Wilkins,2010: 271-277.
2. Drake R l, Vogal A W,Mitchell A M.
Conceptional overview: Gray’s anatomy
for students. 2nd Ed. Churchill living stone.
Elsevier, Philadelphia,2009: 709.
3. Maradi K, Sharma J. Ectopic intra thyroidal
thymus-rare finding in an adult. The
internet journal of head and neck surgery.
2009; 3 (1). www.ispub.com/journal/the-
internet-journal-of-head-and-neck-
surgery.(Date of access 14-12-2012)
4. Edwin et al. Age related changes in the
cellular composition of the thymus in
children. The journal of allergy and clinical
immunology. 2005; 115(4):834-840.
5. Papatestas A E et al. Effects of thymectomy
in Mysthenia grevis. Annals of
surgery.1987;206(1): 79-88.
6. Begum M, Paul U K, Alam M J. Age
related changes in weight of the Thymus
Gland of Bangladeshi people. Bangladesh j
anat. 2010; 8(1): 10-12.
7. Afifi A, Raja S G, Pennington D J and
Tsang V T. For neonates undergoing
cardiac surgery does thymectomy as
opposed to thymic preservation have any
adverse immunological consequences
?.Interactive cardiovascular and thoracic
surgery. 2010; 11(3): 287-291.
8. Markert ML,Devlin BH,Mccarthy EA.
Thymus transplantation.Clinical
immunology.2010; 135(2):236-46.
9. Markert ML, Devlin BH, Alexieff MJ, Li J,
McCarthy EA, Gupton SE,Chinn IK, et al.
Review of 54 patients with complete
DiGeorge anomaly enrolled in protocols for
thymus transplantation: outcome of 44
consecutive transplants. Blood. 2007;
109(10):4539-4547.
10. Sauce D, Larsen M,Fastenackels,Duperrier
A,Keller M,Loebenstein BG, et al.
Evidence of premature immune aging in
patients thymectomised during early
childhood. The journal of clinical
immunology.2009; 119(10): 3070-3078.
11. Jr. Ahearn T F. "The Relation of the
Thymus Gland to Sexual Maturity"
http://ecommons.luc.edu/luc_theses/435 (
date of access 26-4-2012)
12. Napolitano L A et al. Growth hormones
enhances the thymic function in HIV
infected adult. J clin investigation, 2008;
18(3): 1085-1098.

Praful S. Jevoor et al. INTERESTING FACTS ON THYMUS GLAND CHANGES-A REVIEW
Int J Cur Res Rev, Sept 2012 / Vol 04 (17) ,
Page 111
13. Hazra R, Mackall C. Thymic functions in
HIV infections. Current HIV/ AIDS report.
2005;(2):24-28.
14. Savino W, Dardenne M, Marche C,
Trophilme D, Dupuy J M, Pekovic D, et al.
Thymic epithelium in AIDS. An immune
histological study. AJP1986;122(2):302-
307.
15. Ping Ye, Denise E, Kirschner and Athena
P, Kourtis, The thymus during HIV disease:
Role in pathogenesis and in immune
recovery. Current HIV research.2004;2(2)
:177-183.
16. Melms A, B.C. Schalke B C,Kirchner T,
Muller-Hermilink H K, Albert E and
Wekerle H. Thymus in mysthenia grevis.
Isolation of T lymphocytes in lines specific
for the nicotinic acetyl choline receptor
from thymuses of myasthenia gravis
patients, journal of clinical investigation.
1988; 81 (3):902-908.
17. Kendall M D and Clarke A G. The thymus
in the mouse changes its activity during
pregnancy, a stage of the
microenvironment, journal of anatomy
2000: 197(3); 393 -411.
18. Simpson J G, Grey E S and Beck J S. Age
involution in the normal human adult
thymus, Clinical experimental immunology
1975;19(2):261-265.
19. Moor A V et al. Age related changes in the
thymus gland CT- Pathologic correlation.
Am J Radiol. 1983; 141: 241-246.
20. Daga B V, Chamangokar V A,
Dhamangaokar V B. Case report-CT
diagnosis of thymic remnant cyst/
thymopharyngeal duct cyst. Ind J radiol
imaging. 2009; 19: 293-295.
Photo legend 1- Gross appearance of thymus
remnant in the cadaver
Number 1 and 2 indicated the lobes of the
thymus gland
Photo legend 2-Histology of thymic ramnent
tissue under H& E staining
Number 1 and 2 is indicating the adipocytes
3 and 4 is showing the Hassall’s corpuscles 5
and 6 is showing dense collection of
lymphocytes

Ranzani. R.et al. INDIGENOUS UNCOATED AND HYDROXYAPATITE COATED COMMERCIALLY PURE
TITANIUM FOILS FOR GUIDED BONE REGENERATION IN DEFECT SITES OF IMPLANTS – AN
IN VITRO STUDY
Int J Cur Res Rev, Sept 2012 / Vol 04 (17) ,
Page 112
IJCRR
Vol 04 issue 17
Section: Healthcare
Category: Research
Received on: 03/06/12
Revised on: 23/06/12
Accepted on: 12/07/12
INDIGENOUS UNCOATED AND HYDROXYAPATITE COATED
COMMERCIALLY PURE TITANIUM FOILS FOR GUIDED BONE
REGENERATION IN DEFECT SITES OF IMPLANTS – AN IN VITRO
STUDY
Ranzani R., Abby Abraham, Chakravarthy R., Lakshmi S.
Department of Prosthodontics, Meenakshi Ammal Dental College,
Chennai, India
Email of corresponding author: [email protected]
ABSTRACT
Use of barrier membranes for the regeneration of bone defects has significantly changed implant
dentistry in the past years. The design of the membranes employed in this study plays an important role
in establishing a healing environment by separating tissues during healing and thus providing space for
regeneration of bone in cases of insufficient bone around implants, it acts like a tent in cases of
extraction sites- which is a potential site for future implant placement thus reducing the problems of
irregular ridge defect, and the rigidity of the material prevents tissue ward collapse of the membrane.
The present study was conducted to prepare the titanium in the form of foil, and tested for
biocompatibility using fibroblast cells, hydroxyapatite coating was made on the foil, characterization
by X-ray diffraction for both the uncoated and the coated foils was done, and osteoblasts adhesion test
was done and viewed under scanning electron microscope both before and after the test.
Key words: Titanium foils, Hydroxyapatite coated foils, Fibroblast culture, Osteoblast adhesion test,
Scanning electron micrographs.
INTRODUCTION
“Everything has its time” The dinosaurs had their
time, and so will it once be said that amalgam had
its time too. In dentistry, implantology currently is
in “its time”. Other than the discovery of
osseointegration more than twenty years ago, the
concept of guided bone regeneration represents
the most important progress in implant dentistry.
This material helps in following cases:
In cases of insufficient bone around implants,
Acts like a tent over the graft material,
Preserves the clot formed by acting as a tent in
cases of extraction site, which is a potential site
for future implant placement.
The rigidity of the material prevents tissue
ward collapse of the membrane.
The present study was conducted to obtain an
improved uncoated and hydroxyapatite coated
titanium foils, both of which can be an economic
replacement for their costly counterparts.
Aim of the study:
To prepare the titanium in the form of foil.
To test biocompatibility of the material using
fibroblast cells.
To make hydroxyapatite coating on the foil.
MATERIALS AND METHODS
Preparation of titanium foil (fig: 1 a, 2a, 2b, 2c)
The titanium sheets were cut to a dimension of
3cm×3cm. 16% hydrofluoric acid w/v was taken
in a glass beaker, and the cut sheets are dipped in
the acid intermittently, and it is alternatively
dipped in water to wash the acid. For every

Ranzani. R.et al. INDIGENOUS UNCOATED AND HYDROXYAPATITE COATED COMMERCIALLY PURE
TITANIUM FOILS FOR GUIDED BONE REGENERATION IN DEFECT SITES OF IMPLANTS – AN
IN VITRO STUDY
Int J Cur Res Rev, Sept 2012 / Vol 04 (17) ,
Page 113
minute of etching, the material is measured with a
micrometer to check the thickness of the foil. This
procedure is carried on until the material is 60μ
thick and uniform pores appear.
Ultrasonic cleaning of the foil:
Foils are ultrasonically cleaned in
a. Acetone for 20 min,
b. 70% ethyl alcohol solution for 20 min and
c. Finally in distilled water for 20 min.
Preparation of hydroxyapatite coating over the
titanium foil (fig: 1b, 2a, 2b, 2c):
The ingredients of the dip-coating solution and
their weight percentages are:
d. Hydroxyapatite – 7.3%
e. Ethanol – 66.2%
f. Polyethyleneglycol 600 – 2.2%
g. Glycerol 10.2%
h. Distilled water – 14.1%
Preparation of dip coating solution (flow chart
no:1):
A mixture of hydroxylapatite and water is made
and maintained for 8 minutes. After 2 minutes,
polyethylene glycol and ethanol are mixed in a
separate beaker and maintained for 8 minutes.
Glycerol is added to the hydroxyapatite and water
mixture and maintained for 2 minutes. After this
time the polyethylene glycol and ethanol mix is
added to the mixture of hydroxyapatite, water and
glycerol. Then the whole solution is maintained
for 4 minutes. The final solution is the dip-coating
solution. Titanium foil is dipped and withdrawn at
45 degree angle in a freshly prepared dip-coating
solution at a constant speed of 10mm/15 seconds.
This procedure was repeated 2-3 times to increase
the coating thickness.
The coated foils were immediately dried in an
oven for 45 minutes. The microwave oven used in
this process is a BPL micro convection system.
X-ray diffraction (fig 3a & 3b):
The hydroxyapatite powder, titanium foil, and
hydroxyapatite-coated foil were characterised by
x-ray diffraction technique. The dip-coated
titanium foils clearly shows the hydroxyapatite
peaks along with the substrate titanium peaks.
Fibroblast culture
Commercially pure titanium foils, Glaxo
modification eagle’s medium (GMEM), Cell line:
VERO cells, Fetal calf serum were procured from
HI media, India and stored at -20 degree Celsius,
Antibiotic stock: Antibiotic stock was prepared
with the following antibiotics in distilled water
and added to the medium in the following
concentration.
Gentamycin : 50 mg/lit
Penicillin : 1,00,000 units/litre
Streptomycin: 50-100 mg/litre
Fungizone : 25μ / litre
Sodium bicarbonate stock: Sodium bicarbonate
8.8% solution (w/v) in phosphate buffered
solution was autoclaved and stored at +4 degree
Celsius until required.
Trypsin versene glucose was sterilized by
filtration through 0.22 μ membrane filters, ale
quoted and stored at -20 degree Celsius until
required.
Phosphate buffered saline (10X) was prepared in
sterile distilled water from this 1 litre of 1X was
prepared and sterilized by autoclaving at 121
degree Celsius for 15 minutes at 15 lbs pressure.
Procedure:
Sterilization of glassware’s:
The glassware’s were washed thoroughly, with
mild detergents and rinsed thoroughly with
distilled water, dried and covered with aluminium
foil and sterilized in autoclave at 121 degree
Celsius for 20 minutes at 15 lbs pressure or in hot
air oven at 180 degree Celsius for 2 hours.
Preparation and sterilization of medium:
The powdered medium was dissolved in 960 ml
of distilled water, tryptose phosphate broth (10%)
was added and the pH was adjusted to 7.4 with
sodium bicarbonate and 2.3 ml/L of antibiotic

Ranzani. R.et al. INDIGENOUS UNCOATED AND HYDROXYAPATITE COATED COMMERCIALLY PURE
TITANIUM FOILS FOR GUIDED BONE REGENERATION IN DEFECT SITES OF IMPLANTS – AN
IN VITRO STUDY
Int J Cur Res Rev, Sept 2012 / Vol 04 (17) ,
Page 114
stock was added and sterilized by filtration
through 0.22μ membrane filter and stored at+4
degree Celsius.
Maintenance of VERO cells:
VERO cells were maintained in growth medium
(GMEM 8% FCS and antibiotics). VERO cells
were passaged at a split ratio of 1:3 on every 3-
day. Briefly spent medium from bottles (25 sp
cm), containing confluent monolayer were
decanted and the cell layer washed with trypsin
versene solution twice. Detached cells were
harvested in 3ml of growth medium and
resuspended to make 24 ml of cell suspension in
growth medium. Cell suspension was seeded into
3 bottles (25-sq cm) at the rate of 8 ml per bottle
and incubated at 37 degree Celsius.
Extraction:
The extraction liquid resulted from the incubation
at 37 degree Celsius for 120 hours of the material
in the extraction “vehicle” (minimum essential
medium) under specific conditions.
A blank extraction was done using Glaxo
modification earl’s medium under the same
conditions, except for the absence of material.
The cells were tested by direct contact of
extraction liquid of the test implant material.
VERO Cyto toxicity study:
This was performed in 6 well tissue culture plates
(NUNC). Cells were seeded at the rate of 2×10⁵
cell/ml. 1.5ml of trypsinised cells were added
with equal volume of each of the four metal
extract in growth medium. 1.5ml of this mixture
was seeded into one well of the plate. Four such
extracts and negative controls were tested in a
single plate. Cytopathic effect was observed daily
for four days, at the end of which the cells were
stained with Giemsa.
Result of the test (fig 4a & 4b):
VERO cyto toxicity: none of the metallic extracts
caused any cytopathic changes in the VERO cells,
when the extracts were used as neat.
Osteoblasts adhesion test
Procedure:
Cell culture system:
Osteoblasts were maintained with minimum
essential media supplemented with foetal calf
serum.
Maintenance of cells:
When the cells become confluent, subculture the
cells using trypsin, incubate until the cells become
rounded and begin to detach by checking under
microscope every one minute. Add 4ml of serum
containing medium and disperse the cells
carefully using a Pasteur pipette.
Adhesion test:
Test samples were conditioned with media. Cells
were seeded on to the conditioned test samples,
standardized to 1.5 x 1.5cm, in multiwell plates
with required amount media. Incubated the
culture for 24 hours. After 24 hours, discarded the
medium from the culture dish, rinsed the cells
with phosphate buffered saline, fixed in 2.5%
glutaraldehyde solution in phosphate buffer for
three times. Dehydrated in different grades of
alcohol, immersed in asoamyl acetate for 2
minutes. Then processing is done for critical point
drying, gold coating and observation under
scanning electron microscopy.
Result of the test (fig: 5a, 5b, 5c, 6a, 6b, 6c ):
Osteoblasts adhered on to both coated and
uncoated test samples. Cell covered surface is
seen in scanning electron micrographs of 400x. At
higher magnification spreading of an individual
cell can be seen.
RESULTS
The result in the present study indicates that a
possible new way of thinking about implant
placement may be on the horizon.
The foil prepared was 60μ thick with uniform
distribution of pores, which can act as a passage
for the nutrients to reach the underlying tissues.

Ranzani. R.et al. INDIGENOUS UNCOATED AND HYDROXYAPATITE COATED COMMERCIALLY PURE
TITANIUM FOILS FOR GUIDED BONE REGENERATION IN DEFECT SITES OF IMPLANTS – AN
IN VITRO STUDY
Int J Cur Res Rev, Sept 2012 / Vol 04 (17) ,
Page 115
Four samples of 15mm X 15mm dimension were
subjected to fibroblast culture study. Extract of
the material was prepared and tested for
cytotoxicity. None of the metallic extracts caused
any cytopathic changes in VERO cells when
observed for four days. Thus, proving the
biocompatibility of the material.
The hydroxyapatite coating was done by
preparing a dip coating solution. When assessed
by X-ray diffraction the coating material was
identified as hydroxyapatite and the substrate as
titanium.
Scanning electron microscopic study revealed that
the uncoated material had distribution of pores
that were through and through, the area in
between the pores appeared scaly and rough,
proving the ability of the material to retain the
hydroxyapatite coating. In the coated material,
hydroxyapatite was uniformly distributed on the
substrate. The vertical section showed that the
thickness of the hydroxyapatite material was 50μ.
Osteoblast adhesion test was performed for both
coated and uncoated test samples. 1.5 x 1.5 cm
test samples were conditioned with media and
cells were seeded on the samples in multiwell
plates. Step wise procedures were conducted and
observed under scanning electron microscope.
Micrographs showed that the osteoblasts had
adhered onto both the coated and the uncoated
test samples. Cell covered surface was seen, and
at higher magnification and spreading of an
individual cell was seen.
DISCUSSION
The term guided bone regeneration, has been used
in tissue engineering for some years and is
actually a specialized sub-area of tissue
engineering and using this procedure for
treatment of partial and total edentulism with
dental implants has become an accepted treatment
modality. Guided bone regeneration is based on
the concept that most tissues are capable of self-
reconstitution if appropriate conditions exist and
by compartmentalizing wound healing. By
placing a physical barrier between epithelial and
connective tissues on one side and implants and
bone on the other side, guided bone regeneration
procedures aim to create a protected space for the
blood clot to form and organise. The presence of a
cell occlusive membrane is required to prevent the
migration of epithelial and connective tissue cells
into the wound area, thus allowing bone cells to
form from marrow spaces to repopulate the defect
and to mature into new bone. Membranes used in
guided bone regeneration should possibly achieve
a good degree of tissue integration with
neighbouring connective tissues in order to obtain
a mechanically stable environment necessary for
successful bone and soft tissue healing. However
regeneration of the bone tissue may be influenced
by the nature of the membranes themselves and
regeneration takes place in sequence of events
including blood clot formation, angiogenesis,
osteoprogenitor cell migration, woven bone
formation, compaction of woven bone and
secondary remodelling. In this study, we have
made indigenous commercially pure titanium foils
by etching, until it is 60μ thick and uniform pores
are seen. Hydrofluoric acid is used because it
attacks titanium even at very dilute
concentrations. Hydroxyapatite coating is done on
the foil by dip-coating, in a solution prepared by a
combination of hydroxyapatite powder, ethanol,
polyethyleneglycol, glycerol, and distilled water.
Hydroxyapatite is used because of its
osteoconductive and osteophilic properties.
Assessment of fibroblast culture: The titanium
was tested for biocompatibility using fibroblast
cells. Metal extract was prepared by incubation at
37◦ C for 120 hours of the material in the
extraction vehicle. Trypsinised VERO cells were
added with equal volume of the metal extract in
the growth medium. 1.5 ml of this mixture is

Ranzani. R.et al. INDIGENOUS UNCOATED AND HYDROXYAPATITE COATED COMMERCIALLY PURE
TITANIUM FOILS FOR GUIDED BONE REGENERATION IN DEFECT SITES OF IMPLANTS – AN
IN VITRO STUDY
Int J Cur Res Rev, Sept 2012 / Vol 04 (17) ,
Page 116
added to 5 wells of the six well plate and negative
control were tested. The cells were observed daily
for four days. None of the metal extract caused
any cytopathic changes, thus proving the
biocompatibility of the material.
Assessment of x-ray diffraction: The
hydroxyapatite powder, titanium foil and
hydroxyapatite-coated foil were characterized by
x-ray diffraction. The uncoated foil clearly shows
the titanium peaks and the coated foil shows the
hydroxyapatite peaks along with the substrate
titanium peaks.
Assessment of osteoblasts adhesion test:
Although the study of fibroblasts provides
valuable information about its response to
exogenous materials, cells of different origin react
differently to foreign bodies. Thus, the results
from fibroblasts should not be transferred to bone
cells. The uncoated and the coated samples were
tested for osteoblasts adhesion. Cells were seeded
on to the surface of the materials. The material
along with the medium was incubated for 24
hours. Later the medium was discarded from the
culture dish and processed for critical point
drying, gold coating and observed under scanning
electron microscope. The surface chemistry of
biomaterials can directly affect cell behaviour and
interactions between the host environment and the
biomaterials may have significant downstream
consequences. Therefore the nature of the
materials used in implantology may drastically
influence surrounding bone regeneration. Cell
attachment and migration are dependent on cell/
substrate interaction. The surface properties of the
material have a strong biophysical influence on
the cell kinetics. Osteoblasts are an anchorage –
dependent cell type and need to attach and spread
so as to divide and become confluent. The
cytoskeletal response (actin filament and focal
contact formation) of osteoblast-like cells to
various substrates has been studied by many
investigators. Bone cells are known to secrete a
great amount of transforming growth factor-β
(TGF - β1) and express cell surface TGF – β1
binding sites. Produced at all stages of bone
remodelling, TGF – β1 is a potent mitogen in
osteoblast-enriched cultures from foetal tissue. It
increases the expression of many genes associated
with osteoblast activity and the production of
extra cellular matrix macromolecules such as type
I collagen, fibronectin and osteonectin. Hasegawa
and coworkers1 demonstrated that the
conformational state of proteins can influence cell
activity and consequently extra cellular matrix
formation. This might be one of the reasons why
cells, because of more favourable spreading
reaction, increased their rate of growth and
supported the formation of mineralized matrix.
The role of TGF-β1 in bone regeneration is
mediated by changes in extra cellular matrix
macromolecules, which, in turn, are regulated by
a balanced secretion of biologically active growth
factors. Human osteoblast synthesis of these
growth factors and extra cellular matrix
macromolecules may be influenced by the
materials used in barrier membranes. Guided bone
regeneration is a means of using the osteogenic
potential of progenitor bone cells, to create new
growth in a variety of osseous defects.
Osteogenesis on bioactive substrates in
characterized by a temporal sequence of biologic
events involving cell morphology, proliferation
and differentiation. Hurzeler and associates2
found a substantial amount of “re-
osseointegration” after treating ligature peri-
implantitis using a combination of guided bone
regeneration and bone grafts.
Assessment of scanning electron micrographs
before osteoblasts adhesion:
The coated samples exhibited a thickness of 50μm
of hydroxyapatite coating in cross section. When
the surface was viewed, the hydroxyapatite

Ranzani. R.et al. INDIGENOUS UNCOATED AND HYDROXYAPATITE COATED COMMERCIALLY PURE
TITANIUM FOILS FOR GUIDED BONE REGENERATION IN DEFECT SITES OF IMPLANTS – AN
IN VITRO STUDY
Int J Cur Res Rev, Sept 2012 / Vol 04 (17) ,
Page 117
crystals were uniformly distributed and uniform
in size. The surface of uncoated foil revealed
uniform distribution of pores and the surface in
between the pores had a scaly appearance, which
aided in both adhesion of osteoblasts and
hydroxyapatite coating.
Assessment of scanning electron micrographs
after osteoblasts adhesion: The micrographs
revealed that osteoblasts adhered to both the
uncoated and the hydroxyapatite coated samples.
Cell covered surfaces were seen in the
micrographs of 400x. at higher magnification
spreading of an individual cell was seen. Thus the
material used in this study has proved to be
osseoconductive by promoting the adhesion of
osteoblasts to the substrate. The present study is
an in vitro study. For further clinical application
an in-depth invivo study is of paramount
importance.
SUMMARY
The study was conducted to prepare a titanium
foil, which can be used as a membrane for guided
bone regeneration in defect sites of implants.
Titanium sheets of required dimensions were cut
and immersed in hydrofluoric acid intermittently
and measured every minute of etching using
micrometer until the foil is 60μ thick and
distribution of micropores is present. The material
was subjected to fibroblast culture to evaluate the
biocompatibility. The results indicated that the
material is biocompatible. The prepared foils are
dip-coated, and the uncoated and the coated foils
were characterized by X-ray diffraction
technique. The uncoated foils clearly shows the
titanium peaks and the dip-coated titanium foils
showed the hydroxyapatite peaks along with the
substrate titanium peaks. Scanning electron
microscopic study showed micropores in the
uncoated material and the scaly substrate in
between the pores. And the hydroxyapatite coated
material showed uniform coating of the material.
Osteoblasts adhesion test was conducted on both
the uncoated and coated test samples. The
scanning electron micrographs revealed the
adhered osteoblasts on the surface of both the test
samples.
CONCLUSION
A new membrane material, titanium foil was
prepared; the material was proved biocompatible
in fibroblast culture study. This material was dip-
coated with hydroxyapatite. X-ray diffraction
showed foils with hydroxyapatite peaks along
with hydroxyapatite peaks along with the
substrate titanium peaks. Scanning electron
microscopic study revealed micropores and scaly
appearance of the uncoated foil, and uniform
coating of hydroxyapatite. The surface roughness
and pores has given provision for the attachment
of the hydroxyapatite crystals. Osteoblasts
adhesion test was done and scanning electron
microscopic study was conducted to view the
adhered cells. The osteoblast cells have adhered
to the substrate of both the coated and uncoated
foils. At higher magnification spreading of an
individual cell was seen. The results reveal that
this study could give rise to a new generation of
osseoconductive membranes which can be used in
various clinical conditions.
REFERENCES
1. Hasegawa, Jan-Thorsten Schantz, Dietmar et
al, Evaluation of a tissue-engineered
membrane-cell construct for guided bone
regeneration. INT J ORAL MAXILLOFAC
IMPLANTS 2002; 17: 161 – 174.
2. Hurzeler, Francisco H. Nociti, et al,
Absorbable versus Nonabsorbable membranes
and bone autografts in the treatment of
ligature-induced peri-implantitis defects in
dogs: A histometric investigation. INT J ORAL
MAXILLOFAC IMPLANTS 2001; 16: 646-
652

Ranzani. R.et al. INDIGENOUS UNCOATED AND HYDROXYAPATITE COATED COMMERCIALLY PURE
TITANIUM FOILS FOR GUIDED BONE REGENERATION IN DEFECT SITES OF IMPLANTS – AN
IN VITRO STUDY
Int J Cur Res Rev, Sept 2012 / Vol 04 (17) ,
Page 118
Legends
1a. Uncoated commercially pure titanium foil
2c & d At 300 and 500 magnification respectively uniform distribution of hydroxyapatite crystals are seen
2b. SEM study -In cross section 50µ thickness of hydroxyapatite coating is
seen
2a. Hydroxyapatite coated titanium foil
1b. SEM Study - Uniform distribution of pores at 20 magnification
1c & d At 300 and 500 magnification respectively scaly appearance of
material between the pores reveals a rough surface.

Ranzani. R.et al. INDIGENOUS UNCOATED AND HYDROXYAPATITE COATED COMMERCIALLY PURE
TITANIUM FOILS FOR GUIDED BONE REGENERATION IN DEFECT SITES OF IMPLANTS – AN
IN VITRO STUDY
Int J Cur Res Rev, Sept 2012 / Vol 04 (17) ,
Page 119
Flow chart No 1 3a
4a . Cell rounding during trypsinization
4b. Cells were well rounded and no sign of cytopathic changes
3b

Ranzani. R.et al. INDIGENOUS UNCOATED AND HYDROXYAPATITE COATED COMMERCIALLY PURE
TITANIUM FOILS FOR GUIDED BONE REGENERATION IN DEFECT SITES OF IMPLANTS – AN
IN VITRO STUDY
Int J Cur Res Rev, Sept 2012 / Vol 04 (17) ,
Page 120
Scanning electron micrographs after osteoblast adhesion test – uncoated foils
Scanning electron micrographs after osteoblast adhesion test – hydroxyapatite coated samples
5a .& 5b. At 400 magnification cell covered surfaces is seen
6a
5c. At higher magnification spreading of an individual cell is seen
6b
6c

Sharmila Banu A et al. OCCUPATIONAL AWARENESS OF RURAL WOMEN WORKERS IN HEN POULTRY FARM,
COIMBATORE DISTRICT, SOUTH INDIA
Int J Cur Res Rev, Sept 2012 / Vol 04 (17) ,
Page 121
IJCRR
Vol 04 issue 17
Section:General Science
Category: Review
Received on: 12/06/12
Revised on: 21/07/12
Accepted on: 12/08/12
OCCUPATIONAL AWARENESS OF RURAL WOMEN WORKERS IN
HEN POULTRY FARM, COIMBATORE DISTRICT, SOUTH INDIA
Sharmila Banu A1, Gunasekaran C
2, SelvaKumar V
3, Mohana P
4,
Kandappan K5, Elanchezhian M
6
1, 2, 4, 6
Conservation Biology Laboratory, Department of Zoology,
Bharathiar University, Coimbatore, TN, India 3, 5
Department of Social Work, Sri Ramakrishna Mission Vidyalaya
College of Arts and Science,Coimbatore,TN, India
Email of corresponding author: [email protected]
ABSTRACT
Frequently the rural area women’s are first-rate the preference to poultry works. Especially
women’s are the majority to work on this field. Rural areas are mainly depends on the women
incomes. The present research focus to scrutiny the occupational awareness in hen poultry farm,
in specific reference to faecal cleaners of women workers. The foremost objective of the
research is to bestow the awareness about work place and mould with them health and safety
decisive factor. The calculation is done by percentage (%) intensity and chi-square test. The
recommendations in addition discuss among women workers.
Key words: occupational awareness, rural, hen faecal cleaning women, livelihood, percentage
and chi-square test.
INTRODUCTION
Even though they are home makers, but they are
forced to work for their family. This is help to
their children future and they have a thought
about empowerment development. The women
are the backbone of agricultural workforce but
worldwide her hard work has mostly been un
paid. She does the most tedious and back-
breaking tasks in agriculture, animal husbandry
and homes (DARE/ICAR ANNUAL REPORT
2003–2004). The choice of occupation is
traditionally (Penny Kane) or time being taken to
commencing of rural women’s and they have the
poor dexterity of occupation effects. Thus, the
rural women’s are randomly selects the hen
poultry farm. In particularly, we have one
question: Why, the research is to selects the
poultry farm and especially in women workers.
Because, POULTRY is by far the largest
livestock group and is estimated to be about 14
000 million, consisting mainly of chickens, ducks
and turkeys (FAO 1999).One third of the world is
moving only the food of chicken. Women are the
back fillet of the whole lot in family. She have to
work for all the relationships like Mother,
Daughter, Sister, Grand mother, worker in
occupation etc. She didn’t feel difficulty with
anything which comes from family or occupation.
The bacterial count in poultry housing systems is
high in comparison to those of pig and cattle.
Little is known about the bacteria present in the
poultry environment such as in poultry litter and
air of poultry house (Saleh et al., 2003, Nasrin
etal). Micro organisms like Bacteria, (USA
Wrestling 2007-08) fungi-Small organisms that
are found everywhere in the environment and on
skin. Where as their population is more high in
pollutants and excrete area like animal faeces.
These organisms move under the skin and start
the problem to the humans. In poultry farm may
cause the problems of infection disease
respiratory problems and so on, these

Sharmila Banu A et al. OCCUPATIONAL AWARENESS OF RURAL WOMEN WORKERS IN HEN POULTRY FARM,
COIMBATORE DISTRICT, SOUTH INDIA
Int J Cur Res Rev, Sept 2012 / Vol 04 (17) ,
Page 122
overwhelming effects to the worker when they
have not any idea about basic occupational skill
(safety manners). The possible negative effect of
noise on reproduction is biologically plausible, as
well as amenable to prevention (Irene Figà-
Talamanca). So the research have in mind of these
points of basic health problems and its root will
be spread when the daily habits are not in
following the proper comportment such as clean
dress, wear the gloves and mask, and footwear.
Since, these are the fundamental to hygienic
working people. The present research asked the
question about clean dress, wearing the gloves,
mask, footwear’s and hand washing habits. These
all done by direct interview method. This analysis
is calculated by percentage (%) variation. Based
on the results they urge.
METHODOLOGY
The research work was conducted on the rural
women worker in hen poultry farm in Coimbatore
District. After approval from Institutional Ethics
Committee,(Kartik et al 2005) the research was
on track with conquering an informed permission
from the partaker of poultry farm. Totally 130
samples were selected for this research which
included age group of Up to 25 with 29 samples
(group I), 26-30 with 74 samples (group II), 31-
35with 19 sample (group III), 36 an above with 8
sample (group IV) and the study was conducted
during the epoch 3rd
-24th
May 2012.The study
was vigilance by direct interview method, we
calculated the percentage of women’s worker
awareness through the questionnaire include the 5
basic question, this also designed by the points of
daily activity such as clean dress code, wearing
gloves and mask , footwear then washing habit of
hands, and the answers were corrected with
options of 1.Yes, 2.No then this research was
successfully completed by the percentage and chi-
square test calculations.
The Direct interview Questions are following
A. Are they workers maintaining the dress code (a
clean pair of working dress) to work place?
B. Are they having the habit to wear footwear in
work place?
C. Are they wearing the disposable gloves?
D. Are they use the mask at work place?
E. Are they washing hands before drinking water?
The standard optionally answers were assessed
directly by the research team. Based on the
options the findings were examined.
I.RESULTS BASED ON SOCIO ECONOMIC
CHARACTERISTICS
Educational qualification of the Respondents
Education Frequency (N) Percent (%)
Secondary
education
7
5.4
SSLC 35 26.9
Illiterate 88 67.7
Total 130 100.0
Marital status of the Respondents
Parameters Frequency (N) Percent (%)
Married 85 65.4
Unmarried 39 30.0
Widow 6 4.6
Total 130 100.0
Family type of the respondents
Parameters Frequency Percent
Joint family 32 24.6
Nuclear family 98 75.4
Total 130 100.0
Income of respondents
Parameter Frequency Percent
up to 2200 37 28.5
2201 – 2600 48 36.9
2601 – 3000 43 33.1
3001and above 2 1.5
Total 130 100.0
Experience of respondents
Parameter Frequency Percent
Up to 5 year 78 60.0
6 -10 47 36.2
11 and above 5 3.8
Total 130 100.0

Sharmila Banu A et al. OCCUPATIONAL AWARENESS OF RURAL WOMEN WORKERS IN HEN POULTRY FARM,
COIMBATORE DISTRICT, SOUTH INDIA
Int J Cur Res Rev, Sept 2012 / Vol 04 (17) ,
Page 123
Results based on awareness response from
workers
Parameter Frequency Percent
Moderate 38 29.2
Low 92 70.8
Total 130 100.0
Respondents’ age and awareness of the
respondents
Respondents
age
Awareness
of the
respondents
Total
Mo
dera
te
Low
1
2
3
4
Up to 25 Count 9 20 29
%within
respondents
age
31.0
%
69.0
%
100.0%
26 -30 Count 29 45 74
% within
respondents
age
39.2
%
60.8
%
100.0%
31-35 Count 19 19
% within
respondents
age
100.0
%
100.0%
36 and
above
Count 8 8
% within
respondents
age
100.0
%
100.0%
Total Count 38 92 130
% within
respondents
age
29.2
%
70.8
%
100.0%
II. RESULTS BASED ON AWARENESS
QUESTION
The total number of samples was 130 and
analyzed by five types of awareness questions and
calculated by optional answers (yes, no)
A. Clean dress code Frequency Percent
Yes
N
12
(%)
9.2
No 118 90.8
Total 130 100.0
B. Custom of Footwear
Parameter Frequency Percent
Yes 28 21.5
No 102 78.5
Total 130 100.0
C. Practice of disposable gloves
Parameter Frequency Percent
Yes 24 18.5
No 106 81.5
Total 130 100.0
D. Handling of Mask
Parameter Frequency Percent
Yes 58 44.6
No 72 55.4
Total 130 100.0
E. Ritual of washing hands
Parameter Frequency Percent
Yes
N
46
(%)
35.4
No 84 64.6
Total 130 100.0
DISCUSSION
The present research was focused to identified the
occupational awareness in rural area especially
women workers in hen poultry farm. In the
attendance the research encounter only the fecal
cleaners. Why? The study concentrated to faecal
cleaners because they were more infected through
the excrete materials in poultry farm, According
to Mojtaba Yegani (2010)Zoonotic diseases are
transmitted from animals to humans and include
bacterial, viral, fungal, and parasitic diseases.
Salmonellosis, campylobacteriosis, chlamydiosis,
tuberculosis, Newcastle Disease, and avian
influenza are amongst the most common zoonotic

Sharmila Banu A et al. OCCUPATIONAL AWARENESS OF RURAL WOMEN WORKERS IN HEN POULTRY FARM,
COIMBATORE DISTRICT, SOUTH INDIA
Int J Cur Res Rev, Sept 2012 / Vol 04 (17) ,
Page 124
diseases transmitted from poultry to humans.
Poultry workers are at a greater risk of being
affected by these diseases. This review also
support to our research. Based on the results the
age group of up to 25 was more aware worker
than the rest of the age group. Why? The research
team asked the question about clean dress means
some worker have the habit to wear pair of dress
for work time, some of the worker have the habit
to wear clean dress in daily basis, but few of the
workers used the dress for two day or three days.
The table A. question only 12 samples answered
and the percentage was 9.2%, High percentage
was 90.8% found from 118 samples. Similar to
the second question about the habit of foot wear,
why? We had chosen this, because any time every
minute whenever we want anything we used only
our travel pack of legs, sometime we may go
hospital for children or elders and reach our home
without footwear means it can spread the growth
of microbial diversity through work place. The
table B shows in the percentage of 21.5 from 28
samples and high percentage from 102 samples.
The third question asked about gloves, why? The
research team set this kind because hands are the
direct conduct to get the infection; through the use
of hand they cleaned the fecal ooze material. This
material has the quality to induce in the skin and
cause diseases and hands are the machine for
everything like eating, cooking, washing etc.
without proper practice in the work place we may
get the foundation of ill. So cleaning is the main
factor of the above. The table C shows the
percentage variation like start from 24 samples of
18.5 and the 81.5 percentage from 106 samples.
Its basic, its simple. The number one way to
improve health in rural areas is not to provide
clean water; that comes in third. It is much easier
than that: teach people how to wash their hands
(Mihelcic, 2003). Third world communities suffer
greatly from preventable water borne diseases and
from diseases spread through poor hygiene
practices. By improving sanitation and
environmental conditions in the communities and
implementing an educational program of health
and hygiene education appropriate for the
community, the numbers of preventable deaths
and illnesses have been shown to decrease
(Panchita Paulete, 2003). According to WHO
guidelines for indoor air quality: dampness and
mould, exposure to microbial contaminants is
clinically associated with respiratory symptoms,
allergies, asthma and immunological reactions.
The microbial indoor air pollutants of relevance to
health are widely heterogeneous, ranging from
pollen and spores of plants coming mainly from
outdoors, to bacteria, fungi, algae and some
protozoa emitted outdoors or indoors. They also
include a wide variety of microbes and allergens
that spread from person to person. There is strong
evidence regarding the hazards posed by several
biological agents that pollute indoor air; however,
the WHO working group convened in October
2006 concluded that the individual species of
microbes and other biological agents that are
responsible for health effects cannot be identified.
This is due to the fact that people are often
exposed to multiple agents simultaneously, to
complexities in accurately estimating exposure
and to the large numbers of symptoms and health
outcomes due to exposure. The exceptions include
some common allergies, which can be attributed
to specific agents, such as house-dust mites and
pets. So, it’s our duty to be safe in work place and
in environment, based on this statement the
research team frames the question about wearing
of mask at work place, this will help to control the
respiratory problems. The table D showed the
percentage of 58 samples 44.6 and 72 samples
55.4.Improved hygiene (hand washing) and
sanitation (latrines) have more impact than
drinking water quality on health outcomes,
specifically reductions in diarrhea, parasitic

Sharmila Banu A et al. OCCUPATIONAL AWARENESS OF RURAL WOMEN WORKERS IN HEN POULTRY FARM,
COIMBATORE DISTRICT, SOUTH INDIA
Int J Cur Res Rev, Sept 2012 / Vol 04 (17) ,
Page 125
infections, morbidity and mortality, and increases
in child growth,.(Water, sanitation & hygiene,
2002).the research team included the question
about washing hands before drinking water or any
intervals based on the answered from the samples
the finding were done. The table E shows the 35.4
percentage from 46 samples and 64.6 from 84
samples respectively. The chi-square test valuable
were calculated by the factors of age and
awareness, income and awareness, experience and
awareness. The Pearson chi-square value was
14.75, Degrees of freedom was 3 and p value was
.002(less than .05) these were the values of age
and awareness. The income and awareness was
Pearson chi-square value 20.155, degrees of
freedom 3 and p value was .000 (less than 0.05).
The experience and awareness was Pearson value
0.817, the degrees of freedom was 2 and p value
was 0.665. From the chi-square results the
research find out that experience is not mould the
person directly but some cases it can. Age is the
factor this is have the ability to know that what
we will do or what we didn’t. Because the
research were not get the significance in
experience where as the significance appear in
age and income compared with awareness.
Hygienic and health conscious to support our
immune actions. The research questions such as
wearing footwear, to avoid the microbial infection
in legs and foot and the questions of gloves and
mask were support to the workers from
respiratory problems like sneezing, cough and
cold. Washing hands and wearing clean dress are
important to live good life. These are the basic
questions arise from the research team and
observed by direct interview method. This is the
first stage in a process that helps empower
members of a community. To assess their
knowledge base, investigate the local
environment, visualize a future scenario, analyze
constraints on change, plan for change, and
implement it,. (PHAST, 1998).Based on this
review support, our research was analyzing the
occupational environment on rural women
workers in first stratum.
CONCLUSION
During the month of period the research was
conducted on hen poultry with randomly selected
130 samples in various poultry farm. Whenever,
we interview the women workers by directly that
time on spot awareness created to them its shows
visibly. After two or four hours the awareness was
disappear. This is because of the care less and not
giving the preference to health and long life. But
awareness not only the source to protect them,
apart from this self appraisal with awareness of
each individual concentration is more important
than the voice arise from the researcher. As a
result we entitled the aphorism to their hearts that
is realize your work and know the reality of your
occupation, this will reduce the occupational
problems of health.
ACKNOWLEDGEMENT
I thank to God to have this opportunity to do
something good to society especially women
workers, Our sincere thanks to Dr.Sasikala, head
and professor, Department of Zoology, Bharathiar
University, with her support and encourage
completing this work in smooth way. Gratitude to
Institutional Human Ethical Committee of
Bharathiar University for permit the research
work. Our heartfelt thanks to poultry farm women
workers for their patience and managing director,
supervisor and last but not least Self Help Group
members for their support in this field. Authors
acknowledge the immense help received from the
scholars whose articles are cited and included in
references of this manuscript. The authors are also
grateful to authors / editors / publishers of all
those articles, journals and books from where the
literature for this article has been reviewed and
discussed

Sharmila Banu A et al. OCCUPATIONAL AWARENESS OF RURAL WOMEN WORKERS IN HEN POULTRY FARM,
COIMBATORE DISTRICT, SOUTH INDIA
Int J Cur Res Rev, Sept 2012 / Vol 04 (17) ,
Page 126
REFERENCES
1. FAO 1999. Statistical database, www.fao.org.
Food and Agriculture Organisation of the
United Nations. Rome, Italy. Houghton, MI.
2. Irene Figà-Talamanca Occupational risk
factors and reproductive health of women
Department of Hygiene and Industrial Health,
University of Rome ‘La Sapienza’, Piazzale
Aldo Moro 5, 00185 Roma, Italy. e-mail:
3. Jim Porter, USA Wrestling MRSA and other
Infection Facts Making Wrestling Safer Guide
to Recognition of Skin Infections
4. Kartik R Shah and Rajnarayan R Tiwari 2005,
OCCUPATIONAL SKIN PROBLEMS IN
CONSTRUCTION WORKERS Indian J
Dermatol. 2010 Oct-Dec; 55(4): 348–
351.doi: 10.4103/0019-5154.74537
5. M.S. Nasrin, M.J. Islam, K.H.M.N.H. Nazir,
K.A. Choudhury and M.T. Rahman1
Identification of bacteria and determination of
their load in adult layer and its environment
Dept. of Microbiology and Hygiene,
Bangladesh Agricultural University,
Mymensingh-2202, Bangladesh J. Bangladesh
Soc. Agric. Sci. Technol., 4(1 & 2): 69-72,
2007 ISSN 1811-6221
6. Mihelcic, Jim, Ph.D. Lecture. (13 March
2003). Michigan Technological University.
Houghton, MI
7. Mojtaba Yegani, 08 Jul 2010 Prevention /
Control Health hazards: Safety always comes
first, University of Alberta, Canada
8. Panchita Paulete (May 2003), Practice and
importance of combining health/hygiene and
environmental education with water sanitation
for sustainable health benefits in rural areas
School of Forest Resources & Environmental
Science Michigan Technological University,
Houghton, MI
9. Penny Kane, Senior Associate, Editor “women
and occupational health, issues and policy”
paper prepared for the global commission on
women's health The Office for Gender and
Health, The University of Melbourne,
Australia.
10. PHAST Initiatives in East Africa. (1998). The
World Bank. Presented at the Community
Water Supply and Sanitation Conference,
Washington,DC.http://www.wsp.org/english/fo
cus/conference/hyg_phast.pdf SOPAC WRU
Strategies.
11. Saleh, M., Seedorf, J. and Hartung, J. 2003.
Total count of bacteria in the air of three
different laying hen housing systems. Dtsch.
Tierarztl. Wochenschr., 110(9): 94-97.
12. Water, sanitation & hygiene: at a
glance..(March 2002). World Bank Group.
http://wbln0018.worldbank.org/HDNet/hdd
60/9d1422d8016e85d885256b90005e1f76/$FI
LE /5WatSan%20AAG.pdf
13. WHO guidelines for indoor air quality
:dampness and mould This document presents
World Health Organization (WHO) guidelines
for the protection of public health from health
risks due to dampness, associated microbial
growth and contamination of indoor spaces oct
2006
14. Women in Agriculture, (Dare/Icar Annual
Report 2003–2004)

Londhe Shashikala et al. FUSION OF FIRST AND SECOND THORACIC RIB NEAR STERNAL END
Int J Cur Res Rev, Sept 2012 / Vol 04 (17) ,
Page 127
IJCRR
Vol 04 issue 17
Section: Healthcare
Category: Case Report
Received on: 03/06/12
Revised on: 23/07/12
Accepted on: 12/08/12
FUSION OF FIRST AND SECOND THORACIC RIB NEAR
STERNAL END
Londhe Shashikala, Kori Rohini, Panjakash Samreen
Dept of Anatomy, Al-Ameen Medical College Bijapur, KA, India
Email of corresponding author: [email protected]
ABSTRACT
During routine work in the osteology section in the department of anatomy, Al- Ameen medical
college Bijapur, we got an unusual specimen showing fusion of first and second rib near its
sternal end on left side. Fusion was along the outer margin of first rib and inner margin of
second rib, 2.2 cm and 2.8cm behind the costo-chondral junction, along the inner and outer
margin of first and second ribs respectively. Fused segment was 8.5cm in front of vertebral end
along outer margin of first rib. 8.2cm in front of vertebral end along inner margin of second rib.
Transverse Length of fused part between first and second rib was 3.3cm and length of
intercostal space in front and behind the fusion was 0.6cm and 1.1cm respectively. Both the ends
of both ribs were free so intercostal space at the costochondral junction and at the vertebral end
was open. Because of such type of rib variations there are chances of compression of
neurovascular bundle along the intercostal space. These fused rib affect chest wall expansion,
may result in respiratory complications. Knowledge and awareness of such anatomical variation
of rib is important for physicians, radiologist and surgeons.
Key Words - Fusion, first and second thoracic rib.
INTRODUCTION
There are two types of variations related to ribs,
numerical and structural. In numerical type,
number of ribs either more or less. Cervical or
lumbar rib may be present as extra ribs, one or
more ribs may be absent as in less ribs. In
structural type, there is bifid rib, short rib and
fused rib.1 Each rib originates from the caudal
half of one sclerotome and the cranial half of the
next subjacent sclerotome. Head develops from
sometocele cells from one somite which migrate
with the caudal half of sclerotome, proximal
portion of the rib develops from both caudal and
cranial sclerotomal halves, and there is no mixing
of cells from these origins. Distal portion of rib
developed from caudal and cranial halves of
sclerotome, these cells mix as the rib extends into
the ventral bodywall and segmentation
diminishes .2 Any change or variation at this step
of development may be the reason for fusion of
ribs. Irregular segmentation of primitive vertebral
arches lead to fusion anomalies, recent
experimental studies in mice have implicated
splotch gene mutation for various structural
abnormalities in the ribs3.
Bicipital rib is an unusual anatomical pecularity
which results due to the fusion of shaft of two
distinct ribs into a common body and is seen
exclusively in relation to the first rib, either due to

Londhe Shashikala et al. FUSION OF FIRST AND SECOND THORACIC RIB NEAR STERNAL END
Int J Cur Res Rev, Sept 2012 / Vol 04 (17) ,
Page 128
fusion of cervical rib with first rib or more
commonly due to fusion of the first rib with
second rib4, 5
. Its incidence has been reported
o.3% in a study based on chest radiograph. 5
The rib anomalies whether pathological or normal
varients such as cervical rib, pelvic rib, bifid rib
and bicipital rib etc. often indicate an underlying
systemic disorder.6
CASE REPORT
We noticed a left sided bone specimen showing
fusion of first and second ribs, during routine
work in the osteology section of department of
anatomy, Al- Ameen medical college Bijapur
.Specimen was examined in detail for its
anatomical features, measurements were done and
photograph taken from both aspects of rib as in
figure 1. Complete length of first rib along the
outer margin was 13cm, complete length of
second rib, along the inner margin was 14.3cm.
Fusion of two ribs was near the sternal end, fused
segment was 2.2cm and 2.8cm behind the
costochondral junction of sternal end, along the
inner and outer margin of first and second rib
respectively. Fused segment was 8.5cm infront of
vertebral end along outer margin of first rib and
8.2cm infront of vertibral end along inner margin
of second rib .Transverse length of fused segment
was 3.3cm. The remaining part of intercostal
space, before and after the fused segment of rib
was open. The first rib had normal anatomical
features that are head, neck and tubercle of
vertebral end was normal and at the sternal end it
had depression at the tip for costal cartilage.
Along the outer margin of first and second ribs
there were prominent impressions for serratus
anterior muscle towards the vertebral end. The
second rib had rudimentary vertebral end, head,
neck and tubercle was not prominent and sternal
end was cut.
DISCUSSION
The first rib anomalies include the floating rib,
central defects bridged by ligamentous band,
rudimentary structure terminating in a synostosis
or pseudoarthrsis with second rib, bifurcated rib
etc.7Vinita Gupta et al reported partial fusion of
rib in anterior and posterior portion and
completely blended with each other in middle, the
first intercostal space was obliterated8. Rib fusion
causes scoliosis and restriction of chest wall
expansion, which may require surgical correction.
Fused ribs also encountered in Gorlin syndrome.6
Rani Anita et al reported synostosis between the
anterior ends and shafts of 1st and 2
nd ribs of right
side. There was single articular oval facet on head
with scalene tubercle at the inner margin of shaft
of upper segment1.
David Levi reported a case of 8 year boy with
lump at inner end of first right rib. There was
history of injury, the skiagram showed fusion of
first and second rib in the middle third of their
curve, he stated that condition appeared to be
congenital. He also stated that when fusion is at
the sternal end is due to ossification at the
costochondral joint, it spread towards the sternal
end of ribs, when fusion occurs at the vertebral
end, it is due to lesion of intrathoracic content,
especially long standing collapse of lung. Fusion
of middle third is a rare condition for that no
instance is recorded in anatomy textbooks9.
Any scoliosis associated with fused rib may result
in three dimensional thoracic deformity with
adverse effect on thoracic growth and function
with development of thoracic insufficiency
syndrome, which is defined as the inability of the
thorax to support normal respiration or lung
growth. He also stated that children suffering
from thoracic insufficiency syndrome referred to
them were on oxygen or ventilator support, in all
of these patient the common denominator was a

Londhe Shashikala et al. FUSION OF FIRST AND SECOND THORACIC RIB NEAR STERNAL END
Int J Cur Res Rev, Sept 2012 / Vol 04 (17) ,
Page 129
small, stiff distorted thorax that could not provide
volume for growth of the underlying lungs and
functioned poorly, with minimal secondary
breathing mechanism because of fused,
malformed or absent rib.10
Baumgarlner F et al reported two cases of fused
first and second ribs associated with thoracic
outlet syndrome in a radiological study.11
Seema
Deepak reported an unusual case of a bicipital rib
in which first and second rib of right side were
fused obliterating the intervening intercostals
space, she concluded that such a specimen cannot
present with thoracic outlet syndrome but can also
be an indicator of an underlying systemic
disorder.12
REFERENCES
1. Rani Anita, Rani Archana, Chopra Jyoti, Manik
Punita.Synostosis of First and Second Rib- Case
Report.J. Anat. Soc. India. 2009; 58(2):189-91.
2. Standrings, Johnson D, Ellis HAND Collin
P.Grays Anatomy, 39th edition, Churchill
Livingstone, London,2005. pp 796.
3. Evans DJR. Contribution of somatic cells to the
avian ribs. Developmental Biology.2003; 256:114-
26.
4. Turner WM. Cervical ribs and the so called
Bicipital ribs in man in relation to corresponding
structures in the Cetacea. Journal of anatomy and
physiology. 1883;17(30)384-400.
5. Terry RJ, Trotter M. The Ribs, In: Schaeffer JP
(eds) Human Anatomy, A Complete Systemic
treatise 11th edition. The Blakiston Company, New
York, Toronto, 1953, pp.192-98.
6. Glass RB, Norlon KI, Milre SA, Kaug E. Pediatric
ribs:a spectrum of abnormalities.
Radiographics.2002; 22: 87-104.
7. White JC, Poppel MH, Adams R. Congenital
malformation of the first thoracic rib: A case of
brachial neuralgia which simulates the cervical rib
syndrome. Surg Gynecol Obstel.1945; 81:643-59.
8. Vanita Gupta, Rajesh Kumar Suri, Gayatri Rath,
Hitendra Loh. Synostosis of first and second
thoracic ribs: Anatomical and radiological
assessment. International journal of anatomical
variations. 2009; 2:131-33.
9. David Levi. Fusion of middle third of the first and
second ribs. Proc R Soc Med. 1932; 25(8)1233.
10. Robert M. Cambell JR, Melvin D. Smith,Thomas
C.Mayes,John A. Mangos,Donna B. Willey-
Courand, Nusret Kose, Ricardo F. Pinero,Marden
E.Alder, DDS,Hoa L. Duong, Jennifer L.Surber,
BS.The characteristics of thoracic insufficiency
syndrome associated with fused ribs and
congenital scoliosis.The journal of bone and joint
surgery, Jbis org.203;85(3):399-408.
11. Baumgarlner F, Nelson RJ, Robertson JM.The
rudimentary first rib :Acause of thoracic outlet
syndrome with arterial compromise. Arch Surg.
1989; 124:1090-92.
12. Seema Deepak, Dikshayani KR. An unusual case
of a bicipital rib- a case report.Anatomica
Karnataka.2011; 5 (1)50-52.
Fig 1: Showing superior and inferior aspect of
fused part between 1st & 2nd rib

Shkelqim Gjevori CONSTRUCTION OF THE MATHEMATICAL MODEL FOR EVALUATION AND FORECAST OF
INTERURBAN PASSENGERS TRAVEL
Int J Cur Res Rev, Sept 2012 / Vol 04 (17) ,
Page 130
IJCRR
Vol 04 issue 17
Section: General Sciences
Category: Research
Received on: 03/07/12
Revised on: 23/07/12
Accepted on: 11/08/12
CONSTRUCTION OF THE MATHEMATICAL MODEL FOR
EVALUATION AND FORECAST OF INTERURBAN
PASSENGERS TRAVEL
Shkelqim Gjevori
Ministry of Public of Works and Transport. Institute of Transport, Tirana,
Albania.
Email of corresponding author: [email protected]
ABSTRACT
For a more harmonious development between economy and transport and for a close relation
supply and demand for travel, proper scientific studies should be conducted to determine
operational instruments for resolving the contradictions between this report and especially those
technical instruments should provide recommendations on permanent and long-term planning
that preceded the decision and policy-makers. One of these instruments that are in use with much
interest and after 50 years are mathematical models in transportation. They are based on the
assumption that a linear equation could represent the relationship between a dependent variable
“Y “that represents a pointer or economic phenomenon and one or more independent variables
“ pXXX ...., 21 ” and that each of them taken separately can satisfy the assumption of linearity that
is expressed in mathematical form as follows,
eXaXaXaaFy nn ....... 22110 (1.0)
It is important that we have implemented practical use of information which is part of a database
system for collection and data management of travel and road traffic in our country. In particular
and very carefully, we have also defined specific requirements for input data analysis and have
made their selection for the purpose of constructing the model.
Key words: O/D matrix, demand modelling, supply, variables, balance.
INTRODUCTION
Theoretical treatment and research on our
part has been extended by examining all
transport’s components, taking into account
the current information system that forms
the basis of existing data, and providing
other forms of data impossible to ensure up
to now but that are indispensable. On the
other hand refereed to the specific
conditions of Albania's research and
collection of appropriate data is not easy
mainly because of the fragmented
characteristics of existing statistical data
and lack of time series. Basic variables
which we are supported affect the quantity
and quality of travels and we have grouped
into three categories as follows,
demographic, economic, territorial factors.
MATERIALS AND METHODS
Based on three categories of the above
variables from an analysis of their
grouping, have deemed to representation
and application of the travel modeling, the
following variables as, resident population
in cities, the number of passenger vehicles,
and the active forces able to work,
economically active enterprises, number of
employees. With travel ensuring O/D
(origin-destination) between the cities of

Shkelqim Gjevori CONSTRUCTION OF THE MATHEMATICAL MODEL FOR EVALUATION AND FORECAST OF
INTERURBAN PASSENGERS TRAVEL
Int J Cur Res Rev, Sept 2012 / Vol 04 (17) ,
Page 131
the country and variables expressed above
we have ensured the necessary database for
the travel modeling through the application
of selected mathematical model. To derive
the travel legality in the function of
variables "Xi" selected according to the
recommendations and analysis made by us,
we were focused on some of the country's
main towns which make up about 96 % of
the population and economic activities, of
variables "Xi" taken into consideration.
Starting from the given travel data O/D and
for the 5 selected variables we have draw 5
tables. Starting from the given travel data
O/D and for the 5 selected variables we
have draw 5 tables, travels O/D depending
on 1.the population variable (Xp), 2.number
of economically active enterprises (Xnd),
3.vehicle of transportation for passengers
(Xmj), 4.active work force (Xap) and
5.number of employees.(Xnp) as an example
only one of them (table 1) for,
a) selection of independent variables
classifying by weight occupied by each of
them, and to make a second selection of the
5 variables in the three we have applied the
mathematical model of the shape force,
2
1
cXcY (1.1)
and for,
b) modeling and forecast of interurban trips
we shall apply the mathematical model of
linear form,
eXaXaXaaY nn ...22110 (1.2)
Mathematical model of the selected form Y
= c1X c2
is based on comparing of the
process conduct and this of the model,
especially when the dependence between
the "Y" and "Xi" is not linear and more so
when there is no identity of conduct.
The objective of the method is to modify
the model parameters in order to achieve a
better fit by assuring a very fast
convergence and adjacent to the
redevelopment status and optimal.
The result of the model describes a
relationship between average variables of
the two variables. The results given by the
model are tabular and in graphical form,
showing except of the parameters values
(coefficients before variables "Xi"), and
some important indicators that show the
reliability of the model and extent of links
between the two sizes "X and Y" such as, R,
R2 (or R
2 correlation coefficients, an
indication that express the value of the
model), adjusted R2 (or Adjuster R) is
useful in comparing this model with other
models, F (value of the coefficient of
reliability, P-value (probability value of
reliability of coefficients before variables
"Xi", etc.
Based on the selected mathematical model
we have applied software of this model
(1.1) for nine main cities like Tirana,
Durres, Vlora, Elbasan, Fieri, Korca, Berat,
Shkodra, Lezha, representing cities centers
of the county towns that constitute
the major economic, social and cultural
potentials, taking as the origin one city and
destination eight other cities and so
changing the positions of origin of travels
to eight cities in an order we have received
the following results which express the
legality of dependency between
variables "Xi" and function "Y". In here we
are providing only one of the results of
application of software. Journeys in the
function of the population origination from
Elbasan. (table 1/1) where;
TT(pop)-is variable “Xp” that gives the
number of population for cities Berat,
Durres, Fier, Korca, Lezha, Shkodra, Tirana
and Vlora (which are marked with the
indices according to the vehicles number
plates of the respective cities).

Shkelqim Gjevori CONSTRUCTION OF THE MATHEMATICAL MODEL FOR EVALUATION AND FORECAST OF
INTERURBAN PASSENGERS TRAVEL
Int J Cur Res Rev, Sept 2012 / Vol 04 (17) ,
Page 132
UP(O/D)-are current journeys originating
travel between the city of Elbasan and 8
other cities of destination (which in fact is
the value of the function of “Y”
mathematical model that we implemented)
YP(legality), is the result of the travel legality
"Y" according to the application of
mathematical model. From the results of
model we are taking,
Fopt = 3.762306016217445E-002
Copt(1)=2.658623009781310E007
Copt(2)=1.790759920467837
where; Fopt-function value (Y legality)
Copt(1), Copt(2)- values of model parameters.
In that way the function has the form,
790.10000002658.0 pXY
(1.3)
In the same way we extracted the results
and for eight other cities taken by order as
the origin of travels. In this way the
characteristics of transport in urban areas
reflect in a broad way the social, economic,
physical conditions at a given point in a
given time. In Table 2 are given the
variables and the correlation’s coefficient.
Thus from the 200 directions of travel
between 8 cities in the study, about 80-85%
of them express a reliable correlation
between the curve of O/D and that of
legality of the O/D found by modeling the
remaining 15-20% displays a correlation
not very satisfactory. To select which of the
variables “Xi” influence more on trips O/D,
it was applied their simulation “Xp, Xmj, Xnd,
Xfa, Xpu” by increasing them to the extent of
10%.
From the application of mathematical
model of the type power (equation 1.1) we
obtained 200 values of trips O/D between
the couple of cities and we get the
following results. Specifically for
simulation with 10 % of “Xp” we get the
results as table 3. As a conclusion based on
the above two assessments therefore;
1) to the extent of influence after the
simulation with 10% of variables,
2) and coefficient “kO/D/Xi” [travel/unit
variable].
Have made their classification, from which
we selected three of variables that have
significant impact on the generation and
attraction of trips which are,
population (Xp), vehicle of transportation of
passengers (Xmj), and economic enterprises
(Xnd)
Based on these three selected variables in
accord with (equation1.2) "construct" the
model of trips generated or attracted in
nationally rate, where, e-error term,
for X1=Xp,; X2=Xnd and X3=Xmj. Then our
function will have the following form,
Y = a0 + a1Xp + a2Xnd + a3Xmj + e (1.64)
STATISTICAL METHODS
Descriptive statistics, mean and standard
deviation were tabulated using SPSS 16.0
software.
RESULTS
Based on official data of INSTAT and the
values of travel according to the matrix
O/D we have benefited Table 4. To obtain
the mathematical form of the model for
interurban travel in national scale have
applied software SPSS, where we have the
following results and linear form of
mathematical model of inter urban
travel. According to the results of software
and the taken coefficients interurban travel
modeling has the form of general equation
as follows,
Y=1003.578–0.029Xp+1.68Xnd+0.632Xmj
(1.7)
Based on the above model we calculated
the values of the function “Y“ for 22
centering (cities) and the results are given

Shkelqim Gjevori CONSTRUCTION OF THE MATHEMATICAL MODEL FOR EVALUATION AND FORECAST OF
INTERURBAN PASSENGERS TRAVEL
Int J Cur Res Rev, Sept 2012 / Vol 04 (17) ,
Page 133
in table 5. In this case, model rejected by
the negative value of coefficient a1 = -0.029
variable that is before "Xp" which is
impossible, because it is in confrontation to
the generation theory and trips attraction
which estimate that the population is the
community of variables that
affect positively in increasing the travel.
This discrepancy is due to multicorelation
among the selected variables by our side
with the desire to include as many variables
in the modeling of travel. To continue to the
realization of the goal of work shall exclude
the variable "Xp" from the table 5 above and
would appreciate the dependence of travels
with two other variables “Xmj,& Xnd”.
Besides the elimination of population
variables we have increased the number of
zone (cities) to have an even greater
representation of spatial interaction. To
obtain the mathematical form of model for
generation interurban trips (table 5) in
nationally scale we have applied again
software SPSS, where we get the following
results and linear form of mathematical
model of generating interurban travel. (table
6,7)
DISCUSSION
According to the results of software and
coefficients of Table 7, are,
a0 = - 329.479; a1= 1.315; a2= 0.535; (1.8)
and interurban travel modeling generation
has the form of general equation as follows
Ygj = - 329.4+1.315*Xnd+ 0.535*Xmj (1.9)
Regarding the reliability of function (1.9)
we halted in the analysis of some
parameters that are evaluated by software
through ANOVA (analysis of variation).
From the results of tables 6 and 7 we see
that the coefficient of determination is
R2=0.97 or 97%, which highlights the
extent of variation of the “Y” from two
variables “Xmj,&Xnd” and from statistical
theory is considered as a criterion to judge
objectively on the quality of the model
because it is the indicator of the degree of
approximation of “Y and Xi” likewise, “R”
corrected (adjusted R Square) and "R"
Multiple, have very high values that attests
to a strong correlation between independent
variables and dependent variable.
The data results of Table ANOVA according
the table OUTPUT SUMMARY results that
Significance F=1.45705E-20 is less
than 05.0 so we are within a specified
condition, while the validity coefficient
(importance) to the 05.0 According the
values of table I the book of Statistics) we
have that probability of regression
coefficient at the variable “Xnd" is 90% as
the P-value=0:06, while the probability of
the coefficient of regression at the variable
"Xmj" is 95% as the P-value =0007 so many
good values which estimate the model of
"construction". Above model parameters
carry a significant meaning so the
regression parameter a1=1.315 before
variable "Xnd" indicates that when the
number of enterprises increased by 1% the
number of trips generated will increase by
1.31% while for the regression parameter
a2=0.535 before variable "Xmj" it shows that
when the number of vehicles increased by
1% the number of trips generated will be
increased by 0535%. Regarding the
parameter a0 = - 329.479 in general have no
much sense and requires great care in
interpretation.
CONCLUSION
The Design of a model for the evaluation of
interurban trips will help decision makers
in policy planning, management and
investment in the transport field.

Shkelqim Gjevori CONSTRUCTION OF THE MATHEMATICAL MODEL FOR EVALUATION AND FORECAST OF
INTERURBAN PASSENGERS TRAVEL
Int J Cur Res Rev, Sept 2012 / Vol 04 (17) ,
Page 134
ACKNOWLEDGEMENT
I thank the staff of the Institute of Transport
for the support given in data-base as well as
colleagues of the Faculty of Mechanical
Engineering, Polytechnic University of
Tirana. Also thank the authors and co-
authors for the literature that was useful in
this publication. Authors acknowledge the
immense help received from the scholars
whose articles are cited and included in the
references of this manuscript.
REFERENCES
1. John P. Sammon, Robert J. Caverly
2007. Transportation Systems.
2. Josef Sussman 2005. Introduction to
Transportation System.
3. Kumares C. Sinha, Samuel Labi. 2007.
Transportation Decision Making.
4. Avishai Ceder 2007. Public Transport
Planning and Oparation.
5. C.S. Papacostas. P.D. Prevedours 2005.
Transportation Engineering and
Planning.
6. Prof.Dr. Myslym Osmani. 2005
Statistics.
7. Louis Berger. S.p.a. 2009. Albania
National Transport Plan.
8. INSTAT 2009. Indicators by
Prefectures.
9. Peter R. Stopher. Arnim H. Meyburg.
Urban Transportation Modeling and
Planning. 1975
10. Michael D. Meyer, Eric J. Miller. 2001
Urban Transportation Planning; a
decision-oriented approach.
11. Susan Hanson. The geography of urban
transportation. Aug 6. 2004
12. Ryuichi Kitamura, Satoshi Fujii, and
Eric I. Pas. Time-use data analysis and
modeling: toward the next generation of
transportation planning methodologies.
1997.
13. David A.Hensher, Kenneth J.Button.
2000. Handbook of Transport
Modelling.

Shkelqim Gjevori CONSTRUCTION OF THE MATHEMATICAL MODEL FOR EVALUATION AND FORECAST OF
INTERURBAN PASSENGERS TRAVEL
Int J Cur Res Rev, Sept 2012 / Vol 04 (17) ,
Page 135
TABLES
TABELA 1. TRAVELS O/D DEPENDING ON THE POPULATION VARIABLE. (XP)
Destination
cities
population
“Xp”
The cities of origin
Tirana Durresi Fieri Elbasani Vlora
Travels O/D
Berat 127837 2768 721 450 62 827
Durrës 181662 15230 - 1155 1225 626
Elbasan 221635 4224 1150 640 - 681
Fier 199082 3850 1100 - 1050 3560
Korcë 142909 4046 427 73 583 177
Lezhë 67734 2118 171 75 15 50
Shkodër 185395 2247 532 82 54 79
Tiranë 519720 - 14097 4191 4583 3694
Vlorë 147128 4377 565 2045 404 -
TABLE 1/1 RESULTS OF APPLICATION OF SOFTWARE. JOURNEYS IN THE FUNCTION OF THE
POPULATION ORIGINATING FROM ELBASAN.
cities TT
(pop)
UP
(O/D)
YP
(legality)
BR 127837 62 371
DR 181662 1225 696
FR 199082 1050 820
KO 142909 583 453
LE 67734 15 119
SH 185395 54 722
TR 519720 4583 4573
VL 147128 404 477

Shkelqim Gjevori CONSTRUCTION OF THE MATHEMATICAL MODEL FOR EVALUATION AND FORECAST OF
INTERURBAN PASSENGERS TRAVEL
Int J Cur Res Rev, Sept 2012 / Vol 04 (17) ,
Page 136
TABELA 2. VARIABEL AND CORELATION’S COEFFICIENT.
City of origin
V A R I A B E L
AND CORRELATION’S COEFFICIENT
Xp Xmj Xnd Xfa Xpu
Correlation coefficients
Elbasan 0.94 0.95 0.98 0.91 0.98
Durrës 0.98 0.99 0.99 0.94 0.99
Fier 0.77 0.80 0.83 0.67 0.79
Vlorë 0.52 0.44 0.58 0.66 0.50
Tirane 0.95 0.80 0.59 0.99 0.89
TABLE 3. TRAVEL INCREASE BY SIMULATION 10 % OF “ XP”
Cities of Travel Origine
TIRANA ELBASAN FIER VLORE
Travel
increase in %
Travel
increase in %
Travel
increase in %
Travel
increase in %
Cities of Travel Destinations
BR 21 BR 18.6 BR 16.3 BR 12.6
DR 21 DR 18.6 DR 16.3 DR 12.6
EL 21 FR 18.6 EL 16.3 EL 12.6
FR 21 KO 18.6 KO 16.3 FR 12.6
KO 21 LE 18.6 LE 16.3 KO12.6
LE 21 SH 18.6 SH 16.3 LE 12.6
SH 21 TR 18.6 TR 16.3 SH 12.6
VL 21 VL 18.6 VL 16.3 TR 12.6
TABLE 4. REAL TRAVELS ACCORDING TO 3 VARIABLES.
No.
Cities Xp Xnd Xmj
O/D
Real travels
1) Tirana 519720 19363 72925 63922
2) Durres 181662 6058 19721 25222
3) Kavaje 78179 1683 4430 6296
4) Kruje 63517 455 5641 5837
5) Elbasan 221635 3422 14594 8390
6) Peqin 32964 267 1170 534
7) Fier 199082 3906 12449 9423
8) Vlore 147128 3947 12143 11574
9) Lushnje 143933 2120 5611 4069
10) Shkoder 185395 1582 13972 4964
11) Sarande 35089 433 3221 1809
12) Lezhe 67734 550 4085 3236
13) Lac 54392 480 3706 3562
14) Korce 124870 3245 11016 5367
15) Pogradec 70471 578 2846 1359
16) Librazhd 72387 131 1081 870

Shkelqim Gjevori CONSTRUCTION OF THE MATHEMATICAL MODEL FOR EVALUATION AND FORECAST OF
INTERURBAN PASSENGERS TRAVEL
Int J Cur Res Rev, Sept 2012 / Vol 04 (17) ,
Page 137
17) Erseke 17161 224 682 393
18) Kukes 102037 344 2443 1287
19) Gjirokaster 54647 1327 4713 1756
20) Tepelene 32404 141 1241 1077
21) Permet 25780 168 924 429
22) Diber 132546 723 4039 1048
TABLE 5. THE VALUES OF THE FUNCTION FOR LEGALITY OF TRAVELS “Y’
AND REAL TRAVELS “Y”
a0
a1
Xp
b1
Xnd
c1
Xmj
Legality
of travels
(Y) O/D
Real
travels
O/D (Y)
City
1003.578 0.029 519720 1.68 19363 0.632 72925 64550 63922 TR
1003.578 0.029 181662 1.68 6058 0.632 19721 18376 25222 DR
1003.578 0.029 78179 1.68 1683 0.632 4430 4363 6296 KJ
1003.578 0.029 63517 1.68 455 0.632 5641 3491 5837 KR
1003.578 0.029 221635 1.68 3422 0.632 14594 9548 8390 EL
1003.578 0.029 32964 1.68 267 0.632 1170 1235 534 PE
1003.578 0.029 199082 1.68 3906 0.632 12449 9660 9423 FR
1003.578 0.029 147128 1.68 3947 0.632 12143 11042 11574 VL
1003.578 0.029 143933 1.68 2120 0.632 5611 3937 4069 LU
1003.578 0.029 185395 1.68 1582 0.632 13972 7115 4964 SH
1003.578 0.029 35089 1.68 433 0.632 3221 2749 1809 SR
1003.578 0.029 67734 1.68 550 0.632 4085 2545 3236 LE
1003.578 0.029 54392 1.68 480 0.632 3706 2574 3562 LA
1003.578 0.029 124870 1.68 3245 0.632 11016 9796 5367 KO
1003.578 0.029 70471 1.68 578 0.632 2846 1729 1359 PG
1003.578 0.029 61234 1.68 131 0.632 1081 131 870 LB
1003.578 0.029 17161 1.68 224 0.632 682 1313 393 ER
1003.578 0.029 102037 1.68 344 0.632 2443 166 1287 KU
1003.578 0.029 54647 1.68 1327 0.632 4713 4626 1756 GJ
1003.578 0.029 32404 1.68 141 0.632 1241 1085 1077 TP
1003.578 0.029 25780 1.68 168 0.632 924 1122 429 PR
1003.578 0.029 132546 1.68 723 0.632 4039 927 1048 DI
Table 6
SUMMARY OUTPUT
Regression Statistics
Multiple R 0.9888221
R Square 0.97776914
Adjusted R Square 0.97591657
Standard Error 1959.44908
Observations 27

Shkelqim Gjevori CONSTRUCTION OF THE MATHEMATICAL MODEL FOR EVALUATION AND FORECAST OF
INTERURBAN PASSENGERS TRAVEL
Int J Cur Res Rev, Sept 2012 / Vol 04 (17) ,
Page 138
Table 7
ANOVA
df SS MS F
Significance
F
Regression 2 4052837796 2026418898 527.79013 1.45705E-20
Residual 24 92146576.44 3839440.68
Total 26 4144984373
Coefficients
Standard
Error t Stat P-value Lower 95%
Intercept
- 329.4979926 429.6622815 -0.7668767 0.4506332 1216.277351
Xnd 1.31581788 0.677392307 1.94247538 0.0639025 0.082251118
Xmj 0.535742204 0.183371013 2.92162973 0.0074701 0.157283036

Suresh sukumar et al. INFECTION RISK CONTROL IN “COMPUTER RADIOGRAPHY IMAGING PLATE” IN
DIAGNOSTIC RADIOLOGY DEPARTMENT
Int J Cur Res Rev, Sept 2012 / Vol 04 (17) ,
Page 139
IJCRR
Vol 04 issue 17
Section: Healthcare
Category: Research
Received on: 03/07/12
Revised on: 02/08/12
Accepted on: 12/08/12
INFECTION RISK CONTROL IN “COMPUTER RADIOGRAPHY
IMAGING PLATE” IN DIAGNOSTIC RADIOLOGY DEPARTMENT
Suresh sukumar, Sushil Yadav
Department of Medical Imaging Technology, Manipal College of Allied
Health Sciences, Manipal University, Manipal, KA, India
Email of corresponding author: [email protected]
ABSTRACT
This study was carried out in order to establish whether infection control measures we’re being
undertaken sufficiently on Computer Radiography Imaging Plate (CRIP) used in Radio
Diagnosis and Imaging Department of our medical college. CRIP is used to obtain the take
computerised radiographic image. This study involved the swabbing of a sample of CRIP used
within different areas of the department. Swabs were taken from the area on the corners and the
centre of the plate. Each plate was firstly swabbed to determine the current level of
microorganism contamination (determination of baseline data) and then again after
recommended cleaning. Comparisons were then made between the number of microorganisms’
present (colony forming units/cm2) pre and post-cleaning at each location. All CRIP were found
to be contaminated with microorganisms. Methylated spirit used in the practice of medicine,
with water and soap is used to clean the CRIP was found to be significantly reduce the amount
of microorganisms present. The results suggest that the All CRIP were not being cleaned
sufficiently which has infection control implications for the department. In order for cross
contamination to be kept to a minimum an effective infection control policy needs to be
employed and this Should be to carry out regular cleaning.
Key word: Infection control, computer Radiography Imaging Plate, Hospital acquired infections,
Radiology Department
INTRODUCTION
Infection within healthcare has been in the
news and has become a high priority
recently, particularly as some infections
are becoming harder to treat. The
resistances of antibiotics and other
antimicrobial agents have been reported on
along with concerns regarding the rise of
methicillin resistant Staphylococcus aureus
(MRSA) (1). Staphylococcus aureus is one
of the most common of all bacteria and can
cause superficial infections of the skin and
serious infections (2).Epidemic strains
exist, which spread easily from person to
person and can cause ward closure and
disrupt hospital services (3). Infection
control in hospitals is concerned with
decontamination; this prevents
microorganisms reaching a susceptible site
in sufficient quantities to cause infection or
potential harm to patients (4). Hospitals
can become contaminated with organic
matter and potentially infectious organisms
and a safe environment can only be
achieved by decontamination in the form
of cleaning, disinfection and sterilization,
breaking the chain of infection (5). A
major reason for the importance of
infection control is to prevent the
occurrence of Nosocomial or Hospital
Acquired Infections. These are infections
that occur during a patient’s stay in

Suresh sukumar et al. INFECTION RISK CONTROL IN “COMPUTER RADIOGRAPHY IMAGING PLATE” IN
DIAGNOSTIC RADIOLOGY DEPARTMENT
Int J Cur Res Rev, Sept 2012 / Vol 04 (17) ,
Page 140
hospital which were not present or
incubating at the time of admission (2). In
contrast to community acquired infections
these infections usually occur as a result of
pathogens taking advantage of patients
whose normal defences against infection
are contravened (2).
AIM
To establish whether CR plate can become
contaminated with microorganisms and
become a potential reservoir for cross
infection and if simple, regular cleaning
can significantly reduce this cross
infection risk
Objectives
1. To determine whether there is currently
a detectable Presence of
microorganisms on a sample of CRIP
2. To determine any presence of
microorganisms after recommended
cleaning (methylated spirit used in the
practice of medicine with water and
soap is used to clean the CRIP).
3. To evaluate the findings and make
suggestions for future practice,
including recommendations for re-audit.
METHOD
20 CRIP were swabbed, from Different
areas within the Radiology department.
These included general X-ray rooms for
inpatients (room number 1, room number
2, and room number 3) and outpatient’s
room. Randomisation of the sample was
not practical, as it was necessary to
ascertain data from each area. It was
possible to swab all of CRIP from general
X-ray rooms for in-patients (room number
1, room number 2, and rom number 3) and
outpatients. Swabbing was carried out with
Tryptic Soy Agar contact plates which are
used to sample flat surfaces of equipment.
They consist of a domed surface which is
placed gently upon the area causing any
microorganisms to be transferred onto the
agar (10) (13). The plates were taken to the
microbiology laboratory for culturing. The
current level of microorganism
contamination on the sample CRIP is
known as baseline data. Following the
collection of baseline data, each CRIP in
the sample was cleaned according to
recommended guidelines and swabbing
was repeated. Data collected from this part
of the audit was to identify a standard to
compare to future practice and any future
infection control carried out on CRIP
After the data is collected the presence and
absence of infection is mentioned as
presence in CRIP and absence in CRIP.
RESULT
From this work all CRIP pre cleaning were
contaminated with microorganisms. Table
shows pre and post-cleaning results for
location general X-ray rooms for in-
patients (room number 1, room number 2,
rom number 3) and out-patients x ray
room. Post-cleaning data demonstrates that
on most of the CRIP the number of colony
forming units was reduced after cleaning.
All plates were inspected by microbiology
staff to identify the range of
microorganisms present. Species of
microorganisms found across the samples
included most significantly Gram positive
cocci in the form of Staphylococci, both
coagulases positive and negative.
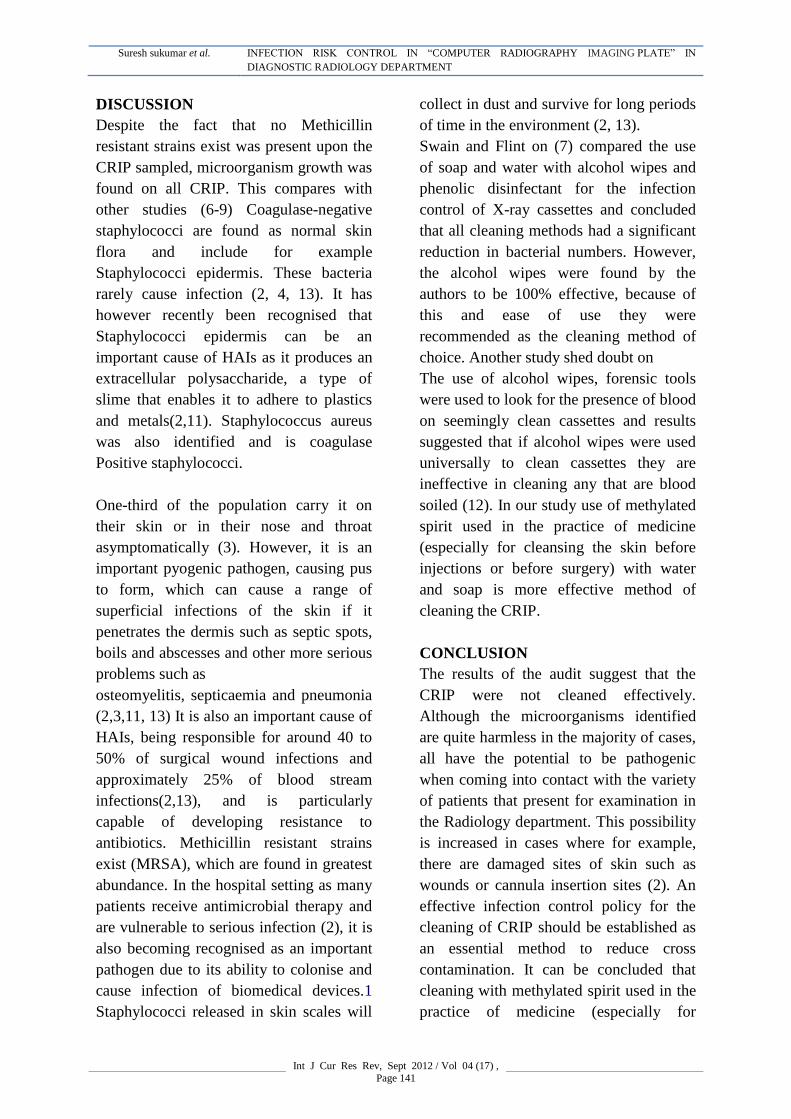
Suresh sukumar et al. INFECTION RISK CONTROL IN “COMPUTER RADIOGRAPHY IMAGING PLATE” IN
DIAGNOSTIC RADIOLOGY DEPARTMENT
Int J Cur Res Rev, Sept 2012 / Vol 04 (17) ,
Page 141
DISCUSSION
Despite the fact that no Methicillin
resistant strains exist was present upon the
CRIP sampled, microorganism growth was
found on all CRIP. This compares with
other studies (6-9) Coagulase-negative
staphylococci are found as normal skin
flora and include for example
Staphylococci epidermis. These bacteria
rarely cause infection (2, 4, 13). It has
however recently been recognised that
Staphylococci epidermis can be an
important cause of HAIs as it produces an
extracellular polysaccharide, a type of
slime that enables it to adhere to plastics
and metals(2,11). Staphylococcus aureus
was also identified and is coagulase
Positive staphylococci.
One-third of the population carry it on
their skin or in their nose and throat
asymptomatically (3). However, it is an
important pyogenic pathogen, causing pus
to form, which can cause a range of
superficial infections of the skin if it
penetrates the dermis such as septic spots,
boils and abscesses and other more serious
problems such as
osteomyelitis, septicaemia and pneumonia
(2,3,11, 13) It is also an important cause of
HAIs, being responsible for around 40 to
50% of surgical wound infections and
approximately 25% of blood stream
infections(2,13), and is particularly
capable of developing resistance to
antibiotics. Methicillin resistant strains
exist (MRSA), which are found in greatest
abundance. In the hospital setting as many
patients receive antimicrobial therapy and
are vulnerable to serious infection (2), it is
also becoming recognised as an important
pathogen due to its ability to colonise and
cause infection of biomedical devices.1
Staphylococci released in skin scales will
collect in dust and survive for long periods
of time in the environment (2, 13).
Swain and Flint on (7) compared the use
of soap and water with alcohol wipes and
phenolic disinfectant for the infection
control of X-ray cassettes and concluded
that all cleaning methods had a significant
reduction in bacterial numbers. However,
the alcohol wipes were found by the
authors to be 100% effective, because of
this and ease of use they were
recommended as the cleaning method of
choice. Another study shed doubt on
The use of alcohol wipes, forensic tools
were used to look for the presence of blood
on seemingly clean cassettes and results
suggested that if alcohol wipes were used
universally to clean cassettes they are
ineffective in cleaning any that are blood
soiled (12). In our study use of methylated
spirit used in the practice of medicine
(especially for cleansing the skin before
injections or before surgery) with water
and soap is more effective method of
cleaning the CRIP.
CONCLUSION
The results of the audit suggest that the
CRIP were not cleaned effectively.
Although the microorganisms identified
are quite harmless in the majority of cases,
all have the potential to be pathogenic
when coming into contact with the variety
of patients that present for examination in
the Radiology department. This possibility
is increased in cases where for example,
there are damaged sites of skin such as
wounds or cannula insertion sites (2). An
effective infection control policy for the
cleaning of CRIP should be established as
an essential method to reduce cross
contamination. It can be concluded that
cleaning with methylated spirit used in the
practice of medicine (especially for

Suresh sukumar et al. INFECTION RISK CONTROL IN “COMPUTER RADIOGRAPHY IMAGING PLATE” IN
DIAGNOSTIC RADIOLOGY DEPARTMENT
Int J Cur Res Rev, Sept 2012 / Vol 04 (17) ,
Page 142
cleansing the skin before injections or
before surgery) with water and soap is
more effective method of cleaning CRIP
can significantly reduce the number of
microorganisms present and it should be
carried out routinely.
ACKNOWLEDGEMENT
Author acknowledges the immense help
received from the scholars whose articles
are cited and included in references of this
manuscript. The authors are also grateful
to authors / editors /publishers of all those
articles, journals and books from where the
literature for this article has been reviewed
and discussed. The author is highly
thankful to the referees for their very
constructive, valuable suggestions and
useful technical comments, which led to a
significant improvement of the paper.
REFERENCES
1. National Audit Office. The
Management and control of hospital
Acquired infection in acute NHS trusts
in England. London:National Audit
Office; 2000.
2. Wilson J. In: Infection control in
clinical practice. 3rd Ed. Edinburgh:
Elsevier Limited; 2006.
3. Gould D, Brooker C. Applied
Microbiology for Nurses. Basingstoke:
Macmillan Press Limited; 2000
4. McCulloch J, editor. Infection control,
science, management And practice.
London: Whurr Publishers; 2000.
5. Horton R, Parker L. In: Informed
infection control practice. 2nd ed.
Edinburgh: Churchill Livingstone;
2002.
6. Fox M, Harvey J. An investigation of
infection control for X-ray Cassettes in
a Diagnostic Imaging Department.
Radiography 2008; 14:306e11.
7. Swain JA, Flinton DM. X-ray cassettes:
a potential crossinfection Risk? Journal
of Diagnostic Radiography and Imaging
2000; 3:121e5.
8. Smith A, Lodge T. Can radiographic
equipment be contaminated?By micro-
organisms to become a reservoir for
cross Infection? Synergy 2004; Dec:
12e7.
9. Hodges A. Radiographic markers:
friend or fomite? Radiologic
Technology 2001; 73:183e5.
10. Booth C. Microbe monitoring.
Cleanroom Technology 2006; Oct:
18e20.
11. Meers P, Sedgwick J, Worsley M. The
microbiology and epidemiology of
infection for health science students.
London: Chapman and Hall; 1995
12. Study on blood contamination reveals
disturbing results. Society of
Radiographers. Available from:
www.sor.org/members/snnarchive/SNR
Aug03p07.pdf; 2003 [accessed
16/04/09].
13. ‘‘Do lead rubber aprons pose an
infection risk?’’ Helen Boyle, Ruth M.
Strudwick (2010)

Suresh sukumar et al. INFECTION RISK CONTROL IN “COMPUTER RADIOGRAPHY IMAGING PLATE” IN
DIAGNOSTIC RADIOLOGY DEPARTMENT
Int J Cur Res Rev, Sept 2012 / Vol 04 (17) ,
Page 143
Table 1: The situation of all the CRIP used in the study.
Room
number
Number
of
cassette
Before cleaning – presence of infection After cleaning – presence of infection
Room
number – 1
(inpatients)
4 Increase number of microorganisms (colony forming
units/cm2)
(CRIP - 1 to 4)
Absent of microorganisms (colony forming
units/cm2) in 1 CRIP and decrease in number
of microorganisms’ present (colony forming
units/cm2) in 3 CRIP Absent – CRIP -4
Decrease – CRIP – 1st ,2nd and 3rd
Room
number – 2
(inpatients)
4 Increase number of microorganisms (colony forming units/cm2) (CRIP - 5 to 8)
decrease in number of microorganisms’ (colony forming units/cm2) in 4 CRIP
Decrease – CRIP – 5th ,6th ,7th and 8th
Room
number – 3
(inpatients)
5 Increase number of microorganisms (colony forming units/cm2)
(CRIP - 9 to 13)
Absent of microorganisms (colony forming
units/cm2) in 2 CRIP and decrease in number
of microorganisms (colony forming units/cm2) in 3 CRIP
Absent – CRIP -10th and 11th
Decrease – CRIP – 9th ,12th and 13th
Out patients 7 Increase number of microorganisms (colony forming
units/cm2)
(CRIP - 14 to 20)
Absent of microorganisms (colony forming
units/cm2) in 5 CRIP and decrease in number of microorganisms (colony forming units/cm2)
in 2 CRIP
Absent – CRIP -15th ,16th ,18th ,19th and 20th Decrease – CRIP – 14th and 17th
Table 2:- The situation of all the CRIP used in the study
Room number CRIP
Room number 1 (inpatients) CRIP - 1st to 4
th
Room number 2 (inpatients) CRIP - 5th to 8
th
Room number 3(inpatients) CPIP – 9th to 13
th
Out patients room CRIP – 14th to 20
th

Sushil Kumar Tiwari et al STRESS ANALYSIS OF SPUR GEAR USING FINITE ELEMENT METHOD – A REVIEW
Int J Cur Res Rev, Sept 2012 / Vol 04 (17) , Page 144
IJCRR
Vol 04 issue 17
Section: Technology
Category: Review
Received on: 10/06/12
Revised on: 23/07/12
Accepted on: 11/08/12
STRESS ANALYSIS OF SPUR GEAR USING FINITE ELEMENT
METHOD – A REVIEW
Sushil Kumar Tiwari, Upendra Kumar Joshi
Department of Mechanical Engineering JEC Jabalpur (M.P.) India
Email of corresponding author: [email protected]
ABSTRACT
The basic aim of this review paper is to provide the information for calculating the stresses of an
involute gear in meshing. Gears are critical component in the rotating machinery. The
researchers throughout the years had given various research methods such as Theoretical,
Numerical and Experimental. We prefer the Theoretical and Numerical methods because
Experimental testing can be expensive. This study says Finite Element Method is the best
numerical solution for calculating gear stress.
Key words: Spur Gear, Stress Calculation, Bending Stress, Hertz Stress, Finite Element Method.
INTRODUCTION
Gears are use to transmit power and
motion from one shaft to another. Spur
gear is cylindrical in form and has teeth,
which are of involute form in most cases.
The tooth surface elements are parallel to
the gear axis. Each gear tooth may
consider as a cantilever beam. When it
transmits the load, it subjected to bending.
The bending stress is highest at the fillet
and can caused breakage or fatigue failure
of tooth in root region, whereas contact
stresses are on the both side of the tooth
may causes Scoring Wear, Bending and
Pitting fatigue.[1]
Pitting fatigue is a compressive fatigue
occurring at the point of maximum
Hertzian stress. Gear stresses are affected
by surface hardness, carbon content,
metallurgical structure and lubrication
condition. Gear tooth strength is the ability
to resist tooth breakage and the ability to
resist pitting is referred as durability.[1] To
calculating bending stress, Lewis Formula
is used, and for calculating contact stress
Hertz equation can be applied in spur
gear.[2]
BENDING STRESS (LEWIS
FORMULA) [1]
A gear tooth is essentially a stubby
cantilever beam. At the base of the beam,
there is tensile stress on the loaded side
and compressive stress on the opposite
side. The ability of gear tooth to resist
tooth breakage usually referred to as their
‘Beam Strength’. Wilfred Lewis accurately
calculated this in 1893; he conceived the
idea of inscribing a parabola of uniform
strength inside a gear tooth.

Sushil Kumar Tiwari et al STRESS ANALYSIS OF SPUR GEAR USING FINITE ELEMENT METHOD – A REVIEW
Int J Cur Res Rev, Sept 2012 / Vol 04 (17) , Page 145
Figure (1) shows a rectangular cantilever beam. The stress at the root of this beam given by,
------------------
(1)
If we substitute a gear tooth for the rectangular beam, we can find the critical point in the root
fillet of the gear by inscribing a parabola.
Now, from figure (3) and, from equation (1)
Where, Wt = Transmitted Load (Newton)
F = Face width (m or mm)
m = Module (m or mm) and, Y = Lewis form Factor.
Y is the function of number of teeth, pressure angle and an involute depth of the gear, and the
value of
It is a fact that when teeth mesh, the load is delivered to the teeth with some degree of impact.
To calculate bending stress, the velocity factor must be used in calculation. In the case of cut
or milled profile gears, using Barth equation, [2]
The velocity factor, (Where, V is the Pitch Line Velocity)
And,
Where, n= r.p.m and, d= Pitch diameter of Gear or Pinion (mm)
Now Lewis equation becomes,
--------------- (2)

Sushil Kumar Tiwari et al STRESS ANALYSIS OF SPUR GEAR USING FINITE ELEMENT METHOD – A REVIEW
Int J Cur Res Rev, Sept 2012 / Vol 04 (17) , Page 146
CONTACT STRESS (HERTZ EQUATION) [1] Following Figure (4) shows the stresses in the region of tooth contact.
In the centre of the band, there is a point of
maximum compressive stress. Directly
underneath this point, there is a maximum
subsurface shear stress.
Just ahead of the band of contact, there is a
narrow band of the compression and just
behind the band of contact; there is a
narrow region of tensile stress.
A bit of metal on the surface of a gear
tooth goes through a cycle of compression
and tension each time, when a mating gear
tooth passes over it. If gear tooth loaded
heavily enough, and there will usually be
evidence of both surface cracks and plastic
flow on the contacting surface, and there
may be a rupturing of the metal due to
surface shear stresses.
The stress on the surface of gear teeth are
usually determined by formula derived
from the work of H. Hertz’s; and these
stresses are termed as Hertz stress. Hertz
determined the width of the contact band
and the stress pattern when various
geometric shapes were loaded against each
other. Considering figure (5),

Sushil Kumar Tiwari et al STRESS ANALYSIS OF SPUR GEAR USING FINITE ELEMENT METHOD – A REVIEW
Int J Cur Res Rev, Sept 2012 / Vol 04 (17) , Page 147
Where, W = applied force
L = length of cylinders
B = width of the band of contact
The Hertz formula for the width of the band of contact is,
Where,
K1 = and, K2 =
1, 2 = Possion’s Ratio, and, E1, E2 = Modulus of Elasticity,
Now, the maximum compressive stress is,
Putting the value of B, and = 0.3
Above Hertz formula can be applied to Spur Gears quite easily by considering that the
contact condition of gears are equivalent to those of cylinders having the same radius of
curvature at the point of contact as the gear have. Ali Raad Hassan [8] presented formula for
calculating Hertz equation for contact stresses in the pair of mating spur gear teeth. As figure
(6)

Sushil Kumar Tiwari et al STRESS ANALYSIS OF SPUR GEAR USING FINITE ELEMENT METHOD – A REVIEW
Int J Cur Res Rev, Sept 2012 / Vol 04 (17) , Page 148
Assuming R1 and R2 are as the respective radius of the involute curve at the contact point.
Thus and,
Now the Hertz equation for contact stresses in the teeth becomes,
-------------- (3)
Where and are the pitch radius of
the Pinion and Gear respectively and is
the pressure angle. Equations (2) and (3)
are use for quick calculation of Bending
and Contact stress of a pair of mating gear
efficiently. American Gear Manufacture
Association (AGMA) provides the
standard equations for calculating bending
and contact stresses for a pair of mating
gear including various factors.
Following literature review gives a lot of
information about stress calculation based
on Lewis formula, Hertz theory,
AGMA/ANSI (American National
Standards Institute) equations and Finite
Element Method.
LITERATURE REVIEW
Shuting Li (2002) researcher, performed
loaded tooth contact analysis of a three
dimensional, thin-rimed gear by presenting
a method that combines the Mathematical
Programming Method (MPM) with the 3-
dimentional finite element method and
compare the results with experiment. and
concluded that FEM with MPM efficiently
calculates bending stress in gears.[3]
Andrzej Kawalec (2006) author gives
comparative study of tooth-root strength
evaluation methods used within
International Standard Organization (ISO)
and AGMA standards then verifying them
with Finite Element method. The results
allow for a better understanding of existing
limitation in the current standards applied
in engineering practice as well as provide a
basis for future improvement of gear
standard.[4]
Jose I. Pedrero (2007) researcher used a
nonuniform model of load distribution
along the line of contact. He says if the
load is, assume to be uniformly distributed
along the line of contact, simple equations
given by the linear theory of elasticity and
the Hertzian contact model are not good
agreement with experimental results. In

Sushil Kumar Tiwari et al STRESS ANALYSIS OF SPUR GEAR USING FINITE ELEMENT METHOD – A REVIEW
Int J Cur Res Rev, Sept 2012 / Vol 04 (17) , Page 149
this paper a non uniform model has been
considered for stress analysis at contact
ratio 2 and 2.5, and concluded that,
1) The critical tooth-root stress
corresponds to contact at the inner
point of the outer interval of the two
pair tooth contact, and teeth loaded
60% of total transmitted load.
2) The critical contact stress corresponds
to either one of the three following
condition.
(a) Contact at the inner point of contact
and teeth loaded with 25% of the total
transmitted load.
(b) Contact at the inner point of the two
pair tooth contact and teeth loaded
with 40% of the total transmitted load.
(c) Contact at the outer point of the inner
interval of the two pair tooth contact,
and teeth loaded with 60% of the total
transmitted load.[5]
Shuting Li (2007) researcher presented 3-
Dimentional Finite Element Method to
conduct Surface contact stress (SCS) and
Root bending stress (RBS) calculations for
a pair of spur gear with Machining Error
(ME), Assembly Error (AE) and Tooth
Modification(TM). Moreover, found that
ME, AE and TM exerts great effects on
SCS and RBS of the gear. Results obtained
by International Standard Organization
(ISO) and Japan Gear Manufacturing
Association (JGMA) standards are
comparing with result of Finite Element
Analysis. [6]
Shuting Li (2008) researcher investigates
the effect of addendum modification on
contact strength, bending strength and
basic performance parameters of spur gear.
A face contact model of teeth and MPM
and 3D finite element methods are used
together to conduct loaded tooth contact
analysis. He concluded that Hertz formula
is not exact enough for the contact stress
calculation because in engagement
position the contact point is for away from
the pitch point, also Hertz formula cannot
be use for contact stress calculation of the
gear at Tip or Root contact. Contact stress
and contact width are changed slightly if
addendum becomes longer and number of
teeth is not changed.[7]
Ali Raad Hassan (2009) author is
analysed contact stress between two spur
gear teeth in different contact position,
between 0º to 30º. Start with an angle of 0º
and end at 30º with an interval of 3º with
corresponding length of contact and
contact ratio. and found that a highest
value of contact stress is at beginning of
contact and then starts reducing until it
reaches the location of single tooth
contact. Result obtained by finite element
analysis is compare with theoretical value
which is found at geometrical contact
point.[8]
Rubin D. Chacon (2010) researcher
analysed the contact stress between spur
gear teeth using a plane model and validate
Hertz stress and AGMA contact stress
with finite element contact stress. Then
concluded that FEM is able to simulate
contact stress in a pair of mating gear, the
contact stress is highest at higher point on
the involute and lower at a single pair of
teeth. Assume the full load transmitted and
minimal at the pitch point of contact.[9]
Konstandinos G. Raptis, (2010) author
performed photo-elasticity test to
determine stresses in a pair of mating gear.
Obtained experimental results were
comparing with the theoretical value of
maximum stress at gear tooth root (when
tooth is loaded at their most unfavorable
contact point i.e. highest point of single

Sushil Kumar Tiwari et al STRESS ANALYSIS OF SPUR GEAR USING FINITE ELEMENT METHOD – A REVIEW
Int J Cur Res Rev, Sept 2012 / Vol 04 (17) , Page 150
tooth contact). Then concluded that the
result obtained by the applied method is in
reasonable value whereas it rises with
increasing number of teeth on the large
gear.[10]
Wei Yangang,(2010) author provided a
theoretical procedure for obtaining
maximum contact stress at different point
in meshing under the light of Hertz
formula. and concluded that when the
number of teeth on small gear is smaller
than a certain value, the maximum contact
stress in the meshing process is not
generated in the inner critical point in the
single tooth meshing region of the small
gear.[11]
Xianzhang FENG (2011) author use a
precise model in large-scale CAD software
and define the stress and displacement
field to determine the maximum equivalent
stress and maximum displacement. By
defining the quasi-static characteristic of
finite element model, shows that model
can accurately simulate the distribution of
equivalent stress and displacement change
in the process of teeth meshing. The
results are well agree with the actual
meshing law and not only verify the
correctness of model but also expect to
dynamic analysis of gear.[12]
Ignacio Gonzlez-Peraz (2011) researcher
developed a finite element model and
validate in terms of contact area, pressure
distribution and maximum contact
pressure for those cases where the Hertz
theory can be applied and provide partial
crowning to the finite element model
where Hertz theory do not work properly.
And concluded that analysis results gives
good agreement with Hertz theory for
calculating maximum contact pressure,
contact area, and deflection with minute
errors. [13]
Ali Kamil Jabur, (2011) author
investigates the characteristics of an
involute gear system including contact
stress between a pair of the gear from 3-
dimansional analysis and compared the
result with experimental data.
Experimental setup uses DC servomotor
and mounting the strain gauge in the tooth
of the gear made by Polyimide materials.
and concluded that increasing the spur
gear design parameters (number of teeth
with module) leads to improvement in the
tooth strength and increasing the thickness
of critical section and makes it able to
withstand higher load.[14]
S. Sankar, (2011) author used circular
root fillet instead of standard trochoidal
root fillet in gear. and concluded that the
tooth deflection in the circular root fillet is
less when compared to the trochoidal root
fillet, further there is appreciable reduction
in bending stress and contact shear stress
for circular root fillet design in comparison
to that of trochoidal root fillet design.[15]
Seok- Chul Hwang (2011) author
compared the variation of contact stress
during rotation with contact stress at
Lowest Point of Single Tooth Contact
(LPSTC) and concluded that gear design
that consider the contact stress in a pair of
mating gear is more severe than that of the
AGMA standard.[16]
Massimiliano Pau (2012) researcher
performed a tooth contact analysis, and
contact area, contact pressure using an
ultrasonic experimental setup. The results
provide the information about the size and
shape of the nominal contact area and
contact pressure distribution. He
concluded that the ultrasonic method has
good potential as an effective tool in
investigating contact problem in gear.[17]

Sushil Kumar Tiwari et al STRESS ANALYSIS OF SPUR GEAR USING FINITE ELEMENT METHOD – A REVIEW
Int J Cur Res Rev, Sept 2012 / Vol 04 (17) , Page 151
CONCLUSION
The above literature review presents that
the Finite Element Method is widely used
for stress analysis in a pair of gear. In
addition, FEM software has been use for
performing meshing simulation. Almost in
all of the above cases, contact stress
calculation and Bending Stress calculation
play more significant role in the design of
gear. This study shows that Hertz theory is
the basis of contact stress calculation and
Lewis formula is use for calculating
bending stress in a pair of gear.
Theoretical result obtained by Lewis
formula and Hertz equation and results
found by AGMA/ANSI equations are
comparable with Finite Element Analysis
of spur gear.
REFERENCES 1. Darle W. Dudley, Practical Gear
Design, McGraw-Hill Book Company,
1954
2. Peter R.N. Childs, Mechanical Design,
Second edition, Elsevier Butterworth-
Heinemaan, 2004
3. Shuting Li, ‘Gear Contact Model and
Loaded Tooth Contact Analysis of a
Three-Dimensional Thin-Rimmed
Gear’ Journal of mechanical Design,
ASME, 2002; vol.124/511.
4. Andrzej Kawalec, Jerzy Wiktor,
Dariusz Ceglarek, ‘Comparative
Analysis of Tooth-root Strength Using
ISO and AGMA Standard in Spur and
Helical Gear With FEM-based
Verification’ Journal of mechanical
Design, ASME, 2006; vol. 128/1141.
5. Jose I. Pedrero, Izaskun I.Vallejo,
Miguel Pleguezuelos, ‘Calculation of
Tooth Bending Strength and Surface
Durability of High Transverse Contact
Ratio Spur and Helical Gear Drives’
Journal of mechanical Design, ASME,
2007; vol. 129/69.
6. Shuting Li, ‘Finite Element Analyses
for Contact Strength and bending
Strength of a pair of spur gears with
Machining Errors, Assembly Errors and
Tooth Modifications’ Mechanism and
Machine Theory, Elsevier, 2007; 42:
88-114.
7. Shuting Li, ‘Effect of Addendum on
Contact Strength, Bending Strength and
Basic Performance Parameters of a pair
of Spur Gears’ Mechanism and
Machine Theory, Elsevier, 2008; 430:
1557-1584
8. Ali Raad Hassan,‘Contact Stress
Analysis of Spur Gear Teeth Pair’
WASET 2009; 58
9. Rubin D. Chacon, Luis J. Adueza,
‘Analysis of Stress due to Contact
between Spur Gears’ Wseas.us, 2010
10. Konstandinos G. Raptis,’ Theodore N.
Costopoulos ‘Rating of Spur Gear
Strength using Photo elasticity and the
Finite Element Method’ American
Journal of Engineering and Applied
Sciences, 2010; 3(1): 222-231.
11. Wei Yangang, Zhang Xiujuan, Liu
Yankui, ‘Theoretical research on the
maximum Contact Stress of Involute
spur Cylindrical Gear Pair in the
External Meshing Process’ IEEE,2010
12. Xianzhang FENG, ‘Analysis of field of
Stress and Displacement in process of
Meshing Gears’ vol.5, 2011
13. Ignacio Gonzalez-Perez, Jose L. Iserte,
Alfonso Fuentes, ‘Implementation of
Hertz theory and validation a Finite
Element Model for stress analysis of
gear drives with localized bearing
contact’ Mechanism and Machine
Theory, Elsevier, 2011; 46: 765-783

Sushil Kumar Tiwari et al STRESS ANALYSIS OF SPUR GEAR USING FINITE ELEMENT METHOD – A REVIEW
Int J Cur Res Rev, Sept 2012 / Vol 04 (17) , Page 152
14. Ali Kamil Jebur, L.A.Khan, Y.Nath,
‘Numerical and Experimental Dynamic
Contact of Rotating Spur Gear’
Canadian Center of Science and
Education, Modern Applied Science
vol.5;2011
15. S. Sankar. Muthusamy Natraj, ‘Profile
Modification- A Design approach for
increasing the Tooth Strength in Spur
Gear’ International Journal of Advance
Manufacturing Technology,
Springer,2011; 55: 1-10.
16. Seok-Chul Hwang, Jin-hwan Lee,
‘Contact Stress Analysis for a pair of
Mating Gears’ Mathematics and
computer modelling, Elsevier, 2011
17. Massimiliano Pau,Bruno leban, Antonio
Baldi, Francesco Ginesu, ‘Experimental
Contact pattern Analysis for a Gear-
Rack system’
Meccanica,Springer,2012; 47: 51-61

Somnath Patil et al FORMULATION AND EVALUATION OF XANTHAN GUM BASED FLOATING TABLET OF
TRAMADOL HYDROCHLORIDE
Int J Cur Res Rev, Sept 2012 / Vol 04 (17) ,
Page 153
IJCRR
Vol 04 issue 17
Section: Healthcare
Category: Research
Received on: 13/06/12
Revised on: 23/07/12
Accepted on: 11/08/12
FORMULATION AND EVALUATION OF XANTHAN GUM BASED
FLOATING TABLET OF TRAMADOL HYDROCHLORIDE
Somnath Patil, Swati Jagdale, Shailendra Kela, Varsha Divekar
MAEER’s Maharashtra Institute of Pharmacy, Pune, India.
Email of corresponding author: [email protected]
ABSTRACT
The aim of the present work was to prepare floating tablets of Tramadol HCl (TH) using xanthan
gum as carrier. TH is a centrally acting oral analgesic that blocks pain through opoid receptor
binding and inhibition of nor epinephrine & serotonin reuptake. It has elimination half-life of
about 6 hrs. It has an oral bioavailability of about 70% which is suitable for developing gastro
retentive floating drug delivery system. The formulations were prepared by varying the
concentrations of xanthan gum and sodium bicarbonate. The tablets were prepared by direct
compression technique. Xanthan gum and Hydroxy propyl methyl cellulose (HPMC) were used
as alone and in combination as matrix forming agent and sodium bicarbonate for development of
CO2. The prepared floating tablets were evaluated for tablet properties such as hardness,
thickness, weight variation, floating property. In vitro dissolution was carried out for 8 hrs in
0.1N HCl at 37±0.50C using USP paddle type dissolution apparatus. It was noted that, all the
prepared formulations had desired floating lag time and constantly floated on dissolution
medium by maintaining the matrix integrity. The drug release from prepared tablets was found
to vary with varying concentration of the polymer, xanthan gum and HPMC K4M. From the
study it was concluded that floating drug delivery system can be prepared by using xanthan gum
as a carrier.
Key words: Floating Tablet, HPMC K4M, in- vitro dissolution, Tramadol HCl, Xanthan gum
INTRODUCTION
The real issue in the development of oral
controlled release dosage forms is not just to
prolong the delivery of drugs for more than
12 hours, but to prolong the presence of the
dosage forms in the stomach or upper
gastrointestinal (GI) tract until all the drug is
released for the desire period of time [1]
.
Rapid GI transit could result in incomplete
drug release from the drug delivery device
in the absorption zone leading to diminished
efficacy of the administered dose [2]
. Several
approaches are currently used to retain the
dosage form in the stomach. These include
bio adhesive systems [3]
. swelling and
expanding systems,[4‐5]
floating drug
delivery systems (FDDS),[6‐7]
and other
delayed gastric emptying devices.[8]
FDDS,
also called hydrodynamically balanced
system, is an effective technology to prolong
the gastric residence time in order to
improve the bioavailability of the drug.[9]
This technology is suitable for drugs with an
absorption window in the stomach or in the
upper part of the small intestine,[10]
drugs
acting locally in the stomach,[11]
and for

Somnath Patil et al FORMULATION AND EVALUATION OF XANTHAN GUM BASED FLOATING TABLET OF
TRAMADOL HYDROCHLORIDE
Int J Cur Res Rev, Sept 2012 / Vol 04 (17) ,
Page 154
drugs that are poorly soluble or unstable in
the intestinal fluid.[12]
FDDS have a bulk
density lower than the gastric fluid and thus
remain buoyant in the stomach, without
affecting the gastric emptying rate for a
prolonged period of time. While the system
is floating on the gastric contents, the drug is
released slowly. Based on the mechanism of
buoyancy, two distinctly different
technologies, i.e. noneffervescent and
effervescent systems, have been utilized in
the development of FDDS. The effervescent
system utilizes matrices prepared with
swellable polymers and effervescent
components, e.g. sodium bicarbonate and
citric acid or stearic acid. The matrices are
fabricated such that in the stomach carbon
dioxide is liberated by the acidity of the
gastric contents and is entrapped in the
gellified hydrocolloid. This produces an
upward motion of the dosage form and
maintains its buoyancy. In noneffervescent
FDDS, the drug is mixed with a gel‐forming
hydrocolloid, which swells on contact with
the gastric fluid after oral administration and
maintains relative integrity of shape and a
bulk density of less than unity within an
outer gelatinous barrier. The air trapped by
the swollen polymer confers buoyancy to
these dosage forms. [13‐14]
TH is a centrally acting oral analgesic that
blocks pain through opoid receptor binding
and inhibition of nor epinephrine& serotonin
reuptake. TH is having short plasma half life
6 hrs which is suitable for developing gastro
retentive floating drug delivery system.
MATERIALS AND METHODS
MATERIALS:
Tramadol hydrochloride was provided as a
gift sample from JCPL, Jalgaon and hydroxy
propyl methyl cellulose K4M and xanthan
gum obtained as a gift sample from Vapi
Care Pharma Pvt Ltd. Vapi. Other excipients
and chemicals were of analytical grade and
purchased from Pure Chem. Laboratories,
Pune.
METHOD
Floating tablets containing TH were
prepared by direct compression technique
using variable concentrations of Xanthan
gum and HPMC K4M with sodium
bicarbonate. Different tablets formulations
were prepared by direct compression
technique. All the powders were passed
through 60 mesh sieve. Required quantity of
drug, and low-density polymer were mixed
thoroughly. Magnesium stearate was finally
added as lubricant. The blend was directly
compressed (9mm diameter punches) using
tablet compression machine. Each tablet
contained 100mg of TH and other
pharmaceutical ingredients as listed in
table1.
Evaluation of powder blend:
The powder blend used for preparation of
tablets was evaluated for angle of repose,
and compressibility index.
Angle of repose:
The angle of repose is a relatively simple
technique for estimation of the flow property
of a powder. Powders with low angle of
repose are free flowing and those with a
high angle of repose are poorly flowing
powders [7]
. 10 gm of powder was passed

Somnath Patil et al FORMULATION AND EVALUATION OF XANTHAN GUM BASED FLOATING TABLET OF
TRAMADOL HYDROCHLORIDE
Int J Cur Res Rev, Sept 2012 / Vol 04 (17) ,
Page 155
through funnel and the pile was formed. The
height and weight of the pile was measured
and the angle of repose was calculated by
using the formula:-
Angle of repose (θ) = tan-1 (height /radius)
The angle of repose less than 300 usually
indicate a free- flowing material and more
than
400 suggest a poorly flowing material
[8].
Carr`s compressibility index:
The Carr’s compressibility index was
calculated by calculating the tapped and
bulk density using the 100 ml measuring
cylinder. Compressibility is calculated by
the formula.
Carr`s compressibility index = (TBD-LBD)/
TBD X100
Where, TBD is tapped bulk density and
LBD is loose bulk density. A carr`s index
greater than 25 is considered to be an
indication of poor flowability, and below 15,
of excellent flowability. [9]
Table 2: Characterization of precompresion
parameters of table
Evaluation of Tablets:
All the formulations were evaluated for
various parameters such as hardness,
friability, weight variation, % drug content,
buoyancy lag time, swelling index, in-vitro
drug release, release experiments, IR
spectroscopy and optimized formulation
were evaluated for in-vivo study.
Hardness:
Hardness of tablets was determined using
monsanto hardness tester.
Friability:
For each formulation, the friability of 20
tablets was determined using the Roche
friabilator. In this test tablets were subject to
the combined effect of shock abrasion by
utilizing a plastic chamber which revolves at
a speed of 25 rpm, dropping the tablets to a
distance of 6 inches in each revolution. A
sample of pre weighted 20 tablets was
placed in Roche friabilator which was then
operated for 100 revolutions i.e. 4 mins. The
tablets were then dusted and reweighed.
Percent friability (%F) was calculated as
follows,
% F= (loss in weight / initial weight) x 100
Conventional compressed tablets that lose
less than 0.5 to 1.0% of their weight are
generally considered acceptable.
Thickness:
Thickness of all tablets was measured using
a vernier calliper.
Weight variation:
The weight of 20 tablets was taken on
electronic balance and the weight variation
was calculated. The weight variation
tolerance allowed for tablet weighing 324
mg and more is 5%.
Drug content:
To calculate the drug content, the tablets
were triturated in the mortar. 30mg of the
tablet powder (10mg Tramadol HCL) was
added to 10 ml of distilled water and drug
solution was filtered through Whatman
paper no.1. The sample was analyzed for
drug content by UV spectrophotometer
(Varian Cary 100) at 270 nm after suitable
dilutions. Drug stability in the 0.1 N HCl
and distilled water was checked using UV
spectrophotometer for a period of 10 hours.
Buoyancy Studies:
In vitro buoyancy was determined by
buoyancy lag time. The tablets were placed

Somnath Patil et al FORMULATION AND EVALUATION OF XANTHAN GUM BASED FLOATING TABLET OF
TRAMADOL HYDROCHLORIDE
Int J Cur Res Rev, Sept 2012 / Vol 04 (17) ,
Page 156
in a 100 ml beaker containing 0.1N HCl.
The time required for the tablet to rise to the
surface and float was determined as floating
lag time.
Swelling index:
The swelling index of the tablets was
calculated in order to find out the swelling
ability of the tablets. For calculating the
swelling index, the previously weighed
tablets were placed in the 100 mL beaker
containing 0.1 N HCl. The tablets were
removed at the time interval of 1 hr for 8
hours and weighed. The swelling index of
the tablets can be measured by studying its
dimensional changes, weight gain or water
uptake. Hence swelling index was calculated
by the formula;
Swelling index= (Wt-Wo) X 100/Wo
Where, Wt= Final weight of tablets at time‘t’
Wo= Initial Weight of tablets.
In Vitro Dissolution Studies:
The release rate of Tramadol HCl from
floating tablets was determined using United
States Pharmacopeia (USP) 24 dissolution
testing apparatus 2 (paddle method). The
dissolution test was performed using 900
mL of 0.1N HCl, at 37 ± 0.5°C and 60 rpm.
A sample (5 mL) of the solution was
withdrawn from the dissolution apparatus
hourly for 10 hours, and the samples were
replaced with fresh dissolution medium. The
samples were filtered through a 0.45-μ
membrane filter and diluted to a suitable
concentration with 0.1N HCl. Absorbance of
these solutions was measured at 270 nm
using double beam UV spectroscopy.
Cumulative percentage drug release was
calculated using PCP disso software.
RESULTS:
Evaluation of tablets:
Hardness:
Hardness of the formulations F1-F13 was
observed within the range of 7.4-9.3 as
shown in table 3.
Friability:
Friability of the tablets was observed below
0.30% for all batches which was in the
acceptable limit.
Thickness:
The thickness of all the tablets was found
within the range of 3 ± 0.5 mm.
Weight variation:
The weight of all the tablets was found
within the range of 300 mg ± 5mg. Hence
the weight of all formulations was found
within the limit.
Drug content:
The range of % drug content of the
formulations F1-F13 was found between
96.01 and 102.87. The tablets showed
hardness, friability, thickness, weight
variation and % drug content within the
limit. The in-vitro buoyancy study shows
that all the formulations shows good floating
property.
In Vitro Buoyancy Studies:
The in-vitro buoyancy study showed the
good floating ability of the tablets as shown
in the table 3. Buoyancy lag time indicates
the time required for the formulation to float
in the medium. From table 2, it was
observed that formulations F10 and F12
shows comparatively more floating lag time
as compared to other formulations. It was
further observed that formulation F2 shows
lowest floating lag time among the all
formulations.

Somnath Patil et al FORMULATION AND EVALUATION OF XANTHAN GUM BASED FLOATING TABLET OF
TRAMADOL HYDROCHLORIDE
Int J Cur Res Rev, Sept 2012 / Vol 04 (17) ,
Page 157
Swelling index:
From the swelling index study of all the
batches, it was observed that the increase in
the concentration of polymers increases the
swelling property of the tablets as shown in
table 3. Further the formulation containing
optimized swelling index was obtained.
From the formulation batches, it was
observed that the formulations F10 and F13
showed maximum swelling index.
In Vitro Dissolution Studies:
The drug release patterns from all the
formulations are shown in table 3. The
percent drug release after 8 hours is as
shown in figure 1, 2 and 3. It was observed
that the drug release was retarded from the
formulations containing more concentration
of Xanthan gum and HPMC K4M. The drug
release profile of formulations F1-F13
indicates that as the concentration of
polymer increases, the drug release was
retarded. From the comparison of release
profile of all the batches, it was observed
that the formulations containing
combination of polymers shows more
retardation in drug release in less
concentration as compared to Xanthan gum
and HPMC K4M alone. This indicates that
combination of polymers is more efficient in
formulating the sustained release dosage
form.
Table 3: Evaluation results of formulations
F1-F13
Fig.1: Effect of Various conc. of Xanthan
gum on drug release
Fig. 2: Effect of Various conc. of HPMC on
drug release
Fig. 3: Effect of Xanthan gum & HPMC in
Various combinations on drug release
DISCUSSION:
The flow properties of the powder blends
were studied and formulation F5 was found
to have comparatively good compressibility
index and hausner ratio than other
formulations. From the results of floating
properties it was shown that all tablets had
good floating properties. From the results of
swelling study it was concluded that
swelling index increases as time passes
because the polymer gradually absorbed
water due to hydrophilic in nature and swell.
The swelling index increases with time up to
2 hours in some batches which might due to
low viscosity of polymer and after 2 hours,
the polymer chain relaxation was
dominating phenomenon as swelling reaches
thresholds resulting in lowering of swelling
index. Thus the viscosity of polymer had a
major role on swelling process, matrix
integrity as well as floating capability. From
the swelling study of the formulations,
formulation F10 was found to have good
swelling properties. The in vitro dissolution
was carried out for all batches. From the
dissolution studies of the formulations,
formulation F10 was found to have better
drug release profile than other formulations.
Formulation F10 was also found to have
better swelling capacity and floating time
than other formulations. The drug release
was extended for more than 8 hours from the
floating drug delivery formulations.
CONCLUSION
Regulated drug release attained in the
current study indicates that the matrix tablets
of Tramadol hydrochloride, prepared using
various polymers, can successfully be
employed as a once-a-day oral controlled

Somnath Patil et al FORMULATION AND EVALUATION OF XANTHAN GUM BASED FLOATING TABLET OF
TRAMADOL HYDROCHLORIDE
Int J Cur Res Rev, Sept 2012 / Vol 04 (17) ,
Page 158
release drug delivery system. High floating
ability of the formulation is likely to
increase its GI residence time, and
eventually, improve the extent of
bioavailability. However, appropriate
balancing between various levels of the 2
polymers is imperative to acquire proper
controlled release and flotation of the
formulation. Formulation F10 shows good in
vitro gastro retentive floating drug delivery
of Tramadol HCl.
ACKNOWLEDGEMENTS
Authors are thankful to JCPL, Jalgaon for
providing the drug sample of Tramadol
hydrochloride, also thankful to Vapi care
pharma Ltd. for providing Xanthan gum and
HPMC K4M. Authors are very much
thankful to Principal and management of
MAEER’s Maharashtra Institute of
Pharmacy, Pune for their help and support.
Authors acknowledge the immense help
received from the scholars whose articles are
cited and included in references of this
manuscript. The authors are also grateful to
authors / editors / publishers of all those
articles, journals and books from where the
literature for this article has been reviewed
and discussed.
REFERENCES
1. Bardonnet P, Faivre V, Pugh WJ,
Piffaretti JC, Falson F. [2006] Gastro
retentive dosage forms: Overview
and special case of helicobacter pylori. J.
Control. Release 111:1 – 18.
2. Obaidat AA, Obaidat RM. [2001]
Controlled release of tramadol
hydrochloride from matrices prepared
using glyceryl behenate, Eur. J. Pharm.
Sci. 52: 231-235
3. Brunton L. Parker K. Blumenthal D. I.
Buxton, Goodman and Gilman`s: Manual
of pharmacology and therapeutics, Mc
Graw Hill, New York. 358-367.
4. Tiwari SB, Murthy TK, Pai MR, Mehta
PR, Chowdhary PB. [2003] Controlled
release formulation of Tramadol
hydrochloride using hydrophilic and
hydrophobic matrix system AAPS
PharmSciTech 31: 1-6
5. Narendra C, Srinath MS, Ganesh B.
[2006] Optimization of bilayer floating
tablet containing Metoprolol tartrate as a
model drug for gastric retention. AAPS
PharmSciTech 34:E1-E7.
6. Dave BS, Amin AF, Patel MM. [2004]
Gastroretentive drug delivery system of
ranitidine hydrochloride: formulation and
in vitro evaluation AAPS PharmSciTech
34: 1-6.
7. Aulton ME. [2008] Aulton`s
Pharmaceutics-The design and
manufacture of medicine, second ed.,
Churchill Livingstone Elsevier:. 133,
441-450.
8. Lachman L, Lieberman HA, [2009] the
theory and practice of industrial
pharmacy, CBS publishers and
distributors, special Indian edition, New
Delhi. 300,301,317,299.
9. Allen LV, Popovich NG, Ansel HC.
[2008] Ansel`s pharmaceutical dosage
form & drug delivery system, Lippincott
William & Wilkins: 186-203.
10. Jain NK. Response surface optimization
of drug delivery system, CBS Publishers
and Distributors, New Delhi.

Somnath Patil et al FORMULATION AND EVALUATION OF XANTHAN GUM BASED FLOATING TABLET OF
TRAMADOL HYDROCHLORIDE
Int J Cur Res Rev, Sept 2012 / Vol 04 (17) ,
Page 159
11. Singh B. [1998] Comprehensive
computer program for the study of drug
release kinetics from compressed
matrices. Ind. J. Pharm. Sci. 60: 358-362.
12. Singh B, Chakkal SK, Ahuja N. [2006]
Formulation and optimization of
controlled release Mucoadhesive tablets
of atenolol using response surface
methodology. AAPS PharmSciTech 3:
E1-E10.
13. Davis SS, Stockwell AF, Taylor MJ. The
effect of density on the gastric emptying
of single and multiple unit dosage forms.
Pharm Res.1986; 3:208‐213.
14. Urguhart J, Theeuwes F. Drug delivery
system comprising a reservoir containing
a plurality of tiny pills. US patent 4 434
153. February 28, 1994.
15. Mamajek RC, Moyer ES. Drug
dispensing device and method. US Patent
4 207 890. June 17, 1980.
Table Caption:
1. Table 1: Composition of Floating Tablet of TH
2. Table 2: Characterization of precompresion parameters of table
3. Table 3: Evaluation results of formulations F1-F13
Figure Caption:
1. Fig.1: Effect of Various conc. of Xanthan gum on drug release
1. Fig. 2: Effect of Various conc. of HPMC on drug release
2. Fig. 3: Effect of Xanthan gum & HPMC in Various combinations on drug release
Table 1: Composition of Floating Tablet of TH
SN Ingredient F1 F2 F3 F4 F5 F6 F7 F8 F9 F10 F11 F12 F13
1 Tramadol.
HCL 100 100 100 100 100 100 100 100 100 100 100 100 100
2
Sod.
Bicarbona
te
60
(20
%)
60
(20
%)
60
(20
%)
60
(20
%)
60
(20
%)
60
(20
%)
60
(20
%)
60
(20
%)
60
(20
%)
60
(20
%)
60
(20
%)
60
(20
%)
60
(20%)
3 Citric acid
30
(10
%)
30
(10
%)
30
(10
%)
30
(10
%)
30
(10
%)
30
(10
%)
30
(10
%)
30
(10
%)
30
(10
%)
30
(10
%)
30
(10
%)
30
(10
%)
30
(10%)
4 Xanthan
gum 75 90 - - 45 105 - 70 35 120 - 40 60
5 HPMC
K4 M - - 75 90 45 - 105 35 70 - 120 60 40
6 Mg.
Stearate 5 5 5 5 5 5 5 5 5 5 5 5 5
7 Mannitol 30 15 30 15 15 - - - - - - 5 5
Total Weight 300 300 300 300 300 300 300 300 300 315 315 300 300

Somnath Patil et al FORMULATION AND EVALUATION OF XANTHAN GUM BASED FLOATING TABLET OF
TRAMADOL HYDROCHLORIDE
Int J Cur Res Rev, Sept 2012 / Vol 04 (17) ,
Page 160
*All quantities are in mg
Table 2: Characterization of precompresion parameters of tablet: Batch Bulk density(g/cm3) Tapped density(g/cm3) Compressibility index Hausner ratio
F1 0.361 0.537 14.08 1.48
F2 0.300 0.348 20.37 1.26
F3 0.300 0.480 39.63 1.59
F4 0.333 0.526 36.67 1.58
F5 0.482 0.561 14.08 1.06
F6 0.436 0.558 21.86 1.27
F7 0.303 0.397 31.02 1.31
F8 0.462 0.549 15.84 1.18
F9 0.300 0.432 30.55 1.44
F10 0.335 0.546 38.64 1.45
F11 0.394 0.463 14.90 1.17
F12 0.416 0.563 26.11 1.35
F13 0.428 0.519 17.53 1.21
Table 3: Evaluation results of formulations F1-F13 Formulation
No.
% drug release
within 8 Hrs.
%Drug
Content
Swelling
Index
Buoyancy Lag
Time (Sec.)
Hardness
(Kg/cm2)
Thickness
(mm)
F1 99.71 99.04 183.39 41 8.6 2.54±0.07
F2 90.56 97.56 210.85 25 7.4 2.64±0.04
F3 93.21 96.01 182.53 39 8.3 2.58±0.03
F4 85.69 101.90 204.02 38 7.9 2.50±0.05
F5 73.69 97.98 203.46 44 8.8 2.43±0.08
F6 84.04 101.44 210.89 31 7.6 2.36±0.02
F7 81.48 98.70 213.52 40 8.5 2.68±0.10
F8 79.56 102.87 190.93 31 7.4 2.59±0.04
F9 84.91 101.67 161.38 46 8.3 2.52±0.02
F10 87.75 98.46 237.97 48 9.1 2.58±0.04
F11 93.04 99.02 210.04 45 8.7 2.50±0.03
F12 82.37 97.35 218.51 54 9.3 2.43±0.07
F13 78.39 100.30 219.36 35 7.8 2.36±0.03

Somnath Patil et al FORMULATION AND EVALUATION OF XANTHAN GUM BASED FLOATING TABLET OF
TRAMADOL HYDROCHLORIDE
Int J Cur Res Rev, Sept 2012 / Vol 04 (17) ,
Page 161
Fig.1: Effect of Various conc. of Xanthan gum on drug release
Fig. 2: Effect of Various conc. of HPMC on drug release
Fig. 3: Effect of Xanthan gum & HPMC in Various combinations on drug release

Mamta Mohan et al VIBRATION THRESHOLD OF UPPER LIMB DURING ULNT1 IN INDIVIDUALS WITH TYPE II
DIABETES MELLITUS AND NON DIABETIC INDIVIDUALS
Int J Cur Res Rev, Sept 2012 / Vol 04 (17) ,
Page 162
IJCRR
Vol 04 issue 17
Section: Healthcare
Category: Research
Received on: 13/06/12
Revised on: 23/07/12
Accepted on: 12/08/12
VIBRATION THRESHOLD OF UPPER LIMB DURING ULNT1 IN
INDIVIDUALS WITH TYPE II DIABETES MELLITUS AND NON
DIABETIC INDIVIDUALS
Mamta Mohan, Ravi Shankar Reddy, Ganesh B. M.
Department of Physiotherapy, MCOAHS, Manipal University, KA, India
Email of corresponding author: [email protected]
ABSTRACT
Background: Type II diabetes mellitus patients have been shown to affect the multimodal
sensory, reflex and motor systems in distal extremities. Studies have examined the
mechanosensitivity and vibration threshold in type II diabetes mellitus patients in the lower limb
and compared it with normal individuals. There is scanty literature available in comparison of
the vibration threshold in the upper limb in type II diabetes mellitus patients with non diabetic
individuals.
Methods: Thirty type II diabetic individuals were included in the diabetic group and thirty
asymptomatic age matched individuals were taken to match the group. Vibration threshold (VT)
was measured by tester 1 at the baseline for both the groups using a bioesthesiometer capable of
deriving a vibration of 100 Hz. After the VT was taken at three levels 1) at the baseline, the
tester performed the upper limb neurodynamic test 1(ULNT1) for each individual. During the
sequence of the ULNT1, 2) vibration threshold was measured at initial onset of pain i.e. P1 and
3) short of maximal pain i.e. P2.
Results: Repeated measures ANOVA was used to compare the VT differences within group
and between groups. There was a statistical significant difference between the vibration
threshold of diabetic and non diabetic group at the three levels with a p value < 0.001.
Conclusion: Vibration threshold of the upper limb is higher in individuals with type II diabetes
mellitus as compared to non diabetic individuals.
Keywords: Vibration threshold, ULNT1, Diabetes mellitus
INTRODUCTION
Diabetes mellitus is a group of metabolic
diseases characterized by hyperglycaemia
resulting from defects in insulin secretion,
insulin action, or both. Type II diabetes
mellitus is most common form which is a
disease of insulin resistance that usually has
relative (rather than absolute) insulin
deficiency1. Earliest change in diabetic
nerve function is alteration in axonal
excitability due to changes in ion
conductance of axon membrane due to
metabolic processes directly affecting the
nerves, microvascular abnormalities of the
endoneurium and auto immune
inflammation. Four main mechanisms have
been postulated to underlie the pathogenesis
of nerve pathology in diabetes mellitus,
which are metabolic processes directly
affecting nerve fibres, endoneurial
microvascular disease, autoimmune
inflammation and deranged neurotrophic

Mamta Mohan et al VIBRATION THRESHOLD OF UPPER LIMB DURING ULNT1 IN INDIVIDUALS WITH TYPE II
DIABETES MELLITUS AND NON DIABETIC INDIVIDUALS
Int J Cur Res Rev, Sept 2012 / Vol 04 (17) ,
Page 163
support.2 It is due to these effects of
hyperglycemia that peripheral nerve
involvement is highly frequent in type II
diabetes mellitus and it has been
documented that one third of type II diabetic
patients have peripheral neuropathy3.
Among the nerves, there is a tendency of the
large diameter nerve fibers that mediate
sense of vibration to get involved first in
diabetes mellitus.2
Neurodynamic tests involve sequential limb
movements that are employed to include the
link between mechanical and physiological
types of mechanisms. An aim of using these
tests in assessment of a nerve is to stimulate
mechanically and move neural tissues in
order to gain an impression of their mobility
and sensitivity to mechanical stresses so as
to evoke the physiological responses.4 In
order to assess the upper limb nerve
function, the standard upper limb neuro
dynamic test 1 (ULNT1) is usually used as it
evokes symptoms of distribution of the
median nerve because the forces generated
by the test are biased towards this structure.4
There are various techniques of assessing
the conductivity of nerve such as NCV that
basically assesses the motor and sensory
aspects of the nerve whereas the vibration
threshold (VT) reflects particular function of
the peripheral nervous system especially the
somatosensory pathway.5
Type II diabetes mellitus patients have been
shown to affect the multimodal sensory,
reflex and motor systems in distal
extremities. Mechanosensitivity in diabetes
mellitus patients should be considered as an
essential inclusion in the assessment to
predict the extent of involvement of the
nerve.6
Studies have also been done to
determine the vibration threshold in lower
limb in normal individuals but there is
scanty literature available in comparison of
the vibration threshold in the upper limb in
type II diabetes mellitus patients with non
diabetic individuals.
METHODOLOGY
Study Design
This study took place in department of
physiotherapy, Manipal University,
Manipal, India. A cross –sectional 2-group
design was used. Completion of
questionnaires and all measurement
procedures were conducted in the same
room on each occasion.
Subject Selection
Type II diabetic subjects in the study were
selected from all patients presenting for the
first time to physiotherapy outpatient and
inpatient clinic over a one year period. 30
subjects with mean age of 55.60 ± 9.79 were
included in the study. All new patients
completed a simple questionnaire as part of
the inclusion-exclusion procedure. On daily
review of these first stage questionnaires,
the clinical records of patients who
provisionally met the inclusion criteria were
subjected to secondary detailed screening by
an experienced member of the
physiotherapy faculty who is experienced
the in the field of musculoskeletal
physiotherapy and diabetic neuropathy. The
Diabetic subjects with clinical signs of
neuropathy were excluded from the study.
After this screening, subjects who met
inclusion criteria invited to participate in the
study and were given further verbal and

Mamta Mohan et al VIBRATION THRESHOLD OF UPPER LIMB DURING ULNT1 IN INDIVIDUALS WITH TYPE II
DIABETES MELLITUS AND NON DIABETIC INDIVIDUALS
Int J Cur Res Rev, Sept 2012 / Vol 04 (17) ,
Page 164
written information about the study, and
were asked to read and sign a consent form.
For controlled age matched normal subjects
an advertisement was given in
physiotherapy department and Manipal
University for their voluntary participation
in the study. To be considered for inclusion,
the subjects must have been aged between
30 to 70 years, have had no history of
diabetes, upper limb disorders, Cervico-
brachial pain syndrome, Acute
inflammatory/ demyelinating diseases, Any
recent surgeries in upper limb. Finally,
eligible 30 control subjects were selected by
age to ensure a similar distribution to the
patient group. The mean age of the subjects
was 53.43±9.96. The subjects first session
were to familiarize them with the equipment
and vibration threshold testing tasks. All
participants signed a written consent form
prior to participating in the experiment.
Ethics approval was obtained from the
Manipal University Ethics Committee.
Measurement of Vibration Threshold
(VT)
VT was measured by tester 1 at the baseline
for both the groups using a bioesthesiometer
capable of delivering a vibration of 100 Hz.
The subjects were made to sit comfortably
on a chair with hand and arm completely on
the pillow. The probe of the Vibrometer was
placed at the pulp of the distal phalanx of
the thumb.7 Either right or left hand was
tested. The subjects were shielded from the
Vibrometer display during testing. At
baseline, tester 1 first increased the vibration
to a point where the subject perceived the
stimulus. This was taken as appearance of
vibration. Then the intensity was further
increased and slowly reduced till they
identified the disappearance of the stimulus.
This measurement was done thrice and the
average of the six values was taken as the
vibration threshold.
After the VT was taken at the baseline, the
tester performed the ULNT1 (adopted from
M.Shacklock)6 for each individual. For this
a pressure biofeedback inflated to 50 mm
Hg was used to prevent shoulder elevation.
Then the shoulder was abducted to 90-110
degrees followed by complete external
rotation, forearm supination, wrist and
finger extension. The last component of
ULNT1 was elbow extension and elbow
extension value was recorded using
universal goniometer as a measure of
mechanosensitivity. During the sequence of
the ULNT1, the occurrence of the first
response of elbow extension i.e. pain
considered as P1 was noted. The angle of its
occurrence was measured with the universal
Goniometer and VT at this position in the
same manner as that of baseline was taken
for both the groups by the tester 2. The next
occurrence of the symptom i.e. P2 at which
any further movement was intolerable was
noted. The corresponding elbow extension
angle of P2 was measured. The range of
elbow extension was reduced until the
feeling of discomfort disappeared and VT
was measured at this point for both the
groups by the tester 2. The reduction of
elbow extension was adopted to avoid the
masking of pain for perception of vibration.
The measurement of vibration threshold was
measured for both diabetic individuals and
age matched normal individuals.

Mamta Mohan et al VIBRATION THRESHOLD OF UPPER LIMB DURING ULNT1 IN INDIVIDUALS WITH TYPE II
DIABETES MELLITUS AND NON DIABETIC INDIVIDUALS
Int J Cur Res Rev, Sept 2012 / Vol 04 (17) ,
Page 165
Data Analysis
The statistical analysis was done using the
SPSS 14.0 for Windows software. The
statistical significance value was set at 0.05
with 95% confidence interval and p value
less than or equal to 0.05 would be
considered as significant. Repeated
measures ANOVA were used to compare
the VT differences within group and
between groups.
RESULTS
Demographic data regarding the age (yrs),
sex and duration of individuals with type II
diabetes mellitus and non diabetic
individuals are shown in table no. 1 Analysis
of repeated measures ANOVA shows the
comparison of the vibration threshold
between the diabetic and the non diabetic
group at 3 levels i.e. VT at baseline, VT at
P1 and VT at less than P2. There was a
statistical significant difference between the
vibration threshold of diabetic and non
diabetic group at the three levels with a p
value < 0.001. This states that the vibration
threshold was found to be raised in the
diabetic group at all the three levels
compared to the non diabetic group. There
was no statistical significant difference
between the three levels within each group
with a p value of 0.755.This states that there
was no difference in vibration threshold
during the ULNT1 procedure within each
group (Table no. 2 and Figure 1) Thus
vibration threshold of the upper limb is
higher in individuals with type II diabetes
mellitus as compared to non diabetic
individuals. However, vibration threshold
did not change within subjects of each group
during the ULNT1 testing.
DISCUSSION
Our study aimed at comparing the vibration
threshold of the upper limb during ULNT1
in individuals with type II diabetes mellitus
and non diabetic individuals. As per the
results, the vibration threshold was found to
be increased in the individuals with type II
diabetes mellitus as compared to the non
diabetic individuals.
Vibration threshold is a measure of
conductivity i.e. a function of the axon in
conducting the impulse from the external
receptor. Thus, alteration of the vibration
threshold in type II diabetic individuals may
be due various reasons. Studies in human
and animal models with diabetes mellitus
have shown reduced nerve perfusion and
endoneurial hypoxia. Investigations on
biopsy materials from patients with mild to
severe neuropathy show graded structural
changes in nerve microvasculature including
basement membrane thickening, pericyte
degeneration and endothelial cell
hyperplasia. Arterio-venous shunting also
contributes to the reduced endoneurial
perfusion. These vascular changes strongly
correlate with clinical defects and nerve
pathology. Early vasa nervorum functional
changes are caused by metabolic insults of
diabetes, the balance between vasodilator
and vasoconstrictor are altered.8
The findings of our study regarding the
vibration threshold are in contrast with the
study done by David A Gebler et al. They
conducted a study to check the vibratory and
thermal thresholds in normal and diabetic
individuals using an Optacon Tactile Tester
(OTT) and Thermal Sensitivity Tester. They

Mamta Mohan et al VIBRATION THRESHOLD OF UPPER LIMB DURING ULNT1 IN INDIVIDUALS WITH TYPE II
DIABETES MELLITUS AND NON DIABETIC INDIVIDUALS
Int J Cur Res Rev, Sept 2012 / Vol 04 (17) ,
Page 166
did not find the vibratory and thermal
threshold of diabetic subjects to be different
from the normal individuals. But in diabetic
individuals with neuropathy, the thermal and
vibratory thresholds were found to be
increased.9
CONCLUSION
Vibratory threshold of the upper limb in
type II diabetic individuals is higher than the
non diabetic individuals. Vibration threshold
and Mechanosensitivity in diabetes mellitus
patients should be considered as an essential
inclusion in the assessment to predict the
extent of involvement of the nerve.
REFERENCES
1. Fazan V, Vasconcelos C, Valença M,
Nessler R, Moore K. Diabetic Peripheral
Neuropathies: A Morphometric
Overview. Int J Morphol 2010;28:51-64.
2. Raymond AA. Management of Diabetic
Neuropathy. Malaysian Journal of
Medical Sciences 2003;10:27-30.
3. Comi G, Corbo M. Metabolic
neuropathies. Curr Opin Neurol 1998;
11:523-9.
4. Shacklock M. Clinical Neurodynamics -
A new system of musculoskeletal
treatment. London: Elsiever 2005.63-65
5. Lise H, Jepsen JR, Sjogaard G.
Vibrotactile sense in patients with
different upper limb disorders compared
with a control group. Int Arch Occ Env
Hea 2006;79:593-601.
6. Boyd BS, Wanek L, Gray AT, Topp KS.
Mechanosensitivity during lower
extremity neurodynamic testing is
diminished in individuals with Type 2
Diabetes Mellitus and peripheral
neuropathy: a cross sectional study.
BMC Neurology 2010; 10:75.
7. Colette R, Jane G, Nicola J. P. Effect of
straight leg raise examination and
treatment on vibration thresholds in the
lower limb: a pilot study in
asymptomatic subjects. Man Ther 2005;
10:136-143.
8. Cameron NE, Eaton SE. Vascular
factors and metabolic interactions in the
pathogenesis of diabetic neuropathy.
Diabetologia 2001;44:1973-1988.
9. Gelber DA, Pfeifer MA, Broadstone VL,
Munster EW, Peterson M, Arezzo JC.
Components of variance for vibratory
and thermal threshold testing in normal
and diabetic subjects. J Diabetes
Complications 1995;9:170-176
TABLES AND FIGURES
Table no. 1: Study population
characteristics [n = 60]
Demographic
Parameters
Diabetic
group
n= 30
Control
group
n= 30
Age (yrs)
55.60 ± 9.79
(Mean ±
SD)
53.43±9.96
(Mean ±
SD)
Sex
Male: female
19:11
15:15
Duration of
diabetes (yrs)
median (IQR)
5.50 ( 1.75 –
10.50)
-

Mamta Mohan et al VIBRATION THRESHOLD OF UPPER LIMB DURING ULNT1 IN INDIVIDUALS WITH TYPE II
DIABETES MELLITUS AND NON DIABETIC INDIVIDUALS
Int J Cur Res Rev, Sept 2012 / Vol 04 (17) ,
Page 167
Table no. 2: Comparison of Vibration threshold between and within groups
Outcome
measure
Diabetic group
Mean±SD
Control group
Mean ±SD
p value
VT baseline
6.06 ± 1.98
3.72 ± 1.08
Between
groups:
< 0.001
VT at P1
6.24 ± 2.16
4.04 ± 1.24
VT at less than
P2
6.46 ± 2.13
3.99 ± 1.40
p value
Within groups
0.755
Figure1. Trend line showing Vibration Threshold difference between groups and within
group
0
1
2
3
4
5
6
7
VT baseline VT at P1 VT at P2
Diabetic group
Control group
Vt
in v
olt
s

Shahnawaz Anwer et al CARDIOVASCULAR CO-MORBIDITY AND ROLE OF EXERCISE IN RHEUMATOID ARTHRITIS: A
REVIEW
Int J Cur Res Rev, Sept 2012 / Vol 04 (17) ,
Page 168
IJCRR
Vol 04 issue 17
Section: Healthcare
Category: Review
Received on: 10/06/12
Revised on: 13/07/12
Accepted on: 12/08/12
CARDIOVASCULAR CO-MORBIDITY AND ROLE OF EXERCISE IN
RHEUMATOID ARTHRITIS: A REVIEW
Shahnawaz Anwer, Ameed Equebal
Padmashree Dr. D. Y. Patil College of Physiotherapy, Pune, M.S., India
Email of corresponding author: [email protected]
ABSTRACT
Patients with rheumatoid arthritis have an increased risk of cardiovascular disease (CVD).
Cardiovascular event rates are markedly increased in rheumatoid arthritis (RA). Data from
population- and clinic-based epidemiologic studies of rheumatoid arthritis patients suggest that
individuals with rheumatoid arthritis are at risk for developing clinically evident congestive heart
failure (CHF). The vasculature plays a crucial role in inflammation, angiogenesis, and
atherosclerosis associated with the pathogenesis of inflammatory rheumatic diseases. There is
overwhelming evidence that, in the general population and several at risk subpopulations, exercise
provides significant physical and psychosocial benefits, and facilitates management and
improvements of outcome in Rheumatic disease. There is increased recognition of the need for
structured preventive strategies to reduce the risk of CVD in patients with RA. In this review, the
research agenda for understanding and preventing CVD co-morbidity in patients with rheumatoid
arthritis is discussed.
Key-words: Rheumatoid arthritis, Cardiovascular Disease, Inflammation, Exercise
INTRODUCTION
Cardiovascular disease is an increasingly
recognized contributor to excess morbidity and
mortality in rheumatoid arthritis (RA) [1-3]
. The
most probable cause of cardiac death in
rheumatoid arthritis, as in the general
population, is atherosclerotic coronary artery
disease leading to ischaemic heart disease [4]
.
Rheumatoid arthritis, which is characterized by
inflammatory polyarthritis with progressive
joint damage, occurs in about 0.5%-1% of
adult population in most countries [5]
. Several
studies have shown a higher incidence or
prevalence of ischaemic cardiac pathologies
such as myocardial infarction, congestive heart
failure, and coronary deaths in patients with
rheumatoid arthritis than in the general
population [3,6-7]
. Traditional cardiovascular
risk factors do not adequately account for the
extent of cardiovascular disease in RA [3,8]
.
Although hypertension and age are potential
additional contributors to cardiovascular events
in this disease [6]
, markers of current and
cumulative inflammation (white cell counts
and radiographic joint damage, respectively)
are associated with ultrasonographically
determined subclinical atherosclerosis [9]
– a
predictor of cardiovascular events [10]
. The use
of methotrexate is associated with a
significantly lower risk for cardiovascular (CV)
events in RA patients compared with patients
who had never used disease-modifying
antirheumatic drugs (DMARDs) [11]
. Suissa and
colleagues [12]
found a negative association
between the rate of myocardial infarction and
the current use of any DMARD in a case
control study. A study from Sweden [13]
suggested that the risk for developing first CV
events in RA was lower in patients who were
treated with tumour necrosis factor-alpha
(TNF-α) blockers. In this review we examine
the evidence of risk for CVD in patients with

Shahnawaz Anwer et al CARDIOVASCULAR CO-MORBIDITY AND ROLE OF EXERCISE IN RHEUMATOID ARTHRITIS: A
REVIEW
Int J Cur Res Rev, Sept 2012 / Vol 04 (17) ,
Page 169
rheumatoid arthritis and the suggested
underlying mechanism and discuss the role of
exercise for the prevention and management of
CVD in such patients.
Epidemiology of Cardiovascular disease in
patients with rheumatoid arthritis
Fewer statistics on incidence and prevalence
rates for Congestive heart failure (CHF) in
patients with RA are available and are derived
from a handful of population-based[7,14]
and
clinic-based RA cohorts[15]
. Gabriel et al.[7]
estimated the incidence of CHF among all RA
patients in Olmsted Country, Minnesota, from
data abstracted from medical records. Between
1955 and 1985, 78 cases of incident CHF were
identified among 450 prevalent cases of RA
compared to 54 cases among the same number
of non-RA community controls matched for
age, sex, and baseline comorbidity, yielding a
relative risk of 1.60 (95% CI 1.12-2.27). In
contrast, the risk of incident CHF in patients
with osteoarthritis (OA), a non-inflammatory
arthritis, was not increased compared to non-
OA community controls [7]
.
In a follow-up retrospective review of the same
cohort extended to 1995, now using the
Framingham diagnostic criteria for CHF,
Nicola et al.[14]
confirmed an increased risk of
incident CHF in both rheumatoid factor (RF)
negative and positive RA patients compared to
non-RA controls adjusted for age, sex, and CV
risk factors. Incident CHF risk remained
elevated after further adjustment for comorbid
ischemic heart disease, although the risk
relationship was no longer statistically
significant for RF negative patients in this
model [14]
.
In a combined cohort of RA patients from
community-based practices and drug safety
monitoring studies (n = 9093), Wolfe et al.[2]
estimated an adjusted lifetime relative risk of
CHF in patients with RA is more as compared
with OA controls. The adjusted lifetime
prevalence of CHF in the RA population was
0.7 % greater as compared to OA controls.
Data were collected via patient survey of self
reported, physician-diagnosed CHF, and
confirmed by review of a random sample of
medical records in 50% of patients reporting
CVD events. In a subsequent analysis [15]
, in
which the drug safety cohort represented a
third (n = 4,307) of the total sample (n =
13,171), Wolfe et al. reported an adjusted
frequency of CHF of 3.9% (95% CI 3.4-4.3%)
in RA patients compared to 2.3% (95% CI 1.6-
3.3%) in controls with knee or hip OA. Factors
associated with prevalent and incident of CHF
were those typically associated with CHF in
the non-RA population (e.g., age, male gender,
hypertension, coronary artery disease, diabetes,
and smoking) while RA-related measures
(patient-reported disability, pain, and RA
global severity) were also associated with
prevalent and incident of CHF.
Risk factors for cardiovascular events in
patients with rheumatoid arthritis:
Traditional risk factors for vascular disease
such as, smoking, hypertension, diabetes and
hyper lipidemia are important for the increased
risk of CVD in subjects with RA [16]
. However,
traditional risk factors alone do not fully
explain the excess CVD risk in RA. Other non-
traditional factors are hypothesized to play a
role, in particular the burden of inflammation
as indicated by the C-reactive protein (CRP)
and/or erythrocyte sedimentation rate (ESR) [17,
18]. In a community-based cohort of patients
with inflammatory polyarthritis, Goodson, et al
also noted that excess CVD mortality was
confined to patients who were rheumatoid
factor positive [19]
. These markers of
inflammation and inflammatory burden confer
additional risk of CVD death in those with RA
after adjusting for traditional CVD risk factors
and comorbidities [20]
. Severity of disease has
consistently been associated with an increased
risk of CVD events in RA. Patient with severe
extra articular RA manifestations are at an

Shahnawaz Anwer et al CARDIOVASCULAR CO-MORBIDITY AND ROLE OF EXERCISE IN RHEUMATOID ARTHRITIS: A
REVIEW
Int J Cur Res Rev, Sept 2012 / Vol 04 (17) ,
Page 170
increased risk of developing coronary artery
disease [21]
as well as peripheral vascular
disease [22]
; and severe extra articular RA is a
predictor of both overall mortality [23]
and
cardiovascular mortality [20]
, indicating that
systemic inflammation is a major determinants
of vascular comorbidity in RA. In contrast with
the general population, a low body mass index
(BMI), rather than obesity, has been associated
with increased CVD in patients with RA [24, 25]
.
Role of exercise in Rheumatoid arthritis and
Cardiovascular disease:
Exercise is one of the most important
behavioral interventions that can have a major
beneficial impact on the likelihood to develop,
suffer symptomatically or die from CVD. Any
physical activity is better than no, or little,
physical activity. There is overwhelming
evidence that, in the general population and
several at risk subpopulations, exercise
provides significant physical and psychosocial
benefits, and facilitates management and
improvements of outcome in Rheumatic
disease. It helps maintain a healthy life-style,
reduce CVD risk factors including obesity [26]
,
dyslipidaemia [27, 28]
, hypertension [29]
, diabetes
mellitus [30]
and possibly even inflammation [31]
; it is also effective for preventing acute
coronary syndromes [32-34]
. Moreover, exercise
helps the management of established CVD:
both aerobic exercise [35, 36]
and resistance
training [37]
improve myocardial contractility
and quality of life in patients with chronic heart
failure and produce significant functional
benefits in people with intermittent
claudication [38]
. More importantly, cardiac
exercise rehabilitation programmes are an
important part in the management of patients
after an acute coronary syndrome (ACS) [39]
and lead to significantly improved quality of
life and reduced mortality rates [40, 41]
.
The overall physiological adaptations that
occur as a result of exercise [42]
provide
protection against CVD mortality, even in the
presence of well-established CVD risk factors [43, 44]
. CVD mortality is lower in highly fit than
in moderately fit individuals [45]
, while physical
inactivity is an independent risk factor for the
development of CVD [46, 47]
. Even though
cardiorespiratory fitness may have a familial
component [48]
, it can be increased significantly
by exercise training, regardless of age, gender,
race and initial fitness levels [49]
. The required
activity levels can be accrued through formal
training programmes or leisure-time physical
activities [50]
. Moreover, supervised exercise
programmes are more effective compared with
non-supervised exercise [51, 52]
, most likely due
to greater adherence.
Great controversy still exists about the
optimum amount of exercise for eliciting the
greatest cardiovascular benefit. Different
exercise intensity [53]
and duration [54]
, as well
as various combinations of them [55]
, may have
different impacts on the magnitude of
cardiorespiratory fitness improvement. Most
authors agree that there is a dose–response
relation between the amount of exercise, all-
cause and cardiovascular mortality [53, 54]
. The
greatest potential for reduced mortality is in
sedentary individuals (such as many RA
patients), in whom even slight increases in
daily physical activity are beneficial [56,57]
; for
more active individuals, higher levels of
intensity should be pursued [56]
. Depending
primarily on the starting levels of physical
activity, cardiovascular fitness has been
reported to increase by 8–51% following an
exercise intervention [54, 56]
.
Moderate-intensity exercise of long duration
appears to elicit the most benefit on CVD risk
and mortality [53, 55-57]
. Current guidelines by
the American College of Sports Medicine
(ACSM) suggest that an individual should
engage in exercise at least three times a week,
at an intensity of 60–80% of maximum oxygen
uptake (VO2max), for at least 20–30 min, in
order to experience significant improvements

Shahnawaz Anwer et al CARDIOVASCULAR CO-MORBIDITY AND ROLE OF EXERCISE IN RHEUMATOID ARTHRITIS: A
REVIEW
Int J Cur Res Rev, Sept 2012 / Vol 04 (17) ,
Page 171
in cardiorespiratory fitness and optimum
cardiovascular benefits [58]
. In terms of caloric
expenditure, this can be translated to 1000–
2000 kcal/week [59]
. These calories can be
expended in either continuous exercise or
accumulated from several short bouts of
exercise during a day [59, 60]
. Aerobic exercise is
the most appropriate, but this can be
supplemented by low-to-moderate intensity
resistance training [60]
. The exercise regimen
should be reconsidered regularly, usually every
4–6 weeks, based on the principles of exercise
periodization [61]
so that participants continue
to improve their performance.
SUMMARY
There is strong evidence that persons with
rheumatoid arthritis are at high risk for
developing cardiovascular disease. Several
studies have shown a higher incidence or
prevalence of ischaemic cardiac pathologies
such as myocardial infarction, congestive heart
failure, and coronary deaths in patients with
rheumatoid arthritis than in the general
population. Severity of disease has consistently
been associated with an increased risk of CVD
events in RA. CVD mortality was more
confined to patients who were rheumatoid
factor positive. Role of exercise in the
management and prevention of CVD in RA
patients is very important yet neglected area of
RA patients treatment programmes. As this
review shows, there is accumulating evidence
that in patients with RA, exercise therapy is
effective in improving the prognostic risk
factor profile. There is little has been
investigated and published on the role of
exercise as a means to control risk and manage
CVD in individuals with RA. More research is
required to identify the optimal regimens,
timing and environment for exercise, as well as
educational and behavioural intervention that
will facilitate long term adherence to an active
life style and/or structured exercise.
ACKNOWLEDGMENTS
We acknowledge the immense help received
from the scholars whose articles are cited and
included in references of this manuscript. We
are also grateful to authors/editors/publishers
of all those articles, journals and books from
where the literature for this article has been
reviewed and discussed.
REFERENCES
1. Solomon DH, Karlson EW, Rimm EB,
Cannuscio CC, Mandl LA, Manson JE, et
al. Cardiovascular morbidity and mortality
in women diagnosed with rheumatoid
arthritis. Circulation 2003;107:1303-07.
2. Wolfe F, Freundlich B, Straus WL.
Increase in cardiovascular and
cerebrovascular disease prevalence in
rheumatoid arthritis. J Rheumatol
2003;30:36-40.
3. del Rincon ID, Williams K, Stern MP,
Freeman GL, Escalante A. High incidence
of cardiovascular events in a rheumatoid
arthritis cohort not explained by traditional
cardiac risk factors. Arthritis Rheum
2001;44:2737-45.
4. Kitas GD, Banks M, Bacon PA. Cardiac
involvement in rheumatoid disease. Clin
Med 2001;1:18–21.
5. Silman AJ, Hochberg MC,.Epidemiology
of the Rheumatic diseases. Oxford; Oxford
University Press. 1993.
6. Wallberg-Jonsson S, Ohman ML,
Rantapaa-Dahlqvist S. Cardiovascular
morbidity and mortality in patients with
seropositive RA in northern Sweden. J
Rheumatol 1997;24:445–51.
7. Gabriel SE, Crowson CS, O’Fallon WM.
Comorbidity in arthritis. J Rheumatol
1999;26:2475–9.
8. Dessein PH, Joffe BI, Stanwix AE:
Inflammation, insulin resistance, and
aberrant lipid metabolism as cardiovascular
risk factors in rheumatoid arthritis. J
Rheumatol 2003;30:1403-05.
9. Kumeda Y, Inaba M, Goto H, Nagata M,
Henmi Y, Furumitsu Y et al. Increased
thickness of the arterial intima-media
detected by ultrasonography in patients

Shahnawaz Anwer et al CARDIOVASCULAR CO-MORBIDITY AND ROLE OF EXERCISE IN RHEUMATOID ARTHRITIS: A
REVIEW
Int J Cur Res Rev, Sept 2012 / Vol 04 (17) ,
Page 172
with rheumatoid arthritis. Arthritis Rheum
2002;46:1489-97.
10. Belcaro G, Nicolaides AN, Ramaswami G,
Cesarone MR, De Sanctis M, Incandela L
et al. Carotid and femoral ultrasound
morphology screening and cardiovascular
events in low risk subjects: a 10-year
follow-up study (the CAFES-CAVES study
(1)). Atherosclerosis 2001;156:379-87.
11. Van Halm VP, Nurmohamed MT, Twisk
JWR, Dijkmans BAC, Voskuyl AE.
Disease-modifying antirheumatic drugs are
associated with a reduced risk for
cardiovascular disease in patients with
rheumatoid arthritis: a case control study.
Arthritis Res Ther 2006;8:R151.
12. Suissa S, Bernatsky S, Hudson M.
Antirheumatic drug use and the risk of
acute myocardial infarction. Arthritis
Rheum 2006;55:531-6.
13. Jacobsson LT, Turesson C, Gulfe A,
Kapetanovic MC, Petersson IF, Saxne T et
al. Treatment with tumor necrosis factor
blockers is associated with a lower
incidence of first cardiovascular events in
patients with rheumatoid arthritis. J
Rheumatol 2005;32:1213-1218.
14. Nicola PJ, Maradit-Kremers H, Roger VL,
Jacobsen SJ, Crowson CS, Ballman KV et
al. The risk of congestive heart failure in
rheumatoid arthritis: A population-based
study over 46 years. Arthritis Rheum
2005;52:412-420.
15. Wolfe F, Michaud K. Heart failure in
rheumatoid arthritis: Rates, predictors, and
the effect of anti-tumor necrosis factor
therapy. Am J Med 2004;116:305-11.
16. Solomon DH, Curhan GC, Rimm EB, et al.
Cardiovascular risk factors in women with
and without rheumatoid arthritis. Arthritis
Rheum 2004;50:3444-9.
17. Snow MH, Mikuls TR. Rheumatoid
arthritis and cardiovascular disease: the role
of systemic inflammation and evolving
strategies of prevention. Curr Opin
Rheumatol 2005;17:234-41.
18. Wallberg-Jonsson S, Johansson H, Ohman
ML, Rantapaa-Dahlqvist S. Extent of
inflammation predicts cardiovascular
disease and overall mortality in
seropositive rheumatoid arthritis. A
retrospective cohort study from disease
onset. J Rheumatol 1999;26:2562-71.
19. Goodson NJ, Wiles NJ, Lunt M, Barrett
EM, Silman AJ, Symmons DP. Mortality in
early inflammatory polyarthritis:
cardiovascular mortality is increased in
seropositive patients. Arthritis Rheum
2002;46:2010-9.
20. Kremers HM, Nicola PJ, Crowson CS,
Ballman KV, Gabriel SE. Cardiovascular
death in rheumatoid arthritis: a population
based study. Arthritis Rheum 2005;52:722-
32.
21. Turesson C, McClelland RL, Christianson
TJ. Severe Extraarticular disease
manifestatios are associated with an
increased risk of first ever cardiovascular
events in patients with rheumatoid arthritis.
Ann Rheum Dis 2007;66:59-64.
22. Liang KP, Liang KV, Matteson EL.
Incidence of noncardiac vascular disease in
rheumatoid arthritis and relationship to
Extraarticular disease manifestation.
Arthritis Rheum 2006;54:642-8.
23. Gabriel SE, Crowson CS, Kremers HM.
Survival in rheumatoid arthritis: a
population based analysis of trends over 40
years. Arthritis Rheum 2003;48:54-8.
24. Kremers HM, Nicola PJ, Crowson CS.
Prognostic importance of low body mass
index in relation to cardiovascular mortality
in rheumatoid arthritis. Arthritis Rheum
2004;50:3450-7.
25. Escalante A, Haas RW, del Rincon I.
Paradoxical effect of body mass index on
survival in rheumatoid arthritis: role of
comorbidity and systemic inflammation.
Arch Intern Med 2005;165:1624-9.
26. Bensimhon DR, Kraus WE, Donahue MP.
Obesity and physical activity: a review. Am
Heart J 2006;151:598–603.
27. Svendsen OL, Hassager C, Christiansen C.
Effect of an energy-restrictive diet, with or
without exercise, on lean tissue mass,
resting metabolic rate, cardiovascular risk
factors, and bone in overweight
postmenopausal women. Am J Med
1993;95:131–40.
28. Stefanick ML, Mackey S, Sheehan M,
Ellsworth N, Haskell WL, Wood PD.
Effects of diet and exercise in men and

Shahnawaz Anwer et al CARDIOVASCULAR CO-MORBIDITY AND ROLE OF EXERCISE IN RHEUMATOID ARTHRITIS: A
REVIEW
Int J Cur Res Rev, Sept 2012 / Vol 04 (17) ,
Page 173
postmenopausal women with low levels of
HDL cholesterol and high levels of LDL
cholesterol. N Engl J Med 1998;339:12–20.
29. Kelemen MH, Effron MB, Valenti SA,
Stewart KJ. Exercise training combined
with antihypertensive drug therapy. Effects
on lipids, blood pressure, and left
ventricular mass. JAMA 1990;263:2766–
71.
30. Wallberg-Henriksson H, Rincon J, Zierath
JR. Exercise in the management of
noninsulin- dependent diabetes mellitus.
Sports Med 1998;25:25–35.
31. Kasapis C, Thompson PD. The effects of
physical activity on serum C-reactive
protein and inflammatory markers: a
systematic review. J Am Coll Cardiol
2005;45:1563–9.
32. Shaw DI, Hall WL, Williams CM.
Metabolic syndrome: what is it and what
are the implications? Proc Nutr Soc
2005;64:349–57.
33. Murtagh EM, Boreham CA, Nevill A, Hare
LG, Murphy MH. The effects of 60
minutes of brisk walking per week,
accumulated in two different patterns, on
cardiovascular risk. Prev Med 2005;41:92–
7.
34. Balagopal P, George D, Patton N.
Lifestyle-only intervention attenuates the
inflammatory state associated with obesity:
a randomized controlled study in
adolescents. J Pediatr 2005;146:342–8.
35. Haykowsky M, Vonder Muhll I, Ezekowitz
J, Armstrong P. Supervised exercise
training improves aerobic capacity and
muscle strength in older women with heart
failure. Can J Cardiol 2005;21:1277–80.
36. Klocek M, Kubinyi A, Bacior B, Kawecka-
Jaszcz K. Effect of physical training on
quality of life and oxygen consumption in
patients with congestive heart failure. Int J
Cardiol 2005;103:323–9.
37. Levinger I, Bronks R, Cody DV, Linton I,
Davie A. The effect of resistance training
on left ventricular function and structure of
patients with chronic heart failure. Int J
Cardiol 2005;105:159–63.
38. Leng GC, Fowler B, Ernst E. Exercise for
intermittent claudication. Cochrane
Database Syst Rev 2000; CD000990.
39. Clark AM, Hartling L, Vandermeer B,
McAlister FA. Meta-analysis: secondary
prevention programs for patients with
coronary artery disease. Ann Intern Med
2005;143:659–72.
40. Mears S. The importance of exercise
training in patients with chronic heart
failure. Nurs Stand 2006;20:41–7.
41. Ko JK, McKelvie RS. The role of exercise
training for patients with heart failure. Eura
Medicophys 2005;41:35–47.
42. Bassuk SS, Manson JE. Physical activity
and the prevention of cardiovascular
disease. Curr Atheroscler Rep 2003;5:299–
307.
43. Farrell SW, Kampert JB, Kohl HW 3rd.
Influences of cardiorespiratory fitness
levels and other predictors on
cardiovascular disease mortality in men.
Med Sci Sports Exerc 1998;30:899 905.
44. Blair SN, Kampert JB, Kohl HW 3rd.
Influences of cardiorespiratory fitness and
other precursors on cardiovascular disease
and all-cause mortality in men and women.
JAMA 1996;276:205–10.
45. Eaton CB. Relation of physical activity and
cardiovascular fitness to coronary heart
disease, Part II: Cardiovascular fitness and
the safety and efficacy of physical activity
prescription. J Am Board Fam Pract
1992;5:157–65.
46. Myers J, Prakash M, Froelicher V, Do D,
Partington S, Atwood JE. Exercise capacity
and mortality among men referred for
exercise testing. N Engl J Med
2002;346:793–801.
47. Gibbons LW, Mitchell TL, Wei M, Blair
SN, Cooper KH. Maximal exercise test as a
predictor of risk for mortality from
coronary heart disease in asymptomatic
men. Am JCardiol 2000;86:53–8.
48. Bouchard C, An P, Rice T. Familial
aggregation of VO2max response to
exercise training: results from the
HERITAGE Family Study. J Appl Physiol
1999;87:1003–8.
49. Skinner JS, Jaskolski A, Jaskolska A. Age,
sex, race, initial fitness, and response to
training: the HERITAGE Family Study. J
Appl Physiol 2001;90:1770–6.

Shahnawaz Anwer et al CARDIOVASCULAR CO-MORBIDITY AND ROLE OF EXERCISE IN RHEUMATOID ARTHRITIS: A
REVIEW
Int J Cur Res Rev, Sept 2012 / Vol 04 (17) ,
Page 174
50. Fletcher GF, Balady G, Blair SN.
Statement on exercise: benefits and
recommendations for physical activity
programs for all Americans. A statement
for health professionals by the Committee
on Exercise and Cardiac Rehabilitation of
the Council on Clinical Cardiology,
American Heart Association. Circulation
1996;94:857–62.
51. Bendermacher BL, Willigendael EM,
Teijink JA, Prins MH. Supervised exercise
therapy versus non-supervised exercise
therapy for intermittent claudication.
Cochrane Database Syst Rev 2006;
CD005263.
52. Deforche B, De Bourdeaudhuij I.
Differences in psychosocial determinants of
physical activity in older adults
participating in organised versus non-
organised activities. J Sports Med Phys
Fitness 2000;40:362–72.
53. Oguma Y, Shinoda-Tagawa T. Physical
activity decreases cardiovascular disease
risk in women: review and meta-analysis.
Am J Prev Med 2004;26:407–18.
54. Kraus WE, Houmard JA, Duscha BD.
Effects of the amount and intensity of
exercise on plasma lipoproteins. N Engl J
Med 2002;347:1483–92.
55. Jakicic JM, Marcus BH, Gallagher KI,
Napolitano M, Lang W. Effect of exercise
duration and intensity on weight loss in
overweight, sedentary women: a
randomized trial. JAMA 2003;290:1323–
30.
56. Duscha BD, Slentz CA, Johnson JL.
Effects of exercise training amount and
intensity on peak oxygen consumption in
middle-age men and women at risk for
cardiovascular disease. Chest
2005;128:2788–93.
57. Fletcher GF. The antiatherosclerotic effect
of exercise and development of an exercise
prescription. Cardiol Clin 1996;14:85–95.
58. ACSM. ACSM’s Guidelines for Exercise
Testing and Prescription. Seventh edn,
2005: Lippincott Williams & Wilkins,
USA.
59. Pescatello LS. Exercise and hypertension:
recent advances in exercise prescription.
Curr Hypertens Rep 2005;7:281–6.
60. Pescatello LS, Guidry MA, Blanchard BE.
Exercise intensity alters postexercise
hypotension. J Hypertens 2004;22:1881–8.
61. Koutedakis Y, Metsios GS, Stavropoulos-
Kalinoglou A. Periodisation of exercise
training in Sport. In: Whyte G, ed. The
physiology of training, Philadelphia:
Churchill Livingstone, Elsevier, 2006:1–21.

Monali N. Rajurkar et al. NON-HEALING SKIN ULCER IN HIV / TUBERCULOSIS CO-INFECTION: A CASE REPORT
Int J Cur Res Rev, Sept 2012 / Vol 04 (17) ,
Page 175
IJCRR
Vol 04 issue 17
Section: Healthcare
Category: Case Report
Received on: 03/06/12
Revised on: 20/07/12
Accepted on: 12/08/12
NON-HEALING SKIN ULCER IN HIV / TUBERCULOSIS CO-
INFECTION: A CASE REPORT
Monali N. Rajurkar, Silpi Basak
Department of Microbiology, Jawaharlal Nehru Medical College,
Sawangi, Wardha, M.S., India
Email of corresponding author: [email protected]
ABSTRACT
Introduction: Tuberculosis (TB) is very common in India, China and other developing
countries. World Health Organisation (WHO) had estimated 9.2 million new cases of TB,
worldwide in 2006 of which 7.7% were positive for Human Immunodeficiency Virus (HIV). In
India, at the end of 2007, there were 2.5 million people living with HIV and AIDS (PLWHA)
whereas incidence of TB was 1.8 million cases per year. Tuberculosis is the most common HIV
related opportunistic infection in India and caring for patients with HIV/TB co-infection is a
major public health challenge. The incidence of tuberculosis is more in people living with HIV
infection. So, WHO has developed the strategy of treating HIV/TB co-infection irrespective of
patient’s CD4 count. If any HIV positive patient is diagnosed to be infected with tuberculosis,
the Antitubercular treatment (ATT) is started along with Antiretroviral therapy (ART). Here, we
report a case of skin ulcer due to Mycobacterium tuberculosis on chest, secondary to pulmonary
tuberculosis in HIV infected person with varied presentation.
Material and Methods: At first pyogenic infection due to Methicillin Resistant Staphylococcus
auereus (MRSA) was diagnosed. As the patient did not improve even after the full course of
Linezolid therapy for Methicillin Resistant Staphylococcus aureus (MRSA) which was
superadded infection, the discharge and also tissue material were collected from the base of ulcer
and cultured on Lowenstein – Jenesen media and Ziehl-Neelsen staining were done. The acid
fast bacilli were present on staining and growth on Lowenstein - Jenesen media was identified as
Mycobacterium tuberculosis.
Outcome of study: As the patient was also HIV positive both ATT and ART was started. A
significant improvement of the cutaneous lesion was noted after one month of treatment and
patient was discharged after another fifteen days.
Conclusion: Tuberculosis is very common in India and sophisticated automated system for
detecting M.tuberculosis is not available in all centers. Any non-healing ulcer not responding to
routine antibiotics must be screened for tuberculosis in developing countries. If tuberculosis is
detected, promptly HIV testing must be done so that treatment strategy can be finalised.
Key Words: HIV/TB co-infection, People living with HIV and AIDS (PLWHA), Skin
tuberculosis
INTRODUCTION
Tuberculosis is one of the oldest diseases,
known to mankind and its evidence is
detected even in Egyptian mummies. It
remains as a leading cause of death
worldwide, especially in developing
countries like India, China etc. In the initial
period of twentieth century, V.A.Moore has
rightly said that as a destroyer of mankind,
tuberculosis has no equal [1]. Almost one
third of world population is infected with
tuberculosis and in 1993 World Health
Organisation (WHO) has declared
tuberculosis an global emergency [2]. The

Londhe Shashikala et al. FUSION OF FIRST AND SECOND THORACIC RIB NEAR STERNAL END
Int J Cur Res Rev, Sept 2012 / Vol 04 (17) ,
Page 176
risk of developing tuberculosis is estimated
to be between 20-37 times greater in people
living with HIV than among those without
HIV infection [3]. Similarly, tuberculosis
accelerates the progression of HIV
infection to Acquired Immuno Deficiency
Syndrome (AIDS) and shortens the survival
of such patients. Of 1.8 million HIV related
deaths in 2009, 22% were due to
tuberculosis [4]. Even risk of drug resistant
tuberculosis is higher amongst persons with
HIV infection compared to others (HIV
negative).
Tuberculosis skin ulcers are extremely
unusual. Cutaneous tuberculosis is caused
by Mycobacterium tuberculosis and rarely
by Mycobacterium bovis. Even in India and
China where tuberculosis is quite common,
cutaneous tuberculosis cases are rare i.e.
0.1 to 2.5%[5]. Moreover, Seeman et al in
2008 have reported that cutaneous
tuberculosis is still a difficult disease to
diagnose [6].
Here, we present a case with ulcerative
lesion on right side of chest. The patient
was diagnosed as a case of cutaneous
tuberculosis with HIV and was treated with
proper antiretroviral therapy and
antitubercular drugs.
Word count - 246
CASE STYDY
OBSERVATIONS AND RESULTS:
A 38 years old man presented with multiple
ulcers over right axilla extending to the
right chest wall with purulent discharge,
was admitted to our hospital. The patient
gave the history of small swelling over
right axilla, 6-8 months back which was
gradually increasing in size and was
painful. As the patient was an agricultural
worker, the history of trauma or thorn prick
was specifically asked to rule out any
actinomycotic or fungal infection. The
patient had history of persistent cough 3-4
months back. But there was no history of
weight loss. Patient was treated by many
doctors from time to time but patient did
not respond. The swelling was around 4cm
× 3cm and as it was on the lower part of
right axilla, it was diagnosed as axillary
abscess and incision and drainage was done
two and half month back, in a private
nursing home. The pus was not sent for any
investigation and patient was treated with
antibiotic. As patient was very anaemic, 2
bottles of blood transfusion was given in
the nursing home. Then other axillary
swelling developed and ulcerated within
one and half month. Hence, multiple ulcers
with purulent discharge developed
extending from right axilla to right chest
wall (Photo 1). The investigations done in
our hospital was:
Fasting plasma glucose levels: 90 mg/dl,
Haemoglobin: 6.1 gm/dl, ESR: 138 mm in
first hour, Peripheral smear showed
microcytic hypochromic anaemia, platelets
were adequate and other parameters were in
normal limits and X – ray chest: Lungs
clear.
Fine needle aspiration cytology (FNAC)
from ulcerative lesion showed acute
inflammatory cells. Gram’s staining of the
pus showed plenty of Gram positive cocci
arranged in clusters. On routine culture,
Methicillin Resistant Staphylococcus
aureus (MRSA) was isolated which was
sensitive to Vancomycin and Linezolid and
resistant to Penicillin, Erythromycin,
Ciprofloxacin and Quinapristine,
Dalfopristine. Methicillin resistance was
detected using Cefoxitin (Cx 30μg) disk as
per CLSI guideline [7].The patient was
treated with Linezolid but the ulcers were
not healing.
Considering high ESR and as the ulcers
were not healing, the discharge was
collected from edge and base of the ulcer

Londhe Shashikala et al. FUSION OF FIRST AND SECOND THORACIC RIB NEAR STERNAL END
Int J Cur Res Rev, Sept 2012 / Vol 04 (17) ,
Page 177
and Ziehl Neelsen staining with 20%
H2SO4 was done. In the smear plenty of
Acid fast bacilli (AFB) were present and
some were beaded in appearance (Photo 2).
On the same day, patient’s sputum samples
were examined and it was negative for Acid
fast bacilli. On next day morning, the
induced sputum was collected and smear
showed plenty of Acid fast bacilli (3+) and
some were beaded in appearance (Photo 3).
As the patient was AFB positive, patient’s
serum was tested for HIV antibody and the
patient was found to be HIV positive as per
NACO guidelines [8], though the patient
did not give any relevant history.
The tissue collected from base of ulcer was
homogenized and concentrated by Petroff’s
method and the deposit was inoculated into
two bottles of Lowenstein-Jensen media (L-
J). Patient’s sputum was also inoculated
into two bottles of L-J media after Petroff’s
method. The rough, tough and buff
coloured colonies of M.tuberculosis appear
on L-J slant on fourth week from sputum
and from the tissue growth appeared on
sixth week on L-J media (Photo 4). The
AFB staining from the growth revealed
plenty of Acid fast bacilli and the growth
was niacin positive.
As the patient was HIV positive and
sputum and exudate from ulcer was
positive for Mycobacterium tuberculosis,
antiretroviral therapy (ART) and
antitubercular drug regimen was also
started on the same day. The patient
responded to the treatment very well and
after three and half months came for follow
up when skin ulcers healed completely.
DISCUSSION:
Cutaneous tuberculosis is also an ancient
disease and was described long before
Robert Koch identified Mycobacterium
tuberculosis in 1882. Laennec in 1826 first
gave the description of cutaneous
tuberculosis on his own prosector’s wart
which developed after an injury while
performing autopsy on a patient with spinal
tuberculosis [9]. In 1886, Reil and Paltauf
established that the wart was a tubercular
lesion [10]. The clinical varieties of
cutaneous tuberculosis can be divided into
three broad groups – a) patients who were
not previously exposed to M.tuberculosis,
b) patients who were previously sensitized
and c) tuberculids that develops a
hypersensitive response of a tuberculosis
focus elsewhere in the body. As previously
sensitized hosts are very common in
developing countries like India, lupus
vulgaris is the most common variety of
cutaneous tuberculosis reported from India,
followed by TB verrucosa cutis and
scrofuloderma [5]. No systematic survey
for prevalence of cutaneous tuberculosis
has been carried out in India. In one of the
study it was found that cutaneous
tuberculosis was associated with
tuberculosis in other organs in 22.1%
patients and the other organ most
commonly involved were lungs. Even in
the present case, the patient was having
tubercular ulcer along with involvement of
lungs. Most studies also reported that male
are most commonly affected. Cutaneous
tuberculosis sometimes has very diverse
clinical presentation.
The initial presentation may resemble a
common bacterial infection or the
ulcerative lesion may have superadded
bacterial infection [11, 12]. In our case,
initially patient had superadded infection
with Methicillin Resistant Staphylococcus
aureus (MRSA). After taking full course of
Linezolid, the ulcer remained as it is and
that made us to think for doing acid fast
staining from the discharge. In culture, the

Londhe Shashikala et al. FUSION OF FIRST AND SECOND THORACIC RIB NEAR STERNAL END
Int J Cur Res Rev, Sept 2012 / Vol 04 (17) ,
Page 178
growth was identified as M.tuberculosis.
Currently the cause of skin ulcers may be
vascular ulcers, squamous cell carcinoma,
rodent ulcers, tubercular ulcers etc [13].
The differential diagnosis of cutaneous
tuberculosis also includes infections with
Mycobacterium ulcerans and
Mycobacterium marium, Cutaneous
anthrax, Cutaneous leishmaniasis,
Sporotrichosis, Cat scratch disease due to
Bartonella henselae etc [14].
In our case, as the patient was suffering
from tuberculosis and HIV seropositive, the
patient was treated with ART and ATT. In
2009, out of 1.7 million people died from
tuberculosis. 4,00,000 (24%) were among
people living with HIV. Tuberculosis is
also one of the leading causes of morbidity
and mortality among PLWHA. Hence,
WHO implemented collaborative HIV /
Tuberculosis activities to decrease the
burden of HIV / Tuberculosis coinfection.
In patients with latent Tuberculosis
infection, the risk of developing active
diseases is several hundred folds higher
among persons who acquire HIV. In 2007 it
was reported from Brazil, 80% reduction in
tuberculosis cases in HAART treated
compared to ART naïve HIV infected
person [15].
CONCLUSION
It has been observed that HIV epidemic
continues to fuel TB epidemics and each
increasing the morbidity and mortality of
the other. WHO recommends the
implementation of the Three I’s for HIV /
Tuberculosis co-infection to reduce the
burden of Tuberculosis among people
living with HIV [16]. The three I’s are – i)
Intensive tuberculosis case finding, ii)
Isoniazid preventive therapy and iii)
Infection control for tuberculosis. There is
strong evidence that Antiretro-viral
Therapy (ART) can lower a person’s viral
load and restore the immune system and
hence, significantly reduces HIV and
Tuberculosis. WHO in 2011 recommends
earlier ART at ≤350 CD4 count and
immediate initiation of ART for all patients
with HIV/TB co-infection irrespective of
CD4 count[17]. Proper training and
continuing medical education of health care
workers is needed for early detection of
cases with HIV/TB co-infection, so that
WHO treatment strategies can be followed
for a better outcome of the patient.
Hence to conclude, in India, China and
other developing countries, any non-healing
skin ulcer, not responding to routine
antibiotics, must be screened for
tuberculosis and if positive, the patient
must be screened for HIV.
ACKNOWLEDGEMENT
Authors acknowledge the immense help
received from the scholars whose articles
are cited and included in references of this
manuscript. The authors are also grateful to
authors/ editors/publishers of all those
articles, journals and books from where the
literature for this article has been reviewed
and discussed.
REFERENCES
1. Meyer JA Captain of All these Men of
Death: Tuberculosis Historical
Highlights. St. Louis. Warren H Green.
1977
2. Khatri GR, Frieden TR, Controlling
tuberculosis in India. The New England
Journal of Medicine 2002; 347:1420-
1425
3. Guidelines for intensified tuberculosis
case finding and isoniazid preventive
therapy for people living with HIV in
resource-constrained setting. World
Health Organization, 2011

Londhe Shashikala et al. FUSION OF FIRST AND SECOND THORACIC RIB NEAR STERNAL END
Int J Cur Res Rev, Sept 2012 / Vol 04 (17) ,
Page 179
4. UNAIDS 2010 Global Report fact
Sheet in World Health Organization
HIV/TB Facts 2011;1-8.
5. Raman M. Cutaneous tuberculosis.
Chapter 25. In Tuberculosis. Sharma
SK, Mohan A editors. Jaypee Brothers
Medical Publishers New Delhi, 2nd
ed.
2009; 384-396.
6. Seeman R., Trabonlsi R and Kanj S.
Primary Mycobacterium tuberculosis
complex cutaneous infection, Report of
two cases and literature review.
International Journal of Infectious
Diseases 2008; 12:472-477.
7. Clinical and laboratory Standards
Institute (CLSI). Performance
Standards for Antimicrobial
Susceptibility testing 2006; 9th
ed. CLSI
document M2-M9 Wayne, PA: CLSI,
2006.
8. Detection of HIV infection Ch. 6, In:
National AIDS Control Organisation,
Guidelines on HIV testing, March
2007;38-53.
9. Laennec RTH, Traite de l’auscultation
mediate et des maladies des pneumons
et du Coeur Vol 1, Paris : Asselin and
Cie ;1826 p 649-650. Quoted in
Marmelzat WL Laennec and the
prosector’s wart’’. Arch Dermatol.
1962;86: 122-124.
10. Riehl G, Paltauf R Tuberculosis
verrucosa cutis. Eine bisher notch nitch
beschriebne Form von Hauttuberenlose.
Vjschn Derm Syph 1886; 13:19 Quoted
in Most com Lupus vulgaris Raman M
11. Tappeiner G, Wolff K. Tuberculosis
and other Mycobacterial infections. In
Freedberg IM, Eisen AZ, Wolff K et al.
eds. Dermatology in general Medicine,
Vol 2, 5th
edn. New Yark: McGraw –
Hill, 1999:2274-2292.
12. Beyt BE Jr., Orbals DW, Santa
Cruz DJ, et al. Cutaneous
mycobacteriosis: analysis of 34 cases
with a new classification of the disease.
Medicine 1981;60: 95-109.
13. A Morrone, F Dassoni, MC Pajno et al
Ulcers of the face and neck in women
with pulmonary tuberculosis:
presentation of a clinical case, Clinical
case report, Rural and Remote Health,
The International Electronic and
Journal of Rural and Remote Health
Research, Education Practice and
Policy, 2010:10:1485-1489(Online).
14. GL Dandagi. Primary tuberculosis of
skin – a nodular variant rare case report,
Journal of Clinical and Diagnostic
Research, 2010; 4: 3561-65.
15. Miranda A, Morgan M, Jamal L,
Laserson K, Barreire D Silva G, Santos
J et al Impact of antiretroviral therapy
on the incidence of tuberculosis: the
Brazilian experience, 1995-2001, 2007;
PLos ONE 2 e826.
16. Guidelines on intensified tuberculosis
case finding and isoniazid preventive
therapy for people living with HIV in
resource constrained setting, WHO
2011http://whqlibdoc.who.int/publicati
ons/2011/9789241500708_eng.pdf
17. Guidelines on antiretroviral therapy for
HIV infection in adults and adolescents.
WHO 2010
http://whqlibdoc.who.int/publications/2
010/9789241599764_eng.pdf

Londhe Shashikala et al. FUSION OF FIRST AND SECOND THORACIC RIB NEAR STERNAL END
Int J Cur Res Rev, Sept 2012 / Vol 04 (17) ,
Page 180
FIGURES:
Figure 1: Superadded skin ulcer infection
Figure 1: Skin ulcer with superadded
infection
TOP SIDE ↑
Figure 1: Skin ulcer with superadded
infection
Figure 2: Ulcer after traetment with
Linezolid
Figure 2: Tubercular ulcer after treatment
with Linezolide.
TOP SIDE ↑
Figure 2: Tubercular ulcer after treatment
with Linezolide.
Figure 3: AFB from ulcer
Figure 3: Acid fast bacilli from base of the
ulcer.
TOP SIDE ↑
Figure 3: Acid fast bacilli from base of the
ulcer
Figure 4: AFB from sputum
Figure 4: Acid fast bacilli from sputum
TOP SIDE ↑
Figure 4: Acid fast bacilli from sputum

Londhe Shashikala et al. FUSION OF FIRST AND SECOND THORACIC RIB NEAR STERNAL END
Int J Cur Res Rev, Sept 2012 / Vol 04 (17) ,
Page 181
Figure 5: M.tuberculosis on L-J media
Figure 5: Growth of M.tuberculosis on L-J
media from tissue exudate
TOP SIDE ↑
Figure 5: Growth of M.tuberculosis on L-J
media from tissue exudate

N. Balasundari et al. GROWTH AND CHARACTERIZATION OF PICRIC ACID MIXED ZTS SINGLE CRYSTALS
Int J Cur Res Rev, Sept 2012 / Vol 04 (17) ,
Page 182
IJCRR
Vol 04 issue 17
Section: Technology
Category: Research
Received on: 03/06/12
Revised on: 13/07/12
Accepted on: 12/08/12
GROWTH AND CHARACTERIZATION OF PICRIC ACID
MIXED ZTS SINGLE CRYSTALS
N. Balasundari1, P. Selvarajan
2, S. Lincy Mary Ponmani
1, D. Jencylin
1
1Department of Physics, Infant Jesus College of Engineering, Tuticorin,
TN, India 2Physics Department, Aditanar College of Arts and Science, Tuticorin, TN,
India
Email of corresponding author: [email protected]
ABSTRACT
The growth of picric acid-doped Zinc tris (thiourea) sulphate (ZTS) single crystals were grown
from aqueous solution by slow evaporation technique. 1.5 Mol% of picric acid was added in
saturated solution of ZTS. When picric acid was added as dopant, morphological alterations
were noticed in the grown crystals. Cell parameters of the grown crystals were obtained from the
XRD analysis and the presence of functional groups was identified by FTIR study. Its optical
properties were examined by UV-vis analysis. The microhardness values were measured for the
grown crystals and discussed.
Keywords: ZTS; doped, Solubility, Crystal Growth, FTIR, Microhardness, SHG
Introduction
Zinc (tris) thiourea sulphate (ZTS) is a semi-
organic NLO material for second harmonic
generation from metal complexes of thiourea.
High-damage threshold and wide transparency
make it a better alternative for KDP crystals in
frequency-doubling and laser fusion experiments
[1,2]. SHG efficiency of ZTS crystal is 1.2 times
more than that of KDP [3,4]. ZTS crystal belongs
to the orthorhombic system with the space group
Pca21. The growth of ZTS crystals from aqueous
solution and its characterization have been
reported in a number of recent publications [5-9].
Picric acid is one of the organic compounds
having tendency to form the stable picrate
compounds with various organic molecules. It
has been reported that doping NLO crystals with
organic and inorganic additives can alter various
physical properties and doped–NLO crystals may
find wide applications in optoelectronic devices
compared to pure NLO crystals [10, 11]. Keeping
this in mind, pure and picric acid-doped Zinc
(Tris) Thiourea sulphate (ZTS) crystals have been
crystallized and studied in the present work. The
results of the growth, solubility, XRD studies,
FTIR studies, UV-Vis analysis, and
microhardness studies of the grown crystals are
reported in this paper.
Experimental methods and instrumentation
Synthesis and Growth
Pure crystal of Zinc (tris) Thiourea sulphate
(ZTS) was synthesized by dissolving high purity
AR grade Zinc Sulphate heptahydrate and
thiourea in molar ratio 1:3 in double distilled
water. The solution was stirred by a magnetic
stirrer and white crystalline ZTS salt was obtained
on heating at 45 oC for a long time. The salt was
purified by repeated re-crystallization. To obtain
picric acid-doped ZTS salt, 1.5 mol% of picric
acid was added to solution of ZTS and the
solution was heated at 60 oC. Single crystals of

N. Balasundari et al. GROWTH AND CHARACTERIZATION OF PICRIC ACID MIXED ZTS SINGLE CRYSTALS
Int J Cur Res Rev, Sept 2012 / Vol 04 (17) ,
Page 183
ZTS and picric acid-doped ZTS were grown from
saturated solutions of synthesized salts by the
solution growth employing slow evaporation
technique at room temperature (31 oC). The good
quality transparent and colorless pure ZTS crystal
was harvested in 20 -25 days. Transparent and
pale yellow colored picric acid-doped ZTS
crystals were harvested within 20 days. The
photograph of grown crystals is shown fig. 1.
Instrumentation
Single crystal X-ray diffraction studies were
carried out for the grown crystals of this work
using ENRAF NONIUS CAD-4 X-ray
diffractometer with MoKα (λ=0.71069 Å)
radiation to evaluate the structural properties. The
transmission properties of the crystals were
examined using Lambda 35 model Perkin Elmer
double beam UV-vis-NIR spectrometer in the
range from 190 nm to 1100 nm. Optically
polished single crystal of thickness 2 mm was
used for this study. The Fourier transform infrared
spectrum (FTIR) of the sample was recorded in
the region 400-4000 cm-1
with Perkin Elmer
Fourier transform infrared spectrometer (Model :
Spectrum RXI) using KBr pellet. Microhardness
measurement was carried out using Vickers
microhardness tester fitted with a diamond
indentor. The Second Harmonic Generation
(SHG) conversion efficiency was tested using
a set-up of Kurtz and Perry [12] and it was
carried out using Q-switched mode locked
Nd:YAG laser with first harmonic output at 1064
nm.
The grown sample was powdered with uniform
particle size of about 600 nano meter using a ball
mill and the powdered sample was packed
densely between two transparent glass slides. The
fundamental laser beam of 1064 nm wavelength,
8 ns pulse with 10 Hz pulse rate was made to fall
normally on the sample cell. The emitted green
light from the sample was detected by a
photomultiplier tube (PMT) and displayed on a
Cathode Ray Oscilloscope (CRO). KDP crystal
was powdered into identical size as that of the
sample of this work and it was used as reference
material in the SHG measurement.
Results and discussion
Solubility studies
Solubility study for the synthesized salts was
carried out using a hot-plate magnetic stirrer and a
digital thermometer. The procedure for finding
solubility is reported elsewhere [13]. The
variation of solubility with temperature for the
samples is shown in figure 2. It is observed from
the results that the solubility increases with
temperature for both the samples and it is found to
be more for picric acid doped ZTS sample. It is
clear that for the picric acid -doped sample, the
solvent is able to accommodate a marginally
increased amount of solute for the saturation at
the same temperature. Since solubility increases
with temperature, the samples of this work have
positive temperature coefficient of solubility. The
increase in solubility for the picric acid-doped
sample may be responsible for the change in the
growth rate and morphological change observed
in the present work.
Single crystal XRD studies
The grown crystals were subjected to single
crystal XRD analysis and single crystalline data
were obtained. From the data, it is observed that
pure and picric acid-doped ZTS crystals
crystallize in orthorhombic system and the unit
cell parameters are listed in table 1. The obtained
values of lattice parameters for the pure ZTS
crystal are found to be in good agreement with the
reported literature [5]. The changes in the lattice
parameters are due to incorporation of picric acid
in the lattice of ZTS crystal.

N. Balasundari et al. GROWTH AND CHARACTERIZATION OF PICRIC ACID MIXED ZTS SINGLE CRYSTALS
Int J Cur Res Rev, Sept 2012 / Vol 04 (17) ,
Page 184
Powder XRD Analysis
The powder X-ray diffraction (XRD) pattern
picric acid-doped ZTS crystal are shown in
the figure 3. The well-defined peaks at specific 2θ
values show high crystallinity of the grown
crystals. All the reflections of powder XRD
patterns of this work were indexed using the
TREOR software package following the
procedure of Lipson and Steeple [14]. The values
of hkl, relative intensity and 2 theta values for the
reflection peaks of the powder XRD pattern are
given table 2. Using the values in the table 2 and
the UNITCELL software package, the cell
parameters were found and it is observed that the
values of unit cell parameters obtained from
powder XRD method are in comparable with
those obtained from single crystal XRD method.
FTIR Spectral studies
The FTIR analysis was carried out by Perkin
Elmer FTIR spectrometer by KBr pellet technique
in the range 500-4000 cm-1
. The FTIR spectra of
pure and picric acid mixed ZTS samples are
shown in figure 4. In ZTS complex, there are two
possibilities by which the coordination with metal
can occur. It may be either through nitrogen or
through sulfur. From spectra, the N-H, absorption
bands in the high frequency region in thiourea
were not shifted to lower frequencies on
formation of metal thiourea complex, thus
coordination of thiourea occurs through sulfur in
ZTS [11]. The NH, C=S and N-C-N stretching
vibrations were also seen. The comparison of the
samples shows slight shift in characteristic
vibrational frequencies of 1.5 mol% picric acid
doped ZTS with respect to pure ZTS. This
confirms the addition of picric acid in grown
crystal. The spectral assignments for the picric
acid mixed ZTS sample are provided in the table
UV-Visible spectral study
The study of optical transmission range of grown
crystals is important because the crystals are
mainly used for optical applications. The UV–
visible study of grown crystal was carried out by
Varian-Cary 5E UV-vis Spectrometer in a range
200 nm to 1100 nm. The absorption spectrum of
1.5 mol% picric acid–doped ZTS is shown in
fig.6 and the inset figure shows UV spectrum of
pure ZTS for comparison. The absorption
spectrum reveals that the crystal has lower cutoff
wavelength at around 290 nm. The absorption
near UV region is associated electron with
transition within thiourea units of ZTS. Doping of
1.5 mol % of picric acid in ZTS does not destroy
the transparency of the crystal. From spectra it is
observed that the lower cutoff wavelength is
almost the same for picric acid doped ZTS and
pure ZTS crystals. The wide range of
transparency in UV-visible and IR region enables
good transmission of the second harmonic
frequencies of Nd: YAG laser. This is an added
advantage of the grown crystals of this work in
the field of optoelectronic applications.
Measurment of microhardness
Microhardness of a crystal is its capacity to resist
indentation. Physically hardness is the resistance
offered by a material to the localized
deformations caused by scratching or by
indentations [15].The selected smooth surfaces of
the grown crystals were used for microhardness
measurement at room temperature using a Vickers
microhardness tester fitted with a diamond
indenter. The hardness of the crystal is calculated
using the relation The hardness of the crystal is
calculated using the relation Hv = 1.8544 P / d2
kg / mm2
where P is the applied load in kg and d
is the length of indentation impression in
millimeter and 1.8544 is a constant of a
geometrical factor for the diamond pyramid [16].
A plot drawn between the hardness value and

N. Balasundari et al. GROWTH AND CHARACTERIZATION OF PICRIC ACID MIXED ZTS SINGLE CRYSTALS
Int J Cur Res Rev, Sept 2012 / Vol 04 (17) ,
Page 185
corresponding loads is shown in figure 6. It is
noticed that Vickers hardness number (Hv)
increases with the applied load satisfying the
indentation size effect. When a ZTS crystal is
doped with picric acid, the hardness decreases and
this decrease in the hardness value of doped
sample can be attributed to the incorporation of
picric acid in the lattice.
Conclusion
Single crystals of pure and picric acid-doped Zinc
(Tris) Thiourea sulphate(ZTS) were synthesized
and solubility studies were carried out for the
prepared samples in de-ionized water in the
temperature ranging from 30 to 50 oC. In
accordance with the solubility data, saturated
solutions were prepared for growing pure and
picric acid doped ZTS crystals by slow
evaporationtechnique. Morphological alterations
have been observed when ZTS crystals are doped
with picric acid. The powder and single crystal
XRD studies confirms the orthorhombic structure
of the grown crystal..The unit cell parameters of
pure ZTS crystals are in agreement with the
literature values. The FTIR spectrum confirms the
presence of all the functional groups in the grown
crystals. UV-visible study reveals the picric acid
doped ZTS crystal has lower cutoff wavelength at
around 290 nm. Mechanical property of the
grown crystals has been studied by microhardness
test and noticed that there is a decrease of
microhardness number for 1.5 mol% of picric
acid-mixed ZTS crystals.
Acknowledgement
The supports extended in the research by
Sophisticated Analytical Instrumentation Facility
(SAIF), IIT, Chennai, RRL, Trivandrum and
M.K.University, Madurai are gratefully
acknowledged. We thank authorities of Aditanar
College of Arts and Science, Tiruchendur and
Infant Jesus College of Engineering, Keela
Vallanadu, Tuticorin for the encouragement given
to us to carry out the research work.
References
1. P. Kerkoc, V. Venkataraman, S. Lochran,
R.T. Bailey, F.R.Cruickshank, D. Pugh, J.N.
Sherwood, J. Appl. Phys. 80 (1996) 6666.
2. H.O. Marcy, L.F. Warren, M.S. Webb, C.A.
Ebbers, S.P. Velsko, G.C. Kennedy, G.C.
Catella, Appl. Opt. 31 (1992) 5051.
3. V. Venkataraman, C.K. Subramanian, H.L.
Bhat, J. Appl. Phys. 77 (1995) 6049.
4. M. Oussaid, P. Becker, M. Kemiche,
Phys.Stat.Sol. (b) 207 (1998)103.
5. P.M. Ushasree, R. Jayavel, C. Subramanian,
P. Ramasamy, J. Crystal Growth 197 (1999)
216.
6. S.Meenakshisundaram, S. Parthiban, N.
Sarathi, R. Kalavathy, G. Bhagavannarayana,
J Crystal Growth 293(2006) 376.
7. J. Ramajothi,S.Dhanuskodi, K. Nagarajan,
Cryst.Res.Technol. 39(2004)414
8. S.Verma,M.KSingh, V.K.Wadhawan,
C.H.Suresh, Pramana, J. Phys. 54(2000)879
9. P.A. Angalinmary, S. Danushkodi, Cryst. Res.
Technol. 36 (2001) 1231.
10. C.Krishnan, P.Selvarajan, T.H.Freeda,
J.Crystal Growth 311 (2008) 141.
11. P.M. Ushasree, R. Jayavel, P. Ramasamy
Mater. Sci. Eng. B65 (1999) 153.
12. S.K. Kurtz, T.T. Perry, J. Appl. Phys. 39
(1968) 3798.
13. B Helina, P Selvarajan and A S J Lucia Rose,
Phys. Scr. 85 (2012) 055803.
14. H. Lipson, H. Steeple, Interpretation of X-ray
Powder Diffraction Patterns, fifth ed.,
Macmillan, New York, 1970.
15. J. H. Westbrook and H. Conrad (Eds), The
Science of Hardness Testing and its Research
Applications (ASME, Metals Park OH,1973).
16. A.S.J. Lucia Rose, P. Selvarajan, S. Perumal,
Spectrochimica Acta Part A 81(2011)270.

N. Balasundari et al. GROWTH AND CHARACTERIZATION OF PICRIC ACID MIXED ZTS SINGLE CRYSTALS
Int J Cur Res Rev, Sept 2012 / Vol 04 (17) ,
Page 186
(a) (b)
Fig. 1: Photographs of (a) Pure ZTS and
1.5.mol% picric acid added ZTS crystals
30 32 34 36 38 40 42 44 46 48 50 52
2.5
3.0
3.5
4.0
4.5
5.0
5.5
6.0
6.5
7.0
7.5
So
lub
ilit
y(g
m/1
00
ml)
Temperature(oC)
Pure ZTS
ZTS + 1.5 mol % of picric acid
Fig.2: Solubility diagram for pure and picric acid-
doped ZTS samples
Table 1: Lattice parameter values of pure and
picric acid-doped ZTS crystals
Sample Cell
parameters
Volume Z
Pure ZTS
crystal
a = 7.858 Å
b=11.255 Å
c=15.529 Å
α=β=γ=90o
1373.41
4
Picric acid-
mixed ZTS
crystal
a =7.752 Å
b=11.166 Å
c=15.501 Å
=β =γ=90o
1342.10
4

N. Balasundari et al. GROWTH AND CHARACTERIZATION OF PICRIC ACID MIXED ZTS SINGLE CRYSTALS
Int J Cur Res Rev, Sept 2012 / Vol 04 (17) ,
Page 187
10 20 30 40 50 60 70
0
200
400
600
800
1000
1200
10
505
0
11
61
063
01
04
22
30
20
30
15
13
110
4
11
3
10
30
22
11
20
21
10
21
11
01
2
00
2
Inte
ncity
(A
.U)
Two Theta (degrees)
Fig. 3: Powder XRD pattern of picric acid-doped
ZTS crystals.
Table 2: Values of 2- theta, relative intensity and
hkl for picric acid-mixed ZTS sample
Peak No. 2-Theta
(degrees)
Relative
intensity %
hkl
1.
2.
3.
4.
5.
6.
7.
8.
9.
10.
11.
12.
13.
14.
15.
16.
17.
18.
19.
11.343
13.883
15.019
15.955
16.891
17.8944
19.498
20.434
22.038
25.648
26.784
28.522
29.792
32.934
34.137
35.340
36.543
39.953
48.174
54.56
26.97
95.60
82.07
100
29.39
34.40
80.01
33.69
41.03
39.69
32.61
56.09
34.31
59.13
24.28
21.86
21.19
19.53
002
012
111
102
021
112
022
103
113
104
131
203
015
230
042
301
106
050
105
4000 3500 3000 2500 2000 1500 1000 500
0
20
40
60
80
100
621
723
773
945
1123
1336
1396
1515
1638
2099
1816
2357
2691
2865
3167
3266
3373
Tra
nsm
itta
nce(
%)
Wavenumber(cm-1
)
Fig.4 (a)
4000 3500 3000 2500 2000 1500 1000 500
0
20
40
60
80
100
33
72
32
75
31
85
2964
2763
2621
1995
2355
589
646792
993
11
59
12
83
14
21
15
33
1624
Tra
nsm
itta
nce
(%
)
Wave number (cm-1)
Fig. 4(b)
Fig.4: FTIR spectrum of (a) pure and (b) picric
acid mixed ZTS samples

N. Balasundari et al. GROWTH AND CHARACTERIZATION OF PICRIC ACID MIXED ZTS SINGLE CRYSTALS
Int J Cur Res Rev, Sept 2012 / Vol 04 (17) ,
Page 188
Table 3: FTIR spectral assignments for picric
acid-doped ZTS sample
Wave number (cm-1
) Assignments
589
646
792
993
1159
1283
1421
1533
1624
3185
3372
δ (C-S-N)
δ (C-S-N)
γ (C=S)
γ(SO4)
γ(N-C-N)
γ(N-C-N)
γ(C=S)
γ(N-C-N)
δ(NH2)
γs(NH2)
γas(NH2)
γ- Stretching, δ–bending, s–symmetric,
as–asymmetric
Fig.5: UV-vis. Absorption spectra of 1.5 mol %
picric acid doped ZTS
20 30 40 50 60 70 80 90 100 110
50
60
70
80
90
100
110
120
130
140
150
Ha
rdn
ess n
um
be
r (k
g/m
m2)
Load (grams)
Pure ZTS crystal
ZTS crystal + 1.5 mol% of picric acid
Fig. 6: Variation of microhardness number with
load for pure and picric acid-doped ZTS crystals.