33rd ANNUAL AUSTRALIAN POULTRY SCIENCE SYMPOSIUM
190
Proceedings of the AUSTRALIAN POULTRY SCIENCE SYMPOSIUM Volume 33 2022
-
Upload
khangminh22 -
Category
Documents
-
view
2 -
download
0
Transcript of 33rd ANNUAL AUSTRALIAN POULTRY SCIENCE SYMPOSIUM

Proceedings of the
AUSTRALIAN POULTRY SCIENCE SYMPOSIUM
Volume 33 2022


33rd ANNUAL AUSTRALIAN POULTRY SCIENCE SYMPOSIUM
VIRTUAL CONFERENCE CAMDEN, NEW SOUTH WALES
7TH - 9TH FEBRUARY 2022
Organised by
THE POULTRY RESEARCH FOUNDATION (University of Sydney)
and
THE WORLD’S POULTRY SCIENCE ASSOCIATION (Australian Branch)

Papers presented at this Symposium have been refereed by external referees and by members of the Editorial Committee. However, the comments and views expressed in the papers are entirely the responsibility of the author or authors concerned and do not necessarily represent the views of the Poultry Research Foundation or the World’s Poultry Science Association.
Enquiries regarding the Proceedings should be addressed to:
The Director, Poultry Research Foundation Faculty of Veterinary Science, University of Sydney Camden NSW 2570
Tel: 02 46 550 656; 9351 1656 Fax: 02 46 550 693; 9351 1693
ISSN-1034-6260

AUSTRALIAN POULTRY SCIENCE SYMPOSIUM 2022
ORGANISING COMMITTEE
The Committee thanks the following, who refereed papers for the Proceedings:
R. AbdollahiY. Bao
G. MillsN. Morgan
R. BarekatainM. Barua
A. MossW. Muir
P. Blackall G. ParkinsonE. BradburyW.L Bryden
S.A. PirzadoJ. Roberts
D. Cadogan E. RouraR. Carter I. RuhnkeP. Chrystal B. SaremiJ. Downing P. SelleN. Dwyer N. SharmaS. Greenhalgh D. StanleyS. Haberecht C. SydenhamP. Hemsworth G. TactacanD. Isaac P. TaylorR. Jenner M. ToghyaniM. Khalil A. TurneyS. Khan G. UnderwoodA. Kocher S. WilkinsonW. Lambert R. WilsonA. Leary D. (A) Wu
Dr. P. Groves (Director) Dr. J. Roberts (Editor) Ms. L. Jamieson (President PRF) Dr. S.Y. Liu (Co-editor) Mr. R. Browning (Vice Pres PRF) Mr. N. Baker Professor W.L. Bryden
Mr. R. Hopcroft Dr. W. Muir Dr. P. Selle
Dr. D. Cadogan Ms. G. Townsend Dr. N. Gannon Dr. S. Wilkinson

The Committee would also like to recognise the following Moderators and Award Presenters for their contribution to:
Australian Poultry Science Symposium 2021
Ms. Lisa Jamieson – President - Poultry Research Foundation Associate Professor Peter Groves – Director - Poultry Research Foundation Mr. Richard Browning – Vice President – Poultry Research Foundation Professor Julie Roberts – President - Australian WPSA Branch Mr. Benjamin Geist – Poultry Research Foundation - University of Sydney Associate Professor Tamsyn Crowley – Poultry Hub Ms. Sarah Haberecht – WPSA Victorian Branch

AUSTRALIAN POULTRY AWARD
The Australian Poultry Award is presented annually to an Australian resident who has made a long-term outstanding contribution to poultry science and/or the Australian poultry industry. The Award is made by the Australian Branch of the World’s Poultry Science Association (WPSA) and takes the form of a suitably inscribed plaque which includes the winner’s name, together with a framed citation. Nominations are called for early each year from the membership of WPSA, and completed nominations require to be forwarded to the Secretary of the Australian Branch no later than 31st July. The selection committee consists of the Australian Branch Management Committee of WPSA (10 members) as well as Award recipients from the previous 10 years who are still active in the Australian poultry Industry. Voting is by secret postal ballot, and if more than two candidates are nominated, a preferential voting system is used. The Award is made to the winner at suitable forums where poultry industry people are gathered, such as the annual Australian Poultry Science Symposium, the biennial Poultry Information Exchange (PIX), and the triennial Australian Poultry Convention.
Previous recipients of the award are:
1964 Mr A.O. Moll 1993 Mr R. Macindoe 1965 Dr M.W. McDonald 1994 Mr B. Bartlett 1966 Professor R.B. Cumming 1995 Dr R.A.E. Pym 1967 Mr F. Skaller 1996 Dr E.E. Best 1968 Professor G.L. McClymont 1997 Mr M. Peacock 1969 Dr S. Hunt 1998 Professor D. Balnave 1970 Dr L. Hart 1999 Dr H. Westbury 1971 Mr N. Milne 2000 Mr L. Brajkovich 1972 Mr R. Morris 2001 Mr R.J. Hughes 1973 Mr J. & Mr R. Ingham 2002 Dr T.M. Grimes 1974 Mr S.J. Wilkins 2003 Dr R. MacAlpine 1975 Professor C.G. Payne 2004 Dr M. Choct 1976 Mr W. Stanhope 2005 Professor P. Spradbrow 1977 Professor B. Sinkovic 2006 Dr J. R. Roberts 1978 Mr J. Douglas 2007 Dr V. Kite 1979 Mr D. Blackett 2008 Mr R. Horn 1980 Dr A.F. Webster 2009 Professor W. Bryden 1981 Mr R. Fuge 2010 Dr G. Parkinson 1982 Dr J.G. Fairbrother 2011 Dr K. Whithear 1983 Dr R.K. Ryan 2012 Dr P.J. Groves 1984 Mr C. Donnelley 2013 Dr B.S. Baines 1985 Dr P. Gilchrist 2014 Dr P. Blackall 1986 Dr C.A.W. Jackson 2015 Dr. T. Walker 1987 Mr E. Rigby 2016 Dr. P. Glatz 1988 Mr W. Shaw 2017 Dr. C. Morrow 1989 Dr H. Bray 2018 Dr. B. Well 1990 Dr M. Mackenzie 2019 Mr. D. Tinworth 1991 1992
Professor D.J. Farrell Dr B.L. Sheldon
2020 Dr. Peter Scott


SPONSORS of the 2022
AUSTRALIAN POULTRY SCIENCE SYMPOSIUM
Diamond Sponsors
DSM Nutritional Products Aust. Pty. Ltd
Gold Sponsors
AB Vista Australian Eggs/AgriFutures/Poulty Hub – Chook Chat Shack
BASF Australia Ltd Feedworks / Dupont Pty. Ltd
Novus International Perstorp Waspik Bv
Silver Sponsors
Adisseo Asia Pacific Pte. Ltd Alltech Lienert Australia
EW Nutrition Australia Pty. Ltd Elanco Animal Health
Jefo Australia Lallemand Animal Nutrition
Ruth Consolidated Industries Pty. Ltd
Bronze Sponsors
ADM Evonik Australia Pty. Ltd
Kemin AustraliaOrffa Additives B.v


CONTENTS
1
6
7
10
11
12
16
17
21
22
SUSTAINABILITY
HOW CAN THE POULTRY INDUSTRY BECOME CARBON NEUTRAL? R. Eckard – University of Melbourne, Australia
PRECISION FEED ENHANCES BROILER GROWTH EFFICIENCY A F. Moss, D.J. Cadogan, P.V Chrystal, A. Nawab, R. Barekatain, T.M. Crowley –University of New England, Australia
GUANIDINO ACETIC ACID SUPPLEMENTATION IN REDUCED ENERGY-DIETS ON PERFORMANCE OF BROILER CHICKENSB. Jayaraman,F. Poernama, T. Wibowo, J.C. De Paula Dorigam, P. Krishnan,G. Channarayapatna – Evonik (SEA) Pte Ltd, Singapore
GUANIDINO ACETIC ACID CAN REPLACE ARGININE WITH OR WITHOUT BETAINE IN BROILERS OFFERED MODERATELY LOW CRUDE PROTEIN DIETSN.K. Sharma, D.J. Cadogan, P.V. Chrystal, S.J.Wilkinson, V.Inhuber, A.F. Moss – University of New England, Australia
DIGESTIBILITY FOR BROILERS
IMPROVING THE PROTEIN CONTENT AND DIGESTIBILITY OF GRAIN SORGHUM USING GENE EDITINGI Godwin – University of Queensland, Australia
INFLUENCE OF AGE ON THE STANDARDISED ILEAL AMINO ACID DIGESTIBILITY OF MAIZE AND BARLEY IN BROILERSM, Barua, M.R. Abdollahi, F. Zaefarian, T.J. Wester, C.K. Girish, P.V. Chrystal, V. Ravindran – Massey University, New Zealand
ESTIMATION OF ILEAL ENDOGENOUS ENERGY LOSSES AT DIFFERENT AGES AND INFLUENCE OF DIETARY CELLULOSE LEVELS IN BROILER CHICKENSM.M. Khalil, M.R. Abdollahi, F. Zaefarian, P.V. Chrystal, R. Ravindran – MasseyUniversity, New Zealand
INTERACTIVE EFFECT OF DIETARY CRUDE PROTEIN CONCENTRATION AND BIL ACIDS SUPPLEMENTATION ON GROWTH PERFORMANCE AND PLASMA AMINO ACIDS CONCENTRATIONS OF BROILER CHICKENSM.Toghyani, P.V. Chrystal, S.P. Macelline, P.H. Selle, J.B. Li, Y.M. Bao, S.Y. Liu –The University of Sydney, Australia
DIGESTIBILITY FOR BROILERS
INTESTINAL INTEGRITY OF BROILER CHICKENS IS NEGATIVELY AFFECTED ONLY AT THE LOWEST LEVEL OF DIETARY PROTEIN FORTIFIED WITH SYNTHETIC AMINO ACIDSR. Barekatain, P.V. Chrystal, A.F. Moss, G.S. Howarth, T.T.H. Van, R.J. Moore – ,SARDI/ University of Adelaide, Australia Australia
FAT DEPOSITION IN BROILER CHICKENS OFFERED REDUCED-CRUDE PROTEIN DIETS P.H. Selle, S.P. Macelline, P.V. Chrystal, S.Y. Liu – The University of Sydney, Australia

26
30
34
35
39
43
44
45
49
53
A COMPARISON OF WHEAT- AND SORGHUM-BASED DIETS WITH TWO CRUDE PROTEIN LEVELS ON THE PERFORMANCE OF BROILER CHICKENSS.P. Macelline, P.V. Chrystal, M. Toghyani, S. Greenhalgh, P.H. Selle, S.Y. Liu – The University of Sydney, Australia
EFFECTS OF BRANCHED-CHAIN AMINO ACIDS ON GROWTH PERFORMANCE IN BROILER CHICKENS OFFERED REDUCED CRUDE PROTEIN DIETS BASED ON WHEAT OR SORGHUMS. Greenhalgh, S.Y. Liu, P.V. Chrystal, P.H. Selle – The University of Sydney, Australia
IN OVO INJECTION OF OREGANO ESSENTIAL OIL AT DIFFERENT PH AFFECTS HATCHABILITY AND POST-HATCHING PERFORMANCE IN BROILER CHICKENS A A.Khaskheli, S. Niknafs, M.M.Y. Meijer, E. Roura – University of New England, Australia
WATER AND NUTRIENTS
UNDERSTANDING AND MANAGING WATER FOR SUCCESSFUL FLOCKS S.E. Watkins – University of Arkansas, USA
REQUIREMENT OF DIGESTIBLE CALCIUM AT DIFFERENT DIETARY CONCENTRATIONS OF DIGESTIBLE PHOSPHORUS FOR BROILER GROWERS (DAY 11-24 POSTHATCH) L.S. David, M. R. Abdollahi, G. Ravindran, M.R. Bedford, V. Ravindran – Massey University, New Zealand
EFFECTS OF HYDROXYCHLORIDE ZINC AND ELEVATED LEVELS OF HYDROXYCHLORIDE COPPER IN BROILER CHICKENS’ DIET ON PRODUCTIVE TRAITS AND GUT HEALTH M. Toghyani, T.T.H. Nguyen, A. Kumar, R. Barekatain, R. A. Swick – The University of Sydney, Australia
FIBRE AND GUT HEALTH
FIBRE IN POULTRY RATIONS AND ITS RELATIONSHIP WITH BROILER PERFORMANCE AND GUT HEALTHM. Choct – University of New England, Australia
EFFECTS OF STIMBITOC ON PERFORMANCE AND INTESTINAL BARRIER FUNCTION IN BROILERS CHALLENGED WITH A NECROTIC ENTERITISJ.H. Lee, B.K. Lee, X. Rousseau, G.A. Gomes, H.J. Oh, Y.J. Kim, S.Y. Chang, J.W. An, Y.B Go, D.C. Song, H.A. Cho, J.C. Kim, M.R. Bedford, J.H. Cho – AB Vista, United Kingdom
EFFECTS O FUSING A MULTI-STRAIN BACILLUS PROBIOTIC IN COMBINATION WITH A PHYTASE AND A CARBOHYDRASE ON PERFORMANCE OF BROILER CHICKENS EXPOSED TO ENTERIC CHALLENGEA.E. Ghane, S. Haldar, A.K. Dhara, E. White, C. Evans – Danico Animal Nutrition, Singapore
LONG-TERM CONSUMPTION OF SOLUBLE DIETARY FIBRE INCREASES ACTIVATION OF THE IMMUNE SYSTEM IN BROILER CHICKENSC. Castro, S. Niknafs, G. Gonzalez-Ortiz, M.R. Bedford, J. Kim, E. Roura – The University of Queensland, Australia

INFLUENCE OF PRECISION GLYCANS ON LAYER CECAL COMMUNITY 54 F. Petranyi, Y.Bajagai, S. Ramirez, D. Stanley – Central Queensland University
ANTIMICROBIAL STEWARDSHIP
THE RISE OF ANTIMICROBIAL RESISTANCE 58 D. Stanley – University of Sydney, Australia
MEASURING BROILER RESPONSE WHEN AN ANTIBIOTIC GROWTH PROMOTER ISREMOVED AND REPLACED WITH THERAPEUTIC FEED ADDITIVES
66
R. Yuwars, R. Konkawat, P. Attawoot, M.S. Bekker, T.Tiyasatkulkovit, P. Hutapea,E. Magtagnob – Novus International, Australia
FEEDING A SYNERGISTIC BLEND OF ORGANIC ACIDS AND Β-1,4 MANNAOBIOSE REDUCESCAECAL SALMONELLA IN BROILER CHICKENS
70
S. Van Kuijk, L. Pineda, Y. Han – Trouw Nutrition, Netherlands
MAPPING VARIATION OF CORN DDGS BY IN-VIVO-BASED NIR MODELS 74L.H Zhang, YG. Liu – Adisseo Asia Pacific, Singapore
ARGININE AND ENERGY EFFICACY OF GUANIDINO ACETIC ACID IN BROILER CHICKENS 78B. Saremi, J. Millecam – CJ Europe GmbH, Germany
ENZYMES
FEEDING A DOUBLE DOSE OF XYLANASE IMPROVES FEED CONVERSION IN BROILERSFED CORN-BASED DIETS, BUT NOT WHEAT-BASED DIETS
84
N.K. Morgan, M.M. Bhuiyan, R. Hopcroft – University of New England, Australia
APPRAISAL OF MATRIX VALUES FOR EXOGENOUS PHYTASE ALONE OR INCOMBINATION WITH OTHER ENZYMES IN DIETS FOR BROILER CHICKENS
85
A. F. Moss, A. Ghane, Y. Dersjant-Li, T. D. Dao, M. Suleman, N. K. Morgan, T.M. Crowley – University of New England, Australia
EFFECTS OF XYLANASE DOSAGE AND MIXED NSPASES ON THE IN-VIVO PRODUCTION OFXYLO-OLIGOSACCHARIDES IN BROILERS FED BARLEY, CORN, SORGHUM AND WHEAT-BASED DIETS
89
A.D. Wallace, R. Hopcroft, N.K. Morgan – University of New England, Australia
EVALUATION OF A NOVEL BACTERIAL 6-PHYTASE ON GROWTH EFFICIENCY OFBROILERS AT 35 DAYS OF AGE
90
M. Jlali, M.T. Kidd, M.I. Gracia, M. Francesch, P. Cozannet, B. Yavuz andA. Preynat – Adisseo, France

93
100
104
108
109
113
114
115
124
128
EGG QUALITY
UNDERSTANDING EGG QUALITY D.R. Jones, R.K. Gast – USDA, Georgia USA
EARLY LAY DIET DENSITY AND HEN SIZE: DO THEY AFFECT HEN PRODUCTIVITY AND EGG QUALITY IN LATE LAY? W.I. Muir, Y Akter, K. Bruerton, P.J Groves – The University of Sydney, Australia
ADDING A MACROALGAE BLEND TO COMMERCIAL LAYING HEN DIET IMPROVES EGG QUALITY AND BODY WEIGHT GAINJ.S. Sands, L.R. Park, D.Currie, H. Graham – Ocean Harvest Technology Ltd, UK
LAYER NUTRITION
FOOD WASTE-BASED DIETS ARE AN EFFECTIVE ALTERNATIVE FEED FOR LAYING HENS T.H. Dao, N.K. Sharma, R. Swick, N. Boyle, A.F. Moss – University of New England, Australia
AN ASSESSMENT OF THE USE OF ESSENTIAL OILS IN THE DIET OF LAYING HENS ON THE PERSISTENCE OF RATE OF LAY E.K.M. Raimundo, D.S. Santos, M.B. Lima, M.G.B.L. Sousa, H.C. Costa, L.M. Gomes, E.P. Silva – Sao Paulo State University, Brazil
DETERMINING THE OPTIMAL INCLUSION RATE OF 1-MONOGLYCERIDES OF BUTYRIC,CAPRIC AND CAPRYLIC ACID IN HEALTHY LAYING HENST.Z. Sibanda, M. Kolakshyapati, J. de Souza-Vilela, T.A. Chung, S. Barzegar,L. Hall, L. Li, R.Agra, I Ruhnke – University of New England
CHELATED TRACE MINERALS IMPROVE PULLET FLOCK UNIFORMITY AND EGG
PERFORMANCE DURING EARLY LAY
M. Kolakshyapati, T.Z. Sibanda, J. de Souza-Vilela, T. A. Chung, S. Barzegar,M. Bekker, I. Ruhnke – University of New England, Australia
FEED SAFETY AND BEHAVIOUR STUDIES
THE ROLE OF FEED SAFETY IN DEVELOPMENT OF POULTRY MICROBIOTA D. Stanley – Central Queensland University, Australia
BEHAVIOUR OF PULLETS AND HOUSING SYSTEM PREDICTS BEHAVIOUR OF ADULT LAYING HENS IN COMMERCIAL FREE-RANGE EGG FARMS M. Rice, R. Acharya, J. Taylor, P. Taylor, A. Fisher, P. Hemsworth – University ofMelbourne, Australia
PREFERENCE OF COMMERCIAL FREE-RANGE LAYERS FOR SHELTERS OF DIFFERENT SUNLIGHT FILTERINGM.S. Rana, C. Lee, J.M Lea, D.L.M. Campbell – University of New England,Australia

129
130
133
137
138
139
140
141
142
143
SMOTHERING IN COMMERCIAL FREE-RANGE LAYING HENS M. Stevenson, P. Chowdhury, R. Acharya, M. Rice, J. Taylor, A. Fisher, P. Taylor,P. Hemsworth – University of Melbourne, Australia
VIDEO-BASED LAYING HEN BEHAVIOURS ANALYSIS IN EGG FARMS L. Yu, J. Xu, R. Shepard, Q. Wu, R. Jenner, J. Zhang – University of TechnologySydney, Australia
AUTOMATED FLOCK DENSITY AND MOVEMENT ESTIMATION FOR WELFARE MONITORING IN COMMERCIAL EGG FARMS L. Yu, J. Xu, R. Shepard, Q. Wu, R. Jenner, J. Zhang - University of TechnologySydney, Australia
AUTOMATED DETECTION OF FLOCK HEALTH, BEHAVIOUR AND WEIGHT WITH MACHINE VISION IN COMMERCIAL BROILER SHEDSC. McCarthy, D. Long – University of Southern Queensland
POSTERS
ALTERNATIVE FEED SOURCES
AMINO ACID PROFILE OF PRE-TREATED FEATHER MEAL HYDROLYSATESY. Sun, G. Cai, X. Li, D. Zhang, R.E. Speight, W.L. Bryden – University ofQueensland, Australia
ANTIMICROBIAL STEWARDSHIP
IN-OVO INJECTION OF OREGANO OIL AFTER DAY 12 OF EMBRYONIC DEVELOPMENT DID NOT AFFECT HATCHABILITY IN BROILER CHICKENS S. Niknafs, M. Navarro, A.A. Khaskheli, M.M.Y. Meijer, E. Roura – University ofQueensland, Australia
BROILER NUTRITION
HYDROXY-SELENOMETHIONINE IMPROVES SELENIUM STATUS AND ANTIOXIDANT CAPACITY UNDER HEAT STRESS CONDITIONS H. Sun, L. Zhao, Z.J. Xu, M. de Marco, M. Briens, X.H. Yan, L.H. Zhang– AdisseoS.A.S., France
DETERMINATION OF CALCIUM AND PHOSPHORUS DIGESTIBILITY IN A SHORT-TERM BIOASSAY WITH BROILERS X.Li, D. Zhang, L.Y. Pan, S.J. Wilkinson, W.L.Bryden – Feedworks, Australia
IN-OVO INJECTION OF OREGANO ESSENTIAL OIL ON DAY 17.5 DID NOT AFFECT HATHCABILITY IN BROILER CHICKENS M.M.Y, Meijer, A.A. Khaskhelo, S. Niknafs, E. Roura – University of Queensland,Australia
SULFUR AMINO ACID REQUIREMENT OF STARTER, GROWER, AND FINISHER BROILERS DETERMINED USING L-METHIONINE J. Millecam, A. Dedenauer, D.R. Khan, B. Saremi – CJ Europe GmbH, Germany

FOOD SAFETY
POTENTIAL OF LIVE SALMONELLA TYPHIMURIUM VACCINE TO PROVIDE CROSS-PROTECTION AGAINST A NOVEL SALMONELLA ENTERITIDIS STRAIN IN LAYERS
147
C. Clark, A. Collins, Y.Gao, G Underwood, C. Jackson, S. Williamson, S.Sharpe,P.J. Groves – The University of Sydney, Australia
GUT HEALTH IN BROILERS
EFFECT OF DIETARY INCLUSION OF COMBO ENZYME PRODUCT ON PERFORMANCE ANDGUT HEALTH IN BROILERS
148
Y. Bashir, P.P. Das, V. M. Shelke, R. Chanthirasekaran – Kemin Industries SouthAsia Pvt.Ltd, India
EFFECT OF PLANT-DERIVED ISOQUINOLINE ALKALOIDS ON GROWTH PERFORMANCEAND GUT INTEGRITY OF BROILER CHICKENS REARED UNDER TROPICAL CLIMATE CONDITIONS
152
S. Khongthong, N. Roekngam, P. Piewngam, D. Faroongsarng, W. Kraitavin,P.Piyaram, A. Pastor, T. Steiner, Y. Theapparat – Phytobiotics (Thailand) Co., Ltd
BACILLUS SUBTILIS DSM 29784 IMPROVES BROILER PERFORMANCE AND WELFARE –A META-ANALYSIS APPROACH
156
D.P. Preveraud, F. Rouffineau, B. Guo, N.Vieco, A. Mellouk, S. Saxena – AdisseoS.A.S., France
A MULTI-COMPONENT PROTEASE ALONE OR COMBINED WITH A PROTECTED BLEND OFORGANIC ACIDS AND ESSENTIAL OILS ON MEASURES OF GUT HEALTH AND PERFORMANCE IN BROILERS FED LOW-DIGESTIBLE DIETS
157
G.B. Tactacan, P.Preesong, Y. Ruangpanit – Jefo Nutrition Inc, Canada
EFFECTS O F MULTI-STRAIN BACILLUS PROBIOTIC IN COMBINATION WITH CONSENSUSBACTERIAL 6-PHYTASE AND A CARBOHYDRASE WITH FULL MATRIX IMPLEMENTATIONON PERFORMANCE OF BROILER CHICKENS EXPOSED TO ENTERIC CHALLENGE
158
A.E. Ghane, S. Haldar, A.K. Dhara, F. Sidiq, C. Evans – Danisco Animal Nutrition, Singapore
LAYER NUTRITION
EGG QUALITY IS IMPROVED BY FEEDING HENS FERMENTABLE FIBRE, XYLO-OLIGOSACCHARIDES AND XYLANASE
162
N. K. Morgan, T. Sibanda, M.R. Bedford, G. Gonzalez-Ortiz – University of New England, Australia
HYDROXYCHLORIDE ZINC, COPPER, AND MANGANESE USED IN LAYING HENS’ DIETAFFECTS TIBIA TRAITS AND EFF MINERAL DEPOSITION T.T.H. Nguyen, N.K. Morgan, J.R. Roberts, M.Toghyani, R.A. Swick – University of New England, Australia
163

NUTRITION AND OTHER
BARRIERS TO THE IMPLEMENTATION OF MAXIMUM PROFIT AND STOCHASTIC MODELSIN THE AUSTRALIAN POULTRY INDUSTRY
164
A.F. Moss, T.A. Chung, N. Powell, G. Parkinson, G.M. Pesti, T.M. Crowley – University of New England, Australia
CHICKEN SEXING THROUGH BEAK MORPHOMETRY 165A. Iqbal, A. F. Moss – University of New England, Australia
EVALUATION OF SUBSTANCES AFFECTING TURKEY SPERMATOZOA MOTILITY IN VITRO 166P. Massanyi, T. Slanina, M. Miskeje – Slovak University of Agriculture, Slovakia


HOW CAN THE POULTRY INDUSTRY BECOME CARBON NEUTRAL?
RICHARD ECKARD1
Summary
Following the Paris climate agreement (COP21), countries and agricultural supply chain companies are setting targets towards net zero greenhouse gas (GHG) emissions by 2050. In response, there is now significant interest from agricultural producers exploring options to achieve carbon neutral production. This analysis extracted data from the Australian National Greenhouse Gas Inventory to develop a typical profile of GHG emissions from either a broiler or layer enterprise. The largest on-farm GHG emissions source from poultry production is methane and nitrous oxide from the manure management system, with energy consumption the largest off-farm emission. However, pre-farm embedded emissions from the production of feed may be of similar magnitude to the on-farm emissions. Obvious mitigation options towards carbon neutrality would therefore focus on using existing technology to generate green energy, through increasing methane production from the manure management system, plus reducing ammonia emissions at the same time, and either selling this green energy or displacing electricity from the national grid. Other mitigation options will include balancing the crude protein to energy intake of the birds, further reducing ammonia emissions from manure as an indirect nitrous oxide source. Reducing emissions from feed production may increasingly require sourcing feed from low emissions cropping farms. This analysis shows where the major emission sources are from poultry production and presents options to achieve carbon neutral outcomes using existing technologies. How profitable these are on farm may depend either on a carbon offset incentive mechanism, but more likely to ensure compliance with future market access requirements.
I. INTRODUCTION
The Paris climate agreement (COP21) is a legally binding international treaty, adopted by 196 parties and entered into force in November 2016 (United Nations, 2015). Article 2A of the agreement set the goal of limiting global warming to well below 2 °C, with an aspirational goal of pursuing efforts to limit temperature increases to 1.5 °C, below preindustrial levels. More importantly, the Paris Climate Agreement also set the goal of peaking greenhouse gas (GHG) emissions as soon as possible, but Article 4 set the aim of achieving “a balance between anthropogenic emissions by sources and removals by sinks of GHGs in the second half of this century”, thereby effectively establishing the target of net zero GHG emissions by 2050. Of the 160 nationally determined contributions submitted prior to COP21, 80% of these included mitigation targets for the land sector including agriculture (Richards et al., 2016).
In response to the Paris climate agreement, most multinational agricultural supply chain companies have set their own targets consistent with this agreement, thereby signalling a trajectory for agricultural producers towards low emissions or carbon neutral production (Eckard and Clark, 2018). With a recent analysis by Oxfam (2016) reporting that of the 100 largest economies in the world, 69 of these are companies not countries, it is more important for the farming sector to take note of these targets set by their supply chains, than government targets. In addition, over 50% of the agricultural debt market in Australia is managed by National Australia Bank and Rabobank, both have set the target of net zero financed emissions by 2050. Another development potentially significant for the agricultural industries is proposed
1 Faculty of Veterinary and Agricultural Sciences, University of Melbourne, Parkville, Victoria 3010, Australia. [email protected]
Aust. Poult. Science Symp. 2022...33
1
carbon border adjustment tariffs, that will be applied two countries deemed to have insufficient ambition in climate change taxes and policy. These statements have been made by USA president Joe Biden (Financial Review, 2021a), saying “failure to curb emissions means America will tax your exports” and “to ensure climate policies do not place U.S. workers and companies at an unfair disadvantage”. The European Union has also introduced a Carbon Border Adjustment Mechanism, with the European Parliament to start taxing imports from countries without a carbon price by 2023 (Financial Review, 2021b). As approximately 70% of Australian agricultural product is exported, plus Australia ranking extremely low on the recent Climate Change Performance Index (CCPI 2021), this indicates that our agricultural sector will need to demonstrate low carbon production in order to avoid border adjustment tariffs on our exports. This would indicate that the agricultural sector will be paying some form of carbon price, and that it would be seem more judicious that these funds are spent within the country to better position our industries, then simply paid out as a tax to our target export markets. The main GHG emissions from agriculture would be, firstly, methane largely from enteric fermentation in ruminants and methane resulting from manure management (DISER, 2021). The second GHG of concern would be nitrous oxide, from all forms of nitrogen in agricultural soils, but also nitrous oxide resulting from manure management systems. Agriculture is also a source of carbon dioxide emissions, mainly from the use of lime, urea fertiliser and the purchasing of fossil fuel energy in the form of electricity and fuels. Obviously, emissions profiles differ between agricultural systems, with grain cropping systems mainly emitting nitrous oxide from fertiliser use and from crop residues. Ruminant production systems produce most of their emissions from enteric fermentation, with dairy farms also producing nitrous oxide from higher protein diets and nitrogen fertiliser use (Christie et al., 2018). In contrast, monogastric livestock systems produce most of their on-farm emissions from either methane or nitrous oxide as a result of manure management (AGEIS 2021; DISER, 2021). While mechanistic models exist that can dynamically model the emissions of various agricultural production systems, the currently accepted accounting for GHG emissions in Australia would need to align with the IPCC-approved Australian National Greenhouse Gas Inventory method, but placed within the Climate Active (2019) framework (previously the National Carbon Offset Standard), based on the following emission categories: - Scope 1: All the direct emissions of GHGs from the production system, minus the annual
change in carbon stored in managed trees and soils on the farm; - Scope 2: Emissions from the purchase of electricity from the national electricity grid, as a
result of consumption on the farm, and - Scope 3: Pre-farm emissions from the production of feed, fertilisers and agricultural
chemicals required by the farm. To develop a farm carbon account requires the above Scope 1, 2 and 3 emissions to be
accounted in a pre-farm to farm gate lifecycle analysis framework, calculated on an annual timestep. There are currently a number of emerging mechanisms to achieve carbon neutral accreditation, either through Climate Active itself, or through third party accreditors using the same accounting approaches; although a formal audit published in a peer reviewed paper has also proven acceptable by the supply chains as sufficient evidence of integrity in the audit (e.g. the audit of Doran-Browne et al., 2017).
II. RESULTS As there are no GHG emission calculators in the required Climate Active format, specific to the poultry industry in Australia, for this analysis data were extracted data from the Australian National Greenhouse Gas Inventory (AGEIS, 2021; DISER, 2021) to develop a typical profile
Aust. Poult. Science Symp. 2022...33
2

of GHG emissions from either a broiler or grower enterprise (Figure 1). Electricity and fuel emissions (cf. Energy in Figure 1) were sourced from Wiedeman et al. (2015). The GHG emissions profile data presented in Figure 1 would therefore not be specific to a particular farm, but more a general indication of where the emissions are sourced from in the industry and therefore where further research and mitigation attention should be focused.
Figure 1 - The greenhouse gas emissions profile of a a) layer versus b) broiler enterprise, as calculated by the Australian National Greenhouse Gas Inventory. CH4 = methane; N2O = nitrous oxide; CO2 = carbon dioxide; MM = manure management; Soil = emissions from manure applied to agricultural soils; Atmos = indirect N2O from atmospheric deposition; Leach = indirect N2O from run-off and leaching; Energy = electricity and fuel consumption.
Not accounted in the National Greenhouse Gas Inventory at the individual farm level, and therefore absent from Figure 1, would be the emissions embedded in the production of feed supplied to the broiler or layer farm. According to Wiedeman et al. (2015), GHG emissions from the production of feed supplied to poultry farms could be as much as 55 to 60% of the total emissions, thereby effectively doubling the emissions deemed to be sourced from the production of chicken meat or eggs.
III. DISCUSSION
From the data presented in Figure 1, the scope 1 emissions show that the major on-farm GHG emissions from poultry production would be the methane and nitrous oxide from manure management. However, pre-farm embedded emissions from the production of feed may be of similar magnitude again (Wiedeman et al., 2015). Electricity and fuel emissions (scope 2) could be between ~10 (broilers) and ~20% (layers) of the on-farm GHG emissions, depending on the source and consumption (Wiedeman et al., 2015).
Obvious mitigation options towards carbon neutrality would therefore focus on eliminating the direct emissions from manure management, energy and pre-farm emissions from purchased feed. Technology to minimise methane from manure management system is well established, through covering the manure, thereby generating more methane than the baseline case as a result of the more anaerobic conditions induced. This methane can either be simply flared, returning it from methane, at 28 times global warming potential, back to carbon dioxide (DISER, 2021). However, a more useful deployment of this energy would be heating and generation of electricity, displacing electricity consumed from the national grid and selling the excess back into the grid as green energy. Covering the manure would also reduce the indirect nitrous oxide, through the atmospheric deposition of ammonia, no longer lost from the manure management system. This would result in a more nitrogen-enriched nutrient solution post-digestion of the manure, with increasing options to sell this as a more natural source of low-emissions nitrogen into other agricultural applications, now wanting to avoid the high
Energy CO220%
MM CH430%
MM N2O34%
MM Atmos N2O4%
MM Leach N2O5%
Soil N2O1% Soil Atmos N2O
2%Soil Leach
N2O4%
Energy CO210%
MM CH432%
MM N2O38%
MM Atmos N2O8%
MM Leach N2O3%
Soil N2O1% Soil Atmos N2O
2%Soil Leach
N2O6%
a) Layers b) Broilers
Aust. Poult. Science Symp. 2022...33
3

embedded emissions from using urea fertiliser. Other mitigation options will include balancing the crude protein intake of the birds, further reducing ammonia emissions from their manure as an indirect nitrous oxide source (Wiedeman et al., 2015). Although the pre-farm feed production emissions were significant, unless the poultry production system managed these cropping farms, the only mitigation options would be to source carbon neutral supply from the cropping farms. This pressure to source low emissions pre-farm products is likely to increase across all sectors of agriculture, as farmers become aware of their embedded emissions and potential choice of suppliers. The emissions intensity of chicken meat production was estimated by Wiedeman et al., (2015) at between 1.8 and 2.2 kg CO2e/kg carcass weight, an order of magnitude higher than a typical grain production system (Browne et al., 2011), marginally higher than to a dairy production system at 1.0 to 1.1 kg CO2e/kg FPCM, but much lower than typical red meat production systems at 20.2 to 26.0 kg CO2e/kg carcass weight (Alvarez-Hess et al., 2019). This could present a competitive advantage for poultry production as markets and supply chains increasingly drive towards low emissions supply, notwithstanding the far greater challenge of achieving carbon neutral production in red meat production relative to poultry. This analysis shows where the major emission sources are in a poultry production system and presents options for the industry to achieve carbon neutral outcomes using existing and established technologies. How profitable these are on farm may depend either on a carbon offset incentive mechanism, not currently available in Australia for poultry, but more likely, to ensure compliance with future market access requirements.
REFERENCES
AGEIS (2021) National Greenhouse Gas Inventory – Paris Agreement Inventory https://ageis.climatechange.gov.au/
Alvarez-Hess, PS, Little, SM, Moate, PJ, Jacobs, JL, Beauchemin, KA & Eckard, RJ (2019) Agricultural Systems 169: 14-23. https://doi.org/10.1016/j.agsy.2018.11.008
Browne, NA, Eckard, RJ, Behrendt & R, Kingwell, RS (2011) Animal Feed Science and Technology 166-167: 641-652. https://doi.org/10.1016/j.anifeedsci.2011.04.045
CCPI (2021) Climate Change Performance Index. https://ccpi.org/ Christie KM, Rawnsley RP, Phelps C & Eckard RJ (2018). Animal Production Science, 58(5),
937-942. https://doi.org/10.1071/AN16286 Climate Active (2019) https://www.climateactive.org.au/ DISER (2021) National Inventory Report Volume 1 April 2019. The Australian Government
Submission to the United Nations Framework Convention on Climate Change (Australian Government Department of Industry, Science, Energy and Resources. Available at https://www.industry.gov.au/sites/default/files/April%202021/document/national-inventory-report-2019-volume-1.pdf pp 404.
Doran-Browne N, Wootton M, Taylor C & Eckard R (2017) Animal Production Science 58(9): 1648-1655 https://doi.org/10.1071/AN16438. http://dx.doi.org/10.1071/AN16438
Eckard RJ & Clark H (2018) Animal Production Science 60(1): 10-16 https://doi.org/10.1071/AN18574
Financial Review (2021a) US takes tougher line on carbon border tax. 26 April 2021. https://www.afr.com/policy/energy-and-climate/us-takes-tougher-line-on-carbon-border-tax-20210425-p57m82
Financial Review (2021b) European Parliament backs carbon border tax. 11 March 2021. https://www.afr.com/policy/energy-and-climate/european-parliament-backs-carbon-border-tax-20210311-p579o9
Aust. Poult. Science Symp. 2022...33
4

Oxfam (2016) The world’s top 100 economies: 31 countries; 69 corporations, September 15, 2016. https://oxfamapps.org/fp2p/the-worlds-top-100-economies-31-countries-69-corporations/
Richards M, Bruun TB, Campbell B, Gregersen LE, Huyer S, Kuntze V, Madsen STN, Oldvig MB & Vasileiou I (2016) CGIAR Research Program on Climate Change, Agriculture and Food Security, CCAFS, Copenhagen, Denmark. Available at http://hdl.handle.net/10568/73255
United Nations (2015) United Nations / Framework Convention on Climate Change, 21st Conference of the Parties: Paris. Available at https://unfccc.int/files/essential_background/convention/application/pdf/english_paris_agreement.pdf pp 25.
Wiedemann SG, McGahan EJ & Murphy CM (2017) Journal of Cleaner Production 140: 675-684. https://doi.org/10.1016/j.jclepro.2016.06.086
Aust. Poult. Science Symp. 2022...33
5
https://unfccc.int/files/essential_background/convention/application/pdf/english_paris_agreement.pdf

PRECISION FEEDING ENHANCES BROILER GROWTH EFFICIENCY
A.F. MOSS1, D. CADOGAN2, P.V.CHRYSTAL3, A. NAWAB1, R.BAREKATAIN4 and T.M.CROWLEY1,5
Broiler chickens grow rapidly with nutrient requirements changing daily. However, broilers are fed 3-5 diet stages throughout their growth, meaning nutrients are under- and over-supplied throughout production (Kleyn, 2013). Thus, blending rations on a daily basis to meet the daily energy and lysine requirements may improve the efficiency and reduce the coefficient of variation (CV) in broiler flocks. Therefore, the present study evaluates precision feeding regimens for broiler chickens.
A total of 440 Cobb 500 chicks (mixed sex) were raised in floor pens and offered a common starter diet. At 11d post-hatch they were divided into 4 treatments (10 replicate pens per treatment; 11 birds per pen) on the basis of body weight. The treatments, starting at d11, consisted of; 1) a control 4-phase feeding regimen (starter 11−12d, grower 12−21d, finisher 21−35d, withdrawal 35−42d), 2) a precision feeding regimen where a protein and an energy concentrate were blended on a daily basis to match the daily energy and lysine requirement, 3) a precision feeding regimen starting at the same ratio of blends as treatment 2 but blends were adjusted weekly based on the bird’s weight, and 4) the starter, grower, finisher and withdrawal diets used in the control were blended to more closely meet the daily nutrient requirement and produce a gradual diet change. Chicks had unlimited access to feed and water, in an environmentally controlled facility, and lighting and temperature followed Cobb breeder guidelines. Diets were weighed, blended and distributed into individual pens using FEEDLogic precision feeding equipment kindly supplied by Feedworks Pty Ltd. Birds and feed were weighed on a weekly basis, and birds were weighed individually in order to calculate pen CV. There was no significant effect of dietary treatments on weekly weight gain and feed intake. However, precision feeding significantly (P<0.001) improved FCR from 14 to 21 d post-hatch, where treatment 2 improved FCR by 13.8% (1.20 vs 1.40) and treatment 3 improved FCR by 13.6% (1.21 vs 1.40). Day 42 fat pad weights tended to be reduced with precision feeding; particularly the weekly adjusted precision feeding regimen (treatment 3) in comparison with control diets (8.7 vs 10.63 g/kg; P = 0.055). Body weight at day 42 was significantly (P<0.044) greater for birds offered precision feeding diets (treatments 2 and 3) than the control 4-phase feeding regimen, by 5.7% (3381 vs 3197 g) and 7.2% (3428 vs 3197 g), respectively. Finally, the pen CV of birds offered precision feeding diets (treatments 2 and 3) was significantly (P<0.019) lower by the end of the production cycle; both treatments producing similar outcomes and reducing pen CV by approximately 32% at 35 d and 33% at 42 d post-hatch.
In conclusion, precision feeding regimens improved FCR compared to birds offered 4-phase feeding regimens directly after large dietary changes, such as the swap from starter to grower feed. Thus it appears that sudden dietary change may compromise the performance and possibly the intestinal functions of young broiler chicks. Furthermore, precision feeding reduces the CV of birds and increases their weight at the end of grow-out, which may thereby lead to benefits and additional income during processing. ACKNOWLEDGEMENTS: Thank you to Poultry Hub Australia for funding this project and Feedworks for providing the precision feeding equipment and their ongoing support. Kleyn R (2013) Chicken Nutrition A Guide for Nutritionists and Poultry Professionals. Context, UK.
1 School of Environmental and Rural Science, University of New England, Armidale, NSW, AU [email protected] 2 Feedworks Pty Ltd, Romsey, VIC, AU 3 Complete Feed Solutions Ltd, Pakuranga, Auckland, NZ 4 SARDI, University of Adelaide, Roseworthy, SA, AU 55School of Medicine, Deakin University, Geelong, VIC, AU
Aust. Poult. Science Symp. 2022...33
6

GUANIDINO ACETIC ACID SUPPLEMENTATION IN REDUCED ENERGY-DIETS ON PERFORMANCE OF BROILER CHICKENS
B. JAYARAMAN1, F. POERNAMA2, T. WIBOWO2, J. C. DE PAULA DORIGAM3,
P. KRISHNAN1, and G. CHANNARAYAPATNA1
Summary
A study was conducted to evaluate the effects of supplementation of guanidino acetic acid (GAA) to diets with reductions of 0.31 and 0.62 MJ/kg in the nitrogen-corrected apparent metabolisable energy (AMEn) on growth performance and breast meat yield (BMY) of broilers raised up to 35 days. A total of 4,752 Lohmann Indian River mixed-sex day-old broiler chicks were randomly distributed in a factorial arrangement consisting of six dietary treatments with 12 replicate pens/treatment and 66 birds/pen. Dietary factors were as follows; (i) graded levels of reduction (0, 0.31,0.62 MJ/kg of the diet) of AMEn (d 0 to 21: 12.55, 12.24, and 11.92 MJ/kg; d 22 to 35: 12.97, 12.66, and 12.35 MJ/kg) and (ii) GAA supplementation (0 and 0.6 g/kg of diet). There was no interaction between dietary factors and results of main effects indicated that reducing dietary AMEn by 0.31 MJ/kg provided similar (P > 0.05) growth performance and broiler production index (BPI) compared to standard AMEn diet; however, reducing AMEn by 0.62 MJ/kg resulted in higher (P < 0.05) feed conversion ratio (FCR) and BPI compared to other dietary treatments at d 35. Highest AMEn reduction led to increased (P < 0.05) breast meat yield. Birds fed GAA had better FCR (P < 0.05; 2 points improvement) and BPI (10 points improvement) than the non-GAA group. In conclusion, results from this study indicate that GAA supplementation of 0.6 g/kg improved feed conversion ratio and production index in broilers.
I. INTRODUCTION In poultry, energy is the most expensive nutrient accounting more than 50% of total feed cost (Fosoul et al., 2018). Nutritionists have been exploring different strategies to improve energy efficiency without compromising growth performance in broiler chickens (Ceylan et al, 2021). In fast-growing broilers, optimal energy supply to muscle is important for improved performance. Creatine (CRE) plays a central role in energy metabolism, particularly of muscle cells (Khajali et al, 2020). CRE is located in the skeletal muscle (95-98%) in the form of CRE phosphate. GAA is the only immediate precursor to CRE and phosphocreatine and involved predominantly in muscle energy homeostasis (Michiels et al., 2012). Dietary GAA increases muscle CRE concentrations, leading to improved energy metabolism in muscle tissues (Lemme et al, 2011). In this context, the objective of this study was to evaluate the effects of GAA supplementation in energy-reduced diets on growth performance and breast meat yield (BMY) of broilers.
II. METHOD
A total of 4,752-day-old Lohmann Indian River broiler chicks (mixed-sex) were randomly distributed in a factorial arrangement consisting of six dietary treatments with 12 replicate pens/treatment and 66 birds/pen. Dietary factors were as follows;(i) graded levels of reduction (0, 0.31, and 0.62 MJ/kg of the diet) of AMEn (d 0 to 21: 12.55, 12.24, 11.92 MJ/kg; d 22 to 35: 12.97, 12.66, 12.35 MJ/kg) and (ii) GAA supplementation (0 and 0.6 g/kg of diet). Two
1Evonik (SEA) Pte., Ltd. Singapore, 2PT Japfa Comfeed Indonesia TBK, 3Evonik Operations GmbH, Hanau-Wolfgang, Germany. [email protected]
Aust. Poult. Science Symp. 2022...33
7

phase feeding programs were used, one feed was used from d 0 to 21 (crumble) and another feed from d 22 to 35 (pellet). Feed intake and body weight gain (BWG) were measured. BPI was calculated as follows: ((livability × average daily gain) / feed conversion ratio) × 10. Breast meat weight of the birds (2 males and 2 females per pen) was measured on day 35. BMY% was calculated as follows: (Breast meat weight/ final BW) × 100. The response criteria measured were BWG, FCR, BMY and BPI. Data were analyzed as two-way ANOVA using SPSS. Mean values were separated by Duncan’s test and statistical significance were declared at P < 0.05.
III. RESULTS Data on growth performance and BMY are presented in Table 1. Interaction effects were not observed (P > 0.05) among the dietary treatments for any of the response criteria. With respect to main effects, reducing dietary AMEn content by 0.31 MJ/kg provided similar (P > 0.05) growth performance compared to standard AMEn diet, whereas reducing AMEn by 0.62 MJ/kg significantly increased feed intake and FCR (P < 0.05) by approximately 2% and 3.5 points, respectively. Reducing AMEn content up to 0.31 MJ/kg did not impact BPI compared to standard AMEn diet; however, reducing AMEn up to 0.62 MJ/kg resulted in significantly lower BPI (P < 0.05) compared to standard AMEn and -0.31 MJ/kg AMEn reduced diet. BMY was significantly improved (P < 0.05) in birds fed AMEn reduced by 2.6% (0.62 MJ/kg) compared to standard AMEn in broilers. Additionally, broilers fed GAA supplemented diets had a significantly improved FCR (P < 0.05) of 2 points difference compared to broiler fed non-GAA supplemented diets (1.576 versus 1.596). Broilers fed GAA supplemented diets had significantly improved BPI (P < 0.05) by 10 points compared to those fed non-supplemented diets. BMY was not affected (P > 0.05) by GAA supplementation in broilers.
IV. DISCUSSION GAA has been used as a feed additive for improving energy efficiency and enhancing performance in broilers (Khajali et al., 2020). During the past decade, many studies demonstrated that GAA supplementation improves energy efficiency and spares energy in broilers (Lemme et al., 2007; Mousavi et al., 2013; Abudabos et al., 2014; Fosoul et al., 2018). GAA supplementation improved FCR, which agrees with previous studies (Lemme et al., 2007; Ringel et al., 2008; Michiels et al., 2012; Mousavi et al., 2013; Abudabos et al., 2014; Ceylan et al., 2021). In a recent meta-analysis, Khajali et al (2020) indicated that the most consistent effect of supplemental GAA was its effect on FCR. As previously suggested by Lemme et al. (2007), GAA plays an important role on the cell energy metabolism favoring the increase of muscle CRE content and other metabolites related to energy metabolism such as phosphocreatine and adenosine triphosphate. These changes are related to a more efficient transport of energy-rich phosphate groups from the mitochondria to the cytosol which improves the energy-availability for muscle protein synthesis and consequently reflects in better FCR. Broilers alter their feed intake to match dietary energy requirement and the variation in the energy-to-amino acid ratios impairs FCR (Mousavi et al., 2013) especially in feed with very low energy content. As demonstrated in the present study (Table 1), the reduction of dietary AMEn of 0.62 MJ/kg can reduce performance, but a 0.31 MJ/kg reduction would be feasible. In conclusion, broilers fed moderate energy reduction (-0.31MJ/kg) showed similar performance to the standard AMEn diet. GAA supplementation improved feed efficiency and production index in broilers leading to improved overall broiler performance.
Aust. Poult. Science Symp. 2022...33
8

Table 1 - Effects of guanidino acetic acid supplementation in energy reduced broiler diets on growth performance and breast meat yield (35 d)
Diet
AMEn reduction (MJ/kg)
GAA (g/kg) BWG, g FI, g FCR BMY%
BPI
1 0 0 2472 3945 1.587 22.0 430 2 -0.31 0 2443 3897 1.592 23.0 435 3 -0.62 0 2448 3966 1.609 22.8 431 4 0 0.6 2465 3844 1.554 22.5 445 5 --0.31 0.6 2492 3925 1.570 22.4 447 6 -0.62 0.6 2473 3994 1.603 22.9 434
AMEn reduction 0 2479 3914b 1.571b 22.31b 439a
-0.31 2478 3931b 1.581b 22.73ab 442a
-0.62 2471 3999a 1.606a 22.90a 433b GAA 0 2465 3955 1.596a 22.62 433b 0.6 2487 3941 1.576b 22.67 443a
P - Value
AMEn 0.860 0.025 <.001 0.049 0.020 GAA 0.092 0.573 <.001 0.876 <.001 AMEn x GAA 0.200 0.082 0.065 0.102 0.215
AMEn- apparent metabolizable energy nitrogen-corrected; GAA-guanidino acetic acid; BWG-body weight gain; FI-feed intake; FCR -feed conversion ratio; BPI – Broiler production index; BMY – breast meat yield. ab Means within column not sharing a common suffix are significantly different at P < 0.05
REFERENCES
Abudabos AM, Saleh F, Lemme A, & HAH Zakaria (2014) Italian Journal of Animal Science 13: 548–556.
Ceylan N, Koca S, Adabi SG, Adabi SG, Kaharaman N, Bhaya MN & Bozkurt MP (2021) Czech Journal of Animal Science 66: 281-291. Fousoul S, Azarfar A, Gheisari A & Khasravirna H (2018) British Journal of Poultry Science 120: 131-140. Khajali F, Lemme A & Rademacher M (2020) World’s Poultry Science Journal 76(2): 270-
291. DOI: 10.1080/00439339.2020.1716651. Lemme AC, Ringel J & Sterk A (2007) Proceedings of the 16th European Symposium on
Poultry Nutrition. Strasbourg, pp. 335–338. Lemme AC, Elwert R, Gobbi & Rademacher M (2011) Proceedings of 18th European
Symposium on Poultry Nutrition, Çeşme, Turkey, pp. 453–455. Michiels J, Maertens L, Buyse J, Lemme A, Rademacher M, Dierick NA & De Smet S
(2012) Poultry Science 91: 402–412. Mousavi SN, Afsar A & Lotfollahian H (2013) Journal of Applied Poultry Research 22: 47–
54. Ringel J, Lemme A, Redshaw MS, & Damme K. (2008) Poultry Science 87(Suppl 1): 72
(Abst).
Aust. Poult. Science Symp. 2022...33
9

GUANIDINOACETIC ACID CAN REPLACE ARGININE WITH OR WITHOUT BETAINE IN BROILERS OFFERED MODERATELY LOW CRUDE PROTEIN DIETS
N.K. SHARMA1, D.J. CADOGAN2, P.V. CHRYSTAL3, S.J. WILKINSON2, V. INHUBER4 and A.F. MOSS1
Dietary creatine and its endogenous precursors arginine (Arg) and glycine are naturally low in reduced crude protein (CP) broiler diets. Guanidinoacetic acid (GAA) is a direct precursor of creatine and can be used to replace Arg for creatine synthesis (Khajali et al., 2020). The hepatic synthesis of creatine from GAA uses methyl groups and thus supplemental betaine with GAA may be useful. This study investigated the rate at which GAA can spare Arg with and without betaine in moderately low CP diets.
Day-old Ross 308 male broilers were assigned to nine dietary treatments with eight replicates of 10 birds each. The treatments were: normal CP diet (CP- 215 g/kg in grower and 197 g/kg in finisher), a low CP (-15 g/kg) diet deficient in Arg, a low CP diet sufficient in Arg, and low CP diets with GAA, where 0.1% added L-Arg was spared by GAA at 50%, 100% and 150% with and without 0.1% betaine. The treatments were offered during the grower and finisher phases from d 10 to 24 and d 25 to 42, respectively. During d 10 to 42, dietary treatments led to a significant difference in feed intake (P < 0.01), weight gain (P < 0.001) and FCR (P < 0.001). On d 42, treatments had significant effects on breast meat yield, abdominal fat pad yield, breast meat creatine concentration, breast meat moisture, pH (P < 0.001 for all parameters) and drip loss (P < 0.05). The birds offered a low CP Arg deficient diet had 7.8% lower weight gain (3194 g vs 2946 g), 10 points higher FCR (1.517 vs 1.612), 8.5% lower breast meat yield (189.6 g/kg vs 173.5 g/kg), 27.2% lower breast meat creatine concentration (3.287 g vs 2.392 g), and 30.4% more abdominal fat pad (9.2 g/kg vs 12.0 g/kg) compared to those offered a normal CP diet. When Arg was added back to the Arg deficient diet, growth performance, breast meat yield and creatine concentration loss were restored. When GAA spared Arg at 150%, feed intake, weight gain, FCR, breast meat and abdominal fat yields, breast meat moisture, pH, drip loss and breast meat creatine concentration became comparable to Arg sufficient low CP and normal CP treatments. When GAA spared Arg at 100% and 50%, FCR was 3 and 5 points lower than the normal CP treatment. When GAA spared Arg at 100%, breast meat creatine level was higher than the low CP + Arg treatment by 27.5% and comparable to the normal CP treatment. When GAA spared Arg at 50%, breast meat creatine level was higher than the low CP + Arg treatment by 45.2% and the normal CP treatment by 37.3%. Breast meat creatine concentration was negatively correlated to FCR (r= -0.70, P < 0.001), relative weight of abdominal fat (r= -0.37, P < 0.01) and breast meat pH (r= -0.49, P < 0.001), and positively correlated to breast meat moisture (r= 0.33, P < 0.01). There were no further benefits of adding betaine with GAA on the parameters measured but the results with GAA were consistent in the presence or absence of betaine.
The results presented herein highlight the importance of sparing dietary Arg with GAA in low CP broiler diets.
ACKNOWLEDGEMENTS: This research was funded by Poultryhub Australia (PHA project code: 20-225). Special thanks to AlzChem Trostberg GmbH, Germany for laboratory support. Khajali F, Lemme A & Rademacher-Heilshorn M (2020) World’s Poult. Sci. J. 76: 270-291.
1 School of Environmental and Rural Science, University of New England, Armidale, NSW 2351, Australia; [email protected] 2 Feedworks Pty Ltd, Romsey, 3434, Victoria, Australia 3 Poultry Research Foundation, Faculty of Science, The University of Sydney, Camden. 2570, NSW, Australia 4 AlzChem Trostberg GmbH, Dr.-Albert-Frank-Str. 32, 83308, Trostberg, Germany
Aust. Poult. Science Symp. 2022...33
10

IMPROVING THE PROTEIN CONTENT AND DIGESTIBILITY OF GRAINSORGHUM USING GENE EDITING
I. GODWIN1
1 Summary supplied by APSS 2022 Editor
Aust. Poult. Science Symp. 2022...33
11
Professor Ian Godwin’s invited presentation focused on the use of gene editing and genetic modification techniques to improve the protein content and digestibility of sorghum for use in poultry feed. Sorghum is used to produce a range of human food and beverages and is the main summer grain produced in Australia. Sorghum copes well with the unpredictable Australian climate (heat, droughts, floods). Cereals make up more than 60% of poultry feed and sorghum is an excellent feed ingredient for poultry. However, there is a lot of discussion about the grain quality of sorghum and Professor Godwin’s group has researched the breaking down of the starch:protein matrix in sorghum grain. Studies have investigated changing starch, protein, cellulose, lignin, lipid and sugars in sorghum grain but this paper focuses on the work conducted on protein using genomics to inform transgenic and editing approaches. An understanding and control of gene expression underlies the improvement of grain quality. White sorghum produces better results in poultry as it contains lower levels of the proteins kafirins which reduce the digestibility of sorghum. Alpha kafirins are nutritious whereas beta and gamma kafirins are poorly digestible and coat the periphery of the protein body. Professor Godwin and his colleagues set out to increase the size of the sorghum grain and to produce grain with more protein and more digestible protein. Only the successful manipulations are discussed in this paper. Foldase knockout lines were developed which used changes in the way proteins fold to target protein bodies and G-proteins associated with grain size were manipulated. RNAi silencing was used to down-regulate G protein gamma-subunits. Knocking out GGC1 increased grain size, knocking out GGC2 increased seed size and number and knocking out GGC3 mostly increased seed number. In this way, the composition of the endosperm could be changed from being corneous and floury in the wild-type control to being mostly floury (foldase knockout) or mostly corneous (GS3 knockout). An important aspect of gene editing is that the product is not considered to be a GMO because the “edit” is indistinguishable from a natural mutation. To date, the research group has edited 27 genes in sorghum resulting in 134,217,728 genetic combinations. Of these, the GGC1 knockout produces a larger grain and the GGC3 knockout more grain per head. The C1R1 line produces 40% more grain (grain size unchanged) resulting in 24% more protein. The C1R5 line produces 36% more grain, 19% larger grain and 17% more protein. The P4 line produced 32% more grain, 5% larger grain and 21% more protein. The C3R1 line produced 60% more grain (grain size unchanged) and 13% more protein. Overall, the selected lines produced more protein per grain and more protein (up to 91%) per hectare. This manipulation broke the nexus between grain size and grain number and protein and resulted in improvements in both yield and quality. Some of the lines developed were selected for use in broiler feeding trials. During the first year of the trials, there were 17 consecutive days of 35C heat during grain fill and it was discovered that the C3 lines were heat susceptible. For the year 2 trials, the GS3 KO (C1R5) and foldase KO lines 2 and 4 were selected for testing. Formulating the diets was a challenge. The overall findings were that higher protein led to lower digestibility and FCR, lower protein led to higher digestibility and FCR but higher protein with higher digestibility (the foldase knockouts) led to the best FCR. Improved FCR results in reduced feed costs per chicken because protein (usually imported soybean meal) is the most expensive part of the ration. ExpressEdit technology is currently being developed at University of Queensland to enable gene editing to be conducted more quickly. Finally, Professor Godwin provided the details of his new book “Too Good to Eat” which is a popular science book on history and the next generation of GM and gene edited crops and foods. It was published by the Royal Society of Chemistry in February 2019 (https://pubs.rsc.org/en/content/ebook/978-1-78801-085-6), available at Avid Reader and online at Blackwells, Booktopia and Amazon and other providers.

INFLUENCE OF AGE ON THE STANDARDISED ILEAL AMINO ACID DIGESTIBILITY OF MAIZE AND BARLEY IN BROILERS
M. BARUA1, M.R. ABDOLLAHI1, F. ZAEFARIAN1, T.J. WESTER1, C.K. GIRISH2, P.V. CHRYSTAL3 and V. RAVINDRAN1
Summary Standardised ileal digestibility coefficients (SIDC) of nitrogen (N) and amino acids (AA) in maize and barley in broilers at six different ages (days 7, 14, 21, 28, 35, and 42) were investigated. Two assay diets were formulated with the similar inclusion level (938 g/kg) of each grain as the sole source of AA. Titanium dioxide was incorporated as an indigestible marker. The assay diets, in pellet form, were fed to six replicate cages housing 14 (day 7), 12 (day 14), 10 (day 21), 8 (day 28), 8 (day 35), and 6 (day 42) birds per cage for four days prior to digesta collection from the terminal ileum. The apparent ileal digestibility coefficients (AIDC) were standardised using age-appropriate basal endogenous AA (EAA) losses determined in a previous study from birds fed an N-free diet. No age effect (P > 0.05) was noted for the SIDC of N in maize. But the average SIDC of indispensable (IAA) and total AA (TAA) was influenced in a quadratic manner (P < 0.05) with the values being higher at day 7 that decreased at day 14, increased and plateaued between days 21 and 35 with a further decrease at day 42. The average SIDC of dispensable AA (DAA) was influenced linearly (P < 0.05) with higher values at day 7. In barley, the SIDC of N, average IAA, DAA and TAA was affected (quadratic; P < 0.001) by age. The digestibility increased from days 7 to 21, and then plateaued up to day 42. The present findings suggest that the SIDC of AA in maize and barley are influenced by broiler age and that the age effect on AA digestibility may need to be considered for precise feed formulation.
I. INTRODUCTION
Grains are the major energy sources in broiler diets. However, they also supply about 40% of the total dietary protein and contribute significantly to the provision of some indispensable amino acids (IAA; Szczurek et al., 2020). Despite the low protein content in maize, owing to its higher inclusion levels (50-70%) it may contribute approximately up to one third of the protein requirement of broilers. The inclusion of barley in poultry diets remains limited because of relatively low metabolisable energy, high content of fibre and high soluble and insoluble non-starch polysaccharide (NSP) contents (Jacob and Pescatore, 2012). Because of their viscous nature, the water-soluble fractions of NSP in barley exert a negative impact on the digestion and absorption of nutrients, including amino acids (AA; Choct and Annison, 1992). Despite the potential effects of age, only sporadic and inconsistent data exist on the age influence on AA digestibility of ingredients in broilers (Fonolla et al., 1981; Huang et al., 2005). Although several studies (Bryden et al., 2009) have reported the ileal digestibility of AA in a range of feed ingredients, only a few (Adedokun et al., 2007; 2008; Szczurek et al., 2020) exist on the age-related standardised AA digestibility and the data are limited to two or three specific broiler ages. To the authors knowledge, no studies have investigated the
1Monogastric Research Centre, School of Agriculture and Environment, Massey University, Palmerston North, 4442, New Zealand; [email protected]
2Nutrition and Care, Animal Nutrition, Evonik (SEA) Pte. Ltd, 609927 Singapore; 3Complete Feed Solutions, Howick 2145, Auckland, New Zealand.
Aust. Poult. Science Symp. 2022...33
12

standardised ileal digestibility coefficients (SIDC) of AA in maize and barley from hatching to the end of growth cycle of commercial broilers. The current study was designed to determine the SIDC AA in maize and barley at six different ages (days 7, 14, 21, 28, 35 and, 42 post-hatch) of broilers.
II. MATERIALS AND METHODS Two experimental diets were developed with similar inclusions (938 g/kg) of either maize or barley as the only source of AA in the diet. The diets were steam-conditioned at 70 ºC for 30 seconds and pelleted. Titanium dioxide (5 g/kg) was incorporated in both diets as an indigestible marker. A total of 696, one-day-old male broilers (Ross 308) were raised in floor pens and fed a commercial broiler starter diet from days 1 to 21 and a commercial broiler finisher diet from days 22 to 42 in pelleted form. On day 1, 168 chicks were individually weighed, and allocated to 12 cages (14 chicks per cage). The remaining chicks were allocated to 12 cages for ileal AA digestibility determination at 5 different ages, namely day 7 (12 birds per cage), day 14 (10 birds per cage), day 21 (8 birds per cage), day 28 (8 birds per cage), and day 35 (6 birds per cage). The test diets were offered for 4 days [days 3-7 and 10-14 (crumbled); days 17-21, 24-28, 31-35, and 38-42 (pelleted)] prior to ileal digesta collection. On days 7, 14, 21, 28, 35 and 42, all birds were euthanised by intravenous injection of sodium pentobarbitone and the digesta were collected from the lower half of the ileum and pooled within a cage. Representative diet and digesta samples were analysed for dry matter, titanium, N and AA. The apparent ileal digestibility coefficients (AIDC) data were standardised using the basal endogenous N and AA (EAA) losses measured in a previous study at different ages (days 7, 14, 21, 28, 35 and 42) of broilers (Barua et al., 2021). Data were analysed by the GLM procedure of SAS and differences were considered significant at P < 0.05. Orthogonal polynomial contrasts were performed to determine the linear and quadratic effects of age.
III. RESULTS AND DISCUSSION
The influence of broiler age on SIDC of N and AA in maize and barley is presented in Tables 1 and 2, respectively. The SIDC of N in maize was unaffected (P > 0.05) by age. Bird age, however, quadratically influenced the average SIDC of IAA (P < 0.002) and total AA (TAA; P < 0.05). A linear effect (P < 0.05) was observed in the SIDC of dispensable AA (DAA). The highest values were recorded on day 7, then declining on day 14, increasing to day 21 and plateauing to day 35, followed by a decrease on day 42. Except for Thr (P > 0.05), the SIDC of all individual IAA and DAA was influenced (linear or quadratic; P < 0.05 to < 0.001) by broiler age. In barley, the SIDC of N, average SIDC of IAA, DAA and TAA increased quadratically with advancing age of broilers (P < 0.001). The values increased from days 7 to 21, and then plateaued until day 42. The average SIDC of TAA in barley at day 7 was 16.4% lower than day 14, 25.0% lower than day 21, and 23.4% lower than the average from days 28 to 42. The SIDC of individual AA in barley increased (quadratic; P < 0.05 to 0.001) with bird age. The increase in SIDC AA in barley by age agrees with previous findings. Szczurek et al. (2020) determined the AA digestibility in barley in broilers at days 14 vs. 28 post-hatch and found that the SIDC of the AA in barley was higher at day 28.
Aust. Poult. Science Symp. 2022...33
13

Table 1 - Standardised ileal digestibility coefficients1 of nitrogen (N) and amino acids of maize at different ages of broilers2
Age (day) Orthogonal polynomial contrasts Parameter 7 14 21 28 35 42 Pooled SEM Linear Quadratic N 0.936 0.817 0.922 0.911 0.907 0.868 0.0089 0.295 0.684 Indispensable amino acids Arg 0.914 0.828 0.943 0.939 0.930 0.909 0.0056 0.001 0.003 His 0.839 0.810 0.866 0.862 0.854 0.844 0.0080 0.034 0.039 Ile 0.844 0.757 0.917 0.898 0.875 0.859 0.0100 0.001 0.001 Leu 0.902 0.868 0.952 0.939 0.923 0.915 0.0059 0.001 0.001 Lys 0.704 0.583 0.858 0.827 0.805 0.776 0.0142 0.001 0.001 Met 0.899 0.801 0.963 0.948 0.927 0.904 0.0097 0.001 0.001 Thr 0.912 0.678 0.872 0.856 0.871 0.821 0.0138 0.348 0.119 Trp 0.769 0.640 0.828 0.823 0.834 0.792 0.0143 0.001 0.048 Val 0.807 0.723 0.902 0.892 0.873 0.861 0.0100 0.001 0.001 IAA 0.843 0.743 0.900 0.887 0.877 0.854 0.0091 0.001 0.002 Dispensable amino acids Ala 0.896 0.841 0.934 0.923 0.901 0.887 0.0072 0.043 0.001 Asp 0.863 0.733 0.902 0.887 0.868 0.843 0.0100 0.002 0.017 Cys3 0.968 0.906 0.908 0.894 0.895 0.877 0.0089 0.001 0.013 Glu 0.912 0.853 0.948 0.931 0.918 0.903 0.0067 0.026 0.002 Gly3 0.784 0.654 0.845 0.836 0.823 0.807 0.0121 0.001 0.034 Pro 0.845 0.799 0.885 0.874 0.871 0.866 0.0079 0.001 0.048 Ser 0.902 0.733 0.915 0.897 0.907 0.876 0.0119 0.001 0.996 DAA 0.881 0.788 0.905 0.892 0.883 0.865 0.0083 0.010 0.109 TAA 0.860 0.763 0.902 0.889 0.879 0.859 0.0087 0.001 0.011 1Apparent digestibility values were standardised using the basal ileal endogenous flow values (g/kg DM intake), determined by the feeding N-free diet at different ages (Barua et al., 2021). 2Each value represents the mean of six replicates. 3Semi-indispensable amino acids for poultry.
IAA = Average digestibility of indispensable amino acids; DAA = Average digestibility of dispensable amino acids; TAA = Average digestibility of all amino acids
In the SIDC calculations, the AIDC were corrected for the basal EAA losses from various digestive secretions, pancreatic and enzymatic secretions (Ravindran, 2021) and unsurprisingly these two values were different with SIDC being higher. In this study, age appropriate EAA flows were used to standardise the apparent digestibility estimates (Barua et al., 2021). The basal EAA losses of TAA at day 7 (12.93 g/kg dry matter intake; DMI) was twice than that of the average of days 14 to 35 (6.19 g/kg DMI), and almost three times higher than day 42 (4.48 g/kg DMI). After correcting for age appropriate EAA, an increase of 32.5% in the average SIDC of TAA at d 7 was observed in maize that was almost two times higher compared to that from days 14 to 35 (13.9-17.0%), and three times more than the increase at day 42 (9.85%). Similar to maize, the average SIDC of TAA in barley at day 7 was 31.5% higher than the average AIDC of TAA, which decreased to 7.17% at day 42. Among the individual AA in barley, the lowest SIDC was recorded for Lys at d 7 mainly due to very low AIDC Lys at this age. Correction for the EAA losses, did not uplift the SIDC Lys to the same extent of other AA because of low endogenous Lys losses at d 7 (Barua et al., 2021). The exact reasons for the observed age effects on AA digestibility are intricate and complicated by the interactions among a multitude of factors including the ingredient type (Huang et al., 2005), digestive tract development, secretion, and activity of proteolytic enzymes (Nitsan et al., 1991), EAA flows (Barua et al., 2021), digesta passage rate and activity of intestinal microbiome at different ages. Overall, the current findings suggest that the age influence on AA digestibility is dependent on grain type and specific AA. The SIDC of AA in maize and barley are influenced by broiler age and that the age effect on AA digestibility may need to be considered for precise feed formulation.
Aust. Poult. Science Symp. 2022...33
14

Table 2 - Standardised ileal digestibility coefficients1 of nitrogen (N) and amino acids of barley at different ages of broilers2
Age Orthogonal polynomial contrasts Parameter 7 14 21 28 35 42 Pooled SEM Linear Quadratic N 0.674 0.759 0.816 0.799 0.816 0.782 0.0143 0.001 0.001 Indispensable amino acids Arg 0.724 0.755 0.855 0.831 0.854 0.824 0.0135 0.001 0.001 His 0.652 0.762 0.780 0.762 0.783 0.756 0.0143 0.001 0.001 Ile 0.574 0.732 0.821 0.801 0.813 0.793 0.0155 0.001 0.001 Leu 0.650 0.773 0.851 0.829 0.844 0.819 0.0133 0.001 0.001 Lys 0.382 0.616 0.806 0.757 0.783 0.758 0.0211 0.001 0.001 Met 0.611 0.752 0.874 0.847 0.854 0.823 0.0186 0.001 0.001 Thr 0.595 0.705 0.822 0.798 0.845 0.784 0.0196 0.001 0.001 Trp 0.564 0.721 0.787 0.776 0.802 0.769 0.0163 0.001 0.001 Val 0.578 0.719 0.825 0.809 0.819 0.799 0.0144 0.001 0.001 IAA 0.592 0.726 0.825 0.801 0.822 0.792 0.0155 0.001 0.001 Dispensable amino acids Ala 0.566 0.703 0.803 0.778 0.793 0.764 0.0158 0.001 0.001 Asp 0.509 0.664 0.796 0.776 0.800 0.763 0.0179 0.001 0.001 Cys3 0.806 0.870 0.844 0.829 0.843 0.809 0.0171 0.553 0.045 Glu 0.771 0.841 0.874 0.854 0.861 0.844 0.0107 0.001 0.001 Gly3 0.513 0.639 0.753 0.742 0.755 0.729 0.0158 0.001 0.001 Pro 0.755 0.821 0.844 0.831 0.842 0.827 0.0112 0.001 0.001 Ser 0.623 0.732 0.838 0.815 0.852 0.808 0.0159 0.001 0.001 DAA 0.649 0.753 0.822 0.804 0.821 0.792 0.0140 0.001 0.001
TAA 0.617 0.738 0.823 0.802 0.822 0.792 0.0148 0.001 0.001 1Apparent digestibility values were standardised using the basal ileal endogenous flow values (g/kg DM intake), determined by the feeding N-free diet at different ages (Barua et al., 2021). 2Each value represents the mean of six replicates. 3Semi-indispensable amino acids for poultry.
IAA = Average digestibility of indispensable amino acids; DAA = Average digestibility of dispensable amino acids; TAA = Average digestibility of all amino acids
ACKNOWLEDGEMENTS: We acknowledge AgriFutures Australian Chicken Meat Program for funding the project, and Preethi Ramesh, AMINOLab EMSEA, Singapore for AA analyses.
REFERENCES
Adedokun SA, Adeola O, Parsons CM, Lilburn MS & Applegate TJ (2008) Poultry Science 87: 2535-2548.
Adedokun SA, Parsons CM, Lilburn MS, Adeola, O & Applegate TJ (2007) Poultry Science 86: 2598-2607.
Barua M, Abdollahi, MR, Zaefarian F, Wester, TJ, Girish, CK, Chrystal, PV & Ravindran V (2021) Poultry Science 100: 101269.
Bryden WL, Li X, Ravindran G, Hew Li & Ravindran V (2009) RIRDC Project No: 002827 (Rural Industries Research and Development Corporation, Australia) 4-13.
Choct M & Annison G (1992) British Journal of Nutrition 67: 123-132. Fonolla J, Prirto C & Sanz R (1981) Animal Feed Science and Technology 6: 405-411. Huang KH, Ravindran V, Li X & Bryden WL (2005) British Poultry Science 46: 236-245. Jacob JP & Pescatore AJ (2012) The Journal of Applied Poultry Research 21: 915-940. Nitsan Z, Ben-Avraham G, Zoref Z & Nir I (1991) British Poultry Science 32: 515-523. Ravindran, V (2021) Journal of Animal Science and Biotechnology 12: 5. Szczurek W, Szymczyk B, Arczewska-Włosek A & Świątkiewicz S (2020) British Poultry
Science 61: 63-69.
Aust. Poult. Science Symp. 2022...33
15

ESTIMATION OF ILEAL ENDOGENOUS ENERGY LOSSES AT DIFFERENT AGES AND INFLUENCE OF DIETARY CELLULOSE LEVELS IN BROILER CHICKENS
M.M. KHALIL1, M.R. ABDOLLAHI1, F. ZAEFARIAN1, P.V. CHRYSTAL2 and
V. RAVINDRAN1
Evaluation of true ileal digestible energy, as a potential energy system for application in broiler feed formulations, requires accurate estimation of the ileal endogenous energy losses (IEEL). The IEEL estimates can be influenced by several factors including bird age and dietary cellulose levels (Khalil et al., 2020). Two experiments were conducted to investigate the influence of age and dietary cellulose levels on the IEEL estimates in (Ross 308) broiler chickens. Titanium dioxide (5.0 g/kg) was added to all experimental diets as an indigestible marker. In experiment 1, a glucose-based purified diet was used to determine the IEEL in male broilers aged 1-7, 8-14, 15-21, 22-28, 29-35 or 36-42 d posthatch. Birds were offered a starter (d 1-21) and/or a finisher (d 21-35) diet before the experimental diet was introduced. The experimental diet was randomly allocated to six replicate cages at each age and, the number of birds per cage was 12 (d 1-7), 10 (d 8-14) and 8 (d 15-42). Ileal digesta samples were collected from the terminal ileum on the last day of each week (d 7, 14, 21, 28, 35 and 42). Diet and digesta samples were analysed for dry matter, gross energy and titanium. The data were analysed as a one-way ANOVA using the General Linear Model procedure of SAS. Bird age had no significant effect (P > 0.05) on IEEL estimates. The IEEL estimates ranged from 1.32 to 1.10 MJ/kg dry matter intake during weeks 1 to 6. In Experiment 2, four glucose-based purified diets were developed using either 0, 25, 50 and 75 g/kg cellulose. In studies with purified diets, cellulose as a structural component is included to texturise the feed. Each diet was randomly allocated to six replicate cages (eight birds per cage), fed from 18 to 21 d posthatch and, ileal digesta were collected on d 21. Diet and digesta samples were analysed for dry matter, gross energy and titanium. The data were analysed as a one-way ANOVA using the General Linear Model procedure of SAS. In addition, the data were subjected to orthogonal polynomial contrasts to study whether responses to increasing cellulose level were of linear or quadratic nature. The IEEL estimates showed a quadratic response (P < 0.05) to increasing cellulose contents. The lowest IEEL (0.37 MJ/kg dry matter intake) was recorded for the diet without cellulose and the highest IEEL (1.80 MJ/kg dry matter intake) observed for the diet with 75 g/kg cellulose. Overall, the present findings confirmed the previous observations in our laboratory (Khalil et al., 2020) that the IEEL in broiler chickens can be quantified using glucose-based purified diets. Bird age has no influence on IEEL estimates in broiler chickens. The dietary cellulose content has a substantial impact on IEEL estimates and the IEEL determined using a purified diet without cellulose represents a better estimate of IEEL.
ACKNOWLEDGEMENTS: We acknowledge AgriFutures Australian Chicken Meat Programme for funding the project.
Khalil MM, Abdollahi MR, Zaefarian F & Ravindran V (2020) Poult. Sci. 99: 6809-17.
1 Monogastric Research Centre, School of Agriculture and Environment, Massey University, Palmerston North 4442, New Zealand. [email protected] 2 Complete Feed Solutions, Howick 2145, Auckland, New Zealand.
Aust. Poult. Science Symp. 2022...33
16

INTERACTIVE EFFECT OF DIETARY CRUDE PROTEIN CONCENTRATION AND BILE ACIDS SUPPLEMENTATION ON GROWTH PERFORMANCE AND PLASMA
AMINO ACIDS CONCENTRATIONS OF BROILER CHICKENS
M.TOGHYANI1, P.V. CHRYSTAL1, S.P. MACELLINE1, P.H. SELLE1, J.B. LI2, Y.M. BAO3 and S.Y. LIU1
Summary
The objective of this study was to evaluate the impact of bile acids supplementation and dietary crude protein (CP) levels on growth performance and amino acid concentration in systemic plasma in broiler chickens. Dietary CP was reduced by around 30 g/kg for each rearing phase to have 2 levels of dietary CP with or without 0.2 g/kg bile acids, forming a 2 × 2 factorial arrangement of treatments. Each of the four treatments was offered to 6 replicates pens of 35 off-sex male Ross 308 chicks. From 0-42 days post-hatch, there was no two-way interaction of dietary CP and bile acid supplementation for BWG, FI, FCR, abdominal fat pad and nutrient digestibility (P < 0.05). However, as the main effect, reducing dietary CP significantly reduced BWG, increased FCR and abdominal fat pad (P < 0.01). The addition of bile acids significantly improved FCR in both standard and reduced CP diets (P < 0.01). A significant interaction of experimental factors was detected for overall mortality, where bile acid supplementation decreased mortality rate only in birds fed the reduced CP diets (P < 0.01). Compared with the standard diet, the reduced CP diet significantly decreased plasma Arg, His, Phe, Val, Ile, leu and Trp concentrations but increased plasma Met and threonine concentrations (P < 0.01). Bile acids supplementation significantly improved dry matter and protein digestibility (P < 0.01) but had no effect on fat digestibility regardless of dietary protein levels.
I INTRODUCTION
In recent years, based on ideal amino acids profile, a moderate reduction in dietary CP, 20 to 30 g/kg, has been reported to maintain broiler chicken performance and processing yields. However, further reduction of CP more than 30 g/kg has been shown to compromise bird performance and increase adipose fat accumulation (Kidd et al, 2021). These reduced CP levels are usually achieved by increasing feed grains such as wheat inclusion at the expense of soybean meal, relatively increasing carbohydrates or starch levels as the energy source.
Bile acids are synthesized from cholesterol in the liver (Chiang 2002) and secreted into the duodenum to facilitate intestinal digestion and absorption of dietary fat (Hofmann et al., 2008). Bile acids could be metabolised further by bacteria in the intestine. Bacterial enzymes act on the primary bile acids and convert them to secondary bile acids by deconjugation, dehydroxylation, epimerization, and oxidation. The enterohepatic circulation of bile acids is the recycling of bile acids between small intestine and liver; although this process is efficient, some salts and acids are nonetheless lost with every cycle of the enterohepatic circulation (Lai et al., 2018). Furthermore, increased ingestion of non-starch polysaccharides (NSP) present in grains, particularly wheat, has been reported to sequester bile acids, thus enhancing faecal bile acid loss in human (Walters et al., 1975), rats (Overton et al., 1994) and poultry (Choct, 1999). Therefore, the current study was designed to investigate if bile acids supplementation in reduced CP diets with increased NSP content mitigates the possible performance loss previously observed with feeding diets with lower crude protein concentration.
1 Poultry Research Foundation, The University of Sydney, Australia [email protected] 2 Shandong LongChang, China 3 Redox Pty Ltd, Minto NSW 2566
Aust. Poult. Science Symp. 2022...33
17

Table 1 - Ingredient compositions and calculated nutrient specifications of experimental diets
Starter Grower Finisher Item (g/kg) PC RC1 PC RC PC RC Wheat 585 660 632 764 611 754 Dextrose 0 15.2 0 0 0 0 Soybean meal 278 194 282 133 252 115 Canola meal 75 30 30 30 40 30 Soybean oil 19 7 22 4 50 28 L-Lysine HCl 4.3 7.7 3.2 7.5 2.5 6.6 L-Methionine 3.4 4.6 2.9 3.9 2.4 3.4 L-Threonine 2.0 3.6 1.3 3.2 0.9 2.7 L-Tryptophan 0.0 0.0 0.0 0.0 0.0 0.0 L-Valine 98% 0.4 2.4 0.0 2.1 0.0 1.5 L-Arginine 0.8 4.1 0.0 3.9 0.0 3.2 L-Tyrosine 0.0 2.0 0.0 1.8 0.0 1.1 L-Iso-leucine 98% 0.3 2.2 0.0 2.0 0.0 1.6 L-Leucine 98.5% 0.0 2.7 0.0 2.3 0.0 1.5 L-Histidine 0.0 0.5 0.0 0.4 0.0 0.2 Glycine 0.0 2.1 0.0 3.1 0.0 2.9 Salt 1.1 0.0 1.5 0.0 1.8 0.0 Sodium bicarbonate 2.5 4.3 2.1 4.2 1.7 4.2 Potassium carbonate 0.0 3.9 0.0 3.5 0.0 3.9 Limestone flour 14.3 16.3 10.8 11.4 8.6 9.2 M/DCP 10.9 14.9 8.0 9.0 6.2 7.3 Xylanase (VTR) 0.1 0.1 0.1 0.1 0.1 0.1 Phytase (VTR) 0.1 0.1 0.1 0.1 0.1 0.1 Choline chloride 60% 0.8 0.8 0.7 0.7 0.6 0.6 CeliteTM 0.2 20.0 0.2 7.6 20.2 20.2 Premix2 2.0 2.0 2.0 2.0 2.0 2.0 Nutrients(g/kg) AMEn (MJ/kg) 12.00 12.00 12.40 12.40 12.90 12.90 Protein 253 225 240 210 225 195 Fat (g/kg) 38.3 25.4 41.6 23.1 68.4 46.7 Lys 3(g/kg) 13.4 13.4 12.1 12.1 10.8 10.8 Met + Cys (g/kg) 10.0 10.0 9.1 9.1 8.4 8.4 Thr (g/kg) 9.0 9.0 8.1 8.1 7.2 7.2 Trp (g/kg) 2.7 2.1 2.6 1.9 2.4 1.8 Ile (g/kg) 9.0 9.0 8.5 8.2 7.9 7.5 Leu (g/kg) 15.2 14.8 14.7 13.3 13.8 11.9 Arg (g/kg) 14.4 14.4 13.0 12.9 12.2 11.6 Val (g/kg) 10.1 10.1 9.3 9.1 8.8 8.2 His (g/kg) 5.3 4.7 5.1 4.2 4.8 3.8 Gly_eq (g/kg) 15.5 14.5 15.0 14.6 14.1 13.7 Total Ca (g/kg) 10.9 11.8 8.7 8.7 7.5 7.5 Total P (g/kg) 6.5 6.4 5.4 5.1 4.9 4.6 Available P (g/kg) 5.2 5.6 4.4 4.4 4.0 4.0 DEB 280 280 273 250 256 250
1Reduced crude protein 2The premix contained (per kg of diet): [IU] retinol, 12,000; cholecalciferol, 5,000; [mg] tocopherol, 50; menadione, 3; thiamine, 3; riboflavin, 9; pyridoxine, 5; cobalamin, 0.025; niacin, 50; pantothenate, 10; folate, 2; biotin, 0.2; copper, 20; iron, 40; manganese, 110; cobalt, 0.25; iodine, 1; molybdenum, 2; zinc, 90; selenium, 0.3. 3 Lysine and all other amino acids concentrations are calculated ileal standardized digestible values
Aust. Poult. Science Symp. 2022...33
18

II MATERIALS AND METHODS
The feeding study was performed according to the specific guidelines approved by the Animal Ethics Committee of The University of Sydney. A total of 840 off-sex male Ross 308 chicks (parent line) were reared to 42 days post-hatch on three phases of feeding (starter crumble, 0 to 14 d; grower pellet, 15 to 28 d, and finisher pellet from 29 to 42 d). The experimental design was a 2 × 2 factorial array of treatments to evaluate the effect of two dietary levels of crude protein and two levels of bile acid supplementation (0 and 0.2 g/kg feed) for a total of four dietary treatments. There were six replicate pens of 35 birds per treatment. The standard positive control (PC) diet was formulated to meet or exceed the 2019 Aviagen Ross 308 nutrition specifications and reduced CP diet was formulated with around 30 g/kg CP reduction as shown in Table 1. All diets contained phytase and xylanase to be commercially relevant. Chickens had ad libitum access to feed and water. Initial and final body weights were determined, and feed intakes were recorded from which feed conversion ratios (FCR) were calculated. On day 42, 6 birds selected at random from each pen were sacrificed to collect distal ileal digesta and fat pad data. On day 34, blood samples were collected from 3 birds per pen from the wing vein into heparinised vials to prevent blood clotting. Plasma samples were separated and the concentrations of essential amino acids in plasma were determined using precolumn derivatisation amino acid analysis with 6-aminoquinolyl-N-hydroxysuccinimidyl carbamate followed by separation of the derivatives and quantification by reversed phase ultra-performance liquid chromatograph. All data were checked for normal distribution and then analysed by two-way ANOVA using JMP Pro 15 (SAS Institute, Carey, North Carolina, USA). Statistical significance was considered at P ≤ 0.05.
Table 2 - The influence of dietary treatments on growth performance (0-42 days) and ileal fat, CP and DM digestibility coefficient (DC)
Treatment Type
BWG FI(g) FCR Mortality DM DC Fat DC CP DC Fat pad pad Protein Bile acid g/bird g/bird g/g % % % % %
PC Nil 3520 5109 1.451 1.43 bc 0.656 0.969 0.781 0.91 RC Nil 3361 4957 1.475 4.27 a
0.666 0.955 0.783 1.22 PC Plus 3510 5026 1.439 3.33 ab
0.727 0.980 0.820 0.93 RC Plus 3348 4920 1.469 0.95 c
0.745 0.948 0.843 1.15 SEM 28.4 37.7 0.0038 0.7897 0.005 0.006 0.007 0.045 Main Effects:
CP PC 3515a 5067a 1.445a 2.231 0.690b 0.974a 0.800 0.92b RC 3355b 4930b 1.472b 2.619 0.705a 0.951b 0.813 1.18a Bile acids Nil 3441 5033 1.463a 2.857 0.661a 0.962 0.782b 1.06 Plus 3429 4973 1.454b 2.143 0.736b 0.964 0.831a 1.04 P-value CP level <0.001 0.003 <0.001 0.766 0.013 0.001 0.089 <0.001 Bile acid 0.700 0.127 0.027 0.377 <.001 0.775 <.001 0.606 CP × bile acid 0.957 0548 0.345 0.003 0.376 0.158 0.141 0.275
III RESULTS AND DISCUSSION
The effects of dietary treatments on growth performance and plasma essential amino acids concentrations are shown in Tables 2 and 3, respectively. Reducing 30 g/kg CP significantly depressed BWG and FI by 4.8 % and 2.8%, respectively (P < 0.01). The grain source used in this study was wheat and, according to the data published by Chrystal et al. (2021), maize-based diets hold an advantage over wheat-based diets following reductions in dietary CP levels. So, the lower BWG and higher FCR with reduced-CP diets could to some extent be
Aust. Poult. Science Symp. 2022...33
19

because of the background grain (wheat) used in this study. Reducing dietary CP significantly decreased plasma Val, Ile, Leu, Arg, Phe, and Trp concentration but increased Lys, Met and Thr (P < 0.01). Such differences in plasma amino acids concentration indicate that in the current reduced CP diets, Lys, Met and Thr were not absorbed and deposited to a similar extent as other amino acids, implying an imbalance of amino acids profile at the site of protein synthesis. This should have limited bird performance, although reduced CP diets were also formulated to similar ideal amino acids ratio as PC diets, suggesting that the ideal amino acid ratio or the digestion and absorption rate of amino acids in reduced CP diets should be different to that of a normal CP diet. Interestingly, adding bile acids to reduced CP diets significantly reduced mortality rate (P < 0.01). In low CP diets the liver is under high metabolic pressure for protein synthesis and de-amination, plus the higher NSP content in such diets can increase bile acid faecal loss, imposing more burden on liver to increase bile acids production. Thus, supplementation of exogenous bile acids might have alleviated the metabolic pressure on the liver and increased bird liveability. Bile acids addition had no effect on ileal fat digestibility but significantly improved ileal dry matter and protein digestibility, confirming that bile acids can enhance protein digestibility by accelerating hydrolysis process during digestion (Gass et al., 2007).
Table 3 - The influence of dietary treatments on plasma essential amino acid profile (µg/mL)
Treatments Arg His Ile Leu Lys Met Phe Thr Trp Val
Protein Bile acid PC Nil 80.7 13.7 14.9 24.3 31.2 15.8 9.2 70.7 4.32 28.7
RC Nil 61.8 6.45 12.6 19.2 38.2 20.5 15.9 96.3 3.31 25.9
PC Plus 83.1 13.8 15.6 25.5 34.6 17.1 19.7 73.3 4.44 29.4
RC Plus 68.8 6.11 12.6 18.9 36.9 21.4 15.7 92.5 3.25 25.6
SEM 6.617 0.778 0.629 1.251 2.252 0.536 0.378 3.081 0.136 0.936
Main Effects: CP PC 81.8a 13.8a 15.3a 24.9a 32.9b 16.4b 19.5a 72.0b 4.38a 29.1a
RC 65.3b 6.28b 12.6b 19.0b 37.5a 20.9a 15.8b 94.4a 3.28b 25.8b
Bile acids Nil 71.3 10.1 13.8 21.7 34.7 18.1 17.6 83.5 3.81 27.3
Plus 75.9 10.0 14.1 22.2 35.7 19.2 17.7 82.9 3.84 27.5
P-valueCP level 0.021 <.001 0.004 <.001 0.051 <.001 <.001 <.001 <.001 0.002
Bile acids 0.489 0.916 0.634 0.586 0.646 0.055 0.735 0.847 0.825 0.851
CP × bile acid 0.731 0.740 0.601 0.381 0.308 0.647 0.360 0.302 0.509 0.598
ACKOWLEDGEMENT:The authors would like to thank Shandong Longchang for funding this research project
REFERENCES
Chiang J (2002) Endocrine Review 23: 443–463. Choct M (1999) Recent Advances in Animal Nutrition in Australia 12 (1): 31–36. Gass J, Vora H, Gary GM & Khosta C (2007) Gastroenterology 133: 16-23. Hofmann AF & Hagey LR (2008) Cellular and Molecular Life Sciences 65: 2461–2483. Kidd MT, Maynard CW& Mullenix GJ (2021) Journal of Animal Science and Biotechnology 12: 45. verton PD, Furlonger N, Beety JM, Chakraborty J, Tredger JA & Morgan IM (1994) British Journal of
Nutrition 72(3): 385–395. Chrystal PV, Greenhalgh S, McInerney BV, McQuade LR, Akter Y, Cesar de Paula Dorigam J & Liu SY
(2021) Animal Feed Science and Technology 275: 114867. Walters RL, Baird IM, Davies PS, Hill MJ, Drasar BS, Southgate DA & Morgan B (1975) British Medical
Journal 2: 536–538. Lai W, Cao A, Li J, Zhang W & Zhang L (2018) Journal of Applied Poultry Research 27(4): 532-539.
Aust. Poult. Science Symp. 2022...33
20

INTESTINAL INTEGRITY OF BROILER CHICKENS IS NEGATIVELY AFFECTED ONLY AT THE LOWEST LEVEL OF DIETARY PROTEIN FORTIFIED WITH
SYNTHETIC AMINO ACIDS
R. BAREKATAIN1,2, P.V. CHRYSTAL3, A. MOSS4, G.S. HOWARTH2, T.T.H. VAN5 and R.J. MOORE5
Despite extensive research on reduced protein (RP) diets in broiler chickens, the consequences of such practices for gut health and barrier function are not well defined. This study was conducted to investigate the effect of reduced protein and the source of protein. The control normal protein level diets had either meat and bone meal (MBM) or an all-vegetable diet (VEG). Accordingly, four diets were formulated; 1) VEG standard protein, 2) standard protein containing MBM, 3) RP (17.5% in growers and 16.5% in finisher) and 4) RP diet (15.6% in grower and 14.6% in finisher). Off-sex Ross 308 birds were assigned to each of the four diets and performance measurements were taken from d 7 to 42 post-hatch. Each diet was in 8 replicates (10 birds per replicate). A challenge study was conducted on an additional 96 broilers (24 birds per diet) placed in individual cages from d 13 to 21. Half of the birds in each dietary treatment were given three repeated injections of dexamethasone (DEX) to induce a leaky gut (Barekatain et al, 2019). On d 21, intestinal permeability was measured using fluorescein isothiocyanate dextran (FITC-d, 4.16 mg/kg BW). Ileal tissues for gene expression assays and caecal content for microbiota analysis were then collected from all birds. Both RP diets decreased weight gain (P<0001) and increased feed conversion ratio (P<0001) from d 7 to 42 of age compared with control diets, but there was no difference between VEG and MBM control diets. As shown in Table 1, reducing protein to 15.6% increased (P<0.05) intestinal permeability independent of the DEX challenge. Gene expression of ileal samples revealed independent downregulation of claudin-3, a barrier forming tight junction protein in birds fed the lowest level of dietary protein (P<0.05). A significant interaction was observed between diet and DEX (P<0.05) where reductions of protein in grower diets (17.5% and 15.6%) upregulated claudin-2 only in unchallenged birds. Sequencing of 16S rRNA gene amplicons showed that the overall composition of the caecal microbiota was affected in birds fed 15.6% protein compared with other treatments; they had a significantly lower richness of microbiota in both sham and DEX injected birds. To conclude, reducing protein below 17% may significantly compromise intestinal integrity and richness of caecal microbiota in broiler chickens, evidenced by differential mRNA expression of selected tight junction proteins, higher permeability, and changes in the overall microbiota composition. Inclusion of MBM at 4.08% in the control diet had no effect on the studied parameters compared to the VEG diet. Table 1- Concentration of FITC-d (µg/ml) in broilers at d 21 of age
Barekatain R, Nattrass G, Tilbrook AJ, Chousalkar K & Gilani S (2019). Poult. Sci. 98:3662–3675
Acknowledgment: AgriFutures Australia provided financial support for this study (PRJ-012293).
STD VEG
STD MBM
RP 17.5%
RP 15.6%
Sham DEX SEM P values
FITC-d 0.40b 0.39b 0.43ab 0.46a 0.39b 0.46a 0.008 Diet DEX Diet x DEX
0.023 <0.001 0.302
Aust. Poult. Science Symp. 2022...33
21

FAT DEPOSITION IN BROILER CHICKENS OFFERED REDUCED-CRUDE PROTEIN DIETS
P. H. SELLE1, S. P. MACELLINE1, P. V. CHRYSTAL2 and S. Y. LIU1
Summary
This paper considers the problem posed by excessive fat deposition in broiler chickens offered reduced-crude protein diets which is essentially caused by de novo lipogenesis arising from a surplus of glucose derived from starch. This excessive fat deposition could be described as a manifestation of ‘carbotoxicity’ in poultry.
I INTRODUCTION
The development of reduced-crude protein (CP) diets for broiler chickens holds several potential advantages including reduced dependency on imported soybean meal by the Australian chicken-meat industry. Typically, reduced-CP diets contain less soybean meal but more feed grain (and starch) and more synthetic/crystalline amino acids. However, reducing dietary CP from 200 to 150 g/kg in isoenergetic diets has been shown to depress body weight gain, impair food conversion efficiency and increase heat production and abdominal fat deposition (Buyse et al., 1992). The purpose of this paper is to consider fat deposition in relation to starch overload or ‘carbotoxicity’ in poultry offered reduced-CP diets.
II STARCH OVERLOAD, DE NOVO LIPOGENESIS AND FAT DEPOSITION
In humans, ‘carbotoxicity’ has been described as a condition where mono-, di- and polysaccharides undermine health by promoting obesity, diabetes and metabolic syndrome (Kroemer et al., 2018). Metabolic syndrome is a combination of obesity, dyslipidemia, hepatic steatosis, elevated blood glucose and hypertension (Glimcher and Lee, 2009). Starch, which is absorbed as glucose, is the main energy source in broiler diets; the majority of which is provided by the feed grain on which the diet is based. Plasma glucose levels in broiler chickens are high compared to mammalian species (Braun and Sweazea, 2008). However, post-prandial plasma glucose levels in birds offered maize-, wheat- or rice–based diets did not vary depending on starch source (P > 0.35) with an overall mean concentration of 12.72 mmol/L in Li et al. (2019). Thus, glucose homeostasis is maintained in poultry, despite relatively high plasma glucose levels. The metabolic disposal of glucose involves direct oxidation in various tissues, glycogen synthesis in liver and skeletal muscles and hepatic de novo lipogenesis (Jequier, 1994). Glucose can be stored as glycogen but massive carbohydrate overfeeding, or starch overload, in humans has been shown to trigger substantial de novo lipogenesis once glycogen stores in liver and skeletal muscle have been saturated (Acheson et al., 1988). Moreover, there are limited glycogen stores in muscle in avian species such as English sparrows (Braun and Sweazea, 2008). The liver is the main site of de novo lipogenesis in avian species, rather than adipose tissue. Glucose is catabolised to acetyl-CoA which is converted into fatty acids and cholesterol. Cholesterol and triacylglycerol are incorporated into very low density lipoproteins and transported to adipose and other tissues via the circulation (Wang et al., 2017). Thus, de novo lipogenesis is a complex metabolic pathway in which excess
1 Poultry Research Foundation within The University of Sydney. Brownlow Hill NSW [email protected] 2 Complete Feed Solutions, Australia and New Zealand [email protected]
Aust. Poult. Science Symp. 2022...33
22

carbohydrate is converted into fatty acids that are then esterified to storage triacylglycerols (Ameer et al., 2014). Increased fat deposition in broilers offered reduced-CP diets essentially stems from starch overload. In a series of three similar studies (Chrystal et al., 2020a,b,c), broiler chickens were offered maize-based diets with analysed dietary starch concentrations ranging from 303 to 448 g/kg, which were inversely related to crude protein concentrations that ranged from 215 to 155 g/kg. Collectively, dietary starch inclusions quadratically increased relative abdominal fat-pad weights. Estimates of carcass fat can be deduced by multiplying fat-pad weights by a factor of 4.83 (Du and Ahn, 2002). On this basis, increasing dietary starch levels quadratically increased total carcass fat (r = 0.678; P < 0.005), as shown in Figure 1. Curiously, birds offered 165 g/kg CP, maize-based diets clearly outperformed their wheat-based counterparts by 53.0% (2370 versus 1549 g/bird) in weight gain and 19.9% (1.473 versus 1.840) in FCR, but had 71% heavier abdominal fat-pad weights (12.8 versus 7.5 g/kg) in Chrystal et al. (2021). In a subsequent (as yet unpublished) study, birds offered 175 g/kg CP, sorghum-based diets outperformed their wheat-based counterparts by 6.08% in weight gain and by 4.90% in FCR, but had 42% heavier fat-pads (12.2 versus 8.6 g/kg). Therefore, the starch properties of a given feed grain appear to have a tangible bearing on fat deposition in broilers offered reduced-CP diets and maize and sorghum are more likely to promote fat deposition than wheat. This is a conundrum in that while wheat is less likely to promote fat deposition, is not as likely to support acceptable growth performance in comparison to maize or sorghum in the context of reduced-CP diets.
III RAPIDLY AND SLOWLY DIGESTIBLE STARCH; STARCH:PROTEIN RATIOS It becomes relevant that wheat starch (0.036/minute) is digested at a faster rate than starch in maize (0.017/minute) or sorghum (0.018/minute) and the proportion of rapidly digestible starch in wheat (29.5%) is higher than in maize (20.9%) or sorghum (16.2%) under in vitro conditions (Giuberti et al., 2012). Importantly, these relationships appear to translate in vivo as the wheat starch digestion rate (0.117/minute) was more rapid than maize (0.087/minute) and sorghum (0.075/minute) in broilers offered nutritionally-equivalent, standard diets in Selle et al. (2021). Instructively, Ells et al. (2005) concluded that rapidly versus slowly digestible starch provoke distinctly different postprandial metabolic patterns in humans. Indeed, Seal et al. (2003) reported substantial differences in the incremental area under the curve (IAUC) for glucose and insulin in healthy humans in response to rapidly or slowly digestible starch. Rapidly digestible starch triggered an increase in IAUC of glucose by 53% and insulin by 91%. Thus, as reviewed by Lehmann and Robin (2007), rapidly digestible starch generates greater and more rapid changes in blood glucose, insulin and non-esterified fatty acid concentrations than slowly digestible starch. The extent to which these human outcomes apply to poultry is problematic given the inherent differences in the starch-glucose-insulin axes of avian and mammalian species (Tesseraud et al., 2007). Nevertheless, it is possible that sustained glucose and insulin blood levels generated by sorghum and maize-based diets is promoting more de novo lipogenesis than in birds offered rapidly digestible starch. It may be that glucose derived from rapidly digestible wheat starch is being more readily catabolised to generate energy either in the gut mucosa and/or post-enterally; whereas, glucose from slowly digestible starch is being converted to glycogen and then fat via de novo lipogenesis to greater extents. Dietary starch:protein ratios are reflected in starch:protein disappearance rate ratios in broilers and, in turn, expanding disappearance rate ratios are associated with greater fat deposition. This is clearly illustrated by the quadratic relationship (r = 0.729; P < 0.001) between analysed dietary starch:protein ratios and relative abdominal fat-pad weights in broiler chickens as shown in Figure 2. Fairly obviously, one way to address the problem of increased
Aust. Poult. Science Symp. 2022...33
23

fat deposition would be to limit or cap dietary starch:protein ratios in reduced-CP diets. This approach was evaluated in an initial study and displayed some promise (Greenhalgh et al., 2020). A second (as yet unpublished) study has been completed in which starch:protein ratios were condensed by 15% in maize-based diets, which was facilitated by substituting soybean meal with full-fat soy, sourced from the same producer (Soon Soon Oilmills Sdn Bhd). As shown in Table 1, condensing the dietary ratio from 2.76 to 2.35 in 175 g/kg CP diets improved weight gain by 3.45% (2398 versus 2318 g/bird), FCR by 3.75% (1.360 versus 1.413) with a marginal reduction in fat-pad weights from 12.78 to 11.47 g/kg.
IV CONCLUSION Thus, the approach of capping dietary starch:protein ratios does hold promise but the real challenge will be to replace soybean meal with feedstuffs of lesser protein contents without compromising growth performance. In Australia, the obvious alternative is canola meal but the extent to which this feedstuff can be included in reduced-CP diets at the expense of soybean meal and remain feasible has yet to be investigated. Also, if importance of starch digestion rates is verified, it may be that reduced-CP diets based on sorghum-wheat blends will provide a more favourable, intermediate rate of starch digestion which will ameliorate fat deposition. Clearly, these two strategies are not mutually exclusive and could be evaluated in tandem. Thus, in conclusion, the development of reduced-CP broiler diets in Australia could be facilitated by capping starch:protein ratios coupled with diets based on appropriate wheat-sorghum blends to generate more favourable starch digestion rates.
34.00
39.00
44.00
49.00
54.00
59.00
64.00
69.00
74.00
300 350 400Rela
tiv
e c
arc
ass f
at
(g/k
g)
Dietary starch (g/kg)
7
8
9
10
11
12
13
14
15
16
1.4 1.9 2.4
Fat-
pad
weig
ht
(g/k
g)
Dietary starch:protein ratio
Figure 1 Quadratic relationship (r = 0.678; P = 0.004) between analysed dietary starch inclusions and carcass fat in broiler chickens offered maize-based diets across three studies (Chrystal et al., 2020abc) involving 21 observations where: y = 0.749*starch + 0.000772*starch2 -115.167
Figure 2 Quadratic relationship (r = 0.729; P < 0.001) between analysed dietary starch:protein ratios and relative abdominal fat-pad weights in broiler chickens offered maize-based diets across three studies (Chrystal et al., 2020abc) involving 21 observations where: y = 10.24*ratio + 1.3647*ratio2 -4.0194
Aust. Poult. Science Symp. 2022...33
24

Table 1 - Effect of dietary treatments on growth performance and relative abdominal fat-pad weights
from 7 to 35 days post-hatch Treatment Growth performance Relative fat-pad
weights (g/kg)
Starch:protein ratio
Crude protein (g/kg)
Weight gain (g/bird)
Feed intake (g/bird)
FCR (g/g)
Standard (2.24) (2.48) (2.76)
Capped (1.90) (2.11) (2.35)
195 185 175 195 185 175
2490 2469 2318 2550 2490 2398
3389 3378 3275 3394 3320 3261
1.362 1.369 1.413 1.331 1.334 1.360
9.04 9.49
12.78 8.40 9.76
11.47 SEM Significance (P =) Starch:protein ratio (SP) Crude protein (CP) CP x SP interaction
21.73
0.004 < 0.001 0.395
25.99
0.292 < 0.001 0.471
0.0067
< 0.001 < 0.001 0.213
0.462
0.142 < 0.001 0.238
IV REFERENCES
Acheson KJ, Schutz Y, Bessard T, Anantharaman K, Flatt JP & Jequier E (1988) American
Journal of Clinical Nutrition 48: 240-247. Ameer F, Scandiuzzi L, Hasnain S, Kalbacher H & Zaidi N (2014) Metabolism 63: 895-902. Braun EJ, Sweazea KL (2008) Comparative Biochemistry and Physiology, Part B 151: 1-9. Buyse J, Decuypere E, Berghman L, Kuhn ER & Vandesande (1992) British Poultry Science
33: 1101-1109. Chrystal PV, Moss AF, Khoddami A, Naranjo VD, Selle PH & Liu SY (2020a) Poultry Science
99: 505-516. (2020b) Poultry Science 99: 1421-1431. Chrystal PV, Moss AF, Yin D, Khoddami A, Naranjo VD, Selle PH & Liu SY (2020c) Animal
Feed Science and Technology 261: 114387. Chrystal PV, Greenhalgh S, McInerney BV, McQuade LR, Selle PH & Liu SY (2021) Animal
Feed Science and Technology 275: 114867. Du M & Ahn DU (2002) Poultry Science 81: 428-433. Ells LJ, Seal CJ, Kettlitz B, Bal W & Mathers JC (2005) British Journal of Nutrition 94: 948-
955. Glimcher LH & Lee A-H (2009) Annals of the New York Academy of Sciences 1173: E2-E9. Giuberti G, Gallo A, Cerioli C & Masoero F (2012) Animal Feed Science and Technology 174:
163–173. Greenhalgh S, McInerney BV, McQuade LR, Chrystal PV, Khoddami A, Zhuang MAM, Liu
SY & Selle PH (2020) Animal Nutrition 6: 168-178. Jéquier E (1994) American Journal of Clinical Nutrition 59: 682S-685S Kroemer G, Lopez-Otin C, Madeo F & de Cabo R (2018) Cell 175: 605-614. Lehmann U, Robin F (2007) Trends in Food Science & Technology 18: 346-355. Li Z, Li J, Liu XL, Liu DD, Li H, Li JL, Han RL, Wang YB, Liu XJ, Kang XT, Yan FB & Tian
YD (2019) British Poultry Science 60: 449-456. Seal CJ, Daly ME, Thomas LC, Bal W, Birkett AM, Jeffcoat R & Mathers JC (2003) British
Journal of Nutrition 90: 853-864. Selle PH, Moss AF, Khoddami, Chrystal PV & Liu SY (2021) Animal Nutrition 7: 450-456. Tesseraud S, Metayer S, Duchene S, Bigot K, Grizard J & Dupont J (2007) Domestic Animal
Endocrinology 33: 123-142. Wang G, Kim WK, Cline MA & Gilbert ER (2017) Poultry Science 96: 3687-3699.
Aust. Poult. Science Symp. 2022...33
25

A COMPARISON OF WHEAT- AND SORGHUM-BASED DIETS WITH TWO CRUDE PROTEIN LEVELS ON THE PERFORMANCE OF BROILER CHICKENS
S. P. MACELLINE1, P.V. CHRYSTAL1, M. TOGHYANI1, S. GREENHALGH1,
P. H. SELLE1 and S.Y. LIU1
Summary
This study compared growth performance and carcass traits in broiler chickens offered either wheat- or sorghum-based diets with two crude protein (CP) concentrations of 170 and 210 g/kg from 14 to 35 days post-hatch as a 2 × 2 factorial array of dietary treatments. A treatment interaction (P = 0.033) was observed for FCR where broilers offered sorghum-based diets significantly outperformed wheat-based diet by 4.90% (1.437 versus 1.511) when offered 170 g/kg CP diets, but with 210 g/kg CP diets there was no difference in FCR.
I. INTRODUCTION Wheat and sorghum are the two major feed grains used in Australia for broiler diets; however, wheat is more common and is usually considered better quality than sorghum. The local chicken meat industry may have to increase by 60% to meet demand in 2050 so strategies are needed to promote sustainable chicken-meat production to meet this anticipated demand. Crude protein reductions in broiler diets could be a major factor in the quest for sustainable production. Reduced-CP diets have the potential to lower nitrogen excretion and ammonia emissions, improve litter quality and bird welfare, and reduce our dependence on imported soybean meal. However, growth performance of broiler chickens is often compromised by reductions in dietary CP and growth response to reduction of dietary protein was inconsistent among different feed grains (Liu et al., 2021). Wheat-based, reduced-CP diets depressed broiler growth performance in Greenhalgh et al. (2020); in contrast, maize-based diets performed well when dietary CP was reduced (Chrystal et al. 2021). The protein structure and functional properties are similar in sorghum in comparison to maize, and sorghum contains less soluble non-starch polysaccharides and relatively slow starch digestion rate than wheat. Therefore, the present study was designed to compare wheat- and sorghum-based diets in the context of reduced CP diets.
II. MATERIAL AND METHODS This feeding study was conducted in compliance with the guidelines of the Animal Ethics Committee of The University of Sydney. A total of 392 off-sex, male Ross 308 broilers were randomly distributed into 28 floor pens with 14 birds per pen and 7 replicates for each treatment from 14-35 days post-hatch. Prior to this, birds were offered a commercial starter diet. Four experimental diets were formulated based on wheat and sorghum with 210 and 170 g/kg dietary CP concentrations (with xylanase and phytase). All diets were formulated to 13.0 MJ/kg energy and contain ideal amino acid ratios based on 11.0 g/kg digestible lysine. Growth performance, relative abdominal fat-pad weights and carcass traits were determined from 14 to 35 days post-hatch. JMP Pro 14 was used to perform analyses of variance and a 5% probability level was considered significant.
1 Poultry Research Foundation within The University of Sydney, Brownlow Hill NSW 2570, Australia; [email protected]
Aust. Poult. Science Symp. 2022...33
26

Table 1 - Composition and nutrient specification of experimental diets
Feed ingredient (g/kg)
210 g/kg crude protein 170 g/kg crude protein Wheat Sorghum Wheat Sorghum
Wheat 674 - 877 - Sorghum - 624 - 789 Soybean meal 225 275 - 102 Soy oil 43.9 45.1 12.3 19.6 l-lysine HCl 4.20 3.55 10.9 8.72 d,l-methionine 2.68 3.21 4.31 4.66 l-threonine 1.68 1.35 4.53 3.60 l-tryptophan - - 0.65 0.24 l-valine 0.90 0.50 4.30 3.17 l-arginine 0.69 0.56 6.77 5.52 l-histidine - 1.25 1.04 l-tyrosine - - 2.14 0.59 l-isoleucine 0.44 0.13 3.82 2.82 l-leucine - 4.84 - l-phenylalanine - - 2.53 1.26 Glycine 0.13 0.98 5.57 5.63 Other ingredients 46.9 42.8 56.7 51.8 Total non-bound amino acids 10.7 10.3 51.4 37.2
Nutrient specifications Energy (MJ/kg) 13.0 13.0 13.0 13.0 Crude protein 210 207 170 170 Starch 421 399 546 503 Fat 61.4 72.5 30.5 50.4 Calcium 8.70 8.70 8.70 8.70 Available phosphorous 4.35 4.35 4.35 4.35 SID lysine 11.0 11.0 11.0 11.0 SID methionine 5.21 5.77 5.89 6.45 SID threonine 7.26 7.26 7.26 7.26
III. RESULTS
The outcomes of this comparison are shown in Table 2, where overall growth performance exceeded 2019 Aviagen performance objectives for Ross 308 birds by 18.0% for weight gain, 6.50% for feed intake and by 9.49% for FCR. Dietary CP reduction compromised weight gain by 4.61% (2232 versus 2129 g/bird; P < 0.001), feed intake by 2.72% (3157 versus 3071; P = 0.031). Sorghum-based diets supported higher weight gains than wheat by 4.84% (2232 versus 2129 g/bird; P = 0.002). A significant treatment interaction (P = 0.033) was observed for FCR as broilers offered 210 g/kg CP wheat- and sorghum-based diets had statistically similar feed conversion ratios. In contrast, at 170 g/kg CP, the sorghum-based diet supported a better FCR than wheat by 4.90% (1.437 versus 1.511). Therefore, reducing dietary CP from 210 to 170 g/kg increased FCR in wheat and sorghum-based diets by 8.94% and 4.97%, respectively. Dietary CP reductions increased relative fat-pad weights by 16.7% (10.35 versus 8.34 g/kg/bird, P = 0.010) and sorghum-based diets generated heavier fat-pad weights than wheat by 31.8% (10.99 versus 8.34 g/kg/bird, P < 0.001). Dietary CP reduction generated lower relative breast weights by 4.82% (228 versus 217 g/kg/bird, P < 0.001) and wheat-based diets supported heavier breast weights than sorghum by 8.41% (232 versus 214 g/kg/bird, P = 0.004). Relative thigh weights were not influenced (P > 0.15) by treatment.
Aust. Poult. Science Symp. 2022...33
27

Table 2 - Growth performance and carcass traits from 14 to 35 days post-hatch
Treatment Growth performance Carcass traits Crude
protein (g/kg) Feed grain
Gain (g/bird)
Intake (g/bird)
FCR (g/g)
Fat-pads (g/kg)
Breast (g/kg)
Thigh (g/kg)
210
170
Wheat
Sorghum Wheat
Sorghum
2252 2332 2024 2147
3123 3192 3058 3085
1.387a 1.369a 1.511c 1.437b
8.09 9.65 8.55 12.15
238 225 218 209
223 229 232 234
SEM Main effects: Crude protein 210 170 Feed grain Wheat Sorghum Significance (P =) Crude protein (CP) Feed grain (FG) CP x FG interaction
29.0
2292b 2086a
2129a 2232b
< 0.001 0.002 0.464
37.5
3157b 3071a
3088 3134
0.031 0.214 0.585
0.0122
1.378 1.474
1.454 1.406
< 0.001 0.001 0.033
0.526
8.87a
10.35b
8.34a 10.99b
0.010
< 0.001 0.065
3.3
232b 214a
228b 217a
< 0.001 0.004 0.528
4.8
226 233
227 231
0.160 0.416 0.626
abc Means within columns not sharing a common suffix are significantly different at the 5% level of probability
IV. DISCUSSION
The interaction between dietary CP and feed grain on FCR, where sorghum enjoyed a 4.90% advantage in 170 g/kg CP diets, suggests that sorghum is superior to wheat as the basis of reduced-CP broiler diets. Alternatively, sorghum generated 42.1% heavier fat-pad weights than broilers offered 170 g/kg CP, wheat-based diets, which is disadvantageous. These conflicting outcomes present a conundrum to the development of reduced-CP broiler diets. In reduced-CP diets, wheat seems to have a lesser propensity to increase abdominal fat-pad weights, and by extension overall fat deposition, than maize (Chrystal et al., 2021) and, in the present study, sorghum. It is probably salient that the starch digestion rate of wheat is more rapid than maize or sorghum which has been demonstrated under in vitro (Giuberti et al., 2012) and in vivo (Selle et al., 2021) conditions. It appears that slowly digestible maize and sorghum starch and the more gradual and sustained intestinal uptakes of glucose promotes increased fat deposition via de novo lipogenesis (Wang et al., 2017). Excess glucose may be stored as glycogen in liver and muscle but the capacity of avian species to store glycogen in muscle is limited (Braun and Sweazea, 2008). Once glycogen stores are saturated glucose is effectively converted into fat by de novo lipogenesis in the liver. On the other hand, glucose from rapidly digestible wheat starch may be disposed of by direct oxidation to greater extents (Jequier, 1994). The wheat-based, 170 g/kg CP diet contained substantially more non-bound amino acids (51.4 versus 37.2 g/kg) than the corresponding sorghum-based diet. The genesis of this difference was simply because the protein content of wheat exceeded that of sorghum. Non-bound amino acids are more rapidly absorbed than protein-bound amino acids and it follows that this difference could trigger post-enteral amino acid imbalances resulting in the deamination of surplus amino acids and excretion of uric acid, a process that requires energy (Selle et al., 2020). The balance between non-bound and protein-bound amino acids in reduced-
Aust. Poult. Science Symp. 2022...33
28

CP diets may be pivotal, as discussed by Macelline et al. (2020), and a point may be reached where non-bound amino acid inclusions become excessive and compromise performance. In the present study, for example, dietary non-bound amino acid inclusions compromised FCR in a quadratic manner (r = 0.882, P < 0.001), as shown in Figure 1.
V. CONCLUSIONS
Broiler responses to wheat- and sorghum-based diets containing 170 g/kg CP were divergent in that sorghum generated better efficiency of feed conversion but somewhat paradoxically, with greater fat deposition. In this, and other comparative studies, the impact that the feed grain selected as the basis of a reduced-CP diets has on broiler performance is of tremendous importance. The genesis of these differences between feed grains appears to be related to both the properties of starch and protein contents, which dictate the extent of non-bound amino acid inclusions. A better comprehension of both factors is needed if reduced-CP broiler diets are to be developed successfully.
REFERENCES
Braun EJ & Sweazea KL (2008) Comparative Biochemistry and Physiology, Part B 151: 1-9. Chrystal PV, Greenhalgh S, McInerney BV, McQuade LR, Selle PH & Liu SY (2021) Animal
Feed Science and Technology 275: 114867. Giuberti G, Gallo A, Cerioli C & Masoero F. (2012) Animal Feed Science and Technology
174: 163-173. Greenhalgh S, McInerney BV, McQuade LR, Chrystal PV, Khoddami A, Zhuang MAM, Liu
SY & Selle PH (2020) Animal Nutrition 6: 168-178. Jequier E (1994) American Journal of Clinical Nutrition 59, 682S-685S. Liu SY, Macelline SP, Chrystal PV & Selle PH (2021) Journal of Animal Science and
Biotechnology 12: 1-3. Macelline SP, Chrystal PV, Toghyani M, Greenhalgh, Selle PH & Liu SY (2020) Proceedings,
Australian Poultry Science Symposium 31: 95-98 Selle PH, Chrystal PV & Liu SY (2020) Proceedings of the Australian Poultry Science
Symposium 31: 63-66. Selle PH, Moss AF, Khoddami A, Chrystal PV & Liu SY (2021) Animal Nutrition 7: 450-456. Wang G, Kim WK, Cline MA & Gilbert ER (2017) Poultry Science 96: 3687-3699.
1.3
1.35
1.4
1.45
1.5
1.55
1.6
8 16 24 32 40 48 56
Feed
con
vers
ion
ratio
Non-bound amino acid inclusions (g/kg)
Figure 1 Quadratic relationship (r = 0.882; P < 0.001) between dietary non-bound amino acid inclusions and FCR in broiler chickens y = 1.383 - 0.001*NBAA + 0.00007263*NBAA2
Aust. Poult. Science Symp. 2022...33
29

EFFECTS OF BRANCHED-CHAIN AMINO ACIDS ON GROWTH PERFORMANCE IN BROILER CHICKENS OFFERED REDUCED CRUDE PROTEIN DIETS BASED ON
WHEAT OR SORGHUM
S. GREENHALGH1, S.Y. LIU1, P.V. CHRYSTAL2 and P. H. SELLE1
Summary The objective of this study was to compare 187.5 g/kg crude protein (CP) broiler diets based on wheat or sorghum with three different branched-chain amino acids (BCAA) inclusion regimes offered to 216 male Ross 308 broiler chickens from 7 to 28 days post-hatch (6 treatments, 6 replicates and 6 birds per replicate). A significant interaction between feed grains and BCAA was observed for weight gain (P < 0.001) where BCAA inclusions elevated from standard levels depressed weight gain by 9.49% in birds offered wheat-based diets; in contrast, the same transition enhanced weight gain by 9.26% (P < 0.001) in birds offered sorghum-based diets. Feed grains alone had a highly significant (P < 0.001) effect on feed intakes where wheat-based diets generated higher feed intakes (2141 g/bird) compared to sorghum-based diets (1951 g/bird) by 9.74%. Elevated BCAA inclusions compromised FCR by 8.33% in birds offered wheat-based diets but, in contrast, elevated BCAA inclusions in sorghum-based diets did not have any significant impacts on FCR. Birds offered wheat-based diets had relative fat-pad weights of 5.68 g/kg, whereas sorghum-based diets had substantially heavier average fat-pad weights of 13.48 g/kg. Overall, it was found that elevation of BCAA in reduced CP diets is beneficial in sorghum-based diets as opposed to wheat, highlighting the importance of feed-grain type in reduced-CP diets.
I. INTRODUCTION
The development of reduced-CP diets in broiler chickens is gaining more interest as it would drastically lessen the dependence on imported soybean meal which is strategically important for non-soybean producing regions such as Australia and Europe. Modest reductions in CP are already being realised by inclusions of unbound (synthetic or crystalline) methionine, lysine and threonine, which have been routinely included in poultry diets for decades (Kidd et al., 2013). There is the potential to reduce dependence on soybean meal by up to 50% as non-bound (synthetic, crystalline) amino acids are effectively an alternative ‘protein’ source to soybean meal (Selle et al., 2020a). The branched-chain amino acids (BCAA), isoleucine, leucine and valine, merit attention because valine or isoleucine is probably the fourth limiting amino acid in typical broiler diets and leucine is involved in metabolic and physiological roles in addition to protein accretion (Duan et al., 2016). Therefore, the objective of this experiment was to compare growth performance in broiler chickens offered moderately reduced CP diets based on wheat or sorghum which are the most common feed grains in Australia.
1 1 Poultry Research Foundation, School of Life and Environmental Science, Faculty of Science, The University of Sydney, Camden, NSW 2570, Australia; [email protected]; Sonia.liu@sydney,edu.au; [email protected] 2 Complete Feed Solutions. Hornsby, NSW 2077, Australia. Howick, 2145 New Zealand; [email protected]
Aust. Poult. Science Symp. 2022...33
30

II. MATERIALS AND METHODS
This study fully complied with the guidelines (2019/1667) specifically approved by the Research Integrity and Ethics Administration of The University of Sydney. The experimental design consisted of a 2 × 3 factorial array of dietary treatments, which were offered to 216 off-sex male Ross 308 broiler chickens from 7 to 28 days post-hatch. The dietary treatments comprised of two feed grains, wheat and sorghum and three regimens of branched-chain amino acid inclusions as shown in Table 1. All six diets were formulated to contain 187.5 g/kg CP, 11.0 g/kg digestible lysine, 20.0 g/kg glycine equivalents, 12.97 MJ/kg metabolisable energy with a constant dietary electrolyte balance (DEB) of 200 mEq/kg. The composition of diets is shown in Table 2. Phytase and xylanase were supplemented in all dietary treatments. Growth performance was recorded and dead or culled birds were weighed to adjust feed intake and FCR. The two-way ANOVA of experimental data was carried out by IBM® SPSS® Statistics 24 program (IBM Corporation. Somers, NY). Experimental units were cage means (6 replicate cages of 6 birds per dietary treatment) and probability levels of less than 5% were considered statistically significant by Student’s t-test.
Table 1 - Outline of dietary treatments with relativity of leucine, isoleucine and valine to leucine (100) shown in parentheses
Treatment Feed grain Branched-chain amino acids (g/kg) Leucine Isoleucine Valine
1A 2B 3C 4D 5E 6F
Wheat Wheat Wheat
Sorghum Sorghum Sorghum
11.55 (105) 16.50 (150) 16.50 (150) 11.55 (105) 16.50 (150) 16.50 (150)
7.15 (65) 7.15 (65) 8.25 (75) 7.15 (65) 7.15 (65) 8.25 (75)
8.25 (75) 8.25 (75) 9.35 (85) 8.25 (75) 8.25 (75) 9.35 (85)
Table 2 - Composition of experimental diets
Feed ingredient (g/kg) 1A 2B 3C 4D 5E 6F Wheat Sorghum Canola seed Soybean meal Soy oil Lysine HCl Methionine Threonine Tryptophan Valine Arginine Isoleucine Leucine Histidine Glycine Sodium bicarbonate Potassium carbonate Limestone Dicalcium phosphate Xylanase
798
- 60
29.8 8.53 9.19 3.892 3.928 0.407 2.995 5.849 2.685 3.443 0.830
11.440 4.92 7.22 12.20 8.98 0.10
812
- 60
12.0 3.72 9.705 4.023 4.151 0.491 3.269 6.335 2.957 8.912 0.983 11.870 4.92 8.10 12.28 9.11 0.10
818
- 60
3.74 1.62
9.943 4.084 4.255 0.530 4.520 6.561 4.205 9.119 1.054
12.071 4.92 8.50
12.31 9.17 0.10
-
705 60
124 15.04 7.265 4.032 2.880 0.352 2.161 4.515 1.869 0.000 0.614
11.669 4.90 1.39
11.94 8.84 0.10
-
701 60
134 14.40 6.959 3.937 3.044 0.298 1.984 4.215 1.697 4.753 0.515
11.381 4.89 0.89
11.90 8.75 0.10
-
706 60
127 12.38 7.175 3.998 3.139 0.335 3.225 4.425 2.936 4.928 0.583
11.578 4.89 1.24
11.93 8.81 0.10
Aust. Poult. Science Symp. 2022...33
31

Phytase Choline chloride Celite Sand Vitamin-mineral premix Sum of non-bound amino acids
0.05 0.90 20.0 2.50 2.00
42.64
0.05 0.90 20.0 2.50 2.00
50.56
0.05 0.90 20.0 2.50 2.00
54.16
0.05 0.90 20.0 2.50 2.00
33.76
0.05 0.90 20.0 2.50 2.00
37.25
0.05 0.90 20.0 2.50 2.00
40.74
III. RESULTS AND DISCUSSION
The effects of dietary treatments on growth performance and relative abdominal fat-pad weights are shown in Table 3. The overall 3.09% mortality/cull rate was not related (P > 0.15) to treatment. There was a highly significant (P < 0.001) interaction between feed grains and BCAA for weight gain. The transition from standard to elevated BCAA inclusions depressed weight gain by 9.49% (1288 versus 1423 g/bird; P < 0.001) in birds offered wheat-based diets; in contrast, the same transition enhanced weight gain by 9.26% (1451 versus 1328 g/bird; P < 0.001) in birds offered sorghum-based diets. Feed grain had a significant (P < 0.001) effect on feed intake where wheat-based diets generated 9.74%. higher feed intake (2141 g/bird) compared to sorghum-based diets (1951 g/bird). A significant (P < 0.014) treatment interaction was also observed for FCR. Elevated BCAA inclusions compromised FCR by 8.33% (1.665 versus 1.537) in birds offered wheat-based diets but, in contrast, it did not have any impact on sorghum-based diets. Feed grains had a significant (P < 0.001) impact on relative fat-pad weights. Birds offered wheat-based diets had fat-pad weights of 5.68 g/kg whereas birds offered sorghum-based diets had substantially relative heavier fat-pad weights of 13.48 g/kg. The underlying mechanism for such differences is unclear; however it could be suggested that the fatty acid composition difference between the grains in conjunction with the added dietary oil may influence fat deposition through an imbalance of saturated fatty acids such as palmitic acid (PA) to polyunsaturated fatty acids (Arroyo et al., 2013; Cherian et al., 2002; Carta et al.,2017). In a similar preceding study (Greenhalgh et al., 2021), leucine concentrations were elevated from 110 to 150 relative to lysine in 190 g/kg CP, wheat-based diets. This transition numerically increased feed intake by 1.05% (2109 versus 2087 g/bird) but numerically compromised weight gain by 2.52% (1390 versus 1426 g/bird) and FCR by 3.28% (1.512 versus 1.464) from 7 to 28 days post-hatch. In the present study, the same leucine elevation significantly decreased weight gain by 5.62% (1343 versus 1423 g/bird) in wheat-based diets. In contrast, high leucine in sorghum-based diets significantly increased weight gain by 9.26% (1451 versus 1328 g/bird) in the present study. Thus, the findings in wheat-based diets were somewhat similar in both the previous and present studies but differed with the outcome in sorghum-based diets. However, positive responses to elevated leucine levels in maize-based diets have been reported (Yamazaki et al., 2006; Chen et al., 2016). Overall elevation in sorghum-based diets are beneficial compared to wheat based diets, highlighting the importance of the feed-grain in reduced-CP diets, albeit in the context of differing BCAA inclusion regimes.
Aust. Poult. Science Symp. 2022...33
32

Table 3 - The effects of dietary treatments on growth performance and relative abdominal fat-pad
weights from 7 to 28 days post-hatch Treatments Growth performance Fat-pad
weights (g/kg)
Feed grain
BCAA
Weight gain (g/kg)
Feed intake (g/kg)
FCR (g/g)
Mortalities (%)
Wheat
Sorghum
Standard High Leu
High BCAA Standard High Leu
High BCAA
1423c 1343ab 1288a 1328a 1451c 1451c
2187 2094 2142 1846 2009 1998
1.537b 1.556b 1.665c 1.390a 1.385a 1.378a
8.34 2.78 5.56 2.78 0.00 0.00
5.66 5.89 5.48
13.95 13.76 12.73
SEM Main effects: Grain Wheat Sorghum BCAA Standard High leucine High BCAA Significance (P =) Grain BCAA Grain × BCAA interaction
21.03
1351 1410
1387 1401 1378
0.002 0.418
< 0.001
44.87
2141b 1951a
2007 2031 2036
< 0.001 0.706 0.059
0.022
1.586 1.384
1.445 1.441 1.481
< 0.001 0.085 0.014
8.23
5.56 0.93
3.70 3.70 1.85
0.150 0.662 0.141
0.494
5.68a 13.48b
10.74 10.81 10.55
< 0.001 0.805 0.298
abc Means within columns not sharing the same suffix are significantly different at the 5% level of probability ACKNOWLEDGEMENTS: The authors would like to acknowledge the financial support and guidance of The AgriFutures Australia Chicken Meat Program and the technicians that have contributed to the data used to produce this paper.
REFERENCES Arryo J, Auvergne A, Dubious JP, Lavigne F, Bijja M, Bannelier C, Manse H & Fortune-
Lamothe L (2013) Poultry Science 92: 2448-2456. Carta G, Murru E, Banni S & Manca C (2017) Frontiers in Physiology 8: 1-14 Chen X, Zhang Q & Applegate TJ (2016) Poultry Science 95: 1281-1289. Cherian G, Selvaraj RK, Goeger MP & Stitt PA (2002) Poultry Science 81: 1415-1420. Duan Y, Li F, Li Y, Tang Y, Kong X, Feng Z, Anthony TG, Watford M, Hou Y, Wu G &
Yin Y (2016) Amino Acids 48: 41-51. Greenhalgh S, Liu SY, Chrystal PV & Selle PH (2020) Proceedings of the Australian Poultry
Science Symposium 32: 92-95. Kidd MT, Tillman PB, Waldroup PW & Holder W (2013) Journal of Applied Poultry
Research 22: 583-590. Selle PH, Hughes RJ, Godwin ID, Khoddami A, Chrystal PV & Liu SY (2021a) World’s
Poultry Science Journal 77: 29-41. Yamazaki M, Murakami H, Nakashima K, Abe H & Takemasa M (2006) Journal of Poultry
Science 43:150-155.
Aust. Poult. Science Symp. 2022...33
33

IN OVO INJECTION OF OREGANO ESSENTIAL OIL AT DIFFERENT pH AFFECTS HATCHABILITY AND POST-HATCHING PERFORMANCE IN BROILER CHICKENS
A.A. KHASKHELI1, S. NIKNAFS1, M.M.Y. MEIJER1 and E. ROURA1
The dynamic complexity of the developing embryo requires the maintenance of differentiated compartments with the capacity to maintain independent environments required to optimise their function. One of the least understood homeostatic mechanisms in embryonic development relates to the pH. The albumen’s pH at lay experiences a sharp increase to 9.7 which later decreases to 6.90 by day 17 (Tona et al., 2001). In contrast, the pH of yolk starts with a relatively low 6.67 at lay and increases with the embryonic development up to 8.05 at 15 d (Decuypere et al., 2001). This experiment aimed at testing the hypothesis that the in ovo injection of oregano essential oil (OEO) at a buffered neutral pH between 6.5 and 7.0 has the potential to improve the hatchability and the post-hatch performance in broiler chickens.
The study included 720 eggs incubated using standard procedures. T1-T2 were control groups consisting of 3 replicates of 20 eggs each non-injected (T1) or injected with a saline solution (T2) in the air-sac on day 17.5. T3-T8 consisted of 5 replicates of 20 eggs each injected 0.1ml OEO at different pH, in air sac on day 17.5. The concentration of OEO was 0.5%. The pH solution for T3 (pH=4.5) was adjusted using 0.1 mM citric acid, while for T4-T8 (pH of 5.5, 6.5, 7.5 and 8.5, respectively) 0.001M sodium hydroxide was used. At 21 d, 45 chicks from groups T1-T8 (3 replicates of 15 chicks/group) were transferred to brooders and reared for 7 days. Data was analysed using PROC GLM of SAS 9.4. Significance level was set at P<0.05.
The highest hatchability was observed for the 6.5 pH in T5 (95.7%) while T6 (pH 7.5) had the lowest (82.0%) (Table 1). Injection of OEO with different pH into the air cell had no significant impact on post-hatch growth or feed intake (P>0.05). However, injection of OEO at a pH of 7.5, compared to the non-injected control group, significantly (P<0.05) reduced feed conversion ratio (FCR) (1.114 vs 1.558). Improvement in FCR might be related to positive influence of OEO on chickens’ health, so they efficiently utilized the feed. In conclusion, changes in the pH of OEO injected in ovo may influence hatchability and FCR post-hatch in broiler chickens.
Table 1 – Influence of in ovo injection of oregano essential oil at different pHs on hatchability and post hatching performance in broiler chickens
Treatments Hatchability (%) BW0 (g) BW7 (g) Feed intake (g) FCR T1(control) 89.6 44.6 167.3 188.8 1.558 a T2(saline) 90.6 44.7 183.4 163.3 1.183 ab T3(oregano pH 4.5) 92.7 44.0 182.5 169.8 1.225 ab T4(oregano pH 5.5) 91.8 45.3 182.4 180.1 1.318 ab T5(oregano pH 6.5) 95.7 44.9 187.2 183.7 1.291 ab T6(oregano pH 7.5) 82.0 44.3 184.9 156.3 1.114 b T7(oregano pH 8.5) 89.5 44.2 181.5 163.1 1.188 ab T8(oregano pH 9.5) 91.9 44.5 188.4 180.6 1.256 ab SEM - 0.51 6.4 9.3 0.09 P values - 0.6167 0.4494 0.2123 0.0343
ac means within each column with different letters are significantly different at P<0.05.
ACKNOWLEDGEMENTS: Study was supported by AgriFutures Chicken Meat Program. Decuypere E, Tona K, Bruggeman V & Bamelis F (2001) World's Poult. Sci. J. 57: 127-138. Tona K, Bamelis F, De Ketelaere B, Bruggeman V, Moraes VM, Buyse J & Decuypere E (2003) Poult. Sci. 82: 736-741.
1 The University of Queensland, Australia; [email protected]
Aust. Poult. Science Symp. 2022...33
34

UNDERSTANDING AND MANAGING WATER FOR SUCCESSFUL FLOCKS
S.E. WATKINS1
Summary
Water is the single greatest input into the production of poultry products such as eggs and meat. The fact water is a relatively inexpensive input as compared to feed, and it is difficult to conduct experiments which evaluate water parameters on poultry performance, has resulted in little research done in this area in the past thirty years. With the changing dynamics of production as well as the advancement in genetics, there exists the need for sound water quality guidelines which help production personnel evaluate water systems and interpret findings in a manner which support optimal production.
I INTRODUCTION As the single greatest nutrient input into the production of eggs and meat, water quality and quantity deserve careful attention to assure optimal flock performance. Twenty-five years of assisting the poultry industry worldwide with identifying and correcting drinking water challenges provides the foundation of experience and expertise which will be shared in this paper.
Birds are fairly tolerant of most contaminants in drinking water. While standards exist for maximum acceptable levels for the most common naturally occurring water contaminants such as iron (0.3 mg/L also ppm) and calcium (80 mg/L), these standards are mainly derived from standards used for human drinking water supplies. These are based more on aesthetic values and not on careful research evaluations to determine what levels have a negative correlation to performance parameters such as weight gain, feed conversion, livability, fertility and egg production. Therefore, most standard guidelines should be considered just that, guidelines and not representation of what birds can tolerate. The exceptions to this observation are levels of sodium and chloride as well as magnesium and sulfate combinations. Levels of sodium and chloride above 200 mg/L without adjustments to dietary salt levels can increase the incidence of loose droppings and levels exceeding 400 ppm/L will depress weight gains and feed conversions. Similar issues of loose droppings have been observed with magnesium levels above 60-80 mg/L combined with sulphate levels greater than 250 mg/L. Birds are tolerant of calcium levels as high as 150-180 mg/L but this scale-producing mineral along with magnesium, iron and manganese can impact equipment function and diminish distribution pipe size if corrective actions such as a water softener or acidification to a pH below 6 are not implemented. Birds are also very tolerant of the presence of iron and manganese in the water but are less tolerant of the pathogens such as pseudomonas, E. coli and salmonella which require iron, and in some cases manganese, for building cell walls. Therefore, the presence of these two minerals in water supplies should be considered a red flag for the risk of harmful microbes and appropriate sanitation and filtration steps taken.
Water supplies are dynamic and subject to the risk of changing. Factors such as floods, droughts, water usage level, as well as practices such as mining or crop farming, can influence
1 Distinguished Professor Emeritus, Center of Excellence for Poultry Science University of Arkansas’ Systems Division of Agriculture [email protected]
Aust. Poult. Science Symp. 2022...33
35

quality with surface supplies being the most vulnerable. Poultry drinking water systems are also vulnerable to change, particularly microbial, even when the source also provides drinking water for residences. Poultry production buildings use water differently than residential sources. In poultry barns, water is slow moving, creating a perfect environment for microbes such as Bordetella and water can sit dormant throughout the night or between flocks. Both situations can compromise microbial quality even when sanitisers such as chlorine are used.
Companies with the most successful water programs are proactive in developing and implementing a diligent water inspection process that can help identify and correct challenges early. Also critical for successful water programs are effective and thorough system cleaning between flocks or when the barns are empty and use of water sanitizers which complement the water. The final steps to a successful program are consistent monitoring and verification of effectiveness through microbial testing provide the sanitation schedule for on-farm water systems. This paper presents a series of checklists to assist the user.
II WATER SYSTEM INSPECTION
a) Source
• Identify source-well, municipal, surface, other • Examine well or surface water design • Determine if any unusual conditions have occurred such as flooding or droughts. Does
the area have activities like row-crop farming, mining or fracking? • Check for well-head damage and determine if any maintenance has been done on the
system such as pump replacement that could result in contamination • Measure gallons per minute (gpm) at source. Rainwave flow meter can be attached to
hydrants, but verify the water faucet used for the test does not restrict flow or the water hose draining from Rainwave during test
• What water treatments are used at the source- and in what order? • Are there injectors and how are they plumbed in? What is their gpm rating? • Collect sterile water sample as close to source as possible for total bacteria, coliforms
and mineral and pH analysis (need one cup of water) - store on cool pack until submitted to laboratory
• Visually examine water, smell and taste it
b) Storage • Size/holding capacity/volume, material, color, location, cleanliness • How does water flow into and out of storage? • Does water leave storage directly from bottom or output elevated off bottom? • How long does water remain in storage? What is dwell time in storage between flocks
and during flock? • How often is storage cleaned and can it be completely cleaned including bottom? If
cleaned, how and with what? • Is water supply treated prior to or after storage? • What products or treatments are used before and after storage? • If concerns about water quality changing during storage, collect sterile water sample
and post storage for total bacteria and mineral and pH evaluation
Aust. Poult. Science Symp. 2022...33
36

c) Distribution • Verify pipe size(s) and type of plumbing material (pvc, metal) and age of lines from
source to birds. Has there been any work done on distribution lines? • Determine if underground water lines can be cleaned from source to barns. • Have lines been cleaned and with what?
d) Barns-Entry Way/Ante Room
• Is there daily water usage information for flocks? Are there usage records throughout the day?
• Check pressure reducer-maintenance schedule, has screen been checked for sediment build-up, are there pressure gauges pre and post pressure reducer?
• Inspect filters –are they clean, how often are they changed? Do they clog frequently? (If so, submit filter covered in clogging material to Watkins Water Lab for mineral/microbial analysis where appropriate)
• What is gpm flow at barn entrance • Inspect injectors - what is gpm rating, • Inspect connectors to medicators when not hard plumbed; do connector hoses create
flow restrictions? Have injectors been repaired? Has injection accuracy been verified? How many injectors? What are they used for? Are they cleaned between uses? What is container used to hold injected products? Is it sealed, used for anything else?
• What products are added? If sanitation products/acidification are used, is there time for products to mix into water prior to additional injections? How often are products added?
• Is there any verification of sanitiser residual in water?
e) Drinker System • Verify system type • Verify age and length of each water line and drinker spacing and # per line • Determine #birds/drinker - during brooding and grow-out • Inspect hoses and connectors, with particular attention to drop hoses into water lines • Regulators - age, maintenance, chemicals used (cleaners, sanitizers, acids) • Have water lines been cut open? If so, what was observed on inside of line? • Do lines experience sediment buildup? Do drinkers leak due to sediment build-up? • Has system been cleaned? When and with what? • Are water lines flushed during flock? How often? • Inspect water line drain hoses, do they allow water flow to move freely or are there
restriction points? • Inspect standpipes • Is there any documentation of water sanitation product residual in drinker lines in front
and back of barn • Are all water lines used during brooding? If not, how are off-brood end lines managed
during the brooding period? • Are there shocker lines over drinker lines? Are they working? How are they grounded? • Visually examine water from water line, smell and taste it • Collect sterile drip water samples from water line but do so in a way that prevents
contamination of sample from fans and moving air • Collect swab samples from end of water lines and when possible, from inside regulator,
also prevent contamination from air from fans, etc
Aust. Poult. Science Symp. 2022...33
37

f) Cool Cells and Foggers • Are any products used? • Inspect system and if challenges with cool cells - turning to mush or mineral build-up
clogging air flow, take sample of water from cool cell recirculation tank for mineral and pH analysis
• How often are fogger lines used? • Are they cleaned during non-use or prior to warm weather?
g) Water Analysis
Standard Analysis: Analyse source samples for minerals and pH, total bacteria and coliforms. Test drip and swab samples from water lines for total bacteria. Carefully collect samples to prevent contamination from hands, air or outside of water line. If using a different lab from ones listed below, confirm lab will analyze for: calcium, magnesium, iron, manganese, sulphur (sulphates), chloride, sodium, pH. Additional tests should be requested if the following symptoms or concerns are present:
• Clear to white filmy, stringy slime - Request fungus, yeast and mold and general microbial profile from UA Diagnostic Laboratory. Collect the slime in as sterile as possible manner with swab
• Pinkish, reddish, brown slime in storage, water filters or lines - Request pseudomonas from UA Diagnostic Lab
• Concerns that treatments are not working properly, i.e. filtration, Reverse Osmosis, magnets - submit a sample collected post treatment for mineral and pH analysis
• Health challenges such as respiratory, leg lameness or necrotic enteritis, loose droppings or feed passage above normal levels - Collect drip samples from near end of water lines and swab samples from regulators and end of water lines-request total microbial profile including staph from UA Diagnostic Lab as well as total bacteria, yeast and mold from Watkins Lab
• Use of water products such as therapeutics or organic/inorganic acids- Request bacteria, yeast and mold from Watkins Water Lab
Collect samples in as sterile as possible manner for microbial analysis and store in a cooler with ice packs till submitted to lab. For best results, submit sample within 24 hours of collection but up to 4 days is acceptable as long as samples are kept cold but not frozen.
III CONCLUSION
Water plays a major role in the health, well-being and productivity of poultry flocks. Because in the past, it has tended to be a relatively cheap resource compared to feed, there has been little research done to better understand the role its quality plays on performance or just how vulnerable water quality is to the evolving dynamics of poultry drinking systems. However, in the era of antibiotic free production, all factors of production must receive careful scrutiny, including water systems to assure that overlooked issues or practices do not contribute to a loss of control of quality. By acknowledging and accepting water sources, supplies and systems for poultry operations can be vulnerable to contamination, particularly microbial pathogens, production personnel may be more motivated to develop water programs that take a pro-active stance in assuring optimal water quality is maintained from source to the last drinker. This paper provides a foundation for creating a proactive water inspection program which could be beneficial for assuring water is maintained at the quality necessary for keeping flocks performing at their best.
Aust. Poult. Science Symp. 2022...33
38

REQUIREMENT OF DIGESTIBLE CALCIUM AT DIFFERENT DIETARY CONCENTRATIONS OF DIGESTIBLE PHOSPHORUS FOR BROILER GROWERS
(DAYS 11-24 POSTHATCH)
L. S. DAVID1, M. R. ABDOLLAHI1, G. RAVINDRAN2, M. R. BEDFORD3 and V. RAVINDRAN1
Summary
An experiment was conducted to determine the digestible calcium (Ca) and digestible phosphorus (P) requirements of 11-24 days old broiler chickens. Eighteen experimental grower diets based on maize-soybean meal were formulated in a 6 × 3 factorial arrangement with diets containing six concentrations of standardised ileal digestible (SID) Ca (1.80, 2.35, 2.90, 3.45, 4.00 and 4.55 g/kg) and three concentrations of SID P (3.5, 4.5 and 5.5 g/kg) and were fed to broilers from days 11 to 24. Each experimental diet was randomly allocated to six replicate cages (eight birds per cage). Body weight was recorded on day 11 and 24. On day 24, the birds were euthanised to collect tibia for the determination of tibia ash concentrations. Fixed effects of the experiment were dietary concentrations of SID Ca and SID P and their interaction. If the interaction or main effects were significant (P < 0.05), the parameter estimates for second-order response surface model were determined using General Linear Model procedure of SAS (2019). The body weight gain of broiler growers was found to be optimised at the SID P concentrations of 3.5 g/kg at SID Ca concentrations below 4.0 g/kg. At 3.5 g/kg SID P concentration, the required SID Ca for maximum weight gain was determined to be 3.05 g/kg, which corresponded to SID Ca to SID P ratios of 0.87. The concentration of SID Ca that maximised tibia ash at 3.5 g/kg SID P was 3.69 g/kg, which corresponded to SID Ca to SID P ratio of 1.05. Bone ash requires more Ca than body weight gain.
I. INTRODUCTION
Poultry diets are currently formulated based on total calcium (Ca) and available phosphorus, with a ratio of 2:1 being maintained between them. For a number of reasons, there is increasing interest in shifting the formulations based on digestible Ca and digestible P. To enable this move, information is required of the requirements of digestible Ca and digestible P. A recent study at our laboratory (David et al., 2021) determined the standardised ileal digestible (SID) Ca and SID P requirements for broiler starters (day 1-10 posthatch). The results showed that the weight gain, tibia ash, and Ca and P utilisation were optimised at 5 g/kg SID P concentration. The SID Ca required for maximum weight gain and tibia ash at 5 g/kg SID P was determined to be 3.32 and 4.51 g/kg, respectively, which corresponded to SID Ca to SID P ratios of 0.66 and 0.90, respectively. The objective of the current study was to determine the requirements of digestible Ca and digestible P in broiler growers (days 11-24 posthatch) to maximise weight gain and tibia ash.
II. MATERIALS AND METHOD
The experimental protocol was approved by the Massey University Animal Ethics Committee. Eighteen experimental grower diets based on maize-soybean meal were formulated in a 6 × 3 factorial arrangement with diets containing six concentrations of Ca and three concentrations
1 Monogastric Research Centre, School of Agriculture and Environment, Massey University, Palmerston North 4442, New Zealand. [email protected] 2 Institute of Food, Nutrition and Human Health, Massey University, Palmerston North 4442, New Zealand. 3 AB Vista, Marlborough, Wiltshire SN8 4AN, United Kingdom.
Aust. Poult. Science Symp. 2022...33
39

of P. Diets were formulated to contain 1.80, 2.35, 2.90, 3.45, 4.00 and 4.55 g/kg SID Ca (corresponding to 3.8, 4.8, 5.8, 6.8, 7.8 and 8.8 g/kg total Ca, respectively) and 3.5, 4.5 and 5.5 g/kg SID P (corresponding to 4.7, 6.2 and 7.7 g/kg total P, respectively). A total of 864, day-old male broilers (Ross 308) were fed broiler starter crumbles till day 10. On day 11, the birds were weighed and allocated (mean ± SD, 383 ± 11.2 g) to 108 grower cages (eight birds per cage). The experimental diets were offered ad libitum to six replicate cages of broilers from day 11 to 24 post-hatch. The birds had free access to water. Body weight was recorded on a cage basis at the start and end of the experimental period and the weight gain was calculated. On day 24, right tibia from six birds per replicate was removed and processed as described by David et al. (2021). The tibia ash concentration was determined using AOAC (2016) procedures. Data were analysed using the General Linear Model (GLM) procedure of SAS (2019), with cage serving as the experimental unit. Two sets of analyses were conducted. First, as a factorial arrangement of treatments examining the effects of dietary concentrations of SID Ca and SID P and their interaction. The effects were considered significant at P < 0.05. Second, if the interaction or main effects were significant, then the estimates for the second-order response surface model were determined using the GLM procedure of SAS (2019) and these estimates were used to calculate the maximum response and the SID Ca concentration required for maximum response.
III. RESULTS AND DISCUSSION
All birds remained healthy during the experiment. Table 1 and Figure 1 present the body weight gain and the concentrations of tibia ash of 11 to 24-day old birds fed the diets containing different SID Ca and SID P. There was an interaction (P < 0.001) between SID Ca and SID P for body weight gain. At the lowest SID Ca (1.80 g/kg) concentration, increasing concentration of SID P reduced body weight gain. However, increasing SID P concentration increased body weight gain at the highest SID Ca concentration (4.55 g/kg), but did not affect the gain at other SID Ca concentrations (2.35 and 4.00 g/kg), demonstrating that the gains were increased with increasing SID P if the SID Ca was also increased (4.55 g/kg) beyond 4.00 g/kg. To predict the SID Ca at maximum response, a reduced model was used for body weight gain. The predicted maximum body weight gains at SID P concentrations of 3.5, 4.5 and 5.5 g/kg were 1174, 1177 and 1200 g/bird, at SID Ca concentrations of 3.05, 3.69 and 4.33 g/kg, respectively. These values corresponded to SID Ca to SID P ratios of 0.87, 0.82 and 0.79, respectively. Based on the current finding and at SID Ca concentrations below 4.0 g/kg, the SID P concentration of 3.5 g/kg is recommended for broiler growers (11-24 day post-hatch). The concentration of SID Ca that maximised body weight gain at 3.5 g/kg SID P was 3.05 g/kg, which corresponded to SID Ca to SID P ratio of 0.87. This estimate is lower than the current Ross (2019) total Ca recommendation for broiler growers (8.7 g/kg total Ca or 4.47 g/kg SID Ca) and that reported for broiler starters (David et al., 2021) for weight gain (3.32 g/kg SID Ca). Digestible Ca requirements between 4.5-5.4 g/kg have been proposed by Angel (2018) for 11 to 24 day old broilers, but experimental details for this recommendation were not provided.
Based on factorial arrangement of treatments, there was no interaction (P > 0.05) between SID Ca and SID P for the tibia ash. Tibia ash was increased (P < 0.05) by increasing concentrations of both SID Ca and SID P. As expected, the highest concentration of both SID P (5.5 g/kg) and SID Ca of 4.0 g/kg and above increased the concentration of tibia ash, which is in agreement with the previous finding (David et al., 2021). To predict the SID Ca at maximum response, a reduced model was used for tibia ash. The predicted maximum tibia ash at SID P concentrations of 3.5, 4.5 and 5.5 g/kg were 401, 413 and 428 g/kg, at SID Ca concentrations of 3.69, 4.30 and 4.91 g/kg, respectively. These values corresponded to SID Ca to SID P ratios of 1.05, 0.96 and 0.89, respectively. Based on the current findings, required SID P concentration for the optimum tibia ash at SID Ca concentrations below 4.0 g/kg was 3.5
Aust. Poult. Science Symp. 2022...33
40

g/kg. The concentration of SID Ca that maximised tibia ash at 3.5 g/kg SID P was 3.69 g/kg, which corresponded to SID Ca to SID P ratio of 1.05. This estimate is lower than the current Ross (2019) total Ca recommendation for growers (8.7 g/kg total Ca or 4.47 g/kg SID Ca) and that reported for broiler starters (David et al., 2021) for tibia ash (4.51 g/kg SID Ca), demonstrating a reduction of 18% in SID Ca requirement in growers compared to broiler starters.
Table 1 - Body weight gain (g/bird) and tibia ash concentration (g/kg dried defatted matter) in broiler
chickens fed diets containing different concentrations (g/kg) of standardised ileal digestible (SID) Ca and SID P from d 11 to 241
SID Ca SID P Body weight gain Tibia ash 1.80 3.5 1129bcd 385 4.5 1082de 385 5.5 1043e 387 2.35 3.5 1152abc 398 4.5 1129bcd 400 5.5 1099cd 403 2.90 3.5 1185a 400 4.5 1167ab 405 5.5 1147abc 417 3.45 3.5 1182ab 396 4.5 1177ab 403 5.5 1161ab 415 4.00 3.5 1156ab 402 4.5 1170ab 420 5.5 1189a 423 4.55 3.5 1085de 394 4.5 1191a 420 5.5 1200a 425 SEM2 19.9 5.2 Main Effects SID Ca
1.80 1085 386c 2.35 1127 400b 2.90 1166 408ab 3.45 1173 405b 4.00 1172 415a 4.55 1159 413a
SEM2 11.2 3.0 SID P
3.5 1148 396c 4.5 1153 406b 5.5 1140 412a
SEM2 8.1 2.1 Probability, P ≤ SID Ca 0.001 0.001 SID P 0.543 0.001 SID Ca × SID P 0.001 0.178
1Each value represents the mean of six replicates (eight birds per replicate for body weight gain and six birds per replicate for tibia ash). a-e Means having different superscripts within the column are significantly different (P < 0.05). 2Pooled standard error of mean.
Aust. Poult. Science Symp. 2022...33
41

1000
1100
1200
1.80 2.35 2.90 3.45 4.00 4.55
Bod
y w
eigh
t gai
n
SID Ca
a
a
b
Figure 1 – Interaction and response surface plots for (a) body weight gain (g/bird) and (b) tibia ash concentration (g/kg dried defatted matter) of broiler chickens fed different standardised ileal digestible (SID) calcium (Ca) and SID phosphorous (P) concentrations (3.5, 4.5 and 5.5 g/kg) from day 11 to 24 post-hatch
In conclusion, the requirements of SID Ca, SID P and their ratio for broiler growers were determined. Accordingly, required SID P for the weight gain and tibia ash of 11-24 day old broilers at SID Ca concentrations below 4.0 g/kg is 3.5 g/kg. At 3.5 g/kg SID P, weight gain and tibia ash are maximised at 3.05 and 3.69 g/kg SID Ca concentrations, respectively.
REFERENCES
Angel CR (2018) Proceedings of the Asia Pacific Poultry Conference 11: 43-51 AOAC (2016) Official Methods of Analysis, 20th ed. Association of Official Analytical
Chemists, Washington, DC. David LS, Abdollahi MR, Bedford MR & Ravindran V (2021) Poultry Science. DOI:
10.1016/j.psj.2021.101439. Ross (2019) Ross 308 Broiler: Nutrition Specification, Aviagen. Huntsville, AL.
Y = 1317.211 + 42.123 × Ca – 26.060 × Ca2 - 109.943 × P + 33.341 × Ca × P
(R2 = 0.44)
380
410
440
1.80 2.35 2.90 3.45 4.00 4.55
Tibi
a as
h
SID Ca
b
Y = 372.588 + 12.793 × Ca – 4.104 × Ca2 – 7.828 × P + 4.999 × Ca × P
(R2 = 0.48)
Aust. Poult. Science Symp. 2022...33
42

EFFECTS OF HYDROXYCHLORIDE ZINC AND ELEVATED LEVELS OF HYDROXYCHLORIDE COPPER IN BROILER CHICKENS’ DIET ON PRODUCTIVE
TRAITS AND GUT HEALTH
M. TOGHYANI1,2 , T. T. H. NGUYEN2, A. KUMAR2, R. BAREKATAIN3 and R. A. SWICK2
Trace minerals are often supplied in the forms of inorganic salts such as sulphates into poultry feed to meet the requirements. The ionic bonds in inorganic salts of minerals are very weak allowing the metal ion to disassociate once in contact with water, binding up diet antagonists such as other minerals, vitamins, and enzymes. To mitigate these negative effects technologies such as organic minerals or mineral complexes, which are less reactive, are used. In hydroxychloride minerals (Hyd) the metal ions are held together by a series of covalent bonds located between the metal ion, multiple hydroxyl groups and the chloride ions. This creates mineral complexes, which are more stable and can avoid unwanted interactions. Commercially, copper could be supplemented in broilers diet at far above nutritional levels (125 to 250 ppm), to improve gut health and growth performance as an alternative to antibiotic growth promoters. The current study aimed to investigate the effect of Hyd zinc (HyZn) and copper (HyCu) at different inclusion levels on productive traits and gut health biomarkers in broiler chickens. The five experimental diets were as follows: inorganic diet with 15 and 100 ppm Cu and Zn added in form of CuSO4 and ZnSO4 (INO), Hyd diet with 15 and 100 ppm Cu and Zn added in form of HyCu and HyZn (Hyd1), and Hyd diets with 80 ppm Zn as HyZn and either 100 (Hyd2) or 150 (Hyd3) ppm Cu as HyCu, and Hyd4 diet with 80 ppm Zn as HyZn with 200, 100 and 60 ppm Cu as HyCu in starter (1-10 d), grower (10-24 d) and finisher (24-35 d) diets, respectively. Each diet was replicated 11 times (18 male Ross 308 chicks per replicate). As summarized in Table 1, birds in all Hyd groups, regardless of HyCu levels, had a higher BW by 4 % on day 35 than INO group (P < 0.05). Hyd1 treatment improved FCR by 2.5 % compared to INO (1.455 vs 1.419; P < 0.01), adding 100 and 150 ppm HyCu, improved FCR by 3.8 and 3.2 %, respectively, compared to INO (P < 0.01). Feeding Hyd4 diet resulted in similar BW and FCR to Hyd2 diet (P > 0.05). Birds fed the INO diet had the lowest tibia breaking strength, breast meat yield and highest abdominal fat than all Hyd diets (P < 0.05). Bifidiobacteria counts determined through qPCR in ceca digesta tended (P = 0.06) to be higher in all Hyd groups than INO. Inclusion of higher HyCu in the diet significantly (P < 0.01) reduced cecal Entrobacteria count compared to Hyd1 and INO treatments. In conclusion, the results obtained in this study suggest that replacing ZnSO4 and CuSO4 with HyZn and HyCu in broiler chickens diet improves BW by around 80 g/bird and FCR by approx. 2.5 %. A higher dosage of HyCu up to 100 ppm results in a further 1.3 % improvement of FCR.
Table 1 - Effect of experimental diets on performance parameters (1-35 day) Treatment INO Hyd1 Hyd2 Hyd3 Hyd4 SEM P- value Body weight g/b 2557b 2641a 2692a 2651a 2669a 15.76 0.001 Feed intake g/b 3665 3691 3713 3680 3656 28.27 0.642 FCR g/g 1.455 a 1.419 b 1.399 cd 1.409 bc 1.390 d 0.005 0.001 BWc FCR1 1.455 a 1.402 b 1.372 cd 1.391 bc 1.367 d 0.005 0.001 Livability % 96.9 97.5 96.0 98.0 98.5 0.958 0.402
a–c values in a row with no common superscripts differ significantly (P ≤ 0.05) – Tukey Test Mean values are based on 18 birds per replicate and 11 replicates per treatment 1FCR values corrected to the mean body weight (35 d) of INO group – 1 point of FCR considered for every 50 g difference in BWG
ACKNOWLEDGEMENTS: This study was financially supported by Trouw Nutrition, A Nutreco Company
1 Poultry Research Foundation within the University of Sydney, Camden, NSW 2570, Australia [email protected] 2 School of Environmental and Rural Science, University of New England, Armidale, NSW 2351, Australia 3 South Australian Research and Development Institute, Roseworthy Campus, University of Adelaide, Roseworthy, 5371 SA, Australia
Aust. Poult. Science Symp. 2022...33
43

FIBRE IN POULTRY RATIONS AND ITS RELATIONSHIP WITH BROILER PERFORMANCE AND GUT HEALTH
M. CHOCT1
Fibre is a nutrient that has been largely ignored in feed formulation, not because it is unimportant, but because it is not well known what ‘fibre’ actually stands for. Firstly, the terms used to describe fibre in feed are confusing and the values they represent are inaccurate. For instance, ‘crude fibre’ is a 19th century relic that does not mean much in monogastric animal nutrition. Its continued use in feed formulation perhaps represents the single largest source of inaccuracy in so-called “least cost feed formulation” that relies on the additivity of all nutrients present in a given diet. This is because crude fibre values are highly variable, and miss up to a third of the fibre constituents in key ingredients such as soybean meal. Furthermore, two other terms that came into existence in the 1960s, acid detergent fibre (ADF) and neutral detergent fibre (NDF), refer to the arbitrary extracts of feed constituents that do not represent unique classes of chemically defined molecules, and these values are not used in feed formulation. They are also not accurate; for example, NDF ignores up to a quarter of the true fibre components - mainly soluble hemicellulose and pectic polysaccharides. A further confusion has arisen in recent years from the use of “fibre additives” that come under the term “structural fibre or components”. This particular class of “fibre” consists mainly of NSP and lignin and is used as additives in poultry feed to enhance gut development in birds that have little or no access to a sufficient amount of coarse material in their feed or environment. Examples of such additives are tree fibres, cereal hulls, straws, bagasse, and woody grass that have a reasonable level of coarseness and can stimulate the gizzard first and foremost.
Secondly, the feed industry currently does not have a reliable and applicable fibre database for feed ingredients commonly used in poultry feed formulation. The true fibre content of feed is well represented by the sum of non-starch polysaccharides (NSP) and lignin. However, it is important to highlight that even when some nutritionists have access to NSP values for commonly used feed ingredients, they have difficulty applying them to feed formulation. This is because: a) there is no clear correlation between the levels of crude fibre and NSP, hampering the ability of nutritionists to set a minimum or maximum value in feed formulation; b) the physical properties of fibre, to a significant degree, dictate its nutritional roles in poultry diets. It is not just solubility or viscosity, rather it is the way the NSP are associated with various components of cell walls, i.e., how they are embedded in cell wall architectures. Such information is not readily available; and c) NSP come in various chemical structures, meaning their digestibility naturally differs widely. The chemical structures also influence the nutritional properties of NSP, be it the digestion by the animal consuming them, or by feed additives such as exogenous enzymes targeting them.
Thirdly, nutritionists need to have the awareness that the use of crude fibre in feed formulation must be phased out because it is not accurate, nor is the representation of true fibre contents in feed ingredients. To achieve this goal, the development of NSP database may initially focus on the total, insoluble and soluble NSP and their relationship with the crude fibre levels used in commercial diets, followed by techniques that enable rapid determination of these fractions. Then, concerted efforts should be directed to producing a database that provides not just NSP values but also physiochemical and nutritional characteristics. For instance, the chemical structures of the entities making up each fraction will be essential for determining the susceptibility of each entity to the digestive process of the animal as well as to exogenous enzymes. This in-depth understanding of the physical and chemical characteristics of NSP will inform future nutritional strategies that target specific fractions and types of fibre in ingredients, to produce desired nutritional and health outcomes in pigs and poultry.
1 University of New England, Armidale, NSW 2351, Australia. [email protected]
Aust. Poult. Science Symp. 2022...33
44

EFFECTS OF STIMBITOC ON PERFORMANCE AND INTESTINAL BARRIER FUNCTION IN BROILERS CHALLENGED WITH A NECROTIC ENTERITIS
J.H. LEE1, B.K. LEE2, X. ROUSSEAU3, G.A. GOMES3, H.J. OH1, Y.J. KIM1,
S.Y. CHANG1, J.W. AN1, Y.B. GO1, D.C. SONG1, H.A. CHO1, J.C. KIM3, M.R. BEDFORD3 and J.H. CHO1
Summary
Two experiments were conducted to evaluate the efficacy of stimbiotic (STB) supplementation in necrotic enteritis (NE) challenged broilers. In Experiment 1, a total of 120 Arbor Acres (AA) broilers (45.0 ± 0.2g) were randomly assigned to 6 treatments in a 3×2 factorial arrangement. This experiment was conducted to establish the efficacy of an NE challenge model and determine the desirable level of vaccine overdose with or without a set dose of live Clostridium perfringens (CP) to optimise the outcome. Vaccine treatments included non-challenge (0), ×10 the recommended dose (×10) or ×20 the recommended dose (×20) by the manufacturer. Clostridium perfringens treatments were non-challenge (No) or 3 ml of 2.2 × 10⁷ CFU/mL CP challenge (Yes). In Experiment 2, a total of 72 AA broilers (40.17 ± 0.03g) were randomly assigned to 6 treatments in a 3×2 factorial arrangement. Dietary treatments included non-additive (CON), 500 mg/kg STB (STB, Signis, AB Vista) and 500 mg/kg STB combined with essential oil, probiotics, and enzyme (CB). Challenge treatments included non-NE challenge (NE-) and NE challenge (NE+) as established in Experiment 1. In Experiment 1, the oral administration of ×20 recommended doses of vaccines coupled with CP significantly decreased growth performance and increased (P < 0.01) the incidence of wet litter and intestinal lesions. In Experiment 2, the NE challenge decreased (P < 0.01) growth performance, villus height (VH) in the ileum, immunoglobulin contents in blood and beneficial caecal bacteria in the caecum. Additionally, the NE challenge increased (P < 0.05) crypt depth (CD) in the ileum, score of footpad dermatitis, intestinal lesion scores, tumour necrosis factor (TNF-α) and endotoxin in the serum and pathogenic bacterial count such as Escherichia coli and CP in the caecum compared with the non-NE challenged birds. The supplementation of STB and CB in diets enhanced (P < 0.05) growth performance and influenced intestinal microbiota and blood profiles by stimulating ileal morphology (VH and VH:CD), but no differences in the measured variables between STB and CB were observed. In conclusion, STB supplementation was able to reduce the inflammatory response and improve the performance of NE challenged birds, and the supplementation of STB alone was as effective as a typical commercial blend containing a number of other additives.
I. INTRODUCTION Necrotic enteritis (NE), caused by Clostridium perfringens (CP) and exacerbated when birds are co-infected with Eimeria spp., is one of the most severe and common diseases resulting from intestinal mucosal damage (Bae et al., 2021). The stimbiotic (STB) concept has been recently introduced as a non-digestible and fermentable additive that stimulates the development of a microbiome comprising bacterial species that are principally involved in fibre degradation (Cho et al., 2020). It was reported that a low concentration of STB resulted in a
1 Department of Animal Science, Chungbuk National University, Cheongju 28644, South Korea. [email protected] 2 Cherrybro Co.,Ltd. Jincheon-gun 27820, South Korea. 3 AB Vista, Marlborough, Wiltshire, United Kingdom.
Aust. Poult. Science Symp. 2022...33
45

better fermentation activity in colonic samples compared with 10-20 times higher doses of commercially available prebiotics. To successfully test the proposed mode of action, it is critical to develop an experimental infection model that will mimic a commercial outbreak of NE. Therefore, for successful NE induction in Experiment 1, a pre-screening study was performed to determine the optimal dosage of vaccine (coccidia and infectious bursal disease) and CP for inducing damage of the intestinal mucosa and instigating an NE infection model. Then in Experiment 2, the effects of STB on performance and intestinal barrier function in broilers challenged with the NE infection model were evaluated.
II. METHODS The experimental protocol for this study was reviewed and approved by the Institutional Animal Care and Use Committee of Chungbuk National University, Cheongju, Korea (CBNUA-1477-20-02).
1. Experiment 1 1.1. Oral administration of Vaccine and C. perfringens
Coccidia vaccine (Hipra Evalon®, Laboratorios Hipra, Girona, Spain) and infectious bursal disease (IBD) vaccine (IBD Blen®, Boehringer Ingelheim Animal Health USA Inc., Georgia, USA) were used in this experiment. These vaccines were diluted in sterile water and, when broiler chickens reached 14 days of age, 10 times or 20 times the recommended dose was administered orally through a sterile pipette. Clostridium perfringens (CP) type A NCTC 8798 (NCTC, National Collection of Type Cultures, London, UK) was used in this experiment. Four days after vaccination, a total of 3 ml of CP at 2.2 × 10⁷ colony forming units (CFU)/mL was orally administered twice daily for 3 consecutive days (09:00 and 17:00; on days 18, 19, and 20).
1.2. Experimental animals and treatment A total of 120 Arbor Acres (AA) broilers (45.0 ± 0.2g) were randomly assigned to 6 treatments in a 3×2 factorial arrangement (5 replicate pen with 4 broiler per pen). The duration of experiment was from d14 and d28. Coccidial and IBD vaccine treatments included non-challenge (0), 10 times the recommended dose (×10) or 20 times the recommended dose (×20) by the manufacturer. Clostridium perfringens (CP) treatments were non-challenge (NE-) or 3 ml of 2.2 × 10⁷ CFU/mL CP challenge (NE+).
2. Experiment 2 2.1. Induction of necrotic enteritis (NE) disease
NE was induced according to the optimal conditions determined in Experiment 1. Briefly, birds in the challenged groups were orally gavaged 20 times the recommended dose of coccidia vaccine and IBD vaccine on 14 days of age followed by oral gavage with a 3 ml of CP type A NCTC 8798 at 2.2 × 10⁷ CFU/mL twice daily for three consecutive days (09:00 and 17:00; on day 18, 19, and 20). 2.2. Experimental animals and treatment A total of 72 AA broilers (40.17 ± 0.03g) were randomly assigned to 6 treatments in a 3×2 factorial arrangement (4 replicate pens with 3 broiler per pen). The duration of experiment was from d1 and d 30. Birds were individually tagged and placed in floor pens from d1 to d21 and then moved in cages at d22 (3 birds/cage). Dietary treatments included non-additive (CON), 100 mg/kg STB (STB) and 100 mg/kg STB with other commercial feed additives such as essential oil, probiotics, and yeast cell wall (CB). Challenge treatments included non-NE challenge (NE-) or NE challenge (NE+).
Statistical analysis Parametric data (growth performance, ileal morphology, blood profile, caecal microbiome and SCFA) were analysed by ANOVA using the fit model using JMP Pro 15.1 (SAS Institute Inc.,
Aust. Poult. Science Symp. 2022...33
46

Cary, NC, USA). The statistical model included the effect of the additives (CON, STB, CB), the effect of the challenge (NE- vs NE+) and the interaction between additives and challenge, and initial body weight was also included as a covariate. Treatment means were separated using Student’s t-test with significance accepted at p≤0.05. Nonparametric data (footpad dermatitis scoring, intestine lesion scores) were analyzed using contingency analysis to test the relationship between categorical variables and a Chi-square test to check if the variables are dependent or not with significance accepted at p≤0.05.
III. RESULTS
1. Experiment 1
1.1. Growth performance There was no interaction between vaccine overdose and CP challenge. CP challenge decreased (P < 0.01) body weight, body weight gain and feed intake on d24 compared with the non-CP challenged group. Moreover, the injected vaccines groups had (P < 0.05) lower BW, BWG and FI than non-injected group in d24, but the performance between ×10 and ×20 vaccines overdose was not significant. However, no mortalities occurred following NE challenge. 1.2. Incidence of diarrhoea and intestinal lesion The incidence of diarrhoea (score 4) was significantly higher in the broilers challenged with ×10 and ×20 vaccine with CP. The percentage of score 3 and 4 lesions, equivalent to acute lesions, increased in the broilers challenged with ×20 vaccine with CP compared to the broilers challenged with ×10 vaccine with CP.
2. Experiment 2 2.1. Growth performance
There was no interaction between diet and NE challenge. NE challenge decreased BW , BWG and FI (P<0.05), and increased FCR (P<0.001) compared with the non-NE challenged groups until the end of the experiment. Compared with the CON group, the supplementation of STB and CB improved (P<0.05) BWG, FCR and bodyweight-corrected FCR at d1-30, but there were no differences among STB and CB. However, the mortality by NE challenge was not observed.
2.2. Incidence of footpad and intestinal lesion The percentage of score 3 and score 2 (equivalent to acute and moderate lesions in jejunum and ileum, respectively) increased when broilers were challenged with NE compared to the broilers without NE challenge. The supplementation of STB and CB reduced the percentage of the birds with the highest score.
2.3. Ileal morphology There was no interaction between NE challenge and diets. The NE challenge decreased VH (P<0.01) and increased CD (P<0.01), hence reduced the VH:CD ratio (P<0.01). The supplementation of STB and CB maintained higher VH () and VH:CD ratio (P < 0.01) than CON group, but there was no significant difference between STB and CB.
2.4. Blood profile There was a significant interaction between NE-challenge and additives supplementation for endotoxin and TNF-α content (Figure 1; P<0.01). The NE-challenge significantly increased serum endotoxin (P<0.01) and TNF- contents (P<0.01) but in higher proportion for the control treatment. STB and CB decreased the serum TNF- and endotoxin content only in the challenged birds.
2.5. Caecal bacteria culture The NE challenge significantly reduced Lactobacillus counts (P < 0.01) in the caecal content and increased C. perfringens (Figure 2; P < 0.01). Supplementation of STB and CB increased Lactobacillus count (P<0.01), while they significantly decreased E. coli (P < 0.01). An
Aust. Poult. Science Symp. 2022...33
47

interaction between additives and challenge conditions was observed only for C. perfringens counts (P < 0.01), wherein the challenged conditions with no additives CP counts were significantly higher than for birds fed with STB or CB. The effect of STB and CB was also higher in challenged than in non-challenged conditions.
Figure 1. Effects of NE challenge and dietary treatments on TNF-α in serum and C.perfringens count in caecal content in broilers challenged with a necrotic enteritis infection model
IV. DISCUSSION
The results were in agreement with the works of Craig et al. (2020) where the addition of XOS increased BWG in broilers. These improvements were partly explained by the enhanced gut health and functionality. In this study, NE challenge decreased growth of broilers, gut health and SCFA production, while increasing the lesion score and penetration of endotoxin into the blood. However, STB alleviated these negative effects induced by the NE challenge. XOS supplementation significantly improved the relative abundances of beneficial bacteria in addition to increased luminal concentrations of SCFAs, which are considered advantageous for intestinal health (Azad et al., 2018). The analysis by traditional microbiology methods of selected pathogenic bacteria such as E.coli and C. perfringens counts demonstrated their decrease, while the count of Lactobacillus, a well-known beneficial bacterial genus was increased by supplementing the diets with STB. NE challenge also increased endotoxin levels in the blood, while the addition of STB decreased endotoxin penetration. Liu et al (2012) reported that NE can promote the proliferation of several gram-negative bacteria in the ileum such as E. coli, resulting in the translocation of endotoxin to the blood and increasing the level of endotoxin in the blood. The reduction of endotoxin in this study can partly be attributed to the increase in beneficial intestinal microorganism populations that may have improved their capacity to ferment fibre and provide better gut integrity. Another interesting finding in this study was that other additives supplemented on top of the STB diet did not significantly improve the measured variables under these study conditions which were considered reasonably harsh, probably due to overlap of the mode of actions between the additives used.
REFERENCES
Azad M, Kalam A, Sarker M, Li T, & Yin J (2018) BioMed research international. Bae D, Lee JW, Chae JP, Kim JW, Eun JS, Lee KW, & Seo KH (2021) Poultry Science, 100:
302-313. Cho HM, González-Ortiz G, Melo-Durán D, Heo JM, Cordero G, Bedford MR & Kim JC
(2020) PlOS One 15: e0240264. Craig AD, Khattak F, Hastie P, Bedford MR & Olukosi OA (2020) PlOS One 15: e0229281. Liu D, Guo S & Guo Y (2012) Avian Pathology 41: 291-298.
Aust. Poult. Science Symp. 2022...33
48

EFFECTS OF USING A MULTI-STRAIN BACILLUS PROBIOTIC IN COMBINATION WITH A PHYTASE AND A CARBOHYDRASE ON PERFORMANCE OF BROILER
CHICKENS EXPOSED TO ENTERIC CHALLENGE
A.E. GHANE1, S. HALDAR2, A.K. DHARA2, E. WHITE3 and C. EVANS
Summary
The present experiment was conducted with the primary objective of assessing the efficacy of a three-strain Bacillus probiotic for combatting dysbacteriosis mediated necrotic enteritis and growth promotion in broiler chickens with a concomitant improvement in feed conversion ratio (FCR). A secondary objective of the study was to validate a mixed nutrient matrix application (0.199% Ca, 0.194% available P, 110 kcal energy and 0.704% CP) for a phytase, xylanase, amylase and protease combination in a corn-wheat based diet by comparing the performance of experimental chickens with the breed standard. Combination of the phytase (Buttiauxella), the NSP enzymes (xylanase, amylase and protease mix) and the multi-strain probiotic successfully met the nutrient requirements of the birds fed a diet diluted in terms of nutrients according to the combined matrix of the enzyme mix (phytase and NSP enzymes). In the absence of any severe enteric challenge, the enzyme-probiotic combination was found to be effective in augmenting growth of the experimental chickens. In the presence of an Eimeria spp challenge, the same combination was found to be effective in reversing the dysbacteriosis induced growth depression. Overall, the study validates the matrix values (downspec i.e. reduction of 0.199% Ca, 0.194% available P, 110 kcal energy and 0.704% CP), which can be used as a practical tool to reduce feed cost while maintaining performance and confirms the efficacy of the combination of probiotics and enzymes. The combination of enzymes and probiotic showed beneficial effects as the birds exhibited recovery in FCR, improvements in average daily gain, and final body weight compared to challenged and even with unchallenged treatments. The enzymes and probiotic combinations restored the body weight and FCR in the group fed with the diet which was made deficient in terms of Ca, available P, energy and protein. Even in presence of dysbacteriosis challenge, body weight was similar to that obtained with the unchallenged control group. The combination of enzymes and probiotic showed positive responses in terms of performance recovery in groups with deficient diets (downspec) and even challenged groups.
I. INTRODUCTION Phytase enzymes are commonly used in the pig and poultry feed industry mainly to increase the availability of phosphorus (P) from plant ingredients. Additionally, phytase improves the availability of other nutrients such as Ca, digestible amino acids (AA), and energy (Dersjant-4Li et al. 2015a) by facilitating breakdown of phytate P and thus negating its anti-nutritional effects on nutrient digestibility. Combination of Phytase with NSP enzymes has proven to be an effective practical strategy to improve productivity, reducing feed cost, and improving efficiency (Amerah et al., 2017).
In practice, with proper application of phytase and NSP enzymes (dose levels and type of enzymes) and diet management, more sustainable poultry production can be achieved
1 Danisco Animal Nutrition, Singapore, [email protected] 2 Agrivet Research and Advisory P Ltd, Kolkata, India, [email protected] ; [email protected] 3 DuPont Animal Nutrition, Marlborough, UK., [email protected] ; [email protected]
Aust. Poult. Science Symp. 2022...33
49

without using the finite inorganic P source, to improve Return on Investment (ROI) and increase sustainability. It is critical to understand the matrices and associated contribution values of combined enzymes for proper application of various levels of matrix values for minerals, energy and amino acid fractions. Many studies have demonstrated that using a reliable full matrix value including digestible AA and energy can maximize the cost benefit with increased ROI. However, a realistic matrix value should be linked to actual feed formulation and dietary characteristics.
The other important subject is reduction and/or elimination of Antibiotic Growth Promoters (AGP) and implementing preventative measures to control, eradicate, and improve recovery of birds under challenge conditions. Probiotics are gaining more attention in the animal industries due to market trends to reduce antibiotics use, whilst still preventing disease outbreaks and maintaining, or even improving, animal performance. Bacillus based probiotics have been shown to influence gastro-intestinal tract (GIT) microbial populations and reduce Avian Pathogenic E. coli counts in the GIT of broilers. Bacillus based probiotics have a number of different modes of action which include outcompeting non-beneficial bacteria, encouraging growth of beneficial bacteria and aiding development of the immune system (Ouwehand et al., 2010, Bento et al., 2013, Wealleans et al., 2017). Dersjant-Li et al. (2016) reported positive improvements in terms of inflammatory responses, enhancements of gut structure and bird performance in a challenge model study in broilers using an enzyme blend in combination with direct fed microbial containing three strains of Bacillus . Multi-strain probiotics show positive impact on broiler performance in terms of feed conversion and improved body weight (Flores et al, 2016) and the combination with an appropriate enzyme mix (Syncra Concept) has proven to be a practical and efficacious strategy to improve overall performance of broilers (Dersjant-Li et al., 2015b). In this study, it was decided to investigate the effects of combinations of enzymes and probiotic.
II. METHODS
A total of 480 one-day-old male Vencobb broiler chicks were allocated to 4 treatments with 10 replicate pens per treatment (12 birds/pen). All diets were mixed grain based (corn – wheat) and were fed ad libitum as crumble during the starter and grower phases (1-28 days) and as pellets during the finisher phase (29-42 days). All diets included a Buttiauxella phytase (Axtra PHY®) at 1000 FTU/kg and a xylanase, amylase and protease combination (Axtra XAP®) dosed to provide 2000 U/kg xylanase, 200U/kg α-amylase and 4000 U/kg protease. Control diets were reduced by 0.199% Ca, 0.194% available P, 110 kcal energy and 0.704% CP according to the full matrix recommendations for the enzymes. The control diet was fed either unsupplemented, or supplemented with 150, 000 CFU/g feed of a 3 strain Bacillus DFM (Enviva PRO®) and were fed to unchallenged and challenged birds, giving four treatments. The unchallenged control diet contained Salinomycin. On day 4, challenged birds were administered with 10 times the recommended dose of a coccidiosis vaccine (Livacox Q). Bodyweight and feed intake were measured on days 1, 21 and 35 for the calculation of performance parameters. Statistical differences between treatments were determined using ANOVA and Tukey means separation (JMP, SAS software).
III. RESULTS
Results of the study are presented in Table 1. The performance of the unchallenged control birds was in line with breed performance recommendations. Compared to the challenged control, average daily gain in body weight and the final body weight were improved (P < 0.05) by 3.7% when the three-strain-Bacillus probiotic was supplemented to the
Aust. Poult. Science Symp. 2022...33
50

diet. Liveability was improved (P < 0.05) by 0.6% with the addition of the 3 strain bacillus compared to the challenged control and was maintained comparable to the unchallenged control.
Table 1 - Performance of challenged and unchallenged birds fed a diet supplemented with a 3 strain bacillus 1-42 days of age
Parameter Unchallenged control (UC)
UC + Bacillus probiotic
Challenged control (CC)
CC + Bacillus probiotic
SEM P-value
Initial bodyweight (g/bird)
45.5 45.5 45.4 45.5 0.10 0.99
Final bodyweight (g/bird) 2962a 2981a 2862b 2968a
6.19 0.0001
Average daily gain (g/bird/day) 69.4a 69.9a 67.1b 69.6a
0.15 0.001
Average daily feed intake (g/bird/day) 110ab 110b 110ab 113a
0.21 0.017
FCR 1.59b 1.57b 1.64a 1.62a 3.83 0.0001 Liveability% 98.6a 98.9a 97.8b 98.4a 0.74 0.022
ab Values without a common superscript are significantly different (P<0.05)
IV. DISCUSSION
The matrix downspec proved to be at proper levels resulting in numerical improvements in terms of final body weight and improved FCR in the unchallenged birds versus the breed specifications. This finding offers significant practical applications in terms of feed cost reduction, performance, efficiency improvements and sustainability. The combination of enzymes and probiotic proved to be beneficial as the birds showed recovery in FCR, significant improvements in average daily gain, and final body weight compared to challenged treatments. The enteric challenge imposed in the study was robust enough to reduce the final BW and the 3 strain Bacillus alleviated the negative effects of enteric challenge to restore the BW to the level obtained with the unchallenged control group. The tendency to a difference between the unchallenged control and UC + Bacillus group can be explained by the fact that gut acting growth promoters could elicit their full potential only in presence of some enteric challenge. Nevertheless, there was almost a 20 g difference observed between the Unchallenged Control and UC Bacillus groups which, from a commercial point of view would tend to offset fixed costs and result in additional meat produced per cycle or flock. The Bacillus spp. used in the study have been shown to positively influence the microbiome of broilers (Ouwehand et al., 2010, Bento et al., 2013, Wealleans et al., 2017) by supporting beneficial microbial populations (e.g. lactic acid bacteria) and reducing potentially non-beneficial populations (e.g. E. coli and C. perfringens). There is some evidence the Bacillus strains can support the development of the avian immune system, making them better equipped to deal with intestinal challenges. Such modes of action could explain the positive performance effects noted in the current study, although these measurements were not taken directly. This is not the first time these additives have been documented to have a beneficial effect in challenge studies. Dersjant-Li et al. (2016) reported reductions in inflammatory responses, improvements in gut structure and a maintenance of bird performance to that of the UC in a coccidiosis/necrotic enteritis study.
Aust. Poult. Science Symp. 2022...33
51
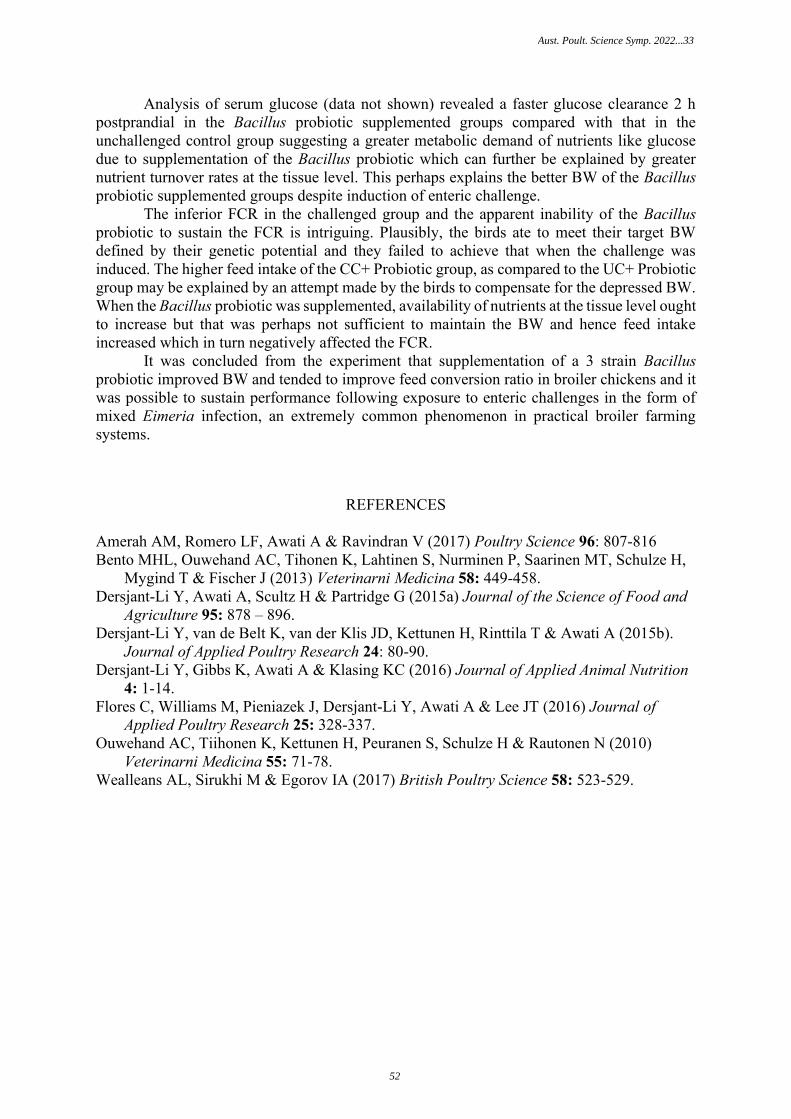
Analysis of serum glucose (data not shown) revealed a faster glucose clearance 2 h postprandial in the Bacillus probiotic supplemented groups compared with that in the unchallenged control group suggesting a greater metabolic demand of nutrients like glucose due to supplementation of the Bacillus probiotic which can further be explained by greater nutrient turnover rates at the tissue level. This perhaps explains the better BW of the Bacillus probiotic supplemented groups despite induction of enteric challenge. The inferior FCR in the challenged group and the apparent inability of the Bacillus probiotic to sustain the FCR is intriguing. Plausibly, the birds ate to meet their target BW defined by their genetic potential and they failed to achieve that when the challenge was induced. The higher feed intake of the CC+ Probiotic group, as compared to the UC+ Probiotic group may be explained by an attempt made by the birds to compensate for the depressed BW. When the Bacillus probiotic was supplemented, availability of nutrients at the tissue level ought to increase but that was perhaps not sufficient to maintain the BW and hence feed intake increased which in turn negatively affected the FCR.
It was concluded from the experiment that supplementation of a 3 strain Bacillus probiotic improved BW and tended to improve feed conversion ratio in broiler chickens and it was possible to sustain performance following exposure to enteric challenges in the form of mixed Eimeria infection, an extremely common phenomenon in practical broiler farming systems.
REFERENCES
Amerah AM, Romero LF, Awati A & Ravindran V (2017) Poultry Science 96: 807-816 Bento MHL, Ouwehand AC, Tihonen K, Lahtinen S, Nurminen P, Saarinen MT, Schulze H,
Mygind T & Fischer J (2013) Veterinarni Medicina 58: 449-458. Dersjant-Li Y, Awati A, Scultz H & Partridge G (2015a) Journal of the Science of Food and
Agriculture 95: 878 – 896. Dersjant-Li Y, van de Belt K, van der Klis JD, Kettunen H, Rinttila T & Awati A (2015b).
Journal of Applied Poultry Research 24: 80-90. Dersjant-Li Y, Gibbs K, Awati A & Klasing KC (2016) Journal of Applied Animal Nutrition
4: 1-14. Flores C, Williams M, Pieniazek J, Dersjant-Li Y, Awati A & Lee JT (2016) Journal of
Applied Poultry Research 25: 328-337. Ouwehand AC, Tiihonen K, Kettunen H, Peuranen S, Schulze H & Rautonen N (2010)
Veterinarni Medicina 55: 71-78. Wealleans AL, Sirukhi M & Egorov IA (2017) British Poultry Science 58: 523-529.
Aust. Poult. Science Symp. 2022...33
52

LONG-TERM CONSUMPTION OF SOLUBLE DIETARY FIBRE INCREASES ACTIVATION OF THE IMMUNE SYSTEM IN BROILERS CHICKENS
C. CASTRO1, S. NIKNAFS1, G. GONZALEZ-ORTIZ2, M. R. BEDFORD2, J. KIM2
and E. ROURA1
Long-term feeding of dietary fibre (DF) has been reported to cause erosion of the epithelial cell layer resulting in mucosal damage with a decrease in villus height in the small intestine (Iji et al., 2001). This project studied the long-term effects of low and high levels of soluble DF on gut physiology by comparing transcriptome in the jejunum between groups. We hypothesized that soluble DF would cause an increase in immune system activity and result in an increased inflammatory response in the gastrointestinal tract (GIT).
A corn/soy-based mash diet was used with or without DF supplementation consisting of 0.5% xylo-oligosaccharide (XOS) and 1% arabinoxylan-rich fraction (AXRF) of wheat. Each treatment was randomly distributed across eight pens (n=8) with eight chickens each. At the end of the 42-day experiment, there were no significant differences for growth between the two treatment groups. At day 42, one chicken per pen was selected based on average weight and jejunum samples were collected for transcriptomics analysis. Standard RNA-seq protocols were used to identify differentially expressed genes (DEGs) and the Database for Annotation, Visualization and Integrated Discovery to identify enriched pathways. Results showed more than 450 DEGs (P < 0.05). The DEGs of interest associated with the immune response are shown in Table 1. CD40LG, a factor inducing differentiation of IgM+ naïve B cells into IgA+ B cells was upregulated (P < 0.05) in chickens fed with high levels of DF. IL8L1, a mediator of the inflammatory response, was also upregulated (P < 0.05). DEGs showed enriched pathways associated with the intestinal immune network for IgA production and the inflammatory response (Table 1).
Table 1 – Significantly (P<0.01) enriched pathways and up (↑) or down (↓) regulated differentially expressed genes in chickens fed a low (control diet) versus high (control diet + 0.5% xylo-oligosaccharide
and 1% arabinoxylan-rich fraction of wheat) fibre diet. Database Pathway P value Genes KEGG Intestinal immune network
for IgA production 0.0043 ↑ CD40LG, TNFRSF13C, ICOS, CD28, ITGA4
↓ BLB1 Gene Ontology (Biological Pathway)
Inflammatory response 0.0004 ↑ CD40LG, IL8L1, ZAP70, TLR15, CCL26, CXCL13L3, TNFRSF8; ↓ TLR1B, BDKRB1, ITGB6, ANXA1, LOC378902, TNFRSF1A
CD40LG, CD40 ligand; TNFRSF13C, TNF receptor superfamily member 13C; ICOS, inducible T cell costimulatory; CD28, CD28 molecule; ITGA4, integrin subunit alpha 4; BLB1, Major histocompatibility complex class II beta chain BLB1; IL8L1, interleukin 8-like 1; ZAP70, zeta chain of T cell receptor associated protein kinase 70; TLR15, toll-like receptor 15; CCL26, C-C motif chemokine ligand 26; CXCL13L3, C-X-C motif chemokine ligand 13-like 3; TNFRSF8, TNF receptor superfamily member 8; TLR1B, toll-like receptor 1 family member B; BDKRB1, bradykinin receptor B1; ITGB6, integrin subunit beta 6; ANXA1, annexin A1; LOC378902, death domain-containing tumor necrosis factor receptor superfamily member 23; TNFRSF1A, TNF receptor superfamily member 1A.
In conclusion, long-term dietary supplementation with XOS and AXRF increased immune system activity, involving specific (IgA production) and non-specific (inflammatory response) defence mechanisms in the GIT of broiler chickens.
ACKNOWLEDGEMENTS: This study has been funded by AB Vista.
Iji PA, Saki AA & Tivey DR (2001) Anim. Feed Sci. Technol. 89: 175-188.
1 Centre for Nutrition and Food Sciences, Queensland Alliance for Agriculture and Food Innovation (QAAFI), The University of Queensland. [email protected], [email protected], [email protected] 2 AB Vista. [email protected], [email protected], [email protected]
Aust. Poult. Science Symp. 2022...33
53

INFLUENCE OF PRECISION GLYCANS ON LAYER CECAL COMMUNITY
F. PETRANYI 1, Y. BAJAGAI 2, S. RAMIREZ3 and D. STANLEY4,
Summary
Glycans are ubiquitous complex polysaccharides present in all biological systems. Industry and the scientific community are becoming increasingly more aware of the importance of intestinal health in animal productivity and welfare. Novel strategies are emerging in developing intestinal health, targeting products that aim to control microbiome functions and alter the beneficial/pathogenic genera ratio in the gut. Precision glycans can be developed to improve intestinal health and functionality, and recent reports showed encouraging results. Here we present the effects of precision glycan-based intervention on the caecal intestinal microbiota in layers.
I. INTRODUCTION
Glycans are polysaccharides, essential biomolecules with well-established benefits for the host and abundantly used as prebiotics to support balanced microbiome function. Host produced glycans, such as mucins, are crucial for the defensive purpose of the intestinal epithelial barrier against pathogens (Coker et al., 2021). Glycans are often projecting on the cell surface and are frequently secreted molecules, thus presenting a perfect pathogen trap or barrier.
In addition to host produced glycans, many studies have investigated enormous benefits to intestinal health via supplementation of dietary glycans (Tannock, 2021). Dietary supplementations with specific glycans can modulate microbiota, improving enteric health and preventing dysbiosis by rebuilding diverse microbial communities (Tannock, 2021). This is presenting us with the opportunity to develop precision glycans, optimised to maximise and harness the best intestinal benefits and bring about the new generation of prebiotics (Tannock, 2021) to match or outperform next-generation probiotics.
Precision glycan inspired Precision Biotic (PB) is developed on a functional metagenomics platform to control pathogenic functions in the poultry gut and improve intestinal health. A natural coccidiosis challenge study reported that PB resulted in similar or better performance to the Avilamycin and consistently exhibited significantly enhanced performance compared to the phytogenic, essential oils-based treatments (Ramirez et al., 2021). In another study, two precision glycan metabolic modulators of different glycan sizes were investigated across 19 geographically distinct high powered trials conducted using 33,880 broiler chickens. One of the products displayed a reduction of cFCR of 0.06 g feed/ g BW gain compared to control, while the other precision glycan product reduced cFCR. While both products improved FCR, one of them increased and the other one reduced feed intake (Walsh et al., 2021). In this study, we investigated the effects of PB, previously shown beneficial in broiler enteric challenge (Ramirez et al., 2021), in a commercial layer trial comprised of 40,000 layers housed in experimental sheds, specifically designed for this type of experiment.
1 Central Queensland University, IFFS, Australia; [email protected] 2 Central Queensland University, IFFS, Australia; [email protected] 3 DSM Nutritional Products, Singapore; [email protected] 4 Central Queensland University, IFFS, Australia; [email protected]
Aust. Poult. Science Symp. 2022...33
54

II. METHOD
The experiment was performed in a large commercial layer farm in a shed designed to take two groups of 20,000 birds each, with the two treatments on opposite sides of the shed, separated by a utility room in the middle and with a wire fence separating the birds in the range with an outdoor buffer zone between the two treatments. The 40,000 of 18 weeks old pullets from the same batch of Hyline chicks were randomly assigned to either control or PB supplemented group. The birds are given the same batch of feed with the supplement automatically premixed to the treatment side of the shed at the dose of 400ppm. The birds were provided with a standard company layer ration optimised for maximum health and performance under the current farm environmental conditions and layer breed. Ten weeks after the shed placement and treatment supplementation, when the birds were 28 weeks of age, caecal content was collected for microbiota analysis via 16S amplicon sequencing.
Microbiota analysis was done via amplification of the V3-V4 region of 16S rRNA. Sequencing was completed on the Illumina MiSeq platform using 2x300 bp paired-end sequencing. The data were analysed using Quantitative Insights Into Microbial Ecology 2 (QIIME 2). After demultiplexing with Cutadapt, Phred quality scores were set to a minimum of 30 using only top quality sequences. Dada2 was used to error correct and chimera clean the data and taxonomy was assigned using SILVA database. Data analysis and interpretation were done using Hellinger transformed ASV table at an ASV and genus level. DeSeq2 was used for univariate significance comparisons at the genus level.
III. RESULTS
In total, 39 of 40 samples were successfully sequenced with the smallest sample size of 4,228 and the largest sample containing 12,056 sequences with no significant differences between the groups in a number of sequences per sample. The caecal microbial community was significantly different between control and PB supplement using Adonis multivariate analysis and Bray-Curtis distance at an ASV (P=0.0003) and a genus level (P=0.002). Supplementation marginally increased cecal diversity. Table 1 shows the genera affected. Genera increased in the supplemented group included Saccharimonadales, Mucispirillum, Odoribacter, Parasutterella and Mailhella, while reduced include Anaerofilum, Enterorhabdus, Blautia, Subdoligranulum, Ruminococcus, Romboutsia and Megamonas.
Table 1 – Significantly altered cecal genera
Genus P-value(DESeq2)
FDR CTR mean PB mean Higher in
Saccharimonadales 0.0000033 0.00032 0 0.047 PB Anaerofilum 0.0000066 0.00032 0.14 0 CTR Enterorhabdus 0.000031 0.00096 0.052 0 CTR Mucispirillum 0.00004 0.00096 0.048 0.092 PB Blautia 0.000061 0.0012 0.58 0.3 CTR Subdoligranulum 0.00012 0.0019 3.84 1.14 CTR Odoribacter 0.001 0.014 0.13 0.24 PB Ruminococcus 0.0063 0.076 0.42 0.15 CTR Parasutterella 0.016 0.17 0.42 0.75 PB Mailhella 0.029 0.28 0.011 0.11 PB Romboutsia 0.036 0.31 1 0.43 CTR Megamonas 0.043 0.35 1.01 0.46 CTR
Aust. Poult. Science Symp. 2022...33
55

Linear discriminant analysis Effect Size (LEfSe), an algorithm for high-dimensional biomarker discovery, was used to determine main features related to the treatments (Figure 1) and it additionally identified clostridia and Corynebacterium as the biomarker for the control group and Eubacterium hallii group associated with PB.
Figure 1 - LEfSe analysis identified Clostridium sensu stricto and Corynebacterium as significantly associated with control, and Eubacterium hallii group associated with PB.
IV. DISCUSSION
The inclusion of PB introduced distinct changes to the microbial community of layer caeca. One of the strongly inhibited microbial communities (no sequences detected in control birds) were members of the genus Saccharimonadales. As with other newly identified or reclassified genera, there is not much literature available to draw meaningful conclusions on its role in layer intestinal health. Recently, Padovan et al. (2021) thoroughly investigated the threat posed by pathogenic vibrio species in tropical Australia. They identified 42 Vibrio species and reported a significant negative correlation with Saccharimonadales. Mucispirillum (Robertson et al., 2005), another genus increased in the PB group, is better characterised, reported in insects, mice, poultry, dogs, pigs, goats and humans. The name is connected to the flagella and the ability to move through the mucus (Robertson et al., 2005). It is possible that novel glycans interacted with mucin to make the environment more favourable for Mucispirillum. Interestingly, Mucispirillum was also reported as a Salmonella antagonist protecting the mice against colitis (Herp et al., 2019).
Odoribacter are named by the foul smell they produce in the mouth. The effects are high strain-specific and members of this genus have been reported as significant members of oral and faecal microbiota, able to confer protective immunity against cancer (Foegeding and Byndloss, 2021) or, in contrast, as increasing the risk of multiple sclerosis relapse in children or being increased in lupus (Vieira et al., 2021) and obesity (Zeng et al., 2021). Based on our abundant data collected from poultry farms, this genus is a part of normal poultry microbiota, and its particular roles should be further investigated for both benefits and an opportunistic pathogen ability.
Another genus increased in the PB group, Parasutterella, should not be confused with Pasteurella genus responsible for fowl cholera. Parasutterella is a more novel and uncharacterised genus that represents one of the main prominent gut members (Ju et al., 2019).
Aust. Poult. Science Symp. 2022...33
56

It has been reported as improving lipoprotein levels in human participants consuming resistant potato starch (Bush and Alfa, 2020) and as potentially promoting intestinal inflammation (Chen et al., 2018). Mailhella, a sulphate reducing genus, is also one of the more recently noticed genera detected in layers of the caecum (Huang et al., 2019). In addition to more neutral genera affected by PB, the benefits of reduction of true clostridia are well characterised.
A range of layer commensal bacterial genera was reduced in the PB group, including Blautia, Subdoligranulum and Ruminococcus, mostly considered as beneficial. Ruminococcus is one of the major mucin utilising genera (Crost et al., 2016) and is considered beneficial; however, as we stated above, the benefits and pathogenicity are often strain level specific. Ruminococcus was also reported as associated with prediabetes (Allin et al., 2018) and inflammatory bowel disease (Png et al., 2010) and there is growing evidence of the role of primary and secondary mucin degraders in intestinal inflammatory diseases (Png et al., 2010). More research is needed to further investigate possible PB and mucin intestinal interactions.
REFERENCES
Allin KH, Tremaroli V, Caesar R, Jensen BAH, Damgaard MTF, Bahl MI, Licht TR, Hansen TH, Nielsen T, Dantoft TM, Linneberg A, Jorgensen T, Vestergaard H, Kristiansen K, Franks PW, consortium I-D, Hansen T, Backhed F & Pedersen O (2018) Diabetologia 61: 810-820.
Bush JR & Alfa MJ (2020) BMC Nutrition 6: 72. Chen YJ, Wu H, Wu SD, Lu N, Wang YT, Liu HN, Dong L, Liu TT & Shen XZ (2018) Journal
of Gastroenterology Hepatology 33: 1844-1852. Coker JK, Moyne O, Rodionov DA & Zengler K (2021) Gut Microbes 13: 1-18. Crost EH, Tailford LE, Monestier M, Swarbreck D, Henrissat B, Crossman LC & Juge N
(2016) Gut Microbes 7: 302-312. Foegeding NJ & Byndloss MX (2021) Cell Host Microbe 29: 851-853. Herp S, Brugiroux S, Garzetti D, Ring D, Jochum LM, Beutler M, Eberl C, Hussain S, Walter
S, Gerlach RG, Ruscheweyh HJ, Huson D, Sellin ME, Slack E, Hanson B, Loy A, Baines JF, Rausch P, Basic M, Bleich A, Berry D & Stecher B (2019) Cell Host Microbe 25: 681-694 e688.
Huang CB, Xiao L, Xing SC, Chen JY, Yang YW, Zhou Y, Chen W, Liang JB, Mi JD, Wang Y, Wu YB & Liao XD (2019) BMC Genomics 20: 770.
Ju T, Kong JY, Stothard P & Willing BP (2019) ISME Journal 13: 1520-1534. Padovan A, Siboni N, Kaestli M, King WL, Seymour JR & Gibb K (2021) Marine
Environmental Research 169: 105405. Png CW, Linden SK, Gilshenan KS, Zoetendal EG, McSweeney CS, Sly LI, McGuckin MA
& Florin TH (2010) American Journal of Gastroenterology 105: 2420-2428. Ramirez S, Jacquier V, Walsh MC & Geremia JM (2021) Proceedings of the Australian
Poultry Science Symposium 32: 30. Robertson BR, O'Rourke JL, Neilan BA, Vandamme P, On SLW, Fox JG & Lee A (2005)
International Journal of Systematic and Evolutionary Microbiology 55: 1199-1204. Tannock GW (2021) Applied and Environmental Microbiology 87. Vieira JRP, Rezende ATO, Fernandes MR & da Silva NA (2021) Advances in Rheumatology
61: 42. Walsh MC, Jacquier V, Schyns G, Claypool J, Tamburini I, Blokker B & Geremia JM (2021)
Poultry Science 100: 100800. Zeng Q, Yang Z, Wang F, Li D, Liu Y, Wang D, Zhao X, Li Y, Wang Y, Feng X, Chen J, Li
Y, Zheng Y, Kenney T, Gu H, Feng S, Li S, He Y, Xu X & Dai W (2021) Microbial Genomics 7.
Aust. Poult. Science Symp. 2022...33
57

THE RISE OF ANTIMICROBIAL RESISTANCE
D. STANLEY1
Summary
The control of infectious diseases has always been a top medical priority. For years during the so-called "antibiotic era", we enjoyed prolonged life expectancy and the benefits of superior pathogen control. The devastating failure of the medical system, agriculture and pharmaceutical companies, and the general population, to appreciate and safeguard these benefits is now leading us into a grim "post-antibiotic era", and the predictions are very ominous. Antimicrobial resistance (AMR) refers to microorganisms becoming resistant to antibiotics designed and expected to kill that particular species. Prior to the COVD19 pandemic, AMR was recognised by the World Health Organization (WHO) as the central priority area with growing public awareness of the threat it now presents. The Review on Antimicrobial Resistance, a project commissioned by the United Kingdom government, predicted that the death toll of AMR could be one person every three seconds, amounting to 10 million deaths per year by 2050 (O’Neill, 2016). This review will present the current status of AMR focusing on livestock contribution to the global AMR crisis.
I. INTRODUCTION
The UK review of antimicrobial resistance presented now outdated 2014 data on AMR consequences for human life (O’Neill, 2016). They estimated that 700,000 people die every year from AMR, with concerning devastating effects on infant mortality. In India, 60,000 newborn babies die each year from antibiotic-resistant neonatal infections. This problem is more prominent in less developed countries but by no means restricted to them. In the US, there are more than two million AMR infections per year, costing the US health system 20 billion USD. The committee of experts suggested a strong response to AMR (Figure 1); however, other than agriculture responding with efforts to remove antibiotics from production altogether, other directives are falling behind.
II. MAJOR CONTRIBUTORS TO AMR RISE
a) Human and hospital wasteThe sewage microbial community is comprised mainly of human intestinal bacteria and some bacteria that grow on the sewage equipment and system. Antibiotics (ABs) are developed to be resilient to metabolic degradation and active during biological transit time. It is estimated that 50-80% of antibiotics is excreted in urine and 4-30% in faecal material (Riaz et al., 2020). Thisindicates that all unmetabolised antibiotics used by the human population, at home and inhospitals, end up in the sewage system. The sewage is saturated with antimicrobial-resistantbacteria (ARB) and their antimicrobial-resistant genes (ARGs). The troubling issue is theabundance of mobile genetic elements (MGEs), such as plasmids, which serve as vectorstransferring ARGs between bacterial strains in the sewage environment. Sewage is the breedingground for new ARB via ARG transfer.
1 Central Queensland University, IFFS, Australia; [email protected]
Aust. Poult. Science Symp. 2022...33
58

Figure 1 – Recommendations from The Review on Antimicrobial Resistance (O'Neill, 2016)
Unfortunately, wastewater treatment plants (WWTPs) were not designed to remove or reduce AMR contamination. On the contrary, some multiple drug-resistant (MDR) species of Escherichia, Shigella and Klebsiella increase two-fold from raw to treated water. Similarly, total MDR Enterobacteriaceae surged from 5.5 to 14.1% in the treated wastewater. Species like methicillin-resistant Staphylococcus aureus (MRSA) are abundant in raw and treated sewage (Krzemiński et al., 2020). Hospitals often have their own waste treatment. However, that is reserved for medical waste rather than the general waste from toilets, kitchen and laundry. There is a whole new level of AMR enrichment in a hospital environment. Here, it is important to note that all hospital waste eventually ends up in sewage and WWTP.
b) AMR from agricultureFour major manure types are used in agriculture: bovine, horse, pig and poultry. Although animal manures enrich the soil with essential and rare plant nutrients, they also contain biological impurities that include bacteria, fungi, helminths, parasites and other intestinal and environmental biological contaminants. Residual concentration of antibiotics in manure may not be very high and is reported as commonly ~1–10 mg/kg (Krzemiński et al., 2020); it was estimated that, in the last 50 years, more than one million tonnes of antibiotics entered the soil via manure (Allen et al., 2010).
The animal manure contains both urinary and faecal excrements, and both are used to excrete unmetabolised AB. In addition to adding antibiotics to the soil via manure, we also add ARB and ARGs. The survival time of pathogens in the soil is up to ten years and, on plant surfaces, up to one year (Krzemiński et al., 2020). Defra project by UK Centre for Ecology & Hydrology (Nicholson et al., 2016) estimated that approximately 96 million tonnes of farm manure are used annually in the UK and, with this volume of manure applied worldwide, antibiotic accumulation in the soil is inevitable.
Aust. Poult. Science Symp. 2022...33
59

Although manure is a major source of antibiotics, ARG and ARB in the soil, in the USA and many other countries, all manure is considered an organic product and can be used on crops grown organically, thus introducing residual excreted antibiotics into organic plants and allowing AMB to colonise plants and ARGs exchange with native farm soil microbiota. As a result, many organic plants carry an abundance of AMR (Roberts, 2019). Ultimately all of these biological contaminants end up in food and in waterways (Figure 2).
There is another dimension to the presence of AMR in chicken sheds – farm employees welfare and safety! A good example is the UK use of vancomycin-similar drug avoparcin in poultry that resulted in the development of vancomycin-resistant Enterococcus faecium (VRE) in chickens. VRE was then found in processed meat, and farmers and abattoir staff who slaughtered the VRE+ animals, some of whom had to be hospitalised with the VRE infection (Cetinkaya et al., 2000; van den Bogaard et al., 2002). Additionally, van den Bogaard et al. (2002) reported that AMR for nearly all antibiotics was higher in broiler farmers than in egg farmers and slaughterhouse workers. This is in agreement with the higher use of antibiotics in broilers. Moreover, it was reported by multiple investigators that, in cattle and swine, faecal AMR decreases as food animals age, but this was not observed in short-lived poultry (Gaire et al., 2020).
Despite much attention to livestock animals and manure, one of the biggest AMR offenders is aquaculture. Aquaculture is the fastest-growing food-producing area in the world, and by many, considered the future of the food industry. Integrated aquaculture that involves feeding fish livestock manure is a traditional practice of the smaller Asian farms. Tetracyclines were extensively used in aquaculture, and aquaculture is mainly blamed for the broad tet-genes distribution in the world. In 2017 there were 59 tetracycline resistance genes identified even in the world’s most pristine remote environments like Antarctica and the Arctic (Roberts, 2019). It was estimated that 70% of an enormous amount of antibiotics given to seafood ends up in waterways. In addition to using and releasing massive amounts of antibiotics into waterways, the aquaculture AMR bio-waste also contaminates adjacent soils and waterways sediments where it is actively concentrated.
With the rise in seafood consumption, seafood-borne bacterial diseases are becoming more severe health hazards worldwide and, due to antibiotic use in production, it resulted in numerous AMR disease outbreaks in the USA (Elbashir et al., 2018). However, there is a considerable discrepancy in antibiotic usage in different countries. For example, antibiotics are used in a wide range – from 1g/t in Norway to 700 g/t in Vietnam (Defoirdt et al., 2011). Asian countries yield two-thirds of global food fish production, yet concerning levels of resistance to clinically critical antibiotics and high levels of foodborne zoonotic pathogens are evident (Schar et al., 2021), and this resulted in accumulated resistance along with Asia's major river systems, especially in China and India (Schar et al., 2021). Furthermore, to close the toxic cycle, AMR, ARB and ARGs are regularly present in drinking water (Roberts, 2019).
c) AMR in the soilSoil represents the richest microbiota system, abundant with bacterial and fungal communities, and it is the origin of many clinical antibiotics (Afzaal et al., 2020). Similarly to waterways, the soil acts as a major sink that accepts the AMR from major contaminants like hospital waste, wastewater treatment, aquaculture and manure. Although some antibiotics can chemically bond with the soil and persist, soil factors such as soil texture and AMR gene stability play a role in AMR persistence in the soil (Macedo et al., 2020). In addition to antibiotics, many metals in the soil that generate toxic metal resistant bacteria and toxic metal resistant genes show potent cross- and co-resistance to antibiotics and can result in AMR gene emergence without any exposure to antibiotics (Yazdankhah et al., 2018). This is further complicated with both manure and inorganic fertilisers.
Aust. Poult. Science Symp. 2022...33
60

d) AMR in the foodAMR pathogens in human food present a major risk for public health. Food is contaminated by the presence of AB and ARB on food due to the use of antibiotics in production and via cross-contamination with ARB during food processing (Verraes et al., 2013). This is of special concern with seafood (Elbashir et al., 2018). ARB and ARG have been identified in tap water, milk, meat, vegetables, and processed and unprocessed foods (Roberts, 2019); thus, the food chain is one of the principal means of AMR transmission. Although often present in the very low amount on meat, ARBs can often amplify to high numbers due to poor meat handling, storage and hygiene practices (Plaza-Rodriguez et al., 2021).
While ARB and AMR in the meat are a consequence of the contamination in slaughterhouses and processing, vegetables are known to actively uptake antibiotics and AMR genes from the soil or irrigation water (Azanu et al., 2016), especially if manure is used for fertilising (Tasho and Cho, 2016). Wang et al. (2015) and many others reviewed in Tasho and Cho (2016), identified highly abundant ARGs on vegetables growing on soil with more than three years of manure usage.
Although very little attention is given to wild animals, the levels of AMR infiltration into their water, soil and plants suggests that they could not remain unaffected. Even in wild animals that have minimal contact with humans and live in generally considered pristine environments, ARB, like highly multiresistant MRSA, were detected in deer, boar, wolves, foxes, pigeons, pheasants and birds of prey (reviewed in Silva et al., 2020).
Fruit and vegetables are declared safe for human use if they have antibiotic residue under the selected maximum threshold. Similarly, fish and seafood heavily treated with antibiotics can be used after being housed in antibiotic-free water for some time, referred to as the withdrawal period (Bhattacharjee, 2016). Unfortunately, the simple antibiotic residue is a much smaller problem than ARB and ARGs in food. Additionally, washing fruit and vegetables in drinking tap water is not going to help since an abundance of researchers detected AMR in tap water (Roberts, 2019).
e) AMR in the airAlthough it may seem unmanageable, AMR and ARGs have been isolated from the air, especially in highly industrialised countries like China. Li and colleagues (Li et al., 2018) carried out a well-known study investigating air samples from 19 major cities worldwide and screening 30 ARGs (Li et al., 2018). The ARGs were detected to vary by nearly 100-fold in different cities. The highest number of ARGs was detected in Bejing, and San Fransico had the highest ARG abundance. Clinically critical antibiotic resistance genes such as vancomycin were detected in air samples (Li et al., 2018), indicating that urban air represents a health risk associated with continual exposure to airborne ARGs. Li and colleagues also analysed bacterial communities in the air, their networks and contributions to ARGs. They found 50 genera in the urban air, including Corynebacterium, Escherichia/Shigella, Streptococcus and other potentially pathogenic genera. Many other authors came to similar conclusions (Krzemiński et al., 2020). Unlike AMR in soil, the AMR in air and water are mobile, and diffusion, floods and rain play a role in delivering AMR, ARB and ARGs to the remote and "untouched" ecosystems.
f) AMR in probioticsAlthough often ignored, it is well established that most probiotics carry AMR and ARGs. This is well investigated and comprehensively reviewed (Gueimonde et al., 2013; Li et al., 2020). The probiotics carry ARGs, because AMR profile was not required for their registration and, even if it was, AMR profile was until recently done using PCR on a hand-picked subset of genes or disc diffusion tests, methodologies inferior to shotgun metagenomic sequencing and blasting against databases that now have well over 3000 fully annotated ARGs. Some
Aust. Poult. Science Symp. 2022...33
61

researchers that tackled this issue suggest that it is suitable for species like Lactobacillus to be antibiotic-resistant so they can survive, maintain and help to restore healthy gut after antibiotic treatments (Gueimonde et al., 2013). However, authors universally agree that ARGs on mobile genetic elements (such as plasmids) constitute a significant problem because of resistance spread to other species (Zheng et al., 2017; Baumgardner et al., 2021). Liu confirmed the presence of resistance to AB, including clinically critical, in commercial probiotics, identifying vancomycin, rifampicin, streptomycin, bacitracin, and erythromycin ARGs (Liu et al., 2009), and suggesting a re-evaluation of probiotic safety and proposing new regulations.
Probiotics are continually added into the intestinal community due to regular use in both humans and supplemented animals (Zheng et al., 2017) and the effects of accumulation of AMR is not yet investigated. Baumgardner and colleagues (Baumgardner et al., 2021) performed a comprehensive study to determine if transferable ARGs are present in 47 commercially available veterinary probiotics, including products marketed for cattle, dogs, camelids, cats, goats and horses. 97% of the 47 probiotics contained at least one mobile AMR gene, and 82% contained two or more. This study is highly relevant to poultry and other livestock, and it confirms the risk for transmission of these mobile AMR genes into meat products, manure and environment. Considering the scale of production and administration of probiotics, they also strongly amount to AMR enrichment in manure, and thus soil, water, and the environment. In a survey of fermented food starter cultures from 90 different sources in Switzerland, Kastner et al. (2006) confirmed AMR in the most common starter culture species. A recent study by Montassier published in Nature Microbiology (Montassier et al., 2021) brings this story to another level. An administration of ABs resulted in the increase of the lower GI tract resistome. However, the addition of probiotics further exacerbated AMR and ARGs expansion in the gut mucosa by promoting the bloom of strains carrying vancomycin resistance genes but not resistance genes carried by the probiotic strains! This opens an interesting new area of research on identifying supplements that enlarge or reduce resistome in human and animal intestines. For example, the faecal transplant can assist in the reduction of ARGs in the gut (Montassier et al., 2021). The vicious cycle of AMR spread on a global scale is presented in Figure 2.
Aust. Poult. Science Symp. 2022...33
62

Figure 2 – Vicious cycle of AMR spread and expansion in the environment
III. FUTURE DIRECTIONS
The estimated death toll from rising AMR is in millions per year (O’Neill, 2016), and medical practitioners are constantly reporting new all-resistant strains of pathogens while AMR related annual mortality is on a steep rise (O’Neill, 2016). There are numerous suggestions to improve monitoring, surveillance and diagnostics; however, efforts in reducing the load of AMR in the environment are urgently needed. One of the emerging methods is bioremediation using living organisms that have a remarkable ability to remove or reduce ARG load in treated samples.
Bacteria and other microorganisms such as protozoa and yeast are the most promising and widely used for AMR and AB bioremediation. However, this is based on complex microbial interactions and is not yet fully understood or optimised. To assist bioremediation, microorganisms must be able to survive and thrive under extreme conditions (oxidative pressure, nutrient depletion, osmotic stress) (reviewed in Apreja et al., 2021). It was reported that a combination of bacteria and microalgae could efficiently remove a range of antibiotics from the sludge, where the symbiotic interactions between bacteria and microalgae played a major role in the kinetics of antibiotic removal (da Silva Rodrigues et al., 2021). Although this area of research is relatively new, modern methodologies such as shotgun sequencing of antibiotic-resistant isolates revealed new enzymes capable of bioremediation (dos Santos et al., 2015). They opened an opportunity for the rapid development of bacterial libraries capable of removing ABs from the environment. Bacillus species, alone or in combination with other microorganisms, are among the most promising candidates (Al-Gheethi et al., 2019).
Phytoremediation is the removal of antibiotics using algae. Cyanobacteria are among the most interesting: they use light as an energy source and CO2 as a carbon source, also helping
Aust. Poult. Science Symp. 2022...33
63

in carbon sequestration during the bioremediation process. Additionally, they are hardy, capable of growing under extreme conditions, and capable of fixing up atmospheric nitrogen. Successful examples of algal bioremediation of antibiotics are well presented and reviewed (Grimes et al., 2019; Xiao et al., 2021; Zhou et al., 2021). It is, however, important to monitor the production of algal toxins before selecting the algae of choice for bioremediation.
Mycoremediation and phytoremediation are up-and-coming remediation techniques using fungi and plants to remove ABs from the environment. We previously discussed how plants accumulate AB from the soil; although this is an issue for vegetable and other edible plants production, it is excellent in bioremediation.
IV. CONCLUSIONS
There is no doubt that AMR is one of the major global health issues. AMR is a natural phenomenon that has existed for as long as microorganisms. The preservation of intestinal content in both naturally and deliberately mummified human remains confirmed the presence of resistance genes to most known antibiotics, including most recently discovered (reviewed in Santiago-Rodriguez et al., 2017). This became an excuse for many to ignore the current global AMR pollution putting aside the fact that never in history have we had millions of tonnes of antibiotics pumped into the environment. According to WHO predictions, we are heading towards post-antibiotic era where things like c-section, organ transplants or chemotherapy will be hazardous procedures.
REFERENCES
Afzaal M, Mirza SA, Arooj T, Almas M & Ahmed S (2020) Antimicrobial and antibiotic resistance genes in the environment, In: Hashmi, M.Z. (Ed.), AMR genes, Springer, pp. 51-79. https://link.springer.com/chapter/10.1007%2F978-3-030-40422-2_3
Al-Gheethi A, Noman E, Radin Mohamed RMS, Ismail N, Bin Abdullah AH & Mohd Kassim AH (2019) Journal of Hazardous Materials 365: 883-894.
Allen HK, Donato J, Wang HH, Cloud-Hansen KA, Davies J & Handelsman J (2010) Nature Reviews Microbiology 8: 251-259.
Apreja M, Sharma A, Balda S, Kataria K, Capalash N & Sharma P (2021) Environmental Science and Pollution Research (International) 1-17.
Azanu D, Mortey C, Darko G, Weisser JJ, Styrishave B & Abaidoo RC (2016) Chemosphere 157: 107-114.
Baumgardner RM, Berreta A & Kopper JJ (2021) The Canadian Veterinary Journal = La revue veterinaire canadienne 62: 379-383.
Bhattacharjee MK, 2016. Development of resistance to antibiotics, In: Bhattacharjee, M.K. (Ed.), Chemistry of antibiotics and related drugs, Springer.
Cetinkaya Y, Falk P & Mayhall CG (2000) Clinical Microbiology Reviews 13: 686-707. da Silva Rodrigues DA, da Cunha C, do Espirito Santo DR, de Barros ALC, Pereira AR, de Queiroz
Silva S, da Fonseca Santiago A & de Cassia Franco Afonso RJ (2021) Environmental Science and Pollution Research (International) 28: 67822-67832.
Defoirdt T, Sorgeloos P & Bossier P (2011) Current Opinion in Microbiology 14: 251-258. dos Santos DF, Istvan P, Noronha EF, Quirino BF & Kruger RH (2015) Biotechnology Letters 37:
1809-1817. Elbashir S, Parveen S, Schwarz J, Rippen T, Jahncke M & DePaola A (2018) Food Microbiology
70: 85-93. Gaire TN, Scott HM, Sellers L, Nagaraja TG & Volkova VV (2020) Frontiers in Veterinary
Science 7: 622495. Grimes KL, Dunphy LJ, Loudermilk EM, Melara AJ, Kolling GL, Papin JA & Colosi LM (2019)
Chemosphere 237: 124421.
Aust. Poult. Science Symp. 2022...33
64

Gueimonde M, Sanchez B, C GdLR-G & Margolles A (2013) Frontiers in Microbiology 4: 202. Kastner S, Perreten V, Bleuler H, Hugenschmidt G, Lacroix C & Meile L (2006) Systematic and
Applied Microbiology 29: 145-155. Krzemiński P, Markiewicz M & Popowska P 2020. Entry routes of antibiotics and antimicrobial
resistance in the environment, In: Hashmi, M.Z. (Ed.), Springer, pp. 1-26. Li J, Cao J, Zhu YG, Chen QL, Shen F, Wu Y, Xu S, Fan H, Da G, Huang RJ, Wang J, de Jesus
AL, Morawska L, Chan CK, Peccia J & Yao M (2018) Environmental Science & Technology 52: 10975-10984.
Li T, Teng D, Mao R, Hao Y, Wang X & Wang J (2020) Food Research International 136: 109571. Liu C, Zhang ZY, Dong K, Yuan JP & Guo XK (2009) Biomedical and Environmental Sciences :
BES 22: 401-412. Macedo G, Hernandez-Leal L, van der Maas P, Heederik D, Mevius D & Schmitt H (2020) The
Science of the Total Environment 737: 139563. Montassier E, Valdes-Mas R, Batard E, Zmora N, Dori-Bachash M, Suez J & Elinav E (2021)
Nature Microbiology 6: 1043-1054. Nicholson F, Chambers B, Lord E, Bessey R & Misselbrook T (2016) Estimates of manure volumes
by livestock type and land use for England and Wales. NERC Environmental Information Data Centre., In: Hydrology, U.C.f.E. (Ed.). https://catalogue.ceh.ac.uk/documents/517717f7-d044-42cf-a332-a257e0e80b5c
O’Neill J (2016) Antimicrobial Resistance: Tackling a Crisis for the Health and Wealth of Nations. The Review on Antimicrobial Resistance. https://amr-review.org/sites/default/files/AMR%20Review%20Paper%20-%20Tackling%20a%20crisis%20for%20the%20health%20and%20wealth%20of%20nations_1.pdf
Plaza-Rodriguez C, Mesa-Varona O, Alt K, Grobbel M, Tenhagen BA & Kaesbohrer A (2021) Microorganisms 9.
Riaz L, Yang Q, Sikandar A, Safeer R, Anjum M, Mahmood T, Rehman MSU, Rashid A & Youan W, 2020. Antibiotics use in hospitals and their presence in the associated waste, In: Hashmi, M.Z. (Ed.), Antibiotics and antimicrobial resistance genes, Springer, pp. 27-49.
Roberts MC, 2019. Antibiotics and Resistance in the Environment, In: Fong, I.W., Shlaes, D., Drlica, K. (Eds.), Antimicrobial Resistance in the 21st Century.
Santiago-Rodriguez TM, Fornaciari G, Luciani S, Toranzos GA, Marota I, Giuffra V & Cano RJ (2017) Genes (Basel) 8.
Schar D, Zhao C, Wang Y, Larsson DGJ, Gilbert M & Van Boeckel TP (2021) Nature Communications 12: 5384.
Silva V, Correia S, Pereira JE, Igrejas G & Poeta P, 2020. Surveillance and environmental risk assessment of antibiotics and AMR/ARGs related with MRSA, Springer, pp. 271-295.
Tasho RP & Cho JY (2016) The Science of the Total Environment 563-564: 366-376. van den Bogaard AE, Willems R, London N, Top J & Stobberingh EE (2002) The Journal of
Antimicrobial Chemotherapy 49: 497-505. Verraes C, Van Boxstael S, Van Meervenne E, Van Coillie E, Butaye P, Catry B, de Schaetzen
MA, Van Huffel X, Imberechts H, Dierick K, Daube G, Saegerman C, De Block J, Dewulf J & Herman L (2013) International Journal of Environmental Research and Public Health 10: 2643-2669.
Wang X, Ryu D, Houtkooper RH & Auwerx J (2015) Bioessays 37: 1045-1053. Xiao G, Chen J, Show PL, Yang Q, Ke J, Zhao Q, Guo R & Liu Y (2021) Chemosphere 282:
130966. Yazdankhah S, Skjerve E & Wasteson Y (2018) Microbial Ecology in Health and Disease 29:
1548248. Zheng M, Zhang R, Tian X, Zhou X, Pan X & Wong A (2017) Frontiers in Microbiology 8: 908. Zhou H, Cui J, Li X, Wangjin Y, Pang L, Li M & Chen X (2021) Water Environment Research
e1670.
Aust. Poult. Science Symp. 2022...33
65

MEASURING BROILER RESPONSE WHEN AN ANTIBIOTIC GROWTH PROMOTOR IS REMOVED AND REPLACED WITH THERAPEUTIC FEED ADDITIVES
R. YUWARES1, R. KONKAWAT1, P. ATTAWOOT1, M.S. BEKKER2,T. TIYASATKULKOVIT2, P. HUTAPEA2 and E. MAGTAGNOB2
Summary
Resistance of infectious bacteria to antibiotics critical for human health is increasing. As part of the strategy to reduce the exposure of bacteria to therapeutic antibiotics, production animals, particularly monogastric animals such as broiler chickens are reducing their reliance on antibiotics for growth promotion (AGP). As AGPs are removed from broiler diets, performance is negatively impacted and susceptibility to infection increases. The present study investigates the effectiveness of alternative feed ingredients alone and in combination, including essential oils, slow-release organic acids, chelated copper and exogenous protease on the performance of broiler chickens when a common AGP (zinc bacitracin) is removed. As the negative control performed as well as any treatment group, including the AGP treatment, it is clear the birds remained healthy and grew well regardless of treatment, undergoing no acute or chronic disease pressure. Of note in the 0-10 day growth period was the tendency of birds fed exogenous protease to grow as well with a lower feed intake, displaying significant feed efficiency over some other treatments. In the 10-24 day growth period the combination of essential oils and protected benzoic acid outperformed the AGP treatment. No other significant growth performance data was observed; however both the protease treatment and chelated copper treatment with essential oil did show greater villus height to crypt depth ratio in jejunum samples compared to other treatments. This may give further direction as to the specific actions of antibiotic alternatives and when they could be applied for greatest effect.
I. INTRODUCTION
The World Health Organisation has raised concern regarding increasing antibiotic resistance to commonly used antimicrobial drugs. In response, the use of antibiotic growth promoters in livestock production is being reduced each year, directed either by local government legislation or the pressure of consumer preferences. The objective of this study was to evaluate the effectiveness of several active compounds in maintaining bird health and performance when an antibiotic growth promotor was removed from the diet.
II. METHOD
1,365 Ross 308 broiler chicks were allocated to 5 treatments with 13 replications, using 21 chicks per experimental unit. Treatment periods were 0-10 days of age, 11 to 24 days of age and 25 to 35 days of age. Birds were fed a corn/soybean meal-based diet and raised to breed manual specifications as seen in Table 2. The treatments can be seen in Table 1. Samples of intestinal tissue (jejunum and ileum) were collected from 2 birds per pen at 35 days of age for the measurement of villus length, villus width, crypt depth and villous:crypt ratio. Analysis of all zootechnical data was conducted using Analysis of Variance. Treatment effects were significantly different at P < 0.05. Variables having a significant F-test were compared using
1 Animal Sciences Department, Faculty of Agriculture at Kamphaengsaen, Kasetsart University, Bangkok2 Novus International. [email protected]
Aust. Poult. Science Symp. 2022...33
66

the Duncan’s new multiple range test function of SAS. Statistical significance was declared at P ≤ 0.05, with 0.05 < P < 0.10 considered as a near-significant trend.
Table 1 - Dietary Treatments Treatments Dietary Inclusion
T1 Positive Control (PC) - Zinc Bacitracin (50 ppm) T2 Negative Control (NC) - No antibiotics T3 T2 + Essential Oils1 (30-15-15 ppm) and Benzoic Acid2 (250-250-250 ppm) T4 T2 + Copper3 (30-30-30 ppm) and Essential Oil1 (15-15-15 ppm) T5 T2 + Protease4 (300-300-300 ppm)
1 - Encapsulated essential oil blend composed of Carvacrol and Thymol 2 - Encapsulated Benzoic Acid 3 - Copper as Methionine Hydroxy Analogue Chelate 4 - Serine protease added on top of pre-starter (0-10d) and formulated with matrix values for starter and finisher (11-35d)
Table 2 - Nutrient composition of experimental diets1 Raw Material 0-10 Day 11-24 Day 25-35 DayCorn 54.75 59.52 64.30 Soybean oil 1.92 1.72 1.50 Soybean Meal 48% 30.65 24.48 18.25 Full fat Soybean 8.00 10.00 12.00 Calcium carbonate 1.45 1.33 1.22 MCP-22 1.79 1.60 1.44 Salt 0.36 0.36 0.36 DL-Methionine 0.34 0.30 0.26 L-Lysine 0.25 0.23 0.23 Threonine 0.09 0.07 0.04 Choline Chloride 60% 0.06 0.06 0.05 Antioxidant 0.01 0.01 0.01 Toxin Binder 0.15 0.15 0.15 Premix (vitamin + mineral) 0.18 0.18 0.18 Total 100.00 100.00 100.00 Nutrient composition ME for Poultry 3050.00 3100.00 3150.00 Protein 22.00 20.00 19.00 Moisture 11.56 11.63 11.63 Fat 5.64 5.90 6.42 Fiber 2.71 2.62 2.55 Ash 6.69 6.17 5.79 Ca 0.96 0.90 0.85 Total P 0.74 0.70 0.66 P avail 0.48 0.45 0.42 Salt by Na 0.58 0.46 0.41 Dig Lysine 1.30 1.14 1.07 Dig Methionine 0.56 0.50 0.49 Dig Met + Cys 0.90 0.82 0.80 Dig Cysteine 0.34 0.32 0.31 Choline 1700.00 1600.00 1500.00
1All diets were formulated according to Ross308 recommendation and manufactured by a commercial feed mill.
III. RESULTS
No significant differences were observed in mortality or morbidity among dietary treatments. During 0-10 days of age, birds fed the protease (T5) had lower feed intake (P < 0.05) than negative control (T2) and T4 but not positive control (T1) or T3. Growth performance during this period was equal among all treatments; however feed conversion ratio followed the significant difference of feed intake with T5 showing better efficiency (P = 0.01) than T2 and
Aust. Poult. Science Symp. 2022...33
67

T4 but not different than T1 or T3. During 11-24 days of age, birds fed T3 grew heavier (P < 0.05) than T2 but not different than other treatments. By the end of the study, at 35 days of age, there were no significant differences of growth performance among treatments as seen in Table 3.
When stress and immunity measurements were taken using blood from one bird per pen at 35 days the only significant difference found was for T3, T4 and T5 which had higher interleukin 2 (IL2) (P = 0.007) than T2, with T5 the only treatment to have a significantly higher IL2 than both T1 and T2.
Table 3 - Effect of in-feed therapeutics on performance of broilers
T1 T2 T3 T4 T5 P-value Pooled SE
Initial weight 40.48 40.17 40.23 40.23 40.17 0.3894 0.0556 0-10 DOAFinal weight (g) 314.88 312.98 313.76 315.40 313.33 0.8583 0.7901 Body wt. gain (g) 274.40 272.81 273.53 275.17 273.16 0.8882 0.7912 Feed intake (g) 296.89ab 300.26a 293.72ab 299.01a 289.12b 0.0616 1.3538 FCR 1.082abc 1.101a 1.074bc 1.087ab 1.058c 0.0111 0.0040 Mortality (%) 0.000 0.000 0.000 0.000 0.000 0.0000 0.0000 Culling (%) 0.000 0.000 0.000 0.000 0.000 0.0000 0.0000 11-24 DOAFinal weight (g) 1287.75ab 1277.58b 1303.97a 1298.16ab 1286.30ab 0.1988 3.7931 Body wt. gain (g) 972.87ab 964.60b 990.21a 982.75ab 972.97ab 0.1604 3.4728 Feed intake (g) 1263.16 1258.48 1283.92 1281.52 1259.66 0.3401 5.1680 FCR 1.298 1.305 1.297 1.304 1.295 0.7654 0.0029 Mortality (%) 1.099 0.000 0.000 1.099 0.366 0.2049 0.2120 Culling (%) 0.366 0.000 0.000 0.000 0.000 0.4147 0.0733 25-35 DOAFinal weight (g) 2353.83 2349.36 2396.24 2392.00 2358.57 0.4705 10.4892 Body wt. gain (g) 1066.08 1071.78 1092.27 1093.84 1072.28 0.7674 8.3607 Feed intake (g) 1726.99 1740.60 1767.45 1773.25 1731.21 0.4771 10.0183 FCR 1.620 1.624 1.618 1.621 1.615 0.9995 0.0083 Mortality (%) 0.366 0.733 0.000 0.366 0.000 0.4623 0.1430 Culling (%) 0.000 0.000 0.000 0.000 0.000 0.0000 0.0000 1-35 DOAFinal weight (g) 2353.832 2349.361 2396.240 2391.996 2358.573 0.4705 10.4892 Body wt. gain (g) 2313.36 2309.19 2356.01 2351.76 2318.40 0.4702 10.4971 Feed intake (g) 3287.03 3299.34 3345.08 3353.77 3279.99 0.3158 13.9389 FCR 1.421 1.429 1.420 1.426 1.415 0.8105 0.0035 Mortality (%) 1.465 0.733 0.000 1.465 0.366 0.2155 0.2464 Culling (%) 0.366 0.000 0.000 0.000 0.000 0.4147 0.0733
a, b Means within the same column with different superscripts differ significantly (P<0.05).
There was no significant difference among treatments for measurements of villus architecture in the ileum tissue section; however in the jejunum section, treatments T4 and T5 had significantly shallower crypt depth than T1 and T2 (P < 0.05) and this led to significantly greater villus to crypt ratios (P = 0.0002) for T4 and T5 to all other treatments as seen in Table 4. This result is similar to responses seen to the same additives when reported in conjunctionwith water acidification by Bekker et al, 2019.
Aust. Poult. Science Symp. 2022...33
68
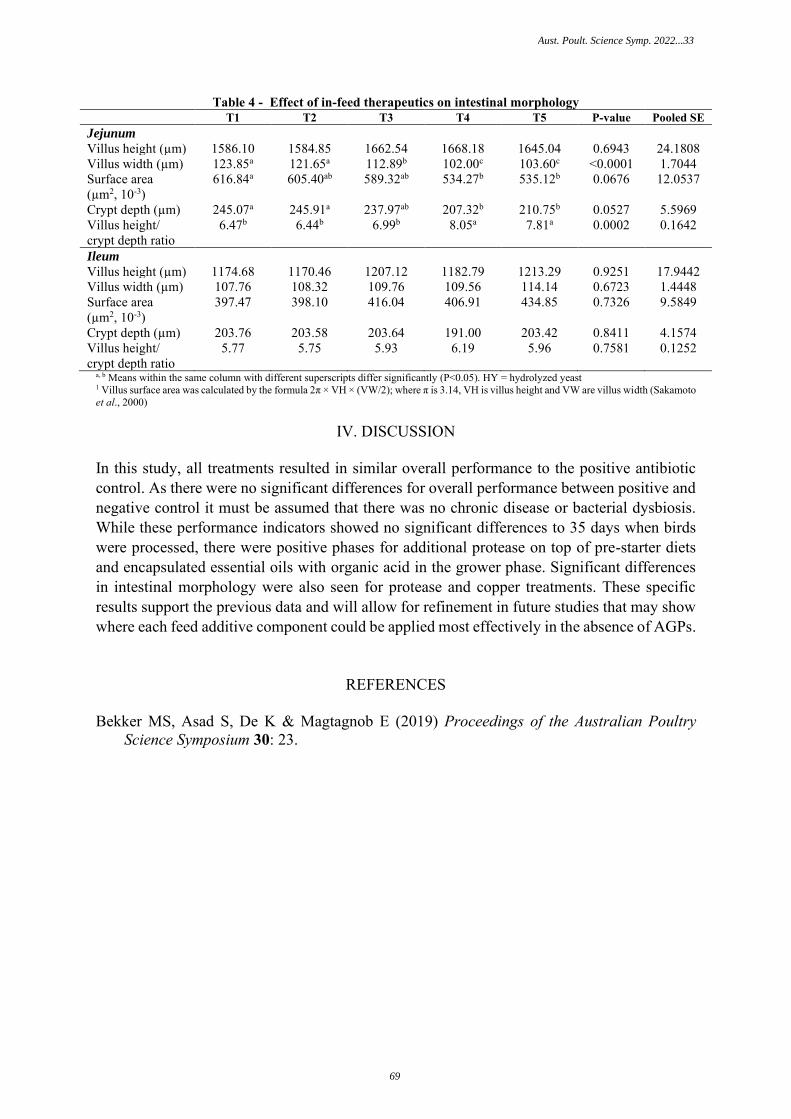
Table 4 - Effect of in-feed therapeutics on intestinal morphology T1 T2 T3 T4 T5 P-value Pooled SE
Jejunum
Villus height (µm) 1586.10 1584.85 1662.54 1668.18 1645.04 0.6943 24.1808 Villus width (µm) 123.85a 121.65a 112.89b 102.00c 103.60c <0.0001 1.7044 Surface area (µm2, 10-3)
616.84a 605.40ab 589.32ab 534.27b 535.12b 0.0676 12.0537
Crypt depth (µm) 245.07a 245.91a 237.97ab 207.32b 210.75b 0.0527 5.5969 Villus height/ crypt depth ratio
6.47b 6.44b 6.99b 8.05a 7.81a 0.0002 0.1642
Ileum
Villus height (µm) 1174.68 1170.46 1207.12 1182.79 1213.29 0.9251 17.9442 Villus width (µm) 107.76 108.32 109.76 109.56 114.14 0.6723 1.4448 Surface area (µm2, 10-3)
397.47 398.10 416.04 406.91 434.85 0.7326 9.5849
Crypt depth (µm) 203.76 203.58 203.64 191.00 203.42 0.8411 4.1574 Villus height/ crypt depth ratio
5.77 5.75 5.93 6.19 5.96 0.7581 0.1252
a, b Means within the same column with different superscripts differ significantly (P<0.05). HY = hydrolyzed yeast 1 Villus surface area was calculated by the formula 2π × VH × (VW/2); where π is 3.14, VH is villus height and VW are villus width (Sakamoto et al., 2000)
IV. DISCUSSION
In this study, all treatments resulted in similar overall performance to the positive antibiotic control. As there were no significant differences for overall performance between positive and negative control it must be assumed that there was no chronic disease or bacterial dysbiosis. While these performance indicators showed no significant differences to 35 days when birds were processed, there were positive phases for additional protease on top of pre-starter diets and encapsulated essential oils with organic acid in the grower phase. Significant differences in intestinal morphology were also seen for protease and copper treatments. These specific results support the previous data and will allow for refinement in future studies that may show where each feed additive component could be applied most effectively in the absence of AGPs.
REFERENCES
Bekker MS, Asad S, De K & Magtagnob E (2019) Proceedings of the Australian Poultry Science Symposium 30: 23.
Aust. Poult. Science Symp. 2022...33
69

FEEDING A SYNERGISTIC BLEND OF ORGANIC ACIDS AND ß-1,4 MANNOBIOSE REDUCES CAECAL SALMONELLA IN BROILER CHICKENS
S. VAN KUIJK1, L. PINEDA1 and Y. HAN1
Summary
The aim of this study was to investigate the overall effect of feeding a synergistic blend, that contains short chain fatty acids, medium chain fatty acids, hydrolyzed copra meal (containing ß-1,4 mannobiose) and microencapsulated sodium salts of butyric acid, on caecal Salmonella counts in Salmonella challenged broiler chickens, regardless of experimental conditions. To test this, data from 9 studies, performed around the globe (Brazil, Spain, Thailand), were combined into one meta-analysis. In all studies broiler chickens were fed either a control diet according to local standards or a diet containing the synergistic blend from day 1 onwards. Between day 1 and 8 of age the birds were challenged with one of the Salmonella spp. (Enteritidis, Typhimurium, or Heidelberg). The quantitative Salmonella count data were split between 0-14 days post inoculation (DPI) and 15-34 DPI. Data analysis was done in SAS taking within and between study variation into account using a random and repeated statement within the mixed model respectively.
The results show that in the period 0-14 DPI the synergistic blend resulted in significantly lower caecal Salmonella counts compared to the control diet. The natural course of Salmonella infection caused a decrease in the period 15-34 DPI, resulting in no significant differences between caecal Salmonella counts of both diets. Overall, it was concluded that feeding a synergistic blend is effective in reducing caecal Salmonella in broiler chickens within the first 14 days after the initiation of the challenge.
I. INTRODUCTION
Salmonella spp. in poultry pose a serious risk for food safety. The complex nature of Salmonella infections in poultry requires a multifactorial solution. It is key to preventing Salmonella colonization throughout the entire gastrointestinal tract (GIT). Short chain fatty acids (SCFA) have been described as having beneficial effects in the upper part of the gut, whereas medium chain fatty acids (MCFA) target the lower GIT (Van Immerseel et al., 2009). Coated butyrate is described as having an effect in the lower GIT (Van Immerseel et al., 2005). Combining these three ingredients into one feed additive blend results in a targeted response to Salmonella throughout the GIT. In addition, since a microbial imbalance, due to overgrowth by organisms such as Salmonella, may cause a less efficient gut immune response, a fourth ingredient was considered. Hydrolyzed copra meal with ß-1,4 mannobiose as main ingredient has proven beneficial effects against Salmonella in vitro and in vivo in broiler chickens, in addition to activating the innate immune response in macrophages, supporting the natural host defense mechanisms (Agunos et al., 2007; Ibuki et al., 2011). It is hypothesized that feeding a synergistic blend containing SCFA, MCFA, hydrolyzed copra meal (containing ß-1,4 mannobiose) and microencapsulated sodium salts of butyric acid will reduce Salmonella colonization in the GIT of broiler chickens. Several studies have been performed around the globe to show effects of this synergistic blend; however due to differences in study design and geographic differences the results were not always consistent. Therefore, all these studies were combined into one meta-analysis, aimed at investigating the overall effect of the synergistic
1 Trouw Nutrition R&D, P.O. Box 299, 3800 AG Amersfoort, the Netherlands. E-mail: [email protected], [email protected]
Aust. Poult. Science Symp. 2022...33
70

blend on Salmonella colonization in Salmonella challenged broiler chickens, regardless of experimental conditions.
II. MATERIALS AND METHODS
Thirteen studies, conducted at various research institutes around the globe (Brazil, Spain, Thailand) were included in the meta-analysis. All included studies were performed at Trouw Nutrition research facilities or done at research institutes in collaboration with Trouw Nutrition. None of the studies were published, details on the study design per study are shown in Table 1. All studies were done in broiler chickens that were challenged with one of the Salmonellastrains (Enteritidis, Typhimurium, or Heidelberg). In each study, from day 1 onwards, the birdsreceived either a control diet, or the control diet with the synergistic blend (Fysal Fit-4, TrouwNutrition, the Netherlands) added to it. The synergistic blend was a proprietary mixture of shortchain fatty acids, medium chain fatty acids, hydrolyzed copra meal (containing 13% ß-1,4mannobiose) and microencapsulated sodium salts of butyric acid. The blend was dosed at 3kg/metric tonne in the first feeding phase, which varies in length up to maximum 23 days ofthe study, and 1 kg/metric tonne until the end of each study. In all 9 studies, quantitativeSalmonella counts were enumerated in the caecum at one or more different days varying perstudy. Caecal Salmonella counts are expressed as log colony forming units (CFU) per gramcaecal content.
The raw data containing caecal Salmonella counts of the studies were combined into one file. The data were analyzed in SAS using a mixed model including within and between study variation in the random and repeated statements. Data analysis was split into two statistical analyses. One contains the data between 0 and 14 days post inoculation (DPI), for which analysis 5 studies were included. The second contains data between 15 and 34 DPI, for which 8 studies were included.
Table 1 - Overview of studies included in the meta-analysis.
Country Study
duration (days)
Model Salmonella serovar
Day of inoculation
Included parameters1
Spain 32 Infection Enteritidis 7 15-34 DPISpain 42 Infection Typhimurium 8 15-34 DPI
Spain 35 Infection Enteritidis 8 0-14 DPI, 15-34DPI
Spain 32 Infection Enteritidis 7 0-14 DPI, 15-34DPI
Spain 42 Infection Enteritidis 8 0-14 DPI, 15-34DPI
Spain 33 Infection Enteritidis 7 15-34 DPISpain 33 Infection Typhimurium 7 15-34 DPI
Brazil 35 Seeder Heidelberg 3 0-14 DPI, 15-34DPI
Thailand 35 Infection Typhimurium 7 0-14 DPI1 0-14 DPI = Salmonella counts between days 0 and 14 post inoculation, 15-34 DPI = Salmonella counts between
days 15 and 35 post inoculation.
Aust. Poult. Science Symp. 2022...33
71
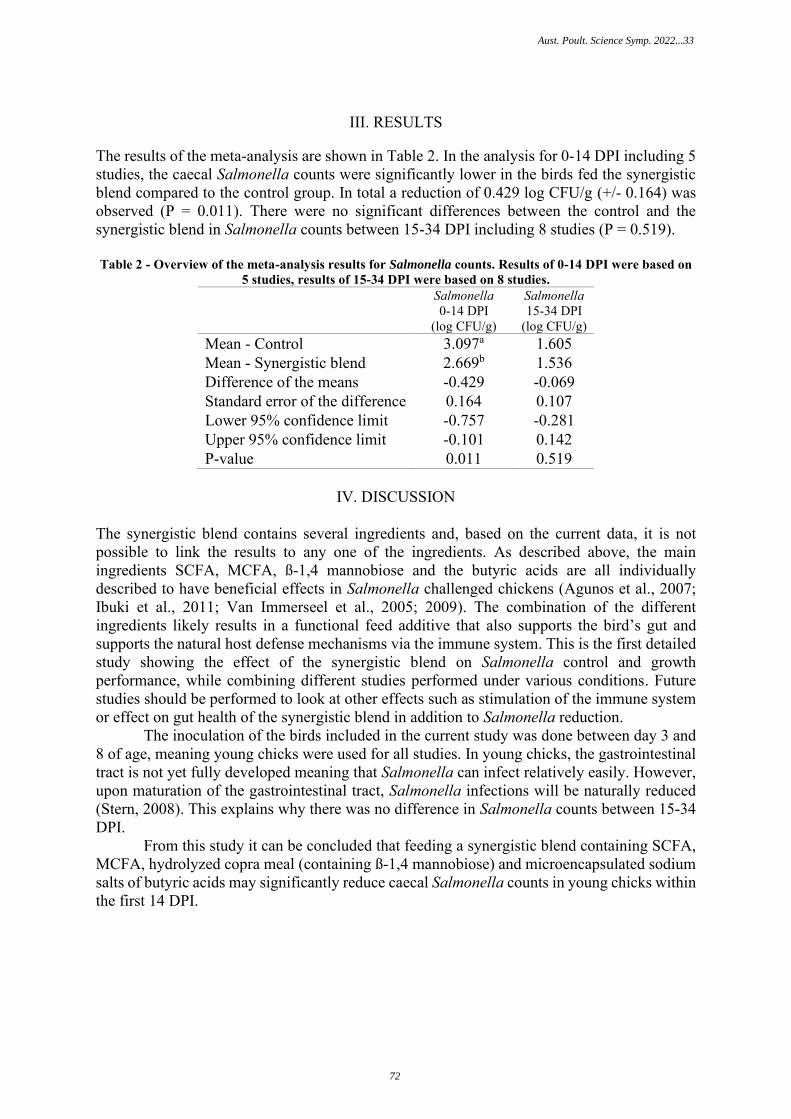
III. RESULTS
The results of the meta-analysis are shown in Table 2. In the analysis for 0-14 DPI including 5 studies, the caecal Salmonella counts were significantly lower in the birds fed the synergistic blend compared to the control group. In total a reduction of 0.429 log CFU/g (+/- 0.164) was observed (P = 0.011). There were no significant differences between the control and the synergistic blend in Salmonella counts between 15-34 DPI including 8 studies (P = 0.519).
Table 2 - Overview of the meta-analysis results for Salmonella counts. Results of 0-14 DPI were based on 5 studies, results of 15-34 DPI were based on 8 studies.
Salmonella 0-14 DPI
(log CFU/g)
Salmonella 15-34 DPI
(log CFU/g)Mean - Control 3.097a 1.605 Mean - Synergistic blend 2.669b 1.536 Difference of the means -0.429 -0.069Standard error of the difference 0.164 0.107Lower 95% confidence limit -0.757 -0.281Upper 95% confidence limit -0.101 0.142P-value 0.011 0.519
IV. DISCUSSION
The synergistic blend contains several ingredients and, based on the current data, it is not possible to link the results to any one of the ingredients. As described above, the main ingredients SCFA, MCFA, ß-1,4 mannobiose and the butyric acids are all individually described to have beneficial effects in Salmonella challenged chickens (Agunos et al., 2007; Ibuki et al., 2011; Van Immerseel et al., 2005; 2009). The combination of the different ingredients likely results in a functional feed additive that also supports the bird’s gut and supports the natural host defense mechanisms via the immune system. This is the first detailed study showing the effect of the synergistic blend on Salmonella control and growth performance, while combining different studies performed under various conditions. Future studies should be performed to look at other effects such as stimulation of the immune system or effect on gut health of the synergistic blend in addition to Salmonella reduction.
The inoculation of the birds included in the current study was done between day 3 and 8 of age, meaning young chicks were used for all studies. In young chicks, the gastrointestinal tract is not yet fully developed meaning that Salmonella can infect relatively easily. However, upon maturation of the gastrointestinal tract, Salmonella infections will be naturally reduced (Stern, 2008). This explains why there was no difference in Salmonella counts between 15-34 DPI.
From this study it can be concluded that feeding a synergistic blend containing SCFA, MCFA, hydrolyzed copra meal (containing ß-1,4 mannobiose) and microencapsulated sodium salts of butyric acids may significantly reduce caecal Salmonella counts in young chicks within the first 14 DPI.
Aust. Poult. Science Symp. 2022...33
72

REFERENCES
Agunos A, Ibuki M & Yokomizo F (2007) British Poultry Science 48(3): 331-341. Ibuki M, Kovacs-Nolan J, Fukui K, Kanatani H & Mine Y (2011) Veterinary Immunology
and Immunopathology 139: 289-295. Stern NJ (2008) Poultry Science 87: 2399-2403. Van Immerseel F, Boyen F, Gantois I, Timbermont L, Bohez L, Pasmans F, Haesebrouck F
& Ducatelle R (2005) Poultry Science 84: 1851-1856. Van Immerseel F, De Zutter L, Houf K, Pasmans F, Haesebrouck F & Ducatelle R (2009)
World’s Poultry Science Journal 65: 367-392.
Aust. Poult. Science Symp. 2022...33
73

MAPPING VARIATION OF CORN DDGS BY IN VIVO-BASED NIR MODELS
L.H. ZHANG1 and Y.G. LIU1
Summary
Corn DDGS can be a valuable ingredient for poultry diets but its variation has been a real concern for procurement, quality control and formulators. This article describes advanced NIR calibration models based on wide representativeness of samples, accurate wet chemistry data plus in vivo determination on digestible nutrients. The NIR prediction results of 2433 samples collected from Southeast Asia showed average crude protein 295.4 ± 17.1 g/kg, crude ash 43.6 ± 4.0 g/kg, crude fats 83.2 ± 11.5 g/kg, and crude fibre 74.2 ± 5.5 g/kg. Crude fats carried the highest variation (CV 13.9%), followed by crude ash (CV 9.2%). Corn DDGS was rich in Leu (34.5 g/kg) but deficient in Trp (2.4 g/kg). The variation of essential total amino acids (TAA) ranged from CV 4.7 to 7.1%. Mean apparent metabolisable energy (AME) value was 9.81 MJ/kg, with a large range from 6.86 to 12.2 MJ/Kg. Similarly, nitrogen corrected AME (AMEn) was from 6.50 to 11.38 MJ/Kg with a standard deviation 0.79 MJ/kg. These results revealed considerable diversity among the corn DDGS sources currently used in Southeast Asia, and the advantages of using the advanced NIR technology to assess nutritive quality that enables informed procurement and usage of corn DDGS in the diet formulation.
I. INTRODUCTION
Increasing ethanol production from cereal grains generates huge quantities of dried distillers’ grain with solubles (DDGS). As corn DDGS is rich in protein and energy it was commonly used for ruminants. In recent years, the high cost and supply shortage of common feed ingredients have prompted poultry producers to adopt DDGS in formulations. DDGS is known for its variation. During the past 10 years, we’ve seen evolutions in the ethanol industry and new technologies used in order to improve ethanol yield and profitability. These changes may not necessarily improve the quality and consistency of DDGS. Thus, it is important to determine the value and monitor the variation of DDGS of each batch, in a rapid yet reliable manner, for procurement and optimum usage in formulation. Classical evaluation on DDGS includes analyses of proximate nutrients by wet chemistry and colour density by visual check. This paper describes our latest Near Infrared Spectroscopy (NIRs) models developed for DDGS and the quality variation of 2433 DDGS samples uploaded by feed producers across the Asia Pacific region, for proximate composition and digestible nutrients.
II. NIR MODELS FOR DDGS
We have collected 764 corn DDGS samples globally and analyzed for their proximate composition and total amino acids (TAA). We determined standardised ileal amino acid digestibility (SID AA) using in vivo model based on adult caecectomized cockerels, following the method described by Green at al. (1987). We also measured AME values of more than 130 corn DDGS samples through in vivo measurements using 3-week-old male broilers, following European reference method (Bourdillon et al., 1990) with ad libitum feeding and total excreta collection. All these corn DDGS samples were analyzed for their absorbances in the NIR region from 1100 to 2500 nm. Correlations between spectra characterizations and reference data were developed using partial least squares (PLS) regression technique. Performance of prediction models was reported as the standard error of calibration (SEC), standard error of cross
1 Adisseo Asia Pacific, Singapore; [email protected]
Aust. Poult. Science Symp. 2022...33
74

validation (SECV) and calibration R2. The accuracy of the calibrations was validated with external samples and expressed by the standard error of prediction (SEP).
Table 1 shows the wet chemistry and in vivo results of these corn DDGS samples used for the calibrations and their performance statistics. The results indicate a wide range of sample set used for the calibration development. Crude protein of these 764 corn DDGS samples ranged from 152.0 to 434.0 g/kg, total lysine 7.52 g/kg (range 3.6 – 11.8 g/kg) with digestibility ranging from 45.2% to 80.6% (average = 55.67%). The values of R2 for CP, TAA and SID AA were higher than 0.77 (range 0.77 – 0.97), with ratio of standard deviation (SD) to standard error of calibration (SEC) close or above 3.
Table 1- Database description of NIRs calibration and statistics of corn DDGS N Min. Max. Mean SD SEC R2 SECV
CP, g/kg 764 152.0 434.0 271.7 43.3 7.2 0.97 8.8 T Lys, g/kg 358 3.6 11.8 7.52 1.53 0.74 0.77 0.84 T Met, g/kg 361 3.6 9.6 5.17 0.98 0.30 0.91 0.32 T Cys, g/kg 362 2.3 10 5.52 1.21 0.43 0.87 0.49 T Thr, g/kg 357 7.5 15.2 10.45 1.34 0.54 0.84 0.61 SID Lys, % 107 45.2 80.6 55.67 16.77 6.93 0.83 9.15 SID Met, % 111 76.5 93.3 82.24 8.36 2.13 0.94 2.77 SID Cys, % 111 48.7 79.8 58.53 16.37 4.33 0.93 6.82 SID Thr, % 110 41.3 83.5 68.68 11.04 4.01 0.87 5.75 AME, MJ/kg 136 7.27 13.61 10.32 1.51 0.68 0.80 -
Min = minimum, Max = Maximum, SD = standard deviation, Standard error of calibration (SEC), standard error of cross validation (SECV), T = total and SID = standardized ileal digestible
We have noticed other authors also reported AME prediction equations (Rochell et al., 2011, Jie et al., 2013, Meloche et al. 2013, Losada et al., 2015), based on limited batches of corn DDGS (usually from 6 - 30), and their residual standard deviation (RSD) ranged from 0.38 to 0.82 MJ/kg depending on the variables they reported. The best RSD 0.23 MJ/kg was from an equation developed by Losada et al. (2015), with 6 corn DDGS just derived from crude protein. In contrast, our in vivo based AME NIR calibrations included a calibration set ranging from 7.27 to 13.61 MJ/kg with average value 10.32 MJ/kg. High correlations were also noted for AME with R2 of 0.80. Considering the high variability and in particular the wide range of quality of our calibration set, our in vivo based AME NIRs model with 0.68 MJ/kg is appears to be more representative and reliable than previous models, as confirmed by external validation of 0.54 MJ/kg (SEP) using in vivo determination.
Thereafter, we integrated individual NIR database or equations into an online platform called Precise Nutrition Evaluation (PNE), which offers fast and robust tool for feed producers to obtain nutritional value, evaluate variability, track suppliers, and control formulation cost at their own convenience.
III. CORN DDGS USED IN SOUTHEAST ASIA
Following the above model development, from June 2020 to June 2021, our PNE platform received in total 2433 corn DDGS samples. All these samples were scanned on Adisseo standardized and validated NIR instruments at feed mill level. These samples were predicted for their proximate (PROX), namely dry matter (DM), crude protein (CP), ash (Ash), crude fiber (CF) and fats (Fat), TAA and SID AA, AME and AMEn.
Substantial variations were observed for all nutrition parameters, except for dry matter (Table 2). From the usual proximate parameters, the average corn DDGS contains: CP 295.4
Aust. Poult. Science Symp. 2022...33
75

g/kg, Ash 43.6 g/kg, Fat 83.2 g/kg, CF 74.2 g/kg. Coefficient of variation (CV) was 13.9% for Fat, 9.2% for Ash, 7.5% for CF and 5.8% for CP. Corn DDGS was rich in Leu but deficient in Trp. Essential TAA had CV ranging from 4.7 to 7.1%.
Table 2 – Contents of proximate compositions, total essential amino acids of corn DDGS Mean Min Max SD CV, %
PROX (N = 2433), g/kg as fed DM 888.9 832.8 928.6 9.8 1.1 CP 295.4 218.9 487.8 17.1 5.8 Ash 43.6 29.7 56.8 4.0 9.2 Fat 83.2 49.7 129.2 11.5 13.9 CF 74.2 20.8 93.7 5.5 7.5 TAA (N = 1890), g/kg as fed Lys 8.5 5.8 10 0.5 6.1 Met 5.7 4.2 7.7 0.3 6.0 Cys 5.6 3.7 8.1 0.4 7.1 Thr 11.3 8.4 13.6 0.5 4.7 Trp 2.4 1.8 2.9 0.2 6.3 Val 14.5 10.9 19.1 0.8 5.5 Ile 11.3 8.5 15.3 0.6 5.7 Leu 34.5 24.8 48.1 2.4 7.0 His 7.3 5.6 9.3 0.4 5.3 Arg 12.2 8.4 14.8 0.8 7.0
Standardized ileal digestibility amino acid (SID AA) CV ranged from 3.4% for SID Met and SID Leu to 12.6% for SID Cys. Mean value of AME for these corn DDGS samples was 9.81 MJ/kg with a minimum value 6.86 and maximum value 12.2 MJ/Kg. Nitrogen corrected AME (AMEn) was from 6.50 to 11.38 MJ/Kg with a standard deviation 0.79 MJ/kg. These results suggest considerable diversity among the corn DDGS sources which warrant a real time monitoring on the variability by screening every batch for its specific digestible nutrients. NIRs with in vivo based digestible nutrients database is a great tool used by feed mill for such monitoring.
IV. CONCLUSION
Corn DDGS is a valuable ingredient for poultry diets but its variation has been a real concern. Our advanced NIR calibration models are based on wide sample representativeness, accurate wet chemistry data plus in vivo determinations, with prediction reliability confirmed by their performance statistics and external validation. This report summarized results of 2433 samples collected from Southeast Asia, showing the average crude protein 295.4 g/kg, crude ash 43.6 g/kg, crude fats 83.2 g/kg, and crude fibre 74.2 g/kg. Crude fats carried the highest variation (CV 13.9%), followed by crude ash (CV 9.2%). Corn DDGS was rich in Leu (34.5 g/kg) but deficient in Trp (2.4 g/kg). Essential TAA had CV from 4.7 to 7.1%. Mean AME value was 9.81 MJ/kg, with a considerable range from 6.86 to 12.2 MJ/Kg. Nitrogen corrected AME (AMEn) was from 6.50 to 11.38 MJ/Kg with a standard deviation 0.79 MJ/kg. These results revealed a considerable diversity among the corn DDGS sources used in Southeast Asia, and advanced NIR technology allows rapid and precise assessment, which enables informed procurement and the formulation by using “true” value to achieve expected performance results.
Aust. Poult. Science Symp. 2022...33
76

Table 3. SID essential amino acids, AME and AMEn of corn DDGS Mean Min Max SD CV, %
SID AA (N = 1546), % SID Lys 69.4 35.5 92.2 7.3 10.5 SID Met 90.9 75.4 98.7 3.1 3.4 SID Cys 69.0 32.5 91.4 8.7 12.6 SID Thr 84.4 54.7 98.7 5.7 6.8 SID Trp 83.6 59.3 99.6 6.5 7.7 SID Val 89.5 70.3 99.6 4.6 5.1 SID Ile 88.6 69.7 97.2 4.3 4.8 SID Leu 93.5 82.4 99.9 3.2 3.4 SID His 88.1 59.8 99.4 5.4 6.1 SID Arg 93.1 72.3 99.9 4.7 5.0 AME and AMEn (N = 2351), MJ/kg as fed AME 9.81 6.86 12.20 0.82 8.4 AMEn 9.14 6.50 11.38 0.79 8.6
REFERENCES
Bourdillon A, Carré B, Conan L, Frankesch M, Fuentes M, Huyghebaert G, Janssen WMMA, Leclerq B, Lessire M, McNab JM, Rigoni M & Wiseman J (1990) British Poultry Science 31: 567-576.
Green S, Bertrand SL, Duron MJC & Maillard R (1987) British Poultry Science 28: 631-641. Jie, YZ, Zhang, JY, Zhao, LH, Ma QG & Ji C (2013) Journal of Animal Science and
Biotechnology 4: 38. Losada B, De Blas C, García-Rebollar P, Cachaldora P, Méndez J & Ibáñez M (2015) Spanish
Journal of Agricultural Research 13: 02-06. Meloche KJ, Kerr BJ, Shurson GC & Dozier III WA (2013) Poultry Science 92: 3176-3183. Rochell SJ, Kerr BJ & Dozier III WA (2011) Poultry Science 90: 1999-2007.
Aust. Poult. Science Symp. 2022...33
77

ARGININE AND ENERGY EFFICACY OF GUANIDINO ACETIC ACID IN BROILER CHICKENS
B. SAREMI1 and J. MILLECAM2
Summary
The eventual energy and arginine sparing effects of Guanidino acetic acid (GAA) was investigated. In two parallel experiments using in total 3000 male Ross 308 chickens, either a dose response to GAA or arginine (Arg) was used to determine the efficacy of GAA to provide Arg saving in broilers (experiment 1) or the potential of GAA was investigated in diets with 0.21 (negative control 1) or 0.42 (negative control 2) MJ lower energy than a positive control group (experiment 2). 200 pens were divided between the two experiments. Broilers were weighed and feed intake was measured on days 0, 10, 24, and 35. Feed conversion ratio (FCR) and daily weight gain (DWG) were calculated. Four birds per pen were slaughtered and carcass, breast and leg weights were recorded. Statistical analysis was done using a quadratic polynomial model (experiment 1) or one-way ANOVA (experiment 2) to determine the efficacy of GAA. On average, GAA was determined to provide 59.6% Arg sparing in an age dependent manner. An energy sparing effect of GAA could not be established.
I. INTRODUCTION
Guanidino acetic acid (GAA) is a naturally occurring metabolite which is synthesized in the kidney by L-arginine-glycine amidinotransferase (AGAT) using glycine and arginine (Arg) as substrate (Brosnan et al. 2009). Then, GAA is methylated to creatine in the liver using GAA N-methyltransferase (GAMT). Feeding GAA to humans and animals increases creatine inblood and muscle tissues (Ostoic et al. 2013; DeGroot et al. 2018). High creatine in blood hasan inhibitory feedback on AGAT which is known as a rate limiting enzyme in creatine synthesis(Edison et al. 2007, McGuire et al. 1984, Van Pilsem et al. 1971). Thus, GAA is speculated tohave Arg sparing effects in broilers. Creatine is an important molecule in energy homeostasisin muscle (Brosnan et al. 2009). In the literature, several groups attempted to research aconnection between GAA and efficiency of energy utilization in broilers (Majdeddin et al.2019; Ale Saheb Fosoul et al. 2018). It is also claimed that GAA can provide 347.5-695 MJper kg of AMEn (CreAmino, Alzchem, DE; GuanAmino, Evonik, DE) when it is added as afeed additive to a broiler feed. This amount of energy will provide a reduction of 0.21-0.42MJ/kg of feed by adding 0.06% of GAA in a feed making the diet cheaper. Approximatelythree quarters of the feed costs are represented by costs for dietary energy. Therefore, anaccurate estimation of the energetic value of raw materials is extremely important to reduce thefinal cost of poultry feed. Prediction of AMEn for different raw materials is affected by theinclusion rate of specific raw materials in the feed (Lopez and Leeson, 2008). Moreover, thereis an interaction with other raw materials such as fat and oil. There is also a wide variation inAMEn within and between grain species (Black et al. 2005). For example, the average ilealdigestible energy value for different corn samples was 13.42 MJ/kg DM with a standarddeviation of 2.04 MJ/kg DM (D'Alfonso, 2005). This high variation can lead to inaccuracy inmeeting the energy requirement of birds. Consequently, it creates room for false negativeresults when a reduction in energy content of feed is under investigation. Herein, the energysparing effect of GAA is investigated using enough positive and negative controls. Moreover,efficacy of GAA to replace Arg is determined.
1 Poulpharm BVBA, Prins-Albertlaan 112, 8870 Izegem, Belgium; [email protected] 2 Main Airport Center, Unterschweinstiege 2-14, 60549 Frankfurt am Main, Germany; [email protected]
Aust. Poult. Science Symp. 2022...33
78

II. METHOD
Care and use of animals was in accordance with the principles and guidelines presented in Guide for the Care and Use of Agricultural Animals and Research and Teaching (Federation of Animal Sciences Societies, 2010). Male Ross 308 birds (n=3000) were allocated to 200 pens. Pens were divided between two experiments running in parallel. Experiment 1 consisted of 13 treatment groups. A basal diet deficient in Arg (1.02, 0.88, and 0.75% SID Arg in starter, grower and finisher phases, respectively) was supplemented with 0.06, 0.12, 0.18, 0.30, 0.45, 0.61% of either L-Arg (CJ Europe BestAmino, DE; 98.5% purity) or GAA (Alzchem, DE; 96% purity). All the other nutrients were formulated to meet the Aviagen (2019) recommendations
Table 1 – Basal diets characteristics in the arginine deficient groups (Experiment 1)
Ingredient Name Starter (0-10 days) Grower (10-24 days) Finisher (24-35 days) Corn 50.00 55.00 69.87 Soybean meal 20.36 14.38 8.86 Rape Seed Meal 8.00 10.00 5.18 Corn starch 6.00 Corn gluten meal 5.55 5.10 10.00 Corn gluten feed 2.78 6.76 Soy oil 1.98 4.27 1.34 DCP 1.60 0.95 1.14 Limestone 1.06 0.92 0.96 L-Lysine HCL 0.61 0.59 0.62 Broiler premix 0.50 0.50 0.50 Salt 0.37 0.37 0.39 L-Methionine 0.37 0.32 0.24 L-Threonine 0.29 0.26 0.21 L-Glycine 0.27 0.33 0.51 L-Isoleucine 0.15 0.16 0.11 L-Valine 0.11 0.08 0.06 L-Tryptophane 0.02 0.02 0.04 Nutrient composition % AMEn Broiler (MJ/kg) 12.39 12.77 13.19 Crude Protein 21.43 20.12 18.11 Crude Fat 5.49 8.12 5.56 Crude Fiber 3.32 3.70 2.89 Ash 6.15 5.41 4.95 Calcium 0.90 0.70 0.70 Available Phosphorous 0.42 0.32 0.32 SID Lysine 1.28 1.15 1.03 SID Methionine 0.65 0.59 0.52 SID Met Plus Cys 0.95 0.87 0.80 SID Arginine 1.02 0.88 0.75 SID Threonine 0.86 0.77 0.69 SID Leucine 1.63 1.48 1.70 SID Isoleucine 0.86 0.78 0.71 SID Valine 0.96 0.87 0.78 SID Tryptophan 0.20 0.18 0.16 SID Phenylalanine 0.86 0.78 0.75 SID Histidine 0.47 0.44 0.39 Choline 1439 1492 1030 Starch 34.63 38.07 46.94
DCP: Dicalcium phosphate; SID: Standardized ileal digestibility; Met: Methionine; Cys: Cysteine; AMEn: Apparent metabolizable energy corrected for nitrogen; empty cells are equal to zero.
Aust. Poult. Science Symp. 2022...33
79

(Table 1). Experiment 2 consisted of 5 treatment groups: T1) A positive control (PC) diet meeting the nutrient specifications according to Aviagen (2019); T2 and T3) Two negative controls (NC1= PC-0.21 MJ/kg AMEn and NC2=PC-0.42 MJ/kg AMEn) to test the sensitivity to lack of energy; T4) 0.06% GAA was added to NC1 diet as a basal; T5) 0.12% GAA was added to NC2 diet as a basal (Table 2). The body weight (BW), DWG, daily feed intake (DFI) and FCR were measured at the end of each growth phase (day 0, 10, 24, and 35). Birds were slaughtered at day 35 (4 birds per pen). Carcass, breast meat and leg weight were measured. Data from experiment 1 were analysed with R (version 3.2.5.). A quadratic polynomial model was used to compare the birds’ response to different doses of Arg and GAA below and above the known Arg requirements (Aviagen, 2019). The dosage of each additive for the maximum performance was estimated and a ratio of the Arg to GAA dose was defined as bio-efficacy in percentage. Data from experiment 2 were analysed using ANOVA (P<0.05).
Table 2 – Diet characteristics (Experiment 2)
Ingredient Name Starter (0-10 days) Grower (10-24 days) Finisher (24-35 days) PC NC1 NC2 PC NC1 NC2 PC NC1 NC2
Corn 39.70 41.00 42.30 38.40 39.70 40.99 40.21 41.51 42.81 Soybean meal 33.24 33.00 32.77 29.16 28.93 28.69 21.70 21.46 21.23 Wheat 20.00 20.00 20.00 25.00 25.00 25.00 30.00 30.00 30.00 Soy oil 2.32 1.25 0.18 3.36 2.29 1.22 3.99 2.91 1.84 DCP 1.63 1.63 1.62 1.08 1.08 1.07 1.15 1.14 1.14 Limestone 1.08 1.08 1.08 0.91 0.92 0.92 0.92 0.93 0.93 Broiler premix 0.50 0.50 0.50 0.50 0.50 0.50 0.50 0.50 0.50 Salt 0.38 0.38 0.38 0.39 0.39 0.39 0.39 0.40 0.40 L-Methionine 0.37 0.37 0.37 0.32 0.32 0.31 0.30 0.30 0.30 L-Lysine HCL 0.37 0.37 0.38 0.32 0.32 0.33 0.38 0.39 0.39 L-Threonine 0.23 0.23 0.23 0.18 0.18 0.18 0.20 0.20 0.20 L-Arginine 0.12 0.13 0.13 0.09 0.09 0.09 0.16 0.16 0.16 L-Valine 0.04 0.04 0.04 0.01 0.01 0.01 0.04 0.04 0.04 L-Isoleucine 0.03 0.03 0.03 0.01 0.01 0.01 0.06 0.06 0.07 L-Glycine 0.28 0.28 0.28 Nutrient composition % AMEn Broiler (MJ/kg) 12.39 12.18 11.97 12.77 12.56 12.35 13.19 12.98 12.77 Crude Protein 22.80 22.80 22.80 21.18 21.18 21.18 18.59 18.59 18.59 Crude Fat 5.27 4.25 3.24 6.29 5.28 4.26 6.97 5.96 4.94 Crude Fiber 2.67 2.69 2.71 2.62 2.64 2.67 2.53 2.55 2.57 Ash 6.40 6.40 6.39 5.53 5.53 5.52 5.25 5.25 5.24 Calcium 0.90 0.90 0.90 0.70 0.70 0.70 0.70 0.70 0.70 Available Phosphorous 0.42 0.42 0.42 0.32 0.32 0.32 0.32 0.32 0.32 SID Lysine 1.28 1.28 1.28 1.15 1.15 1.15 1.03 1.03 1.03 SID Methionine 0.64 0.63 0.63 0.57 0.57 0.57 0.53 0.53 0.52 SID Met Plus Cys 0.95 0.95 0.95 0.87 0.87 0.87 0.80 0.80 0.80 SID Arginine 1.37 1.37 1.37 1.23 1.23 1.23 1.10 1.10 1.10 SID Threonine 0.86 0.86 0.86 0.77 0.77 0.77 0.69 0.69 0.69 SID Leucine 1.54 1.54 1.54 1.43 1.44 1.44 1.25 1.25 1.25 SID Isoleucine 0.86 0.86 0.86 0.78 0.78 0.78 0.71 0.71 0.71 SID Valine 0.96 0.96 0.96 0.87 0.87 0.87 0.78 0.78 0.78 SID Tryptophan 0.23 0.23 0.23 0.21 0.21 0.21 0.18 0.18 0.17 SID Phenylalanine 0.93 0.93 0.93 0.86 0.86 0.86 0.73 0.73 0.73 SID Histidine 0.50 0.50 0.50 0.47 0.47 0.47 0.40 0.40 0.40 Choline 1313 1314 1315 1233 1234 1235 1077 1079 1080 Starch 39.78 40.60 41.42 41.84 42.65 43.47 45.70 46.52 47.34
DCP: Dicalcium phosphate; SID: Standardized ileal digestibility; Met: Methionine; Cys: Cysteine; AMEn: Apparent metabolizable energy corrected for nitrogen; empty cells are equal to zero. PC: positive control; NC: Negative control.
Aust. Poult. Science Symp. 2022...33
80

III. RESULTS
In experiment 1, on average 59.6% of the GAA dose was required to create a comparable performance response with Arg. Approximately 46, 77 and 55% of the GAA dose was needed to achieve the maximum BW when using Arg at the end of starter, grower, and finisher phases, respectively (Table 3). Similarly, to achieve the maximum DWG, approximately 46, 84, 44 and 57% of GAA dose was required during the starter, grower, finisher or during the whole growth period, respectively, to reach a similar response with Arg (Table 3). GAA had a negative impact on BW and DWG at higher doses when added more than 0.18% GAA to an Arg deficient feed. Feed intake was increased in response to Arg or GAA addition. However, GAA had a negative impact on feed intake in an age dependent manner. Efficacy of Arg compared with GAA during the grower, finisher or during the whole growth period was 73, 39, or 44%, respectively (Table 3). During the starter phase, GAA created only a negative impact on feed intake thus Arg efficacy determined to be infinite. Feed conversion ratio was improved by both Arg and GAA. However, GAA had a detrimental impact on FCR at doses higher than 0.18%. Efficacy of GAA vs. Arg was defined equal to 50, 102, 61, and 78% during the starter, grower, finisher and the whole growth period, respectively (Table 3). At day 35, maximum slaughter performances (live weight, carcass weight, breast weight and leg weight) were also achieved with less Arg compared with GAA (56, 53, 51, and 56%, respectively) (Table 3).
Table 3 – Maximum response (MR; gram), the dose required to achieve the MR (%) and the efficacy (Eff.) of GAA (%) to replace Arg (Experiment 1)
MR Dose Eff. MR Dose Eff. BW at Day 10 DFI (Day 0-10)
Arg 295 0.07 Ref. Arg 26.3 0.31 Ref. GAA 275 0.16 46 GAA 26.3 0.00 Infinite
BW at Day 24 DFI (Day 10-24) Arg 1343 0.20 Ref. Arg 95.7 0.15 Ref.
GAA 1269 0.26 77 GAA 93.0 0.20 73 BW at Day 35 DFI (Day 24-35)
Arg 2325 0.16 Ref. Arg 176.9 0.11 Ref. GAA 2109 0.28 55 GAA 160.5 0.28 39
DWG (Day 0-10) DFI (Day 0-35) Arg 25.3 0.07 Ref. Arg 101.1 0.11 Ref.
GAA 23.3 0.16 46 GAA 94.4 0.25 44 DWG (Day 10-24) FCR (Day 0-10)
Arg 74.8 0.23 Ref. Arg 1.034 0.17 Ref. GAA 71.1 0.27 84 GAA 1.084 0.34 50
DWG (Day 24-35) FCR (Day 10-24) Arg 89.8 0.14 Ref. Arg 1.261 0.32 Ref.
GAA 77.1 0.32 44 GAA 1.279 0.32 102 DWG (Day 0-35) FCR (Day 24-35)
Arg 65.2 0.16 Ref. Arg 1.902 0.22 Ref. GAA 59.0 0.29 57 GAA 2.025 0.36 61
Breast weight FCR (Day 0-35) Arg 457 0.15 Ref. Arg 1.527 0.26 Ref.
GAA 388 0.30 51 GAA 1.576 0.33 78 Leg weight Carcass weight
Arg 658 0.15 Ref. Arg 1765 0.15 Ref. GAA 597 0.27 56 GAA 1572 0.28 53
BW: Body weight; DWG: Daily weight gain; DFI: Daily feed intake; FCR: Feed conversion ratio.
Aust. Poult. Science Symp. 2022...33
81

In experiment 2, feed intake was not affected by 0.21 or 0.42 MJ/kg reduction in dietary energy (Table 4). In the starter phase, adding 0.12% GAA to a feed lower in energy by 0.42 MJ/kg caused a reduction in feed intake. In the finisher phase and the entire production period 0-35, a similar reduction in feed intake happened when birds were fed with 0.06% GAA compared to the NC1 diet. FCR was not affected by treatments during the grower, finisher, or the whole growth period. During the starter period, NC2 caused an increase in FCR, but the other groups stayed irresponsive (Table 4). Slaughter data demonstrated that breast meat weight does not respond to any of the treatment groups.
Table 4 – Least square means of body weight (BW; gram), daily feed intake (DFI; gram), feed conversion ratio, and breast weight (gram) in response of treatments (Experiment 2)
Treat BW 10
BW 24
BW 35
DFI 0-10
DFI 10-24
DFI 24-35
DFI 0-35
FCR 0-10
FCR 10-24
FCR 24-35
FCR 0-35
Breast weight
PC 302.2 1355 2396ab 27.7ab 98.5 164.4ab 98.6ab 1.07b 1.32 1.75 1.48 521 NC1 303.3 1374 2460 a 28.2ab 100.5 168.8a 100.7a 1.08b 1.32 1.72 1.47 523 NC2 302.1 1358 2412ab 28.7a 100.4 167.8a 100.7a 1.11a 1.33 1.76 1.49 527 0.06% GAA 304.2 1359 2369 b 27.8ab 98.9 159.7b 97.0b 1.07b 1.32 1.77 1.48 512
0.12% GAA 301.2 1358 2384ab 27.7b 99.7 164.4ab 99.0ab 1.08b 1.32 1.77 1.49 533
SEM 2.9 10 29 0.3 0.9 2.4 1.0 0.01 0.01 0.03 0.01 8 PC: positive control; NC: negative control; 0.06% GAA is added to NC1; 0.12% GAA is added to NC2; BW: Body weight; DFI: Daily feed intake; FCR: Feed conversion ratio; Numbers after BW, DFI, and FCR represent days.
IV. DISCUSSION
GAA is a pro-oxidant, a methyl group scavenger, and a precursor of creatine. GAA’s application as a feed additive needs to be carefully monitored because its efficacy is highly depending on availability of methyl donors (EFSA, 2016). Herein, we observed a negative impact of GAA on performance parameters with a dose higher than 0.18% when GAA is added to an Arg deficient diet. The impact of adding comparable amounts of GAA to an Arg adequate diet stays to be elucidated.
Using a semi-purified broiler feed, Dilger et al. (2013) attempted to define the efficiency of GAA. Adding 0.06, 0.12, 0.39, 0.78% GAA to an Arg deficient diet (0.88% Arg) could not match the performance results (212 vs. 145 grams weight gain; 8 to 17 days post hatch) with the deficient diet supplemented with 1% Arg (source of L-Arg was not mentioned: unknown purity). Dilger et al. (2013) in another experiment using a semi-purified diet, compared the efficacy of GAA with Arg using an exponential response model. However, in this experiment in both groups the response was created with graded levels of Arg in two different basal diets: with or without GAA inclusion (0.12% vs. 0%). Dilger et al. (2013) concluded that GAA is an efficacious Arg source under Arg deficient conditions because there was a difference between the two groups when less than 0.4% L-Arg was supplemented to the deficient diet (0.88% SID Arg) and no response was found when more than 0.4% L-Arg was supplemented to the basal diet. According to the current broiler Arg recommendations (1.37% SID Arg in starter broilers; Aviagen, 2019), 0.88% SID Arg is considered a severely deficient diet in Arg. Nevertheless, a quantitative efficacy number was not provided. Herein, we defined the efficacy of GAA and compared it with Arg. On average, GAA could be replaced with 59.6% Arg to achieve a similar maximum performance. During the starter phase, a linear negative impact of GAA on feed intake and a less efficiency of GAA (47.3%) was observed in very young birds.
Broilers response to different levels of energy is highly dependent on the magnitude of energy reduction or addition in the feed. Recent literature has used a stepwise increase or decrease in dietary energy equal to 0.52 to 0.63 MJ/kg feed to test the response to different
Aust. Poult. Science Symp. 2022...33
82

energy levels (Barekatain et al. 2021; Maharjan et al. 2020). Others have gone one step further and used true metabolized energy (TME) and measured the TME of the applied raw materials to make sure that they will see a response to energy by means of increasing their accuracy (Naranjo, 2018). Lower magnitudes of a change in energy content of feed (AMEn 25-50 kcal/kg of feed) have led to a conclusion that birds do not respond to different energy levels (Dozier and Gehring, 2014). Herein, we also did not observe a response of broilers to a lack of 0.21 or 0.42 MJ AMEn in their feed as compared to the positive control group except for FCR in the starter phase causing a higher FCR, an effect which was not repeated in grower and finisher phase.
GAA is suggested to improve energy homeostasis in muscle tissue because of the data showing extra creatine phosphate and free creatine in muscle tissue (DeGroot et al. 2019). This is often misinterpreted giving GAA an energy matrix value between 83.000 and 166.000 kcal/kg. There is contradiction in the literature regarding the energy saving effect of GAA. On one hand, a negative impact of GAA on growth parameters is observed, especially under deficient or sufficient methionine levels (Majdeddin et al. 2019). On the other hand, a positive impact of GAA is concluded when it is added on top of an energy deficient feed (Ale Saheb Fosoul et al. 2018). Herein, addition of GAA to an energy deficient diet had no positive impact on performance parameters.
In conclusion, the Arg sparing effect of GAA depends on age and on the Arg content of the basal diet. Currently, it is two sized solutions (77% and 149% Arg sparing) for all animal species at different ages. According to our findings, GAA can provide on average 59.6% Arg sparing in broiler chickens. Moreover, GAA is not recommended to be used in young chickens because GAA linearly caused a reduction in their feed intake. In general, a reduction or increase in feed energy levels less than 0.52-0.63 MJ AMEn/kg is a challenge to be measured in broilers. In this study, GAA did not bring any extra energy value into the feed. Thus, it is recommended to use the energy content of GAA as a molecule (10.33 MJ/kg of GAA) instead of an energy sparing value.
REFERENCES
Ale Saheb Fosoul S, Azarfar A, Gheisari A & Khosravinia H (2018) British Journal of Nutrition 120: 131-140. Aviagen (2019) Ross Broiler Nutrient Specifications. https://en.aviagen.com/assets/
Tech_Center/Ross_Broiler/RossBroilerNutritionSpecs2019-EN.pdf. Barekatain R, Romero LF, Sorbara JOB & Cowieson AJ (2021) Animal Nutrition doi.org/10.1016/j.aninu.2020.12.003. Black JL, Hughes RJ, Nielsen SG, Tredrea AM, MacAlpine R & van Barneveld RJ (2005) Proceedings of Australian Poultry
Science Symposium 17: 21-29. Brosnan JT, Wijekoon EP, Warford-Woolgar L, Trottier NL, Brosnan ME, Brunton JA & Bertolo RFP (2009) The Journal of
Nutrition 139: 1292–1297. D'Alfonso TH (2005) Krmiva 47: 83-86. DeGroot AA, Braun U & Dilger RN (2019) Poultry Science 98: 2896–2905. DeGroot AA, Braun U & Dilger RN (2018) Poultry Science 97: 890–900. Dilger RN, Bryant-Angeoni K, Payne RL, Lemme A & Parsons CM (2013) Poultry Science 92: 171–177. Dozier WA & Gehring CK (2014) Journal of Applied Poultry Research 23: 494-500. Edison EE, Brosnan ME, Meyer C & Brosnan JT (2007) American Journal of Physiology-Renal Physiology 293: F1799-804. EFSA (European Food Safety Authority) (2016) The EFSA Journal 14:4394. Federation of Animal Sciences Societies (2010) 3ed. ISBN: 978-1-884706-11-0. Lopez G & Leeson S (2008) Poultry Science 87: 298-306. Maharjan P, Mullenix G, Hilton K, Caldas J, Beitia A, Weil J, Suesuttajit N, Kalinowski A, Yacoubi N, Naranjo V, England
J & Coon C (2020) Poultry Science 99: 6884-6898. Majdeddin M, Golian A, Kermanshahi H, Michiels J & De Smet S (2019) British Poultry Science 60: 554-563. McGuire DM, Grioss MD, Van Pilsum JF & Towle HC (1984) Journal of Biological Chemistry 259: 12034-8. Naranjo VD (2018) XXXIV Curso de especialización FEDNA. Ostojic SM, Niess B, Stojanovic M & Obrenovic M (2013) International Journal of Medical Sciences 10:141-147. R Core Team (2020) R Foundation for Statistical Computing, Vienna, Austria. Van Pilsum JF (1971) The Journal of Nutrition 101:1085-92.
Aust. Poult. Science Symp. 2022...33
83

FEEDING A DOUBLE DOSE OF XYLANASE IMPROVES FEED CONVERSION IN BROILERS FED CORN-BASED DIETS, BUT NOT WHEAT-BASED DIETS
N. K. MORGAN1, M.M. BHUIYAN1 and R. HOPCROFT2
Wheat has traditionally been the target substrate ingredient for xylanase application, due to its high arabinoxylan content causing increased digesta viscosity. However, numerous studies have highlighted the benefits of supplementing non-viscous corn-based diets with xylanase, on broiler performance and energy, protein and dry matter digestibility (Rabello et al., 2021; Stefanello et al., 2016). This is thought to be attributable to production of prebiotic xylo-oligosaccharides (XOS) as a consequence of xylanase hydrolysing dietary xylan. The hypothesis of this study was that increasing the dose of xylanase supplemented into both commercial-type corn- and wheat-based broiler diets would increase bird performance and reduce excreta moisture content, through heightened XOS production and reduced digesta viscosity. Cobb 500 mixed-sex broilers (n =360) were distributed into 36 pens, (10 birds per pen, 9 pens per treatment) and fed either a commercial-type corn- or wheat- based diet, supplemented with either a commercial recommended dose of xylanase (16,000 BXU/kg), or a double dose of xylanase (32,000 BXU/kg) (Econase XT 5P, AB Vista, Marlborough, UK). Diets were fed as three phases, Starter (d0-12), Grower (d12-23) and Finisher (d23-35). Birds and feed were weighed on arrival (d0) and on d12, 23 and 35, and these values were used to calculate feed conversion ratio corrected for mortality (cFCR). Fresh excreta samples were collected per pen on d12, 23 and 35 and dry matter content measured.
Table 1 – Effect of feeding a commercial dose (16,000 BXU/kg) or double dose (32,000 BXU/kg) of xylanase to broilers fed commercial-type corn- and wheat-based diet
Xylanase Dose (BXU/kg) cFCR Excreta Dry Matter (%) d0-12 d0-23 d0-35 d12 d23 d35
Corn 16,000 1.16a 1.31a 1.41a 13.86b 17.52b 20.56 32,000 1.12b 1.27b 1.39b 18.27a 18.58a 21.77 P-value <0.001 0.002 0.036 <0.001 0.034 0.720
Wheat 16,000 1.08 1.27 1.37 18.35 18.90 20.02b 32,000 1.07 1.25 1.37 17.65 18.77 22.72a P-value 0.433 0.064 0.685 0.090 0.878 0.002
The lack of significant effect of the double xylanase dose on cFCR in birds fed the wheat-based diet suggests the commercial dose was sufficient at eliminating the anti-nutritional effects of the dietary xylan. Wheat-based diets also contain more fermentable xylan compared to corn-based diets, signifying the microbiota in wheat-fed birds contains more xylan-degrading bacteria species, so is better adapted at utilising dietary xylan. This was particularly apparent in the young birds, with lower cFCR value at d0-12 seen in birds fed the wheat- compared to corn- based diet (P < 0.001). The double xylanase dose did however increase excreta dry matter content at d35 in birds fed the wheat-based diet (P = 0.002), presenting increased xylan degradation. The positive effects of double xylanase dose in birds fed the corn-based diets suggests heightened production of XOS and solublisation of xylan, which stimulated xylan-degrading bacteria and provided fuel for beneficial probiotic bacteria species. This study suggests that there may be benefits to supplementing higher xylanase doses, particularly in corn-based diets.
ACKNOWLEDGEMENTS: The authors are grateful for financial support from AgriFutures Australia Chicken Meat Program
Rabello CBV, Costa MJ, Nogueira CL, Guilherme Barbosa J, Carlos Rios-Alva J, Wyatt CL, York TW, Serrano MP & Orlando Oviedo-Rondón E (2021) Poultry Science. 100: 820-834. Stefanello C, Vieira S, Carvalho P, Sorbara JO & Cowieson A (2016) Poultry Science. 95: pew070
1 University of New England, Australia [email protected] 2 Inghams Enterprises Pty. Ltd, Australia
Aust. Poult. Science Symp. 2022...33
84

APPRAISAL OF MATRIX VALUES FOR EXOGENOUS PHYTASE ALONE OR IN COMBINATION WITH OTHER ENZYMES IN DIETS FOR BROILER CHICKENS
A.F. MOSS1, A. GHANE2, Y. DERSJANT-LI3, T.H. DAO1, M. SULEMAN1, N. MORGAN1 and T.M. CROWLEY1,4
Summary
A trial was conducted to determine if full matrix values for phytase alone or in combination with xylanase and beta-glucanase (XB) were appropriate across multiple inclusion levels and combinations. It may be concluded that these matrix values are appropriate, with birds offered diets containing either phytase alone or in combination with XB overall generating a similar or improved performance than those offered control diets.
I. INTRODUCTION
Typical Australian broiler diets contain 2.5-3.0 g/kg phytate-P or roughly 10.0 g/kg phytate; therefore, phytase is included into every Australian broiler diet. As phytase is capable of increasing the availability of phosphorus, calcium, sodium, amino acids and energy content of diets, these nutrients may be decreased in the feed formulations as ‘matrix values’ without adverse effects on the birds’ growth performance (Dersjant-Li et al. 2020). However, phytase inclusion rates and matrix values vary substantially across the industry, and this is further complicated as phytase and NSPase enzymes are typically used in tandem in broiler diets. When used in combination, energy matrix values are applied to the NSPase enzyme rather than to phytase itself, so as not to ‘double up’. It is recommended that, when the enzymes are used in combination, the matrix values should not be applied additively but specifically adjusted based on the levels of the substrate (Adeola and Cowieson 2011). Thus, further study is required to identify matrix values of phytase and in combination with XB at multiple levels to improve adoption of a full matrix by the Australian poultry industry.
Therefore, a trial was conducted at the University of New England to determine if ascribed matrix values for phytase and in combination with XB were appropriate across multiple inclusion levels and combinations.
II. METHOD
Six treatments were tested including a positive control (PC, T1) formulated meeting Cobb nutritional requirements and 5 test diets reformulated with reduced nutrients and energy according to respective matrix values of the enzymes used. The enzymes supplemented are; T2, a novel consensus bacterial 6-phytase variant (Axtra® PHY Gold, PhyG, Danisco Animal Nutrition) at 1000 FTU/kg; T3, a mixed enzyme (Axtra® XB, XB, Danisco Animal Nutrition, supplemented at 100 g/t to provide 1,220 U/kg xylanase and 152 U/kg beta-glucanase); T4, PhyG at 1000 FTU and XB combination; T5, PhyG at 2000 FTU/kg; T6, a combination of PhyG at 2000 FTU and XB. A total of 912 mixed-sex Cobb 500 birds were randomly assigned to 6 dietary treatments (4 diet phases per treatment) with 8 replicate floor pens per treatment from 0-42 d post-hatch. Sampling was performed at days 21 and 42. Growth performance, organ weights, apparent metabolisable energy, toe ash, and digestibility of Ca, P, Na, protein, starch and NSP were measured. Positive control diets were formulated to Cobb nutrient recommendations and were based on wheat, maize, soybean meal, lupin and canola seed containing high level of phytate and total arabinoxylan. Matrix values were included in the formulation of the test diets, and were ascribed for Av.P, Ca, Na, AME, Lys, Met, Thr, Ile, Leu, Try, Pro, Ser, Val, and Arg as per Danisco Animal Nutrition recommendations (Tables 1 and 2).
1 School of Environmental and Rural Science, University of New England, Armidale, NSW, AU 2 Danisco Animal Nutrition (IFF), Singapore; 3 Danisco Animal Nutrition (IFF), The Netherlands 4 School of Medicine, Deakin University, Geelong, VIC, AU
Aust. Poult. Science Symp. 2022...33
85

Tab
le 1
- In
feed
con
trib
utio
n va
lues
asc
ribe
d to
phy
tase
and
XB
incl
usio
ns o
ver
the
star
ter
(d 0
to 1
0) a
nd g
row
er (d
10
to 2
1) p
hase
s whe
re a
ppro
pria
te.
Nut
rient
, g/k
g (u
nles
s ot
herw
ise
indi
cate
d)
Star
ter
Gro
wer
Phyt
ase
(100
0 FT
U)
XB
C
ombi
ned
(100
0 FT
U p
hyta
se +
X
B)
Phyt
ase
(200
0 FT
U)
Com
bine
d (2
000
FTU
ph
ytas
e +
XB
)
Phyt
ase
(100
0 FT
U)
XB
C
ombi
ned
(100
0 FT
U p
hyta
se +
X
B)
Phyt
ase
(200
0 FT
U)
Com
bine
d (2
000
FTU
phy
tase
+ X
B)
Ava
ilabl
e Ph
osph
orus
1.
97
1.97
2.
11
2.11
1.
97
1.97
2.
11
2.11
C
alci
um
2.09
2.
09
2.21
2.
21
2.09
2.
09
2.21
2.
21
AM
En1 ,
Kca
l/kg
68.6
9 61
.75
99.5
7 69
.31
100.
19
66.0
7 67
.30
99.7
2 66
.67
100.
32
Cru
de p
rote
in
6.04
6.
04
10.0
1 10
.01
5.29
5.
29
8.58
8.
58
Lysi
ne
0.34
0.
07
0.38
0.
54
0.58
0.
27
0.06
0.
3 0.
41
0.44
M
ethi
onin
e 0.
1 0.
02
0.11
0.
16
0.17
0.
08
0.02
0.
09
0.12
0.
13
Met
hion
ine
+ cy
stei
ne
0.29
0.
05
0.31
0.
45
0.48
0.
23
0.04
0.
25
0.34
0.
36
Thre
onin
e 0.
28
0.06
0.
31
0.45
0.
48
0.22
0.
05
0.25
0.
35
0.37
Is
oleu
cine
0.
27
0.27
0.
43
0.43
0.
22
0.22
0.
33
0.33
Le
ucin
e 0.
59
0.59
0.
93
0.93
0.
46
0.46
0.
7 0.
7 Tr
ypto
phan
0.
08
0.02
0.
09
0.13
0.
14
0.06
0.
02
0.07
0.
1 0.
11
Prol
ine
0.41
0.
41
0.65
0.
65
0.32
0.
32
0.5
0.5
Serin
e 0.
37
0.37
0.
59
0.59
0.
29
0.29
0.
47
0.47
V
alin
e 0.
34
0.34
0.
54
0.54
0.
27
0.27
0.
41
0.41
A
rgin
ine
0.27
0.
27
0.43
0.
43
0.21
0.
21
0.33
0.
33
Sodi
um
0.43
0.
43
0.49
0.
49
0.43
0.
43
0.49
0.
49
1 AM
En: A
ppar
ent m
etab
oliz
able
ene
rgy
corre
cted
to z
ero
N re
tent
ion.
Aust. Poult. Science Symp. 2022...33

Tab
le 2
- In
feed
con
trib
utio
n va
lues
asc
ribe
d to
phy
tase
and
xyl
anas
e in
clus
ions
ove
r th
e fin
isher
(d 2
1 to
35)
and
with
draw
al (d
35
to 4
2) p
hase
s whe
re
appr
opri
ate.
Nut
rient
, g/k
g (u
nles
s ot
herw
ise
indi
cate
d)
Fini
sher
W
ithdr
awal
Phyt
ase
(100
0 FT
U)
XB
C
ombi
ned
(100
0 FT
U p
hyta
se +
X
B)
Phyt
ase
(200
0 FT
U)
Com
bine
d (2
000
FTU
ph
ytas
e +
XB
)
Phyt
ase
(100
0 FT
U)
XB
Com
bine
d (1
000
FTU
ph
ytas
e +
XB
)
Phyt
ase
(200
0 FT
U)
Com
bine
d (2
000
FTU
phy
tase
+
XB
)
Ava
ilabl
e Ph
osph
orus
1.
97
1.97
2.
11
2.11
1.
97
1.97
2.
32
2.32
C
alci
um
2.09
2.
09
2.21
2.
21
2.09
2.
09
2.43
2.
43
AM
En1 ,
Kca
l/kg
63.4
6 73
.08
100.
00
64.0
3 10
0.57
63
.46
72.7
6 99
.84
100.
57
136.
95
Cru
de p
rote
in
4.59
4.
59
7.25
7.
25
4.59
4.
59
7.25
7.
25
Lysi
ne0.
23
0.06
0.
26
0.34
0.
37
0.23
0.
06
0.26
0.
37
0.4
Met
hion
ine
0.07
0.
02
0.08
0.
1 0.
11
0.07
0.
02
0.08
0.
11
0.12
M
ethi
onin
e +
cyst
eine
0.
21
0.04
0.
23
0.3
0.32
0.
21
0.04
0.
23
0.32
0.
34
Thre
onin
e 0.
19
0.05
0.
22
0.29
0.
32
0.19
0.
05
0.22
0.
32
0.34
Is
oleu
cine
0.
19
0.19
0.
27
0.27
0.
19
0.19
0.
27
0.27
Le
ucin
e 0.
44
0.44
0.
64
0.64
0.
44
0.44
0.
64
0.64
Tr
ypto
phan
0.06
0.
02
0.07
0.
1 0.
11
0.06
0.
01
0.07
0.
11
0.12
Pr
olin
e0.
26
0.26
0.
4 0.
4 0.
26
0.26
0.
4 0.
4 Se
rine
0.24
0.
24
0.35
0.
35
0.24
0.
24
0.35
0.
35
Val
ine
0.24
0.
24
0.36
0.
36
0.24
0.
24
0.36
0.
36
Arg
inin
e 0.
18
0.18
0.
27
0.27
0.
18
0.18
0.
27
0.27
So
dium
0.
43
0.43
0.
49
0.49
0.
43
0.43
0.
54
0.54
1 A
MEn
: App
aren
t met
abol
izab
le e
nerg
y co
rrect
ed to
zer
o N
rete
ntio
n.
Aust. Poult. Science Symp. 2022...33
JoGeist
Cross-Out

Diets contained the same level of phytate-P and total arabinoxylan and were cold-pelleted at 65°C. Birds had unlimited access to feed and water, and lighting and temperature followed breeder guidelines. The study was approved by the University of New England’s Animal Ethics Committee (AEC20-049). The data were analysed via an ANCOVA, with room and % males per pen as covariates. Pen was considered the experimental unit and statistical significance was established at P ≤ 0.05. Pairwise comparisons were made via Fisher’s LSD.
III. RESULTS
Despite the application of full matrix specifications to both phytase and XB, many parameters such as weight gain, FCR, and the ileal digestibility of Ca, P, starch and protein were either not significantly different or significantly improved by dietary treatments in comparison to the PC diet (with the exception of treatment 2 for ileal P digestibility). Over the entire experimental period (d 0 to 42), phytase inclusion at 2000 FTU/kg numerically increased BWG by 3.07% compared to the PC diet (3087 g/bird versus 2995 g/bird). Similarly, 2000 FTU phytase and XB in combination numerically increased BWG by 2.91% compared to the PC diet (3081 g/bird versus 2995 g/bird). Also, phytase inclusion at both levels (1000 or 2000 FTU/kg) increased BWG from d 0 to 10 (P < 0.05) and d 10 to 21 (P < 0.05) compared to the PC diet by pairwise comparisons. Thus, the enzymes successfully released the nutrients and energy that the diets were reduced by in the inclusion of the ascribed matrix values.
IV. DISCUSSION
Given that the full matrix value reductions implemented in diets with phytase and XB inclusions were sizeable, it is noteworthy that the birds offered these diets had similar feed efficiency in all feeding phases and similar ileal digestibility of protein, starch, calcium and phosphorus at d 21 compared to the PC diets in the current study. Furthermore, despite the application of full matrix specifications, phytase inclusion at both 1000 and 2000 FTU/kg increased BWG in starter and grower phases. The results of the current work support those previously reported in the literature (Amerah et al. 2014; Truong et al. 2017; Gilani et al. 2021) and suggest that phytase and XB successfully released the nutrients and energy that the diets were reduced by in the inclusion of the matrix values.
Overall, it may be concluded that these matrix values are appropriate, and may even generate an improved body weight gain.
ACKNOWLEDGEMENTS: The authors would like to acknowledge and thank Danisco Animal Nutrition (IFF) for funding this project and for their encouragement and support.
REFERENCES
Adeola O & Cowieson AJ (2011) Journal of Animal Science 89: 3189-3218. Amerah AM, Plumstead PW, Barnard LP & Kumar A (2014) Poultry Science 93: 906-915. Dersjant-Li Y, Van de Belt K, Kwakernaak C & Marchal L (2020) Journal of Applied Animal
Nutrition 8: 49-59. Gilani S, Gracia MI, Barnard L, Dersjant-Li Y, Millán C & Gibbs K (2021) Journal of Applied
Animal Nutrition 9: 77-83. Truong HH, Yu S, Moss AF, Partridge GG, Liu SY & Selle PH (2017) Animal Feed Science and
Technology 223: 13-22.
Aust. Poult. Science Symp. 2022...33
88

EFFECTS OF XYLANASE DOSAGE AND MIXED NSPASES ON THE IN-VIVO PRODUCTION OF XYLO-OLIGOSACCHARIDES IN BROILERS FED BARLEY, CORN, SORGHUM AND
WHEAT-BASED DIETS
A. D. WALLACE1, R. HOPCROFT2 and N. K. MORGAN1
There is increasing evidence that supplementing small amounts of prebiotic xylo-oligosaccharides (XOS) into poultry diets has positive effects on bird performance and gastrointestinal health. Soluble XOS that reach the caeca intact are utilised by beneficial bacteria, inducing positive effects such as increased production of short chain fatty acids (Aachary & Prapulla, 2011). Commercial endo-xylanases are added to diets to reduce digesta viscosity, but have the side effect of producing these favorable XOS, namely xylobiose (X2), and to a lesser degree xylotriose (X3) and xylotetraose (X4). The aim of this study was to examine if production of XOS from dietary xylan could be increased by feeding a higher dosage of xylanase, or by feeding a cocktail of xylanase and other non-starch polysaccharide degrading enzymes (NSPase Mix). Cobb 500 mixed-sex broilers (n =720) were distributed into 72 pens (10 birds per pen, 6 pens per treatment) and fed commercial-type barley-, corn-, sorghum- or wheat-based diets, supplemented with either a recommended dose of xylanase (16,000 BXU/kg), a double dose of xylanase (32,000 BXU/kg) (Econase XT 5P, AB Vista) or a xylanase (16,000 BXU/kg) and NSPase mix, containing beta-glucanase (20,000 U/kg) (Econase GT, AB Vista), cellulase (2000 U/kg) (Sigma-Aldrich), pectinase (1400 U/kg), mannanase (250 U/kg), galactanase (20 U/kg) and arabinofuranosidase (10,000U/kg) (Deltagen). At day 35, digesta samples from the ileum were collected and analysed for XOS using Liquid Chromatography Mass Spectrometry.
Figure 1 – XOS measured in ileum digesta (D35) from broilers fed commercial-type barley, corn, sorghum, or wheat-based diets supplemented with either single xylanase (16,000 BXU/kg), double xylanase (32,000 BXU/kg) or single xylanase and NSPases mix.
In the sorghum- and wheat-based diets, no increase in XOS was observed when diets were supplemented with the NSPase mix as compared to xylanase alone. This suggests that xylanase activity was not inhibited by other NSP in these diets, or that the NSPases were ineffective. A slight change in XOS profile towards X2 and X3 was observed in the wheat-based diets with double xylanase application. This may indicate that all enzyme hydrolysable substrates were being depleted. In the barley- and corn- based diets, significant increase in all XOS production was observed with the increased xylanase dose. The NSPase mix improved XOS production in the barley- and corn-based diets. This implies that other NSPs in these diets may inhibit xylanase activity, and presence of additional NSPases may be beneficial.
ACKNOWLEDGEMENTS: The authors are grateful for financial support from AgriFutures Australia Chicken Meat Program. Aachary AA & Prapulla SG (2011) Comprehensive Reviews in Food Science and Food Safety, 10(1): 2–16.
1 University of New England, Australia [email protected] 2 Inghams Enterprises Pty Limited, Australia
Aust. Poult. Science Symp. 2022...33
89

EVALUATION OF A NOVEL BACTERIAL 6-PHYTASE ON GROWTH EFFICIENCY OF BROILERS AT 35 DAYS OF AGE
M. JLALI1, M. T. KIDD2, M. I. GRACIA3, M. FRANCESCH4, P. COZANNET1,B. YAVUZ5, and A. PREYNAT1
Summary
Three broiler performance studies were conducted in three different facilities to investigate the efficacy of a novel bacterial 6-phytase on growth performance of broilers fed diets deficient in available phosphorus (avP) and total calcium (Ca). Design was the same for all studies, with three treatments: positive control (PC) diet formulated to meet or exceed the requirements of birds, negative control (NC) diet reduced by 0.15% units in avP and Ca, and the NC diet supplemented with phytase (NC + Phytase) at 500 FTU/kg diet from one to 35 days of age. Body weight (BW) and feed intake were measured at 21 and 35 days of age, and average daily gain (ADG), average daily feed intake (ADFI), feed conversion ratio (FCR), body weight gain corrected FCR (FCRc) and mortality were calculated for the experimental period. The P and Ca deficiency in the NC diet resulted in a lower (P <0.001) final BW (-7.9%), ADFI ( -8.0%) and ADG (-8.0%) leading to a higher FCRc (+2.2%, P <0.001) and mortality (+1.6% unit, P = 0.03) compared with the PC diet. The supplementation of NC diet with phytase improved (P <0.001) the final BW (+9.9%), ADG (+10.2%), ADFI (+10.7%) and FCRc (-1.8%). Phytase addition also decreased (P = 0.02) the percentage of mortality by 1.9% unit in comparison to NC diet. These performance parameters were similar to those of birds fed adequate-nutrient PC diet except for ADFI which is higher (+1.9%, P=0.03) in diet supplemented with phytase. Thus, avP and Ca can be lowered similarly by 0.15% units from bacterial phytase-supplemented diets without effects on growth performance of broilers.
I. INTRODUCTION
In all vegetable-based diets such as wheat, corn and soybean meal, up to 83% of dietary phosphorus (P) is bound to phytate (Li et al., 2016; Aureli et al., 2017). Phytate is known to contain bound P that is unavailable to the broilers, resulting in the use of inorganic-P sources such as monocalcium phosphate and dicalcium phosphate (NRC, 1994) in order to fulfill the broiler P requirements. However, the use of inorganic-P sources in broilers not only increases the feed cost but results also to an increase of P released resulting in environmental issues. So, nowadays, the most efficient strategy to optimize P utilization in poultry is through supplementation with exogenous phytase. This in turn allows for reductions in the use of expensive inorganic P and increases the utilization of phytate-P. Therefore, three experiments were conducted to evaluate the efficacy of a biosynthetic bacterial 6-phytase produced by Trichoderma reesei on growth performance of broilers from 0 to 35 days of age.
1 Adisseo France S.A.S., Center of Expertise in Research and Nutrition, 03600 Malicorne, France;[email protected], [email protected], [email protected] 2Center of Excellence for Poultry Science, University of Arkansas, Fayetteville, AR 72701, USA; [email protected] 3Imasde Agroalimentaria, S.L. C/ Nápoles 3, 28224, Pozuelo de Alarcón, Madrid, Spain; [email protected] 4IRTA, Animal Nutrition, Ctra. Reus-El Morell km. 3.8, E-43120 Constantí, Tarragona, Spain; [email protected] 5Adisseo France S.A.S., 92160 Antony, France; [email protected]
Aust. Poult. Science Symp. 2022...33
90

II. METHOD
Three broiler performance studies were conducted in three different research facilities. Design was the same for all studies, with three treatments: a positive control (PC) diet formulated to meet or exceed the requirements of birds (starter phase: ME= 12.97 MJ/kg, dig. Lys = 1.22%, Ca =0.90% and avP = 0.41% and grower phase: ME= 13.18 MJ/kg, dig. Lys = 1.01%, Ca =0.60% and avP = 0.32%), negative control (NC) diet reduced by 0.15% units in avP and Ca compared to the PC diet, and the NC diet supplemented with phytase at 500 FTU/kg diet (NC + Phytase) from one to 35 days of age.
The type and nutritional composition of the diets between the 3 studies is quite similar. Experiments 1 and 2 were based on corn-soybean meal diets, whereas the third experiment was based on corn-wheat-soybean meal diets. Same feeding program (starter from d1 to d21 and grower from d22 to d35) was used in the three studies. The 6-phytase (Rovabio PhyPlus, Adisseo France S.A.S, Antony, France) was diluted with water at the rate of one liter per ton feed to spray application in order to provide 500 FTU/ton of feed. Diets without phytase (NC and PC diets) were sprayed with water. Feed and water were provided ad libitum. For each study, a total of 2,160, 1, 296 and 1, 200 one-day-old male Ross 308 chicks were individually weighed and then randomly allocated in 48 (45 birds/pen), 72 (18 birds/pen) and 48 (25 birds/pen) floor pens for trials 1, 2 and 3, respectively.
In each trial, body weight (BW), average daily feed intake (ADFI), average daily feed intake (ADFI), corrected for mortality feed conversion ratio (mFCR), and mortality were measured on a pen basis throughout the experimental period. In addition, BW gain corrected FCR (FCRc) was determined for the global period.
Raw data from growth studies were subjected to ANOVA, with trial, block, and treatment as fixed effects using the ANOVA procedure of XLSTAT to establish differences among diets. In addition, orthogonal contrasts were done to compare NC diet vs. PC diet and NC + Phytase vs. PC diet. Statistical significance was set at P ≤ 0.05.
III. RESULTS AND DISCUSSION
The P and Ca deficiency in the NC diet resulted in a lower final BW (-7.9%, P<0.001), ADFI ( -8.0%, P <0.001) and ADG (-8.0%, P < 0.001) accompanied with higher FCRc (+2.2%, P <0.001) and mortality (+1.6% unit, P = 0.03) compared with the PC diet (Table 1). These resultsare in accordance with those reported in several studies showing that dietary reduction in Caand particularly in avP resulted in a significant decrease of growth performance and an increasein FCRc in broilers (Vieira et al., 2015; Scholey et al., 2018; Jlali et al., 2021). Such findingsconfirm the essentiality of P and Ca in regulating feed intake and growth performance inbroilers (Waldroup, 1999). P and Ca are also essential minerals required for normal muscle andbone development and play vital roles in maintaining osmotic and acid-base balance, energymetabolism, amino acid metabolism, and protein synthesis (Underwood and Suttle, 1999;Proszkowiec-Weglarz and Angel, 2013; Li et al., 2016). The supplementation of NC diet withphytase at 500 FTU/kg diet improved the final BW (+9.9%, P<0.001), ADG (+10.2%,P<0.001), ADFI (+10.7%, P<0.001), and FCRc (-1.8%, P = 0.0003). In addition, it decreased(P = 0.02) the percentage of mortality by 1.9% in comparison with the NC diet. Since phytateis considered as an antinutrient in poultry (Woyengo and Nyachoti, 2013; Dersjant-Li et al.,2015), these improvements on performance as also reported by Amerah et al. (2014) andDersjant-Li et al. (2020), indicate the effectiveness of the phytase used to improve the P andCa availability for broilers by acting on its substrate (phytate-P) and by limiting the negativeinteractions between phytate and other dietary nutrients including Ca within the gastrointestinaltract. The orthogonal contrasts showed that performance parameters were not statistically
Aust. Poult. Science Symp. 2022...33
91

different in birds fed adequate-nutrient PC diet and those fed NC diet deficient in avP and Ca supplemented with phytase.
In conclusion, this study showed that this novel phytase added at 500 FTU/kg diet allowed birds fed diets reduced in P and Ca to reach a growth performance similar to that of birds fed a diet adequate in all nutrients in a more economically and sustainable way. Thus, avP and Ca can be lowered similarly by 0.15% unit in phytase-supplemented diets without compromising feed efficiency and reducing the production cost of broilers.
Table 1 - Average BW, ADG, ADFI, FCR corrected for mortality, and BW gain corrected FCR and mortality of male broilers supplemented with phytase from 1 to 35 d of age1,2
BW d35, g/bird
ADG d0-35, g/bird/day
ADFI d0-35, g/bird/day
mFCR d0-35
FCRc d0-35
Mortality, %
PC 2456a 67.92a 93.80b 1.384a 1.375b 2.6b NC 2263b 62.48b 86.31c 1.384a 1.404a 4.1a NC + Phytase1 2485a 68.83a 95.54a 1.391a 1.379b 2.3b Main effects
Trial <0.001 <0.001 <0.001 <0.001 <0.001 0.35 Block 0.23 0.31 0.03 0.009 0.11 0.61 Diet <0.001 <0.001 <0.001 0.32 <0.001 0.02
Orthogonal contrasts NC vs PC <0.001 <0.001 <0.001 0.95 <0.001 0.03 NC + Phytase vs PC 0.12 0.09 0.01 0.18 0.56 0.63
a-cMeans in the same row with no common superscripts are significantly different at P ≤ 0.05. All parameters are corrected for mortality. 1Positive control (PC) represents an adequate-nutrient diet formulated to meet or exceed the requirements of birds; Negative control (NC) is a similar diet to PC with reduced by 0.15% units in calcium and available phosphorus. mFCR = FCR corrected for mortality; FCRc = BW gain corrected FCR. 2Data (n = 162) were subject to variance analysis Trial (n = 3), block (n = 8) and diet (n = 3) were considered as fixed effects. Orthogonal contrasts were applied NC vs. PC in order to evaluate the reformulation effect and NC + Phytase vs. PC to evaluate the restoration with phytase.
REFERENCES
Amerah AM, Plumstead PW, Barnard LP & Kumar A (2014) Poultry Science 93: 906-915. Aureli R, Ueberschlag Q, Klein F, Noël C, & Guggenbuhl P (2017) Poultry Science 96: 160-
168. Dersjant-Li Y, Archer G, Stiewert AM, Brown AA, Sobotik EB, Jasek A, Marchal L, Bello A,
Sorg RA, Christensen T, Kim H-S, Mejldal R, Nikolaev I, Pricelius S, Haaning S, Sørensen JF, de Kreij A & Sewalt V (2020) Animal Feed Science and Technology 264: 114481.
Dersjant-Li Y, Awati A, Schulze H & Partridge G (2015) Journal of the Science of Food and Agriculture 95: 878e96.
Jlali M, Cozannet P, Moore D & Preynat A (2021) Animal Feed Science and Technology 276: 114927.
Li X, Zhang D, Yang TY, & Bryden WL (2016) Agriculture. 25: 1-15. NRC (1994) Ninth Revised Edition, National Academy Press, Washington D.C. Proszkowiec-Weglarz M & Angel R (2013) Journal of Applied Poultry Research 22: 609-627. Scholey DV, Morgan NK, Riemensperger A, Hardy R & Burton EJ (2018) Poultry Science 97:
2435-2440. Underwood EJ & Suttle (1999) 3rd edition. Wallingford UK. Vieira SL, Anschau DL, Stefanello C, Serafini NC, Kindlein L, Cowieson AJ & Sorbara JOB
(2015) Journal of Applied Poultry Research 24: 335-342. Waldroup PW (1999) Poultry Science 78: 683-691. Woyengo TA & Nyachoti CM (2013) Canadian Journal of Animal Science 93: 9-21.
Aust. Poult. Science Symp. 2022...33
92

UNDERSTANDING EGG QUALITY
D.R. JONES1 and R.K. GAST2
Summary
Egg quality is multi-faceted, with physical, functional, and microbial aspects contributing to egg quality. Research has shown that many factors impact egg quality including flock age and management, genetics, hen diet, housing design and management, as well as egg handling and storage. As laying egg production around the world shifts to more extensive housing systems, the impact of these housing systems on egg quality is unclear. Furthermore, the handling and storage of eggs have been shown to greatly affect egg quality. Understanding the factors influencing egg quality allows for higher quality eggs reaching consumers.
I. INTRODUCTION
Eggs are an affordable raw agricultural commodity with a high nutrient density. Eggs serve a key role in diets around the world. Maintaining the quality of eggs is a worldwide concern. Generally, there are three types of egg quality: 1) physical, 2) functional, and 3) microbial. During this presentation, all three types of egg quality will be discussed and factors which influence egg quality characteristics will be explained. Understanding the types of egg quality, as well as factors impacting them, is integral to the ultimate goal of safe, high quality eggs reaching consumers.
Physical egg quality is defined by the visible characteristics of the egg. Exterior features such egg shape, shell texture, shell colour, cleanliness, and soundness are the first impression for consumers when selecting eggs for purchase. Interior physical egg quality factors include albumen height and clarity, as well as yolk colour, shape, size, and structure.
Functional egg quality describes the manner which whole egg, albumen, and yolk perform in a variety of food matrices. Eggs perform numerous functional properties in foods. Common functional attributes assessed for egg quality include foaming, coagulation, and emulsification.
Microbial quality of eggs considers both food safety and spoilage organisms. Eggs are a raw agricultural commodity with a shelf life dependent on initial flora present, handling, and storage conditions. Salmonella spp. are the historic foodborne pathogens associated with the consumption of eggs. Other spoilage organisms, including yeasts and molds, can impact the shelf-life of eggs.
II. PHYSICAL EGG QUALITY
The shape, texture, color, and soundness of the shell are the first egg quality factors consumers encounter. Shell quality provides aesthetics to the egg. It also serves as the first line of defense for microorganisms entering the eggs via horizontal transmission. A cracked egg is not only a potential loss of revenue due to lack of sale or store return, it is also a food safety risk since organisms can easily move through the crack to the shell membranes. Broken eggs with ruptured shell membranes (leakers) provide microorganisms direct contact with the egg contents and should not be consumed. In the US, leakers are considered a loss egg (USDA,
1 United States Department of Agriculture, Agricultural Research Service, Egg Safety and Quality Research Unit, Athens, Georgia, USA; [email protected] 2 United States Department of Agriculture, Agricultural Research Service, Egg Safety and Quality Research Unit, Athens, Georgia, USA; [email protected]
Aust. Poult. Science Symp. 2022...33
93

2000). The soundness of the egg also impacts the ability for intact eggs to reach end users. Furthermore, consumers have expectations as to the brightness of white shell eggs, as well as shade and consistency of colour for brown or coloured shells.
Once the egg is broken, the shape, clarity, and appearance of the albumen and yolk define the physical quality of the egg. The Haugh unit (Haugh, 1937) is utilised around the world as a quantitative measure for egg grade standards. In the US, Grade AA is defined as a Haugh unit score > 72; Grade A is a score > 60, but less than 72; and Grade B is a score less than 60 (USDA, 2000). The Haugh unit is calculated based on egg weight and thick albumen height. The score has been questioned due to the calculation being weighted for a large size egg (56 g). In such cases, thick albumen height alone is utilised for reporting albumen and egg quality.
Yolk quality is monitored by determining yolk index and vitelline membrane mechanical characteristics. Yolk index is a calculation of yolk height divided by yolk diameter and is an indicator of yolk shape. As an egg ages, water migrates from the albumen into the higher solute yolk. This leads to a flattening of the yolk resulting in a lower yolk index value. Vitelline membrane strength and elasticity are physical properties of the membrane surrounding the yolk. The strength of the vitelline membrane is important not only to ensure the yolk remains intact during cracking and separation of the yolk and albumen fractions for cooking or the manufacturing of egg products, the membrane is also a barrier for microorganisms present in the albumen entering the nutrient rich yolk. The elasticity of the vitelline membrane indicates how much the membrane can deform before rupturing.
III. FUNCTIONAL EGG QUALITY
Eggs are highly functional ingredients in a variety of food matrices including, but not limited to, baked goods, sauces, candies and confections, desserts, snacks, meal replacement bars, and beverages. Functional characteristics can be provided by albumen, yolk, and whole egg. While there are many identified functionalities associated the eggs (AEB, 2021), three of the overarching categories are: foaming, coagulation, and emulsification.
Primarily, albumen and whole eggs can provide foaming capacity to a food matrix. The proteins in the albumen are particularly suitable for unfolding and interacting during whipping to entrap air, forming foams. During heating, the air and any moisture present will expand and provide leavening and lightness to the food product.
Whole egg, yolk, and albumen all assist with coagulation. Coagulation, generally due to heat exposure, is the binding or setting of food components. Coagulation is responsible for the texture created during the scrambling of eggs. Furthermore, coagulation allows for ingredients particles in quiches to be suspended with the dish. Coagulation is also responsible for the thickening achieved during heating of egg-containing puddings or sauces. Coagulation also accounts for the heat setting of foams such as meringues and sponge cakes.
Yolk, whole egg, and to a lesser extent albumen, are emulsifiers bridging the hydrophobic and lipophobic portions of a food matrix to aid in the creation of a stable emulsion. Eggs play a key role in the emulsification of mayonnaise and salad dressings, as well as ice cream bases, Hollandaise, and bearnaise, to name a few applications. Eggs also assist with browning and colour formation during cooking, adhering food coatings, and enhancing mouth-feel. The functional applications of eggs are endless, while also providing nutrient density and clean labels to the foods.
Aust. Poult. Science Symp. 2022...33
94

IV. MICROBIAL EGG QUALITY
Foodborne pathogens and spoilage organisms contribute to the microbial quality of eggs. Eggs can become contaminated via vertical transmission, as well as horizontal contamination. Salmonella Enteritidis is deposited inside the edible interior of eggs due to infected reproductive organs (Gantois et al., 2009), although high frequencies of reproductive organ invasion by Salmonella do not always result in correspondingly high frequencies of egg contamination (Gast et al., 2004). Both the ovary and oviduct of laying hens can be invaded by S. Enteritidis, leading to bacterial deposition in either edible egg fraction (Gast et al., 2007).The abundant nutrients in egg yolk can support rapid microbial growth at warm temperatures(Gurtler and Conner, 2009), whereas albumen of fresh eggs contains antimicrobial compoundsthat limit iron availability and disrupt bacterial membranes (Baron et al., 2016). S. Enteritidisis generally deposited inside contaminated eggs in the albumen or on the vitelline (yolk)membrane (Gast and Holt, 2001). Eggs contaminated by S. Heidelberg, a common serovar inlaying housing environments, have been implicated in occasional reports of human disease inthe US (Chittick et al., 2006). In Australia, sporadic egg-associated illnesses have beenattributed to S. Typhimurium contamination of eggshells (Moffatt et al., 2016; Ford et al.,2018). In the US, there were Salmonella Enteritidis egg-associated outbreaks in 2010 and 2018(CDC, 2010; 2018a), Salmonella Oranienburg in 2016 (CDC, 2016), Salmonella Braenderupin 2018 (CDC, 2018b), and Listeria monocytogenes in hard-cooked eggs in 2019 (CDC, 2020).Other salmonellae, including S. Kentucky in the US, are prevalent in commercial laying flockhousing environments but have not been shown to cause egg contamination.
Pathogens other than Salmonella are also important for eggs and the egg production environment. Campylobacter spp. and Listeria spp. have frequently been detected (Jones et al., 2012, 2015; Jones and Anderson, 2013; Novoa-Rama et al., 2018) in environmental swabs from a variety of hen housing systems. Additional studies have determined the flora present on the shells of nest run eggs is diverse (De Reu et al., 2006, 2008; Mallet et al., 2006; Singh et al., 2009; Jones et al., 2011).
Spoilage organisms must also be considered when discussing the microbial quality of eggs. Being a raw agricultural commodity, eggs are prone to rotting, especially if the eggs have been mishandled. Organisms which have been associated with the rotting of eggs include Pseudomonas, Acinetobacter, Proteus, Aeromonas, and Serratia. Fungi are also able to grow on the shell surface and between the shell and shell membranes.
V. EGG HANDLING AND STORAGE
Around the world, eggs are handled and stored in diverse manners. The controlled washing of shell eggs for human consumption has been a point of debate for over 50 years. In the US, USDA Agricultural Marketing Service standards for the voluntary grading of shell eggs serve as the basis for the washing of shell eggs (USDA, 2008). Under these standards, eggs must be spray washed in warm water (32°C or 11°C warmer than the warmest egg), exposed to a sanitising rinse of 100 – 200 ppm chlorine or its equivalent, and be blown dry with high velocity, filtered air. Generally, caustic detergents are utilized in the wash water.
The washing of eggs has been a concern due to the potential of disturbing the cuticle of the egg. The cuticle serves as the first line of defense for the movement of water, air, and external microorganisms into and out of an intact egg. With the changes in flock management, hen genetics, as well as hen housing, modern research has produced conflicting results as to the impact of washing on cuticle integrity (Kim and Slavik, 1996; Wang and Slavik, 1998; Leleu et al., 2011; Gole et al., 2014a,b; Liu et al., 2016). Washing of shell eggs removes
Aust. Poult. Science Symp. 2022...33
95

adhering matter, such as dust, feed, and fecal matter – all of which can harbour both pathogenic and spoilage microorganisms. Washing of consumer eggs enhances egg quality.
Prompt refrigeration of eggs has been shown to be a key factor in controlling the growth of Salmonella Enteritidis, other Salmonella spp., and many other human pathogens (Gast et al., 2006, 2018; Fikiin et al., 2020; Lin et al., 2021). For this reason, in the US, shell eggs are required to be under refrigeration (7.2°C) within 36h of lay through distribution and retail (FDA, 2009; USDA, 2020). Refrigeration is also key in retaining product physical and functional quality characteristics. In a comparison of common egg handling and storage practices utilised around the world, it was determined that refrigeration had the greatest impact on retaining physical egg quality regardless of washing status (Jones et al., 2018b).
VI. HEN HOUSING SYSTEMS
Consumers draw conclusions about housing systems in part based on the quality of the eggs from housing systems available in retail. Extensive housing systems often have higher production costs, resulting in more expensive eggs. A consumer has an expectation of enhanced quality with the price premium. Several review articles have been published on the impacts of hen housing on egg quality (Sossidou and Elson, 2009; Holt et al., 2011; Rokonjac et al., 2014). In many instances, studies conflict on the outcomes of egg quality due to housing. Karcher et al. (2015) illustrate the complexity of comparing hen production and egg quality amongst housing systems and the factors which can significantly influence outcomes.
Physical and functional egg quality influence market share and usage, for both consumers and food manufacturers. Many retailers, food service, and food manufacturers in the US and around the world have made pledges to convert to cage-free eggs, but little is known as to the impacts of extensive housing systems on egg quality – in particular egg functionality.
Outcomes of egg quality assessments conducted worldwide regarding hen housing have been inconsistent (Abrahamson and Tauson, 1998; Guesdon and Faure, 2004; Van Den Brand et al., 2004; Mertens et al., 2006; Hidalgo et al., 2008; Singh et al., 2009; Wang et al., 2009; Jones et al., 2010). Principal component analysis of egg quality and egg production in terms of hen diet composition and environmental temperature across commercial conventional cage, enriched colony cage, and cage-free aviary determined that many factors influence various egg quality parameters and the influence is often dependent on housing system (Karcher et al., 2015). The effective collection of eggs from extensive systems impacts egg quality (Singh et al., 2009). Prompt refrigeration has long-lasting positive influence on all interior egg quality factors (Jones et al., 2018b). Eggs laid outside of the intended egg collection area (mislaid eggs) may not be effectively collected and could be older when packaged. A comparison of hen genetic strains in cage-free aviaries found strains produced eggs of varying quality and quality declined at different rates during long-term cold storage (Jones et al., 2018a). Egg grade standards (USDA, 2000) are based on conventional cage eggs. Jones et al. (2014) determined that US federal egg grade standards are equitable for commercial conventional cage, enriched colony cage, and cage-free aviary produced eggs during long-term refrigerated storage.
Research has documented the changes in egg functionality during the extended cold storage of eggs (Jones, 2007). As egg production shifts to cage-free and food manufacturers are making cage-free commitments, there is limited knowledge on the effect of hen housing on egg functionality. A single study of retail eggs in Italy provided insight (Hidalgo et al., 2008) and retail egg studies limit the control of egg age and handling, which can impact egg quality.
A variety of extensive systems have been developed including enriched colony cages (providing lower stocking densities for larger hen groups plus environmental enhancements such as perches, nesting areas, and scratching pads), cage-free aviaries (allowing birds to move freely among multiple open levels of enriched cage and floor areas within houses), cage-free
Aust. Poult. Science Symp. 2022...33
96

barn, and free-range housing (offering greater opportunities for freedom of movement via varying degrees of access to outdoor forage or pasture areas). The numerous facility design features and management practices associated with each of these systems influence the environmental and flock persistence and transmission of pathogens such as Salmonella (Jones et al., 2015). A considerable body of research has assessed the effects of laying hen housing systems on important food safety parameters, but this work has generated no overall consensus to suggest that any one system is superior to others (Whiley and Ross, 2015). Challenge studies have been conducted comparing conventional and enriched colony cages (Gast et al., 2013, 2014; Gomes et al., 2014), but there has been limited ability to assess the impact of cage-free housing on infection and transmissibility, as well as egg contamination.
A high prevalence of Campylobacter spp. has been detected in both intensive and extensive hen housing systems (Sulonen et al., 2007; Schwaiger et al., 2008; Green et al., 2009; Jones et al., 2012, 2015). Jones et al. (2015, 2016) compared Campylobacter detection in conventional cage, enriched colony cage, and multi-tier cage-free aviary housing and found scratch pads, system wires, and flooring substrate to be environmental reservoirs. Listeria monocytogenes is an important foodborne pathogen, known to proliferate in refrigerated conditions. Listeria has been detected in the shell egg and egg products processing environment (Leasor and Foegeding, 1989; Farber et al., 1992; Jones et al., 2006; Jones and Musgrove, 2007, 2008) but information as to on-farm incidence or impact of housing systems on Listeria prevalence is limited. When hens have outdoor access (such as organic or free range), the environmental and egg flora are impacted (Sulonen et al., 2007; Jones et al., 2011, 2012; Jones and Anderson, 2013). Mislaid eggs are defined as those which cannot be effectively, efficiently, or hygienically collected. These are often referred to as floor eggs, but may not always occur on the floor of an extensive housing system. Research has found that mislaid eggs have a higher likelihood of microbial contamination (De Reu et al., 2006; Huneau-Salaün et al., 2010; Jones and Anderson, 2013; Jones et al., 2015). Research has also found that cage-free systems, in particular cage-free aviaries, result in high levels of dust from hens foraging and dust bathing in the substrate (Zhao et al., 2015). The increase in dust impacts egg safety and worker health (Jones et al., 2015, 2016; Mitchell et al., 2015).
VII. CONCLUSIONS
Maintaining and enhancing shell egg quality requires a holistic approach to egg production, handling, transportation, and distribution. Much is known about conserving egg quality associated with conventional cage production systems. As world egg production shifts to a variety of extensive housing systems for laying hens, as well as changes in dietary formulations and laying hen genetic stocks, controlling egg quality can be challenging. It can be daunting to process the information or lack of information to make informed decisions. Producers do not have to face these challenges alone. Reach out to the multitude of resources available and in today’s virtual environment, it is even easier to receive assistance from anywhere in the world.
REFERENCES
Abrahamsson P & Tauson R (1998) Journal of Applied Poultry Research 7: 225-232. American Egg Board (2021) https://www.incredibleegg.org/professionals/manufacturers/real-egg-
functionality. Accessed: 18 NOV 2021. Baron F, Nau R, Guérin-Dubiard C, Bonnassie S, Gautier M, Andrews SC & Jan S (2016) Food
Microbiology 53: 82-93.
Aust. Poult. Science Symp. 2022...33
97

CDC (2010) https://www.cdc.gov/salmonella/2010/shell-eggs-12-2-10.html. Accessed: 30 NOV 2021.
CDC (2016) https://www.cdc.gov/salmonella/oranienburg-10-16/index.html. Accessed: 30 NOV 2021.
CDC (2018a) https://www.cdc.gov/salmonella/enteritidis-09-18/index.html. Accessed: 30 NOV 2021.
CDC (2018b) https://www.cdc.gov/salmonella/braenderup-04-18/index.html. Accessed: 30 NOV 2021.
CDC (2020) https://www.cdc.gov/listeria/outbreaks/eggs-12-19/index.html. Accessed: 30 NOV 2021.
Chittick P, Sulka A, Tauxe RV & Fry AM (2006) Journal of Food Protection 69: 1150-1153. De Reu K, Grijspeerdt K, Heyndrickx M, Uyttendaele M, Debevere J & Herman L (2006) British
Poultry Science 47: 163-172. De Reu K, Messens W, Heyndrickx M, Rodenburg TB, Uyttendaele M & Herman L (2008)
World’s Poultry Science Journal 64: 5-19. Farber JM, Daley E & Coates F (1992) Food Research International 25: 143-145. FDA (2009) https://www.gpo.gov/fdsys/pkg/FR-2009-07-09/pdf/E9-16119.pdf, Accessed: 30
NOV 2021. Fikiin K, Akterian S & Stankov B (2020) Trends in Food Science and Techology 100: 359-362. Ford L, Wang Q, Stafford R, Ressler KA, Norton S, Shadbolt C, Hope K, Franklin N, Krsteski R,
Carswell A, Carter GP, Seemann T, Howard P, Valcanis M, Castillo CFS, Bates J, Glass K, Williamson DA, Sintchenko V, Howden BP & Kirk MD (2018) Foodborne Pathogens and Disease 15: 285-292.
Gantois I, Ducatelle R, Pasmans F, Haesebrouck F, Gast R, Humphrey TJ & Van Immerseel F (2009) FEMS Microbiology Reviews 33: 718-738.
Gast RK, Guard J, Guraya R & Locatelli A (2018) Journal of Food Protection 81: 876-880. Gast RK, Guard-Bouldin J & Holt PS (2004) Avian Diseases 48: 863-869. Gast RK, Guraya R, Guard-Bouldin J, Holt PS & Moore RW (2007) Avian Diseases 51: 40-44. Gast RK & Holt PS (2001) Poultry Science 80: 997-1002. Gast RK, Holt PS & Guraya R (2006) Journal of Food Protection 69: 1426-1429. Gast RK, Guraya R, Jones DR & Anderson KE (2013) Poultry Science 92:468-473. Gast RK, Guraya R, Jones DR, and Anderson KE (2014) Poult. Sci. 93: 728-733. Gole VC, Chousalkar KK, Roberts JR, Sexton M, May D, Tan J & Kiermeier A (2014a) PLoS ONE
9(3):e90987. Gole VC, Roberts JR, Sexton M, May D, Kiermeier A & Chousalkar KK (2014b) International
Journal of Food Microbiology 182-183: 18-25. Gomes AVS, Quinteiro-Filho WM, Ribeiro A, Ferraz-de-Paula V, Pinheiro ML, Baskeville E,
Akamine AT, Astolfi-Ferreira CS, Perreira AJP & Palermo-Neto J (2014) Avian Pathology 43: 82-90.
Green AR, Wesley I, Trampel DW & Xin H (2009) Journal of Applied Poultry Research 18(3): 605-621.
Guesdon V & Faure JM (2004) Animal Research 53(1): 45-57. Gurtler JB & Conner DE (2009) Foodborne Pathogens and Disease 6: 561-567. Haugh RR (1937) US Egg Poultry Magazine 43: 552-555, 572-573. Hidalgo A, Rossi M, Clerici F & Ratti S (2008) Food Chemistry 106(3): 1031-1038. Holt PS, Davies RH, Dewulf J, Gast RK, Huwe JK, Jones DR, Waltman D & Willian KR (2011)
Poultry Science 90(1): 251-262. Huneau-Salaün A, Michel V, Huonnic D, Balaine L & Le Bouquin S (2010) British Poultry Science
51(2): 163-169. Jones DR (2007) International Journal of Poultry Science 6: 157-162. Jones DR & Anderson KE (2013) Poultry Science 92: 2221-2225. Jones DR, Anderson KE & Guard JY (2012) Poultry Science 91: 1195-1202.
Aust. Poult. Science Symp. 2022...33
98

Jones DR, Anderson KE & Musgrove MT (2011) Poultry Science 90: 2063-2068. Jones DR, Cox NA, Guard J, Fedorka-Cray PJ, Buhr RJ, Gast RK, Abdo A, Rigsby LL, Plumblee
JR, Karcher DM, Robison CI, Blatchford RA & Makagon MM (2015) Poultry Science 94: 544-551.
Jones DR, Guard J, Gast RK, Buhr RJ, Fedorka-Cray PJ, Abdo Z, Plumblee JR, Bourassa DV, Cox NA, Rigsby LL, Robison CO, Regmi P & Karcher DM (2016) Poultry Science 95: 1116-1124.
Jones DR, Karcher DM & Abdo Z (2014) Poultry Science 93: 1282-1288. Jones DR, Karcher DM, Regmi P, Robison CO & Gast RK (2018a) Poultry Science 97: 2347-2355. Jones DR & Musgrove MT (2007) Journal of Food Protection 70(9): 2004-2007. Jones DR & Musgrove MT (2008) Journal of Food Safety 28(3): 346-354. Jones DR, Musgrove MT, Anderson KE & Thesmar HS (2010) Poultry Science 89: 582-587. Jones DR, Musgrove MT, Caudill AB & Curtis PA (2006) Journal of Food Safety 26: 264-274. Jones DR, Ward GE, Regmi P & Karcher DM (2018b) Poultry Science 97: 716-723. Karcher DM, Jones DR, Abdo Z, Zhao Y, Shepherd TA & Xin H (2015) Poultry Science 94(3):
485-501.Kim J & Slavik MF (1996) Journal of Food Protection 59(8): 859-863. Leasor SB & Foegeding PM (1989) Journal of Food Protection 52: 777-780. Leleu S, Messens W, De Reu K, De Preter S, Herman L, Heyndrickx M, De Baerdemaeker J,
Michiels CW & Bain M (2011) Journal of Food Protection 74(10): 1649-1654. Lin Q, Chousalkar KK, McWhorter AR & Khan S (2021) Food Control 125: 107996. Liu Y, Chen T, Wu Y, Lee Y & Tan F (2016) Food Chemistry 211: 687-693. Mallet S, Guesdon V, Ahmed AHM & Nys Y (2006) British Poultry Science 47: 30-35. Mertens K, Bamelis F, Kemps B, Kamers B, Verhoelst E, De Ketelaere B, Bain M, Decuypere E
& De Baerdemaeker J (2006) Poultry Science 85(9): 1670-1677. Mitchell D, Arteaga V, Armitage T, Mitloehner F, Tancredi D, Kenyon N & Schenker M (2015)
Journal of Agromedicine 20: 256-264. Moffatt CRM, Musto J, Pingault N, Miller M, Stafford R, Gregory J, Polkinghorne BG & Kirk MD
(2016) Foodborne Pathogens and Disease 13: 379-385. Novoa-Rama E, Bailey M, Jones DR, Gast RK, Anderson K, Jagpinder B, Taylor R, Oliver HF &
Singh M (2018) Foodborne Pathogens and Disease 15: 506-516. Rokonjac S, Bogosavljević-Bošković S, Pavlovski Z, Škrbić Z, Dosković V, Petrović MD &
Petričević V (2014) World’s Poultry Science Journal 70: 93-104. Schwaiger K, Schmied EMV & Bauer J (2008) Zoonoses and Public Health 55: 331-341. Singh R, Cheng KM & Silversides FG (2009) Poultry Science 88(2): 256-264. Sossidou EN & Elson HA (2009) World’s Poultry Science Journal 65: 709-718. Sulonen J, Kärenlampi R, Holma U & Hänninen ML (2007) Poultry Science 86(6):1223-1228. USDA (2000)
https://www.ams.usda.gov/sites/default/files/media/Shell_Egg_Standard%5B1%5D.pdf. Accessed: 30 NOV 2021.
USDA (2008) https://www.ecfr.gov/current/title-7/subtitle-B/chapter-I/subchapter-C/part-56. Accessed: 30 NOV 2021.
USDA (2020) https://www.ecfr.gov/current/title-9/chapter-III/subchapter-I/part-590. Accessed 29 NOV 2021.
Van Den Brand H, Parmentier HK & Kemp B (2004) British Poultry Science 45(6): 745-752. Wang H & Slavik MF (1998) Journal of Food Protection 61(3): 276-279. Wang XL, Zheng JX, Ning JH, Qu LJ, Xu GY & Yang N (2009) Poultry Science 88(7): 1485-
1492. Whiley H & Ross K (2015) International Journal of Environmental Research and Public Health
12: 2543-2556. Zhao Y, Shepherd TA, Li H & Xin H (2015) Poultry Science 94: 518-533.
Aust. Poult. Science Symp. 2022...33
99

EARLY LAY DIET DENSITY AND HEN SIZE: DO THEY AFFECT HEN PRODUCTIVITY AND EGG QUALITY IN LATE LAY?
W.I. MUIR1, Y. AKTER1, K. BRUERTON2 and P.J. GROVES3
Summary
Hen production and late lay egg quality were evaluated in heavier (HW) and lighter weight (LW) ISABROWN hens fed either a higher nutrient density (HND) or lower nutrient density (LND) diet during early lay. Eighteen-week-old pullets were assigned to either above breed standard weight (BSW), HW, or below BSW, LW treatment groups. Within each weight group birds were randomly allocated to an early lay HND or LND diet which was fed from 18 to 24 weeks of age (woa). Hens on the HND diet moved to LND diet at 25 woa. All birds were on the same diet from 25 woa, changing to a mid-lay diet at 40 woa and late lay diet at 78 woa. Hen performance was recorded from 18-89 woa and egg quality of 12 focal birds per treatment group was evaluated between 86-90 woa. Heavier weight birds had significantly higher body weight, daily and cumulative (cum.) feed intake (FI) and cum. egg mass at 89 woa compared to LW birds. Egg weight at 89 woa experienced treatment interactions with HW birds fed LND diet producing the heaviest eggs and LW birds on LND diet the lightest eggs. HW birds had numerically higher cum. eggs per hen continuing and cum. feed conversion ratio (FCR) to 89 woa. LW hens on HND had lowest FCR to 89 woa. Yolk colour and shell weight as percent egg weight were not different but shell thickness and breaking strength were significantly higher in birds that had received the HND diet. Overall, LW hens demonstrated benefits from receiving a HND diet during early lay.
I. INTRODUCTION
Pullet body weight (BW) has significant impact on hen sexual maturity, egg productivity and flock uniformity (Lacin et al. 2009). Australian layer flocks are frequently 100-300 grams heavier than breed standard weight (BSW) (Parkinson et al. 2015). These birds typically lay larger eggs than LW hens and higher BW is symptomatic of bird obesity which can result in the production of excessively large eggs with lower eggshell quality and poorer persistency of lay in late lay compared to smaller sized birds. Therefore, rearing pullets of BSW or slightly smaller size may improve laying persistency and egg quality when birds are to be in production beyond 80 woa.
Globally the layer industry is extending layer hen productive life to 100 woa to realise benefits in industry sustainability (Dunn, 2013). But, for this to succeed, longer term efficient hen productivity, hen health and eggshell quality need to be achieved (Bain et al. 2016). The better feed efficiency of smaller sized hens (Akter et al. 2019) is appealing in a longer laying cycle. However, as smaller hens have lower FI compared to larger sized hens (Harms et al. 1982) they may not consume adequate diet for their nutritional needs, especially when the diet is formulated on BSW daily FI (Leeson et al. 2001).
A diet of higher nutrient density (HND) at the start of lay could circumvent challenges of lower FI in LW hens enabling them to attain required nutrients within their lower daily FI.
1 School of Life and Environmental Sciences, Faculty of Science, Poultry Research Foundation, The Universityof Sydney, Camden, NSW 2570, Australia; [email protected] 2 PO Box 1362, Elanora, Queensland, 4221, Australia 3 Sydney School of Veterinary Science, Faculty of Science, Poultry Research Foundation, The University ofSydney, Camden, NSW 2570, Australia.
Aust. Poult. Science Symp. 2022...33
100

This diet may also prime these birds for sustained egg production. This study compared the persistency of lay, eggshell quality and feed efficiency of HW and LW point of lay pullets fed either a HND or LND diet during early lay.
II. MATERIALS AND METHODS
This study was a 2 × 2 factorial arrangement consisting of 2 nutrient densities (HND and LND) and 2, 18 woa bird weight groups: mean weight 1.65 kg (HW) and 1.49 kg (LW). When 16 woa, 240 ISABROWN pullets were purchased from a grower, transported to University of Sydney, Camden and housed in the high-rise layer shed in individual pens (25 × 50 × 50 cm) each with an individual feeder and waterer. Pullets were fed the LND diet ad libitum and allowed to acclimate for a 2-week period. All birds were weighed at 18 woa and 120 pullets were allocated to each weight group (HW or LW). Sixty pullets from each weight group were randomly assigned to either a HND (formulated on 90g FI/day; 2900 kcal/kg, 0.83% SID.Lys) or LND (formulated to 110g FI/day; 2725 kcal/kg; 0.737% SID.Lys) diet. They were fed the experimental diets from 18 to 24 woa. At 25 woa hens on HND diet were consuming at least 100g FI/day and were transferred to the LND diet. At 40 woa all hens were moved to a mid-lay diet (formulated to >110g FI/day; 2724.2 kcal/kg; 0.695% SID.Lys and then at 78 woa a late lay diet (formulated to 110g FI/day; 2752.63 kcal/kg; 0.728% SID.Lys) which they received until 90 woa. From 18-89 woa individual hen egg production (EP), egg weight (EW) and FI were measured to allow weekly determination of egg mass (EM), FCR and cum. production. Between 86-90 woa eggs from 12 focal birds /treatment group were assessed for egg quality each week. Data were analysed using a factorial ANOVA with 18 woa BW and diet nutrient density as the main effects.
III. RESULTS AND DISCUSSION
Typical of Australian conditions the 16 woa pullets were above BSW but HW and LW pullets were selected without drawing from the extremities of the flock. Hen weight and production are presented in Table 1. Production data is presented to 89 woa as bird sampling during 90 woa (data not shown) prevented those birds from contributing to a full week of production data. Therefore, to include at least 32 birds in each treatment group for statistical analysis, 89 woa data was used.
Average BW at 90 woa and 89 woa average daily FI, 18-89 cum. FI (CFI) and cum. egg mass (CEM) of HW birds were significantly higher (P < 0.05) than the LW birds. Heavy weight birds at 18 woa were 10.7% heavier than LW birds and 10.9% heavier at 90 woa. Hence LW birds did not undergo compensatory growth which has also been reported for HyLine Brown hens (Perez-Bonilla et al. 2012). HW birds had an average 9.2% higher cum. FI to produce an additional 5.3 % cum. egg mass or, for each additional 100 g BW at 90 woa they consumed an additional 4.5 g/d feed and produced an additional 0.36 g/d EW. In comparison Leeson and Summer (1987) identified an average increase of 3.5g FI and 1.2g EW for each 100 g increase in BW in Leghorn hens. Diet density only impacted EW at 89 woa, where a significant interaction (P = 0.02) resulted in the highest EW for HW LND diet treatment birds compared to LW LND diet birds. However, there were no significant differences in 89 woa egg production nor cumulative eggs produced per hen. Cumulative FCR was not significantly different however at 69 woa the LW hens had significantly lower cumulative FCR (data not shown) and continued with the lowest cum. FCR to 89 woa. In light of the preference for HW hens in Australia it is interesting to consider a simple cost benefit analysis to 89 woa on the cost of the additional 4.9 kg of feed consumed by HW birds with the return for their additional 7 eggs compared to LW hens.
Aust. Poult. Science Symp. 2022...33
101

Interestingly the HND diet did not initiate a significant reduction in FI to the end of 24 woa (data no shown). This lack of FI adjustment for diet nutrient density has been identified previously (Morris, 1968; Jalal et al. 2007) while adjustment in FI due to diet density has been reported by others (Perez-Bonilla et al. 2012; dePersio et al. 2015). The reason behind these differences is not immediately evident.
Table 1 - Hen weight, week 89 production and weeks 18-89 cumulative production
BW(18woa): 18 weeks of age body weight; HW: Heavier weight; LW: Lighter weight; DND: Diet nutrient density; HND: Higher nutrient density diet (formulated on 90g FI/day; 2900 kcal/kg, 0.83% SID.Lys); LND: Lower nutrient density diet (formulated to 110g FI/day; 2725 kcal/kg; 0.74% SID.Lys); BW (Kg)^: body weight at 90 woa; FI: average daily feed intake at 89 woa; EP(%): average percent egg production at 89 woa; EW: average egg weight at 89 woa; Cum eggs/hen: total number of eggs produced from 18-89 woa; CFI: Cumulative feed intake 18-89 woa; CEM: Cumulative egg mass 18-89 woa; CFCR: Cumulative feed conversion ratio 18-89 woa. #HND diet was fed to the end of 24 woa being replaced with LND diet. From 40 woa mid-lay diet (formulated to >110g FI/day; 2724.2 kcal/kg; 0.695% SID.Lys and from 78 woa late lay diet (formulated to 110g FI/day; 2752.63 kcal/kg; 0.728% SID.Lys) were fed to all birds. abc Means within column not sharing a common suffix are significantly different at P < 0.05.
The effects of BW and diet nutrient density on egg quality assessed across 86-90 woa are presented in Table 2. Haugh units of birds on HND diet were significantly lower (P = 0.05) than the LND diet; however both measures were above 90. Perez-Bonilla et al. (2012) also observed a significantly lower Haugh unit in eggs from 56-59 woa Hy-line Brown hens fed a higher energy diet, but it should be noted those hens consumed the treatment diets from 24-59 woa, as opposed to this study where the dietary treatments were fed in early lay only. dePersio et al (2015) also noted a decline in Haugh unit in Hy-line W36 hens between 33-70 woa when hens had consumed the higher energy compared to the lower energy diet from 19-70 woa. Yolk colour and % shell weight were not different, the latter also being reported by Perez-Bonilla et al (2012). As seen in Table 2 percent shell was at or above 9.7% being the minimum below which the number of shell fractures tends to increase (Abdallah et al 1993). Importantly the HND diet fed during early lay resulted in significantly thicker eggshell (P = 0.03) and higher (P = 0.05) shell breaking strength. Literature on eggshell thickness and shell breaking strength due to diet nutrient density is limited, however both dePersio et al (2015) and Hassan et al (2013) found no difference in shell breaking strength with higher energy diets.
While the HW birds had the highest cum FI, cum EM and cum. FCR, LW hens and particularly the LW birds on the HND diet had the lowest cum FCR and no difference in egg production. The HND diet also increased the shell thickness and shell breaking strength. Hence LW hens can perform across a long laying cycle with benefits in their production and egg quality from a HND diet fed in early lay. These treatments should be evaluated in cage free systems.
Treatment BW (Kg)^
FI (g/d)+
EP (%)+
EW (g)+
Cum eggs/ hen
CFI (Kg)
CEM (Kg)
CFCR
BW (18woa) HW 2.23 111 81.7 62.4 469.7 58.4 27.6 2.14 LW 2.01 101 80.8 61.6 462.6 53.5 26.2 2.10 DND HND# 2.12 107 81.3 61.9 464.8 55.4 26.8 2.11 LND 2.11 105 81.2 62.1 467.5 56.5 27.0 2.12 Interaction HW*HND 2.25 111 83.2 61.5a,b 464.9 57.9 27.1 2.16 HW*LND 2.20 111 80.3 63.4a 474.5 58.9 28.1 2.12 LW*HND 1.99 103 79.4 62.3a,b 464.7 52.9 26.5 2.07 LW*LND 2.02 99 82.1 60.8b 460.4 54.2 25.9 2.13 P- ValuesBW < 0.0001 <0.0001 0.83 0.21 0.29 < 0.0001 0.02 0.33 DND 0.78 0.47 0.98 0.81 0.70 0.29 0.69 0.85 BW*DND 0.31 0.30 0.52 0.02 0.31 0.86 0.14 0.21
Aust. Poult. Science Symp. 2022...33
102

Table 2 - Egg quality at 86-90 weeks of age
BW(18woa): 18 weeks of age body weight; HW: Heavier weight; LW: Lighter weight; DND: Diet nutrient density; HND: Higher nutrient density diet (formulated on 90g FI/day; 2900 kcal/kg, 0.83% SID.Lys); LND: Lower nutrient density diet (formulated to 110g FI/day; 2725 kcal/kg; 0.74% SID.Lys); #HND diet was fed to the end of 24 woa being replaced with LND diet. From 40 woa mid-lay diet (formulated to >110g FI/day; 2724.2 kcal/kg; 0.695% SID.Lys and from 78 woa late lay diet (formulated to 110g FI/day; 2752.63 kcal/kg; 0.728% SID.Lys) were fed to all birds. abc Means within column not sharing a common suffix are significantly different at P < 0.05.
ACKNOWLEDGMENT: This research was funded by Australian Eggs
REFERENCES
Abdallah AG, Harms RH & El-Husseiny O (1993) Poultry Science 72: 2038-2043. Akter Y Groves PJ, Liu SY, Moss AF, Anene D & O’Shea, CJ (2019). Proceedings of the
Australian Poultry Science Symposium 30: 249-252. Bain MM, Nys Y & Dunn IC (2016) British Poultry Science 57: 330-338. dePersio S, Utterback PL, Utterback CW, Rochell SJ, O’Sullivan N, Bregendahl K, Arango J,
Parsons CM & Koelkebeck KW (2015) Poultry Science 94: 195-206. Dunn IC (2013) Proceedings of 9th European Symposium on Poultry Nutrition. Potsdam
Germany Hassan MR, Choe HS, Jeong YD, Hwangbo J and Ryu KS (2013) Italian Journal of Animal
Science 12: 60-65. Harms RH, Costa PT & Miles RD (1982) Poultry Science 61: 1021-1024. Jalal MA, Scheideler SE & Pierson EM (2007) Journal of Applied Poultry Research 16: 289-
295. Lacin E, Yildiz A, Esenbuga N & Macit M (2008) Czech Journal of Animal Science 53: 466–
471. Leeson S & Summers JD (1987) Poultry Science 66: 1924–1928. Leeson S, Summers JD & Caston LJ (2001) Journal of Applied Poultry Research 10: 46-52. Morris TM (1968) British Poultry Science 9: 285-295. Parkinson GB, Roberts J & Horn R (2015) Australian Egg Corporation Limited. 1UN112. 1. Perez-Bonilla A, Novoa S, Garcia J, Mohiti-asli M, Frikha M and Mateos GG (2012) Poultry
Science 91: 3156-3166.
Haugh Unit
Yolk Colour
Shell weight (%)
Shell Thickness (mm)
Shell breaking strength (g)
BW(18woa) HW 92.7 9.15 9.7 0.35 3799 LW 92.6 9.01 9.9 0.36 3781 DND HND# 90.6 9.15 9.9 0.36 3896 LND 94.8 9.01 9.8 0.35 3683 Interaction HW*HND 91.6 9.30 9.7 0.36 3884 HW*LND 93.8 9.00 9.7 0.35 3714 LW*HND 89.5 9.01 10.1 0.37 3908 LW*LND 95.7 9.02 9.8 0.35 3653 P-ValueBW 0.98 0.23 0.11 0.64 0.86 DND 0.05 0.20 0.37 0.03 0.05 BW*DND 0.35 0.18 0.19 0.15 0.69
Aust. Poult. Science Symp. 2022...33
103
ADDING A MACROALGAE BLEND TO COMMERCIAL LAYING HEN DIETS IMPROVES EGG QUALITY AND BODY WEIGHT GAIN
J.S. SANDS1, L.R. PARK2, D. CURRIE2 and H. GRAHAM1
Summary
The effect of a selected blend of brown, green and red macroalgae on egg production and egg quality was evaluated as a functional ingredient in diets fed to commercial laying hens from the onset of laying (22 weeks of age) for a period 168 days. A total of 288 Hyline, point-of-lay pullets were randomly allocated to 72 cages. The birds were fed one of 3 dietary treatments with increasing concentration of a proprietary macroalgae blend (MAB): Control (0 g/kg), Control plus MAB at 5 g/kg feed and Control plus MAB at 10 g/kg feed. Diets met or exceeded the NRC requirements (1994) for laying hens and were presented as mash with hens having ad libitum access to feed throughout the study. Diets were assigned to replicate cages using a completely randomised design, with each group consisting of 24 replicate cages of 4 birds. Under the conditions of the study, MAB did not have a significant influence on egg production rate or egg weight (P>0.05). However, hens offered diets with MAB had higher (p=0.04) body weight gain than the Control group offered diets without the MAB. Egg albumen height and consequently Haugh units were significantly higher (P=0.02) for eggs from hens offered the MAB. These findings suggest MAB may have a positive impact on egg quality factors.
I. INTRODUCTION
Ingredients other than in-feed antimicrobial compounds can offer a sustainable approach to improving gastrointestinal (GI) health and animal performance. Efficient egg production and egg quality are of major importance to the poultry industry, but their optimisation is dependent on numerous factors. Nutrition and disease factors are among the most common factors affecting egg production and quality (Roberts, 2004). It follows that a healthy GI tract is required for efficient digestion and absorption of nutrients and, consequently, for egg production and egg quality. Marine macroalgae represent a promising feed ingredient, due to the presence of several bioactive components that have been reported to benefit GI health (Salehi et al. 2019). These bioactive compounds including polysaccharides, peptides, essential fatty acids, antioxidants such as polyphenols and other phytogenic compounds vary significantly between macroalgal species (Salehi et al., 2019). This variation in content of bioactive compounds between algae species provides opportunities for selection of different species to vary the amounts of specific categories of bioactive compounds that benefit GI health in laying hens. The authors hypothesised that a blend of marine macroalgae containing varying proportions of selected brown, green and red algal species may convey benefits that improve egg production and egg quality in commercial hens.
II. METHODS
Wheat and soyabean meal-based diets were formulated to be iso-nutritive and to meet the recommended nutrient requirements of the NRC (1994) for layers (Table 1). Three dietary treatments were produced by increasing the concentration of a proprietary, marine macroalgae blend (MAB, OceanFeedTM, supplied by Ocean Harvest Technology Ltd.) to provide a Control
1Ocean Harvest Technology Ltd., Heaton House, Fareham, Hampshire, UK PO16 8AA. [email protected] 2 Roslin Nutrition Ltd., Longniddry, East Lothian, Scotland EH32 0PX.
Aust. Poult. Science Symp. 2022...33
104

(0 g/ kg), Control plus MAB at 5 g/ kg feed and Control plus MAB at 10 g/ kg feed. Diets were fed in two phases, weeks 1-12 and weeks 13-24. The diets were presented to the birds in mash form and were prepared without the inclusion of growth promoting antimicrobials. Diets were analysed for nutritional homogeneity prior to the start of the trial. The hens were allowed continuous access to feed and water throughout the study.
Table 1 - Composition and calculated analyses of basal diets for phases 1 and 2 Ingredients, % 0 – 12 Weeks 13 – 24 Weeks Wheat 49.1 49.4 Soybean meal, 48% CP 22.2 24.3 Maize 15.0 12.5 Soya oil 2.67 2.26 Dical-Aliphos 40 1.40 1.66 Salt 0.37 0.37 Limestone 8.47 8.70 L-Lysine HCl 0.005 – DL-Methionine 0.195 0.230 L-Threonine 0.055 0.068 Roslin pigment 0.150 0.150 Vitamin and mineral Premix1 0.319 0.319 Calculated analyses2 ME Poultry, MJ/kg 11.5 11.2 Crude protein, % 17.2 18.0 Crude fat (acid hydrolysis), % 5.1 4.6 Crude fibre, % 2.1 2.2 Ash, % 12.6 13.1 Dig. Lysine (poultry), % 0.724 0.770 Dig. Methionine (poultry), % 0.422 0.465 Dig. Meth+cyst (poultry), % 0.669 0.722 Dig. Threonine (poultry), % 0.557 0.597 Calcium, % 3.64 3.80 Total phosphorus, % 0.590 0.648 Digestible P Layers 0.471 0.452 Sodium, % 0.160 0.160 Potassium, % 0.746 0.785 Chloride, % 0.264 0.263 1Details of vitamin, mineral and enzyme premix available on request.
This study was conducted in accordance with Regulations (EC) No 1831/2003 (EC, 2003) and No 429/2008 (EC, 2008) as outlined in the European Food Safety Authority’s (EFSA) technical guidance document on the assessment of efficacy of feed additives (EFSA, 2018). A total of 288 Hyline pullets (Gallus gallus domesticus) at the point-of-lay were randomly allocated to 72 cages, 4 birds per cage in 3 blocks of 24 cages. Three dietary treatments were randomly allocated to cages within blocks providing 24 replicate cages per block. The house was cleaned prior to placement and was equipped with programmable artificial lighting, automated gas heating and forced ventilation. The temperature inside the building was maintained as per breeder recommendations. A 24-hour lighting programme of 16 hours light and 8 hours dark was maintained throughout the trial. The 3 dietary treatments were allocated at random to cages with blocks. Each 4-bird cage served as an experimental unit, providing 24 replicates per treatment. Zootechnical performance parameters measured included: feed intake, egg number, egg weight, average egg weights, egg mass, hen body weight, feed conversion efficiency and incidence of cracked, soft-shelled, and dirty eggs. Egg production (%/hen/day) was calculated as [total egg number per (number hens * number of days hens were alive) x 100]. Feed conversion efficiency (FCE) was calculated as [Egg mass (g/cage/day) per average daily feed intake (g/cage/day)].
Aust. Poult. Science Symp. 2022...33
105

Prior to statistical analyses, the data were assessed for outliers using the Box Plot method of JMP® PRO 14.2 (SAS Institute Inc., Cary, NC) and assumptions of Analysis of Variance (ANOVA) using Shapiro–Wilk test for testing normal distribution and Welch test for testing equal variances, respectively. Where data met the assumptions of the ANOVA test, data were analysed as a randomised completely block design by JMP® PRO 14.2 using the Fit Model. Treatment was included as a main effect and block as random effect in the model. The results were presented as the least squares means. Statistical significance was declared at P ≤ 0.05. The Tukey-Kremer test was used to separate differences between means. Data that did not meet the assumptions for ANOVA were transformed to facilitate meeting of the assumptions or non-parametric analysis was employed if assumptions for ANOVA were not met. For all response criteria, cage served as the experimental unit.
III. RESULTS
Body weight of hens were not different among dietary treatment groups; however, the change in body weight during the trial period tended to be higher in hens offered diets containing MAB (p=0.065, Table 2). Egg production, egg mass, egg weight and feed conversion efficiency were not significantly affected by diet over the 168-day study period. However, for egg quality parameters, the average albumen height (mm) and Haugh units were increased by in eggs from hens fed diets containing the MAB (Table 3, Figure 1).
Table 2 - Egg production, average daily feed intake, final body weight, body weight change and feed conversion efficiency of laying hens fed a wheat-soybean meal-based diets with the addition of a marine
macroalgae blend* at 0, 5 or 10 g/ kg of feed over a period of 24 weeks. Concentration of Macroalgae Blend
Parameter 0 g/ kg 5 g/ kg 10 g/ kg SEM P-value
Egg Production Rate (%/hen/day)1 92.6 93.4 93.4 0.43 0.50 Average Daily Feed Intake (g/cage/d)2 513 513 516 2.5 0.68
Body weight (g, week 0)1 1938 1921 1904 10.9 0.13
Body weight (g, week 24)1 2208 2220 2232 16.7 0.48 Body Weight Gain (g, weeks 0-24)1 243 271 299 13.1 0.04
Feed Conversion Efficiency1 0.458 0.459 0.459 0.004 0.88 *A selected blend of green, brown and red macroalgae optimised to deliver a range of soluble, non-starch polysaccharides. SEM = Standard error of mean; a, b, c Denotes significance within a row (P≤0.05); 1Data analysed using parametric tests (ANOVA) with P-value shown; 2Data analysed using non-parametric tests (Wilcoxon test) with Chi-square estimate shown
Table 3: Egg Quality (egg weight, egg mass, albumen height and yolk colour) from laying hens fed a wheat-soybean meal-based diets with the addition of a marine macroalgae blend* at 0, 5 or 10 g/ kg of
feed over a period of 12 weeks. Concentration of Macroalgae Blend
Parameter 0 g/ kg 5 g/ kg 10 g/ kg SEM P-value
Average Egg Weight (g/egg)1 62.6 62.5 62.9 0.29 0.60 Egg Mass (g/cage/day)2 234.9 235.8 235.4 2.05 0.55
Albumin Height (week 12)2 4.43a 6.00b 6.01b 0.438 0.016
Yolk Colour (week 12)2 5.75 5.96 5.46 0.410 0.58 Average Haugh Units 102.9a 104.5ab 106.8b 0.80 0.004 *A selected blend of green, brown and red macroalgae optimised to deliver a range of soluble, non-starch polysaccharides. SEM = Standard error of mean; Different superscripts denotes significant differences between means within a row (P≤0.05); 1Data analysed using parametric tests (ANOVA) with P-value shown; 2Data analysed using non-parametric tests (Wilcoxon test) with Chi-square estimate shown
Aust. Poult. Science Symp. 2022...33
106

Figure 1 - Haugh Unit (HU, an index of egg quality) of eggs from hens fed diets containing a marine macroalgae blend at 0, 5 and 10 g/ kg of feed. 1HU was measure using the formula: HU=100log (H-1.7W0.37+7.6) where H is the height (in millimeters) of the albumen, and W is the weight of the egg. Values shown are means +/- SEM; different superscripts, denotes significant differences between means (P≤0.05).
IV. DISCUSSION
While egg production was similar, hens offered diets with MAB tended to have higher body weight gain after consuming the diets for 168 days. An increase in weight suggests a more efficient extraction of nutrients; however, this was not confirmed by improved feed conversion efficiency. Haugh Units (HU), which combines the egg mass with the albumen height, is generally accepted as an indicator of egg quality (Eisen et al. 1962). An improvement in albumin height and in HU noted with dietary MAB in this trial suggests an improvement in overall egg quality. Given HU is widely accepted as a key indicator of egg quality and freshness (Eisen et al. 1962, Williams, 1992), it is an important value metric for egg producers. Further studies involving supplementation with the MAB used in this study, to greater numbers of laying hens over longer periods of time are proposed to confirm the possible benefits for laying hen welfare and productivity. Further, a more detailed assessment of the quality factors and the composition of eggs from hens fed diets containing MAB should be included in future studies.
REFERENCES
Eisen, EJ, BB Bohren & HE McKean (1962) Poultry Science 41(5): 1461-1468. European Food Safety Authority (2018) EFSA Journal 16(5): 5274 Salehi B, Sharifi-Rad J, Seca AML, Pinto DCGA, Michalak I, Trincone A, Prakash Mishra A,
Nigam M, Zam W & Martins N (2019) Molecules 24(22): 4182. NRC, 1994. National Research Council, (1994) Nutrient Requirements of Poultry. 9th Rev. Ed.
National Academy Press. Washington DC. USA. Roberts, JR (2004) Journal of Poultry Science 41: 161-177. Williams, KC (1992) World’s Poultry Science Journal 48: 5-16.
103a 105ab
107b
Aust. Poult. Science Symp. 2022...33
107

FOOD WASTE-BASED DIETS ARE AN EFFECTIVE ALTERNATIVE FEED FOR LAYING HENS
T.H. DAO1, N.K. SHARMA1, R. SWICK1, N. BOYLE2 and A.F. MOSS1
An estimated 7.3 million tonnes of food waste are dumped annually in Australia, leading to substantial environmental and economic losses (Arcadis, 2019). Additionally, poultry feed represents the majority of production cost. Therefore, an experiment was designed to evaluate food waste as a feed for laying hens. A total of 150 Isa Brown laying hens at 24 weeks of age were allocated to 3 treatments (50 replicates per treatment) on the basis of body weight to maintain uniformity between the treatments. Treatments consisted of a control wheat-sorghum-soybean meal-based diet, a food waste-based diet, and a 50-50 blend. Feedstuffs were analysed for nutrient content including dry matter, gross energy, crude protein, amino acids, crude fat, crude fiber, and mineral composition using standard procedures (AOAC, 1994) prior to diet formulation. Food waste streams included fruit/vegetable meal, spent brewers grain, fish offal/spent brewers grain blend, hospital/nursing home food scraps, pub/restaurant food scraps, meat and bone meal, bakery meal and oyster shell meal. Waste streams were heat processed (for biosecurity) and blended into a complete mash feed. Diets were formulated to Isa Brown minimum nutrient requirements. In meeting the nutrient requirements, the food waste-based diet contained higher concentrations (g/kg) of crude protein (256 vs 178), fat (134.4 vs 52.8), fibre (89.1 vs 27.8), available phosphorus (10.2 vs 4.5) and sodium (4.5 vs 1.8) compared to the control diet. Hen performance was measured from weeks 24 to 43. The average egg mass (g/day) of all hens was slightly greater than breed specifications for Isa Brown hens (60.0 vs 58.9), as was feed intake (128 vs 112) and FCR (2.137 vs 1.906), likely due to the cold weather during the experimental period. Hen weight, egg weight, hen day egg production and egg mass did not significantly differ between dietary treatments. However, hens offered the food waste-based diet consumed significantly less feed (122 vs 133 g/day; P < 0.001) and therefore had a more efficient FCR (2.068 vs 2.216; P < 0.001) than hens offered the control diet. Internal and external egg quality was measured at 43 weeks. Parameters (albumen height and weight, Haugh unit, yolk index, shell breaking strength, shell thickness and weight, egg shape index and reflectivity) were not significantly different between dietary treatments. Yolk colour was significantly higher (darker) in eggs laid by hens offered the food waste-based diet as compared to their control counterparts (13.5 vs 12.5; P < 0.001; the same level of pigment was added to both diets). Hens offered the food waste-based diet had slightly wetter excreta (78.2 vs 75.4% excreta moisture; P = 0.005), but energy digestibility did not differ. There was one mortality during the study and mortality was not related to dietary treatment. This study is continuing to 63 weeks of production, but only the first 20 weeks of data are presented as the study is ongoing. Hens fed the 100% food waste-based diet had improved performance in comparison to the commercial wheat-sorghum-soybean meal-based diet in the present study. The improved performance may be due to the higher fibre, fat, protein and phosphorus content of the diet. Further research is required to explore the digestibility, nutrient variability and optimal particle sizes of waste streams to optimise diets for commercial production. However, it is clear that food waste has potential as a feedstuff for laying hens that will reduce the environmental burden of landfill and provide a cheaper alternative to traditional feedstuffs. ACKNOWLEDGEMENTS: The authors would like to thank Food Recycle for funding this project and for their guidance, encouragement and support.
AOAC (1994) Association of Official Analytical Chemists, Washington, D.C. Arcadis (2019) https://www.environment.gov.au/system/files/pages/25e36a8c-3a9c-487c-a9cb-66ec15ba61d0/files/national-food-waste-baseline-final-assessment.pdf accessed 2 Aug 2021.
1 School of Environmental and Rural Science, University of New England, Armidale, NSW, 2351, Australia, [email protected] 2 Food Recycle Ltd, Candelo, NSW, 2550, Australia
Aust. Poult. Science Symp. 2022...33
108

AN ASSESSMENT OF THE USE OF ESSENTIAL OILS IN THE DIET OF LAYING HENS ON THE PERSISTENCE OF RATE OF LAY
E. K. M. RAIMUNDO1, D. S. SANTOS2, M. B. LIMA3, M. G. B. L. SOUSA4, H. C. COSTA5, L. M GOMES6 and E.P. SILVA7
Summary
This research aimed to study the effect of supplementation of essential oils (EOs) on the egg production of older laying hens and from these data analysed whether this supplementation delayed the aging of hens. One hundred and twenty-eight commercial laying hens Lohmann LSL-Lite lineage 80 weeks old were used. The experimental design was completely randomized with two treatments, eight replicates of eight hens each, totalling 16 experimental units. The treatments consisted of a control diet without EO supplementation and another consisting of a control diet + EO supplementation. A mix of functional oils from copaiba, peppers and cashew nut shell was used with inclusion of 300 g/ton. The experimental period was 112 days, using only the average egg production of the last four weeks, from 92 to 96 weeks of age. To calculate the age of the laying hens, the relationship between egg production (EP, %) and the predicted age of hens in weeks (t) was first adjusted using data from the lineage manual. To find the function of the egg production curve (f), post-peak egg production data, from 27 to 95 weeks of age, were used which describe the rate of decay of EP as a function of the increase in t. The equation t = -ln(EP/λ)/β was used to calculate the value of t for some EP. Based on the EP values of each experimental unit the respective t values for the beginning and end of the experiment were calculated. The values of EP and t at the beginning and end were submitted to ANOVA, considering a significance of 0.05 to reject H0. For the final condition after 16 weeks of the hens being fed diets supplemented with EOs, a significant effect was verified between treatments, with an EP of 92.2%, this value was approximately 7% higher than the control diet, without the supplementation of EOs. There was a significant effect for the predicted age variable (P < 0.01). According to the EP, hens supplemented with EOs in the diets showed a response close to a hen at 49.1 weeks of age, which corresponded to a 19-week difference when compared to the predicted age of the hens not supplemented with EOs. The difference between predicted age (lineage manual) and chronological (actual) is based on the organic state of the bird which can be adjusted by the rearing conditions of the hens. In this research, it was demonstrated that the period of use of laying hens can be extended, depending on nutrition aimed at improving the REDOX state. The supplementation of 300 g/ton of mix of functional oils in the diet of commercial laying hens improved egg production and longevity of production of hens.
I. INTRODUCTION
A consistent definition of aging was presented by DiLoreto and Murphy (2015). According to these authors, aging is the result of the non-functionality of the animal's cells, tissues and organs, caused by the stochastic degradation of its parts. This definition considers the changes
1 UNESP, São Paulo State University, Campus of Jaboticabal, SP, Brazil, [email protected] 2 UNESP, São Paulo State University, Campus of Jaboticabal, SP, Brazil, [email protected] 3 UNESP, São Paulo State University, Campus of Jaboticabal, SP, Brazil, [email protected] 4 UNESP, São Paulo State University, Campus of Jaboticabal, SP, Brazil, [email protected] 5 UNESP, São Paulo State University, Campus of Jaboticabal, SP, Brazil, [email protected] 6 Phytus Feed Agroindustrial SA, São José dos Campos, SP, Brazil, [email protected] 7 UNESP, São Paulo State University, Campus of Jaboticabal, SP, Brazil, [email protected]
Aust. Poult. Science Symp. 2022...33
109

that have occurred in laying hens that affect the rate of lay (Gu et al. 2021a, 2021b). The main changes are related to the digestive, reproductive system, endocrine glands and metabolic pathways (Pinto et al. 2020; Gu et al. 2021a, 2021b). The study by Gu et al. (2021a) showed that the antioxidant capacity of commercial laying hens at 75 weeks was 30% lower compared to values for hens at 28 weeks of age. On the one hand, interest in the mechanisms involved in aging has grown (DiLoreto and Murphy 2015; Gloux et al. 2019), on the other hand, there is a demand from producers to increase the period of use of commercial animals. Some information is still scarce; for example, how long can the aging of laying hens be delayed? In commercial production, this can be a tool to increase persistence of rate of lay and improve planning for placement of new flocks. Several studies have shown that supplementing diets with antioxidant molecules such as essential oils (EOs) can delay aging (Ding et al. 2017; Feng et al. 2021), maintaining or improving egg production (Jia et al. 2016; Jiang et al. 2020). These results have been confirming the effectiveness of the molecules; however, doubt remains about the extent of this effect applied to the period of use of the hens. Using the egg production curve (f), which represents the genetic potential of hens as a function of bird age (t) to interpret the response at t, using the inverse function (f -1), may assist in determining the period of use of hens. Among the models used to interpret egg production, Wood's (1967) function has been preferred, but when applied to f -1, it results in a non-trivial solution. Considering the above, the current research aimed to evaluate the effect of dietary supplementation of essential oils on the egg production of aged laying hens and, through the adjusted curve, calculate the age of the corresponding hen, using f -1 and compare whether the supplementation of essential oils delayed the aging of hens.
II. METHOD
The study was conducted at the Laboratory of Poultry Sciences, Faculdade de Ciências Agrárias e Veterinárias, UNESP, Campus de Jaboticabal, SP, Brazil. All procedures adopted in the research were approved by the Ethics Committee on the Use of Animals (CEUA) of Universidade Estadual Paulista, under protocol nº 1481/21. One hundred twenty-eight commercial laying hens of the Lohmann LSL-Lite lineage, 80 weeks old, were used. The design used was completely randomized with two treatments, eight replicates of eight hens each, totalling 16 experimental units. The treatments consisted of a control diet without EO supplementation and another consisting of a control diet + EO supplementation. A mix of functional oils from copaiba, peppers and cashew nut shell (Ave Pepper Phytus - Phytus Feed®) was used with inclusion of 300 g/ton. Water and feed were provided ad libitum and the lighting program was 16 hours of light. The density used was 625 cm²/bird. The experimental period was 112 days, using only the egg production averages of the last four weeks, from 92 to 96 weeks of age. To calculate the predicted age of the hens, the relationship between egg production (EP) and t was first adjusted using data from the breeder manual. Only post-peak production data, from 27 to 95 weeks of age, which describe the decline in EP as a function of the increase in t given in weeks (f) were used. The function used was: EP =λe-βt, where λ and β are estimated parameters. To calculate the value of t in weeks for some EP (%) the following equation was used: f -1: t = -ln(EP/λ)/β). The adjusted values of λ and β were 115 and 0.0043, respectively. Based on the EP values of each experimental unit, the respective t values for the beginning and end of the experiment were calculated. The values of EP and t at the beginning and end of the test were submitted to ANOVA, considering a significance of 0.05 to reject the H0.
Aust. Poult. Science Symp. 2022...33
110

III. RESULTS
The results obtained from the ANOVA are shown in Table 1. As expected, the H0 for the initial condition of the EP was accepted, indicating that the treatments started under the same conditions, obtained with the standardization of the experimental units at the beginning of the trial. The predicted age of hens calculated from the EP showed the same degree of significance for accepting H0. When considered, the absolute value of the predicted age of the hens at the beginning of the trial diverged with the chronological age of the lineage manual. The chronological age of hens at the start of the assay was 80 weeks, while the prediction (t) calculated using the observed state variable EP was 55.8 weeks. After 16 weeks of trial, for hens fed diets supplemented with EOs, a significant effect was verified (P < 0.01) between treatments with EP of 92.2% and approximately 7% greater than the control diet without EO supplementation. A significant effect was verified for the predicted age variable (P < 0.01). According to the EP, hens fed with EOs showed a similar response to hens at 49.1 weeks of age, which corresponded to a 19-week difference (P < 0.01) when compared to the predicted age of hens not supplemented with EOs.
Table 1 - cumulative effect after 16 weeks under dietary treatment with essential oils of laying hens from 80 to 96 weeks of age¹
Variables Treatments Mean² Minimum Maximum General P-value CV
Initial condition
Rate lay Observed, %
Without EOs 90.4 90.2 90.7 90.5 0.380 0.3
With EOs 90.5 90.2 90.8
Age Predicted, weeks
Without EOs 55.9 55.2 56.5 55.8 0.381 1.1
With EOs 55.6 54.9 56.5
Final condition
Rate lay Observed, %
Without EOs 85.8 78.1 92.4 89.3 0.004 4.5
With EOs 93.2 91.1 98.0
Age Predicted, weeks
Without EOs 68.3 51.0 89.9 59.3 0.004 18.0
With EOs 49.1 37.3 54.3 ¹Suplementação de 300 g/ton of mix of functional oils from copaiba, peppers and cashew nut shell ²Valores usados para ANOVA ³Coefficient of variation
IV. DISCUSSION
We expected that H0 would be rejected due to decreased egg production in the control group, without supplementation of EOs in the diet. In absolute values, the EP of hens supplemented with EOs increased at the end of the 16 weeks of the experiment, when we expected them only to maintain egg production. These results corroborate previous results that found that older laying hens responded positively to supplementation with nutritional additives and improved antioxidant capacity (Ding et al. 2017; Feng et al. 2021). In addition to their antioxidant function by scavenging free radicals, the EOs have an antioxidant action by inhibiting the activation pathways of nuclear factors, such as nuclear factor erythroid 2-related factor 2 (Nrf2), considered the master regulator of the cellular antioxidant response (Su et al. 2018). According to Gu et al. (2021a) the antioxidant capacity of aged commercial laying hens (75 weeks) is reduced by 30% compared with younger hens; however, the hens used in this research started the experiment at 80 weeks of age and possibly presented an even greater deficit than that reported by Gu et al. (2021a). This hypothesis may explain the 19-week difference in predicted age between treatments with and without EO supplementation. This research offers a methodological proposal to evaluate the effect of additives on the longevity of hens, which we propose here as the predicted age, using data from the lineage manual. The difference between the predicted and chronological age is based on the organic state of the hen and, in
Aust. Poult. Science Symp. 2022...33
111

this research, it was demonstrated that the period of use of laying hens can be extended depending on the rearing conditions, especially using nutrition aim at improving the REDOX state. The supplementation of 300 g/ton of mix of functional oils in the diet of commercial laying hens improved egg production and longevity of laying hens from 80 to 96 weeks of age.
ACKNOWLEDGEMENTS
We wish to thank the Phytus Feed® for financial support of research.
REFERENCES
DiLoreto R & Murphy CT (2015) Molecular biology of the cell 26: 4524-4531. Ding X, Yu Y, Su Z & Zhang K (2017) Animal Nutrition 3: 127-131. Feng J, Lu M, Wang J, Zhang H, Qiu K Qi G & Wu S (2021) Journal of Animal Science
and Biotechnology 12: 72. Gloux A, Duclos MJ, Brionne A, Bourin M, Nys Y & Réhault-Godbert S (2019) BMC
Genomics 20: 821. Gu YF, Chen YP, Jin R, Wang C, Wen C & Zhou YM (2021a) Poultry Science 100:101478. Gu YF, Chen YP, Jin R, Wang C, Wen C & Zhou, YM (2021b) Poultry Science 100:
100949. Jia Y, Yang M, Zhu K, Wang L, Song Y, Wang J, Qin W, Xu Z, Chen Y & Liu G (2016)
Scientific Reports 6: 39799. Jiang J, Qi L, Dai H, Hu C, Lv Z, Wei Q & Shi F (2020) Animal Feed Science and
Technology 269: 114682. Pinto C, Ninfole E, Gaggiano L, Benedetti A, Marzioni M & Maroni L (2020) Seminars in
Liver Disease 40: 225-232. Su, Guoqi, Zhou, Xuanwu, Wang, Yu, Chen, Daiwen, Chen, Guang, Li, Yan, He, Jun
(2018) Lipids in health and disease 17: 1-10. Wood, PDP (1967). Nature 216: 164-165.
Aust. Poult. Science Symp. 2022...33
112

DETERMINING THE OPTIMAL INCLUSION RATE OF 1-MONOGLYCERIDES OF BUTYRIC, CAPRIC AND CAPRYLIC ACID IN HEALTHY LAYING HENS
T.Z. SIBANDA1, M. KOLAKSHYAPATI1, J. de SOUZA-VILELA1, T.A. CHUNG1, S BARZEGAR1, L. HALL2, L. LI3, R. AGRA4 and I. RUHNKE1
1-Monoglycerides of short and medium chain fatty acids (monobutyrin, monocaprin andmonocaprylin) have shown positive effects on cell metabolism, intestinal integrity and immunesystem (Calder 2008). However, little is known about their effect on laying hen health,performance and egg quality. Therefore, this study was designed to add further insight in theapplied benefits as well as optimal inclusion level of 1-monoglycerides of butyric, capric andcaprylic acid on hen performance, their immune health, focusing on external and internal eggquality as well as eggshell ultrastructure.
A total of 256, 15-week-old unchallenged and healthy Isa Brown hens were placed in pairs in conventional cages equipped with two nipple drinkers and two trough feeders. Hens were randomly allocated into 4 treatment groups (32 replicates/treatment): 0%, 0.05%, 0.1% and 0.2% 1-monoglycerides of butyric, capric and caprylic acid (BalanGut® LS P, BASF Ludwigshafen, Germany) inclusion level. After one week of adaptation, the hens were fed with isocaloric and isonitrogenous experimental diets that met or exceeded the nutrient requirements as specified by the breeder manual until hens were 30 weeks of age. Production performance and egg quality parameters were investigated weekly while eggshell ultrastructure, yolk vitamin content and intestinal intraepithelial lymphocytes were determined when hens were 30 weeks of age. A dose-dependent regression analysis was used to investigate the impact of the 4 inclusion levels of 1-monoglycerides of butyric, capric and caprylic acid on hen performance, egg quality and with cage as statistical unit. One-way ANOVA was used to analyse egg yolk vitamins and eggshell ultrastructure with an egg as statistical unit. For hen performance and egg quality, cage was considered as statistical unit while for egg yolk and eggshell ultrastructure, each egg was considered as statistical unit. The continuous data were tested for normality using Wilkinson Shapiro test and P > 0.05 was considered normally distributed.
There was no significant effect of inclusion of butyric, capric and caprylic acid on any of the performance parameters, immune system, internal egg quality parameters and most of the eggshell ultrastructure parameters. The eggs from hens fed with 0.2% 1-monoglycerides of butyric, capric and caprylic acid had significantly higher albumen height (P = 0.03) throughout the laying period suggesting beneficial effect of this combination at older age when egg quality is known to decrease significantly. There is thus an opportunity to investigate the positive effect of these 1-monoglycerides for older hens as it pertains to improving egg quality at that stage of lay. In conclusion, further investigation regarding the addition of 1-monoglycerides of butyric, capric and caprylic acid is warranted especially when using in laying hens during mid- and late lay.
Acknowledgement: BASF and Poultry Hub Australia for financial and administrative support. Calder PC (2008) Prostag.Leukotr. Ess. 79(3-4): 101-108.
1 School of ERS, University of New England, Armidale, NSW 2351, Australia; [email protected]; [email protected]; [email protected]; [email protected]; [email protected] 2 BASF Australia Ltd, Freshwater Place, 3006 Melbourne, Australia; [email protected] 3 BASF SEA Pte Ltd; #35-01 Suntec Tower One; 7 Temasek Boulevard, 038987, Singapore; [email protected] BASF (Thai) Ltd., 23F Emporium Tower, 622 Sukhumvit 24 Road, Klongton, Klongtoey, Bangkok 10110; [email protected]
Aust. Poult. Science Symp. 2022...33
113

CHELATED TRACE MINERALS IMPROVE PULLET FLOCK UNIFORMITY AND EGG PERFORMANCE DURING EARLY LAY
M. KOLAKSHYAPATI1, T.Z. SIBANDA1, J. de SOUZA-VILELA1, T.A. CHUNG1,S BARZEGAR1, M. BEKKER2 and I. RUHNKE1
Minerals such as copper, manganese and zinc are essential nutrients for enzyme functionality, immune system responses, tissue and bone quality as well as eggshell formation (Richards et al., 2010). Organic trace minerals are used in animal feeds to provide increased mineral bioavailability. In this experiment we investigated the benefits of hydroxy analogues of chelated trace minerals on pullet quality. Three hundred- and sixty day-old Isa Brown layers were randomly allocated into two groups with nine replicates per treatment and twenty pullets per replicate. The control group received standard diets (starter, grower, developer and layer) meeting the nutrient requirements outlined in the breeder manual. The treatment group received same isonitrogenous and isocaloric diets but the conventional zinc, copper and manganese levels were replaced (using 33.3% less chelated trace mineral hydroxy analogues) with 40 ppm chelated zinc, 10 ppm chelated copper and 40 ppm chelated manganese. Weekly feed intake, weekly body weight, average daily gain and feed conversion ratio of pullets for each pen were measured until 22 weeks of age. The flock uniformity was measured at 1, 4, 12 and 22 weeks of age. At 12 and 22 weeks of age, four pullets per pen were randomly selected and humanely killed to evaluate tibia bone quality, blood haematology profile, intraepithelial lymphocytes, oviduct development and CT scanned to determine carcass composition. Pullets experienced comparable growth performance, bone quality and immune status. The tibia bone weight of the treatment group at 12 weeks of age was significantly higher (P = 0.037) compared to the control group, but no difference was observed on further investigation of mineral content and morphometric parameters. The egg mass of the treatment group (34.0 g/hen/day) was significantly higher (P = 0.002) at 20 weeks of age compared to the control group (30.8 g/hen/day) while egg size remained comparable. Laying rate was significantly higher (P = 0.002) for hens fed with chelated trace minerals at week 20 (71.6 ± 2.54%) and week 22 (94.9 ± 1.07%) compared to the control group (65.9 ± 2.06% and 87.4 ± 2.04%, respectively). A trend of higher total bone weight (202 ± 3.76 g vs 188 ± 2.83 g) and bone ash weight (161 ± 1.98 g vs 151 ± 2.23 g) was observed in the birds fed the chelated minerals (P = 0.081). In addition, flock uniformity of the chelated mineral fed hens was 10% higher at 22 weeks of age (P 0.008) when compared to the control group hens. The average live weights (g) and flock uniformity (%) at 22 weeks of age were 1773.2 ± 68.8; 84.0% and 1699.5 ± 59.9; 93.8% for control and treatment groups, respectively. The breed standard for live weight at 22 weeks is 1713g. This higher flock uniformity allows for a more appropriate physiological state to support long-term hen productivity as well as skeletal and egg quality. In conclusion, the addition of chelated trace minerals might be beneficial in improving flock uniformity and improving egg output, therefore supporting hen health and productivity during later stages of hen’s life cycle.
ACKNOWLEDGEMENT: NOVUS and Poultry Hub Australia provided financial and administrative support for this research.
Richards JD, Zhao J, Harrell RJ, Atwell CA & Dibner JJ (2010) Asian-Austral. J. Anim. Sci. 23: 1527-1534
1 Animal Science, School of Environmental and Rural Science, University of New England, Armidale, NSW 2351, Australia; [email protected]; [email protected]; [email protected]; [email protected]; [email protected]; [email protected]; 2 NOVUS Oceania, Novus Nutrition Pty Ltd; [email protected]
Aust. Poult. Science Symp. 2022...33
114

THE ROLE OF FEED SAFETY IN DEVELOPMENT OF POULTRY MICROBIOTA
D. STANLEY1
Summary
The first feed offered to young chicks is likely the most important meal in their life. The complex process of gut colonisation is determined with early exposure. Here we will present the role of feed quality and safety in light of the development of gut microbiota in chicks.
I. INTRODUCTION
Immediately after birth, or hatch in birds, the initial inoculum shapes the gut microbiota for life. The first bacteria to settle in the intestine can attach to epithelial cells with no competition, rapidly establish, grow, and set the intestinal environment to suit their own needs (Stecher and Hardt, 2011; Edwards, 2017). The first bacterial settlers have the most substantial influence on developing the host's immune system and overall ability to thrive (Stecher and Hardt, 2011; Edwards, 2017). While in humans gut microbial community takes around two years to mature, the timeframe to maturity is significantly reduced in chickens. Studies report that chicken microbiota stabilises by day 3 (Apajalahti et al., 2004). The maturity of gut microbiota assumes the ability to resist change to a certain level. Studies on humans report that any early adversities, from mild, such as nutritional imbalance, to major like antibiotic administration, prior to the establishment of a mature intestinal microflora can leave permanent consequences that lead to obesity, asthma, allergic diseases and diabetes (Kaplan and Walker, 2012; Wallace et al., 2016).
Poultry research invested decades in optimising bird nutrition to achieve maximum health and performance. The early nutritional needs of hatchlings are well defined. However, advances in molecular microbiology and microbiota research have shed new light on the role of early chick feed, not just in terms of providing the nutrition to the host, but also providing the nutrition to beneficial microorganisms and restricting the essential nutrients to pathogenic microorganisms in the first days post-hatch. This way, the early feed can contribute to the formation of a balanced gut microbial community. This review will concentrate on the role of feed in gut colonisation, focusing on early feed safety.
II. BIOLOGICAL CONTAMINANTS IN FEED
a) Microbial contamination of feedThe most critical requirement for early post-hatch feed is biosecurity since providing early pathogen access to the naïve gut could lead to mortality, lifelong colonisation, and permanent pathogen shedding. However, it is well established that feed can get contaminated with biological pollutants at any production stage. Salmonella, Campylobacter, Clostridium perfringens, and Escherichia coli feed contamination have been at the centre of feed safety research in chickens and other livestock. Shirota et al., (2000) acknowledged that it is generally presumed that baby chicks bring Salmonella sp. to the farm, implying hatchery contamination,
1 Central Queensland University, IFFS, Australia; [email protected]
Aust. Poult. Science Symp. 2022...33
115
while only a limited number of studies look at the feed as a probable source of contamination. It was reported that only trace levels of Salmonella could lead to young chick mortality (Henderson et al., 1960). Shirota et al., (2000) analysed 4418 samples of finished layer feed in Japan and found 46 Salmonella strains in 143 feed samples. The isolates belonged to a minimum of 32 serovars, with the most abundant being S. Enteritidis, S. Livingstone, S. Bareilly, and S. Derby. The authors concluded that the contamination was often limited to the same mills, and although the source of salmonellae was identified, the mills were persistently contaminated. Gosling et al., (Gosling et al., 2021) summarised the literature on wide contamination of feed mills with Salmonella, concluding that the ingredient intake pits were Salmonella hot spots extending to all stages of growing, shipping, processing, storage, and finished feed. The authors continued to suggest less toxic organic acids for decontamination of Salmonella and E. coli instead of widely used formaldehyde-based treatments. Many authors investigated improved ways to remove Salmonella and other pathogens from the fed mills. Common methods of disinfection of feed mill food contact surfaces were based on "sequencing" of raw feed ingredients so that those most likely to carry pathogens are left for last, followed by "flushing" of equipment with a pulse of animal food such as chemically treated rice hulls (Gebhardt et al., 2018) to clean the equipment and minimise leftover pathogens. The critical issue was the breaking of biofilms formed on the mill equipment. Muckey et al., (2020) investigated methods of sanitation following controlled contamination with Salmonella using a commercially available essential oil blend or rice hulls treated with medium-chain fatty acids, finding that both treatments can reduce contamination compared to the control. The authors suggested that feed sequencing can reduce Salmonella contamination on manufacturing surfaces, particularly when flushing is combined with chemical treatments. Sauli (2005) investigated data on Salmonella contamination of pig feed in Switzerland to conclude that the probability that finishing pig feed contains Salmonella ranged from 34% (no decontamination step) to 0% (with organic acids and heat treatment decontamination step). Another study from China (Yang et al., 2017) investigated the contamination of 1077 feed samples, including raw ingredients and finished feeds, collected from feed mills, farms, and feed sales between 2009 and 2012. Salmonella contamination ranged from 4.7 % in 2009 to the lowest of 0.66 % in 2011. Salmonella contamination came from animal protein material such as meat meal, meat and bone meal, feather meal, blood meal, and fish meal but was not identified in microbial protein, rapeseed, and soybean meal. Salmonella contamination was found in mills, farms and feed wholesale (Yang et al., 2017). Despite no positive samples in Chinese soybean, others (Wierup and Kristoffersen, 2014) reported frequent Salmonella contamination in soybean imported to Norway mostly from South America. This study covered data from 19 years of testing, finding that 34% of samples were positive to Salmonella; with variation from 12-62% each year. Additionally, the dust samples from all shiploads from South America yielded Salmonella. This study reported 94 Salmonella serovars in soybeans over 19 years of import, including 9 of 10 top serovars isolated from clinical cases of salmonellosis. The data of feed and bird carriage of Salmonella differ between the studies and countries. Shirota et al., (2000) pointed out the issues with sample collection and analysis, emphasising that each feed sample tested is usually a single sample of 30-100g taken from a
Aust. Poult. Science Symp. 2022...33
116

massive batch of tonnes of feed and suggested that better sampling methods and strategies should be introduced.
Feed contamination with other pathogens is comparable to Salmonella contamination, which remains the most investigated feed contaminating pathogen. Similarly to Salmonella, contamination of poultry feed with Clostridium perfringens comes mostly from fish meal followed by bone meal, meat and bone meal and dry fish (Udhayavel et al., 2017). In a controlled experiment with a feed mill contaminated with Salmonella and E. coli, E.coli was reported as less resilient and faster to die off than persistent Salmonella (Gosling et al., 2021). In addition to bacterial pathogens, the feed can also carry antimicrobial resistance within pathogens, devastating viruses (Schumacher et al., 2018) or mycotoxin producing mycobiota (Pereyra et al., 2011; Namulawa et al., 2020).
b) Feed microbiotaInstead of investigating feed and raw feed ingredients using classic PCR and other methods that target specific species or genus, a recent study (Haberecht et al., 2020) performed amplicon sequencing of raw and finished poultry feed to find that each feed source carried a rich microbial community. Investigated raw ingredients included meat and bone meal, wheat, corn, canola, barley, soybean, millrun, sorghum, poultry oil, oats, limestone and bloodmeal from four geographically distinct feedstuff suppliers. In agreement with pathogen tracing to high protein raw feedstuffs, the authors reported that the meat and bone meal and bloodmeal samples contained the most complex microbial communities, very distinct from one another. Additionally, unique and dissimilar microbial communities were reported in poultry oil and limestone, distinct from highly overlapping microbiota found in the grain and seed samples: barley, canola, corn, millrun, oats, sorghum, soybean meal and wheat.
Feed microbial composition contained four phyla, in order of abundance: Actinobacteria, Proteobacteria, Firmicutes and Bacteroidetes and 50 genera that included both beneficial like Bacillus, Bifidobacterium, Lactobacillus and Ruminococcus, as well as pathogenic Clostridium, Enterobacter, Staphylococcus and Streptococcus. No Salmonella and Escherichia were detected in this study. The authors followed the feed microbiota through the intestinal sections to find that different taxa from feed persisted in different gut sections investigated, including the caecum, ileum and excreta. Additionally, the feed mill source of raw and finished feed had a substantial influence on microbial communities in feed and the geographic location of the feed mill also played a role.
Despite the fact that people used bacteria contained within the grain throughout history to start sourdough fermentation, there is not much literature on microbial communities in grains. Cereal grains are composed mainly of starch, and it was reasonable to expect that they would carry beneficial fibre/starch loving probiotic bacterial strains and could be a good source of starch degrading enzymes. It was reported that whole-grain oats carry probiotic lactic acid bacteria (Wu et al., 2018). However, Carrizo et al. (2016) investigated lactic acid bacterial microbiota of quinoa grains and spontaneous quinoa sourdough to isolate and identify a range of Lactobacillus species, including multiple strains of L. plantarum, L. rhamnosus, L. sakei, Pediococcus pentosaceus, Leuconostoc mesenteroides, Enterococcus casseliflavus, E. mundtii, E. hirae, E. gallinarum, Enterococcus sp., and E. hermanniensis. They continued to investigate
Aust. Poult. Science Symp. 2022...33
117

the enzymatic and nutritional benefits of these strains to conclude that rich probiotic microbiota present in quinoa carries a potent starter culture able to increase the nutritional value of grains.
While investigating rumen starch-hydrolysing bacteria (SHB) possessing active cell-surface-associated alpha-amylase activity, using fluorescence in situ hybridization, Xia et al., (2015) discovered that 19-23% of the total rumen bacterial cells were attached to particles of four cultivars of barley and corn used for feed. The vast majority of these bacteria were members of the Ruminococcaceae. By microscopical inspection of whole and crushed corn and barley cells wash, the authors identified cocci of different sizes, single or in chains, and rods of different morphology in all samples. The proportion of barley grain in the diet had a large impact on the percentage abundance of total SHB and Ruminococcaceae SHB in these animals. Pan et al., (2015) investigated the ways to reduce Fusarium graminearum in wheat to control Fusarium head blight and subsequent contamination of grain with mycotoxins. They evaluated bacterial endophytes isolated from wheat grain for antagonistic ability against F. graminearum under field conditions. They identified a range of grain endophytes with one isolate of Bacillus megaterium and three of Bacillus subtilis, significantly inhibiting growth of Fusarium on grain.
Bacterial and fungal endophytes are well-reviewed and documented in grains (Abdallah et al., 2018; Ahlawat et al., 2021; Makar et al., 2021) and in legumes (Ruiz Mostacero et al., 2021), thus adding more evidence to the observation of grain microbiota. High prevalence of probiotics in grains and as discussed above the high prevalence of pathogens in protein-rich feedstuffs, indicate that the first feed offered to hatchings, selected and formulated to promote the growth of probiotics and inhibit pathogens, should be grain-based and rely on grains and cereals as a protein source for the first three days of gut microbiota establishment.
III. CHEMICAL CONTAMINANTS IN FEED
c) MycotoxinsMycotoxins are secondary metabolites of filamentous fungi that are causing massive losses to agriculture worldwide. Aflatoxins, ochratoxin A, deoxynivalenol patulin, fumonisins, zearalenone, trichothecenes, fumonisins and ergot alkaloids are presently the most important for food and feed safety (Abrunhosa et al., 2016). Furthermore, the range of fungal species that produce these toxins is broad, including Fusarium, Aspergillus, Penicillium, and Claviceps species. Fungi are widely distributed in nature and foods and feedstuffs from all parts of the world, especially in high rain and high humidity tropical climates. In a comprehensive study from tropical Malaysia, the authors report an abundance of mycotoxins in peanuts, cereals, cocoa, spices, feeds and nuts consumed in Malaysia. Moreover, spices, oilseeds, milk, eggs, and herbal medicine products were also contaminated. Malaysian rice, oat, barley, maize meal, and wheat were contaminated with some of the most toxic mycotoxins (Afsah-Hejri et al., 2013). Mycotoxins in food and feed constitute a significant issue for animal and human safety, and they are comprehensively reviewed by many, including Pleadin et al. (2019) and specifically in pig and poultry feed (Guerre, 2016).
Mycotoxins are carcinogenic, mutagenic, teratogenic, cytotoxic, neurotoxic, nephrotoxic, estrogenic, and immunosuppressant (Abrunhosa et al., 2016), and they affect gut microbiota most negatively by increasing the abundance of pathogens and reducing or eliminating beneficial bacteria (reviewed in Liew and Mohd-Redzwan, 2018). Gao (2020)
Aust. Poult. Science Symp. 2022...33
118

reviewed the effects of mycotoxins on the leaky gut and intestinal barrier that include compromised intestinal integrity, thinned mucus layer and imbalance of inflammatory markers in addition to the disturbed microbial community. Others have also reviewed new targets of mycotoxins – gut mucus layer and microbiota (Robert et al., 2017). Based on the above, even traces of mycotoxins in early hatchling feed would disturb bird heath and colonisation with the beneficial microbial community with likely consequences for the bird's long-term health and performance.
d) Heavy metals Maximum allowed concentrations of heavy metals in livestock feed are recognised as a concern and are tightly regulated in countries worldwide. Heavy metals are the fourth most often notified hazard in Rapid Alert System for Food and Feed (RASFF) (Piglowski, 2018). In some countries like the European Union, firm actions are taken to standardise proficiency tests for the determination of heavy metals in feed (Guntinas et al., 2011). Testing for heavy metals in feed is often performed together with mycotoxin testing. Heavy metal contamination often differs from country to country and depend on levels of heavy metal pollution in nature. For example, all of the tested 40 feed samples in the Iran study (Eskandari and Pakfetrat, 2014) had acceptable Pb concentrations, while a high portion of feed samples had As, Cd and Hg above the maximum limits. The consequences of poor testing in livestock feed can translate to human health. For example, in the Pakistan study, Kabeer et al., (2021) tested Ni, Pb, Zn, Mn, Cr, Cu and Se concentrations in poultry eggs to find that concentrations of Pb, Cr and Se in egg white, egg yolk and both feed and water were above permissible limits in tested farms and backyard birds (Kabeer et al., 2021). In India, heavy metals (Cu, Zn, Cr, Pb, and Cd) originating from feed were found in milk in excessive concentrations (Yasotha et al., 2021). The main concern is the effect that heavy metal contaminated milk and eggs could have on young children whose diets are often rich in milk and eggs. In addition to various methods developed to remove heavy metal contamination from the feed, novel approaches to this significant feed issue are desperately needed. Recently Yang et al., (2021) tested 11 maize varieties in experimentally polluted soil Cd, As, and Pb to identify cultivars with low seed uptake of heavy metals. The hypothesis was that, in some varieties, the heavy metals might be accumulated in non-edible parts of the plant. Major differences between the varieties were identified, providing a new perception in dealing with soil pollution with heavy metals and pointing towards the development of improved varieties. Due to the ability of fish to concentrate heavy metals from polluted waters, heavy metal concentrations in fishmeal are of concern (Jia et al., 2006), especially in fish collected in the proximity or downstream from industrial waste disposal sites (Utomo et al., 2021). Furthermore, some heavy metals are highly accumulated in black soldier fly (Wu et al., 2020), indicating different feed source susceptibility. Heavy metals are known for promoting antimicrobial resistance in a similar way to antibiotic addition (Holzel et al., 2012; Yu et al., 2017; Rilstone et al., 2021) and for a range of negative effects on the host-microbiota (Richardson et al., 2018), general toxicity to microorganisms (Giller et al., 1988), plants and humans (Islam et al., 2007) and their ability to concentrate in both chicken meat (Mondal,
Aust. Poult. Science Symp. 2022...33
119

2020) and plant feed products (Islam et al., 2007) calling for a cautious approach to heavy metals in feed used in early bird's life.
e) Pesticides and herbicides Other common feed contaminants include pesticides and herbicides that readily accumulate in feed. A range of highly sensitive methods is developed for screening of over 100 pesticides in feed (van der Lee et al., 2008). The most susceptible poultry feedstuffs include cereal samples such as wheat, rye, barley, oats, maize, buckwheat and others (Walorczyk and Drozdzynski, 2012). Additionally, the runoff into the waterways ensures a high presence and accumulation of both pesticides and herbicides in fish (Yang et al., 2020). Pesticides are highly toxic and, in sufficient concentrations, fatal for humans (Moebus and Boedeker, 2021), while in lower concentrations, they disrupt microbiota and cause serious health problems (de Boer, 2021; Utembe and Kamng'ona, 2021). Glyphosate is the most highly used herbicide in agriculture, with just recently identified carcinogenic effects (Rueda-Ruzafa et al., 2019). Glyphosate is the most challenging herbicide accumulated in feedstuffs and livestock feed. The consequences of glyphosate in feed for livestock health and productivity were recently reviewed (Vicini et al., 2019; Sorensen et al., 2021), summarising detrimental effects on animal health, including neurological damage and microbiota impairment (Rueda-Ruzafa et al., 2019). Surprisingly, Clostridium and Salmonella are highly resistant to glyphosate resulting in an imbalance between beneficial and pathogenic microorganisms. Also, glyphosate-induced clostridia overgrowth is linked to neurological toxicity (Rueda-Ruzafa et al., 2019).
f) Other feed contaminants There are many more chemical feed contaminants that include residual chemicals such as antibiotics introduced by cross-contamination via lack of equipment cleaning between the batches of feed (Peeters et al., 2016; Przenioslo-Siwczynska et al., 2020) to radiation toxicity (Iammarino et al., 2015) accelerated after Chernobyl and other more recent nuclear disasters, industrial waste products (Torres et al., 2013) and oestrogenic polychlorinated biphenyls (Pinto et al., 2008).
IV. CONCLUSIONS The present literature review summarised in Figure 1, strongly implies the need for highly internationally regulated global livestock feed testing due to the high import and export of final livestock food products. From the gut microbiota establishment point of view, the feed offered to hatchings during the first three days of microbiota formation should be immaculate in terms of both biological and chemical contaminants and, if possible, enriched with beneficial and free of pathogenic bacteria with nutritional composition highly supportive of fibre and other prebiotics loving bacteria.
Aust. Poult. Science Symp. 2022...33
120

Figure 1 - Possible feed contaminants that can disrupt early gut colonisation. Created with BioRender.com
REFERENCES Abdallah MF De Boevre M, Landschoot S, De Saeger S, Haesaert G & Audenaert K (2018)
Toxins (Basel) 10(12): 493. Abrunhosa L, Morales H, Soares C, Calado T, Vila-Cha AS, Pereira M & Venancio A (2016)
Critical Reviews in Food Science and Nutrition 56: 249-265. Afsah-Hejri L, Jinap S, Hajeb P, Radu S & Shakibazadeh S (2013) Comprehensive Reviews in
Food Science and Food Safety 12: 629-651. Ahlawat OP, Yadav D, Kashyap PL, Khippal A & Singh G (2021) Journal of Applied
Microbiology. DOI:10.1111/jam.15375 Apajalahti J, Kettunen A & Graham H (2004) World's Poultry Science Journal 60: 223-232. Carrizo SL, Montes de Oca CE, Laino JE, Suarez NE, Vignolo G, LeBlanc JG & Rollan G
(2016) Food Research International 89: 488-494. de Boer A (2021) Current Opinion in Pulmonary Medicine 27: 263-270. Edwards CA (2017) Annals of Nutrition and Metabolism 70: 246-250. Eskandari MH & Pakfetrat S (2014) Food Additives & Contaminants: Part B 7: 202-207. Gao Y, Meng L, Liu H, Wang J & Zheng N (2020) Toxins (Basel) 12(10): 619. Gebhardt JT, Cochrane RA, Woodworth JC, Jones CK, Niederwerder MC, Muckey MB, Stark
CR, Tokach MD, DeRouchey JM, Goodband RD, Bai J, Gauger PC, Chen Q, Zhang J, Main RG & Dritz SS (2018) Journal of Animal Science 96: 4149-4158.
Giller KE, Witter E & Mcgrath SP (1988) Soil Biology and Biochemistry 30: 1389-1414.
Aust. Poult. Science Symp. 2022...33
121

Gosling RJ, Mawhinney I, Richardson K, Wales A & Davies R (2021) Microorganisms 9. Guerre P (2016) Toxins (Basel) 8(12): 350. Guntinas MB, Semeraro A, Wysocka I, Cordeiro F, Quetel C, Emteborg H, Charoud-Got J &
Linsinger TP (2011) Food Additives & Contaminants: Part A: Chemistry, Analysis, Control, Exposure & Risk Assessment 28: 1534-1546.
Haberecht S, Bajagai YS, Moore RJ, Van TTH & Stanley D (2020) AMB Express 10: 143. Henderson W, Ostendorf J & Morehouse GL (1960) Avian Diseases 4: 103-109. Holzel CS, Muller C, Harms KS, Mikolajewski S, Schafer S, Schwaiger K & Bauer J (2012)
Environmental Research 113: 21-27. Iammarino M, dell'Oro D, Bortone N & Chiaravalle AE (2015) The Italian Journal of Food
Safety 4: 4531. Islam E, Yang XE, He ZL & Mahmood Q (2007) Journal of Zheijang University Science 8: 1-
13. Jia H, Ren H, Maita M, Satoh S, Endo H & Hayashi T (2006) Toxicology Mechanisms and
Methods 16: 411-417. Kabeer MS, Hameed I, Kashif SU, Khan M, Tahir A, Anum F, Khan S & Raza S (2021)
Archives of Environmental & Occupational Health 76: 220-232. Kaplan JL & Walker WA (2012) Current Opinion in Clinical Nutrition & Metabolic Care 15:
278-284. Liew WP & Mohd-Redzwan S (2018) Frontiers in Cellular and Infection Microbiology 8: 60. Makar O, Kuzniar A, Patsula O, Kavulych Y, Kozlovskyy V, Wolinska A, Skorzynska-Polit
E, Vatamaniuk O, Terek O & Romanyuk N (2021) Biology (Basel) 10(5): 409. Moebus S & Boedeker W (2021) International Journal of Environmental Research and Public
Health 18(16): 8307. Mondal NK (2020) Environmental Monitoring and Assessment 192: 590. Muckey M, Huss AR, Yoder A & Jones C (2020) Poultry Science 99: 3841-3845. Namulawa VT, Mutiga S, Musimbi F, Akello S, Nganga F, Kago L, Kyallo M, Harvey J &
Ghimire S (2020) Toxins (Basel) 12(4): 233. Pan D, Mionetto A, Tiscornia S & Bettucci L (2015) Mycotoxin Research 31: 137-143. Peeters LE, Daeseleire E, Devreese M, Rasschaert G, Smet A, Dewulf J, Heyndrickx M,
Imberechts H, Haesebrouck F, Butaye P & Croubels S (2016) BMC Veterinary Research 12: 209.
Pereyra CM, Cavaglieri LR, Chiacchiera SM & Dalcero AM (2011) Veterinary Research Communications 35: 367-379.
Piglowski M (2018) International Journal of Environmental Research and Public Health 15(2): 365.
Pinto B, Garritano SL, Cristofani R, Ortaggi G, Giuliano A, Amodio-Cocchieri R, Cirillo T, De Giusti M, Boccia A & Reali D (2008) Environmental Monitoring and Assessment 144: 445-453.
Pleadin J, Frece J & Markov K (2019) Advances in Food and Nutrition Research 89: 297-345. Przenioslo-Siwczynska M, Patyra E, Grelik A, Chylek-Purchala M, Kozak B & Kwiatek K
(2020) Molecules 25(9): 2162. Richardson JB, Dancy BCR, Horton CL, Lee YS, Madejczyk MS, Xu ZZ, Ackermann G,
Humphrey G, Palacios G, Knight R & Lewis JA (2018) Scientific Reports 8: 6578. Rilstone V, Vignale L, Craddock J, Cushing A, Filion Y & Champagne P (2021) Chemosphere
282: 131048. Robert H, Payros D, Pinton P, Theodorou V, Mercier-Bonin M & Oswald IP (2017) Journal
of Toxicology and Environmental Health, Part B Crytical Reviwes 20: 249-275. Rueda-Ruzafa L, Cruz F, Roman P & Cardona D (2019) Neurotoxicology 75: 1-8.
Aust. Poult. Science Symp. 2022...33
122

Ruiz Mostacero N, Castelli MV, Barolo MI, Amigot SL, Fulgueira CL & Lopez SN (2021) World Journal of Microbiology and Biotechnology 37: 14.
Sauli I, Danuser J, Geeraerd AH, Van Impe JF, Rufenacht J, Bissig-Choisat B, Wenk C & Stark KD (2005) International Journal of Food Microbiology 100: 289-310.
Schumacher LL, Cochrane RA, Huss AR, Gebhardt JT, Woodworth JC, Stark CR, Jones CK, Bai J, Main RG, Chen Q, Zhang J, Gauger PC, DeRouchey JM, Goodband RD, Tokach MD & Dritz SS (2018) Journal of Animal Science 96: 4562-4570.
Shirota K, Katoh H, Ito T & Otsuki K (2000) The Journal of Veterinary Medical Science 62: 789-791.
Sorensen MT, Poulsen HD, Katholm CL & Hojberg O (2021) Animal 15: 100026. Stecher B & Hardt WD (2011) Current Opinion in Microbiology 14: 82-91. Torres JP, Leite C, Krauss T & Weber R (2013) Environmental Science and Pollution Research
20: 1958-1965. Udhayavel S, Thippichettypalayam Ramasamy G, Gowthaman V, Malmarugan S & Senthilvel
K (2017) Animal Nutrition 3: 309-312. Utembe W & Kamng'ona AW (2021) Chemosphere 271: 129817. Utomo SW, Rahmadina F, Wispriyono B, Kusnoputranto H & Asyary A (2021) International
Journal of Environmental Research and Public Health 2021: 6675374. van der Lee MK, van der Weg G, Traag WA & Mol HG (2008) Journal of Chromatography A
1186: 325-339. Vicini JL, Reeves WR, Swarthout JT & Karberg KA (2019) Journal of Animal Science 97:
4509-4518. Wallace JG, Gohir W & Sloboda DM (2016) Journal of Developmental Origins of Health and
Disease 7: 15-24. Walorczyk S & Drozdzynski D (2012) Journal of Chromatography A 1251: 219-231. Wierup M & Kristoffersen T (2014) Acta Veterinaria Scandinavica 56: 41. Wu H, Rui X, Li W, Xiao Y, Zhou J & Dong M (2018) Food and Function 9: 2270-2281. Wu N, Wang X, Xu X, Cai R & Xie S (2020) Ecotoxicology and Environmental Safety 192:
110323. Xia Y, Kong Y, Seviour R, Yang HE, Forster R, Vasanthan T & McAllister T (2015) FEMS
Microbiology and Ecology 91: fiv077. Yang C, Lim W & Song G (2020) Comparative Biochemistry and Physiology Part C:
Toxicology & Pharmacology 234: 108758. Yang N, Wang H, Wang H, Wang Z, Ran J, Guo S & Peng Y (2021) Environmental Science
and Pollution Research Int. DOI:10.1007/s11356-021-12958-y Yang S, Wu Z, Lin W, Xu L, Cheng L & Zhou L (2017) Environmental Science and Pollution
Research Int 24: 1372-1379. Yasotha A, Dabade DS, Singh VP & Sivakumar T (2021) nvironmental Geochemistry Health
43: 1799-1815. Yu Z, Gunn L, Wall P & Fanning S (2017) Food Microbiology 64: 23-32.
Aust. Poult. Science Symp. 2022...33
123

BEHAVIOUR OF PULLETS AND HOUSING SYSTEM PREDICTS BEHAVIOUR OF ADULT LAYING HENS IN COMMERCIAL FREE-RANGE EGG FARMS
M. RICE 1, R. ACHARYA1, J. TAYLOR1, P. TAYLOR 2, A. FISHER1 and P. HEMSWORTH1
Summary
The relationship between behavioural responses of pullets during rearing and adult hens to both novelty and a human stimulus was explored using stepwise backward regression. The results indicate that the behavioural responses of pullets to both novelty and humans, and housing system in adulthood were predictive of the behavioural responses of hens to novelty and humans in adulthood. Less fear of novelty during rearing and larger flock size in adulthood were associated with less fear of novelty or increased curiosity indoors in adulthood. Less fear of novelty during rearing and housing of laying hens in flat deck systems was associated with increased fear of novelty in adult laying hens in the range. In addition, less fear of humans in pullets during rearing, and subsequent housing in aviaries, was associated with less fear of humans in adult laying hens. Further exploration of these relationships could assist with the identification of risk factors for problem behaviour in commercial free-range laying hens.
I. INTRODUCTION
Early life experiences play an important role in the behavioural development of laying hens (Janczak and Riber 2015; Nicol 2015). Environmental differences in rearing systems have been shown to have an impact on behavioural problems such as feather pecking and cannibalism during adulthood (de Haas et al. 2014; Riber and Guzman 2017). In addition, fearfulness early in life has been shown to correspond to increased stress response in adulthood (de Haas et al. 2012). A greater understanding of the rearing conditions and their influence on hen behaviour during rearing and adulthood may assist in the prevention or mitigation of problem behaviours and therefore assist in the reduction of mortality and improvement of welfare in free-range laying hens (Campbell et al. 2019). This study examined the behavioural response of commercial free-range laying hens to humans and novelty during rearing and at peak lay. It was hypothesised that the behavioural response of pullets to humans and novelty would be predictive of their respective responses to humans and novelty, respectively, in adulthood.
II. METHOD
This study was approved by the Animal Ethics Committee of the University of Melbourne (Ethics ID 1814708.1). Behaviour tests were conducted in-situ on 45 flocks (Hy-line brown, n=37; and ISA Brown, n=8) during rearing (15-16 wk old) and 39 adult flocks (45-55 wk old). Of the all the flocks tested, 26 flocks were tested at both rearing and in adulthood. Flocks were reared in either floor rearing (n=17) or JumpStart/Aviary systems (n=28). Adult flocks were housed in either flat deck systems (n= 20) or aviary systems (n=19) and had range access. Flock sizes ranged from 19,203 to 67,297 in rearing and 16,897 to 61,000 in adulthood. The two behaviour tests were a flight distance test (FDT) and a novel object test (NOT) and bird responses were video recorded. The FDT involved an observer moving through the shed (and
1 Animal Welfare Science Centre, Faculty of Veterinary and Agricultural Sciences, The University of Melbourne, Parkville 3010, Australia [email protected] 2 University of New England, Faculty of Science, Agriculture, Business and Law, Armidale, NSW, 2351, Australia
Aust. Poult. Science Symp. 2022...33
124

range for adult flocks) in a standard manner stopping every 20 steps for 30 s. In the NOT a children’s toy was presented in three locations in the shed and range (for adult flocks). The number of hens within 1.5 m in front of the observer was recorded at every step when the observer was moving, and every 30 s whilst the observer was stationary in the FDT. The latency for hens to approach within 10 and 40 cm and interact with the novel object (NO), and the average number of hens within 40 cm of the NO were recorded every 30s over 5 mins in the NOT. A principal component analysis (PCA) with oblique rotation was performed in SPSS (version 27) separately on the two full sets of data from the behaviour tests conducted during rearing and with adult hens to identify sets of components that represent the underlying commonalities (components) in these tests and regression factor scores were calculated. Prior to analysis, all variables were transformed using inverse, log10 or square root transformations to normalise the data. Since the correlation coefficients were all above the required 0.3, the Kaiser-Meyer-Olkin (KMO) values exceeded the recommended value of 0.6, and Bartlett’s Test of Sphericity was statistically significant, the data were considered suitable for the PCA. A backwards stepwise regression was used to identify possible predictors of each of the component scores from the behaviour tests conducted in adulthood using data from the 26 flocks with both rearing and adult behaviour test data. At each step variables were removed based on p-values (p < 0.1).
III. RESULTS
Two components each with eigen values greater than 1 were extracted in the PCA for the tests during rearing, these were labelled RearFDT and RearNOT, and three components, all with eigen values greater than 1 were extracted in the PCA for the tests conducted on adult hens, these were labelled ProdFDT, IndoorNOT and RangeNOT (See Table 1 for component descriptions and loadings). In the resulting scores, a high score in both RearFDT and ProdFDT corresponds with more pullets/hens within 1.25m of the human in both stationary and movement phases. A high score in both the RangeNOT and the IndoorNOT corresponds with less pullets/hens near the NO and longer latency to approach and interact. Table 1 - Pattern Matrix for PCA with Oblique Rotation of two factor solution of rearing behaviour test
items and 3 factor solution of adult behaviour test items
Rearing test PCA Adult test PCA RearNOT RearFDT IndoorNOT RangeNOT ProdFDT Novel object test Indoor latency to interact 0.915 0.885 latency to 10cm 0.936 0.921 x̄ hens (2min) -0.869 0.88 x̄ hens (5min) -0.702 0.839 latency to 40cm 0.726 0.727 Range x̄ hens (2min) 0.969 x̄ hens (5min) 0.969 latency to interact 0.827 latency to 10cm 0.735 latency to 40cm 0.638 Flight Distance Test
Aust. Poult. Science Symp. 2022...33
125

Indoor movement phase x̄ hens 0.927 1.023 stationary phase x̄ hens 0.928 0.838 Range movement phase x̄ hens -0.733 stationary phase x̄ hens -0.554
The variables included in the original model and the final model of the regression are outlined in Table 2. Among the behaviour test variables from rearing, the NOT conducted during the rearing was predictive of the NOT conducted with adult hens both in the range and inside the shed; however this relationship was positive for the adult NOT tests conducted inside the shed, and negative for the NOT tests conducted in the range (i.e. flocks with a higher score in the NOT at rearing, are predicted to have a higher score in the NOT conducted in the shed and a lower score in the NOT conducted in the range during adulthood). The FDT in rearing remained in the final model predicting behaviour in the FDT for adult laying hens. Housing system for adult laying hens was predictive of both their response to the NOT in the range and during the FDT in adult flocks, with hens in aviary systems predicted to score lower in the NOT and higher in the FDT than hens in flat deck systems.
Table 2 - Unstandardised coefficients and adjusted R2 for the initial and final regression model where RearFlockSize is the number of pullets (x 10,000), ProdFlockSize is the number of hens (x 10,000),
RearShedType is the rearing housing system (Foor = 1, Aviary/JumpStart =2), ProdShedType is the adult hen housing system (Flat Deck = 1, Aviary = 2).
Variables IndoorNOT RangeNOT ProdFDT β Initial Final Initial Final Initial Final
Intercept -0.22 1.15 2.48* 1.94** -2.84** -1.96**RearFlockSize 0.47 -0.11 0.14ProdFlockSize -0.37 -0.40* -0.08 -0.51RearShedType -0.50 -0.51 0.59ProdShedType 0.13 -0.75 -1.37** 1.89* 1.35**
RearNOT 0.50 0.52** -0.51 -0.49** 0.46RearFDT -0.08 -0.01 0.56* 0.36
Adjusted R2 0.33 0.37 0.30 0.38 0.48 0.49 *p < 0.05**p < 0.01
IV. DISCUSSION
It should be recognised that the two tests FDT and NOT were designed to measure the approach and avoidance responses of birds to humans and a novel object. Measures of exploration are often interpreted as providing information about fearfulness and are the basis of some of the standard tests of fear (Bateson and Matheson 2007). Although it is unclear how exactly fear and exploration, particularly curiosity or inquisitive exploration, are related, it is generally agreed that high levels of fear inhibit all other motivational systems including exploration (Feenders et al. 2011).
Several relationships were found in the present study between fear of humans and novelty (or conversely curiosity) in adulthood and fear of humans and novelty and housing system. These relationships indicate that the behavioural responses of pullets to both novelty
Aust. Poult. Science Symp. 2022...33
126

and humans, and housing system in adulthood were predictive of the behavioural responses of hens to novelty and humans in adulthood. For example, the behavioural responses of pullets to humans and the housing system in adulthood were related to the behavioural responses of adult hens to humans (both indoors and outdoors), with less fear of humans during rearing and housing in aviaries in adulthood associated with less fear of humans in adulthood. The behavioural responses of pullets to novelty and housing system in adulthood were related to the behavioural responses of adult hens to novelty outdoors, with less fear of novelty during rearing, and housing in flat deck systems in adulthood, associated with increased fear or less exploration of novelty on the range. While housing in adulthood was not predictive of the behavioural responses of hens to novelty indoors, the behavioural responses of pullets to novelty and adult flock size were related to the behavioural responses of adult hens to novelty indoors. This relationship indicates that less fear of novelty during rearing and larger flock size were associated with less fear of novelty or increased curiosity indoors in adult laying hens.
The observed relationships do not demonstrate causality and experimental studies are necessary to determine causality. However, it is useful to consider these relationships since fear or conversely curiosity may have implications on hen welfare. For example, housing in aviaries in adulthood was associated with reduced fear (or conversely increased curiosity) of humans in adulthood and with reduced fear of novelty outdoors in adulthood. While further research is clearly required, housing in aviaries may provide hens when indoors with more visual contact with stockpeople routinely moving through the sheds than housing in flat decks, because of the opportunity for hens in aviaries to locate themselves in elevated positions. Furthermore, this vertical separation from stockpeople may be less threatening to hens and facilitate increased curiosity. The increased visual contact with humans which may occur for those hens housed in aviaries may also be a form of environment enrichment and it has been shown in poultry that environmental enrichment can reduce fear of novel stimuli and humans in laying hens (Hemsworth and Edwards 2021).
These findings also indicate that the behavioural response of pullets to humans and novelty is predictive of their respective responses to humans and novelty, respectively, in adulthood. Indeed, as Campbell et al. (2019) has proposed, rearing conditions and their influence on hen behaviour during rearing and adulthood may affect problem behaviours, mortality and productivity of free-range laying hens. The research reported in the present paper is part of a large prospective observational study to identify risk factors for smothering in Australian free-range layer flocks and the behavioural responses of pullets and adult hens to humans and novelty are some of the risk factors being studied. ACKNOWLEDGEMENTS: This study was funded by Australian Eggs Ltd.
REFERENCES
Bateson M & Matheson S (2007) Animal Welfare 16: 33-36. Campbell DLM, de Haas EN & Lee C (2019) Poultry Science 98: 9-28. de Haas EN, Bolhuis JE, Kemp B, Groothuis TGG & Rodenburg TB (2014) Plos One 9 de Haas EN, Kops MS, Bolhuis JE, Groothuis TGG, Ellen ED & Rodenburg TB (2012)
Physiology & Behavior. 107: 433-439. Feenders G, Klaus K & Bateson M (2011) Plos One 6 Hemsworth PH & Edwards LE (2021) Animal Production Science 61: 915-930. Janczak AM & Riber AB (2015) Poultry Science 94: 1454-1469. Nicol C (2015) 'The Behavioural Biology of Chickens.' (CABI: Oxfordshire, UK). Riber AB & Guzman DA (2017) Poultry Science 96: 3529-3538.
Aust. Poult. Science Symp. 2022...33
127

PREFERENCE OF COMMERCIAL FREE-RANGE LAYERS FOR SHELTERS OF DIFFERENT SUNLIGHT FILTERING
M.S. RANA,1,2 C. LEE2, J.M. LEA2 and D.L.M. CAMPBELL2
Free-range commercial layer farming in Australia has been increasing for the last decade in response to consumer demand for free-range eggs. To meet this demand, there is a focus on research to optimise free-range system design and management. A range of external factors have been shown to impact hens’ daily outdoor range use including weather conditions, time of day, season and range enrichments (Richards et al., 2011; Larsen and Rault, 2021). Sunlight intensity and ultraviolet radiation could be factors affecting use of the outside range in free-range systems. Artificial shelters within the range could provide protection from sunlight for free-range hens in Australian climates with more extreme sunlight.
This study was conducted across two individual flocks (Flock-A, and Flock-B) of a commercial free-range layer farm (December 2020 to March, 2021) in Queensland, Australia to assess hen preferences for artificial shelters of commercially available shade cloths of different densities. Three types of shade cloth shelters with three replicates each were used including (i) 50% UV block, (ii) 70% UV block, and (iii) 90% UV block across two flocks consecutively. Although the shade cloths are marketed as blocking UV radiation, they also filtered out solar radiation in the visible spectrums and are hence referred to as ‘sunlight filtering’. Each shelter (4 m L x 3 m W x 1 m H) was positioned in a straight line parallel with the shed 10.5 m away from the pop holes. Both flocks consisted of approximately 20,000 Hy-Line Brown laying hens, and all observations were taken between 34 to 40 weeks of age. A high-resolution security camera system was installed for recording the hens’ preferences across daylight hours. A weather station was set-up at the respective farm site with different sensors to record the irradiance of sunlight spectrums including ultraviolet radiation (UVAB) (280-400 nm) (W/m²), photosynthetically active radiation (PAR) (400-700 nm) (μmol/m2/s), and total solar radiation (TSR) (100 nm- 1 mm) (W/m²) [TSR was later used to extract infrared radiation (IR) (W/m²)] along with an ambient air temperature and relative humidity sensor. A total of 14 days of video for Flock-A and 17 days for Flock-B were analysed with image snapshots at 30-min intervals used to count the number of hens under the individual shelters. Data were analysed by JMP® 14.0 to test hens’ shelter preferences across the day using GLMMs. The relationship of sunlight and weather variables with hens’ shelter preferences was determined by fitting linear ridge regression models using ‘lmridge’ package in R statistical software.
There was a significant interaction between sunlight-filtering shelter and time of day for hen preferences in both Flock-A (F (36, 2331) = 3.49, p < 0.0001), and Flock B (F (36, 2844) = 2.63, p < 0.0001) where more hens preferred the 90%, followed by the 70% then 50% sunlight-filtering shelters. The overall use of shelters by hens significantly varied across the time of day with peaks in the morning and in the late afternoon compared to the mid-day (both flocks, P < 0.0001). Among the sunlight and weather variables, the majority of the variance in the models resulted from the ambient temperature in both study flocks; however, UVAB was also significantly correlated with hens’ shelter preferences in Flock-B. The study indicated that the higher level of sunlight-filtering shelters on the range were preferred by hens. However, there were still lower numbers of birds outside during the midday period suggesting hens prefer to remain indoors at this time despite the available range shelters.
REFERENCES Larsen H, Rault JL (2021) Br. Poult. Sci. 62:311-319. Richards G, Wilkins L, Knowles T, Booth F, Toscano M, Nicol C, Brown S (2011) Vet. Rec. 169: 338.
1 School of Environmental and Rural Science, University of New England, Armidale, Australia [email protected] 2Agriculture and Food, Commonwealth Scientific and Industrial Research Organisation, Armidale, NSW, Australia. [email protected]
Aust. Poult. Science Symp. 2022...33
128

SMOTHERING IN COMMERCIAL FREE-RANGE LAYING HENS
M. STEVENSON1, P. CHOWDHURY1, R. ACHARYA2, M. RICE2, J. TAYLOR2, A. FISHER2, P. TAYLOR3, and P. HEMSWORTH1
‘Smothering’ in poultry occurs when birds mass together, often on top of each other, resulting in death from suffocation (Bright and Johnson, 2011). The small number of reports documenting the incidence of smothering indicate that it accounts for a substantial proportion of overall mortality in free range layer flocks (Barrett et al., 2014; Bright and Johnson, 2011).
In 2019 Australian Eggs Limited funded the Animal Welfare Science Centre and the Veterinary Epidemiology group at the University of Melbourne to undertake a prospective observational study to identify risk factors for smothering in Australian free-range layer flocks.
Three large commercial free-range poultry units were enrolled into the study with data collection activities starting in January 2019. Flocks entered the study on the day of bird placement into sheds and were followed until the day of depopulation. At present, 85 flocks from the three farms have been enrolled with 47 (n = 23 flat deck and n = 24 aviary) of these completing a full production cycle. Data collection for the project is expected to be completed in March 2022. Throughout the project, each of the 51 flocks received a standardised behavioural test to assess the birds’ responses to novelty and humans during the rearing and production periods.
Based on data collected to date, all-cause mortality rate across the three farms was 22 deaths per 100,000 bird-days at risk of which 4.8 deaths per 100,000 bird-days at risk were due to smothering. The frequency of smothering varied across flocks ranging from less than 1 to greater than 20 deaths per 100,000 bird-days at risk. The accumulated project data will be analysed using a counting process Cox proportional hazards regression model where time to smothering death will be the outcome of interest and factors hypothesised to increase daily smothering hazard operating at the farm, shed and flock level (such as behavioural responses to novelty and humans) permitted to change over time.
Our data show that around one in five deaths that occur in free-range layer poultry flocks were due to smothering. Our presentation will provide results of our multivariable analyses identifying flock, shed and farm-level factors associated with increased smothering risk. A novel feature of this project is its size and its innovative approach integrating well-established methods for assessing the behavioural characteristics of poultry with quantitative epidemiological investigatory techniques.
REFERENCES
Barrett J, Rayner A, Gill R, Willings T, Bright A (2014) Vet. Rec.175: 19. DOI: 10.1136/vr.102327.
Bright A, Johnson E (2011) Vet. Rec. 168: 512. DOI: 10.1136/vr.c7462.
1 Asia Pacific Centre for Animal Health, Faculty of Veterinary and Agricultural Sciences, The University of Melbourne, Parkville 3010, Australia (E: [email protected]) 2 Animal Welfare Science Centre, Faculty of Veterinary and Agricultural Sciences, The University of Melbourne, Parkville 3010, Australia 3 Faculty of Science, Agriculture, Business and Law, University of New England, Armidale 2350, Australia
Aust. Poult. Science Symp. 2022...33
129
VIDEO-BASED LAYING HEN BEHAVIOUS ANALYSIS IN EGG FARMS
L. YU1, J. XU1, R. SHEPARD2, Q. WU1, R. JENNER3 and J. ZHANG1
Summary
Bird activity patterns are of interest to egg farmers during their regular flock inspections. However, this is time-consuming and labour-intensive and cannot be done continuously. Precision Livestock Farming (PLT) Technologies enable monitoring of bird and flock behaviours in a continuous and automated way. We will show how the activity and welfare status of poultry can be evaluated in real-time by video-based automated recognition and monitoring of behaviours. In this paper, we demonstrate the application of advanced computer vision and machine learning techniques to auto-analyse bird behaviours. This system allows the welfare of birds to be assessed. Issues in the flock can be detected in real-time and notifications sent to managers warning of abnormal behaviours and the location within the shed where these alerts have been triggered.
I. INTRODUCTION
In Australia, 95% of the population are concerned about animal welfare with 91% desiring better ways to monitor and improve animal welfare (National pest & disease outbreaks, 2018). There is increased understanding and focus on animals’ sentience and the need to ensure farm animals have ‘lives worth living’. This applies to the Australian egg industry where research shows the community believes that hens are entitled to positive and rewarding lives (Edgar et al., 2013). Good hen welfare also promotes better egg quality and productivity (Sossidou et al., 2009). Typically, components of bird welfare can be assessed by regularly capturing birds for taking of blood and feather samples or through in-person visual observations. These methods are intrusive; they interrupt the shed, imposes stress on captured birds, are not continuous and are prone to sampling and measurement bias (by the observer). It is also difficult to communicate findings to the public because this approach requires thorough analysis of the correlations between visual observations and welfare issues. A potentially more effective way is to observe and analyse bird behaviours from video streams captured by mounted cameras. Without human interruption, the birds behave naturally. Although this approach has many benefits (such as avoiding sampling/measurement bias and disruption and can be done in real-time and continuously), developing and refining systems to analyse video contents require expertise and extensive data analysis and algorithm development. The skill lies in building an automated computer vision system that can assess flock status from the collated evaluation of individual bird behaviours and affected states. Such an automated system supports hands-free and continuous monitoring of flock activities and welfare. This both supports animal welfare assessment and provides a readily communicable and objectively measurable suite of information for the public showing effective welfare and management. The system can also monitor egg productivity through the evaluation of various production-sensitive behaviours, such as feeding and nesting.
II. METHOD
1 School of Electrical and Data Engineering, University of Technology Sydney: [email protected] 2 Herd Health Pty Ltd: [email protected] 3 Rosetta Management Consulting Pty Ltd: [email protected]
Aust. Poult. Science Symp. 2022...33
130

Our system is based on object detection and tracking techniques developed within computer vision research. The success of accurate individual behaviour identification requires massive video data sets. To collect this data our team first set up cameras on a commercial egg farm in NSW and recorded video footage between 15/03/2021 to 16/06/2021. We mounted two 4K cameras to cover 4 eating and 10 drinking areas (see Figure 1 below). Both cameras had zoom to allow focus on fine motion monitoring of individuals. In our case study, we defined two activities: eating and drinking. Through our observation of the video footage, we translated the two terms to facilitate the annotation for the computer vision model. Specifically, eating and drinking were defined as a bird puts its head inside the feeder or the drinker and this action is maintained for at least a set period. The observed area is illustrated in Figure 1. We densely annotated over 3700 instances of these defined activities (see Table 1), to collate training data that we used to develop a deep-learning-based behaviour detection model (YOLO-X (Ge et al, 2021). A validation set was kept from the training data and used to test the trained model. We obtained 95.4% accuracy of detection and identification of these three activities. This is more than adequate for real-time monitoring at the flock level. We further pre-set the eating and drinking areas (see the red circle and rectangle areas in Figure 1) to further reduce the false alarm rate. However, the detection model can identify the behaviours that appear in a static image, but cannot guarantee if an individual bird performs the action in the video footage. Thus we applied a Kalman filter (Wang et al., 2020) to track individual birds within a frame sequence. Based on the object detection and tracking technique, we are able to use the trained artificial intelligence (AI) model to monitor and auto-analyse individual bird behaviours.
Table 1 - Details of training and testing dataset for bird behaviour classification Drinking Eating Train 1167 1064 Validation 292 266 Sum 1459 1330
Figure 1 - The observable areas in the shed by the PTZ camera
III. RESULTS
Based on the trained models for detecting and tracking individual birds, we conducted a case study on video footage taken on 14/06/2021. We first plotted the distribution of feeding time between 12:00 PM and 1:00 PM in Figure 2. We can see that within the 1-hour observation, most birds spent 2-4 minutes eating, with fewer than 60 birds taking more than 6 minutes to eat. In Figure 3, we report the number of birds drinking and eating in different periods of an
Aust. Poult. Science Symp. 2022...33
131

entire day. From the two distributions, we can see that between 4:00 AM and 6:00 PM, the number of birds eating is mostly constant. The peak period for drinking occurs between 11:00 AM and 12:00 PM. These natural variations provide useful baselines for monitoring deviations to normal behaviours. The baselines can be further refined with more data and more variety in farm conditions (e.g, shed, density, breed, age and production system etc.)
Figure 2 - The average feeding time distribution within 1 hour, where the horizontal axis is the feeding time and the vertical axis is the number of the birds counted
Figure 3 - The number of birds drinking and eating within the observation area in an entire day, where the horizontal axis represents the time of the day and the vertical axis is the number of birds counted
IV. DISCUSSION
In this paper, we have demonstrated a practical application of advanced computer vision and machine learning techniques to poultry production. Our system monitors individual bird behaviours on commercial egg farms using a low-cost and robust setup. In the preliminary study, each camera can observe 100 hens’ individual behaviours, covering around 25 m2 area in a shed. The system is suited to continuous monitoring of bird and flock welfare and has application for identifying production-related problems that have behavioural signals (such as reduced eating). Together, the welfare and production monitoring and early warning system present as a practical, low-cost, labour-free system to support commercial egg production in Australia. We plan to improve the system by defining and identifying more complex individual bird and flock activities, which may require the consideration of temporal and spatial dependency (i.e. what activities are happening where and when — and what environmental, management or climatic changes are related to these changes). ACKNOWLEDGEMENT: The authors are grateful to Australian Eggs for their financial support of this study.
REFERENCES
National pest & disease outbreaks (2018) Australia’s Shifting mindset on Farm Animal Welfare. Futureye. (https://www.outbreak.gov.au/sites/default/files/documents/farm-animal-welfare.pdf )
Edgar JL, Mullan SM, Pritchard JC, McFarlane UJ & Main DC (2013). Towards a ‘good life’ for farm animals: Development of a resource tier framework to achieve positive welfare for laying hens Animals 3(3): 584-605.
Sossidou EN & Elson HA (2009) Hens’ welfare to egg quality: a European perspective. World's Poultry Science Journal 65(4): 709-718.
Ge Z, Liu S, Wang F, Li Z & Sun J (2021) YoloX: Exceeding yolo series in 2021.arXiv preprint arXiv:2107.08430.
Wang B, Liu H, Samaras D & Hoai M (2020) Distribution matching for crowd counting. arXiv preprint arXiv:2009.13077.
Aust. Poult. Science Symp. 2022...33
132

AUTOMATED FLOCK DENSITY AND MOVEMENT ESTIMATION FOR WELFARE MONITORING IN COMMERCIAL EGG FARMS
L. YU1, J. XU1, R. SHEPARD2, Q. WU1, R. JENNER3 and J. ZHANG1
Summary
The monitoring of poultry behaviour provides the opportunity to aid egg production and animal welfare. With the current development in machine learning and computer vision, automated content analysis becomes a practical way for low-cost and continuous monitoring of animal behaviours. In this paper, we design a simple, yet effective flock monitoring system based on deep learning techniques for egg farmers that allows them to reduce labour yet improve performance. This work shows it is possible to auto-analyse flock activities thereby providing early warning of welfare issues, by applying object detection, segmentation, tracking and dense counting techniques. With the model trained on the labelled data from the collected video footage, the system can achieve 94% accuracy then automatically generate the activity reports.
I. INTRODUCTION
It is expected that the global demand for livestock products will increase by 70% by the year 2050 (Gerland et al., 2014). As one of the most high-protein and environmentally friendly sources, egg production is an important human food source. Intensive egg production enables the production of cheap, nutritious and readily available human food; however, one of the challenges is to ensure the production systems also can meet the birds' needs, including comfort, health and positive experiences. It can be challenging to monitor bird welfare in large egg farms (typically 25,000-50,000 birds per shed), being labour intensive and requiring expertise. An increasing number of Precision Livestock Farming (PLF) technologies are being examined for this purpose (Dawkins, et al., 2013). Specifically, auto-monitoring systems, equipped with artificial intelligence (AI) models, bring the potential for non-intrusive and continuous monitoring in practically applied solutions for egg farms. Effective auto-analysis is expected to bring welfare and performance improvements to commercial egg production.
Summaries of bird activity and their distribution reflect bird behaviour. These summaries in turn reflect the flock’s welfare status. Specifically, the density and movement patterns of birds within the flock give reliable information on the welfare status of the flock. For example, the real-time monitoring of density and movement can give early warnings of smothering, where several hens pile up (often resulting in suffocation). To observe these and other important flock activities, we developed a low-cost and easy-use system based on the recent AI techniques, to auto-estimate the density and movement of birds within the shed.
This paper aims to introduce the design and implementation of the auto-monitoring and analysis system. Due to the early stage of the project, our case study is conducted in the visual condition of natural daylight environment. This is because the significant changes of illumination largely affect the model performance when training on the limited data. Based on the numerical case study, we further discuss the potential of the commercial value of the wide deployment of our system in egg farms.
II. METHOD
1 School of Electrical and Data Engineering, University of Technology Sydney: [email protected] 2 Herd Health Pty Ltd: [email protected] 3 Rosetta Management Consulting Pty Ltd: [email protected]
Aust. Poult. Science Symp. 2022...33
133

Our system is based on the object detection, tracking and instance segmentation techniques in computer vision, where the core component is a data-driven model. The effectiveness of the monitoring and analysis is heavily dependent on collecting massive video (learning) data sets from sheds within the egg farm. In this section, we describe the settings applied in the case study. • Data collection
Data collection was conducted on a free-range laying hen farm in NSW by setting several cameras on the farm from 15/03/2021 to 16/06/2021. Following the installation procedure of the farm that satisfies the ethics criteria, we positioned two kinds of cameras (PTZ and AXIS) to provide a top-down view (to avoid bird occlusions), then connected to a desktop. The height of the platform was adjustable to allow full coverage of the study space. In our case, each camera can cover 25m2 and 50m2 for indoor and outdoor environments, respectively. The live processed result was then transferred via Wi-Fi and Bluetooth to a central computer to let the manager monitor birds in real-time and to collate data for AI analysis. Videos were high-resolution, recording both indoor and outdoor environments for over 1,000 hours. Figure 1 illustrates our video data collection settings.
Figure 1 - The video data collection settings: indoor camera setup (left), outdoor camera setup (middle), and the cameras used for data collection (right). • Computation backend To begin, we briefly introduce key technical term definitions as follows: (1) object (bird) detection is the cornerstone in the whole computational framework, which aims to locate each bird in the video frame by computing a rectangular bounding box; (2) instance segmentation, is an extension of bird detection, which is to accurately draw a contour of each bird, providing more details about the bird's motions that are helpful to describe the individual behaviours; (3) object (bird) tracking, draws a trajectory of a bird in a frame sequence of video footage. This term is usually bound with bird detection or segmentation. In this way, the movement of each bird can be tracked and recorded; (4) crowd counting, which estimates the number of birds in an observable area of the camera. This is the key indicator of density. • Implementation details The computation backend is implemented by training AI models on annotated image data, with advanced computer vision and machine learning techniques. In the data preparation, we densely labelled over 25,000 bounding boxes and contours of birds from 300 sampled frames, where each bounding box or contour describes only one bird. These frames were manually selected at multiple periods in various visual conditions. Table 1 gives the details of the training and validation dataset. For the model training, we applied the recently proposed RetinaNet (Lin et al., 2017) and Mask-RCNN (He et al., 2017) to train object detection and instance segmentation models, respectively. On the validation dataset, the two models achieved 94% and 92% accuracies for the indoor environment. We used the Kalman filter to track every detected bird in the video footage (Wang, et al., 2020), and the trajectory was estimated by linking all positions of a bird in the frame sequence with small time intervals. The visualization of bird detection, segmentation, tracking, and crowd counting is illustrated in Figure 2.
Aust. Poult. Science Symp. 2022...33
134

(a) Bird detection. (b) Bird segmentation. (c) Bird tracking. (d) Crowd counting.
Figure 2 - Visualizations of bird detection, segmentation, tracking, and crowd counting. In (a), (b) and (d), we used bounding boxes, contours and dots marked with different colours to represent individual birds in the
observation area. In (c) the red line represents a trajectory of a moving bird within 10 video frames.
Table 1 - Overview of the data for model training and validation. Indoor Outdoor
# Images # Count # Images # Count Training 116 12077 122 8426 Validation 30 2808 31 2063 Sum 146 14885 153 10489
III. RESULTS
Based on the trained models, we conducted a case study for bird detection, segmentation and real-time crowd counting in both indoor and outdoor environments.
• Indoor environment We applied the trained model to test a full-day video footage sequence (taken on 18/04/2021), as shown in Figure 3, where a few density peaks (more than 200 birds within the frame) are observed in the entire day. These sudden density increases may trigger alerts for further investigations. Figure 4 shows the visualization of the two methods. The numbers counted by detection and dense counting are 213 and 219, respectively. The reason for the discrepancy is the re-counting in the dense areas of the frame. With faster (local) computer processors, the model can run in real-time, providing live statistics for immediate notifications. Also, when the shooting area is not crowded, both study algorithms gave comparable results. When there is crowding to the point that it is difficult to distinguish the individual boundaries of birds, the crowd counting algorithm shows to outperform 1.5% than object detection in terms of the counting accuracy.
Figure 3: The number of birds observed in different periods (indoor).
Figure 4: The screenshot at 7:25 AM with 207 manually counted birds (left). The middle and right images visualize the detection and crowd counting results, respectively.
Aust. Poult. Science Symp. 2022...33
135

• Outdoor environmentOur two outdoor cameras were mounted on a 4m-high pole, covering a comparably largevisible area (approximately 50m2). We give the exemplar results (13/05/2021) of crowdcounting and the visualization of density estimation at 4:39 PM in Figure 5. In the outdoorcase, birds can move freely, so the density changes more significantly during the entire day.
Figure 5 - The number of birds observed in different periods of the entire day (left), the visualization of density estimation based on equal-sized windows (middle) and clustering (right).
• Region analysisRegion analysis aims to dynamically estimate the density of birds in different regions of anobservation area, which is particularly important to monitor the pilling behaviours leading tosmothering. Here we propose two solutions based on equal-sized windows and clustering,respectively. The first solution is to partition an observable region with equal-sized windows,thus the density (e.g., number of birds per meter) within each window can be separatelyestimated. The second solution is to perform the clustering algorithm on the density map of thewhole image to segment different regions automatically. The regions with estimated densitiesare illustrated in Figure 5 (middle and right).
IV. DISCUSSION AND CONCLUSION
In this paper, we have proposed applying advanced computer vision and machine learning techniques to monitoring flocks in commercial egg farms. With the automated observation and analysis, the system has the potential to help monitor animal welfare and improve the commercial values of egg production in Australia. This case study mainly aims to observe the flock behaviour of laying hens. However, based on the detection, segmentation and tracking methods, we can further analyse the birds’ individual behaviours such as feather sucking and feature pecking. ACKNOWLEDGEMENT: The authors are grateful to Australian Eggs for their financial support of this study.
REFERENCES
Dawkins MS, Cain R, Merelie K & Roberts SJ (2013) Applied Animal Behaviour Science 145(1-2): 44-50.
Gerland P, Raftery AE, Ševčíková H, Li N, Gu D, Spoorenberg T, Alkema L, Fosdick BK, Chunn J & Lalic N (2014) Science 80(346): 234–237.
He K, Gkioxari G, Dollár P & Girshick R (2017) Proceedings of the IEEE international conference on computer vision 2961-2969.
Lin TY, Goyal P, Girshick R, He K & Dollár P (2017) Proceedings of the IEEE international conference on computer vision 2980-2988.
Wang B, Liu H, Samaras D & Hoai M (2020) arXiv preprint arXiv:2009.13077.
Aust. Poult. Science Symp. 2022...33
136

AUTOMATED DETECTION OF FLOCK HEALTH, BEHAVIOUR AND WEIGHT WITH MACHINE VISION IN COMMERCIAL BROILER SHEDS
C. MCCARTHY1 and D. LONG2
Visual assessments for health and welfare of broiler flocks are regularly performed by farm staff walking through the shed. However, common welfare indicators like footpad dermatitis and hockburn require manual handling of the flock and an automated measurement is desirable. There is potential for automated camera monitoring to complement human inspections for detection of health and welfare conditions and perform additional flock monitoring tasks. A proof-of-concept machine vision system has been developed for the detection of the health, welfare and weight of meat chicken flocks in commercial sheds using low-cost video cameras.
Video imagery was collected for six flocks in four commercial sheds using a camera (Galaxy Mini J105, Samsung, South Korea) that continuously recorded video clips for an average of 45 days per flock. The collected video was used for development of novel image analysis algorithms using the Open Computer Vision library (2015). Image analysis development focused on detecting attributes of single chickens such that flock motion could be expressed in terms of number of chickens. Automated chicken counting was achieved with root mean square error (RMSE; Microsoft Corporation, 2018) of 5%, compared to manually counted chickens in images, which was considered acceptable for quantifying flock motion.
Image analysis steps for the detection of additional flock parameters enabled identification of a novel metric which was highly correlated (R2 0.7 to 0.9) with the flock health prediction technique of Dawkins’ optical flow (Dawkins et al., 2012), which has reported success with predicting gait and footpad dermatitis from flock motion expressed in pixels. The novel metric successfully ranked flocks as ranked by Dawkins’ optical flow and as compared with flock health data provided by the farm. The finding provides insight into the flock behavioural attributes detected by Dawkins’ optical flow for health prediction, which from previous studies was not known with certainty (Dawkins et al., 2013).
A novel image analysis algorithm for weight estimation achieved overall RMSE of 55 g and relative RMSE within 5% when compared with weekly weight measurements provided by the farm using standard commercial processes. The technique used imagery from a monocular low-cost video camera and has potential to provide automated and unobtrusive daily flock weight information for the farmer.
Automated classification of multiple bird behaviours including eating, pecking and sitting was achieved in commercial shed conditions with an average of 78% accuracy, which is considered within acceptable tolerance levels due to there being no other existing technologies to perform automated behaviour monitoring in commercial environments. Potentially, automated classification and quantification of behaviours provides an objective measure for assessing flock welfare, or a real-time sensor input for a climate controller inside a shed housing system. Commercialisation opportunities for the proof-of-concept machine vision technologies are currently being explored, and further research should perform extended on-farm evaluations.
OpenCV (2015) Open Source Computer Vision Library. https://opencv.org/ Dawkins M, Cain R, Merelie K & Roberts SJ (2013) Appl. Anim. Behav. Sci. 145: 44-50. Dawkins M, Cain R & Roberts SJ (2012) Anim. Behav. 84: 219-223. Microsoft Corporation (2018) Microsoft Excel. https://office.microsoft.com/excel
1 Centre for Agricultural Engineering, University of Southern Queensland; [email protected] 2 Centre for Agricultural Engineering, University of Southern Queensland; [email protected]
Aust. Poult. Science Symp. 2022...33
137

AMINO ACID PROFILE OF PRE-TREATED FEATHER MEAL HYDROLYSATES
Y. SUN1, G. CAI2, X. LI1, D. ZHANG1, R.E. SPEIGHT2 and W.L. BRYDEN1
Feather meal (FM) which is a biological bvproduct, has a high crude protein content of about 85%. However, poor digestibility and low nutritional value restrict the utilisation of FM as animal feed, most likely linked to the mechanical stability and proteolytic resistance of keratin (Lasekan et al., 2013). Chemical treatments for improving the nutritional value of feather meal were described recently (Pfeuti et al., 2019a). The current study used a chemical-enzymatic pretreatment protocol. The pre-treatment protocol was based on a study demonstrating that keratin could be hydrolyzed using Ronozyme® ProAct (RPA, 75,000 PROT units/g) along with a reducing agent (Navone and Speight, 2018). The FM used in this trial was provided by a commercial source. There were 4 triplicated FM treatments; FM samples were incubated for 1 h with NaOH (0, 0.5, 1.5 or 2.5%) at 30 °C before incubating with 5% RPA (%FM w/w) for 17 h at 45°C. Hydrolysates and residues were collected separately for amino acid analysis. The residues from treated FMs were then lyophilized and milled. The amino acid concentrations (AAC) were determined using a Shimadzu LCMS 8050 and AAC of hydrolysates are shown in the Table.
Treatments
Amino acid concentration (mg/ml) FM1 FM2 FM3 FM4 P-value Methionine 0.45c 0.50b 0.71a 0.68a 0.000
Lysine 1.01b 1.25a 1.41a 0.92b 0.001 Threonine 1.44b 1.99a 2.30a 1.62b 0.000
Valine 2.13c 2.95b 3.55a 2.71b 0.000 Isoleucine 1.48c 1.86ab 2.11a 1.71bc 0.001 Arginine 1.69c 2.46b 2.98a 2.44b 0.000 Histidine 0.53b 0.63b 0.88a 0.82a 0.000 Leucine 2.18c 3.09ab 3.41a 2.80b 0.001
Phenylalanine 1.50c 2.07ab 2.38a 1.91b 0.000 FM1 = FM pre-treated in distilled water at 30°C for 1 h before incubated with 5% RPA at 45°C for 17 h; FM2 = FM pre-treated in 0.5% NaOH at 30°C for 1 h before incubated with 5% RPA at 45°C for 17 h; FM3 = FM pre-treated in 1.5% NaOH at 30°C for 1 h before incubated with 5% RPA at 45°C for 17 h; FM4 = FM pre-treated in 2.5% NaOH at 30°C for 1 h before incubated with 5% RPA at 45°C for 17 h. Means within the same column with different superscripts are significantly (P < 0.05 ) different. There was no difference (p > 0.05) of AAC in residues from treated FMs among treatments, but AAC of hydrolysates were significantly different (Table), especially for lysine, and methionine, the two most limiting amino acids in poultry diets. FM3 (pretreated with 1.5% NaOH and 5% RPA) gave the greatest improvement of amino acid profile. The results demonstrate that pretreatment of FM can modify the amino acid profile. Recently, Pfeuti et al. (2019b) observed that the use of protease along with sodium sulphite could improve amino acid utilisation of FM fed to rainbow trout. Nevertheless, studies on the use of pre-treated FM in poultry feed are still absent. Therefore, bird growth performance and digestibility studies are warranted to evaluate the effect of the pretreatment protocol in vivo. Lasekan A, Abu Bakar F & Hashim D (2013) Waste Management 33: 552-65. Navone L & Speright R (2018) PLoS One 13: e0202608. Pfeuti G, Cant JP, Shoveller AK & Bureau DP (2019b) Aquaculture Research 50: 1459-1474. Pfeuti G, Osborne V, Shoveller AK, Ignatz EH & Bureau DP (2019a) AgriEngineering 1: 475-
484.
1 University of Queensland, Gatton 4343 QLD. [email protected] 2 Queensland University of Technology, Brisbane 4000 QLD
Aust. Poult. Science Symp. 2022...33
138

IN-OVO INJECTION OF OREGANO OIL AFTER DAY 12 OF EMBRYONIC DEVELOPMENT DID NOT AFFECT HATCHABILITY IN BROILER CHICKENS
S. NIKNAFS1, M. NAVARRO1, A. A. KHASKHELI 1, M. M.Y. MEIJER1 and E. ROURA1
The use of antimicrobials in agriculture including broiler production is cause for concern due to the development of antibiotic resistant pathogens affecting both farm animals and humans (Marshall and Levy, 2011). Essential oils (EO) have been considered as promising alternatives to antibiotics. The aim of this study was to establish a standard in-ovo intervention using oregano EO to enhance resilience of new-born chicks against pathogens without compromising post-hatching performance. One important factor in developing a standard in-ovo method for EO is related to the stage of embryonic development. Embryonic development at early stages occurs much more quickly and the pH buffer system is not well developed compared to later stages. Therefore, we hypothesised that in-ovo injection of oregano EO during early embryonic development (before day 12) will reduce hatchability compared to a late intervention.
In this study, 0.1ml of oregano oil with concentration of 0.5% was injected into fertile eggs at different days (treatments) of incubation (day 0, 4, 8, 12, 16, and 17.5) at a rate of 100 eggs/treatment (n=100). Injection was performed under the inner shell membrane using disposable needles (25G 5/8’’). A non-injected control group was also included (control). Hatchability and performance parameters for 7 days post-hatching were compared between different treatments using ANOVA in GLM procedure of SAS 9.4. Results showed that in-ovo injection of oregano oil at days 0 and 4 of incubation compared to non-injected group significantly reduced the hatchability, 62.2% and 43% compared to 87.9%, respectively (P<0.05; Table 1). In addition, hatchability of the group injected at day 8 (79%) was significantly lower than the day 12 group (92%) (P<0.05; Table 1). There was no significant impact of in-ovo injection of oregano at different days of incubation on the performance for 7 days post-hatching.
In conclusion, in-ovo injection of oregano oil in broilers should be performed when the embryo is at least 12 days old to avoid any compromise of hatchability and post-hatching performance. The detrimental effect of early injection (before day 12) of oregano EO, which has acidic pH of 4.6, could be due to low buffering capacity of the early-stage embryo and interruption of the high pace of embryonic development.
Table 1 - Effect of in-ovo injection of oregano oil during different stages of embryonic development on hatchability and performance for 7 days post-hatching (n=100).
Treatment Group Hatchability (%) BW0 (g) BW7 (g) Feed Intake (g) FCR (g/g)
Non-injected group 87.9 ab 44.5 191.5 177.5 1.207 Injected at d0 62.2 c 43.7 189.9 166.0 1.133 Injected at d4 43.0 d 44.0 179.5 189.2 1.395 Injected at d8 79.0 b 44.1 198.0 158.1 1.026 Injected at d12 92.0 a 44.0 180.0 219.3 1.454 Injected at d16 84.8 ab 44.3 185.4 163.0 1.155 Injected at d17.5 88.0 ab 43.7 197.9 204.2 1.344 SEM 6.73 0.34 7.46 31.5 0.210 P value < 0.05 0.5443 0.4231 0.7345 0.7949
ACKNOWLEDGEMENTS: This study has been funded by AgriFutures Chicken Meat. Marshall BM & Levy SB (2011) Clin. Microbiol. Rev. 24: 718-33.
1 Centre for Nutrition and Food Sciences, Queensland Alliance for Agriculture and Food Innovation (QAAFI), The University of Queensland, Australia. [email protected]
Aust. Poult. Science Symp. 2022...33
139

HYDROXY-SELENOMETHIONINE IMPROVES SELENIUM STATUS AND ANTIOXIDANT CAPACITY UNDER HEAT STRESS CONDITIONS
H. SUN1,2, L. ZHAO1,2, Z.J. XU1,2, M. DE MARCO3, M. BRIENS3, X.H. YAN1,2 and L.H. SUN 1,2
This study investigated whether hydroxy-selenomethionine (OH-SeMet) improves broiler oxidative stress response to a greater extent than sodium selenite (SS) or seleno-yeast (SY) under environmental stress. Day-old male Cobb 500 broilers (12 cages/diet, 9 broilers/cage) were fed a selenium (Se)-deficient diet (0.047 mg Se/kg) supplemented with SS, SY or OH-SeMet at 0.3 mg Se/kg for 42 days. Animals were raised at a high stocking density (18 broiler/m²) and during the summer period inducing heat stress conditions (average 1-42 days temperature 33.4°C ± 0.7, average relative humidity 70.9%). OH-SeMet significantly improved the mortality corrected feed conversion ratio (FCR) and Se concentration in pectoral muscle, liver and jejunum as compared with SS (P <0.05, Table 1). Relative selenoprotein W (SELENOW) quantities were also significantly (P<0.05) increased by OH-SeMet compared to SS as observed in pectoral muscle (SS:100; SY:128; OH-SeMet:141) and jejunum (SS:100; SY:112; OH-SeMet:324). OH-SeMet increased total antioxidant capacity compared to SS, and it reduced malondialdehyde and protein carbonyl in the muscle more than SY (P <0.05, Figure 1). Cortisol blood levels were significantly (P<0.05) reduced by SY and OH-SeMet as compared with SS (SS:22.8; SY:20.3; OH-SeMet:18.9 ng/ml). Circulating anti-inflammatory cytokine IL-10 was higher (P<0.05) for OH-SeMet compared to SS and SY, indicating a better ability of OH-SeMet to promote an anti-inflammatory response (IL-10: SS:8.7; SY:9.2; OH-SeMet:12.4 pg/ml). Intestinal morphology measures indicated that OH-SeMet resulted in higher (P<0.05) villus height to crypt depth ratio than SS in the duodenum and ileum (SS:3.53; SY:3.93; OH-SeMet:4.14 and SS:3.87; SY:4.80; OH-SeMet:4.76, respectively).
Table 1 – D1 to D42 performances of broilers fed different selenium sources under heat stress
conditions and D42 tissue selenium concentrations.
SS SY OH-SeMet BWG, g/bird 1537 1535 1594
FI, g/bird 2665 2633 2724 FCR, g/g 1.74a 1.72ab 1.71b
Mortality, % 3.7 4.6 3.7 Muscle [Se] mg/kg 0.12c 0.17b 0.29a Liver [Se] mg/kg 0.44b 0.37b 0.58a
Jejunum [Se] mg/kg 0.43b 0.48ab 0.49a
Figure 1 – Effect of selenium sources on pectoral
muscle antioxidant parameters, total antioxidant capacity (T-AOC), malondialdehyde
(MDA) and protein carbonyl (PC)
OH-SeMet as a pure organic form of selenium, has the potential to improve Se status, antioxidant capacity and anti-inflammatory response under oxidative stress situation.
1 Department of Animal Nutrition and Feed Science, HZAU, Wuhan, Hubei China. [email protected] 2 Hubei Hongshan Laboratory, Wuhan, Hubei 430070, China. 3 Adisseo France S.A.S., 10, Place du Général de Gaulle, 92160 Antony, France. [email protected]
Aust. Poult. Science Symp. 2022...33
140

DETERMINATION OF CALCIUM AND PHOSPHORUS DIGESTIBILITY IN A SHORT-TERM BIOASSAY WITH BROILERS
X. LI1, D. ZHANG1, L.Y. PAN1, S.J. WILKINSON2 and W.L. BRYDEN1
Calcium digestibility can vary dramatically depending on the Ca source, limestone solubility, source of phytate and addition of phytase (Li et al., 2021). However, there is no agreement in the literature about the most appropriate method for determining Ca digestibility (Li et al., 2017). In the current study, the apparent ileal Ca and P digestibility was determined in diets varying in Ca content, with and without phytase supplementation, based on the short-term protocol described by Kim et al. (2019). Day old, Ross 308, male chicks were fed a wheat-sorghum-soybean meal broiler diet. The diet contained 0.65% Ca and 0.25% ileal digestible P with supplemental phytase at 500 FTU (AXTRA® PHY TPT 10,000) and a mixture of carbohydrases (AXTRA® XB 201 TPT). On day 20, the birds were weighed and allocated by stratified randomisation into cages, with 8 birds per cage and 8 replicates per treatment. There were 4 dietary treatments. The control birds were fed the mash basal diet (Diet 1) containing low Ca maize and soybean meal diet (Ca = 0.15 %), with an added indigestible marker, celite, at 20 g/kg. Diet 2 consisted of the basal diet, plus phytase at 1000 FTU/kg. Diet 3 consisted of the basal diet to which was added limestone (PureCal 12-40) to increase the dietary Ca concentration to 0.65%. Diet 4 was prepared by supplementing Diet 3 with phytase (1000 FTU/kg). After 36 hrs of feeding, the contents of the distal half of the ileum were collected, pooled per replicate, freeze dried and ground. Feed and digesta were analysed in duplicate for Ca, P. Ileal digestibility coefficients were calculated and are shown in the Table.
Diet 1 Diet 2 Diet 3 Diet 4 Apparent ileal Ca digestibility 56.32c 72.41a 47.01d 67.35b
SEM 0.67 1.13 1.53 1.08 Apparent ileal P digestibility 70.06c 88.93a 31.77d 79.92b
SEM 0.69 0.55 1.57 0.82 a-d Means within a row not bearing a common superscript are different (P<0.05)
The data were analysed using the General Linear Model procedures (Minitab version 17.0). The significance level is P < 0.05. The results show the impact of both dietary concentrations of Ca and phytase on Ca and P digestibility. The negative impact of Ca concentrations can be largely overcome by dietary supplementation with phytase. These relationships have been described in the literature (Li et al., 2017) and in the present study they demonstrate that this bioassay is appropriate for determining Ca and P digestibility. This short-term feeding procedure avoids some of the difficulties of determining digestibility, namely the physiological adaptation to P deficient or Ca and P imbalanced diets when longer feeding periods are used, making it suitable for Ca and P digestibility determination. ACKNOWLEDGMENTS: Poultry Hub of Australia and Feedworks provided funding Kim SW, Li W, Angel R & Plumstead PW (2019) Poult. Sci. 98: 6837–6848.
Li W, Angel R, Plumstead PW & Enting H (2021) Poult. Sci. 100: 900-909.
Li X, Zhang D & Bryden WL (2017) Anim. Prod. Sci. 7: 2304 -2310.
1 The University of Queensland, School of Agriculture and Food Sciences, Gatton Campus, Gatton QLD 4343 2 Feedworks Pty Ltd, Romsey VIC 3434
Aust. Poult. Science Symp. 2022...33
141

‘IN OVO’ INJECTION OF OREGANO ESSENTIAL OIL ON DAY 17.5 DID NOT AFFECT HATCHABILITY IN BROILER CHICKENS
M.M.Y. MEIJER1, A.A. KHASKHELI1, S. NIKNAFS1 and E. ROURA1
Enteric diseases can severely affect health and welfare in broilers but can be effectively treated by antibiotics. However, complying with current consumer trends requires the adoption of other strategies away from these chemicals. One of the alternatives is essential oils (EO’s); plant-derived compounds that are used in poultry nutrition due to their antimicrobial, antioxidant and immune-modulating effects (Brenes & Roura, 2010). Little is known about using EO’s during embryonic development, referred to as ‘in ovo’. The main objective of this experiment was to identify the best day and site for ‘in ovo’ injection of EOs using oregano oil (OEO) as a model. Thus, this experiment aimed at testing the hypothesis that injecting OEO on d12 of incubation or later, using the least disruptive site of injection (air cell), would result in higher hatchability and better post-hatch performance compared to injections into other sites and control groups. The experiment consisted of a 2x3 factorial design. 0.1mL OEO (0.5%) was injected on two days (d12 and 17.5) in three sites (air cell, amnion, yolk) with 100 eggs/treatment (n=100). A non-injected control and two quality controls injected with 0.9% saline (d12 air cell; d17.5 amnion) (n=40) were used. Treatments were randomly allocated to six levels of two incubators (Brinsea Ova-Easy 580) in groups of 25 or 10 (OEO and controls) and incubated for 18 days. At d12 and 17.5 eggs were injected on the blunt (air cell; amnion) or pointy end (yolk) with a 25Gx5/8” needle for the air cell at d12 and d17.5 and yolk at d17.5 and a 23Gx1¼” needle for the amnion at d12 and d17.5 and yolk at d12. At d18 eggs were transported to two hatchers (Greatlander 6BH) each with six levels divided into three compartments and split into 5 groups of 20 and 2 groups of 20 per treatment (OEO and controls). Groups were randomly allocated to a compartment and incubated until hatch. After hatch, chicks were moved to six brooders (Cimuka) in four groups of 20 and two groups of 20 per treatment (OEO and controls). Hatchability and 7-day post-hatch performance parameters were compared between treatments using ANOVA and pairwise comparisons (RStudio). OEO injection on d12 decreased hatchability (76.5%) compared to OEO injection on d17.5 (85.4%) as well as the non-injected (89.6%) and saline (d12) injected (89.7) controls; therefore OEO injection before d17.5 may affect embryonic development. It remains to be investigated if this is related to possible toxicity caused by OEO in early (d12) but not late (d17.5) embryonic stages. No main effects of OEO injection on day and site of injection were found for body weight at hatch or 7 days post-hatch, feed intake and FCR. Body weight at hatch was lower (P<0.05) for chicks injected with OEO in the yolk at d12 (45.89g), than in the amnion at d17.5 (46.83g), indicating an interaction between day and site of injection. An important aspect uncovered by this trial was a potential cytotoxic effect of OEO early in embryonic development that requires more research. In conclusion, injecting OEO at d17.5 showed promising results regarding hatchability. The reduced hatchability when injecting OEO on d12 was unexpected and warrants further investigation.
ACKNOWLEDGEMENTS: This work was supported by AgriFutures Chicken Meat Program.
Brenes A & Roura E (2010). Anim. Feed Sci. Tech. 158 (1–2): 1–14. Wakenell PS, Bryan T, Schaeffer J, Avakian A, Williams C & Whitfill C (2002) Avian Dis.
46(2): 274–280.
1 Centre for Nutrition and Food Sciences, Queensland Alliance for Agriculture and Food Innovation (QAAFI), University of Queensland. [email protected]
Aust. Poult. Science Symp. 2022...33
142

SULFUR AMINO ACID REQUIREMENT OF STARTER, GROWER, AND FINISHER BROILERS DETERMINED USING L-METHIONINE
J. MILLECAM1, A. DEDENAUER2, D.R. KHAN3 and B. SAREMI 4
Summary
In the absence of a feed grade L-Methionine (L-Met), sulfur amino acid (SAA) requirement of broilers has been defined using DL-Met. In this experiment, we attempted to define SAA requirement of broilers using L-Met. A basal diet deficient in standardized ileal digestibility (SID) of SAA and six incremental levels of L-Met was used to achieve or to exceed the known requirements. Male broilers were used in this study (n=1890). At the beginning of starter, grower and finisher phases, each time 630 broilers were randomly distributed among 42 pens (each 15 broilers). At the end of each growth phase, body weight, body weight gain, feed intake, feed conversion ratio, carcass weight, breast meat and leg weight were determined. Different models were used to estimate the SID SAA requirement of broilers. The model with the best fit to the data was used to generate SID SAA data. The deficient SAA diet significantly reduced broilers performance results. The optimum SID SAA requirement of broilers was depending on age and the measured parameter. Overall, 0.69, 0.66, and 0.62% SID SAA were determined as optimum concentration of SID SAA for broilers in starter, grower and finisher phases, respectively. The estimated SID SAA in this study were lower than the current recommendations.
I. INTRODUCTION
Methionine plus Cysteine (Cys) requirement of poultry and swine has been determined using graded levels of DL-Met. Currently, Aviagen recommends 0.95, 0.87, and 0.83% SID Met plus Cys for starter, grower, and finisher phases of Ross 308 broilers (Aviagen, 2019). Cobb recommends 0.88, 0.80, and 0.74% SID Met plus Cys for the respective growth phases (Cobb, 2018). Similarly, Brazilian tables recommend 0.99, 0.97, and 0.91% SID Met plus Cys for broilers starter, grower, and finisher phases (Rostagno et al. 2005). In 2005, Garcia and Batal demonstrated in two executive experiments with male Cobb 500 broilers, the SID SAA recommendations (%) for the first 4, 7, and 21 days of life were 0.88 and 0.71, 0.87 and 0.75, and 0.83 and 0.75 (used DL-Met to create the incremental SID SAAs). In this experiment, we determined the SID Met plus Cys requirement of broilers in feeds containing only L-Met from protein bounded L-Met and supplementary L-Met. There was no attempt to compare methionine sources in this experiment.
II. METHOD
One day old male Ross 308 broilers (n=1890) were used in this study. Part of the chickens (n=630 test birds) were entered into 42 pens (1 m2). The remaining chickens were kept in two large pens (pool birds) and were kept on a commercial starter and grower feed (Millecam et al. 2021). Pool birds were entered into test pens at day 10 and 23 after removing the previous birds to avoid a carryover effect from the previous feeding phases. Basal diets (published at Millecam et al. 2021) were formulated according to Ross 308 (Aviagen, 2019) except for SID Met plus Cys (0.60, 0.55 and 0.50 during the starter, grower and finisher phases, respectively; Millecam
1 Poulpharm BVBA, Prins-Albertlaan 112, 8870 Izegem, Belgium; [email protected] 2 Poulpharm BVBA, Prins-Albertlaan 112, 8870 Izegem, Belgium; [email protected] 3 Main Airport Center, Unterschweinstiege 2-14, 60549 Frankfurt am Main, Germany; [email protected] 4 Main Airport Center, Unterschweinstiege 2-14, 60549 Frankfurt am Main, Germany; [email protected]
Aust. Poult. Science Symp. 2022...33
143

et al. 2021). L-Met was added to create the 6 additional levels of SID Met plus Cys. Six pens containing 15 birds each were randomly allocated to the treatment groups. Six pens per treatment group in a regression analysis experimental setup is considered appropriate because means are not compared rather than slope of the lines. Accuracy of the lines are depending to the dots created by graded levels of SID SAAs. Pens were weighed at the beginning and end of feeding phases. Feed intake was measured accordingly. At the end of finisher phase, four birds per pen were individually weighed, slaughtered, and carcass, breast, and leg weight were measured. Data were analyzed using R (R core team, 2020). Two statistical models were applied to the data (a linear broken line and an exponential asymptotic model). The model with the highest R2 was selected and used to determine the SID SAA requirements. Linear regression models (procedure lm of the core package) were used to determine the effect of treatment. Post hoc least significance difference tests with no adjustment for multiple comparisons was applied to compare means (P<0.05).
III. RESULTS
There was a progressive response in starter, grower, and finisher birds by the addition of L-Met to the basal diet (Table 1 and 2). Addition of L-Met significantly increased performance and slaughter parameters until a plateau was achieved. For most of the parameters, the broken line linear model showed the best fit (Figure 1). An overview of estimated SID Met plus Cys are given in table 3. The estimated numbers are variable depending on the parameter and age. According to the best fit, SID Met plus Cys was estimated to be 0.69, 0.66, and 0.62% for starter, grower and finisher phases, respectively.
Table 1 – Mean performance parameters of broilers. The standard error of mean is defined in brackets (SEM).
Treatment BW end of phase (g) ADG (g/day) ADFI (g/day) FCR % mortality
or culled Starter (d0-10)
Basal diet (BD) 265.2 (3.61)c 21.9 (0.32)c 24.71 (1.28)c 1.12 (0.05)a 1.1 BD + 0.05% L-Met 299.3 (4.83)b 25.2 (0.54)b 26.69 (0.82)bc 1.08 (0.02)ab 1.1 BD + 0.10% L-Met 325.6 (3.46)a 27.8 (0.39)a 29.49 (0.52)a 1.05 (0.01)abc 1.1 BD + 0.15% L-Met 329.9 (4.40)a 28.3 (0.39)a 29.94 (1.19)a 1.04 (0.03)bc 1.1 BD + 0.25% L-Met 331.5 (4.08)a 28.3 (0.45)a 29.46 (0.47)a 1.04 (0.01)bc 3.3 BD + 0.35% L-Met 331.1 (5.91)a 28.4 (0.64)a 29.51 (0.71)a 1.04 (0.01)bc 1.1 BD + 0.45% L-Met 323.9 (4.60)a 27.4 (0.45)a 28.53 (1.05)ab 1.00 (0.03)c 1.1
Grower (d11-23) BD 1021 (14.85)d 53.4 (1.09)c 97.6 (1.81)a 1.83 (0.05)a 0.0 BD + 0.05% L-Met 1133 (18.59)c 61.9 (1.64)b 94.8 (1.26)ab 1.54 (0.06)b 0.0 BD + 0.10% L-Met 1191 (6.78)b 66.4 (0.58)a 96.1 (0.78)a 1.44 (0.02)bc 0.0 BD + 0.15% L-Met 1203 (17.72)ab 67.1 (1.71)a 94.7 (1.98)ab 1.41 (0.01)c 1.1 BD + 0.25% L-Met 1234 (8.67)a 69.0 (1.02)a 94.6 (0.82)ab 1.37 (0.02)c 1.1 BD + 0.35% L-Met 1210 (13.55)ab 67.4 (0.73)a 95.3 (1.30)ab 1.41 (0.02)c 4.4 BD + 0.45% L-Met 1229 (10.25)ab 66.3 (1.21)a 92.1 (1.58)b 1.36 (0.01)c 3.3
Finisher (d24-35) BD 2227 (13.66)b 88.1 (1.36)c 163.9 (2.09) 1.86 (0.03)a 1.1 BD + 0.05% L-Met 2355 (101.11)ab 94.0 (4.01)bc 169.6 (7.78) 1.73 (0.02)b 0.0 BD + 0.10% L-Met 2363 (51.03)ab 99.2 (4.32)ab 165.9 (5.19) 1.66 (0.02)bc 0.0 BD + 0.15% L-Met 2389 (40.52)a 106.8 (1.72)a 166.5 (3.22) 1.56 (0.03)d 1.2 BD + 0.20% L-Met 2346 (48.93)ab 102.2 (2.90)ab 160.9 (5.26) 1.58 (0.04)cd 1.2 BD + 0.30% L-Met 2372 (69.94)a 100.5 (5.53)ab 163.4 (6.03) 1.64 (0.03)cd 0.0 BD + 0.40% L-Met 2402 (47.74)a 108.9 (3.83)a 168.4 (3.56) 1.60 (0.05)cd 0.0 a-d Treatment groups who differ significantly (P < 0.05) from each other within a parameter and bird phase have a different letter.
Aust. Poult. Science Symp. 2022...33
144
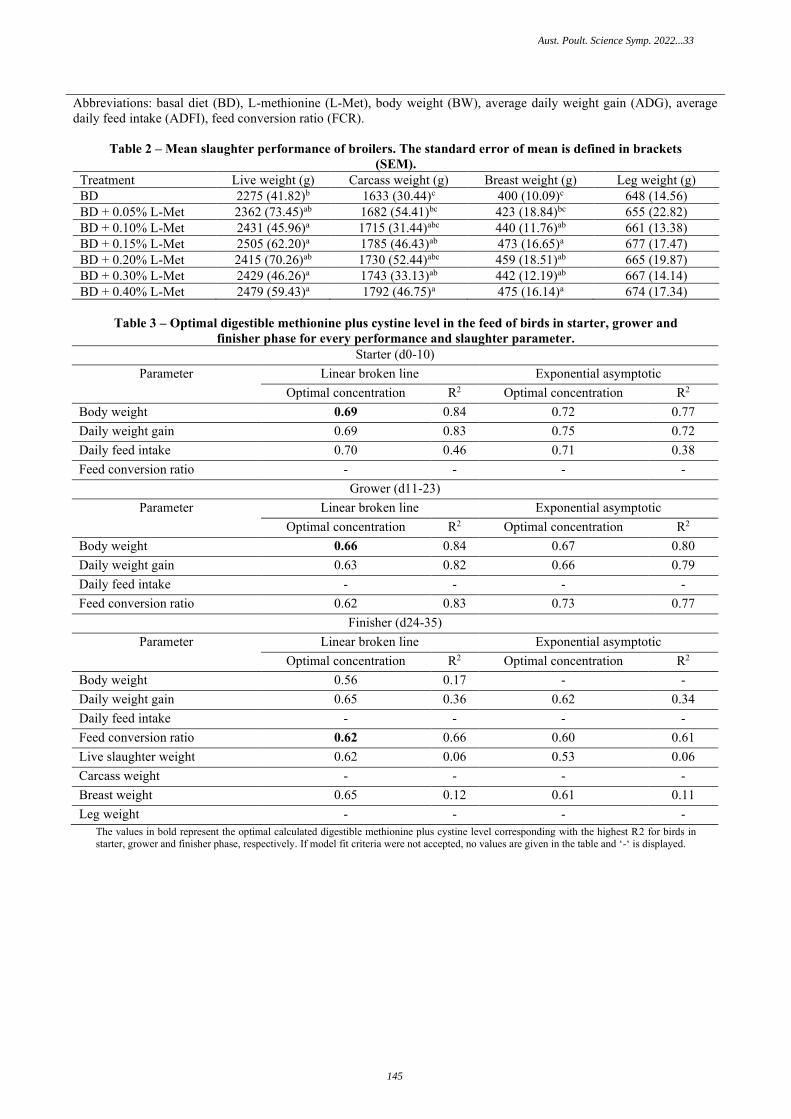
Abbreviations: basal diet (BD), L-methionine (L-Met), body weight (BW), average daily weight gain (ADG), average daily feed intake (ADFI), feed conversion ratio (FCR).
Table 2 – Mean slaughter performance of broilers. The standard error of mean is defined in brackets
(SEM). Treatment Live weight (g) Carcass weight (g) Breast weight (g) Leg weight (g) BD 2275 (41.82)b 1633 (30.44)c 400 (10.09)c 648 (14.56) BD + 0.05% L-Met 2362 (73.45)ab 1682 (54.41)bc 423 (18.84)bc 655 (22.82) BD + 0.10% L-Met 2431 (45.96)a 1715 (31.44)abc 440 (11.76)ab 661 (13.38) BD + 0.15% L-Met 2505 (62.20)a 1785 (46.43)ab 473 (16.65)a 677 (17.47) BD + 0.20% L-Met 2415 (70.26)ab 1730 (52.44)abc 459 (18.51)ab 665 (19.87) BD + 0.30% L-Met 2429 (46.26)a 1743 (33.13)ab 442 (12.19)ab 667 (14.14) BD + 0.40% L-Met 2479 (59.43)a 1792 (46.75)a 475 (16.14)a 674 (17.34)
Table 3 – Optimal digestible methionine plus cystine level in the feed of birds in starter, grower and
finisher phase for every performance and slaughter parameter. Starter (d0-10)
Parameter Linear broken line Exponential asymptotic Optimal concentration R2 Optimal concentration R2
Body weight 0.69 0.84 0.72 0.77 Daily weight gain 0.69 0.83 0.75 0.72 Daily feed intake 0.70 0.46 0.71 0.38 Feed conversion ratio - - - -
Grower (d11-23) Parameter Linear broken line Exponential asymptotic
Optimal concentration R2 Optimal concentration R2 Body weight 0.66 0.84 0.67 0.80 Daily weight gain 0.63 0.82 0.66 0.79 Daily feed intake - - - - Feed conversion ratio 0.62 0.83 0.73 0.77
Finisher (d24-35) Parameter Linear broken line Exponential asymptotic
Optimal concentration R2 Optimal concentration R2 Body weight 0.56 0.17 - - Daily weight gain 0.65 0.36 0.62 0.34 Daily feed intake - - - - Feed conversion ratio 0.62 0.66 0.60 0.61 Live slaughter weight 0.62 0.06 0.53 0.06 Carcass weight - - - - Breast weight 0.65 0.12 0.61 0.11 Leg weight - - - -
The values in bold represent the optimal calculated digestible methionine plus cystine level corresponding with the highest R2 for birds in starter, grower and finisher phase, respectively. If model fit criteria were not accepted, no values are given in the table and ‘-‘ is displayed.
Aust. Poult. Science Symp. 2022...33
145

Figure 1 – Exponential asymptotic (red) and linear broken line (blue) models fitted to body weight gain at day 10 (BWD10) and Feed conversion ratio between day 10 an d23 (FCRD10D23). Linear model did not show a fit to any of the parameters therefore was excluded from data.
IV. DISCUSSION
The nutrient requirement of broilers is affected by different factors such as age, gender, and breed. Consequently, performance of broilers is measured to be affected by such factors (Livingston et al. 2020). SID Met plus Cys requirement of broilers follows a similar trend with an exception. SID Met plus Cys requirements is additionally affected by the source of Met used to implement the incremental levels of SID Met plus Cys. Majority of studies looking at SID Met plus Cys are performed using DL-Met thus efficacy of DL-Met is incorporated in the known SID Met plus Cys requirements. Herein, graded levels of L-Met were used to create the incremental levels of SID Met plus Cys. To achieve the maximum performance of broilers, 0.27. 0.19, and 0.14% less SID Met plus Cys was required compared with breeder recommendations. According to Aviagen, broilers need 0.95, 0.87, and 0.83% SID Met plus Cys for starter, grower, and finisher phases, respectively, while in this experiment 0.69, 0.66, and 0.62% SID Met plus Cys were required to achieve the maximum performance of Ross 308 broilers. Whether or not these observed lower SID Met plus Cys requirements could be attributed to the stereoisomers of Met should be further elucidated.
REFERENCES
Aviagen (2019) https://en.aviagen.com/assets/Tech_Center/Ross_Broiler/RossBroiler NutritionSpecs2019-EN.pdf.
Cobb Vantress Inc. (2018) https://www.cobb-vantress.com/assets/Cobb-Files/product-guides/bdc20a5443/70dec630-0abf-11e9-9c88-c51e407c53ab.pdf.
Garcia A & Batal AB (2005) Poultry Science 84: 1350-1355. Livingston ML, Cowieson AJ, Crespo R, Hoang V, Nogal B, Browning M & Livingston KA
(2020) Heliyon 6: e04400. Millecam J, Khan DR, Dedeurwaerder A & Saremi B (2021) Poultry Science 100: 910–917. Rostagno HS, Albino LFT, Donzele JL, Gomes PC, Oliveira RFM, Lopes DC, Ferreira AS, &
Barreto SLT (2005) Brazilian tables for poultry and swine: food composition and nutrient requirements 2nd ed. Minas Gerais: Universidade Federal de Viçosa, Viçosa.
R Core Team (2020) R Foundation for Statistical Computing, Vienna, Austria.
Aust. Poult. Science Symp. 2022...33
146

POTENTIAL OF A LIVE SALMONELLA TYPHIMURIUM VACCINE TO PROVIDE CROSS-PROTECTION AGAINST A NOVEL SALMONELLA ENTERITIDIS STRAIN IN
LAYERS
C. CLARK1, A. COLLINS2, Y. GAO1, G. UNDERWOOD3, C. JACKSON3, S. WILLIAMSON4, S. SHARPE4 and P. GROVES1
Salmonella serotypes vary throughout the livestock industry. Historically Salmonella Enteritidis is not considered to be prevalent in Australian poultry flocks. As recently as 2018 a novel S. Enteritidis emerged in the industry (FSANZ, 2019). Although, there are no specific vaccines available in Australia against this serotype in poultry, the use of live attenuated Salmonella vaccines that have the potential to cross protect against several Salmonella serotypes could be a solution for the industry.
Currently, if a commercial layer flock becomes infected with serotype Enteritidis, flock depopulation is mandated, and the farm must demonstrate freedom before restocking. This has a significant animal welfare and economic impact on farms where this serotype has spread, representing a significant risk to the Australian poultry industry and human health. The benefits of an existing live attenuated S. Typhimurium vaccine to be able to protect birds against both S. Typhimurium and S. Enteritidis challenge in the field would increase confidence and security in the industry and enhance human protection against food borne salmonellosis.
116 commercial layer hens were held in floor pens much like commercial production practices. Commercial layers were assessed at point of lay at 18 weeks of age, after sexual maturity, as this is a high stress period where the layers are assumed to be most vulnerable. The hens were challenged with the novel S. Enteritidis strain (phage type 12 according to the Salmonella reference laboratory IMVS) orally at 109.
To establish a cross-protection benefit, the vaccination program applied was as follows: day old (coarse spray), 3 weeks age (oral gavage), followed by either one or two intramuscular doses of the same vaccine at 9, or 9 and 14 weeks of age respectively. Protection was measured by a reduction in the proportion of S. Enteritidis detected in cloacal swabs, caeca, liver, spleen, and reproductive tracts of unvaccinated and vaccinated birds. Antibody titre test were conducted for Group B and Group D serovars to measure the effect of vaccination on the production of these antibodies.
Results from cloacal swabs are: in the challenged groups, all had a similar proportion of cloacal swabs positive at 3 days post challenge (83%), but this declined significantly by days 10 and 14 post challenge. The proportion of birds with positive cloacal swabs at 5 days post challenge was significantly lower in the single-injection vaccinated group and at 7 days post challenge in the double vaccinated group compared with the challenged controls. Complete results will be presented and discussed in detail during the conference. FSANZ, June 2019, Salmonella Enteritidis (SE) linked to eggs, Food safety and recalls, https://www.foodstandards.gov.au/consumer/safety/Pages/Salmonella-Enteritidis-linked-to-eggs.aspx, 29 September 2021
1 The University of Sydney, 425 Werombi Road, Brownlow Hill NSW 2570 [email protected]; [email protected]; [email protected] 2 Elizabeth Macarthur Agricultural Institute Woodbridge Road Menangle NSW 2568 [email protected] 3 BioProperties, 36 Charter Street, Ringwood VIC 3134 [email protected] 4 Birling Laboratories, 975 The Northern Road, Bringelly NSW 2556 [email protected]; [email protected]
Aust. Poult. Science Symp. 2022...33
147

EFFECT OF DIETARY INCLUSION OF COMBO ENZYME PRODUCT ON PERFORMANCE AND GUT HEALTH IN BROILERS
Y. BASHIR1, P. P. DAS2, V. M SHELKE3 and R. CHANTHIRASEKARAN4
Summary
The rising cost of feed ingredients can affect profitability necessitating the inclusion of less expensive alternative raw materials to corn and soyabean meal in poultry feed. However, a concern with some alternate raw materials is low digestibility and the presence of anti-nutritional factors, which can impact bird performance. To improve the nutrient utilization and digestibility of protein and energy of the alternate raw materials, a combination of various enzymes such as non-starch polysaccharides (NSPases) and proteases has been used extensively in poultry diets. The present study was designed to investigate the dietary incorporation of an enzyme combination on the productive performance and gut health of commercial broilers fed diets containing various alternate protein sources. A total of 600 day old chicks were divided into three dietary treatments: the first treatment was a positive control with typical commercial broiler feed specifications, the second treatment was a negative control with a reduction of standard amino acid and metabolizable energy, and the third treatment was the addition of combo enzyme product to the negative control. The 35-day trial study revealed that the combo enzyme product was able to maintain productive performance comparable to positive control group
I. INTRODUCTION
Feed is the largest cost in poultry production, particularly in recent times due to the increased price of protein and energy sources. Feed cost can be reduced with the inclusion of alternate protein and energy sources like pearl millet, deoiled rice bran (DORB), meat and bone meal (MBM), dried distillers’ grains with solubles (DDGS) and mustard deoiled cake (MDOC) replacing soya bean meal (SBM) and corn. However, these alternate ingredients have low digestibility and some anti-nutritional factors (ANFs) like non-starch polysaccharides (NSPs) and phytate which can have detrimental impacts on performance. In addition, birds fed with a typical corn-soy ration have approximately 1.67-1.88 MJ of metabolizable energy per kg of diet remaining undigested (Francesch et al., 2009). Inclusion of exogenous enzymes like NSPases or proteases to poultry feed is one way of addressing this issue (Lavrentiev et al., 2019) by correcting the lack of specific endogenous enzymes to digest certain nutrients or to hydrolyze ANFs in feed ingredients (O’Neill et al., 2012)
The current experiment was designed to evaluate the effect of a combo enzyme product (CEP), NUTRIKEM™ 5.0, on performance parameters (body weight, feed conversion ratio (FCR)) and the European efficiency factor which incorporates economic parameters namely livability, average weight, mean age and FCR, economic returns and gut health in commercial broilers (see footnote to Table 4). NUTRIKEM™ 5.0 is a unique combination of multi NSPase enzymes, multi protease (acid, neutral and alkaline protease) and fast acting protease embedded in a matrix of lysophospholipids. Multi NSPases improve digestion of different NSP fractions of raw materials (Khattack et al., 2006; Ravindran V 2013). Multiprotease with fast acting protease activity assists rapid protein substrate reaction throughout the intestine in a sustained
1 Technical Manager, Kemin Industries South Asia Pvt Ltd, [email protected] 2 Head Technical- Nutrition, Kemin Industries South Asia Pvt. Ltd. [email protected] 3 Head Technical- Health, Kemin Industries South Asia Pvt. Ltd. [email protected] 4 General Manager- Technical Services, Kemin Industries South Asia Pvt. Ltd. [email protected]
Aust. Poult. Science Symp. 2022...33
148

manner (Chandrasekar et al., 2017). Lysophospholipids in suitable blends form a strong emulsion, better hydrolysis and absorption of lipid component and total nutrients in diets (Zhang et al., 2011). This reduces gut viscosity and improves nutrient utilization from poorly digested raw materials and bioavailability of nutrients.
II. METHOD
The experiment was conducted at a registered third-party trial facility (Registration number: IGNOU-38011P) in the northern part of India. A total of 600 straight run broiler chicks were randomly allocated to three dietary treatments as indicated in Table 1. Each dietary treatment had 10 replicates of 20 birds each. Table 2 represents ingredients and chemical composition of the diets.
Table 1 - Details of the treatment groups Treatment Description Positive control (PC) Premium basal diet (Vencobb 430 as per industry recommendations)
Negative control (NC) PC minus 0.63 MJ Metabolisable Energy and 80g/kg dig. amino acids (considering matrix associated with product)
Combo enzyme product (CEP) NC + CEP at 500g/MT of feed
Table 2 - Ingredients and chemical composition of experimental diets
Ingredients (g/kg) PS (PC) PS (NC) PS (NC+ CEP) S (PC) S (NC) S (NC+
CEP) F (PC) F (NC) F (NC+ CEP)
Maize 536 489 488 560 549 548 584 591 591 Hypro Soya (49.5% CP) 305 232 232 260 206 206 229 185 185 Pearl millet 75 100 100 75 100 100 75 100 100 MBM (44% CP) 30 45 45 30 45 45 30 45 45 DORB 0 83 83 0 49 49 0 15 15 MDOC (37% CP) 10 25 25 20 25 25 20 35 35 Crude Soya Oil 18 5 5 32 8 8 41 13 13 DL- Methionine 3.02 2.66 2.66 2.67 2.31 2.31 2.32 1.90 1.90 L Lysine HCl 2.75 3.06 3.06 2.65 2.80 2.80 2.41 2.33 2.33 L Threonine 0.96 1.02 1.02 0.93 0.88 0.88 0.82 0.65 0.65 Salt 2.30 2.10 2.10 2.25 2.10 2.10 2.27 2.10 2.10 Soda 2.10 2.00 2.00 2.00 1.75 1.75 2.00 1.80 1.80 Calcite 5.60 3.70 3.70 4.60 2.10 2.10 3.90 1.00 1.00 DCP 3.70 0.50 0.50 2.53 0.50 0.50 1.00 0.50 0.50 Vitamins 0.5 0.5 0.5 0.5 0.5 0.5 0.5 0.5 0.5 Trace mineral 0.5 0.5 0.5 0.5 0.5 0.5 0.5 0.5 0.5 CEP 0 0 0.5 0 0 0.5 0 0 0.5 Phytase (5000 FTU) 0.2 0.2 0.2 0.2 0.2 0.2 0.2 0.2 0.2 Other Additives* 5 5 5 5 5 5 5 5 5 Total 1000 1000 1000 1000 1000 1000 1000 1000 1000
Note: PS- Prestarter; S- Starter; F- Finisher; CP- Crude Protein; DORB- De-oiled Rice Bran; MDOC- Mustard deoiled cake; DCP- Dicalcium phosphate *Additives: mycotoxin binders 1.0 kg, organic acids 1.0 kg, choline chloride 1 kg, anticoccidial 0.5kg, organic acids 1 kg, probiotics 0.5kg
Specifications PS (PC) PS (NC) S (PC) S (NC) F (PC) F (NC) CP (g/kg) 220 205 202 192 190 183 Energy (MJ) 12.34 11.72 12.76 12.13 13.18 12.55 Dig. Lysine (g/kg) 12.3 11.4 11.2 10.4 10.2 9.5 Dig. Arginine (g/kg) 14.3 13.1 13 12 12 11.3 Dig. Threonine (g/kg) 8.1 7.5 7.5 7.0 7.0 6.5 Dig. Tryptophan (g/kg) 2.4 2.1 2.1 2.0 2.0 1.8 Dig. M+C (g/kg) 9.1 8.4 8.4 7.8 7.7 7.2 Dig. Isoleucine (g/kg) 8.4 7.5 7.6 7.0 7.1 6.6 Dig. Valine (g/kg) 9.5 8.7 8.7 8.2 8.1 7.8 Calcium (g/kg) 8.8 8.8 8.0 8.0 7.4 7.4
Aust. Poult. Science Symp. 2022...33
149

Available Phosphorous (g/kg) 4.5 4.5 4.3 4.3 4.0 4.0 Sodium (g/kg) 2.0 2.0 1.9 1.9 1.9 1.9 Chlorine (g/kg) 2.0 2.0 2.0 2.0 2.0 2.1
Note: PS- Prestarter; S- Starter; F- Finisher; CP- Crude Protein; Dig- Digestible; M- Methionine; C- Cysteine.
All birds were reared in deep litter floor pens and were fed a pre-starter diet from day-one to 14 days, starter diets from 15 to 28 days, and finisher diets from 29 to 35 days. Weekly parameters pertaining to average body weight, cumulative feed intake and FCR were measured, and results were calculated after 35 days. Birds had access to ad libitum clean drinking water containing sanitizer and acidifier and were vaccinated for Newcastle disease and Gumboro disease on the 5th and 13th day, respectively. At the end of the trial, three birds from each treatment group were sacrificed and the gut was analyzed for dysbacteriosis score as per Kemin standardized method adapted from Teirlynck, et al. (2011). Statistical analysis of the cumulative data for cumulative body weight and FCR was performed using Statgraphics Centurion XVI.II software. Data was analyzed by one-way ANOVA. A P value of > 0.05 was considered statistically non-significant. Cost of production (COP) was calculated based on the expense incurred (feed cost + chick cost) to produce final weight and average feed cost was calculated based on respective treatment formulations while chick cost was taken same for all treatment groups.
III. RESULTS AND DISCUSSION
Bird performance at day 35 is shown in Table 3. The present study revealed that the inclusion of CEP in nutrient reduced diets maintained the birds’ FCR comparable to PC. Inclusion of CEP to NC significantly reduced (P < 0.05) FCR over NC, and similar to PC with no significant difference (P > 0.05) in feed consumption among the groups. Return on investment (RoI) for CEP was expressed as ratio extra income generated per ton of feed and additional cost of the product inclusion per ton of feed. Calculation of economic benefits revealed that the addition of CEP in NC delivered RoI of 15:1 to PC group (Table 4). Gut health analysis of three birds per treatment at the end of the trial revealed that inclusion of CEP to NC provided a definite advantage by reducing dysbacteriosis when compared to PC with lowest score for dysbacteriosis among all the groups (Table 5).
Table 3 - Effect of combo enzyme product on productive performance of broilers Variables Treatments
PC NC CEP Body weight (g) 1903a 1837a 1899a Feed conversion ratio (FCR) 1.51a 1.59b 1.52a Mortality (%) 4 2 1.5 European Efficiency Factor (EEF**) 345 324 352 Cost of production (USD/kg) 0.98 0.91 0.88 *No significant differences (P > 0.05) were detected among treatments for all traits except FCR. **EEF= (Livability ×Average weight)/ (Mean Age × FCR) ×100
Table 4 - Economic benefits and return on investment Parameters PC NC NC+CEP at 500g Avg. feed cost (USD) 0.51 0.44 0.45 Chick cost (USD) 0.38 0.38 0.38 Birds sold 192 196 197 Kgs sold 365.38 360.05 374.10 Feed consumed (kg) 552.38 571.54 568.15 Cost of production/kg live weight (USD)* 0.98 0.91 0.88 Price/kg live weight (USD) 1.29 1.29 1.29 Live kg/MT feed (kg) 661.45 629.97 658.46 Gross income per MT of feed (USD) 851.98 811.43 848.12
Aust. Poult. Science Symp. 2022...33
150

Net income per MT of feed (USD) 342.13 369.46 402.43 Extra income per MT of feed (USD) - - 60.30 Product inclusion cost per MT (USD) - - 4.07 Return on investment - - 15:1
Table 5 - Impact of CEP on gut health Parameters PC NC NC+ CEP Eimeria acervulina 0.00 1.00 0.33 Eimeria maxima 1.33 1.67 0.33 Eimeria tenella 0.67 0.33 0.67 TMLS* 2.00 3.00 1.33 Bacterial enteritis (Dysbacteriosis) 1.33 1.00 0.67 * TMLS: total mean lesion score
No statistically significant difference was observed in mortality of CEP (1.5%) when compared to PC (4%) and NC (2%). Higher EEF and lowest cost of production (CoP) were observed in CEP as compared to the other groups. As per earlier studies, dietary incorporation of enzyme systems in broiler diet improved feed conversion in nutrient reduced diets (Francesch, 2009; O’Neill et al., 2012; Coppedge et al., 2012). Various NSPase, proteases and lysophospholipids addition in NC group improved the growth performance of broilers that were similar to PC levels. This demonstrates the ability of enzymes to sustain the productive performance when dietary nutrient level was reduced. CEP displayed better control of dysbacteriosis scores which might be due to better balanced gut microflora, possibly imparted through a reduced substrate availability and microbial fermentation in the lower gut.
V. CONCLUSION
A combination of NSPases, multi and fast acting proteases with lysophospholipids has the potential to be an effective tool to combat rising feed costs for broiler producers. This can be achieved by incorporating CEP in diets with less digestible raw materials which helps in effective nutrient utilization. The use of CEP in the current study was able to maintain the FCR similar to PC in a nutrient reduced diet. CEP inclusion also tended to provide an economic advantage by optimizing the feed cost, lower CoP per kg broiler live weight with better gut lesion score reflecting better broiler gut health. Inclusion of CEP generated an RoI of 15:1 proving the economic viability of the product in broiler diets.
REFERENCES
Coppedge JR, Oden LA, Brown B, Ruch F & Lee JT (2012) Journal of Applied Poultry Research 21: 226-234.
Chandrasekar S, Partha D, Bashir Y, Karthigan M & Sankaran S (2017) Journal of Agricultural Science and Technology 7: 432-439.
Francesch M & Geraert PA (2009) Poultry Science 88: 1915-1924. Khattack F.M, Pasha TN & Mahmud A (2006) Journal of Animal and Plant Sciences 16: 1-7. Lavrentiev A, Sherrne VS & Danilova NV (2019) American Journal of Biomedical Science &
Research 4(4): 239-243. O’Neill HVM, Mathis G, Lumpkins BS & Bedford MR (2012) Poultry Science 91: 1356-1360. Ravindran V (2013) Journal of Applied Poultry Research 22: 628-636. Teirlynck Emma, Maarten De Gussem, Jeroen Dewulf, Freddy Haesebrouck, Richard
Ducatelle & Filip Immerseel (2011) Avian Pathology 40: 139-44. Zhang B, Haitao L, Zhao D, Guo Y, Barri A (2011) Animal Feed Science Technology 163:
177–184.
Aust. Poult. Science Symp. 2022...33
151

EFFECT OF PLANT-DERIVED ISOQUINOLINE ALKALOIDS ON GROWTH PERFORMANCE AND GUT INTEGRITY OF BROILER CHICKENS REARED UNDER
TROPICAL CLIMATE CONDITIONS
S. KHONGTHONG1, N. ROEKNGAM1, P. PIEWNGAM2, D. FAROONGSARNG1, W. KRAITAVIN3, P. PIYARAM3, A. PASTOR4, T. STEINER4 and Y. THEAPPARAT5
Summary
Broilers reared under tropical conditions are very likely to be subjected to heat stress. The aim of the study was to evaluate the effect of a standardized blend of plant-derived isoquinoline alkaloids (IQ) on performance, inflammatory status, and gut integrity of broiler chickens reared during the summer season in a tropical climate (Thailand). IQ had a significant impact on performance, improving body weight, average daily weight gain, feed intake, and mortality. IQ significantly reduced corticosterone levels and significantly increased serotonin levels (day 35), pointing at a lower stress response. IQ-supplemented birds tended to have lower FITC-d levels in the blood plasma, implying an improved gut integrity. This evidence was further supported by a significant higher expression of tight junction proteins in the jejunum (TJP-1, MUC-2, Occludin; day 35). Lower levels of iNOS, TNF-α, IL-4, IFN-γ, and NF-κB in the ileum of birds fed IQ indicated that IQ have an impact on inflammation. The present study demonstrated that the use of a standardized blend of plant-derived IQ had a positive impact on inflammation, gut integrity, and stress response of broilers reared under tropical climate conditions, therefore contributing to a better performance.
I. INTRODUCTION
Plant-derived isoquinoline alkaloids (IQ) have the potential to support gut integrity and growth performance under conditions of enhanced stress such as heat stress. The previous study revealed that the BW increased in the IQ group, and the level of FITC-d, to evaluate the gut barrier function, reduced in the IQ supplement group (Kitasato et al., 2021). However, a comprehensive study on the effect of IQ on growth performance and gut integrity under heat stress during the summer season in a tropical climate has not been reported so far. The objective of the present work was to study the impact of feeding IQ on growth performance, inflammatory status, and gut integrity under heat stress conditions in broilers reared during the summer season in a tropical climate.
II. MATERIALS AND METHODS
Ethics approval: MHESI 68014/1571. 720 day-old male Ross 308 broiler chicks were randomly distributed into three treatments: 1) negative control (fed on a basal diet), 2) IQ 60 (supplemented with 60 mg/kg feed, supplemented as Sangrovit® Extra (Phytobiotics Futterzusatzstoffe GmbH, Germany)), 3) IQ 100 (supplemented with 100 mg/kg feed). Each treatment was divided into eight
1 Department of Pharmaceutical Technology, Faculty of Pharmaceutical Science, Prince of Songkla University, Hat Yai, Songkhla, Thailand; [email protected], [email protected], [email protected] 2 Pathogen Molecular Genetic Section, National Institute of Allergy and Infectious Diseases, The National Institutes of Health, Bethesda, MD, USA; [email protected] 3 Phytobiotics (Thailand) Co., Ltd, Huaykwang, Bangkok, Thailand; [email protected], [email protected] 4 Phytobiotics Futterzusatzstoffe GmbH, 65343 Eltville, Germany; [email protected], [email protected] 5 Center of Excellence in Functional Food and Gastronomy, Faculty of Agro-Industry, Prince of Songkla University, Hat Yai, Songkhla, Thailand; [email protected]
Aust. Poult. Science Symp. 2022...33
152

replicates with 30 chickens per replicate. Birds were housed in an open production house in the Southern area of Thailand (April-May). House temperature ranged from 33.0-35.0oC and relative humidity RH ranged from 70-75%. Each replicate was assigned to a wire-floored cage (2.5 x 2.5 m) and equipped with a self-feeder and waterer. All birds were provided ad libitum access to feedand water. Nutrient contents in diets matched the requirements of broilers reared in tropicalclimates. Birds were fed mash diets throughout the duration of the trial (42 days), split up into astarter (day 1 – 21), grower (day 21 -35), and finisher period (day 35 – 42). Live body weight (BW),body weight gain (BWG), feed intake (FI), feed conversion ratio (FCR), and survival rate wererecorded.
On day 35, one chicken was selected from each replicate to determine gut integrity, stress response and inflammatory status. FITC-d was used as a marker to assess gut integrity followed by Vicuña et al. (2015). Real-time quantitative PCR was performed for intestinal tight junction (TJ) proteins, junctional adhesion molecule 2 (JAM-2), Occludin 1, Zonula occludens-1 (ZO-1), Mucin 2 (MUC-2), and Glyceraldehyde-3-phosphate dehydrogenase (GAPDH). Serum cortisol and serotonin levels were determined by HPLC method, according to Theapparat et al. (2017) and Chen et al. (2015). In addition, cytokine gene expression in the ileum was analyzed for IFN-γ, IL-4, TNF-α, iNOS, NF-κB, according to Livak and Schmittgen (2001).
III. RESULTS AND DISCUSSION
a) Performance parameters
The average FI, BW, BWG, FCR, and mortality of broilers fed IQ are presented in Table 1 for the overall trial period. BW, BWG, FI, and survival rate were statistically significant different for broilers fed diets supplemented with IQ at 60 and 100 mg/kg feed compared with the control treatment (P < 0.05). A trend for an improved FCR was observed for birds fed IQ (P < 0.1). The current results are in accordance with Kikusato et al. (2021). The authors fed IQ to birds, induced artificial heat stress, and observed a positive impact of IQ on performance parameters.
Table 1 - Effect of isoquinoline alkaloids (IQ) on growth performance parameters of broiler chickens from 1 to 42 days of age.
Parameters Control Mean (SD)
IQA 60 Mean (SD)
IQA 100 Mean (SD)
SEM p-Value
BW (g) BWG (g) FI (g) FCR (g/g) Mortality (%)
2619.0a (22.77) 2570.9a (0.07)
3929.1a (167.14) 1.53 (0.07) 3.74a (0.87)
2864.1b (49.91) 2815.8b (49.91)
4184.0b (113.19) 1.49 (0.04) 1.58b (0.54)
2829.6b (48.29) 2792.0b (53.99) 4103.5c (119.18)
1.47 (0.03) 1.49b (0.10)
21.10 22.22 67.67 0.02 0.27
<0.0001 <0.0001
0.004 0.082
<0.0001
b) Serum fluorescein isothiocyanate-dextran (FITC-d), corticosterone, and serotonin levels
Supplementation of 100 ppm IQ significantly decreased (P < 0.05) FITC-d levels in the blood (Figure 1a), pointing out a positive impact on gut integrity. IQ supplementation tended to influence corticosterone levels (Figure 1b), implying a lower stress response in IQ-fed birds. Glucocorticoid secretion is well known to be controlled by the hypothalamic-pituitary-adrenal axis (HPA), and cytokines are known to stimulate the hypothalamic-pituitary-adrenal axis function (Herman et al., 2016). The activation of the HPA axis leads to increased levels of corticosterone, which may result in feed intake depression, and consequently weight loss in poultry (Johnson, 2002). In accordance, serotonin-5HT levels were significantly increased in the IQ supplemented groups when compared to the control (Figure 1c).
Aust. Poult. Science Symp. 2022...33
153

Figure 1 - a) Fluorescein isothiocyanate-dextran (FITC-d), b) Corticosterone, and c) Serotonin levels in serum of heat-stressed broiler chickens at 35 days of age from three treatments; basal diet (control), isoquinoline alkaloids at 60 mg/kg (IQ 60), or 100 mg/kg diet (IQ 100). Different superscripts indicate significant differences; * (P < 0.05), ** (P < 0.01), ****(P < 0.0001).
c) The gene expression of intestinal inflammation and tight junction proteins
The supplementation of IQ at 60 and 100 mg/kg feed significantly decreased (P < 0.05) the expression of iNOS, TNF-α, IL-4, IFN-γ, and NF-κB, in the ileum of heat-stressed broiler chickens compared to the control (P < 0.0001). While for the expression of IL-4 and IFN-γ, a dose-dependent effect of IQ-supplementation could be observed, this effect could not be observed for iNOS, TNF-α, and NF-κB (Figure 2). Chaturvedi et al. (1997) and Soler et al. (2016) reported that IQs have an impact on NF-κB, IL-1β, or TNF-α levels. In addition, IQ decreased the expression of iNOS (Khadem et al., 2014; Kisusato et al., 2020). Birds fed 100 mg IQ/kg feed showed a significantly increased level of TJP-1, MUC-2, and Occludin in the jejunum compared to control birds, while the lower inclusion rate of 60 mg IQ/kg feed only had a significant impact on TJP-1 (Figure 3).
Figure 2 - The gene expression of iNOS, TNF-α, IL-4, IFN-γ, NF-κB, in the ileum of broilers under heat-stress conditions at 35 days of age; basal diet (control), isoquinoline alkaloids at 60 mg/kg (IQ 60), or 100 mg/kg diet (IQ 100). Different superscripts indicate significant differences; * (P < 0.05), ** (P < 0.01), ***(P < 0.001), ****(P < 0.0001).
Aust. Poult. Science Symp. 2022...33
154

Figure 3 - The gene expression of MUC-2, TJP-1, Claudin, Occludin, in the jejunum of broiler reared under heat stress conditions at 35 days of age; basal diet (control), isoquinoline alkaloids at 60 mg/kg (IQ 60) or 100 mg/kg diet (IQ 100). Different superscripts indicate significant differences; * (P < 0.05).
IV. CONCLUSIONS
In conclusion, the current study showed that broilers reared under heat-stress conditions in a tropical climate are subjected to inflammation which in turn has a negative impact on gut integrity and therefore performance. Isoquinoline alkaloids offer support to birds under heat-stress conditions by alleviating the negative consequences of heat-stress, therefore contributing to an economical and sustainable broiler production.
REFERENCES
Chaturvedi MM, Kumar A, Darnay BG, Chainy GBN, Agarwal S & Aggarwal BB (1997) Journal of Biological Chemistry 48: 30129-30134.
Chen J, Tellez G, James DR & Escobar F (2015) Frontier in Veterinary Science 2: 139-148. Herman KP, McKlveen JM, Ghosal S, Kopp B, Ryan A, Scheimann MJ & Myers B (2016)
Comparative Physiology 6(2): 603–621. Johnson R (2002) Veterinary Immunology and Immunopathology 87: 443-450. Khadem A, Soler L, Everaert N & Niewold TA (2014) British Journal of Nutrition 112: 1110-
1118. Kikusato M, Xue G, Pastor A, Niewold TA & Yoyomizu, M (2021) Poultry Science 100: 967-963. Livak KJ & Schmittgen TD (2001) Methods 25: 402-408. Soler L, Hermes R & Niewold TA (2016) American Journal of Plant Sciences 7: 1531-1537. Theapparat Y, Rodjan P, Boonyoung, P, Reakham N, Kongtong S & Lamai J (2017) 21st European
Symposium on Poultry Nutrition (ESPN 2017), Salou/ Vila-Seca, Tarragona, Spain, 263. Vicuña EA, Kuttappan VA, Tellez G, Hermandez-Velasco X, Seeber-Galarza R, Latorre JD,
Faulkner OB, Wolfenden AD, Hargis BM & Bielke LR (2015) Poultry Science 94: 1353-1359.
Aust. Poult. Science Symp. 2022...33
155

BACILLUS SUBTILIS DSM 29784 IMPROVES BROILER PERFORMANCE AND WELFARE – A META-ANALYSIS APPROACH
D.P. PREVERAUD1, F. ROUFFINEAU2, B. GUO3, N. VIECO2, A. MELLOUK2
and S. SAXENA3
With the global objective to ban or reduce the use of antibiotic growth promoters (AGP) in poultry production, new alternatives such as probiotics increasingly come into consideration in the way of feeding animals. Bacillus subtilis DSM 29784 (BS29784) has been shown to enhance the host response and to modulate the microbiota leading to reinforcement of the intestinal barrier and control of inflammation (Rhayat et al, 2019). The objective of the present study was to evaluate BS29784 as an alternative to AGP. To achieve this, broiler performance and welfare were assessed using a meta-analysis of experimental and field trials.
This meta-analysis involved three trial series performed from 2015 to 2020. The first series was based on eight performance trials comparing the effect of AGP and BS29784 against a non-supplemented control involving 6,896 broilers. The second series was a compilation of four field trials that measured performance of 1,557,280 broilers following the dietary inclusion of BS29784. The third and final series involved 347,360 broilers and focused on the effect of BS29784 on welfare parameters (pododermatitis (FPD) and litter quality scores). After standardization of performance outcomes, statistical analyses were performed using multiple nonlinear regression and factorial mixed model ANOVA using the procedure GLIMMIX of SAS.
BS29784 showed significant improvement of feed conversion ratio (FCR) by +1.76% relative to non-supplemented control but was not significantly different from the AGP group (p>0.05). Broilers treated with BS29784 had a significantly higher body weight gain (BWG) of +1.60% (p<0.001) without affecting the feed intake (average feed intake in birds supplied BS29784 was -0.16% of the controls; p>0.05). Performance results within the 3 main growing phases showed different feed efficacy (FCR) relative to control (1.20, 1.19, 1.19 in starter phase (P>0.05), 1.40, 1.38, 1.38 in grower phase (P>0.05), and 1.66, 1.63, 1.63 (P<0.01) in finisher phase for control, AGP and BS29784 groups, respectively) and highlight the role of the probiotic solution in contributing to the maturation of the microbiota (Liao et al, 2020) and therefore, in providing energy to animals to make growth. Focusing on field conditions only, FCR and European Broiler Index were also significantly enhanced by 2.38% and 3.14%, respectively, with the supplementation of BS29784 compared to unsupplemented control group. Finally, the probiotic supplementation resulted in a significant improvement of litter quality and a significant reduction of FPD scores compared to non-supplemented birds.
BS29784 showed better performance relative to control in experimental or field conditions despite no change in the feed consumption. Therefore, mechanisms at the gut level may occur to optimize the feed utilisation and improve animal welfare.
Liao X, Shao Y, Sun G, Yang Y, Zhang L, Guo Y, Luo X & Lu L (2020) Poult. Sci. 99: 5883–5895
Rhayat L, Maresca M, Nicoletti C, Perrier J, Sidelmann Brinch K, Christian S, Devillard E & Eckhardt E (2019) Front. Immunol. 10: 564–573
1Adisseo France SAS, Health by Nutrition, Antony, France; [email protected] 2Adisseo Center of Excellence and Research in Nutrition, Commentry, France 3Adisseo Asia Pacific Pte Ltd, Singapore
Aust. Poult. Science Symp. 2022...33
156

A MULTI-COMPONENT PROTEASE ALONE OR COMBINED WITH A PROTECTED
BLEND OF ORGANIC ACIDS AND ESSENTIAL OILS ON MEASURES OF GUT
HEALTH AND PERFORMANCE IN BROILERS FED LOW-DIGESTIBLE DIETS
G. B. TACTACAN1, P. PREESONG2 and Y. RUANGPANIT2
The increasing prices of major feed ingredients have prompted animal nutritionists to use
inexpensive raw materials in their diet formulations to lower feed cost. However, due to their
relatively lower digestibility, diets formulated with these raw materials often lead to poor gut
health status and animal performance. For instance, poor protein digestibility results in the
formation of toxic metabolites that can impair gut health and subsequently confer negative
effects on broiler performance (Qaisrani et al., 2015; Apajalahti and Vienola, 2016).
A study was conducted to investigate the effects of a multi-component protease alone
or in combination with a micro-encapsulated blend of organic acids and essential oils on the
growth performance and gut health of broilers fed low-digestible feed ingredients. A total of
1400-one-day-old Ross 308 male broiler chicks, in a completely randomized design study were
assigned to receive 1 of 4 dietary treatments: 1) Positive control (corn-soybean meal-based
diet, PC), 2) Negative control (corn-wheat-soybean meal-corn DDGS-based diet, NC), 3) NC
+ 125 g/t protease (NC+PRO), 4) NC + 125 g/t protease + 300 g/t micro-encapsulated organic
acids and essential oils (NC+PRO+EOS). All diets were formulated to be iso-caloric and iso-
nitrogenous following the recommendations of the breeder company. Each treatment consisted
of 14 replicates with 25 birds per replicate. All chicks were provided feed and water ad libitum
for 35 days. Growth performance, gene expression of jejunal tight junction proteins, and caecal
fermentation metabolites were determined at the end of the study. Data were subjected to
ANOVA using the PROC GLM procedure of SAS and differences between means were
determined using Duncan’s multiple range test. At 35 d, body weight gain was similar among
treatment groups, but birds fed diets with low-digestible feed ingredients (NC, NC+PRO, and
NC+PRO+EOS) had significantly higher feed intake (P < 0.05) than birds fed the PC diet.
Consequently, feed conversion ratio (FCR) was significantly increased in NC as compared with
PC (1.529 vs. 1.466). In terms of the gene expression of the tight junction proteins, occludin
and claudin-1 genes were upregulated (P < 0.05) in birds fed the NC+PRO and NC+P+EOS,
respectively, as compared to PC and NC. Caecal ammonia was significantly increased in all
diets with low-digestible feed ingredients (NC, NC+PRO, NC+PRO+EOS) relative to PC, but
caecal putrescine and cadaverine in NC only was significantly increased as compared to PC,
NC+PRO, and NC+PRO+EOS. Overall, feeding broiler chickens with diets containing low-
digestible feed ingredients negatively affected feed efficiency, intestinal integrity, and
concentrations of protein fermentation metabolites in the caecum. On the other hand, the
supplementation of a multi-component protease alone or in combination with a
microencapsulated blend of organic acids and essential oils alleviated some of these negative
effects and offered positive benefits on measures of gut health.
Apajalahti J & Vienola K (2016) Ani. Feed. Sci. Tech. 221:323-330.
Qaisrani SN, Van Krimpen MM, Kwakkel RP, Verstegen MWA & Hendriks WH (2015)
World’s Poult. Sci. J. 71:139-160.
1 Jefo Nutrition, Inc., Saint-Hyacinthe, Quebec, Canada; J2S 7B6. [email protected] 2 Kasetsart University, Kamphangsaen, Nakhon Pathom, Thailand; 73140
Aust. Poult. Science Symp. 2022...33
157

EFFECTS OF MULTI-STRAIN BACILLUS PROBIOTIC IN COMBINATION WITH CONSENSUS BACTERIAL 6-PHYTASE AND A CARBOHYDRASE WITH FULL MATRIX IMPLEMENTATION ON PERFORMANCE OF BROILER CHICKENS
EXPOSED TO ENTERIC CHALLENGE
A. E. GHANE1, S. HALDAR 2, A. K. DHARA2, F. SIDIQ 3 and C. EVANS4
Summary
The present experiment was conducted to validate the full matrix of a consensus bacterial 6-phytase and a combination of xylanase, amylase, and protease. The efficacy of this enzyme combination along with a three-strain Bacillus probiotic in combatting dysbacteriosis-mediated necrotic enteritis was also assessed. The enzyme probiotic combination successfully met the nutrient requirements of the birds fed with a diet diluted in terms of nutrients according to the combined matrix values of the enzyme combination. Moreover, in absence of any enteric infection the enzyme-probiotic combination was found to be an effective tool in sustaining growth of the experimental chickens. In the presence of E. coli, Eimeria and clostridia induced dysbacteriosis, the same combination of enzymes and probiotic effectively reversed the resultant growth depression. Apart from validating the matrices of phytase (PHY) and combination non-phytase enzymes: xylanase, amylase and protease (XAP), the study also established the beneficial effects of enzyme/probiotic combination on gut health.
I. INTRODUCTION
Phytase, apart from increasing phosphorus (P) availability from plant ingredients, improves availability of non-P nutrients like Ca, amino acids (AA), and energy (AME) by facilitating the breakdown of phytate P and thus negating its antinutritional effects (Dersjant-Li et al. 2016). Phytase along with carbohydrase enzymes could improve productivity of chickens with a lower feed cost when proper downspec (reduction of nutrient levels in the diet) is applied. It is reported that a novel consensus bacterial 6-phytase may completely replace the inorganic P (equivalent to 0.28% available P) from Mono Calcium Phosphate (MCP) in a broiler diet whilst maintaining performance and bone mineralization (Marchal et al., 2021). Bacillus based probiotics influence gastrointestinal tract (GIT) microbiota and reduce the numbers of Avian Pathogenic E. coli in the GIT of broiler chickens (Pedroso et al., 2016). These probiotics work by outcompeting the non-beneficial bacteria while encouraging the growth of the beneficial ones and aiding development of the immune system (Ouwehand et al., 2010, Bento et al., 2013, Wealleans et al., 2017) with a more conspicuous effect being observed in the presence of enteric challenges (Dersjant-Li et al. 2016).
II. METHODS
Five hundred male Vencobb 430 chicks (Venkateshwara Hatcheries P Ltd., Pune, India) procured from a local hatchery were assigned to one of five treatment groups following a completely randomized design. The chicks were placed on litter composed of wood shavings and paddy straw in pens (1.2 m x 1.2 m). Each pen had 10 chicks at the beginning and there were 10 such pens allocated randomly to each of the treatment groups (n = 100 per treatment).
1 Danisco Animal Nutrition, Singapore, [email protected] 2 Agrivet Research and Advisory P Ltd, Kolkata, India, [email protected]; [email protected] 3 Danisco Animal Nutrition, Indonesia, [email protected] 4 DuPont Animal Nutrition, Marlborough, UK., [email protected]
Aust. Poult. Science Symp. 2022...33
158
The birds received feed within 12 h of hatch and were subsequently fed with starter (1-14 d) and grower (15-28 d) feed as crumbles and finisher (29-42 d) feed as pellets. The lighting program included 24 h light during the first week followed by 20 h light from the second week until harvest. Room temperature was maintained around 30°C with the help of electrical brooders during the first 2 weeks of the experiment.
The experiment involved feeding the birds with a control diet which was formulated to meet the requirements of the breed and was devoid of any gut acting growth promoter, antibiotics and anti-coccidial agents, a negative control (NC) diet which had a nutrient downspec of 0.199% Ca, 0.194% available P, 110 kcal energy and 0.704% crude protein (CP) according to the full matrix recommendations for the consensus bacterial 6-phytase (1000 FTU/kg - Axtra PHY® GOLD) and xylanase, amylase and protease (2000 U/kg xylanase, 200U/kg α-amylase and 4000 U/kg protease - Axtra XAP®)) combination (E) that would be supplemented to the NC diets. Apart from the aforementioned enzyme combination, the NC diet was further supplemented with a multi-strain Bacillus probiotic (PB - Enviva PRO®) supplying 150,000 CFU/g (Colony Forming Units) of the product (NC+E+PB). The group fed with the NC diet was challenged enterically as described below (C-NC) and the effect of the enzyme-probiotic combination was ascertained by supplementing the C-NC group with the said combination (C-NC+E+PB).
The challenge model consisted of a primary inoculation with avian pathogenic E. coli (APEC) at 11-12 d of age, followed by a mixed Eimeria infection (consisting of 8000 sporulated oocysts of E. acervulina, E. maxima and E. tenella per chicken administered through an oral gavage) and finally Clostridium perfringens (ATCC 13124) infection given during 18 -20 d. The APEC was isolated from field infections, cultured and confirmed by the presence ofpapC, iucD and femC genes (Paixao et al., 2016; Zakariazadeh et al., 2019; Mohamed et al.,2018; Subedi et al., 2018;) by targeting the specific 16s rRNA through polymerase chainreaction (Sobur et al., 2019). The Eimeria oocysts were collected from field infections andwere maintained by periodic passage through coccidia-free chicks and sporulated in 2%potassium dichromate solution.
Body weight (BW) was measured at 0 and 42 d. Average daily gain (ADG) in BW and feed conversion ratio (FCR) which was calculated as a ratio of total feed intake (FI) to gain in BW were determined along with liveability and European productivity index (EPI) for the period of 1-42 d. Whole blood samples were collected at 25 d and the serum was analysed for anti-clostridium alpha toxin antibody (CP-α-T-Ab). One bird, selected randomly from each of the replicates under each treatment, was killed humanely and mucosal scrapings collected from across the length of the small intestine were analysed for alpha-1-acid glycoprotein (α-1-AGP) and secretory immunoglobulin A (SIgA) by enzyme linked immune sorbent assays employing commercially available kits specific for chickens. Pens were the experimental units for the performance traits while individual observations were considered as experimental units for analysis of biomarkers. Statistical differences between treatments were determined using ANOVA and Tukey means separation (JMP, SAS software).
III. RESULTS
Data in Table 1 indicates that the nutrient downspec caused reduced BW and inferior FCR (P = 0.0001) in the NC group. Induction of dysbacteriosis further reduced BW and deteriorated FCR (P < 0.05) in the C-NC group. Cumulative FI increased with nutrient down spec in NC diet (P = 0.0001) while dysbacteriosis decreased FI (P < 0.05). Enzyme-probiotic combination restored BW to the level obtained with the Control group and resulted numerically better FCR across all the treatments. The C-NC+PB group performed better than the C-NC group in terms of BW and FCR. Liveability was lower (P = 0.0001) in the C-NC group suggesting conspicuous
Aust. Poult. Science Symp. 2022...33
159

effect of dysbacteriosis in this group. Considering EPI as the index to overall flock performance, it was concluded that in the absence of any enteric challenge, it is possible to sustain performance with a down spec diets supplemented with consensus bacterial 6-phytase and xylanase/amylase/protease combination. Supplementation of Bacillus probiotic with these enzymes might yield better BW and FCR. In the presence of dysbacteriosis, a visible reversal in performance drop is possible when Phytase (Consensus bacterial 6-Phytase) and combination of Xylanase, Amylase and Protease enzymes (XAP) were supplemented along with the probiotics (PRO).
Table 1 - Performance traits during 1-42 d and concentration of immune biomarkers in serum and mucosal scrapping (25 d) of the experimental broiler chickens 1
Parameters Control Unchallenged Challenged Pooled P-value
NC2 NC+E+ PB3
C-NC4 C-NC +E+PB
SEM
BW g 0-d 48.2 48.1 48.3 48.2 48.1 0.02 0.757 42-d 2771.1c 2592.4b 2785.2c 2453.4a 2681.7bc 9.93 0.0001 ADG g (1-42 d) 64.83c 60.58b 65.17c 57.27a 62.71bc 0.236 0.0001 Feed intake g (1-42 d) 4331.6c 4150.2b 4282.5bc 3815.8a 4212.7bc 11.71 0.0001 FCR (1-42 d) 1.591abc 1.632cde 1.566a 1.587ab 1.600abcd 0.004 0.0001 Liveability % 92.0b 94.0b 96.0b 82.0a 91.0b 0.68 0.0001 EPI 381.0bc 354.7bc 405.9c 302.3a 363.1bc 2.56 0.0001 CP-α-T-Ab: serum - - - 12.09b 2.89a 0.17 0.0001 α-1-AGP µg/mL: mucosa 2.409ab 3.922b 3.288ab 7.939c 2.449ab 0.133 0.0001 SIgA µg/mL: mucosa 11.39a 11.80a 13.57b 12.98ab 11.45a 0.25 0.001 1 Means of 10 replicates (n = 10 birds per replicate). 2 formulated with reduced Ca, available P and crude protein; 3 supplemented with a multi-strain Bacillus probiotic (Enviva PRO® ) 4 exposed to a primary challenge with 108 colony forming units of avian pathogenic E. coli field isolate during 11 and 12 d of age followed by a mixed Eimeria inoculation (consisting of 8000 oocysts of E. maxima and E. tenella per chicken) at 15 d and finally Clostridium perfringens 1010 colony forming units/bird during 18-20 d. Means with dissimilar superscripts in a row varied significantly. BW = body weight; ADG = average daily gain; FCR = feed conversion ratio; EPI = European Productivity Index.
Induction of dysbacteriosis increased the activity of α-1-AGP in the mucosal scrapings (P = 0.0001) of the C-NC group. A marginal rise in α-1-AGP activity in the mucosal scrapings of NC group suggests some proinflammatory changes taking place due to feeding of the un-supplemented diet which was richer in phytate P. Activity of SIgA was higher (P = 0.001) in the NC + PB group which might be to an immune stimulatory effect of probiotic a comparatively higher SIgA activity in the C-NC group might be attributed to the hist defence mechanism.
IV. DISCUSSION
The result of the present study suggests that the enzyme-probiotic combination was useful in sustaining performance of the birds not only with nutrient down spec but also in the presence of dysbacteriosis challenge. The data further suggests that the effects of either of these challenges became more conspicuous as the birds grew older and the enzyme/probiotic combination required some time to influence the performance traits since they work more by modulating the GIT microbiota and nutrient turnover patterns rather than by yielding a direct antibacterial effect. Up to 14-d (data not shown) nutrient down spec according to the enzyme matrix may not make the diet too marginal for growth of the young chicks and supplementation of the probiotic with the enzymes not only covered the nutrient down-spec but improved BW
Aust. Poult. Science Symp. 2022...33
160

beyond that of the Control group. Thus, these findings validated the matrix contributions from Phytase and XAP in combination with the probiotic. Decline in BW in the C-NC group was expected and improvement in performance with probiotic in the C-NC+PB group suggested a beneficial effect of the PB in reversing the negative effect of dysbacteriosis. Concentration of α-1-AGP in the mucosal scrapings indicated that the enzyme-probiotic combination probably sequestered the dysbacteriosis induced pro-inflammatory changes in the GIT. Circulatory CP-α-T-Ab concentration, which was below the detectable limit, was rather predictable since without any clostridial challenge it was unlikely that the antibody would be found in the circulation. It is interesting to note the sharp decline in the level of the same antibody in the challenged C-NC+PB group which is suggestive of the beneficial effect of enzyme-probiotic combination and validates the concept which advocates the possibility of maintaining the GIT health with such “green” approaches without AGPs in food animals.
V. CONCLUSIONS
It was concluded that with phytase combined with a xylanase, amylase, protease combination, it may be possible to sustain performance of broiler chickens with diets diluted in terms of nutrients and this strategy should provide scope to reduce feed cost by sparing costly ingredients like oil and protein meals in formulations. The concept of maintaining GIT health with an enzyme-probiotic combination is supported by the results of this study which shows that even in the absence of a conventional AGP, broiler chickens retained their performance with dietary supplementation of the enzyme-probiotic combination while being exposed to a mixed enteric challenge including dysbacteriosis and Clostridium perfringens induced necrotic enteritis.
REFERENCES Bento MHL, Ouwehand AC, Tihonen K, Lahtinen S, Nurminen P, Saarinen MT, Schulze H,
Mygind T & Fischer J (2013) Veterinarni Medicina 58: 449-458. Dersjant-Li Y, Gibbs K, Awati A & Klasing KC (2016) Journal of Applied Animal Nutrition
4: 1-14. Johnson J & Reid WM (1970) Experimental Parasitology 28: 30-36. Marchal L, Bello A, Sobotik EB, Archer G, Dersjant-Li Y. (2021) Poultry Science 100:
100962 Mohamed L, Ge Z, Yuehua L, Yubin G, Rachid K, Mustapha O, Junwei W, Karine O (2018)
Tropical Animal Health and Production 50: 547–553. Ouwehand AC, Tiihonen K, Kettunen H, Peuranen S, Schulze H & Rautonen N (2010)
Veterinarni Medicina 55: 71-78. Paixao AC, Ferreira AC, Fontes M, Themudo P, Albuquerque T, Soares MC, Fevereiro M,
Martins L & de Sa MIC (2016) Poultry Science 95: 1646–1652. Pedroso AA, Batal AB & Lee MD (2016) American Journal of Veterinary Research 77: 514–
526. Sobur A, Haque ZF, Sabuj AA, Ievy S, Rahman AT, Zowalaty ME, & Rahman T (2019)
Future Microbiology 14: 847–858. Subedi M, Luitel H, Devkota B, Bhattarai RK, Phuyal S, Panthi P, Shrestha A & Chaudhary
DK (2018) BMC Veterinary Research 14: 113. Wealleans AL, Sirukhi M & Egorov IA (2017) British Poultry Science 58: 523-529. Zakariazadeh N, Shayegh J & Ghorbani A (2019) Comparative Clinical Pathology 28: 525–
530.
Aust. Poult. Science Symp. 2022...33
161

EGG QUALITY IS IMPROVED BY FEEDING HENS FERMENTABLE FIBRE, XYLO-OLIGOSACCHARIDES AND XYLANASE
N. K. MORGAN1, T. SIBANDA1, M. R. BEDFORD2 and G. GONZÁLEZ-ORTIZ2
The aim of this study was to evaluate the impact of feeding xylo-oligosaccharides (XOS), xylanase (XYL) and fermentable fibre, in the form of wheat bran (WB), on egg quality. It is theorised that WB stimulates and trains the microbiota in the hindgut to hydrolyse and ferment dietary xylan, and XOS and XYL may further upregulate xylan fermentation pathways, resulting in improved nutrient utilisation and thus egg quality. Isa Brown hens (n = 96 hens) were obtained at peak lay (39 weeks of age) and fed one of 12 dietary treatments, Egg quality and feed conversion ratio (FCR) were determined after 14 days. A commercial laying hen ration was fed (wheat, corn, sorghum, canola meal and soybean-meal based). For half of the treatments, 10% of the diet was replaced with wheat bran. Analysed protein, energy and ash level was similar across all treatments. The diets were then supplemented with either (1) no supplements; (2) XOS 50 g/t; (3) XOS 2 kg/t; (4) XYL; (5) XYL + XOS 50 g/t, or (6) XYL + XOS 2 kg/t.
Table 1 - Effect of wheat bran (WB), xylanase (XYL) and xylo-oligosaccharides (XOS) on egg weight and feed conversion ratio (FCR) in eggs from hens fed the dietary treatments for 14 days
In the absence of XYL, XOS increased egg weight when in the presence of WB, but had no impact when WB was not fed. It is suggested this performance benefit was brought about by stimulating the growth of xylan-degrading bacteria in the gastrointestinal tract by provision of fermentable XOS. These probiotic bacteria utilize the XOS, but also accelerate insoluble xylan fermentation, inducing positive effects on nutrient absorption. In the presence of XYL, supplementing XOS increased egg weight in the absence of WB. XYL supplementation in diets with low fermentable fibre content may induce production of soluble xylan, which possibly provides sufficient fuel for probiotic bacteria, causing them to respond positively to XOS. Feeding 2000 g/t XOS caused decreased egg weight when both XYL and WB was present, suggesting providing excessive XOS has detrimental effects of the gastrointestinal environment and microbiota balance. Feeding XYL and 2000 g/t XOS in the absence of WB resulted in a lower FCR value compared to feeding WB with no XOS or XYL. This highlights both the benefits of supplementing XYL and XOS to laying hen diets poor in fermentable fibre, and the need to supply XYL and XOS when feeding diets rich in fermentable fibre.
ACKNOWLEDGEMENTS: The authors are grateful for financial support from Australian Eggs and Australian Government Department of Agriculture, Water and Environment
1 University of New England, NSW Australia [email protected] 2 AbVista, United Kingdom [email protected]
WB (%) XOS (g/t) XYL (BXU/kg) Egg Weight (g) d0-14 FCR 10 0 0 60.10b 2.44a 10 50 0 61.99a 1.73ab 10 2000 0 65.01a 2.20ab 10 0 16,000 61.30a 2.22ab 10 50 16,000 61.63a 2.06ab 10 2000 16,000 59.85b 2.33ab 0 0 0 61.58a 2.04ab 0 50 0 62.19a 2.04ab 0 2000 0 60.96a 1.97ab 0 0 16,000 58.30b 1.87ab 0 50 16,000 61.88a 2.03ab 0 2000 16,000 63.36a 1.69b SEM 0.45 0.05 P-valueWB x XOS 0.903 0.020 WB x XYL x XOS 0.025 0.531 1 FCR calculated as feed intake per egg mass on individual bird basis
Aust. Poult. Science Symp. 2022...33
162
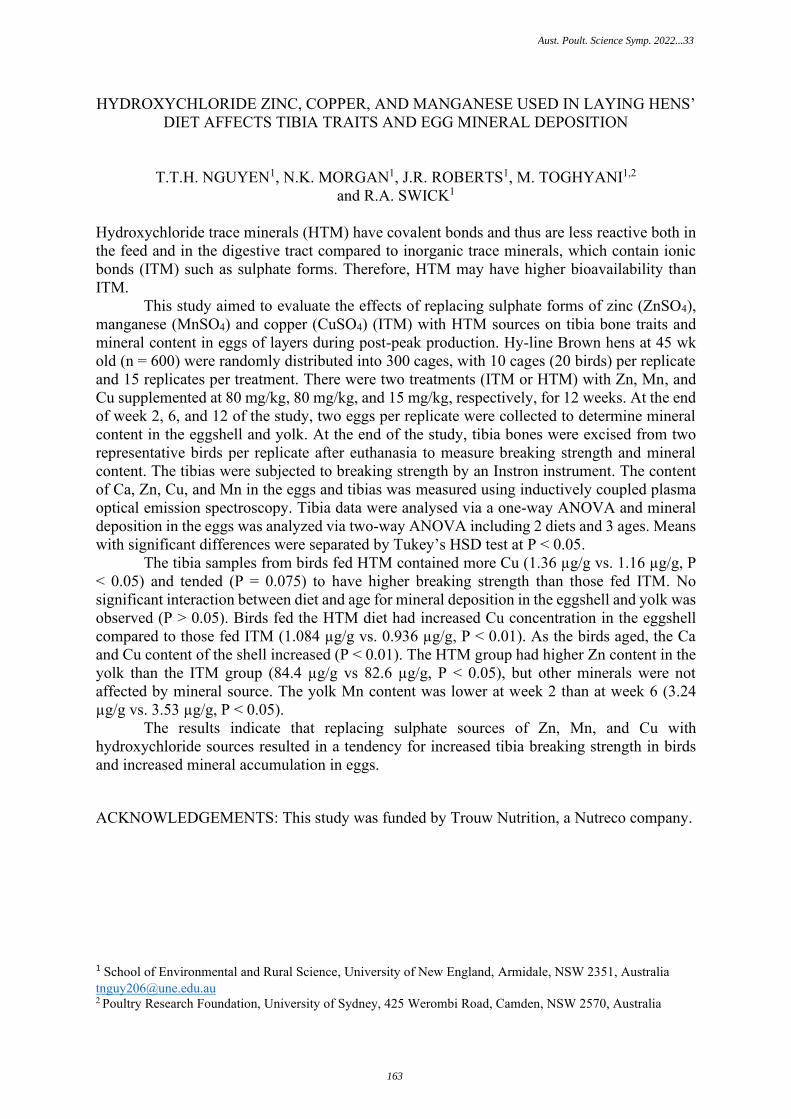
HYDROXYCHLORIDE ZINC, COPPER, AND MANGANESE USED IN LAYING HENS’ DIET AFFECTS TIBIA TRAITS AND EGG MINERAL DEPOSITION
T.T.H. NGUYEN1, N.K. MORGAN1, J.R. ROBERTS1, M. TOGHYANI1,2 and R.A. SWICK1
Hydroxychloride trace minerals (HTM) have covalent bonds and thus are less reactive both in the feed and in the digestive tract compared to inorganic trace minerals, which contain ionic bonds (ITM) such as sulphate forms. Therefore, HTM may have higher bioavailability than ITM.
This study aimed to evaluate the effects of replacing sulphate forms of zinc (ZnSO4), manganese (MnSO4) and copper (CuSO4) (ITM) with HTM sources on tibia bone traits and mineral content in eggs of layers during post-peak production. Hy-line Brown hens at 45 wk old (n = 600) were randomly distributed into 300 cages, with 10 cages (20 birds) per replicate and 15 replicates per treatment. There were two treatments (ITM or HTM) with Zn, Mn, and Cu supplemented at 80 mg/kg, 80 mg/kg, and 15 mg/kg, respectively, for 12 weeks. At the end of week 2, 6, and 12 of the study, two eggs per replicate were collected to determine mineral content in the eggshell and yolk. At the end of the study, tibia bones were excised from two representative birds per replicate after euthanasia to measure breaking strength and mineral content. The tibias were subjected to breaking strength by an Instron instrument. The content of Ca, Zn, Cu, and Mn in the eggs and tibias was measured using inductively coupled plasma optical emission spectroscopy. Tibia data were analysed via a one-way ANOVA and mineral deposition in the eggs was analyzed via two-way ANOVA including 2 diets and 3 ages. Means with significant differences were separated by Tukey’s HSD test at P < 0.05.
The tibia samples from birds fed HTM contained more Cu (1.36 µg/g vs. 1.16 µg/g, P < 0.05) and tended (P = 0.075) to have higher breaking strength than those fed ITM. No significant interaction between diet and age for mineral deposition in the eggshell and yolk was observed (P > 0.05). Birds fed the HTM diet had increased Cu concentration in the eggshell compared to those fed ITM (1.084 µg/g vs. 0.936 µg/g, P < 0.01). As the birds aged, the Ca and Cu content of the shell increased (P < 0.01). The HTM group had higher Zn content in the yolk than the ITM group (84.4 µg/g vs 82.6 µg/g, P < 0.05), but other minerals were not affected by mineral source. The yolk Mn content was lower at week 2 than at week 6 (3.24 µg/g vs. 3.53 µg/g, P < 0.05).
The results indicate that replacing sulphate sources of Zn, Mn, and Cu with hydroxychloride sources resulted in a tendency for increased tibia breaking strength in birds and increased mineral accumulation in eggs.
ACKNOWLEDGEMENTS: This study was funded by Trouw Nutrition, a Nutreco company.
1 School of Environmental and Rural Science, University of New England, Armidale, NSW 2351, [email protected] 2 Poultry Research Foundation, University of Sydney, 425 Werombi Road, Camden, NSW 2570, Australia
Aust. Poult. Science Symp. 2022...33
163

BARRIERS TO THE IMPLEMENTATION OF MAXIMUM PROFIT AND STOCHASTIC MODELS IN THE AUSTRALIAN POULTRY INDUSTRY
A.F. MOSS1, T.A. CHUNG1, N. POWELL2, G. PARKINSON3, G.M. PESTI1 and T.M. CROWLEY1,4
Max-profit and stochastic approaches use production, market and nutrient variability data to formulate diets by more economically sustainable means; giving increased flexibility, opportunity and capacity for the Australian poultry industry to cope and thrive under market challenges (Moss et al. 2020; Sterling et al., 2005). However, in order for producers to accurately formulate diets using max-profit and stochastic techniques, it is likely that some data is presently lacking and there may be some barriers to adoption.
Therefore, this project was conducted to i) determine the industry’s present views of max-profit and stochastic feed formulation and the barriers to implementing these techniques, ii) review the data and modelling tools currently available, and iii) provide recommendations for adoption of max-profit and stochastic feed formulation of Australian layer diets.
A survey of the Australian poultry industry was completed to identify barriers to implementing these alternative feed formulation techniques and potential solutions to these barriers. This survey was approved by the Human Research Ethics Committee within the University of New England (HE21-122) and the online survey was developed and distributed via Survey Monkey Inc (©2021). The survey was distributed via a link given in various Australian poultry newspapers, newsletters and industry webinars to reach many different sectors within the Australian poultry industry. Responses were anonymous and collected between June and August 2021. A total of 32 responses were collected, made up of 17 nutritionists, 4 feed manufacturers, 5 producers and 6 technical personnel.
The survey revealed interest and need to implement stochastic and max profit feed formulation techniques. Stochastic techniques may be particularly useful to manage risk where NIR is not used to analyse ingredients prior to feed formulation. When asked if NIR is used, 40% of respondents in the layer industry said yes, in comparison to 86% of respondents in the broiler industry. Currently, 17% of nutritionists use stochastic feed formulation and 38% used max-profit feed formulation. Barriers to the use of stochastic and max-profit feed formulation included a requirement of better software to assist nutritionists in using these feed formulation techniques, improved data collection, further training, and restriction on nutritionists via key performance indicators to only minimise diet cost.
A table of feed formulation tools with additional stochastic, max profit, or other alternative feed formulation strategies was compiled. While there are quite a few listed programs, many are Excel based and may not still be compatible with modern versions of Excel. Additionally, none of the listed software combines stochastic and max profit feed formulation within the one program.
While there are barriers to the implementation of max profit and stochastic approaches, this project also identifies many opportunities to be gained in these areas to reduce the variability of the nutrient content of diets, improve tools to inform decision making and enhance the profitability and sustainability of Australian poultry industry.
ACKNOWLEDGEMENTS: The authors would like to acknowledge and thank Australian Eggs for funding this project and for their guidance, encouragement and support. Moss AF, Parkinson G, Crowley TM & Pesti GM (2020) J. Appl. Poult. Res. 30: 100137. Sterling KG, Vedenov DV, Pesti GM & Bakalli RI (2005) Poult. Sci. 84(1): 29-36.
1 School of Environmental and Rural Science, University of New England, Armidale, NSW, AU [email protected] 2 Australian Eggs, North Sydney, NSW, AU 3 Livorno Consulting, Brunswick, VIC, AU 4 School of Medicine, Deakin University, Geelong, VIC, AU
Aust. Poult. Science Symp. 2022...33
164

CHICKEN SEXING THROUGH BEAK MORPHOMETRY
A. IQBAL1 and A. F. MOSS2
Feather sexing, a relatively convenient method to separate male and female day-old broiler chicks, is no longer available especially in Australia due to a shift from slow feathering to fast feathering parent stocks (England et al., 2021). Therefore, other convenient ways for chick sexing are needed for research trials. Vent sexing is a possibility, but the time required to successfully vent sex and biosecurity restrictions of hatcheries can make this difficult. Sex may also be determined with DNA analysis of feathers, but this can be time consuming and expensive. Previous studies show that the beaks of some avian species such as finches (Herrel et al., 2010) and Turkeys (Dalton et al., 2017) show sexual dimorphism. So, we hypothesized that beaks of day-old chicks may show sexual dimorphism as well.
To test our hypothesis in a pilot study, beaks of 64 chicks were photographed from the top and the right side for a comparison using landmark (LM) based geometric morphometry technique similar to Dalton et al. (2017). Based on vent sexing of the 64 chicks, 14 were found to be males and 50 were found to be females. After discarding photos that did not meet the standards for analysis, 6 male side-view photos 8 female side view photos were chosen. Similarly, 19 female top view photos and 5 male top view photos were selected.
The selected photos were used to identify several homologous morphological features as landmarks. These landmarks were digitised using TPSdig software and coordinate data of these landmarks were further processed and subjected to canonical variate analysis (CVA) in MorphoJ software to determine the statistical significance of differences between beak landmark configurations of male and female chicks.
The analysis calculated two types of distances between the landmark configurations, a Procrustes distance (PD) and a Mahalanobis distance (MD) as a measure of the difference between the landmark configurations generated from beak photos of male and female chickens along with their associated p-values to determine statistical significance. As the assumption of isotropic variation of landmarks that underlie the Procrustes method do not hold for most biological samples (Klingenberg, 2016), we used MD for this study.
Therefore, based on Mahalanobis distance, these results show significant (P=0.0005, MD=3.0746) difference in the top view landmark configurations between male and female day-old chicks beaks and a tendency (P= 0.0583, MD=2.1014) towards significant difference using the side view configuration. This was a pilot experiment and thus required larger sample sizes and optimisation of methods to capture photos of chicks. However, these results are promising and warrant further exploration into the potential use of beak images for sexing day old broiler chickens.
Dalton HA, Wood BJ, Widowski TM, Guerin MT & Torrey S (2017). PloS One. 12: e0185159 England AD, Kheravii SK, Musigwa S, Kumar A, Daneshmand N, Sharma NK, Gharib-Naseri
K & Wu SB (2021). Poult. Sci.100: 100924. Herrel A, Soons J, Aerts P, Dirckx J, Boone M, Jacobs P, Adriaens D, Podos J (2010). Emu -
Austral Ornithology. 110: 39-47.
1 University of New England, Armidale, NSW, Australia, Chungbuk National University, Cheongju, South Korea; [email protected] 2 University of New England, Armidale, NSW, Australia; [email protected]
Aust. Poult. Science Symp. 2022...33
165

EVALUATION OF SUBSTANCES AFFECTING TURKEY SPERMATOZOA MOTILITY IN VITRO
P. MASSANYI1, T. SLANINA1 and M. MISKEJE1
Artificial insemination is currently a necessary and exclusive means of breeding turkeys in large farms (Di Iorio et al., 2020; Slowinska et al., 2018). For optimal fertility outcomes, breeders must focus not only on the insemination itself, but also on the quality of collected semen. The culture medium is one of the main factors influencing semen quality and turkey spermatozoa in in vitro conditions. The aim of the study was to evaluate the impact of selected additive substances with potential stimulatory effects on spermatozoa motility of turkeys (Meleagris gallopavo), during in vitro incubation. Specifically, we analyzed the effect of different concentrations of trehalose, fructose, caffeine and taurine diluted in the physiological solution as the culture medium. The primary aim of the study was to develop a new semen extender usable in practice based on obtained results. The individual motility parameters were analyzed by CASA system (Computer Assisted Semen Analyzer) at 5°C and 41°C in different time periods.
The highest monitored concentrations of trehalose (10 mg/ml) and fructose (20 mg/ml) showed a relatively balanced value of motility parameters. At the lower concentration of trehalose (5, 2.5, 1.25 mg/ml) and fructose (5, 10, 15 mg/ml), a negative effect on the individual motility parameters of turkey spermatozoa was observed. Significantly (p < 0.01, p < 0.001) higher motility and progressive motility of spermatozoa, respectively, were detected in the samples containing caffeine ranging from 0.16 mg/ml to 7.5 mg/ml in comparison to the control sample at 5°C. At cultivation temperature of 41°C the positive effect of caffeine was demonstrated only at the beginning of incubation (time 0 and 1h.). The concentration of taurine above 10 mg/ml had a negative effect on spermatozoa motility. A significant stimulatory effect of taurine on motility parameters was observed in the samples containing 7.5, 5 and 2.5 mg/ml of taurine. Following the continuous results three new semen extenders were prepared. At the cool media incubation (5°C) all three extenders showed significantly higher values of all CASA motility parameters from 1 to 6 hours during in vitro incubation. After 24 hours of incubation, significantly higher values of motility parameters were measured in extender three compared to the control. In conclusion, we can state that we have successfully developed new turkey semen extenders (registration in process), which not only maintain spermatozoa motility during short-term storage in in vitro conditions, but also have a stimulatory effect on turkey spermatozoa motility.
ACKNOWLEDGEMENTS: This publication was supported by the Operational program Integrated Infrastructure within the project: Creation of nuclear herds of dairy cattle with a requirement for high health status through the use of genomic selection, innovative biotechnological methods, and optimal management of breeding, NUKLEUS 313011V387, co-financed by the European Regional Development Fund. This work was supported also by project of the Scientific Grant Agency of the Ministry of Education, Science, Research and Sport of the Slovak Republic (projects VEGA 1/0539/18). Di Iorio M, Rusco G, Iampietro R, Colonna MA, Zaniboni L, Cerolini S & Iaffaldano N (2020)
Animals (Basel) 10: 421. Slowinska M, Liszewska E, Judycka S, Konopka M & Ciereszko A (2018) Poultry Sci. 97: 3709-
17.
1 Slovak University of Agriculture in Nitra, Faculty of Biotechnology and Food Sciences, Institute of Applied Biology, Tr. A. Hlinku 2, 949 76 Nitra, Slovak Republic AgroBioTech Research Centre, Slovakia [email protected]
Aust. Poult. Science Symp. 2022...33
166

Name Page(s) Email AddressAbdollahi, M.R 12,16,39 [email protected], R 124, 129Agra, R 113Akter, Y. 100 [email protected], J.W 45Attawoot, P 66Bajagai, Y.S 54Bao, Y.M 17 [email protected], R 6,21,43 [email protected], M 12, [email protected], S 113,114Bashir, Y 148 [email protected], M.R 39,45,53,162 [email protected], M.S 66,114 [email protected], M.M 84Boyle, N 108Briens, M 138Bruerton, K. 100Bryden, W.L 138,141 [email protected], D.J 6,10 [email protected], G 138Campbell, D.L.M 128 [email protected], C 53 [email protected],S.Y 45Channarayapatna, G 7 [email protected], R 148Cho, H.A 45Cho, J.H 45 [email protected], M 44 [email protected], P 129Chrystal, P.V 6,10,12,16,17,21,22,26,30 [email protected]. nzChung, T.A 113,114,164Clark, C 147Collins, A 147Costa, H.C 109Cozannet, P 90 [email protected], T.M 6,85,164 [email protected], D 104Dao, T.H 85,108 [email protected], P 148 [email protected], L.S 39 [email protected], A 141Dhara, A.K 49,156De Marco, M 138 [email protected]
AUTHOR INDEX

de Paula Dorigam, J.C 7De Souza Vilela, J 113,114 [email protected], Y 85Eckard, R 1 [email protected], C 49,156Faroongsarng, D 152Fisher, A 124,129Francesch, M 90Gao, Y 147Gast, R.K 93 [email protected], A.E 49,85,158 [email protected], C.K 12Go, Y.B 45Godwin, I 11 [email protected], G.A 45,109Gonzalez-Ortiz, G 53,162Gracia, M.I 90 [email protected], H 104Greenhalgh, S 26,30 [email protected], P.J 100,147 [email protected], B 156 [email protected], S 49,156Hall, L 113Han, Y 70 [email protected], P 124,129Hopcroft, R 84,89 [email protected], G.S 21Hutapea, P 66Iqbal, A 162Inhuber, V 10 [email protected], C 147Jlali, M 90 [email protected], B 7 [email protected], R 130,133 [email protected], D.R 93 [email protected], M 16 [email protected], D.R 141Khaskheli, A.A 34,137,140 [email protected], S 152Kidd, M.T. 90 [email protected], J.C 45Kim, Y.J 45,53Konkawat, R 66Kolakshyapati, M 113,114 [email protected], W 152Krishnan, P 7Kumar, A 43 [email protected], J.M 128

Lee, B.K 45Lee, C 128Lee, J.H 45Li, J.B 17Li, L 113Li, X 138,141 [email protected], M.B. 109Liu, S.Y 17,22,26,30 [email protected], Y.G 74 [email protected], D 137Macelline, S.P 17,22,26 [email protected], E 66Massanyi, P 166 [email protected], C 137 [email protected], M.M.Y 34,139,142 [email protected], A 156Millecam, J 78,143Miskeje, M 166Moore, R.J 21 [email protected], N.K 84,85,89,162,163 [email protected], A.F 6, 10,21,85,108,164,165 [email protected], W.I 100 [email protected], M 139Nawab, A 6Nguyen, T.T.H 43,163 [email protected], S 34,53,139,142 [email protected], H.J 45Pan, L.Y 139Park, L.R. 104Parkinson, G 164Pastor, A 152Petranyi, F 54 [email protected], G.M 164Piewngam, P 152Pineda, L 70 [email protected] Piyaram, P 152Poernama, F 7Powell, N 164Preesong, P 157Preynat, A 90 [email protected], D.P 156 [email protected], E.K.M 109 [email protected], M.S 128 [email protected], S 54 [email protected]
Ravindran, G 39 [email protected]
Ravindran, V 12,16,39 [email protected]
Rice, M 124,129 [email protected]

Roberts, JR 163 jroberts1@
Roekngam, N 152Roura, E. 34,53,139,142Rouffineau, F 156Rousseau, X. 45 [email protected], Y 157Ruhnke, I 113,114 [email protected], J.S 104 [email protected], D.S 109Saremi, B 78,143 [email protected], S 156Selle, P.H 17,22,26,30 [email protected], N.K 10,108 [email protected], S 147Shelke, V.M 148Shepard, R 128Sibanda, T.Z 113,114,162 [email protected] Sidiq, F 156Silva, E.P 109Slanina, T 166Song, D.C 45Sousa, M.G.B.L 109Speight, R.E 138Stanley, D 54,58,113 [email protected], T 152Stevenson, M 129 [email protected], M 85Sun, H 140 [email protected], Y 138 [email protected], R.A 43,108,163 [email protected] Tactacan, G 157Taylor, J 124,129Taylor, P.S 124,129Theapparat, Y 152Tiyasatkulkovit, T 66Toghyani, M 17,26,43,163 [email protected], G 147Van, T.T.H 21 [email protected] Kuijk, S 70 [email protected], N 156Wallace, A.D 89 [email protected], S.E 35 [email protected] Wester, T.J 12White, E 49 [email protected], T 7Wilkinson, S.J 10,141 [email protected], S 147

Wu, Q 130,133Xu, J 130,133Xu, Z.J 138Yan, X.H 140Yavuz, B 90 [email protected], L 130,133Yuwares, R. 66Zaefarian, F 12,16 [email protected], D 138,141Zhang, J 130,133 [email protected], L.H 74,140 [email protected] Zhao, L 140

Notes: