Predictive modeling for preventive Archaeology: overview and case study
14
Cent. Eur. J. Geosci. • 6(1) • 2014 • 42-55 DOI: 10.2478/s13533-012-0160-5 Central European Journal of Geosciences Predictive modeling for preventive Archaeology: overview and case study Research article Maria Danese 1* , Nicola Masini 1 , Marilisa Biscione 1 , Rosa Lasaponara 2 1 IBAM, CNR, Contr.da S. Loja, Tito Scalo (Pz), 85050, Italy; +39 0971 427309 2 IMAA, CNR, Contr.da S. Loja, Tito Scalo (Pz), 85050, Italy Received 5 August 2013; accepted 31 December 2013 Abstract: The use of GIS and Spatial Analysis for predictive models is an important topic in preventive archaeology. Both of these tools play an important role in the Support Decision System (SDS) for archaeological research and for providing information useful to reduce archaeological risk. Over the years, a number of predictive models in the GIS environment have been developed and proposed. The existing models substantially differ from each other in methodological approaches and parameters used for performing the analysis. Until now, only few works consider spatial autocorrelation, which can provide more effective results. This paper provides a brief review of the existing predictive models, and then proposes a new methodological approach, applied to the neolithic sites in the Apulian Tavoliere (Southern Italy), that combines traditional techniques with methods that allow us to include spatial autocorrelation analysis to take into account the spatial relationships among the diverse sites. Keywords: Apulian Neolithic • Autocorrelation • Archaeology, Predictive Models • Spatial analysis © Versita Sp. z o.o. 1. Introduction Predictive models are useful tools for archaeological re- search. They can provide an important decision support system to obtain useful information for defining survey priority and facilitating new discoveries; saving time and money, especially in large areas. Moreover, predictive models can also contribute to the preservation of archae- ological areas and features, and witnesses of the human past, providing information useful for reducing archaeo- logical risk linked both to anthropic and natural risk fac- * E-mail: (m.danese-n.masini-m.biscione)@ibam.cnr.it tors. Archaeological risk can be defined as the product of the hazard, the vulnerability and exposure [2]. The haz- ard expresses the probability that an event causes dam- ages, due to, for example, anthropic hazard such as urban sprawl [3], large-scale infrastructure [4] looting linked to the illicit trade of antiquities [5], or natural risk factors, such as landslides, fire, earthquakes, etc [6]. The expo- sure expresses the value of the element at risk, which is particularly difficult to evaluate in an objective way in the case of archaeological heritage. The vulnerability is connected to elements at risk herein represented by ar- chaeological sites. According to most of Italian regional planning laws, archaeological risk maps are important in- struments for public authorities to prevent and mitigate 42 Brought to you by | provisional account Unauthenticated Download Date | 7/13/16 8:29 PM
-
Upload
independent -
Category
Documents
-
view
1 -
download
0
Transcript of Predictive modeling for preventive Archaeology: overview and case study

Cent. Eur. J. Geosci. • 6(1) • 2014 • 42-55DOI: 10.2478/s13533-012-0160-5
Central European Journal of Geosciences
Predictive modeling for preventive Archaeology:overview and case study
Research article
Maria Danese1∗ , Nicola Masini1, Marilisa Biscione1, Rosa Lasaponara2
1 IBAM, CNR, Contr.da S. Loja,Tito Scalo (Pz), 85050, Italy; +39 0971 427309
2 IMAA, CNR, Contr.da S. Loja,Tito Scalo (Pz), 85050, Italy
Received 5 August 2013; accepted 31 December 2013
Abstract: The use of GIS and Spatial Analysis for predictive models is an important topic in preventive archaeology. Bothof these tools play an important role in the Support Decision System (SDS) for archaeological research and forproviding information useful to reduce archaeological risk. Over the years, a number of predictive models inthe GIS environment have been developed and proposed. The existing models substantially differ from eachother in methodological approaches and parameters used for performing the analysis. Until now, only few worksconsider spatial autocorrelation, which can provide more effective results. This paper provides a brief review ofthe existing predictive models, and then proposes a new methodological approach, applied to the neolithic sites inthe Apulian Tavoliere (Southern Italy), that combines traditional techniques with methods that allow us to includespatial autocorrelation analysis to take into account the spatial relationships among the diverse sites.
Keywords: Apulian Neolithic • Autocorrelation • Archaeology, Predictive Models • Spatial analysis© Versita Sp. z o.o.
1. Introduction
Predictive models are useful tools for archaeological re-search. They can provide an important decision supportsystem to obtain useful information for defining surveypriority and facilitating new discoveries; saving time andmoney, especially in large areas. Moreover, predictivemodels can also contribute to the preservation of archae-ological areas and features, and witnesses of the humanpast, providing information useful for reducing archaeo-logical risk linked both to anthropic and natural risk fac-∗E-mail: (m.danese-n.masini-m.biscione)@ibam.cnr.it
tors. Archaeological risk can be defined as the product ofthe hazard, the vulnerability and exposure [2]. The haz-ard expresses the probability that an event causes dam-ages, due to, for example, anthropic hazard such as urbansprawl [3], large-scale infrastructure [4] looting linked tothe illicit trade of antiquities [5], or natural risk factors,such as landslides, fire, earthquakes, etc [6]. The expo-sure expresses the value of the element at risk, which isparticularly difficult to evaluate in an objective way inthe case of archaeological heritage. The vulnerability isconnected to elements at risk herein represented by ar-chaeological sites. According to most of Italian regionalplanning laws, archaeological risk maps are important in-struments for public authorities to prevent and mitigate42
Brought to you by | provisional accountUnauthenticated
Download Date | 7/13/16 8:29 PM

M. Danese, N. Masinia, M. Biscione, R. Lasaponara
risk factors, on the basis of a documentary knowledge inboth urban and territorial planning. These maps have aprobabilistic nature, depending on both hazard and vul-nerability components, that is the site distribution on theterritory. Unfortunately in the case of archaeological re-mains, the complete and real spatial distribution of ar-chaeological sites can not be known and, in these cases,the use of predictive models can provide useful informationfor obtaining archaeological sensibility maps as results ofa compromise between the reduction of costs and effective-ness of results. Predictive models have been introducedby different authors in the last thirty years [7], [8], [9]for landscape archaeological studies, which focus on therelationships between man and natural environment [10].According to [11], landscape is the backdrop that affectslimits or determines cultural forms and it is considered tobe composed of several phenomena. Each phenomenon isan indicator of cultural transformations in the investigatedregion [12] and is considered in predictive models as anincluding or excluding factor for the presence of archaeo-logical sites of a particular historical period or civilization.The work flow of predictive models starts from the studyof known archaeological sites including their environmen-tal and social characteristics. Known sites are studiedto understand the factors which influenced their positionin space, and consequently, to find settlement rules in-side the model adopted to make prediction [13]. In thisprocess, new technologies, such as GIS and remote sens-ing can be profitably used. Remote sensing and GIS havebeen becoming widely used in recent years thanks to dataavailability in conjunction with the development of userfriendly softwares and tools. GIS environments allow usto find and overlay the model parameters, whereas remotesensing provides a useful data source for facilitating thedetection of archaeological features and sites. The firstmain aspect of predictive modelling is the research andthe use of including and excluding factors. In literaturethis is pursued in two main ways, deductive, inductive.With deductive approaches, location rules derive from atheoretical approach and from the consequent theoreti-cal knowledge of archaeological sites. These elementsprovide settlement patterns and land use criteria adoptedin the past. By using an inductive approach, rules in-serted in the predictive model are extracted on the basisof a dataset, composed by an official database of well-known sites or from data picked up from archaeologicalsurveys and remote sensing images [14], [15]. However,the choice of parameters is, linked to the historical pe-riod investigated and consequently in literature there is agreat variation of factors used, even if the most importantare always present. These are: (i) land use, (ii) elevationand (iii) the proximity to the water bodies [16]. Other pa-
rameters, such as environmental and social elements, areless frequently employed [17], [18], [19], as: 1) the sunexposure ( that is the average of solar radiation hours re-ceived by a site in one day or in a season or during theyear); 2) viewshed analysis and viewshed indexes, ableto take in count the presence of vegetation and of sed-iments that increase the visible surface; 3) the distancefrom different elements such as the coast or reliefs; 4) eu-clidean distance or cost distance between sites. Anotherimportant aspect in predictive models is the choice of themethod used to combine including and excluding factors.The most common methods in literature are statistics; inparticular Markov’s Chain [12], Dempster-Shafer’s belieftheory [20], logistic or linear regression, or multi-fractalanalysis [21]. However, simpler methods such as map al-gebra functions are also used (See, just for some examples,[13], [16], [17]). One aspect that is very rarely treated isthe presence of spatial autocorrelation [22] in the distri-bution of archaeological sites. In this paper we proposea predictive model that considers spatial autocorrelationanalysis to include the distribution of archaeological sites.The paper is organized as follows: in the first section areview of existing predictive models is presented; in thesecond section spatial autocorrelation and spatial tech-niques that are currently used are described; in the thirdsection the case study of Neolithic sites of the Tavoliere(in North-West of Apulia region, Southern Italy) is in-troduced and characterized in order to select parametersand to construct the model; and finally in the last sectionsome final considerations and the validation of the modelare presented.2. Spatial analysis
In this paper two main methods have been used: mapalgebra and point pattern analysis. These are both tech-niques of spatial analysis. They permit investigation intothe spatial distribution of phenomena, aggregation shapesand existing relationships between the phenomenon andmultiple factors.2.1. Map algebra
Map Algebra (MA) is a high level spatial modeling lan-guage, including base elements (operators), complex ele-ments (functions) and formal language (instructions), to-gether with elements needed to program and develop com-plex models [23]. Main MA functions are [24] local, focaland zonal functions. In local functions there are one ormore input raster and the output raster comes from oper-ations done cell-by-cell; in focal functions there is only43
Brought to you by | provisional accountUnauthenticated
Download Date | 7/13/16 8:29 PM

Predictive modeling for preventive Archaeology: overview and case study
one input raster and each pixel of the output raster is theresult of operations calculated in a defined neighborhoodof that input raster; finally in zonal functions the outputraster comes from operations done on the values of oneraster inside areas cover by another zonal raster. Surfaceanalyses, useful to calculate morphological elements of alandscape, come from the combination of these groups offunctions.2.2. Point pattern analysis
In Point Pattern Analysis (PPA) the dataset under con-sideration is represented and analyzed as a point pattern.One of the aims of PPA is to find spatial autocorrelation,expressed by the first principle of geography: ”Everythingis related to everything else, but nearest things are morerelated than distant things” [25]. Studying the autocor-relation in one variable is important because it causes avariation of its spatial distribution; in fact under the hy-pothesis of complete spatial randomness, that is eventscompletely independent, this distribution would be dif-ferent. A variable is considered autocorrelated accordingto similarity and, at the same time, to distances betweenevents. These properties can be affected by two factors:first order effects are related to region properties and areexpressed by the spatial variation in the expected value(mean) of events; second order effects are related to localinteractions between events and are expressed by the spa-tial variation of covariance. Due to first and second ordereffects, the spatial autocorrelation of a distribution canassume three different types of configuration [26] (fig. 1):a) positive spatial autocorrelation or attraction betweenevents, when points are concentrated in some buildingclusters (clustered distribution); b) negative spatial auto-correlation or repulsion, when events are near in the spacebut they have different quantitative properties, so it is im-possible to find homogeneous areas (uniform or regulardistribution); and c) null autocorrelation (random distri-bution) when it is not possible to find any spatial effects,for what concerns both spatial location and properties ofeach event. Consequently, when null autocorrelation isverified, events exhibit a random spatial distribution; soin this case the complete randomness hypothesis is veri-fied.Usually, in predictive models spatial autocorrelation isnot considered. To consider it we used the following twofamilies of PPA: Nearest Neighbor method and KernelDensity Estimation.2.2.1. Nearest neighbor methodNearest Neighbor is the most common distance-basedmethod. It provides information about the interaction
among events at the local scale (second order property).Nearest-Neighbor Index (NNI) is defined by the followingequation (1):NNI = NNOD/NNED (1)
The numerator of equation (1) represents the average dis-tance between N events (Nearest Neighbor Observed Dis-tance, NNOD) considering the minimum distance of eachevent from the nearest one, and it can be represented byequation (2):NNOD = ∑n
i=1 dmin(s1, sj )n , (2)
where dmin (Si,Sj ) is the distance between each point andits nearest neighbour, and n is the number of points in thedistribution. Finally, the denominator of equation (1) rep-resents the nearest neighbour expected distance (NNED),based on a completely random distribution. It is expressedby the following formula (3):NNED = 0.5√A
n . (3)where A is the area of the spatial domain.NNI ¡ 1 means that NNOD¡NNED, so the point patternshows a positive spatial autocorrelation, because eventsare closer to each other than expected.NNI ¿ 1 means that NNOD¿NNED, so events are morescattered than expected.2.2.2. Kernel density estimationWhile classic density only computes the number of eventsincluded in a cell grid, kernel density estimation (KDE)is a moving three-dimensional function, weighting eventswithin their sphere of influence according to their distancefrom the point at which intensity is being estimated [27].The method is commonly used in a more general statisticalcontext to obtain smooth estimates of univariate (or multi-variate) probability densities from an observed sample ofobservations [28]. In each spatial point KDE is definedas:
λ(L) = n∑i=1
1τ2 k
(L− Liτ
), (4)
where λ is the distribution intensity of points, Li is theevent i, k is the kernel function and ? is the bandwidth.The main factor influencing density values is the band-width: if τ is too big the value of λ is closer to simpledensity; if τ is too small the surface does not capture thephenomenon. The second factor influencing density val-ues is cell size, as in every grid analysis. An extension ofKDE is KDEN, where the point estimation is evaluated44
Brought to you by | provisional accountUnauthenticated
Download Date | 7/13/16 8:29 PM

M. Danese, N. Masinia, M. Biscione, R. Lasaponara
Figure 1. a) positive autocorrelation, b) negative autocorrelation, c) random distribution.
along a network. KDEN could be calculated in a verydifferent way and in different application fields (see forexample [29], [30], [31], [32], [33], [34], [35], [36]), but it hasnot yet been applied in the archaeological field. In thispaper the method proposed in SANET software has beenused [37], [38], [39].3. Neolithic sites of the tavoliere(Apulia)
3.1. The case study and the working flow
The above explained methods have been applied to Apu-lian Tavoliere, an extended lowland plain covering an areaof 4300 km2 in Apulia region (Southern Italy). It is lim-ited to the east by the Adriatic Sea, to the northwestby the Gargano Massif, and to the south by the Murgeplateu. The investigated area is involved in an inten-sive mechanized agricultural activity and characterized bya long human presence as attested by a rich archaeo-logical heritage. [40]. On the basis of the aerial pho-tographs taken by Bradford during his ’Apulian Expedi-tion’ [41] this area has interested archaeological researchfor 50 years. In the 80s there were significantly impor-tant publications in conference proceedings about Dau-nia’s Prehistory-Protohistory-History [42], [43], [44], [45]and also monographs on investigations on some specificsites [46]. The area is furthermore the ideal terrain forapplications and palaeo-environmental research in rela-tion to the settlement choices for both the exceptionaldocumentation on the distribution of prehistoric settle-ments and the sparse population; from the reconstructionof the ancient landscape observing the geology, hydroge-ology and sedimentology [47] up to the palaeo-economy
Figure 2. The working flow chart for the predictive model of the Apu-lian Neolithic sites
research as regards settlement choices and conformationof the territory [48], [49], [50],[51]. Other studies on demo-graphic estimates, social organization and settlement [52],[53] have been conducted starting from the classes of sizeof sites [40], [54]. The working flow pursued the follow-ing steps (fig. 2): 1) Creation of a GIS with the datasetof already known archaeological sites and with the envi-ronmental parameters characterizing the study region; 2)Research of including and excluding factors for the Ne-olithic Apulia, through the calculation of spatial statisticsand the use of PPA methods and the comparison of resultsobtained with the study of environmental and social char-acteristics of sites in the chosen historical period; and 3)Overlay of including and excluding factors with the for-malization and the following validation of the model. Theresult is a map of survey priorities that contains areas thatdescribe the probability of finding an element of archae-ological interest.For the creation of the GIS, archaeological features (fig.3) that were used for this case study come from scientificworks, such as: - proceedings of national conferences onDaunia’s Prehistory-Protohistory-History [55], [43], [44],45
Brought to you by | provisional accountUnauthenticated
Download Date | 7/13/16 8:29 PM
Predictive modeling for preventive Archaeology: overview and case study
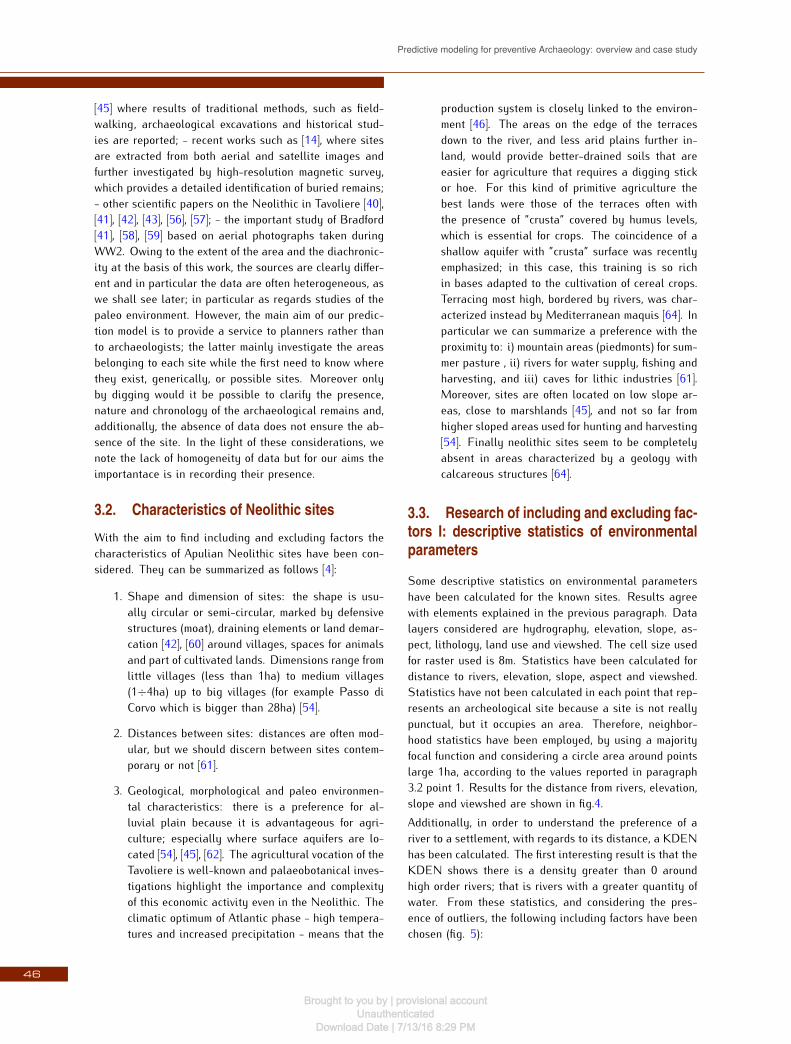
[45] where results of traditional methods, such as field-walking, archaeological excavations and historical stud-ies are reported; - recent works such as [14], where sitesare extracted from both aerial and satellite images andfurther investigated by high-resolution magnetic survey,which provides a detailed identification of buried remains;- other scientific papers on the Neolithic in Tavoliere [40],[41], [42], [43], [56], [57]; - the important study of Bradford[41], [58], [59] based on aerial photographs taken duringWW2. Owing to the extent of the area and the diachronic-ity at the basis of this work, the sources are clearly differ-ent and in particular the data are often heterogeneous, aswe shall see later; in particular as regards studies of thepaleo environment. However, the main aim of our predic-tion model is to provide a service to planners rather thanto archaeologists; the latter mainly investigate the areasbelonging to each site while the first need to know wherethey exist, generically, or possible sites. Moreover onlyby digging would it be possible to clarify the presence,nature and chronology of the archaeological remains and,additionally, the absence of data does not ensure the ab-sence of the site. In the light of these considerations, wenote the lack of homogeneity of data but for our aims theimportantace is in recording their presence.3.2. Characteristics of Neolithic sitesWith the aim to find including and excluding factors thecharacteristics of Apulian Neolithic sites have been con-sidered. They can be summarized as follows [4]:
1. Shape and dimension of sites: the shape is usu-ally circular or semi-circular, marked by defensivestructures (moat), draining elements or land demar-cation [42], [60] around villages, spaces for animalsand part of cultivated lands. Dimensions range fromlittle villages (less than 1ha) to medium villages(1÷4ha) up to big villages (for example Passo diCorvo which is bigger than 28ha) [54].2. Distances between sites: distances are often mod-ular, but we should discern between sites contem-porary or not [61].3. Geological, morphological and paleo environmen-tal characteristics: there is a preference for al-luvial plain because it is advantageous for agri-culture; especially where surface aquifers are lo-cated [54], [45], [62]. The agricultural vocation of theTavoliere is well-known and palaeobotanical inves-tigations highlight the importance and complexityof this economic activity even in the Neolithic. Theclimatic optimum of Atlantic phase - high tempera-tures and increased precipitation - means that the
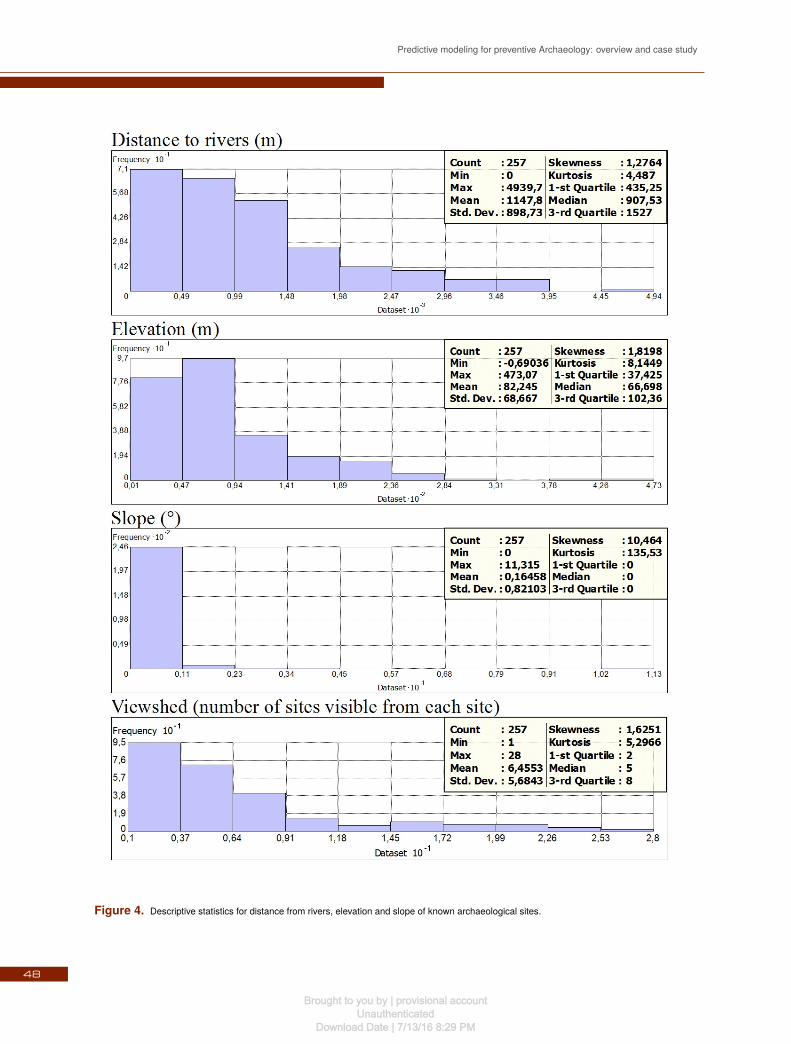
production system is closely linked to the environ-ment [46]. The areas on the edge of the terracesdown to the river, and less arid plains further in-land, would provide better-drained soils that areeasier for agriculture that requires a digging stickor hoe. For this kind of primitive agriculture thebest lands were those of the terraces often withthe presence of ”crusta” covered by humus levels,which is essential for crops. The coincidence of ashallow aquifer with ”crusta” surface was recentlyemphasized; in this case, this training is so richin bases adapted to the cultivation of cereal crops.Terracing most high, bordered by rivers, was char-acterized instead by Mediterranean maquis [64]. Inparticular we can summarize a preference with theproximity to: i) mountain areas (piedmonts) for sum-mer pasture , ii) rivers for water supply, fishing andharvesting, and iii) caves for lithic industries [61].Moreover, sites are often located on low slope ar-eas, close to marshlands [45], and not so far fromhigher sloped areas used for hunting and harvesting[54]. Finally neolithic sites seem to be completelyabsent in areas characterized by a geology withcalcareous structures [64].3.3. Research of including and excluding fac-tors I: descriptive statistics of environmentalparameters
Some descriptive statistics on environmental parametershave been calculated for the known sites. Results agreewith elements explained in the previous paragraph. Datalayers considered are hydrography, elevation, slope, as-pect, lithology, land use and viewshed. The cell size usedfor raster used is 8m. Statistics have been calculated fordistance to rivers, elevation, slope, aspect and viewshed.Statistics have not been calculated in each point that rep-resents an archeological site because a site is not reallypunctual, but it occupies an area. Therefore, neighbor-hood statistics have been employed, by using a majorityfocal function and considering a circle area around pointslarge 1ha, according to the values reported in paragraph3.2 point 1. Results for the distance from rivers, elevation,slope and viewshed are shown in fig.4.Additionally, in order to understand the preference of ariver to a settlement, with regards to its distance, a KDENhas been calculated. The first interesting result is that theKDEN shows there is a density greater than 0 aroundhigh order rivers; that is rivers with a greater quantity ofwater. From these statistics, and considering the pres-ence of outliers, the following including factors have beenchosen (fig. 5):46
Brought to you by | provisional accountUnauthenticated
Download Date | 7/13/16 8:29 PM

M. Danese, N. Masinia, M. Biscione, R. Lasaponara
Figure 3. Neolithic sites of Apulian Tavoliere.
• areas significantly less than 4km away from riverswith a KDEN ¿ 0;• areas with an elevation up to 350m;• areas with a slope up to 4◦;• areas visible from at least one site
Aspect does not have strong effects on sites becauseclasses are homogeneously distributed. The only mean-ingful result, coherent with slope statistics and with char-acteristics of Neolithic sites, is that the majority of sitesare in the flat zone. For this reason, again, aspect hasnot been included in the analysis because it does notgives any additional information at the model. In addition,the lithology and land use layer have been reclassified.In terms of lithology calcareous dolomitic units, argillitewith chaotic structure units, rocks succession with variablegranulometry and composition units have been consideredas excluding factors (fig. 5). In terms of land use, areas
that are not considered suitable for Neolithic settlementare woods, bare rocks, falesias and outcrops. It is worthnoting that during the Holocene Apulia was at the bound-ary between two climatic regions (eastern and westernMediterranean). As a consequence, the changes in climatethat characterised the middle Holocene could have led topeculiar modifications in water availability for vegetationgrowth in this area [65]. The regional climatic variabilityis expressed by a mosaic of phytocoenoses correspondingto specific vegetation types, which in turn corresponds tothe present vegetation covering used here as an includ-ing factor [66]. Thanks to archaeobotanical data result-ing from plant remains of 35 multistratified sites, usedin human activities (domestic fire or food processing), itwas possible to derive palaeo vegetational (i.e. the meso-thermophilous/thermo-xerophilous ratio) and palaeo agro-nomical indicators: (a) the wheat/barley ratio (where ahigher proportion of barley corresponds to relatively drierconditions), (b) hulled/naked cereal ratio (where a higher47
Brought to you by | provisional accountUnauthenticated
Download Date | 7/13/16 8:29 PM
Predictive modeling for preventive Archaeology: overview and case study
Figure 4. Descriptive statistics for distance from rivers, elevation and slope of known archaeological sites.
48
Brought to you by | provisional accountUnauthenticated
Download Date | 7/13/16 8:29 PM

M. Danese, N. Masinia, M. Biscione, R. Lasaponara
proportion of the naked form indicates wetter conditions),and (c) the relative abundance of legumes, weeds and mi-nor cereals (where the ecophysiological characteristics ofthe species are used as cropping period indicators). Theanalysis of plant remains indicates diachronical changesin the exploitation of edible species (cereals and legu-minosae) and fuelwood throughout the Neolithic period;it was possible to identify two dry periods (one between5000 and 4600 BC and another peaking c. 4000 BC) andtwo wet periods (one between 6200 and 5500 BC and an-other peaking c. 4400 BC) [66]. Here we have reportedan example of research that is very useful, but only con-cerns 35 sites. As it is impossible to calibrate the modelbased on a few sites we are forced to bypass this lackof data and of homogeneity, as anticipated at the end ofsection 3.1 by only considering the data that is availableand certain.3.4. Research of including and excluding fac-tors II: the study of spatial autocorrelationTo study if any spatial autocorrelation exists between ne-olithic sites, and to calculate the average modular dis-tance between sites, first the Nearest Neighbor methodhas been applied. The following values have been found:NNOD=1356m; NNED= 2236m, NNI= 0.61. The valueof the NNI, less than one, shows that there is spatial au-tocorrelation in the distribution. NNED has been insteadused to calculate a KDE representing areas where, forthe effect of positive autocorrelation, the probability tofind a new site increases. Other parameters used insidethe KDE are: the cell size (8m), the kernel of Epanech-nikov [66], chosen because it is smooth and it has finiteboundaries. As intensity only the occurrences of pointshave been used. Results obtained from KDE have beenclassified in ten quantile classes and the first nine classeshave been used as including factors.3.5. The final modelThe calculated KDE and the environmental factors havebeen finally reclassified as including and excluding fac-tors and combined with map algebra (a summarizing flowchart has been drawn in figure 7). A value of 1 has beenassigned to including factors and a value of 0 has beenassigned to excluding factors. They are combined accord-ing to the following formula, in order to determine areassuitable for neolithic settlements:K∗1000000+R∗100000+E∗10000+S∗1000+L∗100+U∗10+V ∗1(5)
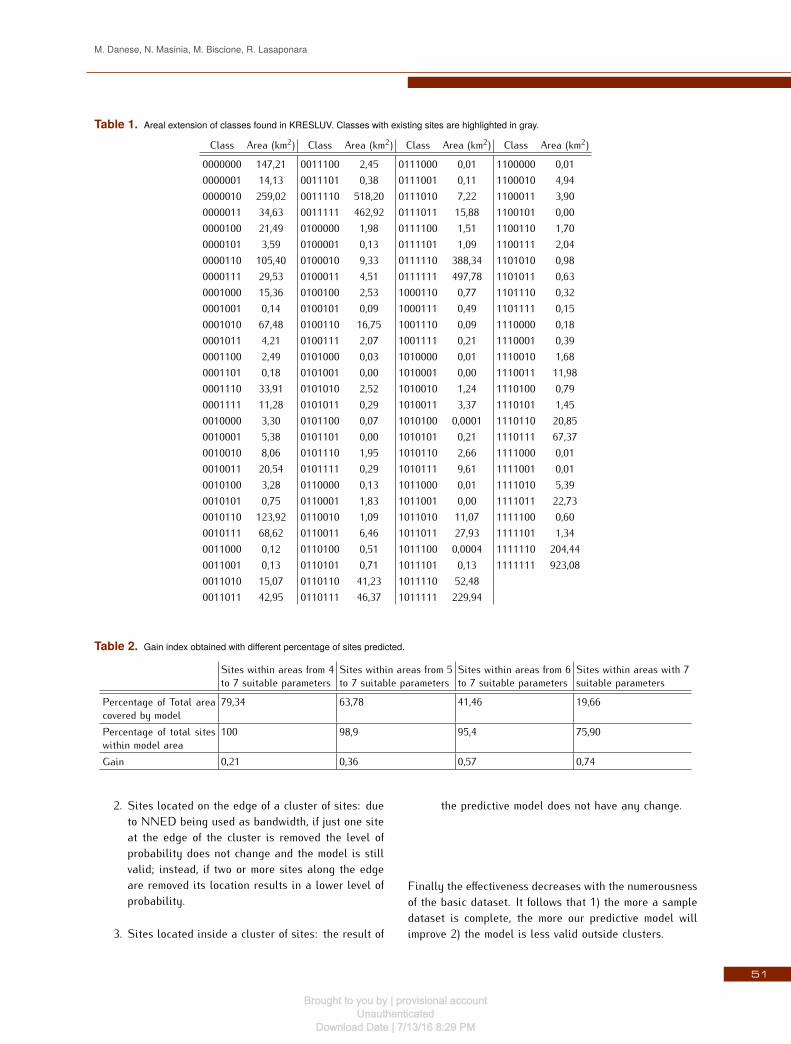
where K is a result of KDE, R is distance from rivers, Eis elevation, S is slope, L is lithology, U is land use andV is viewshed.The result is a raster with a binary number in each pixel.This binary number consists of 7 digits, corresponding tothe number of parameters used in the model. Therefore,each digit represents one parameter and shows if the pixelis suitable (digit equal to 1) for neolithic sites accordingto that parameter or if it is not (digit equal to 0). Theraster has been named KRESLUV to remember the read-ing order of factors and which is the digit that representseach factor, according to the expression (5). In this wayby querying the KRESLUV raster it is possible to knowhow many and which parameters are suitable for Neolithicsites. As an example, if the pixel selected has a value of1010011, it means that (K=1, R=0, E=1, S=0, L=0, U=1,V=1) it is suitable in terms of KDE, elevation, land useand viewshed, but not for distance from rivers, slope andlithology. Finally KRESLUV has been classified in orderto show areas from 0 to 7 factors suitable for neolithicsites by grouping together pixels with a number of digitsfrom zero to seven equal to 1. In this way 8 areas with anincreasing probability level to find new sites have beenobtained.4. ResultsIn total, 111 different combinations of parameters havebeen found (Tab. 1). Figure (9) is useful for understand-ing how the area is distributed into the first sixty largestclasses.The following result has been obtained (fig. 10): thegreatest percentage of sites fall in areas with 7 and 6suitable factors.With these values the validity of the model has been testedby calculating Kvamme’s gain index [67] expressed by (6)Gain = 1−
(% of total area covered by the model% of total sites within model area) (6)
As gain approaches 1, the predictive utility of the modelincreases. In table 2 the calculation of gain is reportedfor the percentage of total sites within different proba-bility areas. The most relevant gain found is the valuecalculated for sites within areas exhibiting 7 suitable pa-rameters; this means that the model has a good ability inpredicting 75.90% of sites.Due to the use of KDE the model is bound to the spatialand geometric properties of the site distribution. With thisaim to control the model behaviour, it has been recalcu-lated by subtracting each time a site in a random way,49
Brought to you by | provisional accountUnauthenticated
Download Date | 7/13/16 8:29 PM

Predictive modeling for preventive Archaeology: overview and case study
Figure 5. ncluding and excluding factors for the different environmental parameters considered: A) distance from river combined with KDEN; B)elevation; C) slope; D) lithology, E) land use and F) viewshed.
Figure 6. Classification of KDE combined with NNED returns areaswith a greater probability to find new sites.
evaluating in which class of the new calculated model thesubtracted site we forecast to find it and finally by look-ing the threshold of validity. The following cases couldhappen:1. Isolated sites: after the recalculation of the modelwithout the isolated site (far from other sites morethan the NNED), its location falls in a lower prob-ability area.
Figure 7. Flow chart summarizing the model. Here i.f. is includingfactor, while e.f. means excluding factor.
50
Brought to you by | provisional accountUnauthenticated
Download Date | 7/13/16 8:29 PM
M. Danese, N. Masinia, M. Biscione, R. Lasaponara
Table 1. Areal extension of classes found in KRESLUV. Classes with existing sites are highlighted in gray.Class Area (km2) Class Area (km2) Class Area (km2) Class Area (km2)0000000 147,21 0011100 2,45 0111000 0,01 1100000 0,010000001 14,13 0011101 0,38 0111001 0,11 1100010 4,940000010 259,02 0011110 518,20 0111010 7,22 1100011 3,900000011 34,63 0011111 462,92 0111011 15,88 1100101 0,000000100 21,49 0100000 1,98 0111100 1,51 1100110 1,700000101 3,59 0100001 0,13 0111101 1,09 1100111 2,040000110 105,40 0100010 9,33 0111110 388,34 1101010 0,980000111 29,53 0100011 4,51 0111111 497,78 1101011 0,630001000 15,36 0100100 2,53 1000110 0,77 1101110 0,320001001 0,14 0100101 0,09 1000111 0,49 1101111 0,150001010 67,48 0100110 16,75 1001110 0,09 1110000 0,180001011 4,21 0100111 2,07 1001111 0,21 1110001 0,390001100 2,49 0101000 0,03 1010000 0,01 1110010 1,680001101 0,18 0101001 0,00 1010001 0,00 1110011 11,980001110 33,91 0101010 2,52 1010010 1,24 1110100 0,790001111 11,28 0101011 0,29 1010011 3,37 1110101 1,450010000 3,30 0101100 0,07 1010100 0,0001 1110110 20,850010001 5,38 0101101 0,00 1010101 0,21 1110111 67,370010010 8,06 0101110 1,95 1010110 2,66 1111000 0,010010011 20,54 0101111 0,29 1010111 9,61 1111001 0,010010100 3,28 0110000 0,13 1011000 0,01 1111010 5,390010101 0,75 0110001 1,83 1011001 0,00 1111011 22,730010110 123,92 0110010 1,09 1011010 11,07 1111100 0,600010111 68,62 0110011 6,46 1011011 27,93 1111101 1,340011000 0,12 0110100 0,51 1011100 0,0004 1111110 204,440011001 0,13 0110101 0,71 1011101 0,13 1111111 923,080011010 15,07 0110110 41,23 1011110 52,480011011 42,95 0110111 46,37 1011111 229,94Table 2. Gain index obtained with different percentage of sites predicted.
Sites within areas from 4to 7 suitable parameters Sites within areas from 5to 7 suitable parameters Sites within areas from 6to 7 suitable parameters Sites within areas with 7suitable parametersPercentage of Total areacovered by model 79,34 63,78 41,46 19,66Percentage of total siteswithin model area 100 98,9 95,4 75,90Gain 0,21 0,36 0,57 0,74
2. Sites located on the edge of a cluster of sites: dueto NNED being used as bandwidth, if just one siteat the edge of the cluster is removed the level ofprobability does not change and the model is stillvalid; instead, if two or more sites along the edgeare removed its location results in a lower level ofprobability.3. Sites located inside a cluster of sites: the result of
the predictive model does not have any change.
Finally the effectiveness decreases with the numerousnessof the basic dataset. It follows that 1) the more a sampledataset is complete, the more our predictive model willimprove 2) the model is less valid outside clusters.51
Brought to you by | provisional accountUnauthenticated
Download Date | 7/13/16 8:29 PM
Predictive modeling for preventive Archaeology: overview and case study
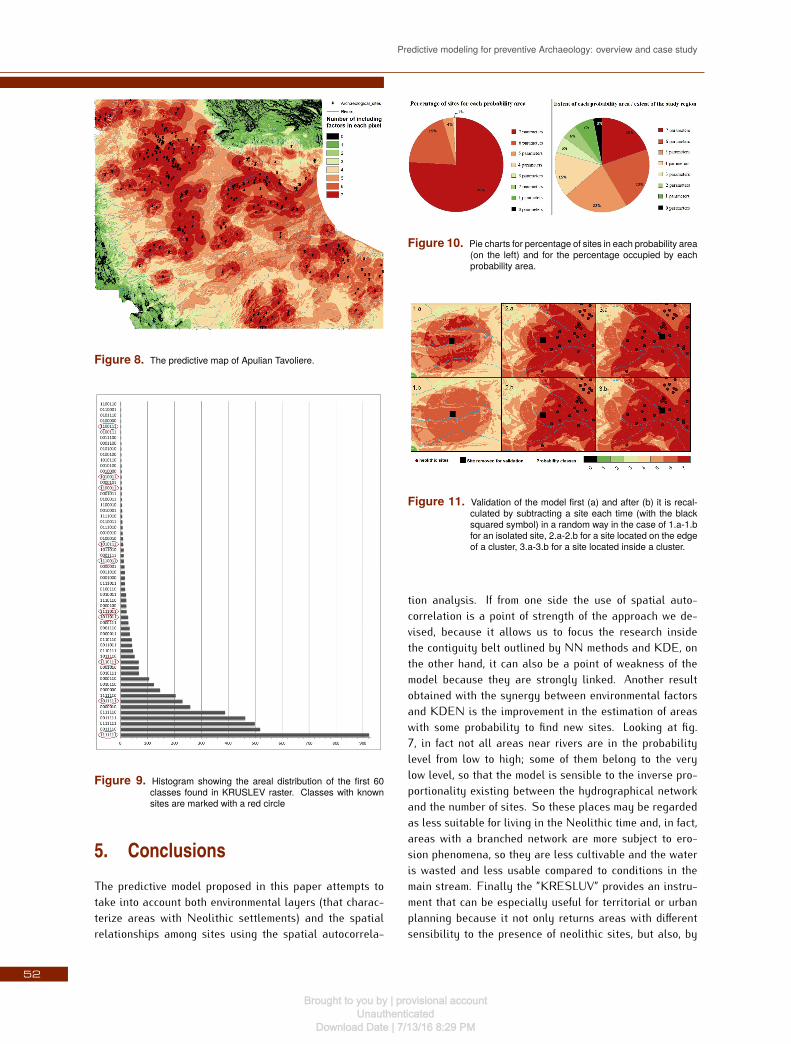
Figure 8. The predictive map of Apulian Tavoliere.
Figure 9. Histogram showing the areal distribution of the first 60classes found in KRUSLEV raster. Classes with knownsites are marked with a red circle
5. ConclusionsThe predictive model proposed in this paper attempts totake into account both environmental layers (that charac-terize areas with Neolithic settlements) and the spatialrelationships among sites using the spatial autocorrela-
Figure 10. Pie charts for percentage of sites in each probability area(on the left) and for the percentage occupied by eachprobability area.
Figure 11. Validation of the model first (a) and after (b) it is recal-culated by subtracting a site each time (with the blacksquared symbol) in a random way in the case of 1.a-1.bfor an isolated site, 2.a-2.b for a site located on the edgeof a cluster, 3.a-3.b for a site located inside a cluster.
tion analysis. If from one side the use of spatial auto-correlation is a point of strength of the approach we de-vised, because it allows us to focus the research insidethe contiguity belt outlined by NN methods and KDE, onthe other hand, it can also be a point of weakness of themodel because they are strongly linked. Another resultobtained with the synergy between environmental factorsand KDEN is the improvement in the estimation of areaswith some probability to find new sites. Looking at fig.7, in fact not all areas near rivers are in the probabilitylevel from low to high; some of them belong to the verylow level, so that the model is sensible to the inverse pro-portionality existing between the hydrographical networkand the number of sites. So these places may be regardedas less suitable for living in the Neolithic time and, in fact,areas with a branched network are more subject to ero-sion phenomena, so they are less cultivable and the wateris wasted and less usable compared to conditions in themain stream. Finally the ”KRESLUV” provides an instru-ment that can be especially useful for territorial or urbanplanning because it not only returns areas with differentsensibility to the presence of neolithic sites, but also, by52
Brought to you by | provisional accountUnauthenticated
Download Date | 7/13/16 8:29 PM

M. Danese, N. Masinia, M. Biscione, R. Lasaponara
querying the map, it is possible to determine which pa-rameters influenced that sensibility as support for reason-ing and decision making. Of course, this attempt to inte-grate spatial autocorrelation and the use of environmen-tal parameters could be further improved: firstly becausethere are many other parameters that could be includedin the analysis such as the communication networks be-tween sites, distance from the sea and the variation ofthe location of settlements within the Neolithic period,and secondly because there is the need to go more intopalaeoenvironmental data.6. AcknowledgementsThe authors thank Basilicata Region for supporting thisresearch in the framework of the project PRO_CULT (”Ad-vanced methodological approaches and technologies forProtection and Security of Cultural Heritage”) financedby OP Basilicata ERDF programme 2007/2013 .References
[1] Kamermans H., Van Leusen M., Verhagen P., Archae-ological prediction and risk management. archaeolog-ical studies. Leiden University Press, 2009[2] Varnes D.J., Slope movements, type and processes. In:Schuster R.L., Krizek R.J. (Eds.), Landslides-analysisand control: National Research Council, Washington,D.C., Transportation Research Board, Special Report1978, 176, 11-33[3] Danese M., Masini N., Murgante B., Archaeologi-cal risk and spatial analysis. How to compare urbansprawl and archaeological sensibility maps. EARSeLeProceedings 2013 (in press)[4] Danese M., Masini N., Biscione M., Lasaponara R.,Gis and archaeology: a spatial predictive model forneolithic sites of the Tavoliere (Apulia). In: Hadjim-itsis D.G., Themistocleous K., Michaelides S., Papa-david G. (Eds), Proc. SPIE 8795, First InternationalConference on Remote Sensing and Geoinformationof the Environment (RSCy2013), 2013[5] Lasaponara R., Danese M., Masini N., Satellite-based monitoring of archaeological looting in Peru.Remote sensing and digital image processing, 2012,16, 177-193, doi: 10.1007/978-90-481-8801-7_8[6] Hadjimitsis D., Agapiou A., Alexakis D., Sarris A., Ex-ploring natural and anthropogenic risk for culturalheritage in Cyprus using remote sensing and GIS.Int. J. Digital Earth, 2013, 6, 2, 115-142[7] Anschuetz K.F., Wilshusen R.H., Scheik C.L., An ar-
chaeology of landscapes: perspectives and directions.J. Archaeol. Res., 2001, 9, 2, 157-211[8] Ashmore W., Knapp A.B. (Eds.), Archaeologies oflandscape: Contemporary perspectives, BlackwellPublishers, Malden, MA, 1999[9] Sever T.L., Irwin D.E., Landscape archaeology:remote-sensing investigation of the ancient Maya inthe Peten rainforest of northern Guatemala. AncientMesoamerica, 2003, 14, 113-122[10] Vaughn S., Crawford T., A predictive model of archae-ological potential: an example from northwestern Be-lize. App. Geog., 2009, 29, 4, 542-555[11] Walker J.H., Recent landscape archaeology in SouthAmerica. J. Archaeol. Res., 2012, 20, 4, 309-355, DOI10.1007/s10814-012-9057-6[12] Niknami K.A., A stochastic model to simulate and pre-dict archaeological landscape taphonomy: monitoringcultural landscapes values based on an iranian surveyproject. Archeologia e Calcolatori, 2007, 18, 101-120[13] Podobnikar T., Veljanovski T., Stan?i? Z., Oï'·tir K.,Archaeological predictive modelling in cultural re-source management. In: Koneï'·nï'· M. (Ed.), GI inEUROPE: integrative - interoperable - interactive.Proceedings of 4th Agile Conference on GeographicInformation Science, 2001, 535-544[14] Ciminale M., Gallo D., Lasaponara R., Masini N., Amultiscale approach for reconstructing archaeologicallandscapes: applications in Northern Apulia (Italy),Archaeol. Prospect., 2009, 16, 143-153[15] Gallo D., Ciminale M., Becker H., Masini N., Remotesensing techniques for reconstructing a vast Neolithicsettlement in Southern Italy. J. Archaeol. Sci., 2009,36, 43-50[16] Brandt R., Groenewoudt B.J., Kvamme K.L., An ex-periment in archaeological site location: modelingin the netherlands using gis techniques. World Ar-chaeol., 1992, 24, 2, 268-282[17] Stan?i? Z., Kvamme, K., Settlement pattern modellingthrough boolean overlays of social and environmentalvariables. In: Barcelo J.A., Briz I., Vila A. (Eds.), Newtechniques for old times, CAA 98, BAR InternationalSeries , 1999, 757, 231-237[18] Verhagen P., Testing archaeological predictive mod-els: a rough guide. In: Posluschny A., Lambers K.,Herzog I. (Eds.), Layers of perception. Proceedingsof the 35th international conference on computer ap-plications and quantitative methods in archaeology(CAA), Berlin, Germany, 2007, 10, 285-291.[19] Garcia A., GIS-based methodology for Palaeolithicsite location preferences analysis. A case study fromLate Palaeolithic Cantabria (Northern Iberian Penin-sula), J. Archaeol. Sci., 2013, 40, 217-22653
Brought to you by | provisional accountUnauthenticated
Download Date | 7/13/16 8:29 PM
Predictive modeling for preventive Archaeology: overview and case study
[20] Canning S., BELIEF in the past: Dempster-Shafertheory, GIS and archaeological predictive modeling.Aust. Archaeol., 2005, 60, 6-15[21] Zhongxuan L., Gang H., Cheng Z., Multi-fractal anal-ysis on neolithic sites around the Sanxia ReservoirArea. RSETE, 2011, 491-494[22] Alexakis D., Sarris A., Astaras T., Albanakis K., Inte-grated GIS, remote sensing and geomorphologic ap-proaches for the reconstruction of the landscape habi-tation of Thessaly during the neolithic period. J. Ar-chaeol. Sci., 2011, 38, 89-100[23] De Mers M.N., GIS Modeling in raster. USA, 2002[24] Tomlin C.D., Geographic Information Systems andcartographic modeling. Englewood Cliffs, New Jersey,Prentice Hall, 1990[25] Tobler W.R., A Computer model simulating urbangrowth in the Detroit region. Econ. Geogr., 1970, 46,234-240[26] O’Sullivan D., Unwin D., Geographic InformationAnalysis. John Wiley & Sons, 2002.[27] Gatrell A.C., Bailey T.C., Diggle P.J., Rowlingson B.S.,Spatial point pattern analysis and its application ingeographical epidemiology. T. I. Brit. Geogr., 1996,21, 256-271[28] Silverman B.W., Density estimation for statistics anddata analysis. Monographs on Statistics and AppliedProbability, Chapman and Hall, London, 1986[29] Flahaut, B., Mouchart, M., Martin, E.S., THOMAS,I., The local spatial autocorrelation and the kernelmethod for identifying black zones a comparative ap-proach. Accident Anal. Prev., 2003, 35, 991-1004.[30] Borruso G., Network density and delimitation of ur-ban arrears. Transaction in GIS, 2004, 7, 177-191[31] Borruso G., Network density estimation: analysis ofpoint patterns over a network. In: O. Gervasi et al(Eds.), Computational Science and its applications.Lecture notes in Computer Science (Berlin, Heidel-berg: Springer-Verlag) 2005, 3482, Part III, 126-132[32] Borruso G., Network density estimation: a GIS ap-proach for analyzing point patterns in a networkspace. Transactions in GIS, 2008, 12, 377-402[33] Downs J.A., Horner M.W., Spatial modeling pathwaysof migratory birds for nature reserve site selection.Int. J. Geogr. Inf. Sci., 2008, 22, 6, 687-702[34] Downs J. A., Horner M.W., Characterising linear pointpatterns. In: Winstanley A.C. (Ed), Proceedings ofthe GIS Research UK Annual Conference, Maynooth:National University of Ireland, 2007, 421-425[35] Downs J. A., Horner M.W., Network-based kernel den-sity estimation for home range analysis. In: DemsarU. (Ed.), Proceedings of the 9th International Confer-ence on Geo-Computation, Maynooth: National Cen-
ter for Geocomputation, 2007[36] Xie Z., Yan J., Kernel density estimation of traffic ac-cidents in a network space. Comput. Environ.UrbanSystems, 2008, 32, 396-406[37] Okabe A., Okunuki K., Shiode S., The SANET tool-box: new methods for network spatial analysis. Trans-actions in GIS, 2006, 10, 4, 535-550[38] Okabe A., Okunuki K., Shiode S., SANET: a toolboxfor spatial analysis on a network. Geogr. Anal., 2006,38, 1, 57-66[39] Okabe A., Satoh T., Sugihara K., A kernel densityestimation method for networks, its computationalmethod and a GIS-based tool. Int. J. Geogr. Inf. Sci.,2009, 23, 1, 7-32[40] Jones G.D.B., Apulia-Vol. I: Neolithic Settlements inthe Tavoliere. Thames and Hudson, London, 1987[41] Bradford J.S.P., Buried landscapes in Southern Italy,Antiquity, 1949, 23, 58-72[42] Cassano S.M., La diffusione del Neolitico in Puglia.Convegno Nazionale sulla Preistoria-Protostoria-Storia della Daunia, San Severo, 1979[43] Gravina A., Caratteri del Neolitico medio-finale nellaDaunia centro-meridionale- 6◦ Convegno Nazionalesulla Preistoria-Protostoria-Storia della Daunia, SanSevero, 1984[44] Gravina A., Masseria Istituto di Sangro un inse-diamento del neolitico medio-finale nella Daunia,8◦ Convegno Nazionale sulla Preistoria-Protostoria-Storia della Daunia, San Severo, 1986[45] Gravina A., Masseria Santa Giusta. Un insedia-mento del Neolitico antico nella Daunia, 9◦ convegnonazionale sulla Preistoria - Protostoria - Storia dellaDaunia, San Severo, 1987[46] Mazzei M. (Eds.), La Daunia antica: dalla preistoriaall’altomedioevo. Milano, Electa, 1984[47] Delano Smith C., Daunia vetus. Terra, vita e mu-tamenti sulle coste del Tavoliere. AmministrazioneProvinciale di Capitanata, Foggia, 1978[48] Whitehouse R.D., Settlement and economy in South-ern Italy in the Neothermal period. Proceeding of thePrehistoric Society, 1968, 34, 332-367[49] Whitehouse R.D., Societa ed economia nel Neoliticoitaliano: la problematica dei fossati. In: La preis-toria del Basso Belice e della sicilia meridionalenel quadro della preistoria siciliana e mediterranea.Societa siciliana per le Storia Patria, Palermo, 1994,275-285[50] Jarman M.R., Webley D., Settlement and land usein Capitanata, Italy.In Higgs E.S. (Eds.), Papers ineconomic prehistory, Cambridge University Press, Ca,Cambridge, 1975,177-221[51] Sargent A., Changing settlements location and sub-54
Brought to you by | provisional accountUnauthenticated
Download Date | 7/13/16 8:29 PM
M. Danese, N. Masinia, M. Biscione, R. Lasaponara
sistence in later prehistoric Apulia, Italy, Origini,2001, 23, 145-168[52] Brown K.A., A passion for excavation. Labour require-ments and possible functions for the ditches of the”villaggi trincerati” of the Tavoliere, Apulia. The Ac-cordia Research Papers, 1991, 2, 7-30[53] Brown K.A., Settlement distribution and social or-ganisation in the Neolithic of the Tavoliere, Apulia.In: Herring R., Whitehouse R., Wilkins J. (Eds.), Pa-pers of the Fourth Conference of Italian Archaeology,The Archaeology of Power , 1991, 1, 9-25[54] Malone C., The italian Neolithic: a synthesis of re-search. J. World Prehist., 2003, 17, 3, 235-312[55] Skeates R., The social dynamics of enclosure inthe Neolithic of the Tavoliere south-east Italy. J.Mediterr. Archaeol., 2000, 13, 155-188[56] Volpe G., Gli insediamenti rurali dall’eta romanaall’eta tardoantca. Il mondo dell’archeologia, 1st.Treccani ed. Roma, 2002, 1, 911-917[57] Sanderson D.C.W., Murphy S., Using simple portableOSL measurements and laboratory characterisa-tion to help understand complex and heterogeneoussediment sequences for luminescence dating. Quat.Geochronology, 2010, 5, 299-305[58] Radcliffe F., Paesaggi sepolti in Daunia - John Brad-ford e la ricerca archeologica dal cielo 1945/1957.Claudio Grenzi Editore, Foggia, 2006[59] Bradford J.S.P., Ancient Landscapes: Studies in fieldarchaeology, G. Bell and Sons, Ltd., London, 1957[60] Tozzi C., Contributo alla conoscenza del villaggioneolitico di Ripa Tetta (Lucera). 6◦ convegno sullaPreistoria-Protostoria - Storia della Daunia, SanSevero, 1984[61] Biancofiore F., Note di antropologia economicadelle comunit? neolitiche della Puglia centro-settentrionale, 5◦ convegno nazionale sulla Preistoria
- Protostoria - Storia della Daunia. San Severo, 1983[62] Gravina A., Le comunita neolitiche di Coppa Pallante,5◦ convegno nazionale sulla Preistoria - Protostoria- Storia della Daunia. San Severo, 1983[63] Caldara M., Pennetta L., Influenza del clima sul pae-saggio neolitico del Basso Tavoliere di Puglia. In:Tine V. (Ed.), Forme e tempi della neolitizzazione inItalia Meridionale e in Sicilia, Rubbettino, SoveriaMannelli, 1996, 559-568[64] Coppola D., Indagini paletnologiche su un insedia-mento neolitico in localita Le Macchie (Polignano aMare - Bari), 3◦ convegno nazionale sulla Preisto-ria - Protostoria - Storia della Daunia, San Severo,1981[65] Gladstone R.M., Ross I., Valdes P.J., Abe-Ouchi A.,Braconnot P., Brewer S., Kageyama M., Kitoh A.,Legrande A., Marti O., Ohgaito R., Otto-Bliesner B.,Peltier W.R., Vettoretti G., Mid-Holocene NAO: APMIP2 model intercomparison. Geophy. Res. Lett.,2005, 32, L16707, doi:10.1029/2005GL023596[66] Fiorentino G., Caldara M., De Santis V., D’OronzoC., Muntoni I.M., Simone O., Primavera M., Radina F.,Climate changes and human-environment interactionsin the Apulia region of southeastern Italy during theNeolithic period, , Holocene, 2013, 23, 1297-1317,doi: 10.1177/0959683613486942[67] Epanechnikov V.A., Nonparametric Estimation of aMultivariate Probability Density, Theor. Probab.Appl.+, 1969, 14, 153-158[68] Kvamme K., Development and testing of Quantitativemodels. In: Judge W., Sebastian L. (Eds.), Quanti-fying the Present and Predicting the Past: Theory,Method and Application of Archaeological PredictiveModelling, Denver, 1988, 325-428.
55
Brought to you by | provisional accountUnauthenticated
Download Date | 7/13/16 8:29 PM