Translation : quá trình dịch mã ( tổng hợp chuỗi polypeptide
Upload
independentCategory
view
0download
0
Prediction of the Absolute Aggregation Rates ofAmyloidogenic Polypeptide Chains
Kateri F. DuBay1, Amol P. Pawar1, Fabrizio Chiti2, Jesus Zurdo1
Christopher M. Dobson1* and Michele Vendruscolo1*
1Department of ChemistryUniversity of CambridgeLensfield Road, CambridgeCB2 1EW, UK
2Dipartimento di ScienzeBiochimiche, Viale Morgagni50, Universita degli Studi diFirenze, 50134 Firenze, Italy
Protein aggregation is associated with a variety of pathological conditions,including Alzheimer’s and Creutzfeldt-Jakob diseases and type II dia-betes. Such degenerative disorders result from the conversion of the nor-mal soluble state of specific proteins into aggregated states that canultimately form the characteristic amyloid fibrils found in diseased tissue.Under appropriate conditions it appears that many, perhaps all, proteinscan be converted in vitro into amyloid fibrils. The aggregation propensitiesof different polypeptide chains have, however, been observed to vary sub-stantially. Here, we describe an approach that uses the knowledge of theamino acid sequence and of the experimental conditions to reproduce,with a correlation coefficient of 0.92 and over five orders of magnitude,the in vitro aggregation rates of a wide range of unstructured peptidesand proteins. These results indicate that the formation of protein aggre-gates can be rationalised to a considerable extent in terms of simplephysico-chemical parameters that describe the properties of polypeptidechains and their environment.
q 2004 Elsevier Ltd. All rights reserved.
Keywords: amyloid fibrils; aggregation rates; sequence analysis;hydrophobic patterns; misfolding diseases*Corresponding authors
Introduction
Pathological conditions such as type II diabetesand neurodegenerative disorders such asAlzheimer’s and Creutzfeldt-Jakob diseaseshave been linked with the deposition in tissue ofinsoluble protein aggregates.1– 5 These deposits,often in the form of amyloid plaques, are largelycomposed of misfolded proteins that assemble toform extended fibrillar structures.6 Despite thelack of detectable similarities among the aminoacid sequences or the native structures of amyl-oidogenic proteins, amyloid fibrils from differentsources share common morphological and struc-tural features.7 Electron and atomic forcemicroscopy have shown that amyloid fibrils areformed from protofilaments that associatelaterally or twist together to form fibrils of largerdiameter.6,8 – 10 Moreover, amyloid fibrils show a
common cross-b pattern in which the polypeptidechains form b-strands oriented perpendicularly tothe long axis of the fibril, resulting in b-sheets pro-pagating in the direction of the fibril.7 Althoughamyloid deposits were initially discovered inassociation with several human disorders, it hasrecently become apparent that a wide range ofother proteins, unrelated to any known disease,can form amyloid structures in vitro whenincubated under appropriate conditions.4,11 – 13 As aconsequence it has been suggested that theability to form amyloid fibrils is a common charac-teristic of polypeptide chains, although the easewith which they form varies greatly with thesequence.11,14,15
Given the increasing number of diseases that arerecognised to be related to amyloid formation, andthe apparent generic ability of natural and syn-thetic polypeptide chains to form amyloid fibrils,it is important to understand the determinants ofthis process. Diverse factors, both intrinsic andextrinsic to the proteins, have been reported toinfluence the rate of aggregation of amyloidogenicpeptides and proteins. Extrinsic factors that affectthe formation of protein aggregates include theinteraction with cellular components such as
0022-2836/$ - see front matter q 2004 Elsevier Ltd. All rights reserved.
Present address: Kateri F. DuBay, Department ofChemistry, UC Berkeley, 419 Latimer Hall, Berkeley, CA94720-1460, USA.
E-mail addresses of the corresponding authors:[email protected]; [email protected]
Abbreviations used: AcP, acylphosphatase.
doi:10.1016/j.jmb.2004.06.043 J. Mol. Biol. (2004) 341, 1317–1326

molecular chaperones,16 proteases that generate orprocess the amyloidogenic precursors,17 and theeffectiveness of quality control mechanisms, suchas the ubiquitin–proteasome system.18,19 They alsoinclude physico-chemical parameters defining theenvironment of the polypeptides, such as pH,temperature, ionic strength and concentration.20 – 25
Intrinsic factors associated with amyloid formationinclude a range of characteristics of polypeptidechains, such as charge,26 – 29 hydrophobicity,30 – 32
patterns of polar and non-polar residues,33 and thepropensities to adopt diverse secondary structuremotifs.27,32,34,35 In the case of globular proteins, thepropensity to form amyloid structures is ofteninversely related to the stability of the nativestate.36 – 40 Many of the proteins associated withamyloid diseases are, however, at least partiallyunstructured under physiological conditions. Forinstance, mutations in the a-synuclein gene, linkedto familial forms of Parkinson’s disease, cannotbe correlated to alterations in protein stability, asa-synuclein appears to be natively unfolded.41,42
Moreover, in many cases changes in stability arenot sufficient to account for the pathogenic natureof mutant proteins, such as in the case of theprion protein where a substantial fraction of themutations analysed so far have been found tohave little or no effect on the stability of the nativestate.43 Similarly, in familial amyloid polyneuropa-thies associated with transthyretin deposition,the degree of destabilisation of the native statecaused by a mutation and the severity of therelated clinical condition are not fully correlated.44
It is therefore becoming clear that, even forglobular proteins, intrinsic factors other than thestability of the native state must play a role indetermining the propensity of a given sequence toaggregate.
The role of intrinsic properties in determiningchanges in the aggregation rate resulting fromsingle amino acid substitutions has been recentlyanalysed in detail using human muscle acylphos-phatase (AcP).45 When aggregation was studiedfrom a denatured ensemble, a very high correlationwas found between the observed changes in theaggregation rates resulting from single amino acidsubstitutions and the effect that each of the substi-tutions has on three intrinsic properties of thepolypeptide chain, hydrophobicity, charge, andthe propensity of the polypeptide chain to adopta-helical or b-sheet structure.45 These factors wereincluded in an equation to correlate the changes inaggregation rates relative to the wild-type proteinfor single substitutions in regions of the poly-peptide chains observed to be influencingaggregation32 and for peptides and proteins thatare at least partially unfolded. The predicted varia-tions in aggregation rates obtained by applyingthis equation to different AcP mutants showed avery good agreement (r ¼ 0:76; p , 0:001) with theexperimental results obtained from the AcPmutants.32,45 The formula also reproduces to aremarkable extent (r ¼ 0:85; p , 0:001) the changes
in the aggregation rates observed experimentallyfor single amino acid substitutions in other poly-peptides, including those associated with amyloiddisease.45
Here, we take a significant step forward in thistype of analysis by showing that intrinsic andextrinsic characteristics can be used as variables ina relatively simple formula that predicts accuratelythe absolute aggregation rates of polypeptidechains under a wide range of experimental con-ditions, without the requirement of experimentalknowledge of the specific regions of the sequencethat are particularly sensitive for aggregation.We introduce the following phenomenologicalequation to describe the absolute rate at which apolypeptide chain aggregates to form amyloidfibrils or their precursors:
logðkÞ ¼ a0 þ ahydrIhydr þ apatI
pat þ achIch
þ apHEpH þ aionicE
ionic þ aconcEconc ð1Þ
where log(k) is the logarithm in base 10 of theaggregation rate k, in units of s21. Factors intrinsicto the amino acid sequence are denoted as I, whileextrinsic, condition-dependent, factors are denotedas E. Ihydr represents the hydrophobicity of thesequence, calculated as the sum of the hydrophobiccontributions of each residue, normalised by N, thenumber of amino acid residues in the sequence;the Roseman scale of hydrophobicity was used toestimate these propensities at neutral pH, usingthe data from Cowan and co-workers to adjust thechanges in hydrophobicity experienced by aminoacid residues at different pH values.46,47 Ipat takesinto account the existence of patterns of alternatinghydrophobic–hydrophilic residues; a factor of þ1was assigned for each pattern of five consecutivealternating hydrophobic and hydrophilic residuesin the sequence.48 Ich is the absolute value of thenet charge of the sequence. EpH accounts for thepH of the solution in which aggregation occursand Eionic defines the ionic strength of the solution,given in millimolar units. Finally, Econc refers to thepolypeptide concentration C (in millimolar units)in the solution, represented here as log(C þ 1), aterm always positive for any value of C.
At this stage of our investigation we focus onanalysing the absolute rates of aggregation forpolypeptide chains determined from theirdenatured states in vitro. We therefore exclude atthe present time parameters linked to the presenceof cellular components such as chaperones, pro-teases, and quality control systems as well asthose related to the conformational stability of thefolded proteins, although such factors could beincluded in extensions of the present study. Theresults of this work demonstrate our ability tocorrelate, and hence to predict, over a broad rangeof potential experimental conditions, the aggrega-tion rates of a number of non-homologous partiallyunstructured peptides and proteins.
1318 Prediction of Protein Aggregation Rates

Results and Discussion
Prediction of the aggregation rates
In order to determine the coefficients in equation(1), we considered a comprehensive database fromthe experimental data on aggregation rates avail-able in the literature at the time of preparation ofthe manuscript (see Methods). The datasetcomprised data from mutational studies on theaggregation of one protein, human muscle acyl-phosphatase (AcP), for which extensive measure-ments have been reported,28,32 and data on othersystems obtained from a systematic literaturesearch44,49 – 57 (see Table 1). Aggregation rates forAcP and for transthyretin variants were deter-mined under conditions that promote the con-version of the native state into an ensemble ofunfolded or partially unfolded conformations.This permitted factors favouring aggregation to beexamined in the absence of complications fromchanges in the stability of the native state thatmight occur as a consequence of the mutations.Since the remaining sequences are all peptidesthat do not fold into a defined globular structure,we can use experimental kinetic data whileremaining confident that the changes in aggrega-tion rates as a result of mutation are not due tochanges in the stability of the globular structure.
The coefficients in equation (1) were determinedby using a standard regression analysis to repro-duce the experimental log(k) values for the poly-peptides reported in Table 1 (see Methods). Thevalues reported in Table 2 represent the resultingestimates of these parameters. The comparisonbetween the calculated and observed aggregationrates for various sequences is illustrated in Figure1; AcP variants are shown in blue and theremaining sequences in green. The linear corre-lation coefficient between the calculated and theobserved values for the entire dataset is 0.92 ðp ,0:0001Þ: The root-mean-squared error between the
calculated and observed log(k) values is 0.3; thisvalue is an estimate of the statistical error on theprediction of log(k) consistent with the resultsobtained by the bootstrapping test (see below).
Validation of the predictions
The results of procedures such as the onedescribed in the previous section can be highlydependent on the database used in the fitting pro-cedure, a problem known as “overfitting”. In thespecific case that we have studied, an extensivetesting of the approach is particularly difficult atthe present stage owing to the relative scarcity ofgood-quality experimental data on polypeptideaggregation rates; indeed one of the objectives ofthe present work is to promote the measurementof the aggregation rates of a much larger numberof polypeptides and proteins. Therefore, in orderto test the accuracy and predictive power ofequation (1) in determining the aggregation rate ofany polypeptide chain we used two cross-validation methods, the bootstrapping procedure,58
and the jackknife method.59
Table 1. Experimental data used in the present work
Peptide/protein Variants pH Ionic strength (mM) [Peptide] (mM) References
AcP 59 5.5 43 0.04 28,32,61Ab40 2 7.4 150 0.25 53Ab40 1 7.4 81 0.03 55Ab42 1 7.4 81 0.01 55ABri 1 9.0 89 1.31 56AChE peptide 586–599 1 7.0 7.7 0.20 57Amylin 22–29 2 7.2 1.1 2.0 54Amylin 1–37 1 7.3 1.4 0.14 52Amylin 9–37 1 7.3 1.4 0.14 52HypF-N 1 5.5 40 0.08 75Amglin 1 5.0 0.1 0.001 50Leucine-rich repeats 1 7.8 3.3 0.39 49PrP peptide 106–126 3 5.0 1.2 0.33 51Transthyretin 3 4.4 130 0.014 44Human calcitonin 1 7.4 25 1.5 (S. Fowler & J.Z., unpublished results)
The sequences are denoted by the common abbreviation of the peptide or protein in each case. The number of mutations whoseaggregation rates were measured is given along with the experimental conditions. The sequences listed were used to fit the para-meters in equation (1), with the exception of HypF-N and calcitonin that were used as a test of its predictive ability.
Table 2. Results from the regression analysis of the entiredataset, which correspond to the best fit of the coef-ficients in equation (1)
a p-value
Hydrophobicity 21.56 ^ 0.38 ,0.001Patterns 0.41 ^ 0.04 ,0.001Charge 20.16 ^ 0.02 ,0.001pH 0.04 ^ 0.07 0.53Ionic strength 20.011 ^ 0.001 ,0.001Concentration 0. 4 ^ 0.6 0.57Intercept 23.3 ^ 0.4 ,0.001
Errors are estimated from the variability of the coefficientsresulting from the bootstrap and the jackknife validation pro-cedures; the respective p-statistics indicate the significance inthe predictions, with a p-value ,0.05 indicating a significantresult (see the text for comments on the values for pH and con-centration).
Prediction of Protein Aggregation Rates 1319

In the bootstrapping test, we randomly dividedthe entire dataset into two subsets. The first subset,composed of two-thirds of the sequences, was usedas the training set, from which the coefficients inequation (1) were estimated. These coefficientswere then used to predict the aggregation rates ofthe remaining sequences, representing the test set.The procedure was repeated 25 times, each timewith a different random choice of the training set.The distribution of the correlation coefficientsbetween the predicted and the experimental valueswas plotted for the training and test sets (Figure2A). The correlation coefficient for the training setranged from 0.90 to 0.94 with an average of 0.93;the p-value is lower than 0.0001 in all cases. Thecorrelation coefficient for the test set ranged from0.78 to 0.95 with an average value of 0.89; in onlyone of the 25 cases the correlation coefficient waslower than 0.80. We analysed carefully the list ofdata used in the training set in this case andfound that the random selection procedureexcluded all the data corresponding to a set ofmeasurements relative to a given range of experi-mental conditions. The resulting overfitting of thecoefficients was thus responsible for the relativelypoor performance in this case. This type of effectshould become less pronounced as more data onaggregation rates become available.
We then adopted the jackknife cross-validationmethod, in which the aggregation rate for eachsequence is predicted in turn after having left thatparticular sequence aside during the determinationof the optimal coefficients for the remainingsequences.59 We performed this procedure for allof the wild-type and mutated polypeptidesreported in Table 1. The linear correlation coef-
ficient between predicted and observed rates was0.91 in this case. The results of this test for variousnon-homologous polypeptide sequences areshown in Figure 2B. The good agreement betweenthe predicted and experimental aggregation ratesfor the various proteins and peptides examined inthis study shows the reliability of the formula indetermining absolute aggregation rates fromunstructured polypeptide chains.
Two further compelling tests for our formula arethe predictions of the aggregation rate of theN-terminal domain of prokaryotic globular proteinHypF (HypF-N) and human calcitonin, two pro-teins that were not included in the analysisdescribed so far. The 91 residue polypeptide chainof HypF-N has been shown to form amyloid fibrilsunder conditions similar to those used in the AcPstudies.28,32,60 HypF-N forms amyloid fibrils evenmore rapidly than AcP, which has one of the fastestamyloid aggregation rates in the dataset used.60 Wepredict log(k) ¼ 22.0 for HypF-N using equation(1). An experimental bound for the rate ofaggregation61 is log(k) $ 2 1.3. The comparisonbetween predicted and observed aggregation ratesof HypF-N (see Figure 1) shows that both valuesare faster than any other rate in our dataset. Simi-larly, the rate of amyloid aggregation for humancalcitonin was found to be log(k) ¼ 23.4 at 25 mMionic strength (S. Fowler & J.Z., unpublishedresults). Equation (1) predicts log(k) ¼ 23.2 forthis sequence (see Figure 1).
Influence of individual factors
The values of the coefficients in equation(1) obtained in the present analysis have been
Figure 1. Results from theregression analysis of the datasetreported in Table 1. The calculatedvalues for log(k), determined usingequation (1) and the coefficientsreported in Table 2, are plottedagainst the experimental values.Data for wild-type AcP and itsmutants are shown in blue (dia-monds), while data for othersequences in the dataset are shownin green (triangles). The compari-son between the predicted and theexperimental aggregation rates forthe N-terminal domain of HypF-Nis plotted as a red bar and yellowcircle for human calcitonin. A lineof slope 1.0 is plotted forcomparison.
1320 Prediction of Protein Aggregation Rates

examined to discuss the extent to which theycorrelate individually with the factors that areconsidered to influence the propensity of a poly-peptide chain to aggregate to form amyloid struc-tures. We note, however, that equation (1) isphenomenological and may involve double-counting of some factors. Therefore, the interpret-ation of the coefficients of individual terms shouldbe made with caution.
Intrinsic factors
Hydrophobicity
Hydrophobic interactions have long beensuggested to play a significant role in amyloidformation.62 The hydrophobicity scale that we usehere assigns positive values to hydrophilicresidues and negative values to hydrophobicresidues;46,63 the use of other hydrophobicity scalesis also possible, requiring only a re-fitting of thecoefficients in Table 2. As we found a significant
ðp , 0:001Þ coefficient for Ihydr; our analysis con-firms the well-documented effect that an increasedhydrophobicity leads to increased aggregation,61
as also shown by the fact that natively unfoldedproteins tend to have a low average hydrophobiccontent.64
Hydrophobic patterns
Hydrophobic patterning was found in thepresent study to be one of the most significant ðp ,0:001Þ determinants of aggregation rates inequation (1). The importance of hydrophobic–hydrophilic patterns has been extensively studiedby Hecht and co-workers,33,65 – 68 and alternatingpatterns of the type that we used have beenshown to be among the least common features ofnatural protein sequences.48 A length of five con-secutive hydrophobic and hydrophilic alternatingresidues was found to yield the most significantcorrelation with the experimental values of aggre-gation kinetics. The positive value of the coefficient
Figure 2. A, Results from thebootstrapping test for equation (1)(see Methods). The histogramshows the distribution of the corre-lation coefficients of both training(black) and test (grey) sets for 25trials. B, log(k) values predicted forall the non-homologous wild-typesequences in our dataset by meansof the jackknife cross-validationanalysis. Predicted values of log(k)for each of the wild-type sequencesshown were calculated using aregression analysis on the data forall the sequences in the datasetexcept those for the single wild-type sequence predicted; namely,Ab40,53 ABri,56 transthyretin,44amylin,52 AChE,57 PrP,51 AcP andHypF-N.75 The experimental con-ditions for each observed aggrega-tion rate are reported in Table 1 aswell as in the references cited.
Prediction of Protein Aggregation Rates 1321

for patterns indicates that the more patterns of thistype occur in a given sequence, the faster is itsaggregation rate. Although a previous study31
observed a selection against consecutive hydro-phobic residues in natural sequences, we detectedno correlation in our dataset between aggregationrates and either consecutive hydrophobic orconsecutive hydrophilic residues.
Charge
The highly significant ðp , 0:001Þ negative coeffi-cient of the charge contribution indicates that theaggregation rate of a polypeptide chain is inverselyproportional to the absolute value of the netcharge; such a correlation has been observed beforefor AcP and its mutants.28 In the case of a smallpeptide, however, charges of ^1 were shown tobe more favourable to the formation of highlyregular amyloid structures than net charges29 of0 or ^2. These studies suggest, however, thatrapid aggregation may be associated with the for-mation of poorly defined structures, whereas theformation of highly ordered amyloid seems torequire longer periods of incubation.29 Modifi-cation of the functional form of Ich from a linear toa polynomial expression with maxima at ^1 gavea lower correlation coefficient for the equation.Thus, our investigation supports a linear depen-dence of the aggregation kinetics on the absolutevalue of the net charge of the polypeptide.45
Extrinsic factors
pH
The coefficients for pH and for concentration(see below) could not be fitted precisely, owing tothe limited size of the available database on aggre-gation rates. Nevertheless, we included them inequation (1) because we anticipate that themeasurement of additional aggregation rates willallow better estimates to be obtained in the future.Our present results suggest that the pH may bepositively correlated to the rate of aggregation.This finding is apparently not consistent with theobservation that formation of amyloid fibrils oftenoccurs at low pH.11,12,24,34,69 A possible explanationis that the charge is included explicitly as anintrinsic factor. The increased positive charge thatproteins tend to have at low pH is expected to dis-favour aggregation, but such an effect is morethan counterbalanced by the lowering of thestability of most proteins with decreasing pH.
Ionic strength
We found that taking into consideration the ionicstrength improved the accuracy of the predictionsof the aggregation rates. The extension of the data-set to include aggregation rates measured for thesame peptide or protein under a wider range ofsalt concentrations than the one we studied here
(from 0.1 mM to 150 mM) will enable a moreaccurate rationalization of this effect.
Peptide concentration
Our results indicate that, as expected, the rate ofaggregation may increase with the peptide concen-tration, C, although a fully quantitative analysis ofthis effect is not possible at present (see above).Several authors have proposed the existence of acritical concentration for amyloid formation,which is specific for each particular system.70 How-ever, since all the experimental data that weconsidered were obtained above the critical con-centration required for aggregation, the extra-polation of equation (1) to very low concentrationsshould be considered with considerable caution.
Additional factors
Factors, such as temperature, stirring and native-state stability, are known to influence amyloidaggregation rates significantly. High temperaturesare generally found to lead to faster aggregationrates20,23 but the limited range of temperatures inthe available experimental results included in thedataset (298–310 K) makes it difficult to establishreliably its contribution at the present time. Simi-larly, although the extent to which solutions areagitated is known to influence greatly the kineticsof aggregation, this factor was not considered here(see Methods). Lastly, as already mentioned, thepresent procedure does not take into account thestability of the native state, but rather predictsrates of aggregation from unfolded states. For glob-ular proteins such states are likely to be populatedat low levels under physiological conditions;nevertheless, they may still determine the observedaggregation rates.71 In principle, however, thestability of the native state, which is likely to be animportant factor in determining aggregation ratesin many cases, could also be considered as anadditional factor in the formula, once a sufficientlylarge set of experimental data becomes available.
Although b-sheet and a-helical propensitieshave been found to influence significantly thechanges in amyloid formation rates with mutationsin a variety of studies,34,35,45,72 they were not foundto be statistically significant in our analysis andtherefore were not included in equation (1).Secondary structure propensities are known, how-ever, to be relevant in describing aggregation ratesfor regions directly involved in the aggregationprocess,45 or when secondary structure pro-pensities do not lead to the formation of stablesecondary structural motifs.34 In addition, Hechtand co-workers33,65 – 67 showed that amino acidpatterns are a major determinant in defining thesecondary structure adopted by polypeptides, andin influencing the ability of amino acid sequencesto form amyloid structures. The inclusion ofpatterns in equation (1) might, therefore account
1322 Prediction of Protein Aggregation Rates

for some of the effects previously attributed tosecondary structure propensities.34,35,45
The present analysis has been carried out usingexperimental data available in the literature at thetime the manuscript was prepared (see Methods).The relative scarcity of these data has prevented atthis stage the consideration of the effects of someadditional factors, such as those mentioned above,known to influence amyloid aggregation rates.For a similar reason, as additional data becomeavailable, estimates for parameters in the rangesfor which we have optimized the coefficients inequation (1) should also become more reliable.The methodology that we present is, however,general, and we hope that the opportunity torefine the quantitative analysis will promote thesystematic collection of data relevant to theseadditional factors in order to rationalize theireffects.
Conclusions
We have shown that relatively simple para-meters defining a polypeptide sequence and itsenvironment can determine, under a wide rangeof experimental conditions, its aggregation ratefrom an unfolded or partially unfolded state intoamyloid fibrils. In the present work we have ana-lysed the effects of intrinsic properties of the poly-peptide sequence, such as hydrophobicity,hydrophobic–hydrophilic patterning and charge,and also environmental parameters, such as pH,ionic strength and concentration. Other factors,such as stability of the native state, temperatureand the degree to which the solution is agitatedcould also be included in the formula, if suitabledata become available to enable a reliable determi-nation of their coefficients.
The aggregation rates calculated using theapproach that we present here reproduce theexperimentally observed rates with a correlationcoefficient of 0.92 (bootstrap cross-validated 0.89,jackknife cross-validated 0.91). They can, therefore,be expected to allow accurate predictions withinthe ranges of conditions included in the datasetused at the present time, namely protein lengthsfrom 8 to 127 residues, pH values from 4.4 to 9.0,ionic strengths from 0.1 mM to 150 mM, tempera-tures from 298 K to 310 K and peptide concen-trations from 0.001 mM to 2 mM. We should alsonote that the formula derived in this work wasobtained by neglecting the observation that someregions of a polypeptide chain are likely to bemore important than others for determining theaggregation rates.32 The approach presented hereconsiders the overall properties of an amino acidsequence, with all residues having the same rela-tive importance. This approximation is likely to beresponsible for the negligible influence of secon-dary structure propensities that was found in thepresent analysis. When such propensities wereanalysed using the experimental knowledge of the
regions important for the aggregation of AcP, theresults demonstrated their importance for the pre-diction of changes in aggregation rates caused bysingle amino acid substitution.45 However, evenwith the limitations imposed by neglecting theexistence of these regions, perhaps compensatedfor by the inclusion of hydrophobic patterns, wehave found a robust correlation between predictedand experimental aggregation rates for essentiallyany sequence of residues. The quality of the predic-tions presented here is likely to be improvedfurther by combining equation (1) with an algor-ithm capable of predicting the relative importanceof different regions in a polypeptide chain. At thesame time, the fact that the regions important foraggregation do not need to be experimentallydetermined in order to use this formula enhancesgreatly its general applicability.
The present analysis is applicable to the kineticbehaviour measured after the lag phase in theaggregation, which is a common feature of aggre-gation resulting in highly organised amyloidfibrils, as indeed for crystallization. After the lagphase, single-exponential behaviour is generallyobserved. We hope that the encouraging resultswe have presented here will stimulate experi-mental groups, in addition to our own, to carryout systematic studies of the factors that influencethe duration of the lag phase as well as the sub-sequent growth phase, thus gathering a body ofknowledge that will make it possible to rationaliseits origin and the factors on which it depends.
One of the most important conclusions of thepresent work is that, under the conditions of appli-cability of equation (1) that we have discussed, arelatively small number of physico-chemical para-meters of a polypeptide chain and its environmentcan be used to determine its intrinsic propensityto form amyloid aggregates, with no apparentinfluence of the mechanism of aggregation andstructure adopted by the polypeptide chain in theresulting aggregates. In addition to providing acomputational tool for determining a priori therate of a process with so many implications in pro-tein science, biotechnology and medicine, this find-ing supports further the suggestion that proteinaggregation is a generic process where the com-mon backbone of a polypeptide chain plays adominant role, although amino acid side-chainsmodulate the propensity of the backbone to aggre-gate as well as many details of the resultingstructure. The ability to predict the aggregationpropensity of a given peptide or protein with theaccuracy shown here for a range of rates varyingby a factor of 105 should be a powerful tool to assistexperimental studies of the behaviour of naturalpolypeptides and their propensity to aggregate, aswell as to establish the principles by whichsequences have been selected through evolution toavoid misfolding and aggregation. A quantitativeunderstanding of the factors influencing aggre-gation rates will increase our capability topredict the onset of amyloidoses and other protein
Prediction of Protein Aggregation Rates 1323
deposition diseases, in addition to helping usexplore effective therapeutic strategies. It will alsohelp us to design or modify polypeptides andproteins rationally, to enhance their properties offolding and self-association for biotechnology,pharmaceutical developments and structuralbiology.
Methods
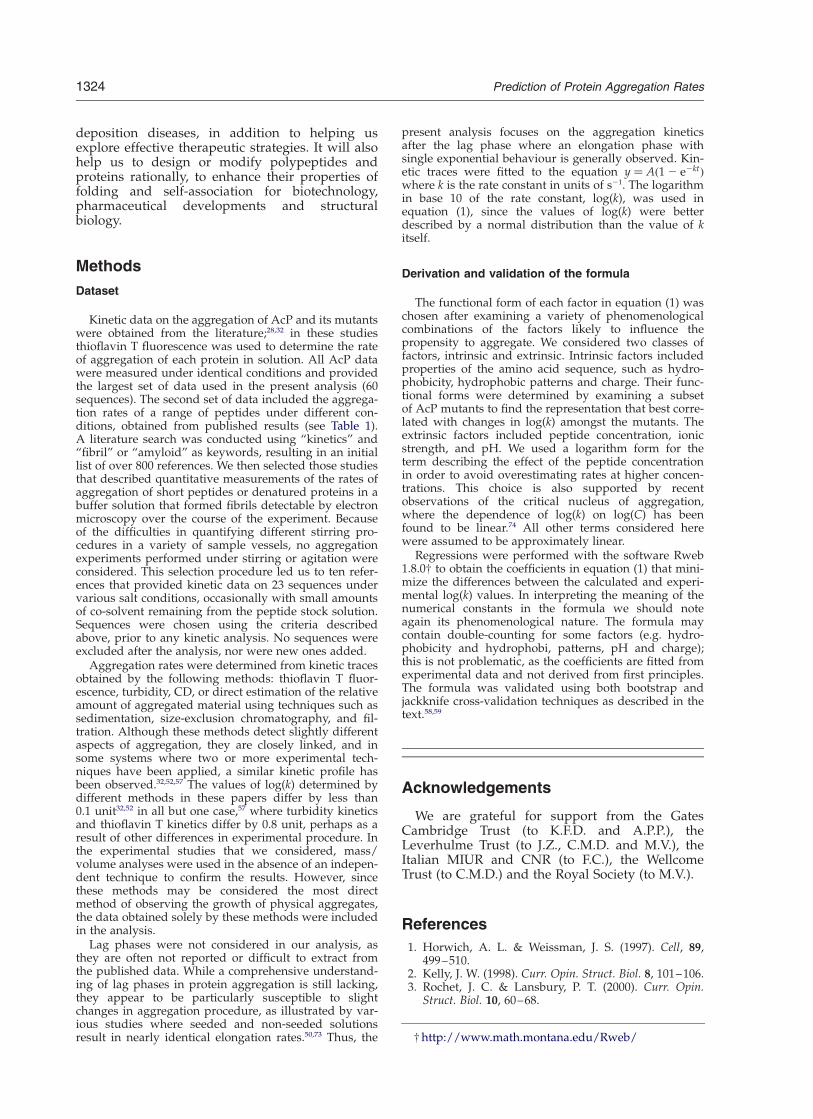
Dataset
Kinetic data on the aggregation of AcP and its mutantswere obtained from the literature;28,32 in these studiesthioflavin T fluorescence was used to determine the rateof aggregation of each protein in solution. All AcP datawere measured under identical conditions and providedthe largest set of data used in the present analysis (60sequences). The second set of data included the aggrega-tion rates of a range of peptides under different con-ditions, obtained from published results (see Table 1).A literature search was conducted using “kinetics” and“fibril” or “amyloid” as keywords, resulting in an initiallist of over 800 references. We then selected those studiesthat described quantitative measurements of the rates ofaggregation of short peptides or denatured proteins in abuffer solution that formed fibrils detectable by electronmicroscopy over the course of the experiment. Becauseof the difficulties in quantifying different stirring pro-cedures in a variety of sample vessels, no aggregationexperiments performed under stirring or agitation wereconsidered. This selection procedure led us to ten refer-ences that provided kinetic data on 23 sequences undervarious salt conditions, occasionally with small amountsof co-solvent remaining from the peptide stock solution.Sequences were chosen using the criteria describedabove, prior to any kinetic analysis. No sequences wereexcluded after the analysis, nor were new ones added.
Aggregation rates were determined from kinetic tracesobtained by the following methods: thioflavin T fluor-escence, turbidity, CD, or direct estimation of the relativeamount of aggregated material using techniques such assedimentation, size-exclusion chromatography, and fil-tration. Although these methods detect slightly differentaspects of aggregation, they are closely linked, and insome systems where two or more experimental tech-niques have been applied, a similar kinetic profile hasbeen observed.32,52,57 The values of log(k) determined bydifferent methods in these papers differ by less than0.1 unit32,52 in all but one case,57 where turbidity kineticsand thioflavin T kinetics differ by 0.8 unit, perhaps as aresult of other differences in experimental procedure. Inthe experimental studies that we considered, mass/volume analyses were used in the absence of an indepen-dent technique to confirm the results. However, sincethese methods may be considered the most directmethod of observing the growth of physical aggregates,the data obtained solely by these methods were includedin the analysis.
Lag phases were not considered in our analysis, asthey are often not reported or difficult to extract fromthe published data. While a comprehensive understand-ing of lag phases in protein aggregation is still lacking,they appear to be particularly susceptible to slightchanges in aggregation procedure, as illustrated by var-ious studies where seeded and non-seeded solutionsresult in nearly identical elongation rates.50,73 Thus, the
present analysis focuses on the aggregation kineticsafter the lag phase where an elongation phase withsingle exponential behaviour is generally observed. Kin-etic traces were fitted to the equation y ¼ Að1 2 e2ktÞwhere k is the rate constant in units of s21. The logarithmin base 10 of the rate constant, log(k), was used inequation (1), since the values of log(k) were betterdescribed by a normal distribution than the value of kitself.
Derivation and validation of the formula
The functional form of each factor in equation (1) waschosen after examining a variety of phenomenologicalcombinations of the factors likely to influence thepropensity to aggregate. We considered two classes offactors, intrinsic and extrinsic. Intrinsic factors includedproperties of the amino acid sequence, such as hydro-phobicity, hydrophobic patterns and charge. Their func-tional forms were determined by examining a subsetof AcP mutants to find the representation that best corre-lated with changes in log(k) amongst the mutants. Theextrinsic factors included peptide concentration, ionicstrength, and pH. We used a logarithm form for theterm describing the effect of the peptide concentrationin order to avoid overestimating rates at higher concen-trations. This choice is also supported by recentobservations of the critical nucleus of aggregation,where the dependence of log(k) on log(C) has beenfound to be linear.74 All other terms considered herewere assumed to be approximately linear.
Regressions were performed with the software Rweb1.8.0† to obtain the coefficients in equation (1) that mini-mize the differences between the calculated and experi-mental log(k) values. In interpreting the meaning of thenumerical constants in the formula we should noteagain its phenomenological nature. The formula maycontain double-counting for some factors (e.g. hydro-phobicity and hydrophobi, patterns, pH and charge);this is not problematic, as the coefficients are fitted fromexperimental data and not derived from first principles.The formula was validated using both bootstrap andjackknife cross-validation techniques as described in thetext.58,59
Acknowledgements
We are grateful for support from the GatesCambridge Trust (to K.F.D. and A.P.P.), theLeverhulme Trust (to J.Z., C.M.D. and M.V.), theItalian MIUR and CNR (to F.C.), the WellcomeTrust (to C.M.D.) and the Royal Society (to M.V.).
References
1. Horwich, A. L. & Weissman, J. S. (1997). Cell, 89,499–510.
2. Kelly, J. W. (1998). Curr. Opin. Struct. Biol. 8, 101–106.3. Rochet, J. C. & Lansbury, P. T. (2000). Curr. Opin.
Struct. Biol. 10, 60–68.
†http://www.math.montana.edu/Rweb/
1324 Prediction of Protein Aggregation Rates

4. Dobson, C. M. (2001). Phil. Trans. Roy. Soc. ser. B, 356,133–145.
5. Selkoe, D. J. (2002). Science, 298, 789–791.6. Sunde, M. & Blake, C. (1997). Advances in Protein
Chemistry, vol. 50. pp. 123–159.7. Sunde, M., Serpell, L. C., Bartlam, M., Fraser, P. E.,
Pepys, M. B. & Blake, C. C. F. (1997). J. Mol. Biol.273, 729–739.
8. Jimenez, J. L., Guijarro, J. L., Orlova, E., Zurdo, J.,Dobson, C. M., Sunde, M. & Saibil, H. R. (1999).EMBO J. 18, 815–821.
9. Harper, J. D., Wong, S. S., Lieber, C. M. & Lansbury,P. T. (1999). Biochemistry, 38, 8972–8980.
10. Serpell, L. C., Sunde, M., Benson, M. D., Tennent,G. A., Pepys, M. B. & Fraser, P. E. (2000). J. Mol. Biol.300, 1033–1039.
11. Guijarro, J. I., Sunde, M., Jones, J. A., Campbell, I. D.& Dobson, C. M. (1998). Proc. Natl Acad. Sci. USA,95, 4224–4228.
12. Chiti, F., Webster, P., Taddei, N., Clark, A., Stefani,M., Ramponi, G. & Dobson, C. M. (1999). Proc. NatlAcad. Sci. USA, 96, 3590–3594.
13. Dobson, C. M. (2002). Nature, 418, 729–730.14. Dobson, C. M. (1999). Trends Biochem. Sci. 24,
329–332.15. Stefani, M. & Dobson, C. M. (2003). J. Mol. Med. 81,
678–699.16. Muchowski, P. J. (2002). Neuron, 35, 9–12.17. Citron, M., Westaway, D., Xia, W. M., Carlson, G.,
Diehl, T., Levesque, G. et al. (1997). Nature Med. 3,67–72.
18. Bence, N. F., Sampat, R. M. & Kopito, R. R. (2001).Science, 292, 1552–1555.
19. Tofaris, G. K., Razzaq, A., Ghetti, B., Lilley, K. S. &Spillantini, M. G. (2003). J. Biol. Chem. 278,44405–44411.
20. Abrahamson, M. & Grubb, A. (1994). Proc. Natl Acad.Sci. USA, 91, 1416–1420.
21. Lomakin, A., Chung, D. S., Benedek, G. B., Kirschner,D. A. & Teplow, D. B. (1996). Proc. Natl Acad. Sci.USA, 93, 1125–1129.
22. Harper, J. D. & Lansbury, P. T. (1997). Annu. Rev. Bio-chem. 66, 385–407.
23. Kusumoto, Y., Lomakin, A., Teplow, D. B. &Benedek, G. B. (1998). Proc. Natl Acad. Sci. USA, 95,12277–12282.
24. Su, Y. & Chang, P. T. (2001). Brain Res. 893, 287–291.25. Zurdo, J., Guijarro, J. I., Jimenez, J. L., Saibil, H. R. &
Dobson, C. M. (2001). J. Mol. Biol. 311, 325–340.26. Konno, T. (2001). Biochemistry, 40, 2148–2154.27. Tjernberg, L., Hosia, W., Bark, N., Thyberg, J. &
Johansson, J. (2002). J. Biol. Chem. 277, 43243–43246.28. Chiti, F., Calamai, M., Taddei, N., Stefani, M.,
Ramponi, G. & Dobson, C. M. (2002). Proc. NatlAcad. Sci. USA, 99, 16419–16426.
29. de la Paz, M. L., Goldie, K., Zurdo, J., Lacroix, E.,Dobson, C. M., Hoenger, A. & Serrano, L. (2002).Proc. Natl Acad. Sci. USA, 99, 16052–16057.
30. Otzen, D. E., Kristensen, O. & Oliveberg, M. (2000).Proc. Natl Acad. Sci. USA, 97, 9907–9912.
31. Schwartz, R., Istrail, S. & King, J. (2001). Protein Sci.10, 1023–1031.
32. Chiti, F., Taddei, N., Baroni, F., Capanni, C., Stefani,M., Ramponi, G. & Dobson, C. M. (2002). NatureStruct. Biol. 9, 137–143.
33. West, M. W., Wang, W. X., Patterson, J., Mancias, J. D.,Beasley, J. R. & Hecht, M. H. (1999). Proc. Natl Acad.Sci. USA, 96, 11211–11216.
34. Villegas, V., Zurdo, J., Filimonov, V. V., Aviles, F. X.,
Dobson, C. M. & Serrano, L. (2000). Protein Sci. 9,1700–1708.
35. Kallberg, Y., Gustafsson, M., Persson, B., Thyberg, J.& Johansson, J. (2001). J. Biol. Chem. 276,12945–12950.
36. Hurle, M. R., Helms, L. R., Li, L., Chan, W. N. &Wetzel, R. (1994). Proc. Natl Acad. Sci. USA, 91,5446–5450.
37. Quintas, A., Saraiva, M. J. M. & Brito, R. M. M.(1999). J. Biol. Chem. 274, 32943–32949.
38. Chiti, F., Taddei, N., Bucciantini, M., White, P.,Ramponi, G. & Dobson, C. M. (2000). EMBO J. 19,1441–1449.
39. Ramirez-Alvarado, M., Merkel, J. S. & Regan, L.(2000). Proc. Natl Acad. Sci. USA, 97, 8979–8984.
40. Siepen, J. A. & Westhead, D. R. (2002). Protein Sci. 11,1862–1866.
41. Weinreb, P. H., Zhen, W. G., Poon, A. W., Conway,K. A. & Lansbury, P. T. (1996). Biochemistry, 35,13709–13715.
42. Li, J., Uversky, V. N. & Fink, A. L. (2001). Biochemistry,40, 11604–11613.
43. Liemann, S. & Glockshuber, R. (1999). Biochemistry,38, 3258–3267.
44. Hammarstrom, P., Jiang, X., Hurshman, A. R.,Powers, E. T. & Kelly, J. W. (2002). Proc. Natl Acad.Sci. USA, 99, 16427–16432.
45. Chiti, F., Stefani, M., Taddei, N., Ramponi, G. &Dobson, C. M. (2003). Nature, 424, 805–808.
46. Roseman, M. A. (1988). J. Mol. Biol. 200, 513–522.47. Cowan, R. & Witthaker, R. G. (1990). Peptide Res. 3,
75–80.48. Broome, B. M. & Hecht, M. H. (2000). J. Mol. Biol. 296,
961–968.49. Symmons, M. F., Buchanan, S. G. S., Clarke, D. T.,
Jones, G. & Gay, N. J. (1997). FEBS Letters, 412,397–403.
50. Kayed, R., Bernhagen, J., Greenfield, N., Sweimeh,K., Brunner, H., Voelter, W. & Kapurniotu, A. (1999).J. Mol. Biol. 287, 781–796.
51. Salmona, M., Malesani, P., De Gioia, L., Gorla, S.,Bruschi, M., Molinari, A. et al. (1999). Biochem. J. 342,207–214.
52. Goldsbury, C., Goldie, K., Pellaud, J., Seelig, J., Frey,P., Muller, S. A. et al. (2000). J. Struct. Biol. 130,352–362.
53. Miravalle, L., Tokuda, T., Chiarle, R., Giaccone, G.,Bugiani, O., Tagliavini, F. et al. (2000). J. Biol. Chem.275, 27110–27116.
54. Azriel, R. & Gazit, E. (2001). J. Biol. Chem. 276,34156–34161.
55. Fezoui, Y. & Teplow, D. B. (2002). J. Biol. Chem. 277,36948–36954.
56. El-Agnaf, O. M. A., Sheridan, J. M., Sidera, C.,Siligardi, G., Hussain, R., Haris, P. I. & Austen, B. M.(2001). Biochemistry, 40, 3449–3457.
57. Cottingham, M. G., Hollinshead, M. S. & Vaux, D. J.T. (2002). Biochemistry, 41, 13539–13547.
58. Press, W. H., Teukolsky, S. A., Vetterling, W. T. &Flannery, B. P. (2002). Numerical Recipes in Cþþ ,Cambridge University Press, Cambridge.
59. Mardia, K. W., Kent, J. T. & Bibby, J. M. (1979). Multi-variate Analysis, Academic Press, London.
60. Chiti, F., Taddei, N., Stefani, M., Dobson, C. M. &Ramponi, G. (2001). Protein Sci. 10, 879–886.
61. Calamai, M., Taddei, N., Stefani, M., Ramponi, G. &Chiti, F. (2003). Biochemistry, 42, 15078–15083.
62. Fink, A. L. (1998). Fold. Des. 3, R9–R23.
Prediction of Protein Aggregation Rates 1325

63. Creighton, T. E. (1993). Proteins. Structure andMolecular Properties, W. H. Freeman, Co., New York.
64. Uversky, V. N. (2003). Cell. Mol. Life Sci. 60,1852–1871.
65. Kamtekar, S., Schiffer, J. M., Xiong, H. Y., Babik, J. M.& Hecht, M. H. (1993). Science, 262, 1680–1685.
66. West, M. W. & Hecht, M. H. (1995). Protein Sci. 4,2032–2039.
67. Xiong, H. Y., Buckwalter, B. L., Shieh, H. M. & Hecht,M. H. (1995). Proc. Natl Acad. Sci. USA, 92,6349–6353.
68. Wang, W. X. & Hecht, M. H. (2002). Proc. Natl Acad.Sci. USA, 99, 2760–2765.
69. Bouchard, M., Zurdo, J., Nettleton, E. J., Dobson,C. M. & Robinson, C. V. (2000). Protein Sci. 9,1960–1967.
70. Lomakin, A., Teplow, D. B., Kirschner, D. A. &Benedek, G. B. (1997). Proc. Natl Acad. Sci. USA, 94,7942–7947.
71. Booth, D. R., Sunde, M., Bellotti, V., Robinson, C. V.,Hutchinson, W. L., Fraser, P. E. et al. (1997). Nature,385, 787–793.
72. Wood, S. J., Wetzel, R., Martin, J. D. & Hurle, M. R.(1995). Biochemistry, 34, 724–730.
73. Padrick, S. B. & Miranker, A. D. (2002). Biochemistry,41, 4694–4703.
74. Thakur, A. K. & Wetzel, R. (2002). Proc. Natl Acad. Sci.USA, 99, 17014–17019.
75. Chiti, F., Bucciantini, M., Capanni, C., Taddei, N.,Dobson, C. M. & Stefani, M. (2001). Protein Sci. 10,2541–2547.
Edited by A. R. Fersht
(Received 19 December 2003; received in revised form 4 June 2004; accepted 6 June 2004)
1326 Prediction of Protein Aggregation Rates
Copyright © 2022 FDOKUMEN