Predicting the turning points of housing prices by ... - PLOS
20
RESEARCH ARTICLE Predicting the turning points of housing prices by combining the financial model with genetic algorithm Shihai Dong 1 , Yandong Wang ID 1,2,3 *, Yanyan Gu ID 1 , Shiwei Shao 4 , Hui Liu 4 , Shanmei Wu 1 , Mengmeng Li 1 1 State Key Laboratory of Information Engineering in Surveying, Mapping and Remote Sensing, Wuhan University, Wuhan, China, 2 Collaborative Innovation Center of Geospatial Technology, Wuhan, China, 3 Faculty of Geomatics, East China University of Technology, Nanchang, China, 4 Wuhan Natural Resources and Planning Information Center, Wuhan, China * [email protected] Abstract The turning points of housing prices play a significant role in the real estate market and economy. However, because multiple factors impact the market, the prediction of the turning points of housing prices faces significant challenges. To solve this problem, in this study, a historical data-based model that incorporates a multi-population genetic algorithm with elit- ism into the log-periodic power law model is proposed. This model overcomes the weak- nesses of multivariate and univariate methods that it does not require any external factors while achieving excellent interpretations. We applied the model to the case study collected from housing prices in Wuhan, China, from December 2016 to October 2018. To verify its reliability, we compared the results of the proposed model to those of the log-periodic power law model optimized by the standard genetic algorithm and simulated annealing, the results of which indicate that the proposed model performs best in terms of prediction. Efficiently predicting and analyzing the housing prices will help the government promulgate effective policies for regulating the real estate market and protect home buyers. Introduction Real estate not only meets the basic human needs for housing but has also become a way to measure wealth [1]. A large number of countries have an ongoing problem of soaring housing prices and even a bubble, leading to an unhealthy development of the real estate market and difficulty in terms of housing purchasing [2–5]. As the most populous country in the world, this issue is particularly acute in China. The urban housing reforms derived from the last decade have fundamentally changed the Chinese housing market [6,7]. With rapid urbaniza- tion in China, the housing market has been stimulated and fueled owing to the continuously increasing demands of residents. In addition, the largest migration from rural regions to urban areas is occurring in China, leading to a rapid increase in the urban population and fur- ther sky-rocketing of urban housing prices [8,9]. As a result, there is a conflict between the PLOS ONE PLOS ONE | https://doi.org/10.1371/journal.pone.0232478 April 29, 2020 1 / 20 a1111111111 a1111111111 a1111111111 a1111111111 a1111111111 OPEN ACCESS Citation: Dong S, Wang Y, Gu Y, Shao S, Liu H, Wu S, et al. (2020) Predicting the turning points of housing prices by combining the financial model with genetic algorithm. PLoS ONE 15(4): e0232478. https://doi.org/10.1371/journal. pone.0232478 Editor: J E. Trinidad Segovia, University of Almeria, SPAIN Received: December 12, 2019 Accepted: April 15, 2020 Published: April 29, 2020 Copyright: © 2020 Dong et al. This is an open access article distributed under the terms of the Creative Commons Attribution License, which permits unrestricted use, distribution, and reproduction in any medium, provided the original author and source are credited. Data Availability Statement: The relevant data with preprocess are within the paper and its Supporting Information files (S2–S4 Tables). The raw housing price data (of the website) are from https://wuhan.anjuke.com (S1 Table). The detailed records of real estate transactions are from the Wuhan Natural Resources and Planning Information Center. Interested readers and researchers can contact with the Wuhan Natural Resources and Planning Information Center, whose website is http://www.digitalwuhan.net, address is Sanyang road no. 13, Jiang’an district,
-
Upload
khangminh22 -
Category
Documents
-
view
2 -
download
0
Transcript of Predicting the turning points of housing prices by ... - PLOS

RESEARCH ARTICLE
Predicting the turning points of housing prices
by combining the financial model with genetic
algorithm
Shihai Dong1, Yandong WangID1,2,3*, Yanyan GuID
1, Shiwei Shao4, Hui Liu4,
Shanmei Wu1, Mengmeng Li1
1 State Key Laboratory of Information Engineering in Surveying, Mapping and Remote Sensing, Wuhan
University, Wuhan, China, 2 Collaborative Innovation Center of Geospatial Technology, Wuhan, China,
3 Faculty of Geomatics, East China University of Technology, Nanchang, China, 4 Wuhan Natural
Resources and Planning Information Center, Wuhan, China
Abstract
The turning points of housing prices play a significant role in the real estate market and
economy. However, because multiple factors impact the market, the prediction of the turning
points of housing prices faces significant challenges. To solve this problem, in this study, a
historical data-based model that incorporates a multi-population genetic algorithm with elit-
ism into the log-periodic power law model is proposed. This model overcomes the weak-
nesses of multivariate and univariate methods that it does not require any external factors
while achieving excellent interpretations. We applied the model to the case study collected
from housing prices in Wuhan, China, from December 2016 to October 2018. To verify its
reliability, we compared the results of the proposed model to those of the log-periodic power
law model optimized by the standard genetic algorithm and simulated annealing, the results
of which indicate that the proposed model performs best in terms of prediction. Efficiently
predicting and analyzing the housing prices will help the government promulgate effective
policies for regulating the real estate market and protect home buyers.
Introduction
Real estate not only meets the basic human needs for housing but has also become a way to
measure wealth [1]. A large number of countries have an ongoing problem of soaring housing
prices and even a bubble, leading to an unhealthy development of the real estate market and
difficulty in terms of housing purchasing [2–5]. As the most populous country in the world,
this issue is particularly acute in China. The urban housing reforms derived from the last
decade have fundamentally changed the Chinese housing market [6,7]. With rapid urbaniza-
tion in China, the housing market has been stimulated and fueled owing to the continuously
increasing demands of residents. In addition, the largest migration from rural regions to
urban areas is occurring in China, leading to a rapid increase in the urban population and fur-
ther sky-rocketing of urban housing prices [8,9]. As a result, there is a conflict between the
PLOS ONE
PLOS ONE | https://doi.org/10.1371/journal.pone.0232478 April 29, 2020 1 / 20
a1111111111
a1111111111
a1111111111
a1111111111
a1111111111
OPEN ACCESS
Citation: Dong S, Wang Y, Gu Y, Shao S, Liu H,
Wu S, et al. (2020) Predicting the turning points of
housing prices by combining the financial model
with genetic algorithm. PLoS ONE 15(4):
e0232478. https://doi.org/10.1371/journal.
pone.0232478
Editor: J E. Trinidad Segovia, University of Almeria,
SPAIN
Received: December 12, 2019
Accepted: April 15, 2020
Published: April 29, 2020
Copyright: © 2020 Dong et al. This is an open
access article distributed under the terms of the
Creative Commons Attribution License, which
permits unrestricted use, distribution, and
reproduction in any medium, provided the original
author and source are credited.
Data Availability Statement: The relevant data
with preprocess are within the paper and its
Supporting Information files (S2–S4 Tables). The
raw housing price data (of the website) are from
https://wuhan.anjuke.com (S1 Table). The detailed
records of real estate transactions are from the
Wuhan Natural Resources and Planning
Information Center. Interested readers and
researchers can contact with the Wuhan Natural
Resources and Planning Information Center,
whose website is http://www.digitalwuhan.net,
address is Sanyang road no. 13, Jiang’an district,
extensive demand for housing and high housing prices, particularly in metropolitan areas
[10,11]. Furthermore, the growth of personal income has been much slower than the increases
in housing prices, further aggravating the issue of poor housing affordability [12,13].
As discussed above, low housing prices are disadvantageous for the economy, while high
prices make housing unaffordable for residents. In addition, housing prices have an indispens-
able role in the economy and the stable development of society; consequently, they have
attracted the interest of researchers. The prediction of housing prices is an ongoing topic; how-
ever, the accurate forecasting of housing prices is challenging owing to multiple factors such as
location, public services, and relevant policies. In general, there are two types of predictions in
this area. The most popular research direction is in predicting the actual value of a housing
price at a specified time in the future [14,15]. Studies in this field have built models with suffi-
cient historical data and influential factors, which can accurately determine the real-time hous-
ing prices. The second type is the prediction of the turning points of housing prices because
such points are significant signs within a fluctuant time series, upon which the present studies
are focused. A turning point refers to a peak of a time series when a long period of the upward
trend is stopped, and an evident crash is initiated. Numerous researchers have forecasted the
turning points of housing prices using univariate and multivariate methods [16–19]. However,
univariate methods are poor at forecasting the downturns or upturns of a time series, whereas
multivariate methods rely on the chosen influential factors of the model requiring higher
inputs for the selection of independent variables [20].
In this study, the log-periodic power law model optimized through the use of the multi-
population genetic algorithm with elitism (LPPL-MPGAWE) is proposed to predict the turn-
ing points of housing prices. The LPPL model is applied for forecasting the turning points
of housing prices because it introduces no external theory-driven variables and has outstand-
ing interpretability. However, parameter solutions of the LPPL model are quite difficult to
achieve because too many parameters need to be determined, and the solution is regarded as a
non-deterministic polynomial time-hardness (NP-hard) problem. The complex form of the
parameters used and the vast optimal research space are challenged to traditional methods,
and the genetic algorithm is therefore considered to be an appropriate choice [21]. Thus, by
combining the original genetic algorithm with ideas of multiple populations and a strategy
used to retain the best individuals in each generation—elitism, we applied a novel and
improved genetic algorithm, MPGAWE, to optimize the parameters of the LPPL model. Based
on three cases selected from housing prices in the city of Wuhan, two other widely used heuris-
tic algorithms, the standard genetic algorithm (SGA) [22] and the simulated annealing (SA)
algorithm [23], are applied to optimize the LPPL model and are then compared with the pro-
posed method to assess its effectiveness. The results indicate that the LPPL-MPGAWE model
is superior to the other two approaches in that it achieves the highest accuracy of the turning
points and the lowest sum of the squared residuals (SSR) among the models. Besides, by ana-
lyzing the temporal features of housing prices based on government policies, we found that the
housing prices at approximately the turning points in Wuhan are affected by such policies to
some degree.
The remainder of this paper is organized as follows. Section 2 reviews the related studies on
the prediction of housing prices and the solutions to the LPPL model. Section 3 demonstrates
the proposed model for turning point forecasting. Section 4 introduces the experimental case
of Wuhan and presents the results of the prediction as compared to those of other optimiza-
tion methods, as well as the results of temporal analysis. Finally, conclusions and limitations of
the current study are discussed in Section 5.
PLOS ONE Predicting the turning points of housing prices
PLOS ONE | https://doi.org/10.1371/journal.pone.0232478 April 29, 2020 2 / 20
Wuhan city, Hubei province, China, phone number
is +86 027-82700220, and email is [email protected].
cn. Interested readers and researchers can
cooperate with the Wuhan Natural Resources and
Planning Information Center and gain the data of
real estate records.
Funding: This work was supported by the National
Key Research Program of China (Grant No.
2016YFB0501403); the National Natural Science
Foundation of China (Grant No. 41271399); and the
China Special Fund for Surveying, Mapping and
Geoinformation Research in the Public Interest
(Grant No.201512015).
Competing interests: The authors have declared
that no competing interests exist.
Related work
Housing price prediction
Housing price prediction as a research area has attracted the attention of numerous research-
ers. Such predictions are of significant policy interest and are used to forecast the occurrence
of peaks and troughs, particularly during periods of economic downturn [24]. The prediction
methods used for housing prices can usually be divided into univariate and multivariate meth-
ods. The former model types predict the variables using information regarding the previous
housing price values and the current state in a time series. In contrast, multivariate methods
predict changes to the housing price based on the movement of other explanatory variables.
Numerous examples have proven that univariate autoregressive integrated moving average
model (ARIMA) styles perform well at predicting trends and housing price values. Crawford
and Fratantoni [16] compared the ability of three types of univariate time series models,
namely generalized autoregressive conditional heteroscedastic (GARCH), regime-switching,
and ARIMA models, and determined that the latter two outperform GARCH in in-sample and
out-of-sample forecasting, respectively. Following this study, Miles [25] employed a general-
ized autoregressive (GAR) model that performs better than the ARIMA model in markets with
high housing-price fluctuations. Vishwakarma [4] proved that the ARIMAX model containing
exogenous macroeconomic variables provides better out-of-sample forecasts than other mod-
els within the ARIMA family, including ARIMA and ARIMAX-GARCH. Concurrently, the
author also verified that the models are only appropriate for short-term predictions. Zietz and
Traian [17] used ARIMA-type models, switching regression models, and state-space/structural
time series models to forecast the turning point of the US housing market. It is interesting to
note that the state-space/structural time series models tend to predict the most accurate results
despite not actually fitting the in-sample data.
The other mainstream of the housing price prediction methods use theory-driven multivar-
iate models. Rapach and Strauss [18] found that autoregressive models incorporating eco-
nomic variables can predict housing prices in the US rather accurately if they do not fluctuate
too severely. Croce and Haurin [26] adopted the Granger causality and a Bayesian predictor as
the comparison tests and used the good-time-to-buy (GTTB) as an indicator for predicting
both the peaks and troughs relatively well. Previous studies also confirmed that a vector auto-
regressive (VAR), particularly a Bayesian vector autoregressive (BVAR) model, is quite good at
predicting the turning points of macroeconomic variables [27,28]. A spatial Bayesian vector
autoregressive merged with first-order spatial contiguity and random walk averaging tech-
nology has estimated for six metropolitan areas in South Africa by Gupta and Das [29]. Also,
GuptaKabundi and Miller [19] employed the ten-variable dynamic stochastic general equilib-
rium (DSGE) model [30] to forecast the US real estate prices in 2006 successfully and demon-
strated that the fundamental economic variables might be improved for predictive purposes.
In recent years, DSGE has also been utilized to analyze housing market fluctuations in China
[31].
In general, both types of prediction methods have their own advantages and disadvantages.
On the one hand, multivariate methods outperform univariate methods at predicting the turn-
ing points of housing prices by acquiring a relatively accurate forecast result. On the other
hand, if the multivariate methods lack fundamental information, the predicted turning points
will be inaccurate. Thus, in this study, the LPPL model is adopted for a turning point predic-
tion consisting of parameters and timestamps without any theory-driven variables. The
LPPL model is used specifically to predict the most probable turning points as one of the
parameters.
PLOS ONE Predicting the turning points of housing prices
PLOS ONE | https://doi.org/10.1371/journal.pone.0232478 April 29, 2020 3 / 20
LPPL model with optimization
The LPPL model was proposed by Johansen et al. and has been used to simulate the growth
bubbles in a variety of stock markets, treating the initial market crash as the turning point [32–
34]. The premise of the LPPL model is derived from the behavior of the agents in the market.
According to the model, traders have only three states: buy, sell, or wait. The actions of traders
rely on limited information regarding the decisions of other traders and external influences
such as a direct upturn or downturn in the market. A transaction is not an individual event,
and each transaction involves two or more traders, indicating that the trading action is irre-
versible. Based on the above considerations, traders are willing to make trading decisions
when profits from rising markets are higher than the losses incurred during a crash, creating a
bubble in the market. Thus, the LPPL model is both a statistically physical model and a rational
expectation model, and it is also a progressive method for predicting the turning points in the
financial market.
Because the LPPL model is derived from the market, numerous researchers have analyzed
the bubbles and turning points of housing prices. Zhou and Sornette used the LPPL model to
determine whether a bubble exists in the US using quarterly average sale price data. It is nota-
ble that the author also showed that the LPPL model was able to successfully predict the critical
turning point of the housing price index in UK Halifax [2]. In addition, the LPPL model was
applied to estimate the critical time, particularly the crashes of the bubble in Sejong, and in
China, Switzerland, and other locations [35–37].
Although the LPPL model is an effective way to predict the turning point of the housing
prices, it struggles to obtain the optimal value of the parameters owing to the relatively small
and noisy samples used, and numerous parameters need to be determined [38]. The essence of
the question is nonlinear and is regarded as an NP-hard problem. Heuristic algorithms are
more advantageous than traditional statistical methods to solve this problem, particularly with
the advancements in high-speed computing. A Taboo search is commonly used to determine
the parameters of the LPPL function from a financial price time series, but it cannot guarantee
convergence as a meta-heuristic method [39]. In addition, the SGA and SA methods were also
developed to optimize the LPPL model [40–41].
In this study, an improved version of the genetic algorithm called the MPGAWE is applied
to search for the best parameters for the LPPL model. Inheriting the advantages of the genetic
algorithm, MPGAWE does not rely on the choice of the initial values and is able to obtain
global optimization after numerous generations. The MPGAWE guarantees the convergence
of the model and avoids the parameters from falling into early maturity owing to the mutation
and migration mechanism. This also speeds up the convergence through parallel computing
with multiple populations. The details of the LPPL optimized using the MPGAWE are pre-
sented in the next section.
Methodology
In this section, the framework of the LPPL-MPGAWE is presented for forecasting the turning
points of housing prices by integrating the LPPL model as the basic means for prediction, and
the MPGAWE methods are proposed as an optimized tool for solving the parameters of the
LPPL model. This method does not import multiple variables and has perfect interpretability
to determine the turning points of housing prices.
LPPL model and simplification of linear parameters
The LPPL model has been proven to be valuable for detecting financial bubbles and predicting
financial crashes as a critical turning point via the fitting of a time series. Because the real estate
PLOS ONE Predicting the turning points of housing prices
PLOS ONE | https://doi.org/10.1371/journal.pone.0232478 April 29, 2020 4 / 20

market involves speculative behaviors, the LPPL model has significant potential to forecast the
turning points of housing prices. Specifically, the LPPL model is created as follows [32]:
yi ¼ Aþ Bðtc � tiÞaþ Cðtc � tiÞ
acosðo lnðtc � tiÞ þ φÞ ð1Þ
Under the current situation, yi is the real housing price at the time ti, A, B, C are the linear coef-
ficients, α is the exponential growth coefficient, ω represents the amplitude of the oscillation,
and φ is the phase deviation. Most importantly, the model does not require any external the-
ory-driven variables and tc is the critical time of the crash, which is the most probable predic-
tion time for the turning points of housing prices. By imitating the behavior of traders, the
most significant feature of the LPPL is that the amplitude of the oscillation in housing prices
decreases and becomes more frequent when ti is close to tc as verified from the above equation.
The turning points can be predicted by fitting the LPPL model to the historical housing price
time series.
However, estimating the parameters of the LPPL model is quite difficult because there are
several parameters in the model, including three linear parameters and four nonlinear parame-
ters that need to be optimized. The linear parameters are bound to reduce the computational
cost, and they are calculated from the given nonlinear parameters through the ordinary least
squares (OLS) method. The original LPPL model in Eq (1) can be compactly rewritten as fol-
lows:
yi ¼ Aþ Bfi þ Cgi ð2Þ
where
fi ¼ ðtc � tiÞa
ð3Þ
gi ¼ ðtc � tiÞacosðo lnðtc � tiÞ þ φÞ ð4Þ
for the given nonlinear tc, ω, φ, α are linear parameters. In addition, A, B, and C can be
obtained through the OLS method as follows:
PNi¼1yi
PNi¼1yifi
PNi¼1yigi
0
BB@
1
CCA ¼
NPN
i¼1fi
PNi¼1gi
PNi¼1fi
PNi¼1fi
2 PNi¼1figi
PNi¼1gi
PNi¼1figi
PNi¼1gi2
0
BB@
1
CCA
A
B
C
0
B@
1
CA ð5Þ
where N is the number of timestamps. Changing the form of Eq (5) produces the following:
A
B
C
0
B@
1
CA ¼
NPN
i¼1fi
PNi¼1gi
PNi¼1fi
PNi¼1fi
2 PNi¼1figi
PNi¼1gi
PNi¼1figi
PNi¼1gi2
0
BB@
1
CCA
� 1 PNi¼1yi
PNi¼1yifi
PNi¼1yigi
0
BB@
1
CCA ð6Þ
After reaching this step, only four free parameters remain to be determined. However, the
optimization of the best value of the nonlinear parameters is challenging owing to its complex-
ity. Based on previous research, MPGAWE derived from the SGA is applied to the solution.
The next section provides details of the MPGAWE model.
MPGAWE for non-linear parameter optimization
As discussed above, the solution of the nonlinear parameters to the LPPL model is an NP-hard
problem. As far as can be determined, the genetic algorithm is one of the most popular meth-
ods used to solve the NP-hard problem. The MPGAWE model surpasses the ordinary genetic
PLOS ONE Predicting the turning points of housing prices
PLOS ONE | https://doi.org/10.1371/journal.pone.0232478 April 29, 2020 5 / 20

algorithm by establishing a multi-population framework and introducing the migration mech-
anism and elitism, which increases the precision of the prediction and the speed of the
convergence.
The MPGAWE procedure can be divided into representation, initialization, selection,
crossover, mutation, reinsertion, and migration operators.
(1) Representation. In this study, each individual consists of four nonlinear parameters of
the LPPL model (tc, ω, φ, α). Binary coding is used for each parameter because it is a user-
friendly coding technique that can alter the precision with a suitable length. The original
parameters are encoded into binary genes and chromosomes are formed with the genes
stacked up such that a fixed number of genes represent the actual value of the parameter and
all genes in the individual represent a series of nonlinear parameters. An example of an indi-
vidual is shown in Fig 1.
(2) Fitness. The fitness is of significant importance in the genetic algorithm, reflecting the
performance of each individual. In this study, the fitness value of an individual is simply deter-
mined as the sum of the squared residuals (SSR). This indicator is widely used to assess the
error between the estimated value and the true value. The fitness in the MPGAWE is described
as follows:
fm;n ¼PN
i¼1fyi � A � Bðtc
m;n � tiÞam;n� Cðtc
m;n � tiÞam;ncosðom;nlnðtc
m;n � tiÞ þ φm;nÞg
2
ð7Þ
where fm,n, tcm,n, αm,n, ωm,n, and φm,n are the fitness values and four nonlinear parameters of
the LPPL corresponding to the n-th individual in the m-th population. Thus, for each genera-
tion, the fitness of every individual can be calculated using the given nonlinear parameters.
(3) Initialization. It has already been proven that the results from the genetic algorithm
do not significantly rely on the initialization; thus, to simplify the method, a random initializa-
tion is adopted in this study. During the initialization step, all populations with a certain num-
ber of individuals are generated by randomly selecting 0 or 1 for each gene. The number of
genes can be computed as follows:
Ngene ¼ Np � Sp � Lc ð8Þ
where Np is the number of population, Sp is the size of population and Lc is the length of the
chromosomes.
(4) Selection. The selection operator depends on the fitness values of the individuals, and
there are two parts of individuals to be chosen with the same individual number. The first part
is called the elites with a fixed small number, eliteSize, made up of the best individuals within
the population, which proceed straight to the next generation. With the elitismmechanism,
the best individuals in each generation are protected to guarantee that the fitness of the next
generation will not be at risk. The second part is the basis for subsequent operations; and is
Fig 1. Representation for an individual.
https://doi.org/10.1371/journal.pone.0232478.g001
PLOS ONE Predicting the turning points of housing prices
PLOS ONE | https://doi.org/10.1371/journal.pone.0232478 April 29, 2020 6 / 20

selected via classical roulette selection with the following probability:
Pi ¼1
fiPNj¼1
1
fj
ð9Þ
where Pi and fi represent the probability to be selected and the fitness value of individual i,respectively.
(5) Crossover. Uniform crossover is used in this step. For the ordinary selected individuals,
we pair them two by two as a set of parents, meaning that eliteSize should be designed to keep
the residual individuals even. With the given probabilities Pc in different populations and a
random value, each pair of genes from the selected parents can be selected for swapping (see
Fig 2).
(6) Mutation. Following the laws of natural reproduction, we design the mutation opera-
tor using a random selection method. By assigning a small mutation probability Pmu, the gene
of the individual is selected for the mutation if a number Ptemp randomly chosen between 0
and 1, is smaller than Pmu. The offspring are generated by mutating the genes through 0 to 1 or
through 1 to 0 (see Fig 3).
(7) Reinsertion. At the beginning of the reproduction, the selected individuals are divided
into elites and others. Thus, we reinsert the elites into the candidates generated by the selection,
crossover, and mutation to form a new generation. Simultaneously, the fitness values of indi-
viduals need to be recomputed, and the individuals with the best performance in each popula-
tion and all chromosomes are recorded.
Fig 2. Uniform crossover based on selected parents.
https://doi.org/10.1371/journal.pone.0232478.g002
Fig 3. Mutation operator with a small probability.
https://doi.org/10.1371/journal.pone.0232478.g003
PLOS ONE Predicting the turning points of housing prices
PLOS ONE | https://doi.org/10.1371/journal.pone.0232478 April 29, 2020 7 / 20
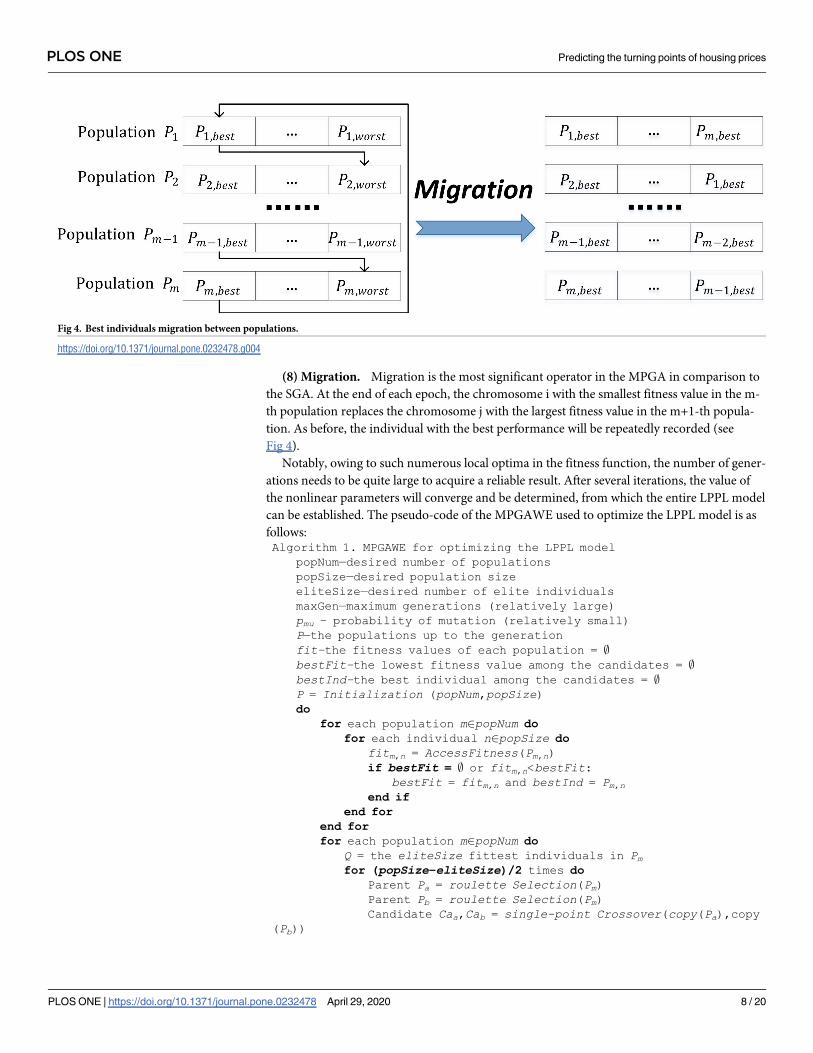
(8) Migration. Migration is the most significant operator in the MPGA in comparison to
the SGA. At the end of each epoch, the chromosome i with the smallest fitness value in the m-
th population replaces the chromosome j with the largest fitness value in the m+1-th popula-
tion. As before, the individual with the best performance will be repeatedly recorded (see
Fig 4).
Notably, owing to such numerous local optima in the fitness function, the number of gener-
ations needs to be quite large to acquire a reliable result. After several iterations, the value of
the nonlinear parameters will converge and be determined, from which the entire LPPL model
can be established. The pseudo-code of the MPGAWE used to optimize the LPPL model is as
follows:Algorithm 1. MPGAWE for optimizing the LPPL model
popNum—desired number of populationspopSize—desired population sizeeliteSize—desired number of elite individualsmaxGen—maximum generations (relatively large)pmu – probability of mutation (relatively small)P—the populations up to the generationfit–the fitness values of each population = ;bestFit–the lowest fitness value among the candidates = ;bestInd–the best individual among the candidates = ;P = Initialization (popNum,popSize)do
for each population m2popNum dofor each individual n2popSize do
fitm,n = AccessFitness(Pm,n)if bestFit = ; or fitm,n<bestFit:
bestFit = fitm,n and bestInd = Pm,nend if
end forend forfor each population m2popNum do
Q = the eliteSize fittest individuals in Pmfor (popSize−eliteSize)/2 times do
Parent Pa = roulette Selection(Pm)Parent Pb = roulette Selection(Pm)Candidate Caa,Cab = single-point Crossover(copy(Pa),copy
(Pb))
Fig 4. Best individuals migration between populations.
https://doi.org/10.1371/journal.pone.0232478.g004
PLOS ONE Predicting the turning points of housing prices
PLOS ONE | https://doi.org/10.1371/journal.pone.0232478 April 29, 2020 8 / 20
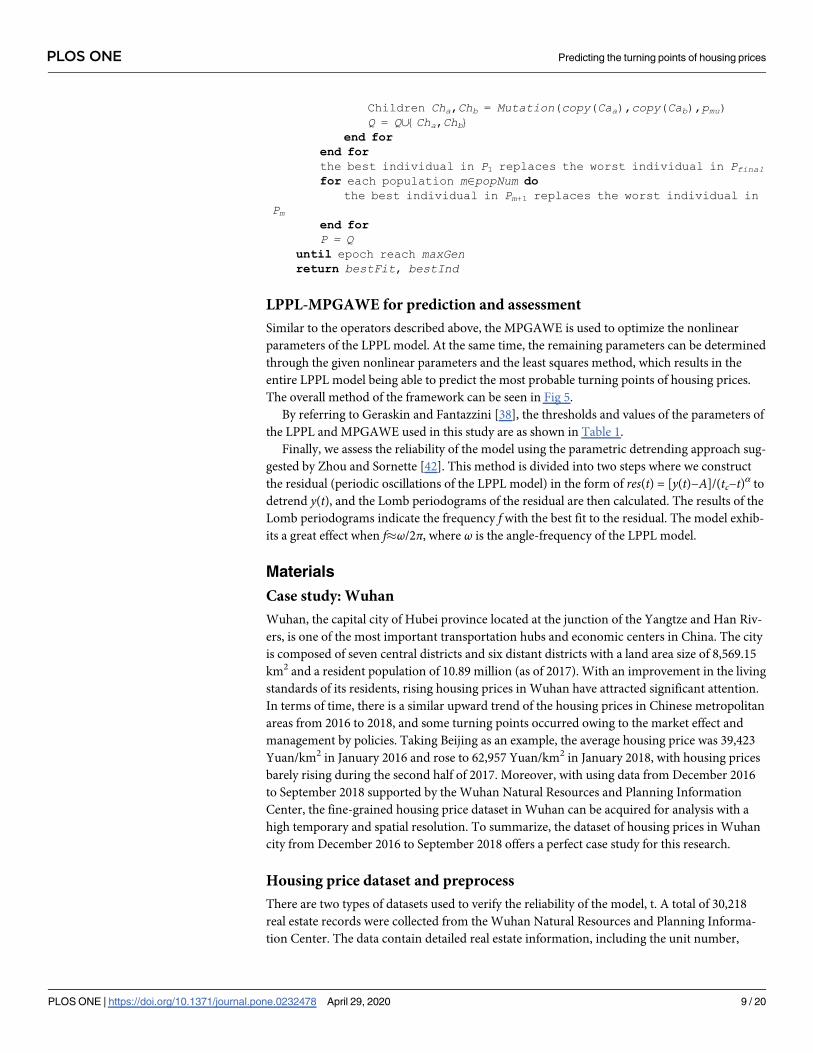
Children Cha,Chb = Mutation(copy(Caa),copy(Cab),pmu)Q = Q[{Cha,Chb}
end forend forthe best individual in P1 replaces the worst individual in Pfinalfor each population m2popNum do
the best individual in Pm+1 replaces the worst individual inPm
end forP = Q
until epoch reach maxGenreturn bestFit, bestInd
LPPL-MPGAWE for prediction and assessment
Similar to the operators described above, the MPGAWE is used to optimize the nonlinear
parameters of the LPPL model. At the same time, the remaining parameters can be determined
through the given nonlinear parameters and the least squares method, which results in the
entire LPPL model being able to predict the most probable turning points of housing prices.
The overall method of the framework can be seen in Fig 5.
By referring to Geraskin and Fantazzini [38], the thresholds and values of the parameters of
the LPPL and MPGAWE used in this study are as shown in Table 1.
Finally, we assess the reliability of the model using the parametric detrending approach sug-
gested by Zhou and Sornette [42]. This method is divided into two steps where we construct
the residual (periodic oscillations of the LPPL model) in the form of res(t) = [y(t)−A]/(tc−t)α to
detrend y(t), and the Lomb periodograms of the residual are then calculated. The results of the
Lomb periodograms indicate the frequency f with the best fit to the residual. The model exhib-
its a great effect when f�ω/2π, where ω is the angle-frequency of the LPPL model.
Materials
Case study: Wuhan
Wuhan, the capital city of Hubei province located at the junction of the Yangtze and Han Riv-
ers, is one of the most important transportation hubs and economic centers in China. The city
is composed of seven central districts and six distant districts with a land area size of 8,569.15
km2 and a resident population of 10.89 million (as of 2017). With an improvement in the living
standards of its residents, rising housing prices in Wuhan have attracted significant attention.
In terms of time, there is a similar upward trend of the housing prices in Chinese metropolitan
areas from 2016 to 2018, and some turning points occurred owing to the market effect and
management by policies. Taking Beijing as an example, the average housing price was 39,423
Yuan/km2 in January 2016 and rose to 62,957 Yuan/km2 in January 2018, with housing prices
barely rising during the second half of 2017. Moreover, with using data from December 2016
to September 2018 supported by the Wuhan Natural Resources and Planning Information
Center, the fine-grained housing price dataset in Wuhan can be acquired for analysis with a
high temporary and spatial resolution. To summarize, the dataset of housing prices in Wuhan
city from December 2016 to September 2018 offers a perfect case study for this research.
Housing price dataset and preprocess
There are two types of datasets used to verify the reliability of the model, t. A total of 30,218
real estate records were collected from the Wuhan Natural Resources and Planning Informa-
tion Center. The data contain detailed real estate information, including the unit number,
PLOS ONE Predicting the turning points of housing prices
PLOS ONE | https://doi.org/10.1371/journal.pone.0232478 April 29, 2020 9 / 20

location, ownership, and transfer time of the property. However, the transaction values in
some records are missing. To solve this problem, we collected housing price data from the
Anjuke website (https://wuhan.anjuke.com), which includes information from 4,702 residen-
tial districts around the Wuhan area (shown in S1 Table).
Fig 5. Flowchart of LPPL-MPGAWE.
https://doi.org/10.1371/journal.pone.0232478.g005
PLOS ONE Predicting the turning points of housing prices
PLOS ONE | https://doi.org/10.1371/journal.pone.0232478 April 29, 2020 10 / 20

During the preprocessing stage, the housing price data were combined with real estate
information through place name address matching and spatial location matching, which
completely fills in the gaps in the real estate records. Then, the data were washed by deleting
the redundant records and removing the holiday statistics because the records on weekends
are far fewer in number than those on the weekdays. Anomaly detection according to the
three-sigma principle is conducted, and the abnormal records are removed. We use a 20-day
moving time window to calculate the average values of the data as a sample because the hous-
ing prices should change smoothly within a few days, avoiding drastic fluctuations caused by
noise and the differences from individual transaction records. For analysis at different spatial
scales, the data are divided based on the administrative district and the time series created for
the different areas.
Selection of turning points and training samples
Based on the raw dataset, the turning points in the time series need to be determined, and the
corresponding samples need to be selected for training. A turning point is the critical time of a
peak in a bubble at which a crash begins. Unlike in the stock market, the fluctuations in the
housing prices are always gentle and smooth. Thus, when considering the characteristics of the
housing price dataset and the reference standards in [43] and [44], we identified a turning
point as follows: (1) 180 weekdays prior to the turning point for which there is no housing
price higher than the peak, and (2) a drop in housing prices of 4% within a period of 45 week-
days after the turning point. Based on these criteria, three turning points (peaks) on August 21
and 22 and December 13, 2017 in the Jiang’an (case 1), Qiaokou (case 2), and Qingshan (case
3) districts are identified respectively (as shown in Fig 6). The data on the housing prices for
the experiment are presented in S2–S4 Tables, which are clipped from January 2017 to Febru-
ary 2018 because there no significant turning points in the remaining part. The selection of the
training samples needs to be noted, we designed the time window for the training samples by
referring to previous studies [43, 45–46] when considering that the period of the data is lim-
ited: (1) Because the time of the previous crash is difficult to acquire, the lowest point since the
start of the dataset is regard as the beginning of the time window; (2) To reserve a period of
data for prediction, the last day of the month two months prior to the turning point is regarded
as the endpoint of the time window (e.g., the turning point is May 15 and the endpoint is
March 31). (3) It was confirmed that the period of the training set is longer than 120 weekdays,
and there is no sharp downturn in this set. Finally, data from January 13 to June 30, 2017 in
case 1, February 4 to June 30, 2017 in case 2, and January 17 to October 30, 2017 in case 3 were
chosen for the modeling in the three districts, respectively.
Table 1. Parameter values and thresholds used in the experiments.
Parameter Threshold/Value
tc (0,60] (two months after the last historical day)
ω [6,15]
φ (0,2 π)
α [0.1,0.9]
popNum 5
popSize 20
eliteSize 4
maxGen 1000
pc [0.4,0.6]
pm [0.05,0.1]
https://doi.org/10.1371/journal.pone.0232478.t001
PLOS ONE Predicting the turning points of housing prices
PLOS ONE | https://doi.org/10.1371/journal.pone.0232478 April 29, 2020 11 / 20

Results and analysis
This section presents an evaluation of the housing prices in Wuhan during December 2016
and October 2018. Based on the three cases selected from the overall dataset, we demonstrate
the reliability and effectiveness of the proposed model through a comparison with the LPPL
model improved using the two other heuristic algorithms.
Results of LPPL-MPGAWE
Because the fitness function of the MPGAWE algorithm has multiple location minimums, we
repeat the models ten times for the data of each region and select the parameters with the low-
est costs. Fig 7 shows the results of the LPPL-MPGAWE model with data from the three dis-
tricts. The red lines are split to represent the splitting of the sample data, and the green lines
are the timestamps of the turning points for each repeated test. In case 1, the turning point was
focused on August 17, 2017, and in case 2 and case 3, the turning point was concentrated on
August 20 and December 20, 2017, respectively. Clearly, although the LPPL-MPGAWE
method is built using no theory-driven factors, the results converge at the real turning points
with slight fluctuations, and the model is stable.
The parameters of the LPPL model with the lowest SSR values are shown in Table 2. There
is a small gap between ω calculated by the Lomb periodograms and ω calculated using the
MPGAWE, which is caused by the short sampling period, and fewer complete fluctuation
cycles are detected. The results are consistent with the conclusion that the parameter is most
readily optimized when ω�6.36±1.56, and another angle-frequency occurs at approximately
ω�11.5 for a few cases, presented as the “second harmonics”, which was proven through
numerous experiments conducted by Johansen [47].
Fig 6. Original time series of housing prices in the study areas.
https://doi.org/10.1371/journal.pone.0232478.g006
PLOS ONE Predicting the turning points of housing prices
PLOS ONE | https://doi.org/10.1371/journal.pone.0232478 April 29, 2020 12 / 20

PLOS ONE Predicting the turning points of housing prices
PLOS ONE | https://doi.org/10.1371/journal.pone.0232478 April 29, 2020 13 / 20

The α parameter is used to describe a faster-than-exponential growth of the housing price,
and it is worth noting that α obtained from the method nearly reached the upper limit (0.9) for
the three cases, which is almost pathologic. Thus, an exponential growth analysis is applied to
fit the samples for all cases. In general, a faster-than-exponential growth is identified by a
strong upward trend in the curves, whereas in Fig 8, the curves tend to be straight lines with a
slight upward curvature. Owing to the characteristics of the faster-than-exponential growth,
which are difficult to identify, the model nearly degenerates into a linear form without expo-
nential growth, and the α parameter also nearly reaches the upper limit.
Comparison among LPPL-MPGAWE, LPPL-SGA, and LPPL-SA methods
To further demonstrate the ability of LPPL-MPGAWE for predicting the turning points of the
housing prices, the method is compared with the LPPL improved by the SA and SGA methods,
and each type of model is established based on the optimal parameters for the three cases,
respectively. The results of the forecasting using the three methods are shown in Fig 9. In the
figure, the blue curve is the original time series of the housing prices, and the vertical black line
indicates the real date of the turning point. The green lines indicate the turning points as pre-
dicted by the LPPL model improved with the MPGAWE, whereas the red lines and blue lines
represent the results of the LPPL model improved with the SGA and SA, respectively. The
results indicate that in all three cases, the predictions generated by LPPL-MPGAWE are closest
to the actual dates of the turning points among the three methods. Notably, the results of
LPPL-SA deviate relatively from the real value of the turning point in case 1 (beyond one
week). Although the LPPL-SGA has a great ability to forecast, it is not a patch on the
LPPL-MPGAWE because it is prone to local optimization, for which a large number of tests
need to be carried out before obtaining a good result. Table 3 shows the values of the SSR of all
algorithms for the three cases and suggests that LPPL-MPGAWE performs best at predictions
with the lowest cost under almost every scenario. To summarize, MPGAWE is superior to the
other two heuristic algorithms when optimizing the parameters of the LPPL model and is
available for turning point predictions.
Temporal analysis with policies
Overall housing prices in Wuhan have been rising consistently since October 2016, with some
areas showing a downtrend. As described above, there were two major turning points in
August 2017 and December 2017 in some districts in Wuhan (as shown in Fig 6). To a certain
degree, the housing price fluctuations are driven by policies macroscopically regulated by the
government. Therefore, two significant points need to be noted at the time of the turning
points. From the end of 2016 to April of 2017, the average mortgage rate in Wuhan was below
4.5%. With the government controlling the rocketing housing prices economically, the average
Fig 7. Repeated tests of LPPL-MPGAWE for three cases. (a) Results for the Jiang’an district (case 1). (b) Results for
the Qiaokou district (case 2). (c) Results for the Qingshan district (case 3).
https://doi.org/10.1371/journal.pone.0232478.g007
Table 2. Parameters of the LPPL model fits for three cases.
Case A B C tc ω φ α ωLomb treal1 22036.18 -33.18 -1.64 2017-08-17 11.3 5.12 0.89 12.0 2017-08-21
2 19723.53 -38.87 1.43 2017-08-23 7.5 5.26 0.88 6.5 2017-08-22
3 18445.05 -38.56 -1.90 2017-12-18 7.4 5.20 0.90 6.5 2017-12-13
https://doi.org/10.1371/journal.pone.0232478.t002
PLOS ONE Predicting the turning points of housing prices
PLOS ONE | https://doi.org/10.1371/journal.pone.0232478 April 29, 2020 14 / 20

mortgage rate continued to rise, and a qualitative change took place in July 2017 when the rate
exceeded 5%. As a result, the high average mortgage rate limited the consumption-ability of
home buyers and inflated the housing prices observably within in a few months, generating
the turning points in August 2017. More importantly, on October 18, 2017, the 19th CPC
National Congress clearly stated that “Houses are used for living, but not for speculation”,
after which, the government departments at all levels positively responded to this declaration.
Specifically, the Department of Housing and Urban-Rural Development of Hubei Province
introduced a policy of “Notice on the implementation of real estate market regulation and con-
trol due to urban conditions” on November 20, emphasizing rational management of the real
estate market to deal with price gouging and deliberate housing market types strictly. Under
the high pressure of such regulations by the government, the rising trend in the housing prices
was restrained, leading to a turning point in December 2017. In general, policies of regulation
and management are relatively effective for controlling housing prices in a period of time,
resulting in the stable development of the real estate market. However, because the impacts of
such policies are time-sensitive and the comprehensive market reasons for rising housing
prices remain, the housing prices in some areas have risen again.
Conclusion and discussion
In this study, a novel framework called LPPL-MPGAWE was applied by incorporating a finan-
cial expectation model and a reliable heuristic algorithm to forecast the turning points of the
real estate market accurately. The study results show an improvement with the proposed
method in two aspects. (1) By combining the mechanism of multiple populations and elitism
with a genetic algorithm, we developed the MPGAWE model to determine the optimal nonlin-
ear parameters of the LPPL model. The MPGAWE is effective for dealing with complex non-
linear problems, and it has advantages that the result does not rely on the initial values, and the
Fig 8. Exponential growth analysis with three case samples.
https://doi.org/10.1371/journal.pone.0232478.g008
PLOS ONE Predicting the turning points of housing prices
PLOS ONE | https://doi.org/10.1371/journal.pone.0232478 April 29, 2020 15 / 20

PLOS ONE Predicting the turning points of housing prices
PLOS ONE | https://doi.org/10.1371/journal.pone.0232478 April 29, 2020 16 / 20

convergence of the optimizing parameters is guaranteed. (2) The LPPL model was built
through historical information without any external theory-driven variables for predicting the
turning points of housing prices, and achieves a high interpretability of the turning point
because the turning point corresponds to the parameter in the model.
With the case study conducted in Wuhan city, the LPPL-MPGAWE model performs well
in the forecasting of three cases with a lower SSR than the LPPL-SA and LPPL-SGA models.
The proposed method also has a significant potential of predicting the turning points of hous-
ing prices in other cities that have a similar trending fluctuation in the time series. Besides, the
LPPL model is also a state-of-the-art method applicable to the forecasting of the time series
with soaring bubbles in other fields, such as the stock market, the oil market, and commodity
prices. In the application of these fields, the LPPL improved with MPGAWE can obtain precise
optimal parameters and increase the accuracy of the prediction.
Although the LPPL-MPGAWE model seems suitable for prediction, it also has some obvi-
ous limitations. The simple form of the LPPL model has difficulty describing the real estate
market in China because it only considers stimulating the trader behavior in the market,
which ignores the influence of government policies. Although the LPPL model has been
proven to be robust using sampling data with different time windows [42], there are still cer-
tain additional data requirements when the model is applied, namely, the relatively long period
of the samples for modeling, which means it is quite difficult to achieve a real-time prediction.
The parameters of the LPPL-MPGAWE model have slight gaps with the results of the Lomb
periodograms, which are caused by insufficient sample data, indicating that the period of the
sample data also influences the accuracy of the prediction.
In future studies, we will consider the impact of policies for improving the model. We will
further employ the model to forecast the turning points of housing prices in other cities and
even other markets to verify its broad applicability. Finally, the method can be used to help
local governments manage the real estate markets, promoting the steady development of the
real estate market. At the same time, home buyers will be able to acquire valuable advice
through the proposed method.
Supporting information
S1 Table. Raw housing price data in Wuhan from the website https://wuhan.anjuke.com.
(XLSX)
S2 Table. Data of housing prices in Jiang’an district for case 1.
(XLSX)
Fig 9. Results of the turning point predictions with different algorithms for the three cases. (a) Comparison of the
three algorithms with the samples from Jiang’an district (case 1). (b) Comparison of the three algorithms with the samples
from the Qiaokou district (case 2). (c) Comparison of the three algorithms with the samples from the Qingshan district
(case 3).
https://doi.org/10.1371/journal.pone.0232478.g009
Table 3. Comparison of the sum of the squared residuals (SSR) among the three algorithms.
Case MPGAWE SGA SA
1 434294.8 418042.5 440603.5
2 309074.5 310687.7 415107.5
3 4169220.7 4186114.7 5582987.5
https://doi.org/10.1371/journal.pone.0232478.t003
PLOS ONE Predicting the turning points of housing prices
PLOS ONE | https://doi.org/10.1371/journal.pone.0232478 April 29, 2020 17 / 20

S3 Table. Data of housing prices in Qiaokou district for case 2.
(XLSX)
S4 Table. Data of housing prices in Qingshan district for case 3.
(XLSX)
Acknowledgments
The authors wish to thank Xiaokang Fu, Mengling Qiao, Mingxuan Dou, Shuhan Liu, Peiqi
Zhang, Weihao Wang for helpful discussions and comments.
Author Contributions
Conceptualization: Shihai Dong, Yandong Wang, Yanyan Gu.
Data curation: Shiwei Shao, Hui Liu, Shanmei Wu.
Funding acquisition: Yandong Wang.
Investigation: Shihai Dong, Yanyan Gu.
Methodology: Shihai Dong, Yandong Wang, Yanyan Gu.
Supervision: Yandong Wang, Shiwei Shao, Hui Liu.
Validation: Shihai Dong.
Visualization: Shihai Dong, Shanmei Wu, Mengmeng Li.
Writing – original draft: Shihai Dong, Yandong Wang.
Writing – review & editing: Shihai Dong.
References1. Wei S, Zhang X, Liu Y. Home ownership as status competition: Some theory and evidence. J Dev
Econ. 2017; 127:169–86. https://doi.org/10.1016/j.jdeveco.2016.12.001
2. Zhou W, Sornette D. Is there a real-estate bubble in the US? Physica A: Statistical Mechanics and its
Applications. 2006; 361(1):297–308. https://doi.org/10.1016/j.physa.2005.06.098
3. Yiu MS, Yu J, Jin L. Detecting bubbles in Hong Kong residential property market. J Asian Econ. 2013;
28:115–24. https://doi.org/10.1016/j.asieco.2013.04.005
4. Vishwakarma VK. Forecasting real estate business: empirical evidence from the Canadian market.
Global Journal of Business Research. 2013; 7(3):1–14. Available from: https://ssrn.com/abstract=
2148507
5. Tan J, Cheong SA. The Regime Shift Associated with the 2004–2008 US Housing Market Bubble.
PLoS ONE. 2016; 11(9):e162140. https://doi.org/10.1371/journal.pone.0162140
6. Ahuja A, Cheung L, Han G, Porter N, Zhang W. Are House Prices Rising Too Fast in China? IMF work-
ing papers; 2010.
7. Liu Y, Yue W, Fan P, Song Y. Suburban residential development in the era of market-oriented land
reform: The case of Hangzhou, China. Land use policy. 2015; 42:233–43. https://doi.org/10.1016/j.
landusepol.2014.08.004
8. Chen J, Guo F, Wu Y. One decade of urban housing reform in China: Urban housing price dynamics
and the role of migration and urbanization, 1995–2005. Habitat Int. 2011; 35(1):1–8. https://doi.org/10.
1016/j.habitatint.2010.02.003
9. Timberlake M, Wei YD, Ma X, Hao J. Global cities with Chinese characteristics. Cities. 2014; 41:162–
70. https://doi.org/10.1016/j.cities.2014.02.009
10. Wen H, Goodman AC. Relationship between urban land price and housing price: Evidence from 21 pro-
vincial capitals in China. Habitat Int. 2013; 40:9–17. https://doi.org/10.1016/j.habitatint.2013.01.004
11. Du Z, Zhang L. Home-purchase restriction, property tax and housing price in China: A counterfactual
analysis. J Econometrics. 2015; 188(2):558–68. https://doi.org/10.1016/j.jeconom.2015.03.018
PLOS ONE Predicting the turning points of housing prices
PLOS ONE | https://doi.org/10.1371/journal.pone.0232478 April 29, 2020 18 / 20

12. Li H, Wei YD, Wu Y, Tian G. Analyzing housing prices in Shanghai with open data: Amenity, accessibil-
ity and urban structure. Cities. 2019; 91:165–79. https://doi.org/10.1016/j.cities.2018.11.016
13. Steentoft AA, Poorthuis A, Lee B, Schlapfer M. The canary in the city: indicator groups as predictors of
local rent increases. EPJ Data Sci. 2018; 7(1):21. 10.1140/epjds/s13688-018-0151-y
14. Park B, Bae JK. Using machine learning algorithms for housing price prediction: The case of Fairfax
County, Virginia housing data. Expert Syst Appl. 2015; 42(6):2928–34. https://doi.org/10.1016/j.eswa.
2014.11.040
15. Sarip AG, Hafez MB, Daud M. Application of Fuzzy Regression Model for Real Estate Price Prediction.
Malays J Comput Sci. 2016; 29:15–27. https://doi.org/10.22452/mjcs.vol29no1.2
16. Crawford GW, Fratantoni MC. Assessing the Forecasting Performance of Regime-Switching, ARIMA
and GARCH Models of House Prices. Real Estate Econ. 2003; 31(2):223–43. https://doi.org/10.1111/
1540-6229.00064
17. Zietz J, Traian A. When was the U.S. housing downturn predictable? A comparison of univariate fore-
casting methods. Q Rev Econ Finance. 2014; 54(2):271–81. https://doi.org/10.1016/j.qref.2013.12.004
18. Rapach DE, Strauss JK. Differences in housing price forecastability across US states. Int J Forecasting.
2009; 25(2):351–72. https://doi.org/10.1016/j.ijforecast.2009.01.009
19. Gupta R, Kabundi A, Miller SM. Forecasting the US real house price index: Structural and non-structural
models with and without fundamentals. Econ Model. 2011; 28(4):2013–21. https://doi.org/10.1016/j.
econmod.2011.04.005
20. Larson W. Evaluating Alternative Methods of Forecasting House Prices: A Post-Crisis Reassessment.
SSRN Electronic Journal. https://doi.org/10.2139/ssrn.1709647
21. Morini M, Pellegrino S. Personal income tax reforms: A genetic algorithm approach. Eur J Oper Res.
2018; 264(3):994–1004. https://doi.org/10.1016/j.ejor.2016.07.059
22. Holland JH. Adaptation in natural and artificial systems: an introductory analysis with applications to
biology, control, and artificial intelligence: MIT press; 1992.
23. Kirkpatrick S. Optimization by simulated annealing: Quantitative studies. J Stat Phys. 1984; 34(5):975–
86. https://doi.org/10.1007/BF01009452
24. Rousova L, Noord PVD. Predicting Peaks and Troughs in Real House Prices. 2011. OECD Economics
Department Working Papers, No. 882, OECD Publishing, Paris. http://dx.doi.org/10.1787/
5kg89j38k17c-en
25. Miles W. Boom–Bust Cycles and the Forecasting Performance of Linear and Non-Linear Models of
House Prices. The Journal of Real Estate Finance and Economics. 2008; 36(3):249–64. https://doi.org/
10.1007/s11146-007-9067-1
26. Croce RM, Haurin DR. Predicting turning points in the housing market. J Hous Econ. 2009; 18(4):281–
93. https://doi.org/10.1016/j.jhe.2009.09.001
27. Gupta R, Zita S. Modeling and Forecasting the Metical-Rand Exchange Rate. The IUP Journal of Mone-
tary Economics. 2008; VI:63–90. http://hdl.handle.net/2263/4408
28. Banerji A, Dua P, Miller S. Performance Evaluation of the New Connecticut Leading Employment Index
Using Lead Profiles and BVAR Models. J Forecasting. 2006; 25:415–37. https://doi.org/10.1002/for.
996
29. Gupta R, Das S. Spatial Bayesian Methods of Forecasting House Prices in Six Metropolitan Areas of
South Africa. S Afr J Econ. 2008; 76(2):298–313. https://doi.org/10.1111/j.1813-6982.2008.00191.x
30. Iacoviello M, Neri S. Housing Market Spillovers: Evidence from an Estimated DSGE Model. Am Econ J
Macroecon. 2008; 2. https://doi.org/10.2139/ssrn.1105750
31. Ng ECY. Housing market dynamics in China: Findings from an estimated DSGE model. J Hous Econ.
2015; 29:26–40. https://doi.org/10.1016/j.jhe.2015.05.003
32. Johansen A, Sornette D. Critical crashes. arXiv preprint cond-mat/9901035. 1999. Available from:
https://www.deepdyve.com/lp/arxiv-cornell-university/critical-crashes-LpApcUNLGd
33. Johansen A, Sornette D, Ledoit O. Predicting financial crashes using discrete scale invariance. J Risk.
1999; 1(4):5–32. https://doi.org/ 10.21314/JOR.1999.014
34. Johansen A, Ledoit O, Sornette D. Crashes as Critical Points. International Journal of Theoretical &
Applied Finance. 2000; 03(02):219–55
35. Jang H, Ahn K, Kim D, Song Y, ’’editors’. Detection and prediction of house price bubbles: Evidence
from a new city. International Conference on Computational Science;2018: Springer.
36. Hui EC, Liang C, Wang Z, Song B, Gu Q. Real estate bubbles in China: a tale of two cities. Construction
Management and Economics. 2012; 30(11):951–61. https://doi.org/10.1080/01446193.2012.714871
PLOS ONE Predicting the turning points of housing prices
PLOS ONE | https://doi.org/10.1371/journal.pone.0232478 April 29, 2020 19 / 20

37. Ardila D, Cauwels P, Sanadgol D, Sornette D. Is There A Real Estate Bubble in Switzerland?(diagnostic
as of 2012-Q4). Diagnostic as of. 2012: Q4. http://dx.doi.org/10.2139/ssrn.2237561
38. Geraskin P, Fantazzini D. Everything you always wanted to know about log-periodic power laws for bub-
ble modeling but were afraid to ask. The European Journal of Finance. 2013; 19(5):366–91. https://doi.
org/10.1080/1351847X.2011.601657
39. Filimonov V, Sornette D. A stable and robust calibration scheme of the log-periodic power law model.
Physica A: Statistical Mechanics and its Applications. 2013; 392(17):3698–707. https://doi.org/10.1016/
j.physa.2013.04.012
40. Jacobsson E. How to predict crashes in financial markets with the Log-Periodic Power Law. M.Sc. The-
sis, The Department of Mathematical Statistics, Stockholm University. 2009. Available from: https://
www.mendeley.com/catalogue/72ba8987-6cab-3bc5-b953-b34d21a87c69/
41. Sornette D, Woodard R, Yan W, Zhou W. Clarifications to questions and criticisms on the Johansen–
Ledoit–Sornette financial bubble model. Physica A: Statistical Mechanics and its Applications. 2013;
392(19):4417–28. https://doi.org/10.1016/j.physa.2013.05.011
42. Zhou W, Sornette D. A case study of speculative financial bubbles in the South African stock market
2003–2006. Physica A: Statistical Mechanics and its Applications. 2009; 388(6):869–80. https://doi.org/
10.1016/j.physa.2008.11.041
43. Bree DS, Joseph NL. Testing for financial crashes using the Log Periodic Power Law model. Int Rev
Financ Anal. 2013; 30:287–97. https://doi.org/10.1016/j.irfa.2013.05.005.
44. Dai B, Zhang F, Tarzia D, Ahn K. Forecasting Financial Crashes: Revisit to Log-Periodic Power Law.
Complexity. 2018; 2018:1–12. https://doi.org/10.1155/2018/4237471.
45. Jang H, Song Y, Sohn S, Ahn K. Real Estate Soars and Financial Crises: Recent Stories. Sustainability.
2018; 10:4559. https://doi.org/10.3390/su10124559.
46. Johansen A, Sornette D. Bubbles and Anti-Bubbles in Latin-American, Asian and Western Stock Mar-
kets: An Empirical Study. International Journal of Theoretical and Applied Finance. 2001; 04(06):853–
920. https://doi.org/10.1142/S0219024901001218.
47. Johansen A. Endogenous versus Exogenous Crashes in Financial Markets. Social Science Electronic
Publishing; 2002. Available from: http://dx.doi.org/10.2139/ssrn.344980
PLOS ONE Predicting the turning points of housing prices
PLOS ONE | https://doi.org/10.1371/journal.pone.0232478 April 29, 2020 20 / 20