Predict and Measure Air Quality Monitoring System Using ...
10
Turkish Journal of Computer and Mathematics Education Vol.12 No.2 (2021), 2562-2571 2562 Research Article Predict and Measure Air Quality Monitoring System Using Machine Learning D.Saravanan a , K.P.Hemalatha b , B. Jinitha c , Dr. K. Santhosh Kumar d , and P.Hemalatha e a Associate Professor1,Department of CSE, IFET College of Engineering,Villupuram, b Research Student, Department of CSE, IFET College of Engineering, Villupuram, c Research Student, Department of CSE, IFET College of Engineering, Villupuram, d Assistant Professor, Department of IT, Annamalai University, Chidambaram, e Senior Assistant Professor,Department of CSE, Annamalai University, Chidambaram, Article History: Received: 11 January 2021; Accepted: 27 February 2021; Published online: 5 April 2021 Abstract: This article looks at how artificial intelligence can help expect the hourly consolidation of air toxinSulphur ozone, element matter (PM2.5), and Sulphur dioxide. As one of the most excellently procedures, AI can efficiently prepare a model on a large amount of data by using large-scale streamlining computations. Even thoughseveral works use AI to predict air quality, most of the earlier studies are limited to long-term data and easilyinstruct regular relapse designs (direct or nonlinear) to expect the hourly air pollution focus. This paper suggestsadvanced analysis to simulate the hourly environmental change focus based on previous days' weather-related data by calculating the expectation for more than 24 hours as an execute multiple tasks learning (MTL) issue. This allows us to choose a suitable model with a variety of regularization strategies. We suggest a useful regularization that maintains the assumption patterns of concurrent hours to be nearby to each other, and we evaluate it to a few common MTL expect completion such as normal Frobenius standard regularization, normal atomicregularization, and '2,1-standard regularization. Our tests revealed that the suggested boundary declining concepts and constant hour-related regularizations outperform open product relapse models and regularizations in terms of execution. Keywords: air pollutant forecast, multi-task learning; regularization; analytical resolution 1. Introduction 1.1 General Summary Conferring to the World Health Organization [WHO], airborneeffluence is defined as the infection rates of the inside or outside climate by any biochemical and genetic agent that alters the environment's qualities. Air pollution and sound pollution are commonly caused by household fission devices, vehicles, and forest fires. Poisons, carbon monoxide, ozone, nitrogen dioxide, and sulfur dioxide are toxins that mess wellbeing up. Air contamination causes circulatory and different diseases, some of which are fatal. According to the WHO, the nature of air in approximately 1500 urban communities was estimated, and India's capital city was the most infected metropolitan area on the planet. The most notable centralized control of fine particulates less than 2.5 micrometers can be found in Delhi. Air contamination and the lack of air quality checking stations present environmental and imaginative challenges for helpless focuses and conditions around the world. To address this issue, the business has focused its endeavors on finding an adaptable mechanical choice that takes into consideration the improvement of the air quality foreseeing measure and gives character reference esteems in network areas where standard checking crashes. AP is one such uncomfortable reason for a human's govt assistance. As indicated by the 'World Health Organization,' the qualities of seven billion individuals are imperiled because of AP (WHO). It is the prevailing and fundamental reason for different ailments, including asthma, skin infections, heart issues, throat and eye issues, bronchitis, cell deterioration in the lungs, and respiratory diseases [1, 2, and 3]. Toxins, for example, sulfur dioxide (SO2), nitrogen dioxide (NO2), particulate matter (PM10 and PM2.5), lead (Pb), ozone (O3), and carbon monoxide are regularly answerable for the distinguished issue (CO). The transformation of such devices into actuality generates massive amounts of data, which is occasionally discussed. Deep Learning (DL) was born out of the idea of anticipating and trying to treat such data. The AI methods widely used to predict AQ are natural detox, support vector machine, neural organizations (NN), and arbitrarily defined timberland. However, few ways concentrate on implied toxin forecasting’s, like Ozone or PM2.5. Mathematical models are basic in AP control. The Ecological Research Institute and public power experts use standard AQ numerical models like WRF-Chem, Community Multi-scale AQ Model (CMAQ), CAMx, and NAQPMS to anticipate AQ. The transient data obtained from the tested vapor was analyzed some time ago to predict future qualities. Suggesting that the methodology has gained sufficient and that the violent attacks planned are invalid while anticipating, it is asserted to be the stable work. 2. Associated Work 2.1 IOT Based Air Pollution Monitoring Classification Authors: Riteeka Nayak. 1. , Malaya Ranjan Panigrahy The degree of toxicity has increased over time due tovarious factors such as population growth, increased vehicle use, industrial development, and urbanization, all of which have negative implications for individual economic success by heavily affecting the health of the populace exposed to it. To look at In this venture, we will make an IOT-Based Air Pollution Monitoring System in which we will show the air quality through a web laborer
-
Upload
khangminh22 -
Category
Documents
-
view
4 -
download
0
Transcript of Predict and Measure Air Quality Monitoring System Using ...

Turkish Journal of Computer and Mathematics Education Vol.12 No.2 (2021), 2562-2571
2562
Research Article
Predict and Measure Air Quality Monitoring System Using Machine Learning
D.Saravanan
a, K.P.Hemalatha
b, B. Jinitha
c , Dr. K. Santhosh Kumard, and P.Hemalathae
a Associate Professor1,Department of CSE, IFET College of Engineering,Villupuram, bResearch Student, Department of CSE, IFET College of Engineering, Villupuram, c
Research Student, Department of CSE, IFET College of Engineering, Villupuram, dAssistant Professor, Department of IT, Annamalai University, Chidambaram, eSenior Assistant Professor,Department of CSE, Annamalai University, Chidambaram,
Article History: Received: 11 January 2021; Accepted: 27 February 2021; Published online: 5 April 2021
Abstract: This article looks at how artificial intelligence can help expect the hourly consolidation of air toxinSulphur ozone, element matter (PM2.5), and Sulphur dioxide. As one of the most excellently procedures, AI can efficiently prepare a model on a large amount of data by using large-scale streamlining computations. Even thoughseveral works use AI to predict air
quality, most of the earlier studies are limited to long-term data and easilyinstruct regular relapse designs (direct or nonlinear)
to expect the hourly air pollution focus. This paper suggestsadvanced analysis to simulate the hourly environmental change focus based on previous days' weather-related data by calculating the expectation for more than 24 hours as an execute multiple tasks learning (MTL) issue. This allows us to choose a suitable model with a variety of regularization strategies. We suggest a useful regularization that maintains the assumption patterns of concurrent hours to be nearby to each other, and we evaluate it to a few common MTL expect completion such as normal Frobenius standard regularization, normal atomicregularization, and '2,1-standard regularization. Our tests revealed that the suggested boundary declining concepts and constant hour-related
regularizations outperform open product relapse models and regularizations in terms of execution.
Keywords: air pollutant forecast, multi-task learning; regularization; analytical resolution
1. Introduction
1.1 General Summary
Conferring to the World Health Organization [WHO], airborneeffluence is defined as the infection rates of
the inside or outside climate by any biochemical and genetic agent that alters the environment's qualities. Air
pollution and sound pollution are commonly caused by household fission devices, vehicles, and forest fires.
Poisons, carbon monoxide, ozone, nitrogen dioxide, and sulfur dioxide are toxins that mess wellbeing up. Air
contamination causes circulatory and different diseases, some of which are fatal. According to the WHO, the
nature of air in approximately 1500 urban communities was estimated, and India's capital city was the most
infected metropolitan area on the planet. The most notable centralized control of fine particulates less than 2.5
micrometers can be found in Delhi. Air contamination and the lack of air quality checking stations present
environmental and imaginative challenges for helpless focuses and conditions around the world. To address this
issue, the business has focused its endeavors on finding an adaptable mechanical choice that takes into
consideration the improvement of the air quality foreseeing measure and gives character reference esteems in
network areas where standard checking crashes.
AP is one such uncomfortable reason for a human's govt assistance. As indicated by the 'World Health
Organization,' the qualities of seven billion individuals are imperiled because of AP (WHO). It is the prevailing
and fundamental reason for different ailments, including asthma, skin infections, heart issues, throat and eye
issues, bronchitis, cell deterioration in the lungs, and respiratory diseases [1, 2, and 3]. Toxins, for example, sulfur
dioxide (SO2), nitrogen dioxide (NO2), particulate matter (PM10 and PM2.5), lead (Pb), ozone (O3), and carbon
monoxide are regularly answerable for the distinguished issue (CO).
The transformation of such devices into actuality generates massive amounts of data, which is occasionally
discussed. Deep Learning (DL) was born out of the idea of anticipating and trying to treat such data. The AI
methods widely used to predict AQ are natural detox, support vector machine, neural organizations (NN), and
arbitrarily defined timberland. However, few ways concentrate on implied toxin forecasting’s, like Ozone or
PM2.5. Mathematical models are basic in AP control. The Ecological Research Institute and public power experts
use standard AQ numerical models like WRF-Chem, Community Multi-scale AQ Model (CMAQ), CAMx, and
NAQPMS to anticipate AQ. The transient data obtained from the tested vapor was analyzed some time ago to
predict future qualities. Suggesting that the methodology has gained sufficient and that the violent attacks planned
are invalid while anticipating, it is asserted to be the stable work.
2. Associated Work
2.1 IOT Based Air Pollution Monitoring Classification
Authors: Riteeka Nayak. 1. , Malaya Ranjan Panigrahy
The degree of toxicity has increased over time due tovarious factors such as population growth, increased
vehicle use, industrial development, and urbanization, all of which have negative implications for individual
economic success by heavily affecting the health of the populace exposed to it. To look at In this venture, we will
make an IOT-Based Air Pollution Monitoring System in which we will show the air quality through a web laborer
Predict and Measure Air Quality Monitoring System Using Machine Learning
2563
and issue an admonition at whatever point the contamination levels fall under a specific edge, i.e., when there is
an adequate measure of dangerous gases obvious in general, like CO2, smoke, alcohol, benzene, and NH3. It will
show the air quality in PPM on the LCD and a site page to handily screen it. We utilized the MQ135 sensor,
which is the most ideal choice for observing air quality since it can recognize the most perilous gases and compute
their complete precisely. With this IoT project, you can look at the poisonousness level from anyplace utilizing
your PC or cell phone. We can introduce this framework anyplace and actuate some gadget when pollution arrives
at a specific level, for example, turning on the fumes fan or sending a prepared SMS/mail to the client.
2.2air and Audio Emissions Surveillance System Of Internet Of Things
Authors: Navreetinder Kaur,Rita Mahajan
The pollution of the air and sound is rapidly increasing. It is strongly advised that you observe it to manage
it. We propose a framework for determining the degree of sound and hazardous gases in environmental factors to
address this problem. High decibels or toxic chemicals present in the atmosphere harm human health and, as a
result, require special attention.
2.3 Arduino-Based IOT-Based Airborneeffluence Control System
The degree of toxicity has increased over time due topopulation growth, increased vehicle use,
industrialization, and urbanization, all of which negatively impact human prosperity by directly influencing the
strength of the populace exposed to it. To check out In this project, we will create an IOT-based Detection
Mechanism in where we will control the air quality through a web specialist and send a caution since when air
quality falls under a specific limit, i.e., when there is an adequate measure of hurtful gases obvious in general,
like CO2, smoke, alcohol, benzene, and NH3. It will show the air quality in PPM on the LCD and the landing
page so we can rapidly distinguish it. You can utilize your cell phone to screen the natural contamination in this
IoT project.
2.4 GSM-Based Classification for Real-Time Air Quality Monitoring
Authors: R.Sowmya, M.Premkumar
Air pollution observing is becoming a risingfear in the pitch of natural design. With competent assistance
from others, designing, for example, an installed system, it is easier to find appropriate answers for any problems
relating to doing something similar. We can decide the area and correspondence of different harmful concentrates
like nitrogen dioxide, sulfur dioxide, carbon monoxide, and carbon dioxide continuously utilizing air
contamination observing. A solitary chip microcontroller, an air contamination sensor bunch and a GPS module
make up the contamination observing framework facilitated and communicated by means of GSM Transceiver.
At long last, it genuinely shows through the PC - time perception.
2.5 Wireless Sensor Node-Based Gsm Air Quality Monitoring and Analysis
Authors: Afrah Mohammad
The keygoal of this project is to create a simple, low-effort air pollution detection organizationbuilt on a
microcontroller and remote technology that detects the presence of various gases such as CO2,SO,NO, and other
boundaries such as moisture, temperature, and so on, shows it on an LCD, and sends it to anisolated client. This
project uses a PIC 16F877A microcontroller, a SIM 900 GSM component, a JHD204A LCD show, and gas
devices. The improvement of utilizing GSM-based knowledgeremains that the GSM-based correspondence
system is spread across a hugeregion and has nearly reached all corners of the globe. GSM equipment also
provides clients with an excellent sign and channel s, allowing them to engage in excellent advanced
communication at a low price. This implanted framework can be useful for anyone who wants to monitor the air's
state in a location without actually staying there. The research's major benefits are that the system may gather
carbon emissions during the day and that the information collected may characterize as a central database that
could be used for various analyses as needed. The system may provide pollutant levels for a specific industry.
This prediction may guide the government in deciding whether or not to allow a particular sector to set up shop
in a given area.
3. System Analysis
3.1 Existing System
Accident CO-220 carbon monoxide meter for CO, Amprobe CO2 meter for CO2, and ForbixSemicon are a
portion of the area's promoting meters. Specialists have proposed various air quality estimation frameworks
dependent on WSN, GSM, and GIS. (Remote sensor organization) A remote sensor network is a specially
appointed stage that empowers a scope of remote sensors to deal with undertakings. WSN has the benefits of
adaptability and ease. GSM (Global System for Mobile Communication) is an electronic gadget for voice and
video transmission. To screen air contamination discharges in any area, a GIS (Geographic Information System)
based stage is fabricated, executed, and tried. The benefit is that any gadget can be administered from a significant
distance, and it is direct to fix in home. The fundamental detriment of GSM is that it is supplier predicated.
Presently, every method has restricted applications appropriate for the expected capacity; for instance, Zigbee
is planned, carried out, and tried to assess the blueprints of air quality in any territory, while GIS (Geographic
Information System) based arrangement is introduced, ordered, and confirmed to evaluate the underlines of air
quality in each room.
3.2 Disadvantages of Existing System
Network problem
Data View at time.
D.Saravanan a, K.P.Hemalatha b, B. Jinitha c , Dr. K. Santhosh Kumard, and P.Hemalathae
2564
3.3 Proposed System
In this proposal, we will create an IoT-based Detection Mechanism in which we will regulate the pollution
levels and over the internet via a web server and send out alerts.
Air pollution (AP) is a potent greenhouse gas. The AP level has been rising every day due tothe rising
population, numerous automobiles, mechanization, and urbanization. This has an impact on all humans who are
revealed to pollution. As a result, these authors introduce an IoT-centered AP monitoring and prediction system
using DLMN.
In smart cities, this method can identify harmful emissions on the roads, measure various AP types, and report
on the AP status. The SV of the IoT devices is initially used as the input. This AP monitoring system is put
through its paces in terms of preparation and assessment. In the training phase, the AQI data set's data values are
used to analyze the AP level.
During training, three distinct activities were carried out: Pre-processing, ii) Articlevariety, iii) Ordering, and
iv) Visualization Using a Machine Learning Approach, An IoT Based Monitoring And Air Pollutant Level
Prediction System Dlmnn
3.4 Benefits of The Proposed System
1) It's simple, compact, and simple to use.
2) Direct mobile phone updates
3) Accurate monitoring of pollution
4) Monitoring from a distance
5) Detecting Co2, Co.
6) It's simple, compact, and easy to use.
3.4 ADVANTAGES OF PROPOSED SYSTEM
1) Simple, compact &Simple to handle
2) Informson portablemobileimmediately
3) CorrectContaminationobserving
4) Isolatedplaceexamining
5) Detecting Co2, Co
6) Simple, compact & Easy to handle.
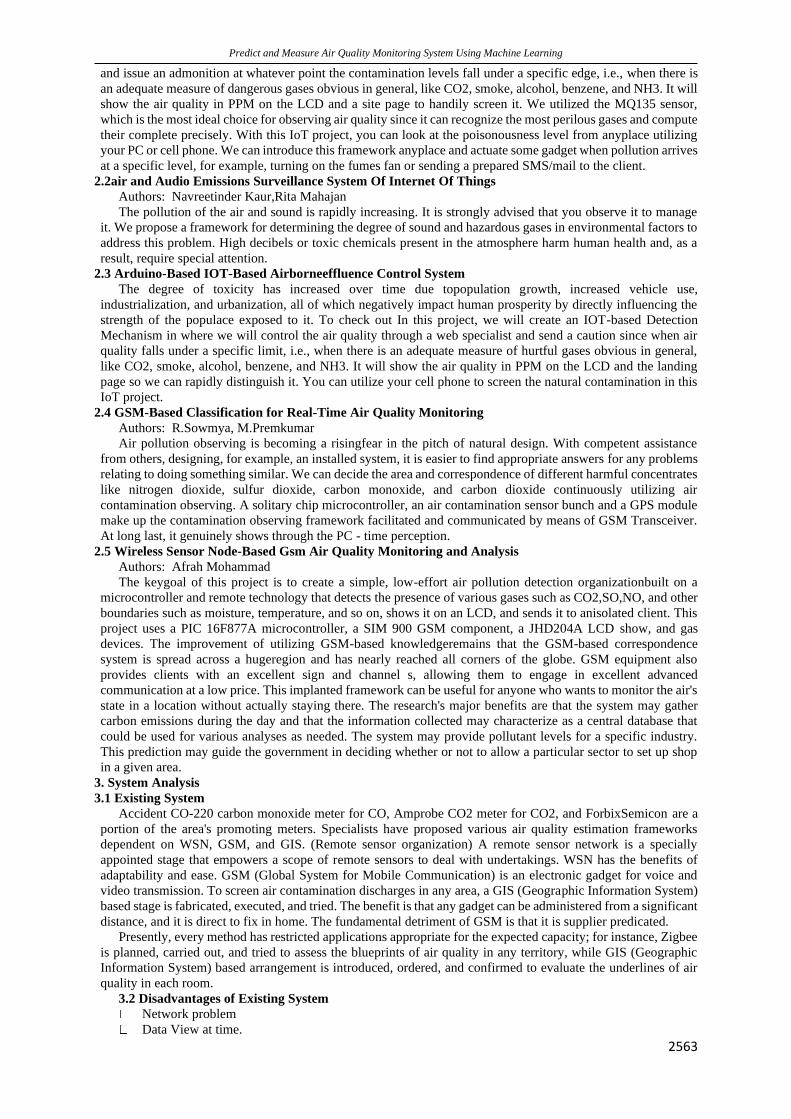
4. System Design.
Figure:4.1 System Architecture
4.2 Module Description
4.2.1. IOT Sensor Data:
Internal sensors obtain data from IoT smart devices like surveillance systems, smart TVs, and wireless
wearable monitors. Commercial security systems, traffic surveillance systems, and weather tracking systems all
provide data. The signal is communicated, saved, and retrievable at any time. The vast majority of IoT devices
produce status data gathered as original information and then used for more detailed models.
4.2.2 Data Set:

Predict and Measure Air Quality Monitoring System Using Machine Learning
2565
A data class is a group of information. A data set relates with one or maybe more relational databases in
the case of numerical values. Each section of the information represents a specific parameter. Each of them
correlates to a particular event of the sample group in question. For each representative of the time series, the
statistical model lists values with each of the different factors, such as an entity's altitude and load. Every deal is
referred to as a datum. A gathering of files can also be included in a data set.
4.2.3 Pre-Processing:
In the pre-processing step, the AQI database is used. There are 'three' steps in the pre-processing process. I
Redundant data removal, ii) scriptural interpretation of missing values, and iii) data normalization To reduce the
data size, the superfluous attributes (meaningless ones) are removed in the first step. The data point of a particular
component is replaced in the last thing by other constraints (CO (GT), PT08.S1 (CO), NMHC (GT), and so on).
The goal of normalizing data is to give all numbers of climate the same weight.
Delete non-essential features: assign collection (filtering and wrapper methods), object space search (see
Lecture 5: Attribute-oriented analysis). Structural equation analysis (only for numeric attributes): finding the
lowest-dimensional storage that best represents the data. Binding a smaller number of input variables
4.2.4 Feature Selection
When creating a prediction model, feature extraction is the lowest quantity of effort parameters. The number
of effort variables should be reduced to reduce the cognitive cost of modeling and, in certain cases, to improve
the model's performance.
4.2.4.1MDFA
The AQI dataset contains many parameters, and inputting all of them into the classification will take a long
time. As a result, the features extraction phase will be included here to choose the AQ level forecast's significant
effects. To select the features of pre-processed data, the altered dragonfly optimization algorithm is used.
Air pollution is a serious issue that has resulted in thousands of premature deaths, prompting the researcher to
predict air quality in terms of planning. The Air Quality Index (AQI) is a consistent place of air quality. PM10,
PM2.5, NO2, SO2, CO, O3, NH3, and Pb are utilized to compute the list esteem. PM2.5 is one of them, and it is
now a major source of pollution that has a significant impact on air quality. As a result, this study's main focus is
on this parameter. A variety of factors influence PM2.5, so in this research, a new feature selection known as the
Causality Based Practical applications was proposed to identify the most important factors influencing pollution.
4.2.5 Classification
For attempting to solve the air quality measurement problem using e-noses, a fuzzy classification with a
quantitative method is developed. The efficiency of e-noses in a vibrant outdoor setting is hampered by sound,
frequency drift, and a quickly shifting environment. The query is how to create predictive models that in an
effective and efficient manner detect and quantitative gases. The existing research has focused on either detecting
or quantifying sensing performance without taking flexible things into account. We suggest a new perfect,
IndistinctOrganization with Quantification Model (FCQM), in this paper to address the challenges stated above.
We ran extensive tests on standard datasets produced over a currently recognized to analyze our model, and the
results show that it outperforms other examine. Gas type prevention and measurement, to our understanding, is
an unsolved problem.
4.2.5.DLMNN Classifier:
The DLMNN is given the chosen features as input here. Because the existing ANN only has one input unit
(HL), training the data takes longer. To solve this problem, the proposed method employs more than three HLs.
Itutilizes the Gravitational Search Optimization Algorithm (GSOA), also known as DLMNN, to generate
optimized weight values between the HLs and the hidden layers and the HLs and the output units.
6.2.5.2 GSOA
The weight values are optimized using GSOA, triggered by Newton's law of enormity and motion. The GSOA
population strategies are known as agencies, and these agencies interact with one another using gravity (GF). The
entities are treated as objects, and the masses evaluate their results. Because of the GF, all things start to move of
other shapes with heavy groups.
For the Traveling Salesman Problem, we developed the Growing Self-Organizing Array (GSOA), which is
based on personality maps' principles (TSP).
The entire protocol is a synthesis of principles used to remedy several variations of the generalized TSP with
Communities (TSPN), for which the central points of the suggested unlabeled data have already demonstrated
broad applicability. In terms of solution quality and computational time, the herein addressed framework ensures
a functionally efficient approach that outclasses the former self map-based method for the TSP.
6.2.6 Visualization
After the instruction mentioned above, the semi sensor information is tested using the same training processes.
Following that, the results of the evaluation classification are visualized, as explained in the segment below. The
network visualizes the classified data in a variety of ways. For example, the base of prevalence in similar locations
is available in a Google map with different colors, as shown below.
Good (AQI≤50): If the order result is acceptable, the representation "Outside air is protected to inhale" is
hued green.
Moderate (AQI: 51–100): The perception "strangely touchy individuals may dodge drawn out or weighty
outside effort" is featured in yellow.

D.Saravanan a, K.P.Hemalatha b, B. Jinitha c , Dr. K. Santhosh Kumard, and P.Hemalathae
2566
Unhealthy for the touchy gatherings (AQI: 101–150): The perception "Delicate individuals (e.g., kids,
the old, outside specialists, and patients with lung sicknesses, like asthma) should restrict long or hefty open air
effort" is featured in orange.
Unhealthy (AQI: 151–200): "Delicate individuals ought to maintain a strategic distance from drawn out
or substantial open air effort," says the representation. Every other person should restrict long or difficult open
air action" is featured in red.
Very unfortunate (AQI: 201–300): "Touchy individuals ought to maintain a strategic distance from all
outside effort." Everyone else should restrict their open air movement" in purple.
Hazardous (AQI≥301): The perception here is in maroon and says, "Everybody ought to evade all outside
effort."
5.3 UML Diagrams
The acronym UML stands for Unified Modeling Language. In the field of article-based computer
programming, UML is standard sensitive information displaying language.The Object Current Management is in
charge of the standard, and they created it.
The goal is for UML to become a standardlanguage for creating models of item-oriented PC programming.
UML has two important parts in its current structure: a Meta-model and documentation. Several other types of
methods or interactions may be placed to or related to UML in the future. The Unified Modeling Language(UML)
is a conventional verbal used to describe, visualizing, designing, and chronicling software system artifacts, as
well as business modeling and other non-software devices.
The UML is a list of principles engineering practices for modeling huge and diverse systems that have been
proven to work.The UML is a critical component of object-oriented project management and software design. To
express the architecture of software projects, the UML primarily employs visual notations.
5.4 Goals
The following are the primary goals of the UML design:
Users should be able to develop and transfer meaningful models using a ready-to-use, easily
understandable modeling language.
To stretch the core concepts, provide mechanisms for group chats and specialization.
Be unconstrained by programming languages or development processes.
5.5 Use Case Diagram
A utilization case chart is a sort of conduct diagram characterized by and created from a Use-case examination
in the Unified Modeling Language (UML). Its will probably get a graphical portrayal of cutting edge materials
regarding entertainers, targets (addressed as use cases), and any incongruencies between those utilization cases.
A utilization case chart's primary objective is to show which framework exercises are led for which entertainer.
The jobs of the framework's entertainers can be highlighted.
Figure:5.5 Use Case Diagram
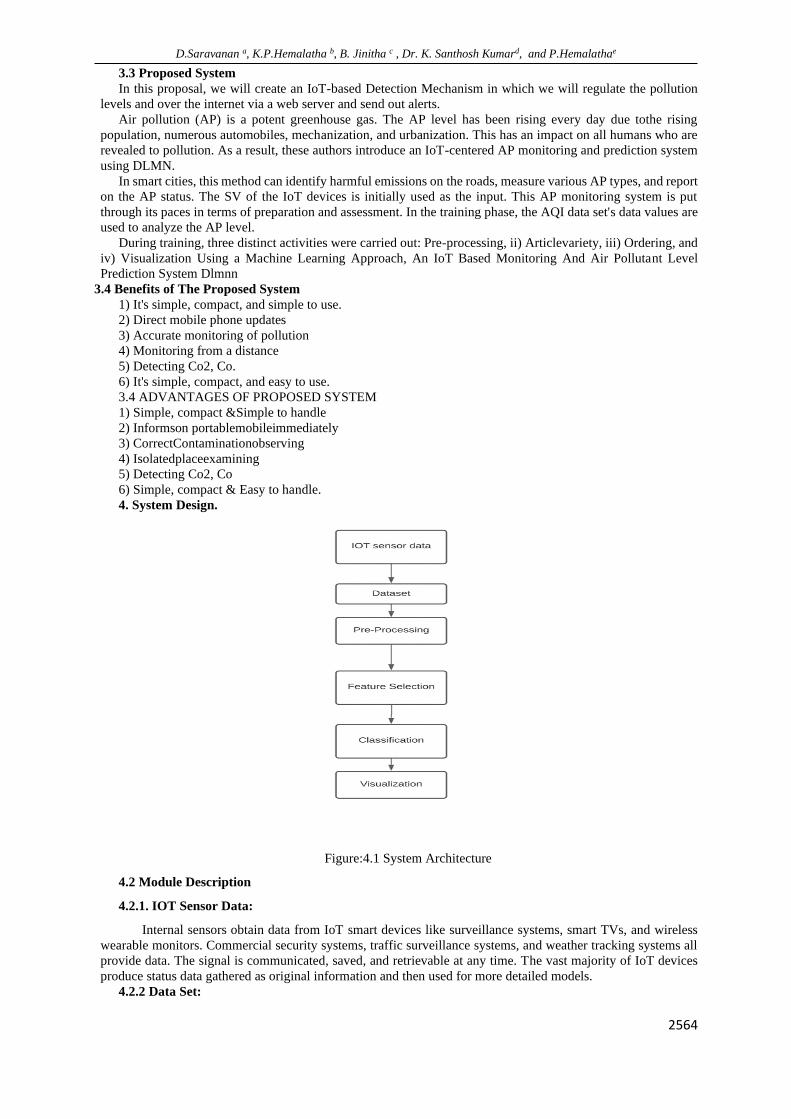
5.6 Class Diagram
A class figure in the Unified Modeling Language (UML) is a context diagram in software development that
depicts the system architecture by displaying the system's classes, qualities, procedures (or methods), and
interactions among the categories. It clarifies which category contains data.
Predict and Measure Air Quality Monitoring System Using Machine Learning
2567
Figure: 5.6 Class Diagram
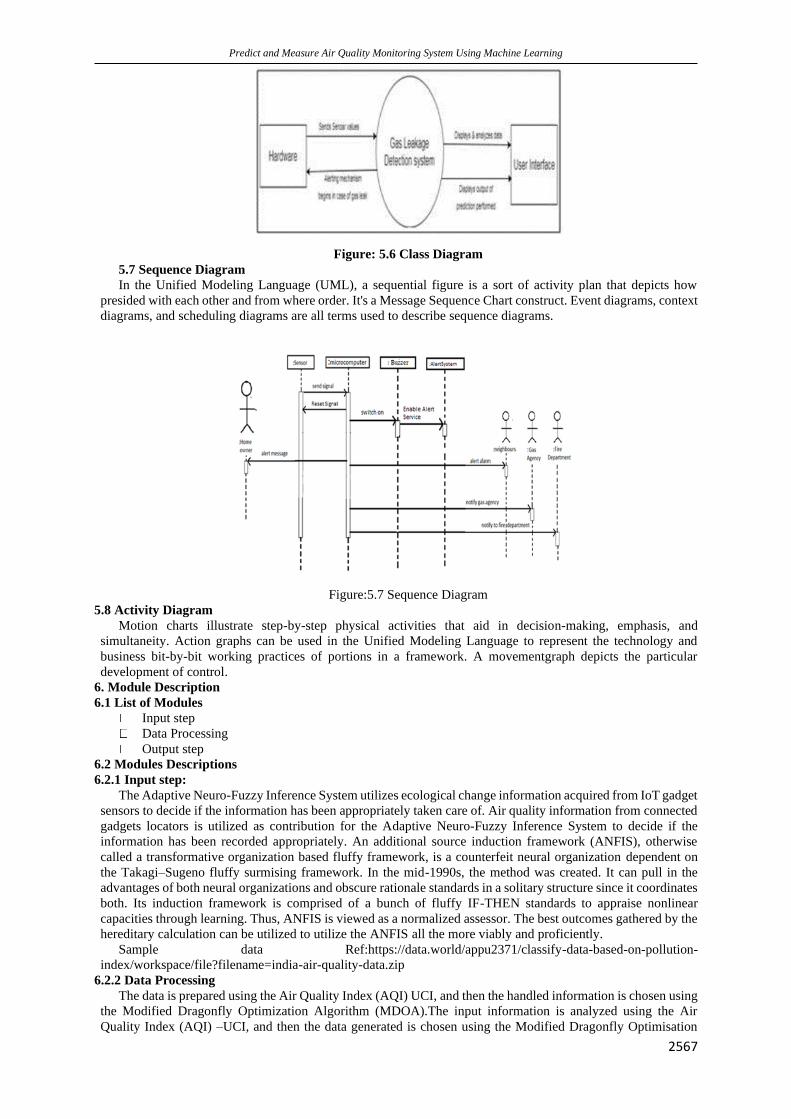
5.7 Sequence Diagram
In the Unified Modeling Language (UML), a sequential figure is a sort of activity plan that depicts how
presided with each other and from where order. It's a Message Sequence Chart construct. Event diagrams, context
diagrams, and scheduling diagrams are all terms used to describe sequence diagrams.
Figure:5.7 Sequence Diagram
5.8 Activity Diagram
Motion charts illustrate step-by-step physical activities that aid in decision-making, emphasis, and
simultaneity. Action graphs can be used in the Unified Modeling Language to represent the technology and
business bit-by-bit working practices of portions in a framework. A movementgraph depicts the particular
development of control.
6. Module Description
6.1 List of Modules
Input step
Data Processing
Output step
6.2 Modules Descriptions
6.2.1 Input step:
The Adaptive Neuro-Fuzzy Inference System utilizes ecological change information acquired from IoT gadget
sensors to decide if the information has been appropriately taken care of. Air quality information from connected
gadgets locators is utilized as contribution for the Adaptive Neuro-Fuzzy Inference System to decide if the
information has been recorded appropriately. An additional source induction framework (ANFIS), otherwise
called a transformative organization based fluffy framework, is a counterfeit neural organization dependent on
the Takagi–Sugeno fluffy surmising framework. In the mid-1990s, the method was created. It can pull in the
advantages of both neural organizations and obscure rationale standards in a solitary structure since it coordinates
both. Its induction framework is comprised of a bunch of fluffy IF-THEN standards to appraise nonlinear
capacities through learning. Thus, ANFIS is viewed as a normalized assessor. The best outcomes gathered by the
hereditary calculation can be utilized to utilize the ANFIS all the more viably and proficiently.
Sample data Ref:https://data.world/appu2371/classify-data-based-on-pollution-
index/workspace/file?filename=india-air-quality-data.zip
6.2.2 Data Processing
The data is prepared using the Air Quality Index (AQI) UCI, and then the handled information is chosen using
the Modified Dragonfly Optimization Algorithm (MDOA).The input information is analyzed using the Air
Quality Index (AQI) –UCI, and then the data generated is chosen using the Modified Dragonfly Optimisation
D.Saravanan a, K.P.Hemalatha b, B. Jinitha c , Dr. K. Santhosh Kumard, and P.Hemalathae
2568
Algorithm (MDOA). The Ultimate Resource Guide to Data Preparation for Machine Learning Data plan prepares
data for the professional development, evaluation, and application of an algorithm in machine learning. Data
collection, cleaning and classification, feature engineering, and labeling are all steps in the process. These steps
are important to the effective quality of someone's machine learning model because they construct on each other
to guarantee that it performs as expected.
6.2.3 Output step:
The process visualizes the testing results. DLMNN is used to order the data. The DLMNN receives the chosen
features as input. Because the current ANN only has one hidden layer (HL), training the data takes longer. To
solve this issue, the present technique employs more than three HLs. Itutilizes the Gravitational Search
Optimization Algorithm (GSOA), also known as DLMNN, to produce optimized weight values between the HLs
and the hidden layers and the HLs and the output layer. We intend to implement the RCNN algorithm in a similar
application for the best results in the future, in which documentation about other factors relating to devices and
software can be acquired. The system for measuring air quality.
7 Conclusion
Using Machine Learning Approach, this project presents an IoT-based AQ scanning and perception
framework. The harassment location stage is based on the sensor values that have been obtained. In this way,
non-assaulted sensor values are tested, and the air pollution level is predicted. There are six different types of
groups of contamination discovered and expected. The proposed strategy's results are evaluated by contrasting
their speech with current methods.
References
1. Choi, W., Hwang, D., Kim, J., &Lee, J.," Fine dust monitoring system based on Internet of Things,"
International Conference on Information and Communication Technology Robotics, 2018.
2. Yohan Han, Byungjun Park, and JongpilJeong, "A novel architecture of air pollution measurement
platform using 5g and blockchain for industrial IoT applications", Procedia Computer Science,vol. 155,
pp. 728-733, 2019.
3. Saba Ameer, Muna Ali Shah, Abid Khan, Houbing Song, Carsten Maple, Saif Ul Islam, and Muhammad
Nabeel Asghar, "Comparative analysis of machine learning techniques for predicting air quality in
smart cities," IEEE Access, vol. 7, pp. 128325-128338, 2019
4. Hernández-Vega, J.I Varela, E.R., Romero, N.H., Hernández-Santos, C., Cuevas, J.L.S. and Gorham,
D.G.P, “Internet of Things (IoT) for monitoring air pollutants with an unmanned aerial vehicle (UAV)
in a smart city”, In Smart Technology, Springer, Cham, pp. 108-120, 2018.
5. TemeseganWalelignAyele, and Rutvik Mehta, "Air pollution monitoring and prediction using IoT," In
Second International Conference on Inventive Communication and Computational Technologies
(ICICCT), pp. 1741-1745. IEEE, 2018.
6. Grace Kingsy, R., Manimegalai R., Devasena MS Geetha, Rajathi S., Usha K., and Baseria N.
Raabiathul, "Air pollution analysis using enhanced K-Means clustering algorithm for real-time sensor
data," In IEEE Region 10 Conference (TENCON) IEEE, pp. 1945-1949, 2016.
7. Huang, Le Hui, and Bin Gui, "Discussion on Air Pollution and Its Control Measures," Advanced
Materials Research, pp. 1010- 1012, pp. 839, 2014.
8. Kumar S. and Katoria D, "Air Pollution and its Control Measures", International Journal of
Environmental Engineering and Management, vol. 4, no. 5, pp. 445-450, 2013.
9. D Stalin David, 2020, ‘An Intellectual Individual Performance Abnormality Discovery System in Civic
Surroundings’ International Journal of Innovative Technology and Exploring Engineering, Volume 9,
Issue 5, PP.2196-2206.
10. D Stalin David, 2020, ‘Machine learning for the prelude diagnosis of dementia’, International Journal
of Pharmaceutical Research, Volume 13, Issue 3, PP.2329-2335.
11. Stalin David D , Saravanan D, 2020, ‘Multi-perspective DOS Attack Detection Framework for Reliable
Data Transmission in Wireless Sensor Networks based on Trust’, International Journal of Future
Generation Communication and Networking , Volume 13, Issue 4, PP.1522–1539.
12. J. K. S and D. S. David, "A Novel Based 3D Facial Expression Detection Using Recurrent Neural
Network," 2020 International Conference on System, Computation, Automation and Networking
(ICSCAN), Pondicherry, India, 2020, pp. 1-6, doi: 10.1109/ICSCAN49426.2020.9262287.
13. Stalin David D, Saravanan D, “Enhanced Glaucoma Detection Using Ensemble based CNN and
Spatially Based Ellipse Fitting Curve Model”, Solid State Technology, Volume 63, Issue 6, PP.3581-
3598.
Predict and Measure Air Quality Monitoring System Using Machine Learning
2569
14. Stalin David D, Saravanan M, Jayachandran A, “Deep Convolutional Neural Network based Early
Diagnosis of multi class brain tumour classification”, Solid State Technology, Volume 63, Issue 6,
PP.3599-3623.
15. R.Parthiban, Dr.K.Santhosh Kumar, Dr.R.Sathya, D.Saravanan,” A Secure Data Transmission And
Effective Heart Disease Monitoring Scheme Using Mecc And Dlmnn In The Cloud With The Help Of
Iot”, International Journal of Grid and Distributed Computing, ISSN: 2005 – 4262, Vol. 13, No. 2,
(2020), pp. 834 – 856.
16. R.Bhavya, G.I.Archanaa, D.Karthika, D.Saravanan,” Reflex Recognition of Tb Via Shade Duplicate
Separation Built on Geometric Routine”, International Journal of Pure and Applied Mathematics 119
(14), 831-836.
17. D Saravanan, R Bhavya, GI Archanaa, D Karthika, R Subban,” Research on Detection of
Mycobacterium Tuberculosis from Microscopic Sputum Smear Images Using Image Segmentation”,
2017 IEEE International Conference on Computational Intelligence and Computing Research (ICCIC).
18. D Saravanan, R Parthiban,” Automatic Detection of Tuberculosis Using Color Image Segmentation
and Statistical Methods”, International Journal of Advance Research in Science and Engineering,
Volume 6, Issue 10.
19. U.Palani, D.Saravanan, R.Parthiban, S.Usharani,” Lossy Node Elimination Based on Link Stability
Algorithm in Wireless Sensor Network”, International Journal of Recent Technology and Engineering
(IJRTE), Volume 7, Issue 6S5.
20. S.G.Sandhya, D.Saravanan, U.Palani, S.Usharani,” Handover Priority to the Data at Knob Level in
Vanet”, International Journal of Recent Technology and Engineering (IJRTE), Volume 7, Issue 6S5.
21. D.SaravananR.Parthiban, U.PalaniS.G.Sandhya,” Sheltered and Efficent Statistics Discrimnation for
Cluster Based Wireless Antenna Networks”, International Journal of Recent Technology and
Engineering (IJRTE), Volume 7, Issue 6S5.
22. D.Saravanan, Dr. K.Santhosh Kumar, R.Sathya, U.Palani, “An Iot Based Air Quality Monitoring And
Air Pollutant Level Prediction System Using Machine Learning Approach – Dlmnn”, International
Journal of Future Generation Communication and Networking, Vol. 13, No. 4, (2020), pp. 925–945.
23. Raghu Raman D, Saravanan D, Nivedha R,” An Efficacious E-Portal for Rancher to Buy
24. Seeds and Humus”, International Journal of Recent Technology and Engineering (IJRTE), Volume-8,
Issue-1S5, June 2019.
25. M.Sudha, D.Saravanan, S.Usharani,” Security Improvement of Dropper Elimination Scheme for IoT
Based Wireless Networks”, International Journal of Engineering Trends and Technology (IJETT)
,Volume-45 Number3 -March 2017.
26. K. Gayathri, D.Saravanan,” An Innovative IOT security Enhancing Schema Based Gamed Theory
Decryption Percentage”, International Journal of Advanced Research in Science and Technology,
Volume 6, Issue2, 2017, pp. 666-671.
27. E.Kowsalya, D.Saravanan, R.Parthiban,” Energy Aware Resource Allocation for Throughput
Maximized IOT Network”, International Journal of Computer Trends and Technology (IJCTT) –
Volume 45 Issue 2- March 2017.
28. D Saravanan, J Feroskhan, R Parthiban, S Usharani, “Secure Violent Detection in Android Application
with Trust Analysis in Google Play”, Journal of Physics: Conference Series 1717 (1), 012055.
29. D Saravanan, E Racheal Anni Perianayaki, R Pavithra, R Parthiban, ” Barcode System for Hotel Food
Order with Delivery Robot”, Journal of Physics: Conference Series 1717 (1), 012054.
30. D Raghu Raman, S Gowsalya Devi, D Saravanan, ”Locality based violation vigilant system using
mobile application”, 2020 International Conference on System, Computation, Automation and
Networking (ICSCAN-IEEE).
31. R Parthiban, R Ezhilarasi, D Saravanan, “Optical Character Recognition for English Handwritten Text
Using Recurrent Neural Network”, 2020 International Conference on System, Computation,
Automation and Networking (ICSCAN-IEEE).
32. R Parthiban, V Abarna, M Banupriya, S Keerthana, D Saravanan, ” Web Folder Phishing Discovery
and Prevention with Customer Image Verification”, 2020 International Conference on System,
Computation, Automation and Networking (ICSCAN-IEEE).
33. K Dhivya, P Praveen Kumar, D Saravanan, M Pajany,” Evaluation of Web Security Mechanisms Using
Vulnerability &Sql Attack Injection”, International Journal of Pure and Applied Mathematics, Volume
119, Issue 14, 2018.

D.Saravanan a, K.P.Hemalatha b, B. Jinitha c , Dr. K. Santhosh Kumard, and P.Hemalathae
2570
34. D Saravanan, R Parthiban, S Usharani, K Santhosh Kumar,” Furtive Video Recorder Using Intelligent
Vehicle with the Help of Android Mobile”, International Journal of Pure and Applied Mathematics,
Volume 119, Issue 14, 2018.
35. K Dheepa, D Saravanan, R Parthiban, K Santhosh Kumar,” Secure And Flexible Data Sharing Scheme
Based On Hir-Cp-Abe For Mobile Cloud Computing”, International Journal of Pure and Applied
Mathematics, Volume 119, Issue 14, 2018.
36. D.Saravanan S. Usharani,” Survey on Security Based Novel Context Aware Mobile Computing Scheme
Via Crowdsourcing”, International Journal of Scientific Research in Computer Science, Engineering
and Information Technology.
37. S. Usharani, D.Saravanan,” Security Improvement of Dropper Elimination Scheme for Iot Based
Wireless Networks”, International Journal of Engineering Trends and Technology.
38. R Parthiban, S Usharani, D Saravanan,” Survey of Security Improvement of Dropper Elimination
Scheme for IoT Based Wireless Networks”, International Journal of Engineering Trends and
Technology (IJETT).
39. Jayachandran, A., and D. Stalin David. "Textures and Intensity Histogram Based Retinal Image
Classification System Using Hybrid Colour Structure Descriptor." Biomedical and Pharmacology
Journal, vol. 11, no. 1, 2018, p. 577+. Accessed 12 Feb. 2021.
40. D. Stalin David, 2019, “Parasagittal Meningiomia Brain Tumor Classification System based on MRI
Images and Multi Phase level set Formulation”, Biomedical and Pharmacology Journal, Vol.12, issue
2, pp.939-946.
41. D. S. David and A. Jeyachandran, "A comprehensive survey of security mechanisms in healthcare
applications," 2016 International Conference on Communication and Electronics Systems (ICCES),
Coimbatore, 2016, pp. 1-6, doi: 10.1109/CESYS.2016.7889823.
42. Stalin David, D., Jayachandran, A. A new expert system based on hybrid colour and structure
descriptor and machine learning algorithms for early glaucoma diagnosis. Multimed Tools Appl 79,
5213–5224 (2020). https://doi.org/10.1007/s11042-018-6265-1.
43. D. Jayakumar; Dr.U. Palani; D. Raghuraman; Dr.D. StalinDavid; D. Saravanan; R. Parthiban; S.
Usharani. "Certain Investigation On Monitoring The Load Of Short Distance Orienteering Sports On
Campus Based On Embedded System Acceleration Sensor". European Journal of Molecular & Clinical
Medicine, 7, 9, 2021, 2477-2494.
44. R. Parthiban; S. Usharani; D. Saravanan; D. Jayakumar; Dr.U. Palani; Dr.D. StalinDavid; D.
Raghuraman. "Prognosis Of Chronic Kidney Disease (Ckd) Using Hybrid Filter Wrapper Embedded
Feature Selection Method". European Journal of Molecular & Clinical Medicine, 7, 9, 2021, 2511-
2530.
45. Dr.U. Palani; D. Raghuraman; Dr.D. StalinDavid; R. Parthiban; S. Usharani; D. Jayakumar; D.
Saravanan. "An Energy-Efficient Trust Based Secure Data Scheme In Wireless Sensor Networks".
European Journal of Molecular & Clinical Medicine, 7, 9, 2021, 2495-2510.
46. Dr. D. Stalin David; R. Parthiban; D. Jayakumar; S. Usharani; D. RaghuRaman; D. Saravanan; Dr.U.
Palani. "Medical Wireless Sensor Network Coverage And Clinical Application Of Mri Liver Disease
Diagnosis". European Journal of Molecular & Clinical Medicine, 7, 9, 2021, 2559-2571.
47. D.Raghu Raman; D. Saravanan; R. Parthiban; Dr.U. Palani; Dr.D.Stalin David; S. Usharani; D.
Jayakumar. "A Study On Application Of Various Artificial Intelligence Techniques On Internet Of
Things". European Journal of Molecular & Clinical Medicine, 7, 9, 2021, 2531-2557.
48. D.Saravanan; Dr.D.Stalin David; S.Usharani; D.Raghuraman; D.Jayakumar; Dr.U.Palani;
R.Parthiban. “An Energy Efficient Traffic-Less Channel Scheduling Based Data Transmission In
Wireless Networks”. European Journal of Molecular & Clinical Medicine, 2020, Volume 7, Issue 11,
Pages 5704-5722.
49. S. Usharani; D.Jayakumar; Dr.U.Palani; D.Raghuraman; R.Parthiban; D.Saravanan; Dr.D.Stalin
David. “Industrialized Service Innovation Platform Based On 5g Network And Machine Learning”.
European Journal of Molecular & Clinical Medicine, 2020, Volume 7, Issue 11, Pages 5684-5703.
50. Hemalatha, P., Matilda, S., Smart Digital Parenting Using Internet of Things, ICSNS 2018 -
Proceedings of IEEE International Conference on Soft-Computing and Network Security, 2018,
8573622.

Predict and Measure Air Quality Monitoring System Using Machine Learning
2571
51. Hemalatha, P., Dhanalakshmi, K, Development of IOT enabled voice recognition robotic guide dog for
visually impaired people to enhance the guiding and interacting experience, Journal of Advanced
Research in Dynamical and Control Systems, 2017, 9, pp. 262–272.
52. Dr.A.Senthil Kumar, Dr.G.Suresh, Dr.S.Lekashri, Mr.L.Ganesh Babu, Dr. R.Manikandan. (2021).
Smart Agriculture System With E – Carbage Using Iot. International Journal of Modern Agriculture,
10(01), 928 - 931. Retrieved from http://www.modern-journals.com/index.php/ijma/article/view/690
53. Dr.G.Suresh, Dr.A.Senthil Kumar, Dr.S.Lekashri, Dr.R.Manikandan. (2021). Efficient Crop Yield
Recommendation System Using Machine Learning For Digital Farming. International Journal of
Modern Agriculture, 10(01), 906 - 914. Retrieved from http://www.modern-
journals.com/index.php/ijma/article/view/688
54. Dr. R. Manikandan, Dr Senthilkumar A. Dr Lekashri S. Abhay Chaturvedi. “Data Traffic Trust Model
for Clustered Wireless Sensor Network.” INFORMATION TECHNOLOGY IN INDUSTRY 9.1 (2021):
1225–1229. Print.