
Precise Assessment of the Mean Effective Luminance of Texture Patches—An Approach Based on...
10
@ Pergamon PII: SOO42-6989(96)OO1O1-O VisionRes., Vol.36,No.23,pp.3775-3784, 1996 Copyright Q 1996ElsevierScienceLtd.Allrightsreserved PrintedinGreatBritain 0042-6989/96 $15.00+0.00 Precise Assessment of the Mean Effective Luminance of Texture Patches-.–AnApproach Based on Reverse-phi Motion THOMAS V. PAPATHOMAS,*$ ANDREI GOREA,7 CHARLES CHUBB$ Received15March1995;in revisedform23 October1995;infinalform29February1996 In studying the response of mechanisms to contrast-defined texture stimuli, it is critical that the average effective luminance of these textures be equal to that of the background, to minimize net luminance-based signals. We present an efficient and accurate technique for constructing such equiluminant textures to isolate contrast-sensitive mechanisms for investigating their properties. The technique is based on the reverse-phi motion phenomenon, and the resulting settings agree closely with those obtained by photometric means for the class of textures studied. The method also allows one to explore the properties of contrast- and luminance-driven motion mechanisms and, in particular, to evaluate the contribution of putative second-order mechanisms to the motion percept. Results of applying the method are presented, and its advantages over the minimum-flicker and minimum-motion techniques are discussed. Copyright O 1996 Elsevier Science Ltd Apparentmotion Luminance Contrast Equiluminance Reverse-phi motion INTRODUCTION Among several models proposed to explain biological, luminance-definedmotion perception are the correlation detector (e.g., Reichardt, 1961, van Santen & Sperling, 1985), the motion energy extractor (e.g., Adelson & Bergen, 1985), and the motion sensor (e.g., Watson & Ahumada, 1985). Despite their apparent differences, these models all extract Fourier motion, i.e., motion reflected by the distribution of stimulus energy in the frequency domain. Such models can predict a wide variety of motion perception phenomena. However, humans can perceive motion in stimuli that do not, on average, contain any net directional Fourier energy. Examples are displays in which motion is carried not directly by luminance, but rather by “second-order” attributes such as contrast, flicker rate, binocular disparity, etc. This has led some researchers to postulate multiple, parallel, motion mechanisms: a first-order mechanism to detect motion carried by space/time *Laboratory of Vision Research and Department of Biomedical Engineering, Psychology Building, Busch Campus, Rutgers, The State University of New Jersey, Piscataway, NJ 08854,U.S.A. f’Laboratoire de PsychologiesExp6rimentale, Universit&Ren6 Des- cartes and Centre National de la Recerche Scientifique, Paris, France. $Departmentof Psychology,Rutgers University, New Jersey, U.S.A. ~Towhom all correspondenceshouldbe addressed[Tel908/445-6533; Fax 908/445-6715; EmaiZ [email protected]. edu]. variations in luminance, as well as second-order mechanisms to extract motion carried by space/time variationsin contrast,flickerrate, binoculardisparity,etc. (e.g., Chubb & Sperling, 1988, 1989; Cavanagh & Mather, 1989). An important issue is whether second-ordermotion is extracted by passive, low-level, sensory mechanisms, or by active, higher-level, attention-drivenprocesses (e.g., Cavanagh,1992,1995).In particular,for stimuliin which motion is carried by texture contrast, the psychophysical (Chubb & Sperling, 1988; Stoner & Aibright, 1992; Werkhoven et al., 1993; Sato & Nishida, 1993; Nishida, 1993; Cavanagh, 1995) and physiological (0’ Keefe et al., 1993) evidence is strongly in favor of low-level detectors. The exact nature and properties of these second-orderdetectors are currently the subject of active research (e.g., Nishida, 1993; Chubb et al., 1994; McGowan & Chubb, 1994; Solomon & Sperling, 1994; Gorea, 1995). Stereopsis is another modality for which second-ordermechanismsmay play a role. To study such putative mechanisms,purely contrast-definedtargets are employed with mean luminance equal to that of the background (e.g., Sato & Nishida, 1993). If one’s objective is to isolate these contrast-sensitivemechan- isms to investigate their properties, it is critically importantto generate textures that vary only in contrast, while remaining constantin space-averageluminance.In this paper we present an efficientand accurate technique for constructingsuch textures. 3775
Transcript of Precise Assessment of the Mean Effective Luminance of Texture Patches—An Approach Based on...

@Pergamon
PII: SOO42-6989(96)OO1O1-O
VisionRes., Vol.36,No.23,pp.3775-3784,1996CopyrightQ 1996ElsevierScienceLtd.All rightsreserved
Printedin GreatBritain0042-6989/96$15.00+ 0.00
Precise Assessment of the Mean EffectiveLuminance of Texture Patches-.–AnApproachBased on Reverse-phi MotionTHOMAS V. PAPATHOMAS,*$ANDREI GOREA,7 CHARLES CHUBB$
Received15March1995;in revisedform23 October1995;infinalform29February1996
In studying the response of mechanisms to contrast-defined texture stimuli, it is critical that theaverage effective luminance of these textures be equal to that of the background, to minimize netluminance-based signals. We present an efficient and accurate technique for constructing suchequiluminant textures to isolate contrast-sensitive mechanisms for investigating their properties.The technique is based on the reverse-phi motion phenomenon, and the resulting settings agreeclosely with those obtained by photometric means for the class of textures studied. The method alsoallows one to explore the properties of contrast- and luminance-driven motion mechanisms and, inparticular, to evaluate the contribution of putative second-order mechanisms to the motion percept.Results of applying the method are presented, and its advantages over the minimum-flicker andminimum-motion techniques are discussed. Copyright O 1996 Elsevier Science Ltd
Apparentmotion Luminance Contrast Equiluminance Reverse-phimotion
INTRODUCTION
Among several models proposed to explain biological,luminance-definedmotion perception are the correlationdetector (e.g., Reichardt, 1961, van Santen & Sperling,1985), the motion energy extractor (e.g., Adelson &Bergen, 1985), and the motion sensor (e.g., Watson &Ahumada, 1985). Despite their apparent differences,these models all extract Fourier motion, i.e., motionreflected by the distribution of stimulus energy in thefrequency domain. Such models can predict a widevariety of motion perception phenomena. However,humans can perceive motion in stimuli that do not, onaverage, contain any net directional Fourier energy.Examples are displays in which motion is carried notdirectly by luminance, but rather by “second-order”attributes such as contrast, flicker rate, binoculardisparity, etc. This has led some researchers to postulatemultiple, parallel, motion mechanisms: a first-ordermechanism to detect motion carried by space/time
*Laboratory of Vision Research and Department of BiomedicalEngineering, PsychologyBuilding, Busch Campus, Rutgers, TheState University of New Jersey, Piscataway, NJ 08854,U.S.A.
f’Laboratoire de PsychologiesExp6rimentale, Universit&Ren6 Des-cartes and Centre National de la Recerche Scientifique, Paris,France.
$Departmentof Psychology,Rutgers University,New Jersey, U.S.A.~Towhomall correspondenceshouldbe addressed[Tel908/445-6533;
Fax 908/445-6715;[email protected]].
variations in luminance, as well as second-ordermechanisms to extract motion carried by space/timevariationsin contrast,flickerrate,binoculardisparity,etc.(e.g., Chubb & Sperling, 1988, 1989; Cavanagh &Mather, 1989).
An important issue is whether second-ordermotion isextracted by passive, low-level, sensory mechanisms,orby active, higher-level, attention-drivenprocesses (e.g.,Cavanagh,1992,1995).In particular,for stimuliin whichmotion is carried by texture contrast, the psychophysical(Chubb & Sperling, 1988; Stoner & Aibright, 1992;Werkhoven et al., 1993;Sato & Nishida, 1993;Nishida,1993; Cavanagh, 1995) and physiological (0’ Keefe etal., 1993) evidence is strongly in favor of low-leveldetectors. The exact nature and properties of thesesecond-orderdetectorsare currently the subject of activeresearch (e.g., Nishida, 1993; Chubb et al., 1994;McGowan & Chubb, 1994; Solomon & Sperling, 1994;Gorea, 1995). Stereopsis is another modality for whichsecond-ordermechanismsmay play a role. To study suchputative mechanisms,purely contrast-definedtargets areemployed with mean luminance equal to that of thebackground (e.g., Sato & Nishida, 1993). If one’sobjective is to isolate these contrast-sensitivemechan-isms to investigate their properties, it is criticallyimportant to generate textures that vary only in contrast,while remainingconstantin space-averageluminance.Inthis paper we present an efficientand accurate techniquefor constructingsuch textures.
3775

3776 T. V. PAPATHOMASet al.
A note of clarificationis in orderhere as to the meaningof luminance. The term can be used under differentvariants of meaning (Palmer et al., 1993). The mostcommon one is that of physical luminance, as measuredby a photometer, denoted by the symbol P in whatfollows. In the context of the present paper, the space-averagephysical luminanceof a texturepatch is obtainedby a photometerwith an aperture that is much larger thanthe texturegrain; in addition,to approacha good estimateof the mean, one would need to averagea largenumberofsuch measurements taken over different samples of thetexture. However, what we have in mind in this work isthe “effective” mean luminance, denoted by the symbolL, i.e., the magnitudeof the elicited neural responseafterthe physical luminance has been processed by thecompressive nonlinearity in the human visual system(e.g., Teller et al., 1982), which, after all, is the signalprovided as input to motion extracting neural mechan-isms. Effective equiluminance cannot be obtained bydirect measurement, it can only be estimated bypsychophysical experiments that require a certainperformance criterion, such as a performance minimum(e.g., the heterochromatic flicker photometry procedurefor obtainingthe equiluminantsetting for a color relativeto a different color) or chance-level performance in atwo-alternative forced-choice paradigm (e.g. the mini-mum-motion equiluminance technique of Anstis &Cavanagh, 1983). It is quite possible that the settings ofthe two types of equiluminance, physical (P) andeffective (L), are different over some range of experi-mental conditions (Brown, 1995), because of nonlinearprocessing in the neural pathways. For this reason, carehas been taken to distinguishbetween them, and we usethe two different symbols consistently to refer to theappropriatemeaning throughoutthe paper.
In addition to distinguishing between physical andeffective luminance, one must also be aware of physicalluminance artifacts that are introduced by displaymonitors, which are well known in the literature (e.g.,Teller et al., 1982). We shall assume that the experi-mentergeneratesdisplaysby assigningvalues to pixels ina digital image, D, which is convertedby hardware to animage with physical luminance P(D) on a CRT screen.Ideally, the transformation P characterizing the displaysystem should be well-behaved in the sense that the netamount of light emitted from a region R of a physicalimage as the result of a certain distributionU of physicalluminance on R’s pixels should depend only on thehistogramof U and not on the particularspatialpatternofthe distribution. Unfortunately, the transformation P istypically more complicated than one would like. Theproblem is that the net amount of light emitted from aregion R of P(D), due to a given pixel assignmentin D,typicallydependsin unknownways on the contextof thatassignment;an exampleof such complexitiesis describedin the Resultssection.We considerthe questionof how togenerate a binary texture B such that P(B) has a meaneffective luminance equal to that of P(M), where M is auniform field of digital value m.
The type of binary texture most frequently used instudying second-order processes is one comprisingjointly independentelements, each of which is assignedvalue a or b with equal probability.We use the notationT,,b for such a digital,texture, and we denote its meanphysicalluminanceby P.v~.Let M be the digitalimageallof whose pixels are assigned value m, and let P. be thephysical luminance of the displayeduniform field P(M),which results in an effective luminance ~. If the spaceaverage luminance is $omputed after a compressive (orother) nonlinearity, then Pavg#Lavg. The problem ofobtaining a contrast patch Ta,b with mean effectiveluminanceL.v~which is equal to ~ can be formulatedasfollows: given a fixed digital value b, vary a in order toobtain the value a* such that the mean effectivekIIk2UICt! Of P(Ta.,b) jS i3c@ tO ~. For COIICH3HU%,
let us assume that a >v >b.Two techniques have been employed by Nishida
(1993) to address this issue. If we cast them in theformat presented above, then in the first techniquetextured regions alternate in time with uniform-lumi-nance regions, and the observerstry to adjusta until theyperceive minimum flicker. The second method usesrandom-checkpatterns, in which the checks are texturedpatchesof randomdots,placed randomlyin space againsta background of uniform luminance. These checks aredisplacedfrom frame to frame, generatingrandom-checkcinematograms, akin to conventional random-dot cine-matograms. If the problem is formulated as above, theobserver’s performance (percent correct of judging thedirectionof motion) is plotted as a function of a, and theeffective equiluminant setting is obtained as the valuethat correspondsto the worst performance.The rationalebehind this minimum-motiontechnique is that, when thetexture checks’ equivalent luminance is equal to that ofthe background, theq there is no Fourier motioncomponent; hence performance will be at its lowest.Both of these techniques involvejudging the magnitudeof a percept (flicker or motion), which is assumed to beminimal at a =a*, and to grow in strength as a deviatesfrom a*.
A problem with each technique is that, even ateffective equiluminance, the percept to be minimizeddoes not disappear completely. In the case of flicker,there is residual flick~r from alternating a patch ofuniformluminanceP(M) with a texturepatch P(T,*,J; inthe case of motion,there is a residualsecond-ordersignal.Worse yet, it turns out that the curves that plot thestrengthof the percept as a functionof a do not possessasharp minimum at a =a* (Nishida, 1993), making itdifficultto obtain accurate estimates of a*. The methodspresented in this paper enable significantlymore preciseestimates by pinning a* at the sharp transition betweentwo opposite-directionmotion percepts. Ledgeway andSmith (1994; see also ,Brown, 1995) also developed atechnique, based on apparent motion, for obtaining atexture patch with a desired mean equivalent luminance,adapted from the heterochromatic motion method ofAnstis & Cavanagh (1983). Our technique has an
MEAN LUMINANCEOF TEXTUREDTARGETS
t(tire
(a)&x
/t (time)
(b)= 100XuL~ 50 - ‘-------- ””-----------z!d! o;
Mean luminance of “C” elements ,(:“
a+
Setting for bright dots of “C” eiements➤a
(c)
3777
FRAME O
FRAME 1
FRAME 2
FRAME 3
FRAME O
FRAME 1
FRAME 2
FRAME 3
uig 50- ------------
E
6 aSetting for bright dots of “C” elements
(d)
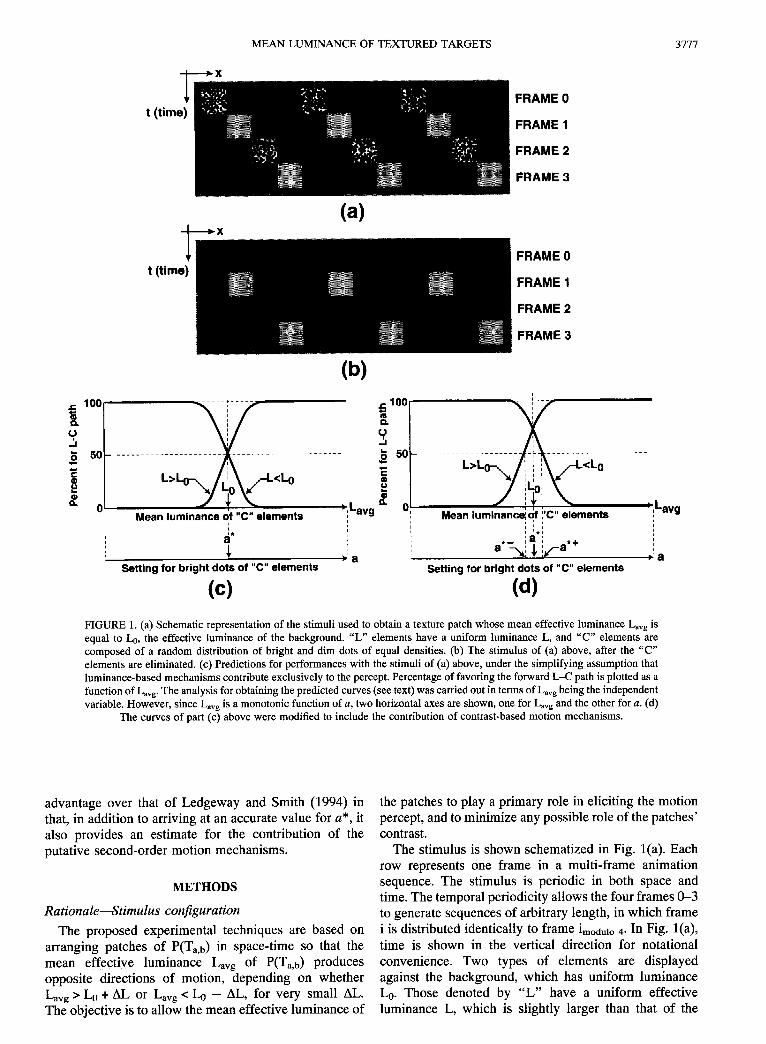
FIGURE 1. (a) Schematic representationof the stimuli used to obtain a texture patch whose mean effective luminanceLa,gisequal to ~, the effective luminance of the background. “L“ elements have a uniform luminance L, and “C” elements arecomposed of a random distribution of bright and dim dots of equal densities. (b) The stimulus of (a) above, after the “C”elements are eliminated. (c) Predictionsfor performanceswith the stimuli of (a) above,under the simplifyingassumptionthatluminance-basedmechanismscontributeexclusivelyto the percept. Percentageof favoringthe forwardL-C path is plotted as afunctionof L,vg.The analysisfor obtainingthe predictedcurves(see text) was carriedout in terms of L,vgbeingthe independentvariable. However,since L,,g is a monotonicfunctionof a,twohorizontalaxesareShov-monefor L~v~and the other for a. (d)
The curves of part (c) above were modifiedto include the contributionof contrast-basedmotion mechanisms.
advantage over that of Ledgeway and Smith (1994) inthat, in addition to arriving at an accuratevalue for a*, italso provides an estimate for the contribution of theputative second-ordermotion mechanisms.
METHODS
Rationale+timulus configuration
The proposed experimental techniques are based onarranging patches of P(T.,b) in space-time so that themean effective luminance Lavg of p(T,,b) producesopposite directions of motion, depending on whetherL,v~> LO+ AL or L,v~< ~ – AL, for very small AL.The objectiveis to allowthe mean effectiveluminanceof
the patches to play a primary role in eliciting the motionpercept, and to minimizeany possiblerole of the patches’contrast.
The stimulus is shown schematized in Fig. l(a). Eachrow represents one frame in a multi-frame animationsequence. The stimulus is periodic in both space andtime.The temporalperiodicityallowsthe four framesO-3to generate sequencesof arbitrary length, in which framei is distributedidenticallyto frame i~OdUIOQ.In Fig. l(a),time is shown in the vertical direction for notationalconvenience. Two types of elements are displayedagainst the background, which has uniform luminanceLO. Those denoted by “L” have a uniform effectiveluminance L, which is slightly larger than that of the

3778 T. V. PAPATHOMASet al.
background, say 5%, above ~, i.e., L =(1 + e)~ > ~.The rest are texturedelements,marked “C” (a mnemonicfor contrast), each of which is filled with P(T,,b).
The value of the proposedtechniqueemergeswhen weconsider the global motion percept that the stimulus ofFig. l(a) might be expected to elicit. Note first that if theL elementshad an effectiveluminanceequalto that of thebackground, then considerations of symmetry mandatethat the resulting stimulusmust be ambiguousin motioncontent.By making the L patchesbarely brighter than thebackground we hope to engage primarily a mechanismsensitive to luminance-definedmotion, i.e., first-order,and as far as possible to avoid stimulating mechanismssensitive to other sorts of motion.
Suppose that, in fact, only mean effective luminanceof patches are relevant to determining the direction ofglobal motion. Consider first the case where the Celements have mean effective luminanceequal to that ofthe background, i.e. L.v~= ~. In this case, they cannotcontributea motion signal to a luminance-drivenmotionextractor, accordingto the hypothesis;then the C patchesvanish as motion tokens, resulting in the oversimplifiedschematic mapping of Fig. l(b). Symmetry considera-tions would predict that the stimulus of Fig. l(b) isambiguous with respect to direction of motion. Thus,irrespective of any assumptions we might make abouthow luminance-defined motion is computed, we canconclude that, if L~Vgis equal to ~, then the stimulusmust elicit ambiguousmotion for first-order,luminance-driven units. Moreover, as we shall see, it turns out thatsmall deviationsof L~Vgaway from ~ sharply affect theglobal motion elicited by the stimulus. It is thisconvenientempirical fact that makes the method useful.
In order to predict the direction of motion elicitedwhen Lavg# ~, we need to appeal to standardcomputational models of luminance-definedmotion. Inparticular, Reichardt models (van Santen & Sperling,1985) and motion energy models (Adelson & Bergen,1985) enable a clear prediction, which is supportedcleanly by the data we shall present. First, if L.v~> ~,then motion should be in the direction of the L-C path,comprising alternating L and C patches (because this isthe direction of the dominant spatiotemporalorientation,since L > LJ. On the other hand, if L,v~c h, then thedominant spatiotemporalorientationruns contrary to theL-C path; hence motion should be in the oppositedirection (“reverse-phi,” Anstis, 1970).Thus, if we plotthe probabilityof perceiving motion along the L-C pathas a function of L~Vg,we expect the solid curve of Fig.l(c), labeled “L> h“. The predictedcurvewas obtainedas a functionof L.vg,but its shaperemainsapproximatelythe same if we plotperformanceas a functionof the high-intensity digital value a, since L.vg is a monotonicfunction of a, as indicatedby the horizontal axis labeled“a”, displayedbelow the L.,g axis in Fig. l(c) and (d).
We also experimentedwith a companion condition inwhich the effective luminanceL of elements “L” in Fig.l(a) was 5% lower than that of the background b, i.e.,L =(1 – c)~ < ~. An analysis similar to that of the
previous paragraph produces a qualitative predictionshown by the curve of Fig. l(c) labeled “L< ~“.Reichardt-typeand mdtion energy models (van Santen &Sperling,1985;Adelson & Bergen, 1985)predict that thetwo curves are mirror images of each other. Under thesimplifying assumption that stimulus motion is deter-mined solely by patc~ mean effective luminance, thetwo curves must meet~atthe 50% performance level forL,vg= LO,as shown in Fig. l(c).
However, suppose stimulus motion is not determinedsolelyby patch mean effectiveluminance. Supposethat,in addition, some ot$er, second-order patch attributeplays a role in dete~ining stimulus motion. (A likelysuch attribute would be patch contrast, the averageabsolute deviation of patch luminance from backgroundluminance.) By settin the effective luminance of the L
~patches close to ~, w hope to minimize contaminationfrom motion mechanisinssensitive to such second-orderattributes. Nevertheless, we cannot presume to haveeliminated all effects due to such mechanisms.
We make two assumptions about these hypothetical,second-order mechanisms. The first is that they do notdistinguishbetween L-patcheswith luminance(1 – e)~vs L-patches with luminance (1 + &)Lo;we assume thatthese two sorts of patches are equivalent tokens towhatever second-ordermechanisms may be involved indeterminingthe finalniotionpercept.This is a reasonableassumptionin view of full-waverectifyingcharacteristicsof second-ordermotion mechanisms(Chubb & Sperling,1988; Werkhoven et al., 1993; Solomon & Sperling,1994; Gorea, 1995). Our other assumption is that theexperimental variations in the pixel value a aresufficiently small that they do not significantly affectthe second-order attributes of the high-contrast C-patches.
The implication of these assumptions is that the netsecond-orderinfluence,on the elicited motion is constantacross all stimulus variations. This means that the onlyeffect of second-orderprocesses is to shift horizontallythe curves of Fig. l(c) by some amount. If, as seemslikely, second-orderinfluencesadd to motion strength inthe direction of the L-C path, then the curves for thecases L < ~ and L > ~ will be shifted to the right and tothe left, respectively,resulting in the predictionsof Fig.l(d); these shifts produce new 50% crossover pointsa*+> ~* and a*– <a*, respectively. Under the assump-
tion that the second-ordermechanismsare characterizedby full-wave-rectificationnonlinearities, the two curvesof Fig. l(d) are expected to be mirror images. Thus, areasonable estimate is that (a*+)–(a*) = (a*)–(a*–),and this is indeed what was obtained experimentally,within measurementerror (see Results section). Thus anaccurateestimatefor a* is obtainedby averaginga*+anda*–
One also realizes that second-orderprocessesexert thesame effect in each of the L > ~ and L c ~ conditions,raising the probability of L-C motion by some amount.Thus, insteadof findingthat the L > ~ and L c LOcurvesintersecteach other at the 50?6level (where theywould if

MEAN LUMINANCEOF TEXTUREDTARGETS 3779
100 0
Exa 75
v TVP oL (a)~ 50$
?’
t..o ‘&a
1$6.0 180.0 184.0 188.0 192.0
Setflrrgforbrightdotsof “C”elements
100.0 0
*
(b)
1 a1$6.0 100.0 184,0 188,0 192.0
5ettlngfor brightdotsof “C”elements
FIGURE 2. Results of two observers with the stimuli of Fig. 1.Percentageof perceivingmotionalongthe forwardL-C path is plottedas a functionof a, the luminanceof the bright dots in the texture patch.A comparison with Fig. l(d) shows close agreement of the
experimental results with the predictions of Fig. l(d).
there were no second-orderinfluences),these curvesmayintersectat some higher level as a result of the horizontalshifts. What is important to realize, however, is thatirrespective of the performance level at which thesecurves intersect, under our assumptions,the digitalvaluea* at which this cross-overoccurs must be the value forwhich Lav~= ~. Thus, anotherway to estimatea* (as thepoint of intersection) is to use the performance data forthe L > L. and L c b cases, to fitpsychometriccurves tothe two data sets (using a maximum likelihood fittingprocedure), and to get the cross-overpoint.An additionalvirtue of locatinga* as the pointof intersectionfollowingcurve-fitting rather by averaging a*+ and a* is that itallows one to bootstrap confidence intervals for theestimate of a*. We tried this approachon the data of Fig.2, and the resuItingestimate of a* was remarkably closeto that obtained by using ((a*+)+ (a*‘))/2.
In summary, if our data conform to the predictionsofFig. l(d), then we will concludethat L,vg= LOoccurs forthe value of a at which the two curves intersect, andassume that any vertical displacement of this crossoverpoint from the 50% level of performance must beattributed to second-orderinfluences.
Stimuli
Stimuli were generated by a Silicon Graphics IRIS
graphicsworkstation,which is capable of displaying256luminance levels (8-bit digital-to-analogconverters) percolor gun. Three different color monitors were used:Monitor 1 was a Sony GDM-17E11; monitor 2 was aMitsubishi HL7965KW-SG; monitor 3 was a HitachiCM2086A3SG.We used exclusivelythe green gun in allexperiments.The viewing distancewas fixed at 218 cm.In mostof the experiments,each of the randomdotsin the“C” targetswas a 3-by-3pixel squarewith a side of 1.25minutes of arc, but we also report results with other dotsizes. Targets were rectangularblocks against a uniformbackground. The spatial period within a frame is theinter-target center-to-center distance, which was fourtimes the targetwidth w, producinga fundamentalspatialfrequencyof l/(4w), expressed in cycles per degree, if wis given in degrees of visual angle. The inter-framedisplacementwas equal to w, resultingin a quarter-cycledisplacement. Several choices of w were tried, whereasthe heightwas fixed, subtendingan angle of 0.5 deg. Thebackgroundfilledthe entire screen,but two bIackverticalstrips covered the left and the right ends of the screen,serving as occluders, and forming an aperture 4.72 degwide by 7.06 deg high. These strips created theimpressionthat targets emerged from under one strip atone end and disappearedunderneaththe strip at the otherend, to avoid artifacts in the motion percept (edgeeffects).
GeneralprocedureThe temporalsequencefor each trial was as follows.A
fixation point (square with a side of approximately4.2 min of arc and luminance 32.3 cd/m2) appeared byitself for 50 msec before the motion stimulus, andremained visible as long as the animation sequencewasdisplayed. Luminance were measured with a MinoltaChroma Meter CS-1OO.The fixationpoint was centeredhorizontally,and its verticaldistancefrom the (fictitious)horizontal line passing through the mid-heights of thetargets is loosely referred to as the eccentricity. Eachframe in the animation sequence lasted for a fixedinterval, denoted as FD (frame duration),with a variableinter-stimulusinterval 1S1.The direction of motion wasrandomizedfrom trial to trial. At the end of the trial, theobserver pressed one of two keys to signify motiondirection to the left or to the right in a two-alternativeforced-choiceparadigm.No feedback was provided.Thenext trial commencedimmediatelyafter the responsekeywas pressed.
The first author served as an observer in all experi-ments, includingpilot sessions.His vision was correctedto normal. Another naive observer with normal visionparticipated in all the experiments reported here.Observers viewed the display binocularly, with naturalpupils. In both variant procedures described below (aconstant-stimuliand a staircase), the digital values of m(background)and b (low-intensitydots) were fixed andthe observer’stask was to report the direetion of motion.

3780 T. V. PAPATHOMASet al.
Experiment 1: Constant-stimui7procedure
We first employed a constant-stimuli procedure, inwhich the value of a was fixed within each block of 50trials. Performance was obtained as a function of a,measured as percentage of responsesthat favored the L-C path. Two conditions were tested: (i) L =(1 + @~ > ~, and (ii) L =(1 – ez)~ c ~, as explainedabove. The value of a was selected at random fromblock to block, and each value was tried in at least threeblocks, so that each datum point on Fig. 2 representstheaverage of at least 150 trials. We tried several combina-tions of values for FD, 1S1,and eccentricities. Further-more, we conducted the same experiments on threedifferent monitors, which allowed a wide range ofluminance values to be tried (see Results section). Thevalues of m and b were kept fixed throughout theexperiment, as mentioned above.
Experiment 2: Successive-approximationstaircasepro-cedure
The steep slope of the psychometric curves of Fig. 2(see Results section) allowed us to develop an efficientmethod for estimatinga* accurately.It employsstaircaseproceduresfor obtainingthe 50% “crossover” values a*+and a*– of Fig.l(d),andthenestimatesa* b averaging
a*+and a*–. The same stimulusof l(a) was used in thisprocedure with the same spatiotemporalconditionsas inExperiment 1, and the observer’s task was to report thedirectionof motion, as before. The goal was to adjust thevalue of a, based on the observer’s responses, such thatthey would converge to a*– for L > h and to a*+ forL c ~. Let us considerthe case L > h (the case L < b isentirely symmetric). If the observer’s response favoredthe L–C path, the value of a was lowered by one bit-count; conversely,if the observerfavored the reverse-phipath, the value of a was incremented by one bit-count.Two independent randomly interleaved staircases wererun simultaneouslyin each block of trials. The stoppingcriterion in each staircasewas to reach 20 reversals, andthe value of a*+(or a*–) was computedas the averageof
the a values at the last 16 reversals.
Experiment 3: Minimum-flickerprocedure
We also designed and conducted a minimum-flickerexperiment, similar to the one described by Nishida(1993), to compare the results of the proposed methods.Flicker was generated by alternating two frames intemporal sequence at a rate of 10 Hz. Each frame wasformed by a checkerboard pattern of 10x 10 squareblocks. In the first frame, odd blocks had a uniformeffective luminance ~, and even blocks containedpatches of T,,~. In the second frame, the contents ofodd and even blockswere exchanged.The rapid temporalalternation results in the perception of flicker, which isexpected to be minimum at effective equiluminance,because this is the condition for which there is no neteffective luminance difference between the two types ofblocks. The values of h and b were fixed and observersadjustedthe value of a so as to arriveat the desiredsetting
a* which would minimize the perceived flicker. Thisadjustment was made possible by two buttons whichobservers could press to increment or decrement thevalue of a. Observers pressed a third button when theyarrived at minimum flicker, and the value of a wasrecorded. Simultaneously, a new trial began, with arandom initialvalue for a, and the block terminated after10 trials. We matched the spatiotemporalconditions tothose of the motion experiments.
RESULTS
Experiment 1
The results in Fig. 2 were obtainedon monitor3 for thefollowingconditions:PO= 11.1 cd/m2,b = 60 (a uniformfield B of value b =60 yields a physical image P(B) ofluminance 2.94 cd/m2). The results reported here wereobtained with w = 10 minutes of arc and an eccentricityof 3.33 deg. Performance as a function of a is shown inFig. 2, using six frames with FD =50 msec and1S1= Omsec. Data for conditions(i) P = (1 + tl)PO> PO,and (ii) P = (1 —82)P0c P. are shownby open and solidcircles, respectively,correspondingto the curves labeled“ L > ~“ and “L c ~“ in Fig. l(d). Data were obtainedwith P = (1 + el)Po= 12.2 cd/m and P = (1 – 62)P. = 10.3 cd/m2.As seen from Fig. 2, the performancecurves conformvery well to the predictionsof Fig. l(d).Psychometricfunctions were fit (Weibull, 1951; Nelder& Mead, 1965)for the points lying on the two curves (forL > ~ and L c ~), and a* was obtained as the point ofintersection. This value was 184.23 and 183.73 forobserversTVP and .JWM.The 50Y0cross-overpointsa*+and a*– were also obtained from the fitted curves, and
their values for observer TVP (JWM) were 186.26(185.52) and 182.80 (182.48), respectively, resulting inan averaged estimate for a* =((a*+)+ (a*‘))/2 withvalues 184.53 (184.00), which agree closely with thepoint-of-intersection estimates above. The transitionfrom favoringforward-phi( >50%)to reverse-phimotion( <50%) occurs around a very limited range of digital avalues. Points along the horizontal axis are spaced apartby just one bit-count, i.e., l/256th of the full range of theluminance, which represents the finest resolution of thecolorgun outputs.Thisallowsvery accurateestimatesfora*, especiallysincea* is located close to the 50?Z0points,where the slopes of the curves are steepest.
Experiment 2
The stopping criterion of 20 reversals was reachedquickly, typically within 40-60 trials per staircase,depending on the starting point. In addition to fastconvergence, this technique yielded repeatable resultswith very low standarddeviations. For example, the casewith P = (1 + el)Po= 12.2cd/m2,m = 127and b = 60 wasrun 10 times for obseryer TVP (JWM), with a resultingaverage of 182.01 (182.40) for a*– and a standarddeviation of 0.921 (0.893); the correspondingvalues forP =(1 – @P.= 10.3cd/m2were 185.46(185.20)for theaverageof a*+with a standarddeviationof 0.991 (1.671)

MEAN LUMINANCEOF TEXTUREDTARGETS 3781
TABLE 1. Values of a*, obtained both photometricallyand psychophysically,as a function of dot size
Dot size (pixels) 1 2 3 4 6 ‘8 16
Monitor1 6* (obtainedphotometrically) 202.0 194.5 189.5 188.3 187.8 187.5 187.51 a* ( II psychophysically) 202.0 195.1 190.4 188.6 188.8 188.0 187.82 ~v ( “ photometrically) 201.0 190.0 184.3 182.0 182.0 182.0 182.02 a* ( II psychophysically) 197,3 188.7 182.7 182.1 182.6 182.5 183,7
for observer TVP (JWM). These values yield theaveraged estimates for a* of 183.74 for TVP and183.80 for JWM. This procedure was tried with a widerange of spatiotemporalparameters and luminancelevels(see below). As expected, the values obtained agreeclosely with those resulting from the constant-stimulivariant of the experiment. The same eccentricity of3.33 deg was used.
Experiment 3The equiluminant settings obtained from the two
psychophysical procedures above agree very closelywith each other, as expected. More importantly, theyagree closely with the settings obtained with theminimum-flickertechnique,thus offering an independentverification for the validity of the reverse-phi methodpresented in this paper. Under foveal viewing, observersreported that there was a wide range of values of a forwhich flickerappeared to be minimal,which made it hardto assess a* with precision. This is reflected in thevariance of the values. With the minimum-flickerprocedure, observer TVP (JWM) had an average of182.40(183.00) for the digital setting a* with a standarddeviation of 4.671 (3.091), obtained with 10 trials. Acomparison of standard deviations showsthe superiorityof the motion procedures in terms of reliability. Anadditionaladvantageis that it allows the experimentertomatch the spatiotemporalconditions to desired ones formotion experiments involving equiluminous texturepatches.
To examinemonitorartifacts,we used a photometertomeasure the physical mean luminance of checkerboardtexturesby ensuringthat the measurementapertureof thephotometer (aperture diameter was equivalent to 98pixels on the screen) was much larger than the texture’sdot size. These textures were composed of square (n x npixels) dots, where n varied in the range 3–16 pixels,having two digital inputsa and b with a > b. We kept thevalue of b fixed and we varied a to find a value 6*, forwhich the mean physical luminance achieved a desiredlevel PO(correspondingto a digital inputof NO).Initially,we measured the luminance corresponding to a fixeddigital inputj by filling the entire screen with a uniformpattern. In this manner we obtained the physicalluminance P, and P~ that correspond to a and b,respectively. If there were no interactions between thebright and dim dots of the checkerboardtexture, then itsmean physical luminancewould be (P. + pb)/2; thus, thedesired P. would be obtained by supplying for ii” the
VdUt3 correspondingto the luminanCe2p. —pb, i.e., d*would be independent of the dot size. Two differentmonitorswere tried (see the Methods section), with thevalues of b and NOfixed at 60 and 127, respectively,forboth. For monitor 1, P~= 13.6 cdlmz, PO=32.8 cd/m2;for monitor 2, Pb= 7.24 cd/m2, P.= 21.4 cd/m2.Accordingly, the luminance P,* of the bright dots thatshouldyield the desired average luminanceP. is 52.0 cd/m2 for monitor 1 and 35.56 cd/m2for monitor 2, whichcorrespond to (interpolated) inputs of 187.0 and 180.5,respectively.
However, when we measured the luminance with aphotometer,we found that d“ varied systematicallywithdot size, as shownin Table 1 for the two monitors(valuesare shown as non-integers,because we used interpolationto estimate6* when no integervalue of a would yield thedesired measurement PO). As shown in Table 1, ii’stabilizes around 187.5, near its photometrically pre-dicted value of 187.0 in monitor 1 for n >6, butconverges to a slightly different value (182.0) than thepredicted value (180.5) for monitor 2. In both cases, a*starts significantly higher than the predicted value forsmall n, and grows progressively closer to it as n getslarger. When the dot size n is small, one needs largervalues of a to get the mean luminance P. that wasobtained for large dot sizes.
To compare these photometricsettings to our psycho-physicalprocedures,we used exactly the same settingsasaboveand we conductedthe staircaseexperimentonly onobserver TVP, given the negligible inter-observerdifferencesreported above.The same two monitorswereused, and the resulting values of a* are also shown inTable 1 (rows2 and 4 for monitors1 and 2, respectively),exhibiting close agreement with the photodetector’smeasurements (rows 1 and 3 for monitors 1 and 2,respectively).However,when texturesof the typeTa,bareused, things are not as simple as with checkerboardpatterns,which have well structuredspectra in the spatialfrequency domain. Ta,b-type textures have a muchbroader spectral composition, because they compriserandom-dot patterns, and it is difficult to analyticallypredict Pavgfor such a pattern based on the checkerboardreadings. One way to obtain P.v~is to generate severalinstancesofTa,bpatches, and obtain the average of theirphotometric outputs. However, when we tried thisapproach, the meter’s readings varied widely as thepattern changed, because of the formation of clusters ofbrighter dark dots; for instance,we used a dot size of 3pixels on monitor 1, and kept b fixed at 60 (pb =13.6 cd/

3782 T. V. PAPATHOMASet al.
TABLE 2. Variation of a*-, a*+, and a* as a functionof FD, ISI, andeccentricity
FD (msec) 1S1(msec) Ecc. (deg) a*- U*+ a“
50 0 3.3 189.5 191.3 190.4150 50 3.3 187.6 192.7 190.250 0 0.0 187.5 192.7 190.1
150 50 1.65 181.5 202.0 191.8150 50 0.0 Staircases did not converge
mz). With an average of 20 photometerreadingsfor eachvalue of a we obtainedmean luminance of 33.43, 33.64,32.84, and 33.24 cd/m2 for a = 192, 193, 194, and 195,respectively,which is not even a monotonicallyincreas-ing sequence, as it should be. Thus one has to make anexcessively large number of measurements to get P,vg,since the variance is high. In contrast, the staircasemethod yields resultswith much lower variance, and it ismuch more efficient than using a photometer.
The techniques described here can also be used toassess the relative contribution of the putative second-order system to the overall motion percept. When thespatiotemporalparameters in the experiments are morefavorable to this systemthan the values reported thus far,we expect the curves correspondingto L > ~ and L c ~to shift further away, resulting in more disparate valuesfor a“- and a*+.The second-ordersystem is favored byfoveal viewing and by large FD and 1S1(Sperling, 1989;Papathomaset al., 1995;Papathomaset al., 1994,Gorea,1995). We varied these parameters using random-dottextureson monitor 1, with dot size set at 3 pixels and allthe other values set as above. Table 2 shows how thevalues of a*– and a*+ changed as FD, 1S1, andeccentricitywere varied.
The values of a“– and a*+drifted away when eitherthe temporal conditions or the eccentricity were varied,and the drifting was in the predicted direction. Theydrifted the most when both were varied to favor thesecond-order system. In fact, as the last row of Table 2indicates, the staircase procedure did not converge at allfor the conditionsthatwere most favorableto this system.This is indeed what is expected: motion is always seenalong the L-C path, never in the reverse-phi direction.Therefore, the curves never cross the 50% line, andconvergence is impossible. The data of Table 2 alsoprovide evidence that the two curves are indeedsymmetric around the a* point, since the resulting a*changed little for a wide range of experimental condi-tions.
DISCUSSION
It is not necessary to posit separate first- and second-order mechanismsto obtain the predictionof Fig. l(d). Itis quitepossibleto obtainequallygood predictionswith asingle-system model. For instance, our data might beexplained in terms of a mechanism that applies motionenergy analysis to the output of an image transformation
that is sensitiveboth to mean effective luminance and totexture contrast. Such a single system could exhibit theputative first- or second-order system characteristics,depending on the experimental conditions, which mayfavor first- or second-ordermanifest conduct. The valueof the techniques proposed in this paper, however, isindependentof which neural architecture (single systemvs multiple separate motion systems) is actually im-plemented in the visual brain.
The curves for L > ~ and L c ~ in Fig. 2 are quiteclose to symmetric, and any possible deviation could beexplainedby a number of reasons: (1) the small numberof points along each curve; (2) the ability of the Weibullfunction to approximatethe data; (3) another possibilityfor a slight asymmetry is that the luminance of the twouniformtargetslabeledL in Fig. l(a) (whichwere used toobtain the two curves) were not symmetric with respectto ~ = 11.1 cd/m2. The bright one (Ll > ~) was 12.2cd/m2, the dim one (~ c Q was 10.3 cd/m2, resultingin DeltaL1= 1.1 cd/m2 and DeltaL2= 0.8 cd/m2.(4) Finally, another fac}ormay be the different mannerin which luminanceincrementsvs decrementscontributeto the perception of motion (Wehrhahn & Rapf, 1992;Mather et al., 1991;Shechter & Hochstein, 1990).
The stimulus of Fig. l(a) is analogous to thatdeveloped for obtaining effective equiluminance forchromatic stimuli (Gorea et al., 1993), where theobjectivewas to find the setting of a test color, say red,that is equiluminantto a reference color, say yellow. Thestimulushad the samex-t structureas shownin Fig. l(a),where the “L” elements were isochromatic to thereference (yellow) background, with luminance above(or below) thebackground.The only differenceis that the“C” elements in Fig. l(a) were chromatic test (red)patches, the intensity of which was varied to obtainequiluminance.As a result, the procedurespresentedheresharea basic advantagewith motion-basedtechniquesforchromatic equiluminance (Anstis & Cavanagh, 1983;Gorea et al., 1993). That is, they elicit an ambiguousdirection of motion when the test patch is nearlyequiluminous with the reference background. As theeffective luminance of the test patch becomes higher orlower than the reference value, one observes that thedirection of motion reverses. Since the techniqueinvolves opposite velocity judgments, the equiluminantsetting is easily obtained, making it appropriate forpsychophysical experiments with monkeys, just as theminimum-motiontechniquewas for color (Logothetis&Charles, 1990).
The present techniqueis not limited to texture patchesthat are composed of equal numbers of dim and brightdots. It is easily applicable to textures with arbitraryproportionsof dots. Similarly, there is nothing about themethod that places limits on the typesof texturesthat canbe handled. Thus, one may use texture patches that arecomposed of bright (or dim) randomly oriented bars, orany other pattern, against a dim (or bright) background.The only constraint is that the texture have twoluminance levels or, more generally, that it have several
MEAN LUMINANCEOF TEXTUREDTARGETS 3783
luminance levels, but only one of them maybe varied toaffect the mean effective luminanceof the entire patch.
Brown (1995)used a variant of Anstis and Cavanagh’s(1983) heterochromatic motion equiluminance techni-que, modified by Ledgeway and Smith (1994). Hereported that the effective luminance of a striped-barstexture that was obtained psychophysicallywas as muchas 33V0below its mean photometric luminance. Ourresults, obtained with the checkerboard textures, did notexhibit such disparities between psychophysical andphotometric data. However, we also found that thepsychophysicallyobtained value of a for a random-dotpattern was consistentlylower, by about 2%, than that ofa checkerboard pattern with the same value for b, fortextures with small dot sizes. Results acquired with thepsychophysicallyobtained settings verified the absenceof net luminance residuals in a series of recentexperiments (Papathomas et al., 1996). In view of thecompressive nonlinearity in the human visual system’sresponse to luminanceinputs,psychophysicaltechniques.,must be preferred to photometric methods for obtainingequiluminantcontrast-definedelements devoid of effec-tive luminance residuals.
The present method can be used to obtain textures thatare equiluminant to each other with respect to theirspatial mean value. For example, if it is desired to havetexture patches of type T1 and T2 that have the sameaverage effective luminance L. but different contrasts,then the procedures can be applied in sequence to findequiluminant settings for T1 and then for T2 against abackgroundof uniform luminance~. This allowsone todesignexperimentsin which the backgrounditself is non-uniform (texture Tl), against which are displayedcontrast-definedtargets (texture T2).
The high level of precision afforded by the techniquepresented in this paper minimizes artifacts caused bymean effective luminance differences and allows theisolation of putative contrast-drivenmechanisms. Thus,the settingsobtainedfrom thisprocedurecan alsobe usedin experimentsin which dynamicrandom-dottexturesareemployed to investigate contrast-driven mechanisms,such as in motion (Werkhoven et al., 1993; Solomon &Sperling, 1994; Cavanagh, 1995), textural grouping(Werkhovenet al., 1992),or stereopsis(Sato & Nishida,1993).
REFERENCES
Adelson,E. H. & Bergen,J. (1985).Spatiotemporalenergymodelsforthe perceptionof motion.Journal of the Optical Society ofAmerica,2A, 284-299.
Anstis, S. M. (1970). Phi movement as a subtraction process. VisionResearch, 10, 1411–1430.
Anstis, S. M. & Cavanagh,P. (1983). A minimum motion techniquefor judging equiluminance. In Mellon, J. and Sharpe, R. T. (Eds),Colour vision: Physiolo~ and psychophysics (pp. 155–166).NewYork: Academic Press.
Brown, R. O. (1995). Luminance nonlinearities and second-orderstimuli. Investigative Ophthalmology and Visual Science, 36, S51.
Cavanagh,P. (1992).Attention-basedmotionperception.Science,257,1563–1565.
Cavanagh, P. (1995). Is there low-level motion processing for non-
luminance-basedstimuli? In Papathomas,T. V., Chubb, C., Gorea,A. & Kowler, E. (Eds), Early vision and beyond (pp. 113-119).Cambridge,MA: MIT Press.
Cavanagh,P. & Mather, G. (1989). Motion:The long and short of it.Spatial Vision, 4, 103–129.
Chubb,C., McGowan,J., Sperling,G., & Werkhoven,P. (1994).Non-Fourier motion analysis. In High-order processing in the visualsystem (pp. 193–205). Chichester, UK: Wiley (Ciba FoundationSymposiumNo. 184).
Chubb, C. & Sperling, G. (1988). Drift-balanced random stimuli: Ageneralbasis for studyingnon-Fouriermotionperception.Journal ofthe Optical Socie~ of America, 511, 1986-2006.
Chubb, C. & Sperling, G. (1989), Second-order motion perception:Space-time separable mechanisms. Proceedings: Workshop onvisual motion, (20-22 March 1989, Irvine, California), (pp. 126138).Washington,D.C.: IEEE ComputerSociety Press.
Gorea, A. (1995). Spatiotemporalcharacterization of a Fourier andnon-Fouriermotion system. Vision Research, 35, 907–914.
Gorea,A., Papathomas,T. V. & Kovacs,L (1993).Motionperceptionwith spatiotemporallymatched chromatic and achromatic informa-tion reveals a “slow” and a “fast” motionsystem. Vision Research,33, 2S15–2534.
Ledgeway,T. & Smith, A. T. (1994). Evidence for separate motion-detecting mechanismsfor first- and second-ordermotion in humanvision. Vision Research, 34, 2727–27’40.
Logothetis, N. K. & Charles, E. R. (1990). The minimum-motiontechnique applied to determine isoluminance in psychophysicalexperimentswith monkeys. Vision Research, 30, 829-838.
Mather, G., Moulden, B. & O’Halloran, A. (1991). Polarity specificadaptationto motion in the human visual system. Vision Research,31, 1013-1019.
McGowan,J. W. & Chubb,C. (1994).Evidencefor a second texture-defined motion channel. Investigative Ophthalmology and VisualScience, 35, 1406.
Nelder, J. A. & Mead, R. (1965). A simplex method for functionminimization.Computer Journal, 7, 308-313.
Nishida,S. (1993).Spatiotemporalpropertiesof motionperceptionforrandom-checkcontrast modulations.Vision Research, 33, 633-645.
O’Keefe, L. P., Caradini, M., Beusmans, J. M. H. & Movshon, J.A.(1993). MT neuronal responses to lst- and 2nd-order motion.Socie~ for Neuroscience Abstracts, 19, 1283.
Palmer, J., Mobley, L. A. & Teller, D. Y. (1993). Motion atisoluminance: Discrimination/detectionratios and the summationof luminanceand chromaticsignals.Journal of the Optical Societyof America, 10, 1353–1362.
Papathomas,T. V., Gorea,A. & Chubb,C. (1995).Separate lst-orderand 2nd-order motion systems or a single motion system?Investigative Ophthalmology and Visual Science, 36, S51.
Papathomas,T. V., McGowan,J. W., Chubb,C. & Gorea, A. (1996).Two neural pathways for Fourier and non-Fourier motion. 12thannual IEEE Northeast Biomedical Engineering Conference, NewBrunswick,NJ, March 1996.
Papathomas, T. V., Ramanujan, K. S. & Gorea, A. (1994). Reversegrouping in texture: Fourier and non-Fouriermechanisms. Investi-gative Ophthalmology and Visual Science, 35, 1667.
Reichardt,W. (1961).Autocomelation,a principlefor the evaluationofsensory informationby the central nervous system. In Rosenblith,W. A. (Ed.), Sensory communication. New York: Wiley.
Sate, T. & Nishida, S. (1993). Second-order depth perception withtexture-definedrandom-check stereograms. Investigative Ophthal-mology and Visual Science, 34, 1438.
Shechter,S. & Hochstein,S. (1990).On andOff pathwaycontributionsto apparent motionperception. Vision Research, 30, 1189-1204.
Solomon, J. A. & Sperling, G. (1994). Full-wave and half-waverectification in second-order motion perception. Vision Research,34,2239-2257.
Sperling,G. (1989).Three stagesandtwo systemsof visualprocessing.Spatial Vision, 4, 183–207.
Stoner, G. R. & Albright, T. D. (1992). Motion coherency rules areform-cue invariant. Vision Research, 32, 465475.
Teller, D. Y., Mayer, D. L., Makous,W. L. & Aflen, J. L. (1982). Do

3784 T. V. PAPATHOMASet al.
preferential lookingtechniquesunderestimate infant visual acuity?.VisionResearch, 22, 1017–1024.
van Santen, J. P. H. & Sperling, G. (1985). Elaborated Reichardtdetectors.Journal of the Optical Society ofAmerica, 2A, 300-321.
Watson, A. B. & Ahumada,A. J. Jr. (1985). Model of human visual-motion sensing. Journal of the Optical Society ofAmerica, 2A, 322–342.
Wehrhahn, C. & Rapf, D. (1992). ON- and OFF-pathways formseparate neural substrates for motion perception: Psychophysicalevidence.Journal of Neuroscience, 126, 2247–2250.
Weibull, W. (1951). A stochastic distribution function of wideapplicability.Journal of Applied Mechanics, 18, 292–297.
Werkhoven,P., Sperling,G. & Chubb,C. (1992).Energycomputationsin motion and texture. Annual meeting of the Optical Society ofAmerica, Albuquerque,NM, 25 September.
Werkhoven,P., Sperling,G. & Chubb,C. (1993).The dimensionalityof texture-defined motion: A single-channel theory. VisionResearch, 33, 463-485.
Acknowledgements—The authors thank Akos Feher for insightfulcomments and technical support. They also thank two (anonymous)reviewers and DavidaTellef, the section editor, for valuable feedbackthat helped us developthe techniquea little further, both conceptuallyand empirically, by distinguishing between physical and effectiveluminance. The research WLMsupportedby two grants from the U.S.National Science Foundationto TVP and AG, as well as to CC, andgrants by AT&T Foundation and the McDonnell-Pew Program inCognitiveNeuroscienceto TVP.


![PHI [101] - novel (in English)](https://static.fdokumen.com/doc/165x107/6323304a63847156ac06f569/phi-101-novel-in-english.jpg)


