Precipitation change in Southern Italy linked to global scale oscillation indexes
12
Nat. Hazards Earth Syst. Sci., 11, 1683–1694, 2011 www.nat-hazards-earth-syst-sci.net/11/1683/2011/ doi:10.5194/nhess-11-1683-2011 © Author(s) 2011. CC Attribution 3.0 License. Natural Hazards and Earth System Sciences Precipitation change in Southern Italy linked to global scale oscillation indexes T. Caloiero 1 , R. Coscarelli 2 , E. Ferrari 3 , and M. Mancini 1 1 Department of Environmental, Hydraulic, Infrastructures and Surveying Engineering (DIIAR), Politecnico of Milan, Milan, Italy 2 National Research Council – Research Institute for Geo-Hydrological Protection (CNR-IRPI), Cosenza, Italy 3 Department of Soil Protection, University of Calabria, Cosenza, Italy Received: 8 June 2010 – Revised: 1 February 2011 – Accepted: 2 February 2011 – Published: 15 June 2011 Abstract. This study investigates precipitation variability in five regions of Southern Italy (Campania, Apulia, Basi- licata, Calabria and Sicily) using a homogeneous database of about 70 rain gauges with more than 50 years of observation. First, a statistical analysis was performed through the Mann- Kendall non-parametric test in order to determine rainfall the trend on both yearly and seasonal scales. Then, the relation- ship between the rainfall and some teleconnection pattern in- dexes was investigated using Spearman’s test. The results show remarkable statistically significant negative trends for annual and winter aggregations in most part of the series. Moreover, a strong correlation has emerged between the tele- connection patterns and precipitation in Southern Italy, par- ticularly in winter and on the Tyrrhenian side of the study area. 1 Introduction Extensive research on climate change, and on its potential, large-scale, environmental and economic consequences, has been carried out during the last 20 years. In particular, rain- fall trend evaluations on large spatial scales have shown a sig- nificant increment in Northern and Central Asia, in the east- ern parts of North and South America, and in Northern Eu- rope (Sharma et al., 2000; Hamilton et al., 2001; Boyles and Raman, 2003). In contradistinction, growing dry conditions have been observed in the Sahel, in the Mediterranean area, in Southern Africa and Southern Asia (Hess et al., 1995; Liu et al., 2008; Lebel and Ali, 2009). Regarding the Mediter- Correspondence to: E. Ferrari ([email protected]) ranean area, several studies have been carried out to inves- tigate trends in annual and seasonal precipitation on a large scale (Kutiel et al., 1996; Piervitali et al., 1998; Xoplaki et al., 2006) and for entire nations or regions (Amanatidis et al., 1993; Esteban-Parra et al., 1998; De Luis et al., 2000; Fei- das et al., 2007; Del Rio et al., 2010). These analyses often revealed negative trends for annual and winter precipitation. Long precipitation records were investigated in Northern and Central Italy (Montanari et al., 1996; De Michele et al., 1998; Brunetti et al., 2006b) and in Southern Italy (Palmieri et al., 1991; Brunetti et al., 2004, 2006a; Cotecchia et al., 2004). In particular, significant annual and winter negative precipi- tation trends have been reported for limited areas of southern Italian regions, as in the case of Campania (Diodato, 2007; Longobardi and Villani, 2010), Basilicata (Piccarreta et al., 2004), Calabria (Coscarelli et al., 2004; Ferrari and Terra- nova, 2004; Caloiero et al., 2011) and Sicily (Aronica et al., 2002; Cancelliere and Rossi, 2003; Cannarozzo et al., 2006). Local changes in meteorological variables are mainly in- fluenced by atmospheric circulation (Parker et al., 1994; Hur- rel and Van Loon, 1997; Brunetti et al., 2002a): for this reason, planetary-scale indexes are used to investigate some phenomena of local climate variability. These indexes are based on the difference in sea level pressure between two geographic areas, called centres of climatic action. Such an approach, called teleconnection, shows that climatic condi- tions in different geographical areas, even when relatively far away from each other, are interdependent. The most important indexes are the Southern Oscillation Index (SOI), best known as El-Ni˜ no Southern Oscillation (ENSO), eval- uated between Tahiti and Darwin on the opposite sides of the Pacific Ocean (Ropelewski and Jones, 1987), the North Atlantic Oscillation Index (NAOI), which represents fluctu- ations in the difference of pressure between the Azores area Published by Copernicus Publications on behalf of the European Geosciences Union.
Transcript of Precipitation change in Southern Italy linked to global scale oscillation indexes
Nat. Hazards Earth Syst. Sci., 11, 1683–1694, 2011www.nat-hazards-earth-syst-sci.net/11/1683/2011/doi:10.5194/nhess-11-1683-2011© Author(s) 2011. CC Attribution 3.0 License.
Natural Hazardsand Earth
System Sciences
Precipitation change in Southern Italy linked to global scaleoscillation indexes
T. Caloiero1, R. Coscarelli2, E. Ferrari 3, and M. Mancini1
1Department of Environmental, Hydraulic, Infrastructures and Surveying Engineering (DIIAR), Politecnico of Milan,Milan, Italy2National Research Council – Research Institute for Geo-Hydrological Protection (CNR-IRPI), Cosenza, Italy3Department of Soil Protection, University of Calabria, Cosenza, Italy
Received: 8 June 2010 – Revised: 1 February 2011 – Accepted: 2 February 2011 – Published: 15 June 2011
Abstract. This study investigates precipitation variabilityin five regions of Southern Italy (Campania, Apulia, Basi-licata, Calabria and Sicily) using a homogeneous database ofabout 70 rain gauges with more than 50 years of observation.First, a statistical analysis was performed through the Mann-Kendall non-parametric test in order to determine rainfall thetrend on both yearly and seasonal scales. Then, the relation-ship between the rainfall and some teleconnection pattern in-dexes was investigated using Spearman’s test. The resultsshow remarkable statistically significant negative trends forannual and winter aggregations in most part of the series.Moreover, a strong correlation has emerged between the tele-connection patterns and precipitation in Southern Italy, par-ticularly in winter and on the Tyrrhenian side of the studyarea.
1 Introduction
Extensive research on climate change, and on its potential,large-scale, environmental and economic consequences, hasbeen carried out during the last 20 years. In particular, rain-fall trend evaluations on large spatial scales have shown a sig-nificant increment in Northern and Central Asia, in the east-ern parts of North and South America, and in Northern Eu-rope (Sharma et al., 2000; Hamilton et al., 2001; Boyles andRaman, 2003). In contradistinction, growing dry conditionshave been observed in the Sahel, in the Mediterranean area,in Southern Africa and Southern Asia (Hess et al., 1995; Liuet al., 2008; Lebel and Ali, 2009). Regarding the Mediter-
Correspondence to:E. Ferrari([email protected])
ranean area, several studies have been carried out to inves-tigate trends in annual and seasonal precipitation on a largescale (Kutiel et al., 1996; Piervitali et al., 1998; Xoplaki etal., 2006) and for entire nations or regions (Amanatidis et al.,1993; Esteban-Parra et al., 1998; De Luis et al., 2000; Fei-das et al., 2007; Del Rio et al., 2010). These analyses oftenrevealed negative trends for annual and winter precipitation.Long precipitation records were investigated in Northern andCentral Italy (Montanari et al., 1996; De Michele et al., 1998;Brunetti et al., 2006b) and in Southern Italy (Palmieri et al.,1991; Brunetti et al., 2004, 2006a; Cotecchia et al., 2004).In particular, significant annual and winter negative precipi-tation trends have been reported for limited areas of southernItalian regions, as in the case of Campania (Diodato, 2007;Longobardi and Villani, 2010), Basilicata (Piccarreta et al.,2004), Calabria (Coscarelli et al., 2004; Ferrari and Terra-nova, 2004; Caloiero et al., 2011) and Sicily (Aronica et al.,2002; Cancelliere and Rossi, 2003; Cannarozzo et al., 2006).
Local changes in meteorological variables are mainly in-fluenced by atmospheric circulation (Parker et al., 1994; Hur-rel and Van Loon, 1997; Brunetti et al., 2002a): for thisreason, planetary-scale indexes are used to investigate somephenomena of local climate variability. These indexes arebased on the difference in sea level pressure between twogeographic areas, called centres of climatic action. Such anapproach, called teleconnection, shows that climatic condi-tions in different geographical areas, even when relativelyfar away from each other, are interdependent. The mostimportant indexes are the Southern Oscillation Index (SOI),best known as El-Nino Southern Oscillation (ENSO), eval-uated between Tahiti and Darwin on the opposite sides ofthe Pacific Ocean (Ropelewski and Jones, 1987), the NorthAtlantic Oscillation Index (NAOI), which represents fluctu-ations in the difference of pressure between the Azores area
Published by Copernicus Publications on behalf of the European Geosciences Union.
1684 T. Caloiero et al.: Precipitation change linked to global scale oscillation indexes
and the Sea of Iceland (Hurrell, 1995; Hurrel and van Loon,1997), numerous block indexes like the European BlockingIndex (EBI), calculated between two points on the AtlanticOcean (Wallace and Gutzler, 1981), and the Arctic Oscilla-tion Index (AOI), defined as the leading Empirical Orthog-onal Function (EOF) of the Northern Hemisphere sea-levelpressure (SLP) anomalies poleword of 20◦ N weighted byarea (Thompson and Wallace, 1998, 2000). In addition tothese indexes, which represent the behaviour of the atmo-sphere on a large scale, there are others which are evaluatedon a smaller regional scale, such as the Mediterranean Os-cillation Index (MOI), calculated as the difference of pres-sure between the western and the eastern part of the Mediter-ranean basin (Conte et al., 1989); the Western EuropeanZonal Circulation Index (WEZCI), proposed by Slonosky etal. (2001) and constructed from Madrid, Barcelona, Lundand Trondheim; the Mediterranean Circulation Index (MCI),defined by Brunetti et al. (2002b) as the normalised pressuredifference between one station located in the North-westernMediterranean (Marseille) and another in the South-easternMediterranean (Jerusalem); and the Western MediterraneanOscillation Index (WeMOI), calculated as the difference be-tween the standardised values in surface atmospheric pres-sure in San Fernando (Spain) and Padua (Italy) (Martin-Videand Lopez-Bustins, 2006).
Brunetti et al. (2002b) have analysed precipitation and wetdays registered in Italy during the last half of the past cen-tury in relation to the NAOI, the WEZCI and the MCI. Thisstudy has demonstrated that the WEZCI and the MCI aremore suitable for representing Italian precipitation variabilitysince they capture a greater proportion of precipitation andwet day variance for all seasons. Specifically, the WEZCIis more representative of dry periods and the MOI moresuitable for representing wet conditions. Martin-Vide andLopez-Bustins (2006) consider the WeMOl significantly bet-ter than the NAOI to explain monthly pluviometric anoma-lies, and regard it as a useful tool to forecast torrential rain-fall events in the northwestern zones of the Mediterranean(the eastern part of the Iberian Peninsula and the South ofFrance).
In this study, we present the trend analysis of the annualand the seasonal rainfall series observed in Southern Italyduring the period 1916–2003 and the evaluation of the in-fluence of SLP anomalies on the pluviometric amounts. Forthe latter purpose, a correlation analysis between precipita-tion and some climatic indexes was performed using threeindexes: the large scale NAOI, for its well known effects onEuropean climate, and two local indexes, the WeMOI and theMCI, better centred on the Mediterranean basin. Finally, acomposite analysis has been performed taking only the win-ter precipitation and the NAOI into account.
2 Data and methodology
The data sets gathered in the present study for the observa-tion period 1916–2003 were collected from the hydrologi-cal reports of the former Hydrological Service. Given thatsome historical series lack information, especially during theWorld War II period (1940–1949), some data series werediscarded when the number of years of observation was toolow for statistical purposes (less than 50 years of observationdata); then data was checked for homogeneities. Among thevarious methods used to solve homogeneity problems, thereis currently no single objective one, and the choice of themost suitable procedure is strictly related to the data-set char-acteristics (metadata availability, station density, and so on)and to the region examined (Peterson and Easterling, 1994;Aguilar et al., 2003). The homogenization approach and thedatabase used in this work is similar to the one discussedin Brunetti et al. (2010). Instead of using one single ref-erence series (obtained, to say, as an average series of theneighbouring stations), each series was tested against otherseries by means of a multiple application of the Craddocktest (Craddock, 1979) in sub-groups of 5 series. The breaksignals of one series against all others were then collected ina decision matrix and the breaks were assigned to the singleseries according to probability. Whenever a break needed tobe corrected, the series used to estimate the adjustments waschosen among the neighbouring series, which resulted homo-geneous in a sufficiently long sub-period centred on the breakyear, and which correlated well with the one to be corrected.Several series were chosen to estimate the adjustments re-quired to improve their stability and to prevent unidentifiedoutliers in the reference series from producing bad correc-tions.
The trend analysis was performed through the applica-tion of the simple non-parametric Mann-Kendall (MK) test.This test is a rank-based method for evaluating the presenceof trends in time-series data without specifying whether thetrend is linear or non-linear (Mann, 1945; Kendall, 1962). Toquantify the trend, a parametric analysis through the linearregression (LR) on seasonal and annual rainfall was carriedout.
The connections between precipitation and large-scale at-mospheric patterns were investigated by means of the non-parametric Spearman’s rank correlation test applied to therainfalls and the climatic indexes (Spearman, 1904). Spear-man’s rank correlation coefficient (ρ) is a special case of thePearson’s product-moment coefficient in which the data areconverted to ranks and then the differenceD between theranks is calculated for each pair of observations. The test iswell suited for monotonically related variables, even whentheir relationship is not linear, as it is required in the caseof Pearson’s correlation coefficient.
Nat. Hazards Earth Syst. Sci., 11, 1683–1694, 2011 www.nat-hazards-earth-syst-sci.net/11/1683/2011/
T. Caloiero et al.: Precipitation change linked to global scale oscillation indexes 1685
The coefficientρ is then given by:
ρ = 1−6∑
D2
N(N2−1
) . (1)
whereD is the difference between the ranks of correspondingvalues of the two variables, andN is the number of pairs ofvalues.
The statistical significance of the regression was checkedby using the two-tailed test of the Student’s t-distribution byevaluating the probability of rejecting the null hypothesis re-garding the absence of any relationship for the values oft
with (N-2) degrees of freedom.The values of the climatic indexes used in the study
were provided by: the Climatic Research Unit (CRU) ofthe School of Environmental Sciences of the University ofEast Anglia in Norwich (http://www.cru.uea.ac.uk/cru/data/pci.htm) for the NAOI, the Institute of Atmospheric Sci-ences and Climate (ISAC) of the Italian National ResearchCouncil (CNR) for the MCI, and the Group of Climato-logy of the University of Barcelona, Catalonia, Spain (http://www.ub.edu/gc/English/wemo.htm) for the WeMOI.
With the aim to better assess the winter precipitation re-sponse to the climatic index variability, the composite nor-malised precipitation anomalies, corresponding to the ex-treme (negative and positive) NAOI phases, were computedfor each station as presented by Turkes and Erlat (2003). Thecomposite analysis refers to a negative (or weak) climatic in-dex anomaly phase corresponding to normalised index va-lues< −1 (NAOI−) and to a positive (or strong) climatic in-dex anomaly phase corresponding to normalised index values> +1 (NAOI+). Each winter rainfall series, characterised bya mean valuePm and a standard deviationσ , was dividedinto two subseries corresponding to the two different climaticindex anomaly phases. Then, for each subseries, the meanprecipitation (pm) and the Composite Normalized Anomalies(CNA), given by the ratio between the difference (Pm−pm)and the standard deviationσ , were calculated to provide ev-idence of the influence of the extreme NAOI phases on thewinter precipitation amounts.
3 Case study
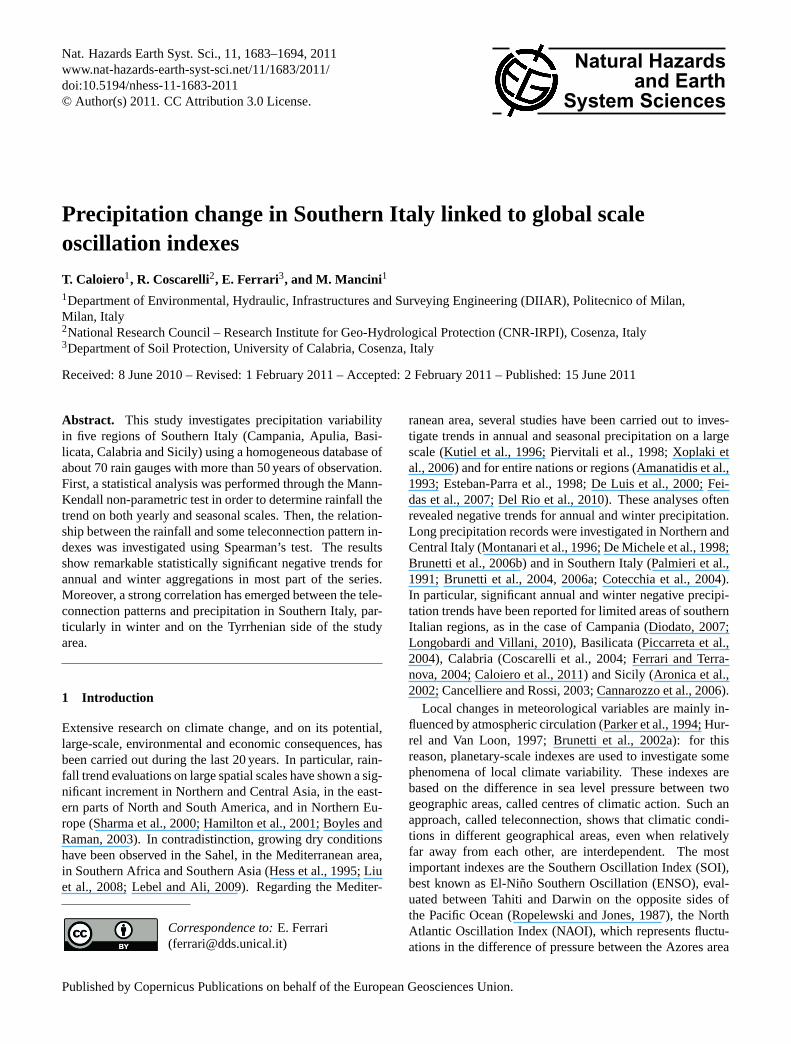
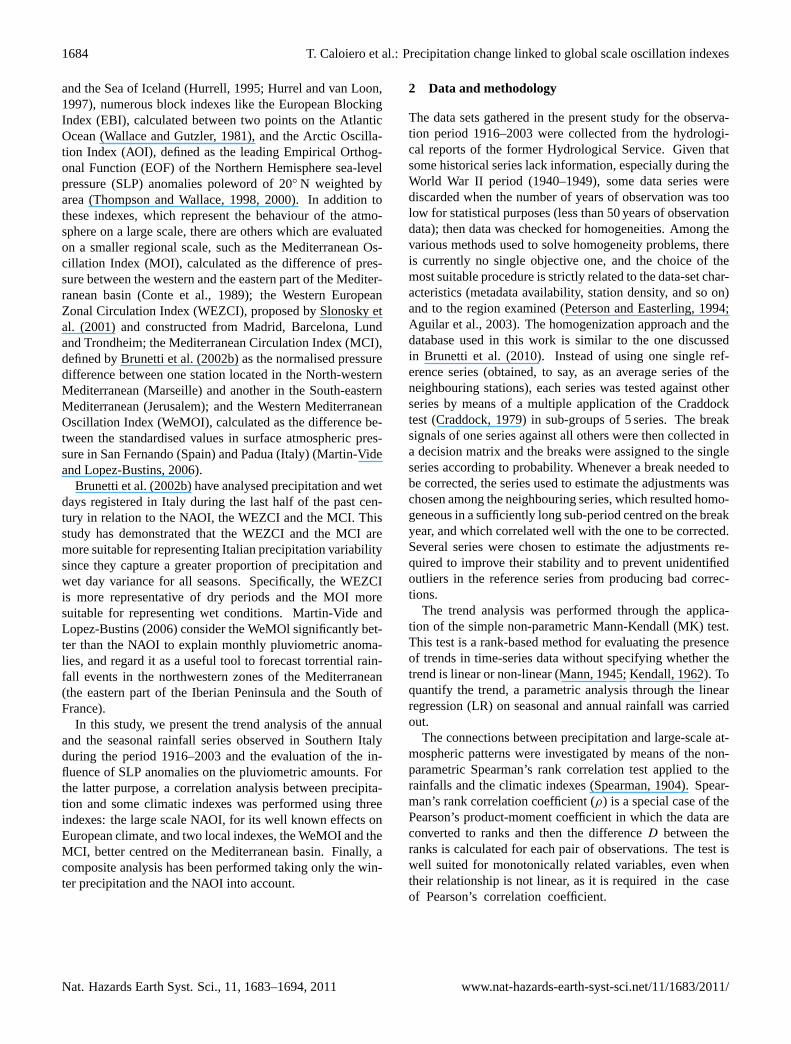
The hydrological series analysed in this work are the sea-sonal and the yearly rainfall data observed in five regions ofSouthern Italy (Campania, Apulia, Basilicata, Calabria andSicily), which occupy a total area of about 85 000 km2. Asa result of the homogenisation procedure, 42 out of the 71daily precipitation series were homogeneous, 26 were ho-mogenised, and 3 were discarded because of their extremelylow quality. Consequently, 68 rainfall series with an ave-rage density of 1 station per 1250 km2 were considered inthis work (Fig. 1). The mean monthly rainfall distributionsin the five regions clearly evidence the typical characteris-tics of the Mediterranean regime, with lower values observed
in the summer period and higher values recorded during au-tumn and winter (Fig. 2). In summer, the Azores anticyclone,extending over Southern Italy, favours a rather dry and tem-perate climate, while breeze circulations develop on the coastand inland (Federico et al., 2000). In winter, fall and spring,when the Azores anticyclone retreats and the Siberian highextends over Northern Europe and Scandinavia, the Mediter-ranean cyclone develops, reaches Southern Italy and deter-mines a colder and more humid climate than in the sum-mer. In most parts of Southern Italy, orography controls therainfall amount and distribution over the regions, as foundonly for the Calabria region by Colacino et al. (1997), whoalso showed that the interaction between the orography andmesoscale circulations leads to a precipitation gradient be-tween the eastern and western side of the peninsula. Numer-ical simulations of severe weather showed the crucial roleplayed by orography, which enhances rainfall in localisedspots (Federico et al., 2003a, b) or forces secondary cy-clogenesis persisting over the Ionian side of Southern Italy(Federico et al., 2007).
4 Discussion
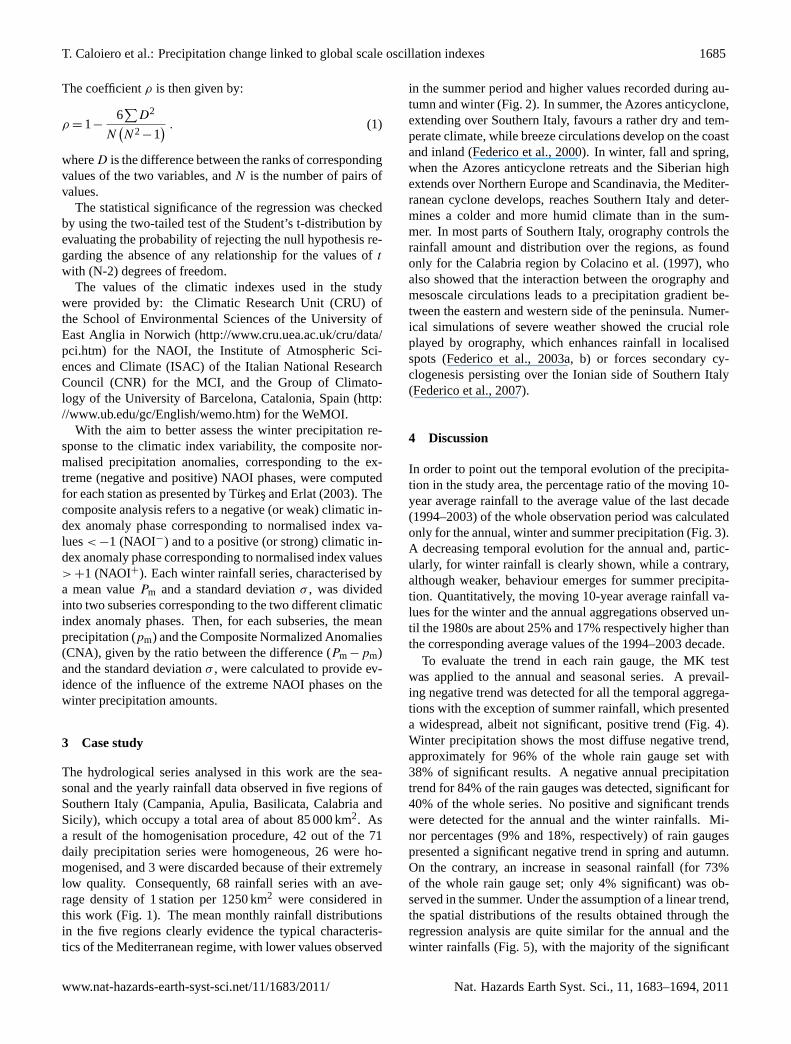
In order to point out the temporal evolution of the precipita-tion in the study area, the percentage ratio of the moving 10-year average rainfall to the average value of the last decade(1994–2003) of the whole observation period was calculatedonly for the annual, winter and summer precipitation (Fig. 3).A decreasing temporal evolution for the annual and, partic-ularly, for winter rainfall is clearly shown, while a contrary,although weaker, behaviour emerges for summer precipita-tion. Quantitatively, the moving 10-year average rainfall va-lues for the winter and the annual aggregations observed un-til the 1980s are about 25% and 17% respectively higher thanthe corresponding average values of the 1994–2003 decade.
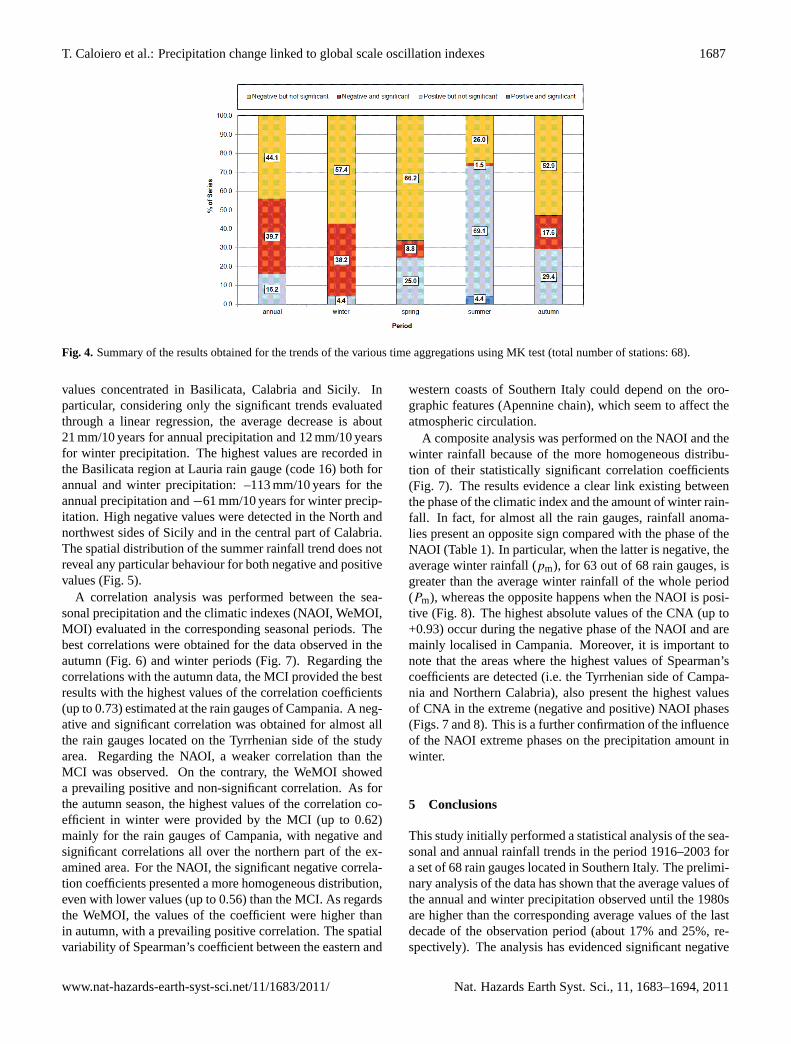
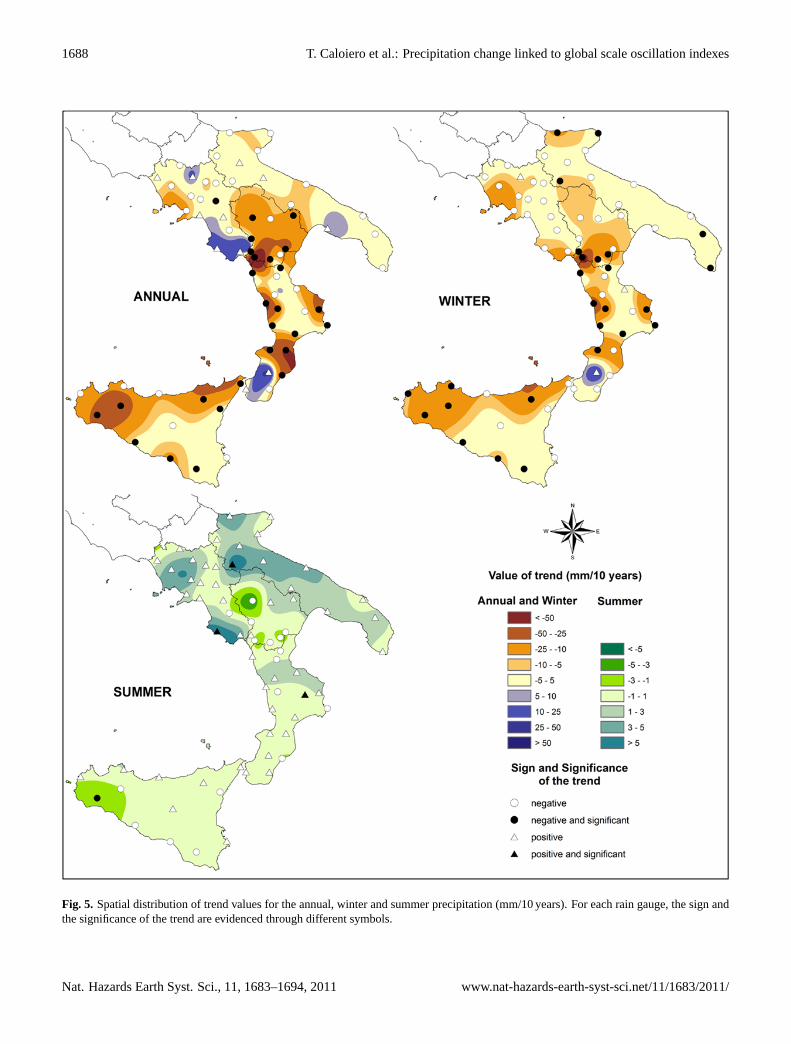
To evaluate the trend in each rain gauge, the MK testwas applied to the annual and seasonal series. A prevail-ing negative trend was detected for all the temporal aggrega-tions with the exception of summer rainfall, which presenteda widespread, albeit not significant, positive trend (Fig. 4).Winter precipitation shows the most diffuse negative trend,approximately for 96% of the whole rain gauge set with38% of significant results. A negative annual precipitationtrend for 84% of the rain gauges was detected, significant for40% of the whole series. No positive and significant trendswere detected for the annual and the winter rainfalls. Mi-nor percentages (9% and 18%, respectively) of rain gaugespresented a significant negative trend in spring and autumn.On the contrary, an increase in seasonal rainfall (for 73%of the whole rain gauge set; only 4% significant) was ob-served in the summer. Under the assumption of a linear trend,the spatial distributions of the results obtained through theregression analysis are quite similar for the annual and thewinter rainfalls (Fig. 5), with the majority of the significant
www.nat-hazards-earth-syst-sci.net/11/1683/2011/ Nat. Hazards Earth Syst. Sci., 11, 1683–1694, 2011
1686 T. Caloiero et al.: Precipitation change linked to global scale oscillation indexes
17
1
2
Figure 1. Localization of the rain gauges used in the applications. 3
4
Fig. 1. Localization of the rain gauges used in the applications.
Fig. 2. Distributions of the ratios between the average monthly andannual rainfalls in the five regions of Southern Italy.
Fig. 3. Percentage ratios of the moving 10-year average rainfallto the average value of the decade 1994–2003 for the summer, thewinter and the annual aggregations.
Nat. Hazards Earth Syst. Sci., 11, 1683–1694, 2011 www.nat-hazards-earth-syst-sci.net/11/1683/2011/
T. Caloiero et al.: Precipitation change linked to global scale oscillation indexes 1687
Fig. 4. Summary of the results obtained for the trends of the various time aggregations using MK test (total number of stations: 68).
values concentrated in Basilicata, Calabria and Sicily. Inparticular, considering only the significant trends evaluatedthrough a linear regression, the average decrease is about21 mm/10 years for annual precipitation and 12 mm/10 yearsfor winter precipitation. The highest values are recorded inthe Basilicata region at Lauria rain gauge (code 16) both forannual and winter precipitation: –113 mm/10 years for theannual precipitation and−61 mm/10 years for winter precip-itation. High negative values were detected in the North andnorthwest sides of Sicily and in the central part of Calabria.The spatial distribution of the summer rainfall trend does notreveal any particular behaviour for both negative and positivevalues (Fig. 5).
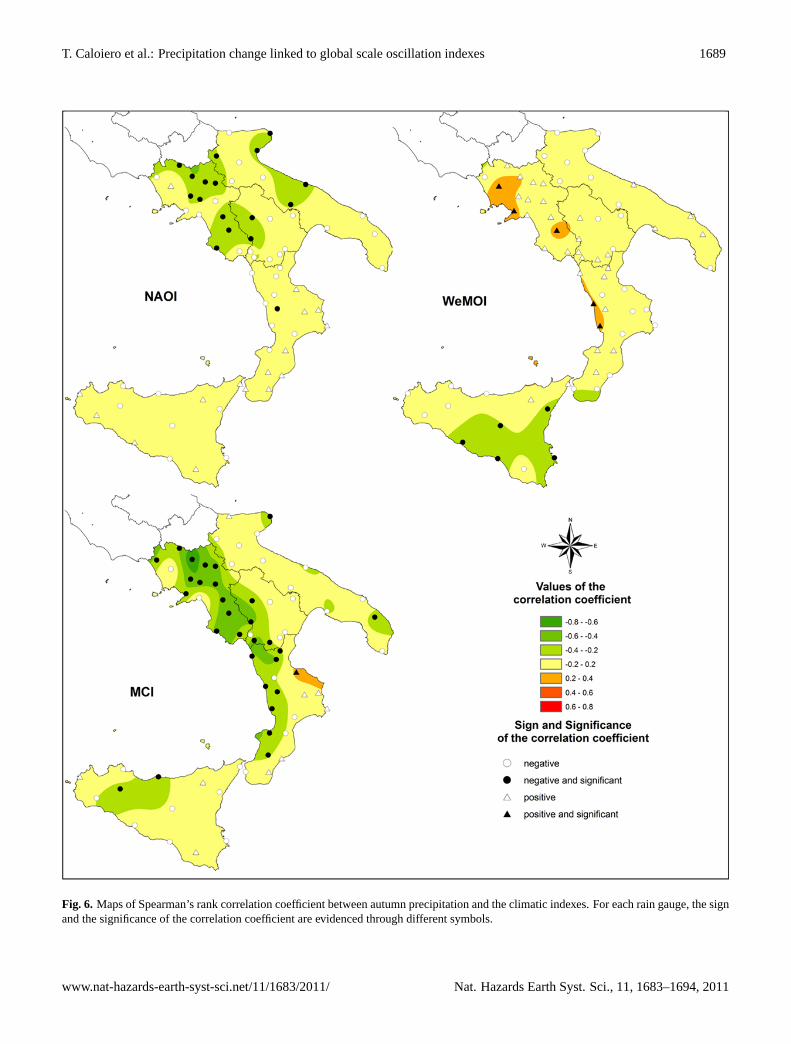
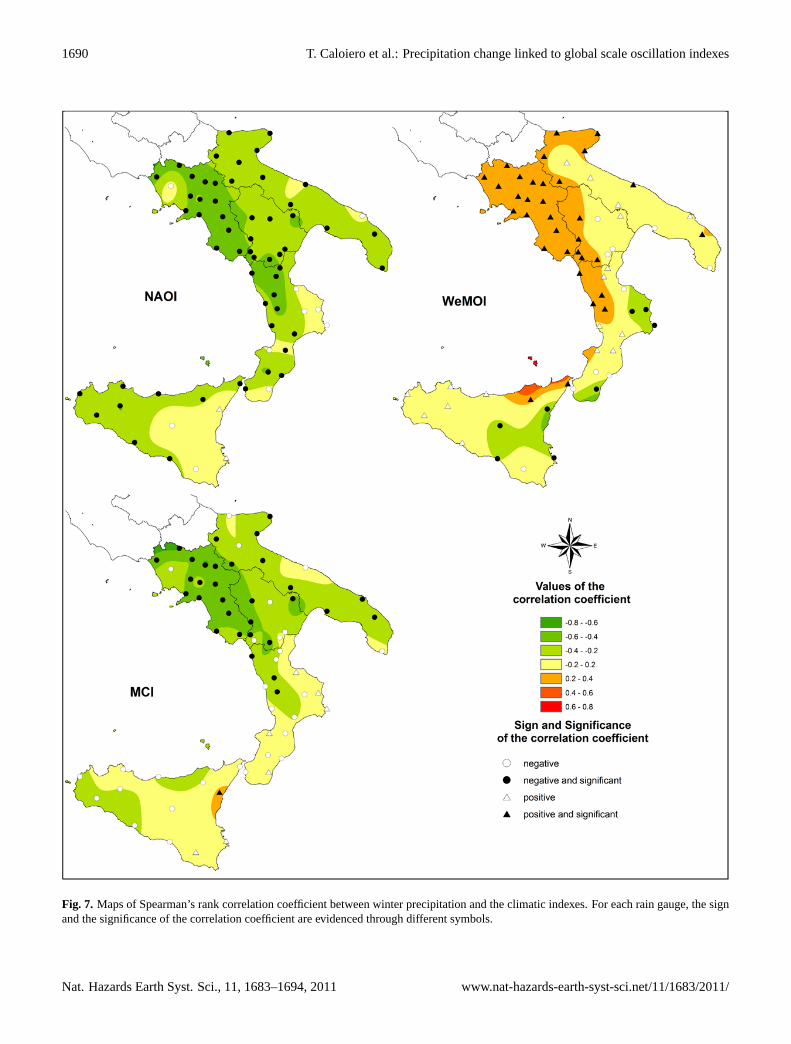
A correlation analysis was performed between the sea-sonal precipitation and the climatic indexes (NAOI, WeMOI,MOI) evaluated in the corresponding seasonal periods. Thebest correlations were obtained for the data observed in theautumn (Fig. 6) and winter periods (Fig. 7). Regarding thecorrelations with the autumn data, the MCI provided the bestresults with the highest values of the correlation coefficients(up to 0.73) estimated at the rain gauges of Campania. A neg-ative and significant correlation was obtained for almost allthe rain gauges located on the Tyrrhenian side of the studyarea. Regarding the NAOI, a weaker correlation than theMCI was observed. On the contrary, the WeMOI showeda prevailing positive and non-significant correlation. As forthe autumn season, the highest values of the correlation co-efficient in winter were provided by the MCI (up to 0.62)mainly for the rain gauges of Campania, with negative andsignificant correlations all over the northern part of the ex-amined area. For the NAOI, the significant negative correla-tion coefficients presented a more homogeneous distribution,even with lower values (up to 0.56) than the MCI. As regardsthe WeMOI, the values of the coefficient were higher thanin autumn, with a prevailing positive correlation. The spatialvariability of Spearman’s coefficient between the eastern and
western coasts of Southern Italy could depend on the oro-graphic features (Apennine chain), which seem to affect theatmospheric circulation.
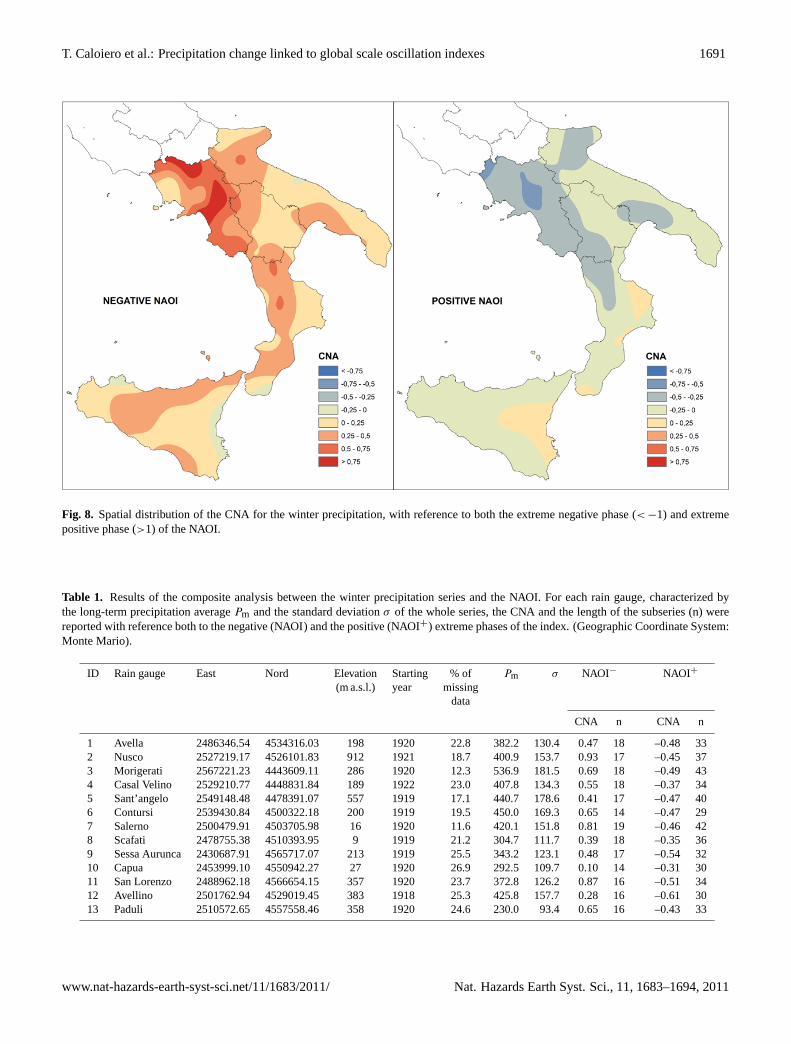
A composite analysis was performed on the NAOI and thewinter rainfall because of the more homogeneous distribu-tion of their statistically significant correlation coefficients(Fig. 7). The results evidence a clear link existing betweenthe phase of the climatic index and the amount of winter rain-fall. In fact, for almost all the rain gauges, rainfall anoma-lies present an opposite sign compared with the phase of theNAOI (Table 1). In particular, when the latter is negative, theaverage winter rainfall (pm), for 63 out of 68 rain gauges, isgreater than the average winter rainfall of the whole period(Pm), whereas the opposite happens when the NAOI is posi-tive (Fig. 8). The highest absolute values of the CNA (up to+0.93) occur during the negative phase of the NAOI and aremainly localised in Campania. Moreover, it is important tonote that the areas where the highest values of Spearman’scoefficients are detected (i.e. the Tyrrhenian side of Campa-nia and Northern Calabria), also present the highest valuesof CNA in the extreme (negative and positive) NAOI phases(Figs. 7 and 8). This is a further confirmation of the influenceof the NAOI extreme phases on the precipitation amount inwinter.
5 Conclusions
This study initially performed a statistical analysis of the sea-sonal and annual rainfall trends in the period 1916–2003 fora set of 68 rain gauges located in Southern Italy. The prelimi-nary analysis of the data has shown that the average values ofthe annual and winter precipitation observed until the 1980sare higher than the corresponding average values of the lastdecade of the observation period (about 17% and 25%, re-spectively). The analysis has evidenced significant negative
www.nat-hazards-earth-syst-sci.net/11/1683/2011/ Nat. Hazards Earth Syst. Sci., 11, 1683–1694, 2011
1688 T. Caloiero et al.: Precipitation change linked to global scale oscillation indexes
Fig. 5. Spatial distribution of trend values for the annual, winter and summer precipitation (mm/10 years). For each rain gauge, the sign andthe significance of the trend are evidenced through different symbols.
Nat. Hazards Earth Syst. Sci., 11, 1683–1694, 2011 www.nat-hazards-earth-syst-sci.net/11/1683/2011/
T. Caloiero et al.: Precipitation change linked to global scale oscillation indexes 1689
Fig. 6. Maps of Spearman’s rank correlation coefficient between autumn precipitation and the climatic indexes. For each rain gauge, the signand the significance of the correlation coefficient are evidenced through different symbols.
www.nat-hazards-earth-syst-sci.net/11/1683/2011/ Nat. Hazards Earth Syst. Sci., 11, 1683–1694, 2011
1690 T. Caloiero et al.: Precipitation change linked to global scale oscillation indexes
Fig. 7. Maps of Spearman’s rank correlation coefficient between winter precipitation and the climatic indexes. For each rain gauge, the signand the significance of the correlation coefficient are evidenced through different symbols.
Nat. Hazards Earth Syst. Sci., 11, 1683–1694, 2011 www.nat-hazards-earth-syst-sci.net/11/1683/2011/
T. Caloiero et al.: Precipitation change linked to global scale oscillation indexes 1691
Fig. 8. Spatial distribution of the CNA for the winter precipitation, with reference to both the extreme negative phase (< −1) and extremepositive phase (>1) of the NAOI.
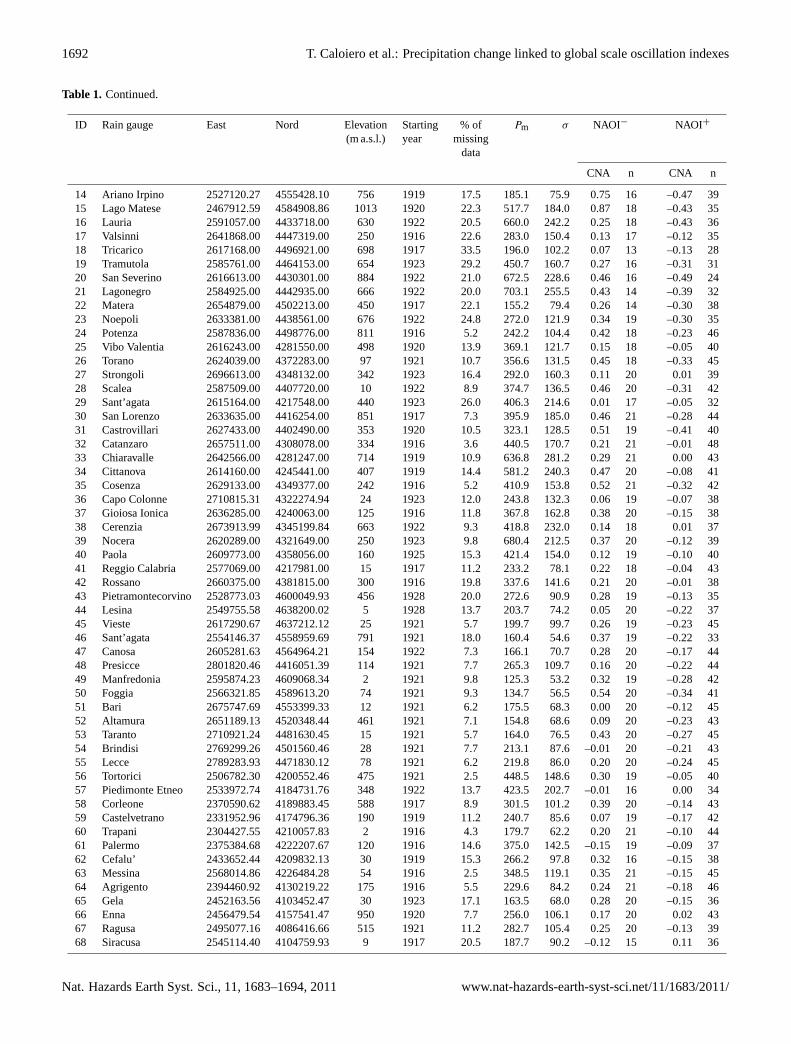
Table 1. Results of the composite analysis between the winter precipitation series and the NAOI. For each rain gauge, characterized bythe long-term precipitation averagePm and the standard deviationσ of the whole series, the CNA and the length of the subseries (n) werereported with reference both to the negative (NAOI) and the positive (NAOI+) extreme phases of the index. (Geographic Coordinate System:Monte Mario).
ID Rain gauge East Nord Elevation Starting % of Pm σ NAOI− NAOI+
(m a.s.l.) year missingdata
CNA n CNA n
1 Avella 2486346.54 4534316.03 198 1920 22.8 382.2 130.4 0.47 18 –0.48 332 Nusco 2527219.17 4526101.83 912 1921 18.7 400.9 153.7 0.93 17 –0.45 373 Morigerati 2567221.23 4443609.11 286 1920 12.3 536.9 181.5 0.69 18 –0.49 434 Casal Velino 2529210.77 4448831.84 189 1922 23.0 407.8 134.3 0.55 18 –0.37 345 Sant’angelo 2549148.48 4478391.07 557 1919 17.1 440.7 178.6 0.41 17 –0.47 406 Contursi 2539430.84 4500322.18 200 1919 19.5 450.0 169.3 0.65 14 –0.47 297 Salerno 2500479.91 4503705.98 16 1920 11.6 420.1 151.8 0.81 19 –0.46 428 Scafati 2478755.38 4510393.95 9 1919 21.2 304.7 111.7 0.39 18 –0.35 369 Sessa Aurunca 2430687.91 4565717.07 213 1919 25.5 343.2 123.1 0.48 17 –0.54 3210 Capua 2453999.10 4550942.27 27 1920 26.9 292.5 109.7 0.10 14 –0.31 3011 San Lorenzo 2488962.18 4566654.15 357 1920 23.7 372.8 126.2 0.87 16 –0.51 3412 Avellino 2501762.94 4529019.45 383 1918 25.3 425.8 157.7 0.28 16 –0.61 3013 Paduli 2510572.65 4557558.46 358 1920 24.6 230.0 93.4 0.65 16 –0.43 33
www.nat-hazards-earth-syst-sci.net/11/1683/2011/ Nat. Hazards Earth Syst. Sci., 11, 1683–1694, 2011
1692 T. Caloiero et al.: Precipitation change linked to global scale oscillation indexes
Table 1. Continued.
ID Rain gauge East Nord Elevation Starting % of Pm σ NAOI− NAOI+
(m a.s.l.) year missingdata
CNA n CNA n
14 Ariano Irpino 2527120.27 4555428.10 756 1919 17.5 185.1 75.9 0.75 16 –0.47 3915 Lago Matese 2467912.59 4584908.86 1013 1920 22.3 517.7 184.0 0.87 18 –0.43 3516 Lauria 2591057.00 4433718.00 630 1922 20.5 660.0 242.2 0.25 18 –0.43 3617 Valsinni 2641868.00 4447319.00 250 1916 22.6 283.0 150.4 0.13 17 –0.12 3518 Tricarico 2617168.00 4496921.00 698 1917 33.5 196.0 102.2 0.07 13 –0.13 2819 Tramutola 2585761.00 4464153.00 654 1923 29.2 450.7 160.7 0.27 16 –0.31 3120 San Severino 2616613.00 4430301.00 884 1922 21.0 672.5 228.6 0.46 16 –0.49 2421 Lagonegro 2584925.00 4442935.00 666 1922 20.0 703.1 255.5 0.43 14 –0.39 3222 Matera 2654879.00 4502213.00 450 1917 22.1 155.2 79.4 0.26 14 –0.30 3823 Noepoli 2633381.00 4438561.00 676 1922 24.8 272.0 121.9 0.34 19 –0.30 3524 Potenza 2587836.00 4498776.00 811 1916 5.2 242.2 104.4 0.42 18 –0.23 4625 Vibo Valentia 2616243.00 4281550.00 498 1920 13.9 369.1 121.7 0.15 18 –0.05 4026 Torano 2624039.00 4372283.00 97 1921 10.7 356.6 131.5 0.45 18 –0.33 4527 Strongoli 2696613.00 4348132.00 342 1923 16.4 292.0 160.3 0.11 20 0.01 3928 Scalea 2587509.00 4407720.00 10 1922 8.9 374.7 136.5 0.46 20 –0.31 4229 Sant’agata 2615164.00 4217548.00 440 1923 26.0 406.3 214.6 0.01 17 –0.05 3230 San Lorenzo 2633635.00 4416254.00 851 1917 7.3 395.9 185.0 0.46 21 –0.28 4431 Castrovillari 2627433.00 4402490.00 353 1920 10.5 323.1 128.5 0.51 19 –0.41 4032 Catanzaro 2657511.00 4308078.00 334 1916 3.6 440.5 170.7 0.21 21 –0.01 4833 Chiaravalle 2642566.00 4281247.00 714 1919 10.9 636.8 281.2 0.29 21 0.00 4334 Cittanova 2614160.00 4245441.00 407 1919 14.4 581.2 240.3 0.47 20 –0.08 4135 Cosenza 2629133.00 4349377.00 242 1916 5.2 410.9 153.8 0.52 21 –0.32 4236 Capo Colonne 2710815.31 4322274.94 24 1923 12.0 243.8 132.3 0.06 19 –0.07 3837 Gioiosa Ionica 2636285.00 4240063.00 125 1916 11.8 367.8 162.8 0.38 20 –0.15 3838 Cerenzia 2673913.99 4345199.84 663 1922 9.3 418.8 232.0 0.14 18 0.01 3739 Nocera 2620289.00 4321649.00 250 1923 9.8 680.4 212.5 0.37 20 –0.12 3940 Paola 2609773.00 4358056.00 160 1925 15.3 421.4 154.0 0.12 19 –0.10 4041 Reggio Calabria 2577069.00 4217981.00 15 1917 11.2 233.2 78.1 0.22 18 –0.04 4342 Rossano 2660375.00 4381815.00 300 1916 19.8 337.6 141.6 0.21 20 –0.01 3843 Pietramontecorvino 2528773.03 4600049.93 456 1928 20.0 272.6 90.9 0.28 19 –0.13 3544 Lesina 2549755.58 4638200.02 5 1928 13.7 203.7 74.2 0.05 20 –0.22 3745 Vieste 2617290.67 4637212.12 25 1921 5.7 199.7 99.7 0.26 19 –0.23 4546 Sant’agata 2554146.37 4558959.69 791 1921 18.0 160.4 54.6 0.37 19 –0.22 3347 Canosa 2605281.63 4564964.21 154 1922 7.3 166.1 70.7 0.28 20 –0.17 4448 Presicce 2801820.46 4416051.39 114 1921 7.7 265.3 109.7 0.16 20 –0.22 4449 Manfredonia 2595874.23 4609068.34 2 1921 9.8 125.3 53.2 0.32 19 –0.28 4250 Foggia 2566321.85 4589613.20 74 1921 9.3 134.7 56.5 0.54 20 –0.34 4151 Bari 2675747.69 4553399.33 12 1921 6.2 175.5 68.3 0.00 20 –0.12 4552 Altamura 2651189.13 4520348.44 461 1921 7.1 154.8 68.6 0.09 20 –0.23 4353 Taranto 2710921.24 4481630.45 15 1921 5.7 164.0 76.5 0.43 20 –0.27 4554 Brindisi 2769299.26 4501560.46 28 1921 7.7 213.1 87.6 –0.01 20 –0.21 4355 Lecce 2789283.93 4471830.12 78 1921 6.2 219.8 86.0 0.20 20 –0.24 4556 Tortorici 2506782.30 4200552.46 475 1921 2.5 448.5 148.6 0.30 19 –0.05 4057 Piedimonte Etneo 2533972.74 4184731.76 348 1922 13.7 423.5 202.7 –0.01 16 0.00 3458 Corleone 2370590.62 4189883.45 588 1917 8.9 301.5 101.2 0.39 20 –0.14 4359 Castelvetrano 2331952.96 4174796.36 190 1919 11.2 240.7 85.6 0.07 19 –0.17 4260 Trapani 2304427.55 4210057.83 2 1916 4.3 179.7 62.2 0.20 21 –0.10 4461 Palermo 2375384.68 4222207.67 120 1916 14.6 375.0 142.5 –0.15 19 –0.09 3762 Cefalu’ 2433652.44 4209832.13 30 1919 15.3 266.2 97.8 0.32 16 –0.15 3863 Messina 2568014.86 4226484.28 54 1916 2.5 348.5 119.1 0.35 21 –0.15 4564 Agrigento 2394460.92 4130219.22 175 1916 5.5 229.6 84.2 0.24 21 –0.18 4665 Gela 2452163.56 4103452.47 30 1923 17.1 163.5 68.0 0.28 20 –0.15 3666 Enna 2456479.54 4157541.47 950 1920 7.7 256.0 106.1 0.17 20 0.02 4367 Ragusa 2495077.16 4086416.66 515 1921 11.2 282.7 105.4 0.25 20 –0.13 3968 Siracusa 2545114.40 4104759.93 9 1917 20.5 187.7 90.2 –0.12 15 0.11 36
Nat. Hazards Earth Syst. Sci., 11, 1683–1694, 2011 www.nat-hazards-earth-syst-sci.net/11/1683/2011/
T. Caloiero et al.: Precipitation change linked to global scale oscillation indexes 1693
trends for almost all seasonal rainfall, while a positive trendin summer rainfall has been observed. In particular, the anal-ysis revealed an average decrease in both annual and winterprecipitation (about 21 mm/10 years and 12 mm/10 years, re-spectively), with the highest values of –113 mm/10 years forthe annual precipitation and of−61 mm/10 years for winterprecipitation.
The correlation analysis between the rainfall and someteleconnection pattern indexes has provided significant re-sults for the winter and the autumn periods, mainly in thecase of the NAO and the MC indexes, with higher correla-tion coefficients observed especially for the rain gauges ofthe Tyrrhenian side of Campania region. A contrary rela-tionship between the rainfall anomalies and the phase of theNAOI has emerged from the composite analysis, performedfor the NAOI and the winter season. In particular, the ave-rage rainfall corresponding only to the negative NAOI phaseis greater than the average rainfall of the whole observationperiod for the majority of the rain gauges, whereas the oppo-site occurs when the NAOI is positive. Moreover, the highestvalues of both Spearman’s coefficient and the CNA valueswere observed in the same geographical areas (the Tyrrhe-nian side of Campania and Northern Calabria). These fi-nal results seem to confirm the influence of the western aircurrents on the behaviour of the rainfall regime of SouthernItaly.
Acknowledgements.The authors thank M. Brunetti of theISAC-CNR for kindly providing the data on the MediterraneanCirculation Index and the two reviewers (M. Maugeri and ananonymous one) for their useful comments. This work developedwithin the UNESCO MED-FRIEND project.
Edited by: R. DeiddaReviewed by: M. Maugeri and another anonymous referee
References
Aguilar, E., Auer, I., Brunet, M., Peterson, T. C., and Wieringa,J.: Guidelines on Climate Metadata and Homogenization, WorldClimate Programme Data and Monitoring WCDMP-No.53,WMO-TD No. 1186, WMO, Geneva, 2003.
Amanatidis, G. T., Paliatsos, A. G., Repapis, C. C., and Barttzis, J.G.: Decreasing precipitation trend in the Marathon area, Greece,Int. J. Climatol., 13(2), 191–201,doi:10.1002/joc.3370130205,1993.
Aronica, G., Cannarozzo, M., and Noto, L.: Investigating thechanges in extreme rainfall series recorded in urbanized area,Water Sci. Technol., 45, 49–54, 2002.
Boyles, R. P. and Raman, S.: Analysis of climate trends in NorthCarolina (1949–1998), Environment Int., 29, 263–275, 2003.
Brunetti, M., Maugeri, M., and Nanni, T.: Atmospheric circulationand precipitation in Italy for the last 50 years, Int. J. Climatol.22(12), 1455–1471,doi:10.1002/joc.805, 2002a.
Brunetti, M., Maugeri, M., and Nanni, T.: Droughts and extremeevents in regional daily Italian precipitation series, Int. J. Clima-tol., 22(5), 543–558,doi:10.1002/joc.751, 2002b.
Brunetti, M., Buffoni, L., Mangianti, F., Maugeri, M., and Nanni,T.: Temperature, precipitation and extreme events during thelast century in Italy, Global Planet. Change, 40, 141–149,doi:10.1016/S0921-8181(03)00104-8, 2004.
Brunetti, M., Maugeri, M., Monti, F., and Nanni T.: Temperatureand precipitation variability in Italy in the last two centuries fromhomogenised instrumental time series, Int. J. Climatol., 26(3),345–381,doi:10.1002/joc.1251, 2006a.
Brunetti, M., Nanni, T., Maugeri, M., Auer, I., Boehm, R.,and Schoener, W.: Precipitation variability and changes in theGreater Alpine Region over the 1800–2003 period, J. Geophys.Res.-Atmos., 111, D11107,doi:10.1029/2005JD006674, 2006b.
Brunetti, M., Caloiero, T., Coscarelli, R., Gulla, G., Nanni, T., andSimolo, C.: Precipitation variability and change in the Calabriaregion (Italy) from a high resolution daily dataset, Int. J. Clima-tol., doi:10.1002/joc.2233, published online, 2010.
Caloiero, T., Coscarelli, R., Ferrari, E., and Mancini, M.: Trenddetection of annual and seasonal rainfall in Calabria (SouthernItaly), Int. J. Climatol., 31, 44–56,doi:10.1002/joc.2055, 2011.
Cancelliere, A. and Rossi, G.: Droughts in Sicily and comparisonof identified droughts in Mediterranean regions, in: Tools fordrought mitigation in Mediterranean regions, edited by: Rossi,G., Cancelliere, A., Pereira, L. S., Oweis, T., Shatanawi, M., andZairi, A., Kluwer, Dordrecht, 103–122, 2003.
Cannarozzo, M., Noto, L. V., and Viola, F.: Spatial distribution ofrainfall trends in Sicily (1921–2000), Phys. Chem. Earth, 31(18),1201–1211,doi:10.1016/j.pce.2006.03.022, 2006.
Colacino, M., Conte, M., and Piervitali, E.: Elementi di climatolo-gia della Calabria, IFA-CNR, Roma, 1997.
Conte, M., Giuffrida, S., and Tedesco, S.: The Mediterranean os-cillation: impact on precipitation and hydrology in Italy, in: Pro-ceedings of the Conference on Climate and Water, Publicationsof Academy of Finland, 1, 121–137, 1989.
Coscarelli, R., Gaudio, R., and Caloiero, T.: Climatic trends: aninvestigation for a Calabrian basin (southern Italy), in: Proceed-ings of the International Symposium The basis of civilization.Water science?, IAHS Publ., 286, 255–266, 2004.
Cotecchia, V., Casarano, D., and Polemio, M.: Characterization ofrainfall trend and drought periods in Southern Italy from 1821to 2001, in: Proceedings of 1st Italian-Russian Workshop NewTrends in Hydrology, CNR Publ., 2823, 139–150, 2004.
Craddock, J. M.: Methods of comparing annual rainfall records forclimatic purposes, Weather, 34, 332–346, 1979.
De Luis, M., Raventos, J., Gonzalez-Hidalgo, J. C., Sanchez, J. R.,and Cortina, J.: Spatial analysis of rainfall trends in the regionof Valencia (East of Spain), Int. J. Climatol., 20(12), 1451–1469,2000.
De Michele, C., Montanari, A., and Rosso, R.: The effect of non-stationarity on the evaluation of critical design storms, Water Sci.Technol., 37(11), 187–193,doi:10.1016/S0273-1223(98)00332-1, 1998.
Del Rio, S., Herrero, L., Fraile, R., and Penas, A. P.: Spatial dis-tribution of recent rainfall trends in Spain (1961–2006), Int. J.Climatol.,doi:10.1002/joc.2111, in press, 2010.
Diodato, N.: Climatic fluctuations in Southern Italy since 17thcentury: reconstruction with precipitation records at Benevento,Climatic Change, 80(3–4), 411–431,doi:10.1007/s10584-006-9119-1, 2007.
Esteban-Parra, M. J., Rodrigo, F. S., and Castro-Diez, Y.: Spatial
www.nat-hazards-earth-syst-sci.net/11/1683/2011/ Nat. Hazards Earth Syst. Sci., 11, 1683–1694, 2011
1694 T. Caloiero et al.: Precipitation change linked to global scale oscillation indexes
and temporal patterns of precipitation in Spain for the period1880–1992, Int. J. Climatol., 18(14), 1557–1574, 1998.
Federico, S., Dalu, G. A., Bellecci, C., and Colacino, M.:Mesoscale energetics and flows induced by sea-land andmountain-valley contrasts, Ann. Geophys., 18, 235–246,doi:10.1007/s00585-000-0235-3, 2000.
Federico, S., Bellecci, C., and Colacino, M.: Quantitative precip-itation of the Soverato flood: the role of orography and surfacefluxes, Nuovo Cimento C, 26, 7–22, 2003a.
Federico, S., Bellecci, C., and Colacino, M.: Numerical simulationof Crotone flood: storm evolution, Nuovo Cimento C, 26, 357–371, 2003b.
Federico, S., Avolio, E., Bellecci, C., Lavagnini, A., and Walko, R.L.: Predictability of intense rain storms in the Central Mediter-ranean basin: sensitivity to upper-level forcing, Adv. Geosci., 12,5–18,doi:10.5194/adgeo-12-5-2007, 2007.
Feidas, H., Noulopoulou, Ch., Makrogiannis, T., and Bora-Senta,E.: Trend analysis of precipitation time series in Greeceand their relationship with circulation using surface and satel-lite data: 1955–2001, Theor. Appl. Climatol., 87, 155–177,doi:10.1007/s00704-006-0200-5, 2007.
Ferrari, E. and Terranova, O.: Non-parametric detection of trendsand change point years in monthly and annual rainfalls, in: Pro-ceedings of 1st Italian-Russian Workshop New Trends in Hydrol-ogy, CNR Publ., 2823, 177–188, 2004.
Hamilton, J. P., Whitelaw, G. S., and Fenech, A.: Mean annual tem-perature and annual precipitation trends at Canadian biospherereserves, Environ. Monit. Assess., 67, 239–275, 2001.
Hess, T. M., Stephens, W., and Maryah, U. M.: Rainfall trends inthe North East Arid Zone of Nigeria 1961–1990, Agr. Forest Me-teorol., 74, 87–97,doi:10.1016/0168-1923(94)02179-N, 1995.
Hurrell, J. W.: Decadal trends in the North Atlantic Oscillation: Re-gional temperatures and precipitation, Science, 269(5224), 676–679,doi:10.1126/science.269.5224.676, 1995.
Hurrell, J. W. and Van Loon, H.: Decadal variations in climate asso-ciated with the North Atlantic Oscillation, Climatic Change, 36,301–326,doi:10.1023/A:1005314315270, 1997.
Kendall, M. G.: Rank Correlation Methods, Hafner PublishingCompany, New York, 1962.
Kutiel, H., Maheras, P., and Guika, S.: Circulation and extremerainfall conditions in the eastern Mediterranean during the lastcentury, Int. J. Climatol., 16, 73–92, 1996.
Lebel, T. and Ali, A.: Recent trends in the Central and West-ern Sahel rainfall regime (1990–2007), J. Hydrol., 375, 52–64,doi:10.1016/j.jhydrol.2008.11.030, 2009.
Liu, Q., Yang, Z., and Cui, B.: Spatial and tempo-ral variability of annual precipitation during 1961–2006 inYellow River Basin, China, J. Hydrol., 361, 330–338,doi:10.1016/j.jhydrol.2008.08.002, 2008.
Longobardi, A. and Villani, P.: Trend analysis of annual and sea-sonal rainfall time series in the Mediterranean area, Int. J. Cli-matol., 30(10), 1538–1546,doi:10.1002/joc.2001, 2010.
Mann, H. B.: Nonparametric tests against trend, Econometrica, 13,245–259, 1945.
Martin-Vide, J. and Lopez-Bustins, J. A.: The Western Mediter-ranean Oscillation and rainfall in the Iberian Peninsula, Int. J.Climatol., 26(11), 1455–1475,doi:10.1002/joc.1388, 2006.
Montanari, A., Rosso, R., and Taqqu, M. S.: Some long-run prop-erties of rainfall records in Italy, J. Geophys. Res., 101(D23),431–438,doi:10.1029/96JD02512, 1996.
Palmieri, S., Siani, A. M., and D’Agostino, A.: Climate fluctuationsand trends in Italy within the last hundred years, Ann. Geophys.,9, 769–776, 1991,http://www.ann-geophys.net/9/769/1991/.
Parker, D. E., Jones, P. D., Folland, C. K., and Bevan, A.:Interdecadal changes of surface temperature since the latenineteenth century, J. Geophys. Res., 99(D7), 14373–14399,doi:10.1029/94JD00548, 1994.
Peterson, T. C. and Easterling, D. R.: Creation of homoge-neous composite climatological reference series, Int. J. Clima-tol., 14(6), 671–679,doi:10.1002/joc.3370140606, 1994.
Piccarreta, M., Capolongo, D., and Boenzi, F.: Trend analysisof precipitation and drought in Basilicata from 1923 to 2000within a Southern Italy context, Int. J. Climatol., 24(7), 907–922,doi:10.1002/joc.1038, 2004.
Piervitali, E., Colacino, M., and Conte, M.: Rainfall over theCentral-Western Mediterranean basin in the period 1951–1995.Part I: precipitation trends, Il Nuovo Cimento, 21, 331–344,1998.
Ropelewski, C. F. and Jones, P. D.: An extension of the Tahiti-Darwin Southern Oscillation Index, Mon. Weather Rev., 115(9),2161–2165, 1987.
Sharma, K. P., Moore III, B., and Vorosmarty, C. J.: Anthropogenic,climatic, and hydrologic trends in the Kosi basin, Himalaya,Climatic Change, 47, 141–165,doi:10.1023/A:1005696808953,2000.
Slonosky, V. C., Jones, P. D., and Davies, T. D.: Atmospheric circu-lation and surface temperature in Europe from the 18th centuryto 1995, Int. J. Climatol., 21, 63–75,doi:10.1002/joc.591, 2001.
Spearman, C.: The proof and measurement of association betweentwo things, Amer. J. Psychol., 15, 72–101, 1904.
Thompson, D. W. J. and Wallace, J. M.: The arctic oscil-lation signature in the wintertime geopotential height andtemperature fields, Geophys. Res. Lett., 25(9), 1297–1300,doi:10.1029/98GL00950, 1998.
Thompson, D. W. J. and Wallace, J. M.: Annular modes in the extra-tropical circulation. Part I: month to month variability, J. Climate,13, 1000–1016, 2000.
Turkes, M. and Erlat, E.: Precipitation changes and variabil-ity in Turkey linked to the North Atlantic Oscillation dur-ing the period 1930–2000, Int. J. Climatol., 23, 1771–1796,doi:10.1002/joc.962, 2003.
Wallace, J. M. and Gutzler, D. S.: Teleconnections in the geopo-tential height field during the Northern Hemisphere winter, Mon.Weather Rev., 109, 784–812, 1981.
Xoplaki, E., Luterbacher, J., and Gonzalez-Rouco, J. F.: Mediter-ranean summer temperature and winter precipitation, large-scaledynamics, trends, Il Nuovo Cimento C, 29, 45–54, 2006.
Nat. Hazards Earth Syst. Sci., 11, 1683–1694, 2011 www.nat-hazards-earth-syst-sci.net/11/1683/2011/