Pre poll analysis of youth’s perception in Tamil Nadu
33
Pre poll analysis of youth’s perception in Tamil Nadu A Dissertation submitted to the Madurai Kamaraj University in partial fulfilment of the requirement for the award of the Degree of MASTER OF COMMUNICATION & JOURNALISM By M.SURESH Reg.No: B207008 Under the guidance of Mr.M.SATHISH KUMAR DEPARTMENT OF JOURNALISM & SCIENCE COMMUINCATION MDURAI KAMARAJ UNIVERSITY MADURAI – 625021 MAY – 2014.
Transcript of Pre poll analysis of youth’s perception in Tamil Nadu

Pre poll analysis of youth’s perception in Tamil Nadu
A Dissertation submitted to the Madurai Kamaraj University in
partial fulfilment of the requirement for the award of the
Degree of
MASTER OF COMMUNICATION & JOURNALISM
By
M.SURESH
Reg.No: B207008
Under the guidance of
Mr.M.SATHISH KUMAR
DEPARTMENT OF JOURNALISM & SCIENCE COMMUINCATION
MDURAI KAMARAJ UNIVERSITY
MADURAI – 625021
MAY – 2014.
Mr.M.SATHISHKUMANR, MA.,
Guest Lecturer
Department of Journalism & Science Communication
Madurai Kamaraj University
Madurai-625021.
CERTIFICATE
This is to certify that the dissertation, entitled ‘Pre poll
analysis of youth’s perception in Tamil Nadu’ submitted to the
Madurai Kamaraj University, in partial fulfilment of the
requirement for the award of the degree of Master of
Communication & Journalism is record of original research work
done by M.SURESH (Reg.No. B207008) regular student of M.Sc., in
the Department of Journalism & Science Communication, Madurai
Kamaraj University, Madurai, during the year 2011-2012. This
dissertation is his original work and it has not previously
formed the basis for the award of any Degree, Diploma, and
Associate ship, Fellowship or other similar titles to any
candidate of any University.

Countersigned
Signature of the Guide
Assistant Prof & Head i/c
(Mr.M.Sathishkumar)
M.SURESH, II year
Department of Journalism & Science Communication,
Madurai Kamaraj University,
Madurai -625 021.
-----------------------------------------------------------------
---------------------------------

DECLARATION
I, M.SURESH hereby declare that the dissertation entitled, Pre
poll analysis of youth’s perception in Tamil Nadu Submitted to
the Madurai Kamraj University, in partial fulfillment of the
requirements for the award of the degree of Master of
Communication & Journalism is a record of original research work
done by me during 2012-2014 under the supervision and guidance
of Mr.M.SATHISHKUMAR, Department of Journalism & Science
Communication, Madurai Kamaraj University, Madurai and it has not
previously formed the basis for the award of any Degree/ Diploma/
Associate/ Fellowship or other similar title of and University.
Place: Madurai Signature of the candidate
Date: ( M.SURESH)
Acknowledgement
The investigator expresses his profound gratitude to
Dr.J.BALASUBRAMANIAM, Assistant Professor & Head, Department of

Journalism & Science Communication, Madurai Kamaraj University,
Madurai, for valuable advice, for having given permission to take
up this study, guidance and all sort of immense help for the
successful completion of the study. His continuous encouragement
and constructive discussions enlightened me and this thesis a
reality.
The investigator expresses his deep sense of gratefully
acknowledges Mr.S.RAJESH KUMAR, Assistant Professor, Department
of Journalism & Science Communication, Madurai Kamaraj
University, Madurai, for valuable suggestions and for the
successful completion of this study.
The investigator expresses his deep sense of gratitude to
Mr.M.SATHISH KUMAR Department of Journalism & Science
Communication, Madurai Kamaraj University, Madurai, for valuable
suggestions and for the successful completion of this study.
The investigator is thankful to DR.V.RATNA MALA , Assistant
Professor, Department of Mass Communication, Mizoram University
who has helped me to complete this Dissertation. The investigator
expresses his sincere thanks to all his friends who have

contributed the necessary aids to this dissertation successfully.
(M.SURESH)
CONTENTS
ACKNOWLEDEGEMENT
LIST OF CHAPTERS
CHAPTER I INTRODUCATION
CHAPTER II REVIEW OF LITERATURE
CHAPTER III METHODOLOGY
CHAPTER IV DATA ANALYSIS AND INTERPRETATION
APPENDIX
BIBLIOGRAPHY
CHAPTER I
Introduction
The purpose of this study is to find out the perception of
Post graduate students of Madurai Kamaraj University on 2014- Lok
sabha Elections.
Election Commission data show that 2.3 crore people in the
18-19 age bracket have been enrolled to vote out of total
electorate of 81.5 crore. This Lok Sabha election is likely to

reflect the peak of India’s electoral demographic dividend with
10% of voter likely to be first time voters, a combination of
electoral and demographic data shows. As fertility beings to
decline faster in the south than in the north this election may
mark the highest ever political impact of first time voters.
Summary revision data released by the Election Commission on
Thursday shows that 2.3 crore 18-19 year-old have been enrolled
to vote, out of a total electorate of 81.5 crore voters.
Additionally, The Hindu’s analysis of census data shows that
there were 12 crore people aged 15-19 at the time of the 2011
census, making them people who were too young to voters formed 10
per cent of the population. This youth bulge might reflect the
peak of India’s demographic dividend as fertility declines and
India’s population begins to age.
In 2001, people aged 15-19 were, in comparison, 9.7 per cent of
the population. The United Nations’ Department of Economic and
Social Affairs’ latest World Population Prospects shows that
India’s 15-19 aged cohort will peak in 2015 after which it will
being to decline as a proportion of the population. The southern
States reached replacement levels of fertility by 1995, but the
northern States still have relatively high fertility. So the peak
of the 15-19 age cohort will have already passed in the southern
States, but in the northern states, this cohort could be at its
peak, Dr.P.Arokiasamy, demographer and professor in the
department of development Studies at the Mumbai-based
International Institute for Population Sciences (IIPS) told the
Hindu.

The Election commission’s data show that the proportion of 18-19
year-olds registered to vote is the the highest in Jharkhand
(9per cent of total electors), Chhattisgarh (4.9 per cent) and
Rajasthan (4.8 per cent) and the lowest in Himachal Pradesh (1.8
per cent).
This proportion is higher than the difference in vote share
between the party that polled the highest seats and the runner-
up in some states including Tamil Nadu and Madhya Pradesh.
Historically, voter turnout among young voter has been
substantially lower than the average turnout. Since 1996, we have
seen that voter turnout among young voter is 5-6 percentage
points lower than the average turnout, Sanjay Kumar, director at
the centre for the Study of Development Societies who leads its
National Election Studies, told The Hindu. Moreover, young voters
have tended to remain as divided among different political
parties as other voters, and without a cohort-specific issue that
animates them. Our study at the time of the last Assembly
election showed a clear preference among young voters for the Aam
Aadmi Party in Delhi and a slight tilt towards the BJP in other
States, Mr. Kumar said. In their January national poll the shift
towards the BJP was even more pronounced and included a surge
among rural voters, while the BJP had traditionally been
relatively popular among urban young voters, Mr. Kumar said.
What does the United Nations mean by ‘youth’? The United
Nations, for statistical purposes, defines ‘youth’, as those
persons between the ages of 15 and 24 years, without prejudice to

other definitions by Member States. The Secretary-General first
referred to the current definition of youth in 1981 in his report
to the General Assembly on International Youth Year (A/36/215,
para. 8 of the annex) and endorsed it in ensuing reports
(A/40/256, para. 19 of the annex). However, in both the reports,
the Secretary-General also recognized that, apart from that
statistical definition, the meaning of the term ‘youth’ varies in
different societies around the world. When the General Assembly,
by its resolution 50/81 in 1995, adopted the World Programme of
Action for Youth to the Year 2000 and beyond, it reiterated that
the United Nations defined youth as the age cohort of 15-24. The
General “In 1995, the world youth population - defined by the
United Nations as the age cohort 15-24 - is estimated to be 1.03
billion, or 18 per cent of the total world population.”
Definition of youth perhaps changes with circumstances,
especially with the changes in demographic, financial, economic
and socio-cultural settings; however, the definition that uses
15-24 age cohort as youth fairly serves its statistical purposes
for assessing the needs of the young people and providing
guidelines for youth development.
An election is a formal decision-making process by which a
population chooses an individual to hold elected status (public
office). Elections have been the usual mechanism by which modern
representative democracy has operated since the 17th century.
Elections may fill offices in the legislature, sometimes in
the executive and judiciary, and for regional and local
government. This process is also used in many other private and
business organizations, from clubs to voluntary associations and

corporations. Electronic ballots are used in Brazilian
elections. The universal use of elections as a tool for selecting
representatives in modern democracies is in contrast with the
practice in the democratic archetype, ancient Athens. As the
Elections were considered an oligarchic institution and most
political offices were filled using siltations, also known as
allotment, by which officeholders were chosen by lot.
Electoral reform describes the process of introducing fair
electoral systems where they are not in place, or improving the
fairness or effectiveness of existing systems. Psephogogy is the
study of results and other statistic relating to elections
(especially with a view to predicting future results).
To elect means "to choose or make a decision" and so sometimes
other forms of ballot such as referendums are referred to as
elections, especially in the United States.
India has an asymmetric federal government, with elected
officials at the federal, state and local levels. At the national
level, the head of the government, Prime minister, is elected by
the members of Lok Sabha, lower house of the parliament of
India. All members of Lok Sabha except two, who can be nominated
by president of India, are directly elected through general
elections which take place every five years, in normal
circumstances, by universal adult suffrage. Members of Rajya
Sabha, upper house of Indian parliament, are elected by elected
members of the legislative assemblies of states and Electoral
College for Union Territories of India.
In 2009, the elections involved an electorate of 714
million (larger than both EU and US elections combined). In 2014,
the Electoral Strength of India increased to 814.5
Million. Declared expenditure has trebled since 1989 to almost
$300 million, using more than one million electronic voting
machines.
The size of the huge electorate mandates that elections be
conducted in a number of phases (there were four phases in 2004
General Election and five phases in 2009General Elections). It
involves a number of step-by-step processes from announcement of
election dates by the Election Commission of India, which
brings into force the 'model code of conduct' for the political
parties, to the announcement of results and submission of the
list of successful candidates to the executive head of the state
or the centre. The submission of results marks the end of the
election process, thereby paving way for the formation of the new
government.
The general election was held in nine phases from 7 April to 12
May 2014 to constitute the 16th Lok Sabha in India. Voting will
take place in all 543parliament constituencies of India to elect
Members of Parliament in the Lok Sabha.
The result of this election will be declared on 16 May 2014, well
before the current 15th Lok Sabha completes its constitutional
term on 31 May 2014.

With an electorate of 814.5 million (larger than the electorate
of the European Union and United States combined), this election
will be the largest democratic election in the world to date.
This also will be the longest and the costliest general election
in the history of the country, The Election Commission has
estimated that the 2014 Lok Sabha elections will cost the
exchequer Rs 3,500 crore. This figure does not include the
expenses incurred for security and the amount political parties
will spend.
Aims and Objectives
To find out the youth’s perception of voting
To do a pre poll analysis of youth’s perception in Tamil Nadu
To study the youth’s perception of leadership
Hypothesis
We assume that the post graduate student vote for 49-O
We assume that the post graduate students dislike the government
freebies

CHAPTER II
REVIEW OF LITERATURE
The Lok Sabha (Hinidi: ललल ललल) or House of the People is the
lower house of the Parliament of India. Parliament of India
consists of two houses: The Lok Sabha or House of the people and
the Rajya Sabha (Hindi: ललललल ललल) or Council of
States. Lok means "people" and Sabha means "assembly" in Sanskrit.
The Lok Sabha meets in the Lok Sabha Chambers, Sansad
Bhavan, Sansad Marg, and New Delhi.
Lok Sabha is composed of representatives of the people chosen by
direct election on the basis of adult suffrage. The maximum
strength of the House envisaged by the Constitution of the India
is 552, which is made up by election of up to 530 members to
represent the States, up to 20 members to represent the Union
Territories and not more than two members of the Anglo-Indian
Community to be nominated by the President of India, if, in
his/her opinion, that community is not adequately represented in
the House. The total elective membership is distributed among the
States in such a way that the ratio between the number of seats
allotted to each State and the population of the State is, so far
as practicable, the same for all States.
Lok Sabha, unless sooner dissolved, continues for five years from
the date appointed for its first meeting and the expiration of
the period of five years operates as dissolution of the House.
However, while a proclamation of emergency is in operation, this
period may be extended by Parliament by law for a period not

exceeding one year at a time and not extending, in any case,
beyond a period of six months after the proclamation has ceased
to operate. An exercise to redraw Lok Sabha constituencies'
boundaries has been carried out by the Delimitation Commission
based on the Indian census of 2001. This exercise, which was
supposed to be carried out after every census, was suspended in
1976 following a constitutional amendment to avoid adverse
effects of the family planning program which was being
implemented. The 15th Lok Sabha was formed in May 2009 and is the
latest to date.
Rajya Sabha (RS) or Council of States is the upper house of the
Parliament of India. Rajya means "state" and Sabha means
"assembly" in Sanskrit. Membership is limited to 250 members, 12
of whom are nominated by the President of India for their
contributions to art, literature, science, and social services.
The remainder of body is elected by the state and
territorial legislatures. Members sit for six-year terms, with
one third of the members retiring every two years.
The Rajya Sabha meets in continuous sessions and, unlike the
LokSabha, the lower house of Parliament, is not subject to
dissolution. The Rajya Sabha has equal footing in all areas of
legislation with Lok Sabha, except in the area of supply, where
the Lok Sabha has overriding powers. In the case of conflicting
legislation, a joint sitting of the two houses is held. However,
since the Lok Sabha has twice as many members as the Rajya Sabha,
the former would normally hold the greater power. Only three such
joint-sessions have been held; the latest one for the passage of
the2002 Prevention of Terrorism Act.

The Chairman of the Rajya Sabha (currently, Hamid Ansari) is
the Vice President of India, who presides over its sessions. The
Deputy Chairman, who is elected from amongst the RS's members,
takes care of the day-to-day matters of the house in the absence
of the Chairman. The Rajya Sabha held its first sitting on 13 May
1952. The salary and other benefits for a member of Rajya Sabha
are same as for a member of Lok Sabha.
Rule 49-O was a rule in The Conduct of Elections Rules, 1961 of
India, which governs election in the country. It described the
procedure to be followed when a valid voter decides not to cast
his vote, and decides to record this fact. The rule was declared
by the Supreme Court in September 2013 to be incompatible with
the constitution and the Election Commission of India announced
that the option under this rule would not be available any
more. The apparent purpose of this section was to maintain a
proper record in order to prevent the election fraud or the
misuse of votes.
NONE OF THE ABOVE (NOTA) OPTION IN EVMs
In its judgement dated 27th September, 2013 in Writ Petition
(C) No. 161 of 2004, the Supreme Court has directed that there
should be a “None of the Above” (NOTA) option on the ballot
papers and EVMs and that the same should be 8 implemented ‘either
in a phased manner or at a time with the assistance of Government
of India’. For implementing the NOTA option, the Commission has
issued detailed instructions to the Chief Electoral Officers of
all States/ UTs.
On the BUs, below the name of the last candidate, there will now
be a button for NOTA option so that electors who do not want to

vote for any of the candidates can exercise their option by
pressing the button against NOTA.
The Commission is taking steps to bring this option to the
knowledge of voters and all other stakeholders and to train all
field level officials including the polling personnel about the
NOTA option.
Reynolds and Reilly explain that preferential voting denotes
“electoral systems in which voters can rank-order candidates on
the ballot paper in order of their choice. The Alternative Vote,
the Single Transferable Vote, and the system used to elect the
Sri Lankan president are all examples of preferential voting.”
Many other researchers of the voting
systems in the Pacific area have used this definition
Vote means a formal indication of a choice between two or more
candidate or courses of action, expressed typically through a
ballot or a show of hands an act of voting. The right to indicate
a choice in an election.
Operational definition of Youth: Youth is the time of life when
one is young, but often means the time between childhood and
adulthood (maturity). Definitions of the specific age range that
constitutes youth vary. An individual's actual maturity may not
correspond to their chronological age, as immature individuals
can exist at all ages. Youth is also defined as "the appearance,
freshness, vigour, spirit, etc., characteristic of one who is
young". YOUTH is best understood as a period of transition from
the dependence of childhood to adulthood’s independence. That’s

why, as a category, youth is more fluid than other fixed age-
groups. Yet, age is the easiest way to define this group,
particularly in relation to education and employment, because
‘youth’ is often referred to a person between the ages of leaving
compulsory education, and finding their first job.
POLLING STATIONS
Presently there are approximately 9,30,000 Polling
Stations in the country, as compared to 8,30,866 Polling Stations
set up during Lok Sabha election, 2009. This marks an increase
of nearly 11.9 percent Polling Stations. This increase is largely
due to rationalization of Polling Stations, which the Commission
undertook in the recent years.
ELECTRONIC VOTING MACHINES (EVM)
The Commission has decided to use Electronic Voting
Machines in all the polling stations of the country as was done
in Lok Sabha Elections in 2004 and 2009. There are 14,68,430
Control Units and 14,95,430 Ballot Units available in the
country. Apart from this, manufacturers have been asked to
manufacture and supply 2,51,650 Control Units and 3,82,876 Ballot
Units, which are expected to be received by 31st March, 2014.
With this, the country will have 17,20,080 Control Units and
18,78,306 Ballot Units. First Level Checking (FLC) of the
available EVMs has been started in all the States/ UTs and has
been completed in many places.
Commission has put in place several administrative safeguards
for EVMs. These include, sealing of CU and BU with Pink Paper
seals specially manufactured by Security Printing Press, Nasik;
two stage randomization; mock poll by casting 1000 votes in at

least 5% EVMs both during FLC and preparation of EVMs during
candidate set operation, taking a sequential print of the 1000
votes cast during the mock poll at the preparation stage and
showing it to representatives of political parties and
candidates; mock poll by casting at least 50 votes on poll day,
multiple thread seals on the EVM and green paper seal on the
result section of the CU after mock poll. All of this is done in
the presence of political party representatives and candidates,
and their signatures are obtained on the seals and in the
registers kept for this purpose. Polled EVMs are transported
under armed escort and stored in strong rooms with a double lock
system and guarded 24x7 by armed police. There is CCTV coverage
of strong rooms and political parties and candidates are also
allowed to keep a watch on them, round the clock.

CHAPTER III
Methodology
Research Method
Quantitative research method was utilized in this study. A pre
poll survey was done among the youth.
Sampling design
A multi stage sampling was employed in this study. First among
the various age clusters, youth group was selected. Again the
youths were also selected from Madurai kamaraj University.
Madurai Kamaraj University is one of the important education
institutions in southern district. There are 74 departments in
regular. Total students strength is 2458 with scholars at
present.
Sample size
A purposive sample of 120 respondents across Humanities and
Science departments were chosen as the sample care was taken to
include boys and girls in both departments.
Tool for Data Collection

Questionnaire is the tool selected by the research for collecting
data from the chosen sample. A simple but a clearly presented
questionnaire with questions was used as a tool. No open ended
question was included.
The researcher prepared a questionnaire and data was collected to
make the process.
Processing of data
The data collected through the questionnaire were
checked and edited. The missions and commission were rectified.
The computer was used for preparing the master table and sub-
tables SPSS was also used in applying statistical tools to the
tabulated data.
The researcher has used the following statistical tools for
analyzing the data procured from the respondents.
1. Percentages Analysis
2. Multi –random sampling
Art - 60 Science -60
English-20, Tamil-
20, Economics -20.
Maths-20, Physic-
20,
Bio-teah-20.

Ist and IInd
Engilsh-M-10 and F-
10
Ist and IInd Maths-
M-10 and F-10
Ist and IInd Tamil-
M-10 and F-10
Ist and IInd
Physic-M-10 and F-
10
Ist and IInd
Eonomics-M-10 and
F-10
Ist and IInd Bio
teac-M-10 and F-10
CHAPTER III
Data analysis
1. Youth with voter ID
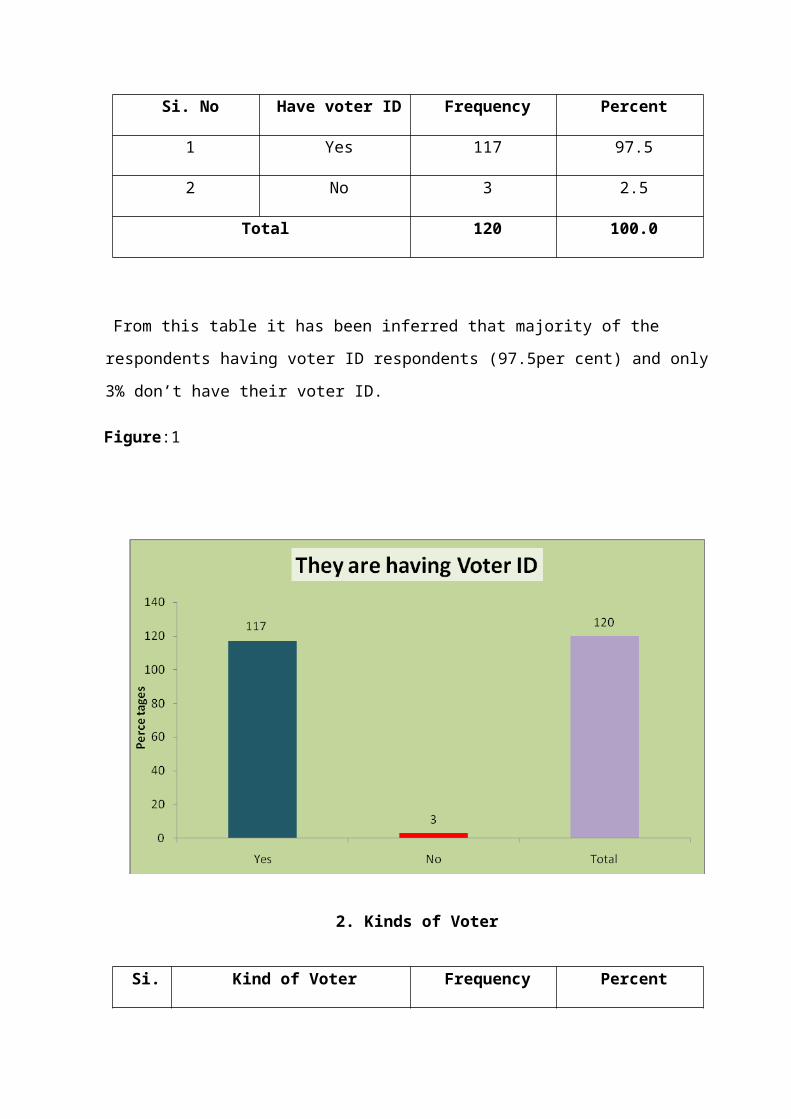
Si. No Have voter ID Frequency Percent
1 Yes 117 97.5
2 No 3 2.5
Total 120 100.0
From this table it has been inferred that majority of the
respondents having voter ID respondents (97.5per cent) and only
3% don’t have their voter ID.
Figure:1
2. Kinds of Voter
Si. Kind of Voter Frequency Percent

No
1 Ist time voter 29 24.1
2 IInd time voter 35 29.2
3 III Time voter 56 46.7
Total 120 100.0
From this table it has been inferred that majority of the
respondents 3rd time voter 56 respondents (46.7per cent) voting
in this Lok sabha election. 2nd voter 35 (29.2per cent)
respondents polling this Lok sabha election. The New voter 27
(22.5 per cent ) respondents there were voting fist time voting.
Very low level of the respondent 2 (1.7 per cent) without voter
Id. Figure:2
3.Youth’s Reason for voting

Si. No Reason Frequency Percent
1 Development of
the society
71 59.2
2 Equality 19 15.8
3 Changing their
Economical states
22 18.3
4 Any other idea 8 6.7
Total 120 100
The above table shows that Reason for my voting total
respondents are 120 members. Totally reason for my voting
majority of reasons for Development of our society 71
respondents (59.2 per cent ) and Equality reasons for 19
respondents in (15.8 per cent) and next changing our Economical
states reason for 22 respondents in (18.3 per cent). They
lowest reasons for any other idea 8 respondents (6.7 per cent)

in the research study. Figure:3
4.Best period in congress
Si. No Frequency Percent
1 Previous One
(2004-2009)
25 20.8
2 Present (2009-
2014)
8 6.7
3 Both are best 12 10.0
4 Both are bad 75 62.5
Total 120 100.0

The above table shows that Best period in Congress
party. 62.5 per cent of respondents felt that both terms of
Congress were bad. Only 10 per cent respondents said that
both terms of Congress are best. 20.8% respondents only felt
that 2004-2009 term of Congress was good.
Figure:4
5.Youth’s Party preference for voting
Si. No Frequency Percent
1 Congress 10 8.3
2 BJP 71 59.2
3 AIADMK 13 10.8
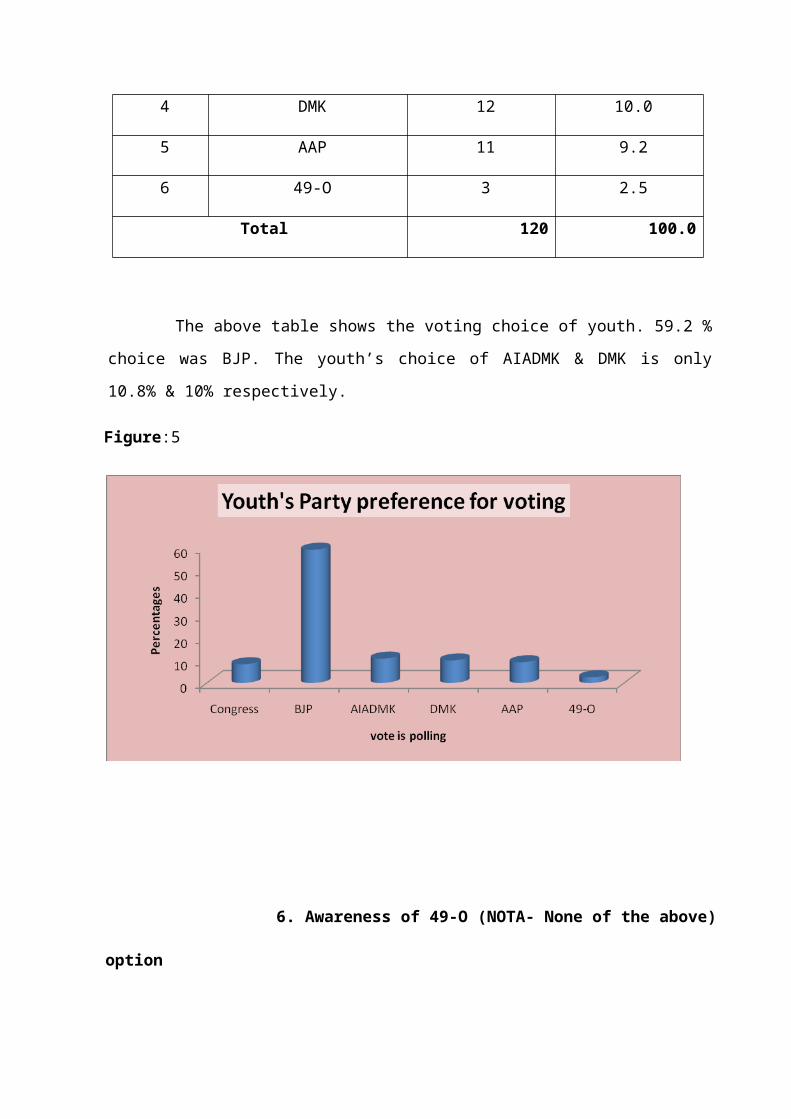
4 DMK 12 10.0
5 AAP 11 9.2
6 49-O 3 2.5
Total 120 100.0
The above table shows the voting choice of youth. 59.2 %
choice was BJP. The youth’s choice of AIADMK & DMK is only
10.8% & 10% respectively.
Figure:5
6. Awareness of 49-O (NOTA- None of the above)
option

Si. No Frequency Percent
1 Yes 75 63.8
2 No 45 36.2
Total 120 100.0
The above table shows that the PG students were aware of 49-O
NOTA. 63.8% knows about 49-0. 36.2 % only don’t know about 49-0
option.
Figure:6

7. Opinion on
Freebies
Si. No Frequency Percent
1 Yes 42 35.0
2 No 78 65.0
Total 120 100.0
The above table shows that PG students were not welcoming
freebies from political parties . 78 65% students do not like
freebies. Only 35% likes to get freebies from the political
parties.
Figure:7

8.Youth’s choice of Prime Ministerial Candidate
Si. No Candidate Frequency Percent
1 Rahul Gandhi 14 11.7
2 Narendra Modi 63 52.5
3 Jayalitha 11 9.2
4 Aravind kejrival 32 26.7
Total 120 100.0

The above table shows that 52% of
PG students prefer Narendra Modi as Prime Minister. Next to
Modi, the 26% youth prefer Aravind Kejrival as Prime Minister.
Figure:8
9. Youth’s
perception on Media support
Si. No Frequency Percent
1 Rahul Gandhi 12 10.0
2 Naranda Mody 77 64.2
3 Jayalalitha 8 6.7
4 Aravith Kejirival 23 19.1
Total 120 100.0
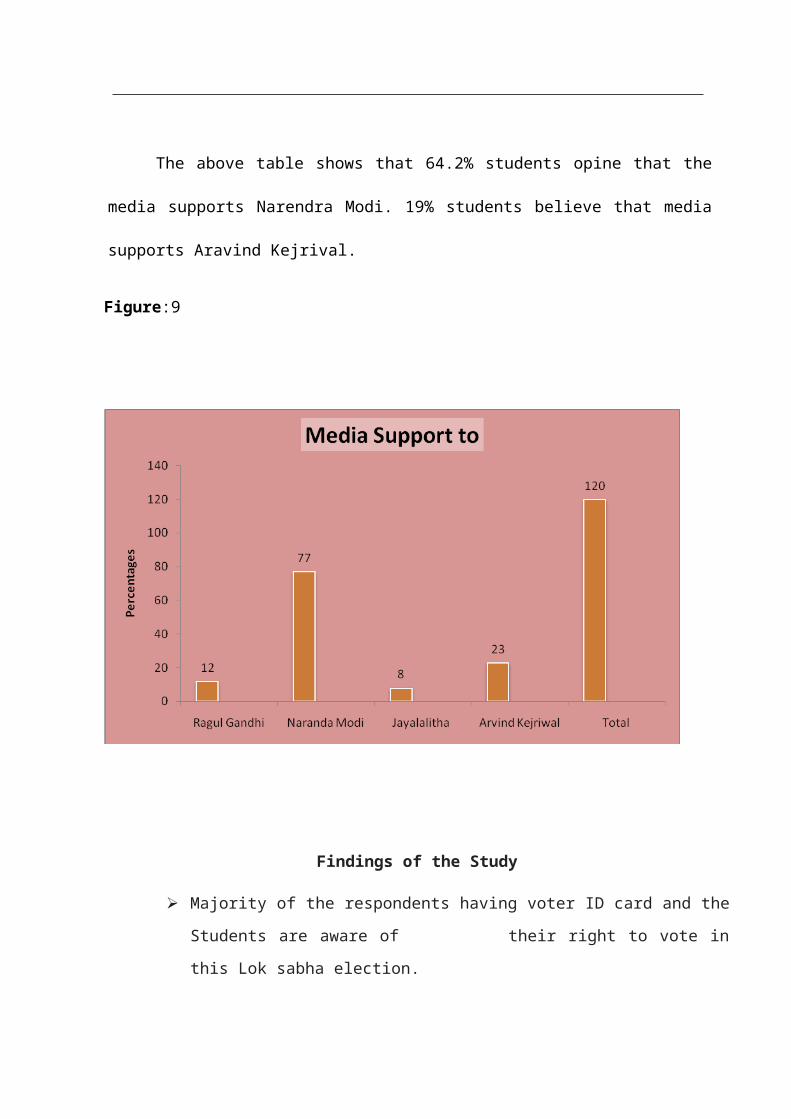
The above table shows that 64.2% students opine that the
media supports Narendra Modi. 19% students believe that media
supports Aravind Kejrival.
Figure:9
Findings of the Study
Majority of the respondents having voter ID card and the
Students are aware of their right to vote in
this Lok sabha election.