pre-feasibility analysis of medium and large scale investment ...
119
PRE-FEASIBILITY ANALYSIS OF MEDIUM AND LARGE SCALE INVESTMENT OPPORTUNITIES IN LUXOR AGRIBUSINESS - WASTE MANAGEMENT - WASTE TO ENERGY
-
Upload
khangminh22 -
Category
Documents
-
view
4 -
download
0
Transcript of pre-feasibility analysis of medium and large scale investment ...

PRE-FEASIBILITY ANALYSIS OF MEDIUM AND LARGE SCALE
INVESTMENT OPPORTUNITIES IN LUXOR AGRIBUSINESS - WASTE MANAGEMENT - WASTE TO ENERGY

Medium and Large Scale Investment Opportunities in Luxor
II
December 2017 The present Pre-feasibility Analysis was conducted by Chemonics Egypt Consultants for UNIDO in the framework of UNIDO “IMKAN project for youth employability and entrepreneurship in Upper Egypt”
IMKAN project is funded by the Government of Japan and implemented by UNIDO together with the Ministry of Trade and Industry and the Governorate of Luxor.

Medium and Large Scale Investment Opportunities in Luxor
III
Table of Contents
Table of Contents ....................................................................................................................... III
List of Figures ..............................................................................................................................V
List of Tables .............................................................................................................................. VI
Executive Summary ..................................................................................................................... 9
1 Background ....................................................................................................................... 12
1.1 Diversifying the Local Economy in Luxor ................................................................................................. 12
1.2 Laying Seeds of Industrial Clusters .......................................................................................................... 12
1.3 Attracting Larger Investments ................................................................................................................. 12
1.4 Why Invest in Luxor? ............................................................................................................................... 13
2 IO1 - Tomato and Fruit Concentrate Production Facility .................................................... 14
2.1 Overview .................................................................................................................................................. 14
2.2 Market Demand....................................................................................................................................... 14
2.3 Direct Inputs Required ............................................................................................................................. 18
2.4 Project Engineering ................................................................................................................................. 20
2.5 Selling, General and Administrative Expenses (SG&A) ............................................................................ 23
2.6 Organizational Structure ......................................................................................................................... 24
2.7 Financial Analysis and Investment ........................................................................................................... 24
2.8 Impact ...................................................................................................................................................... 29
3 IO2 - Black Honey and Date Syrup Production Facility ....................................................... 31
3.1 Overview .................................................................................................................................................. 31
3.2 Market Demand....................................................................................................................................... 31
3.3 Direct Inputs Required ............................................................................................................................. 35
3.4 Project Engineering ................................................................................................................................. 36
3.5 Selling, General and Administrative Expenses (SG&A) ............................................................................ 39
3.6 Organizational Structure ......................................................................................................................... 40
3.7 Financial Analysis and Investment ........................................................................................................... 40
3.8 Impact ...................................................................................................................................................... 45
4 IO3 - Fruit and Vegetable Drying Facility ............................................................................ 47
4.1 Overview .................................................................................................................................................. 47
4.2 Market Demand....................................................................................................................................... 47
4.3 Direct Inputs Required ............................................................................................................................. 51
4.4 Project Engineering ................................................................................................................................. 53
4.5 Selling, General and Administrative Expenses (SG&A) ............................................................................ 55
4.6 Organizational Structure ......................................................................................................................... 57
4.7 Financial Analysis and Investment ........................................................................................................... 57
4.8 Impact ...................................................................................................................................................... 62
5 IO4 - Fruit and Vegetable Packing Facility .......................................................................... 64
5.1 Overview .................................................................................................................................................. 64

Medium and Large Scale Investment Opportunities in Luxor
IV
5.2 Market Demand....................................................................................................................................... 64
5.3 Direct Inputs Required ............................................................................................................................. 68
5.4 Project Engineering ................................................................................................................................. 70
5.5 Selling, General and Administrative Expenses (SG&A) ............................................................................ 74
5.6 Organizational Structure ......................................................................................................................... 75
5.7 Financial Analysis and Investment ........................................................................................................... 75
5.8 Impact ...................................................................................................................................................... 80
6 IO5 - Medium Density Fiberboard Production Facility ....................................................... 82
6.1 Overview .................................................................................................................................................. 82
6.2 Market Demand....................................................................................................................................... 82
6.3 Direct Inputs Required ............................................................................................................................. 84
6.4 Project Engineering ................................................................................................................................. 86
6.5 Selling, General and Administrative Expenses (SG&A) ............................................................................ 89
6.6 Organizational Structure ......................................................................................................................... 91
6.7 Financial Analysis and Investment ........................................................................................................... 91
6.8 Impact ...................................................................................................................................................... 96
7 IO6 Biomass Fuel Pellets Production Facility ...................................................................... 97
7.1 Overview .................................................................................................................................................. 97
7.2 Market Demand....................................................................................................................................... 97
7.3 Direct Inputs Required ........................................................................................................................... 100
7.4 Project Engineering ............................................................................................................................... 101
7.5 Selling, General and Administrative Expenses (SG&A) .......................................................................... 104
7.6 Organizational Structure ....................................................................................................................... 105
7.7 Financial Analysis and Investment ......................................................................................................... 105
7.8 Impact .................................................................................................................................................... 110
8 Key Considerations .......................................................................................................... 111
8.1 Overview ................................................................................................................................................ 111
8.2 EGP Devaluation Effects ........................................................................................................................ 111
8.3 Supply Chain Risks and Mitigation ......................................................................................................... 111
8.4 Conversion Factors and Yields ............................................................................................................... 112
8.5 Marketing and Distribution ................................................................................................................... 112
9 Annex I – Financial Model and Key Assumptions ............................................................. 113
9.1 Methodology for Financial Model ......................................................................................................... 113
10 Annex II – Regulatory Requirements ............................................................................ 116
10.1 For Food Processing Industries .............................................................................................................. 116
10.2 For Waste Management ........................................................................................................................ 117
11 References ................................................................................................................... 118

Medium and Large Scale Investment Opportunities in Luxor
V
List of Figures
Figure 1 Egypt Export vs Import in USD for years 2012-2016 for Tomato Sauces and Ketchup .......................... 15
Figure 2 Egypt Export vs Import in USD for years 2012-2016 for Fruit Pastes and Purees .................................. 16
Figure 3 Comparison between Target Market Size and Year 1-5 Revenues for Concentrate .............................. 17
Figure 4 Process Flow Diagram of Concentrate Production ................................................................................. 20
Figure 5 Egypt Export vs Import in USD for years 2012-2016 for Cane Molasses ................................................ 32
Figure 6 Egypt Export vs Import in USD for years 2012-2016 for Other Sugars ................................................... 33
Figure 7 Comparison between Target Market Size and Year 1-5 Revenues for Syrup Production Line ............... 34
Figure 8 Process Flow Diagram of Syrup Production ............................................................................................ 37
Figure 9 Egypt Export vs Import in USD for years 2012-2016 for Fresh and Dried Tomatoes .............................. 48
Figure 10 Egypt Export vs Import in USD for years 2012-2016 for Fresh and Dried Bananas .............................. 49
Figure 11 Egypt Export vs Import in USD for years 2012-2016 for Fresh and Dried Mangoes ............................. 49
Figure 12 Comparison between Target Market Size and Year 1-5 Revenues for Dried Fruits and Vegetable
Production Line ............................................................................................................................................ 51
Figure 13 Process Flow Diagram of Fruit and Vegetable Drying ........................................................................... 54
Figure 14 Egypt Export vs Import in USD for years 2012-2016 for Fresh and Dried Tomatoes ............................ 65
Figure 15 Egypt Export vs Import in USD for years 2012-2016 for Fresh and Dried Grapes ................................ 65
Figure 16 Egypt Export vs Import in USD for years 2012-2016 for Fresh and Dried Mangoes ............................. 66
Figure 17 Comparison between Target Market Size and Year 1-5 Revenues for Fresh Fruits and Vegetable Packing
Line ............................................................................................................................................................... 68
Figure 18 Process Flow Diagram of Fruit and Vegetable Packing ......................................................................... 70
Figure 19 Egypt Export vs Import in USD for years 2012-2016 for MDF .............................................................. 83
Figure 20 Comparison between Target Market Size and Year 1-5 Revenues for MDF Production Line .............. 84
Figure 21 Process Flow Diagram of MDF Production ........................................................................................... 87
Figure 22 Comparison between Target Market Size and Year 1-5 Revenues for Biomass Fuel Pellets Production
Line ............................................................................................................................................................... 99
Figure 23 Process Flow Diagram of Biomass Fuel Pellets Production ................................................................ 102

Medium and Large Scale Investment Opportunities in Luxor
VI
List of Tables
Table 1 Brix Values for Processed Tomato ........................................................................................................... 14
Table 2 Egypt’s Top Importers of Tomato Sauces and Ketchup in 2016 .............................................................. 15
Table 3 Egypt’s Top Importers of Fruit Pastes and Purees in 2016 ...................................................................... 16
Table 4 Target Market Size for Concentrates ....................................................................................................... 16
Table 5 Production Schedule according to Seasonality of Tomato and Mango in Luxor and Qena ..................... 18
Table 6 Prices of Tomato and Mango for 2016-2017 ........................................................................................... 18
Table 7 Specific Consumption and Utility Bill for Tomato and Fruit Concentrate for Year 1 ............................... 19
Table 8 Seasonal Labor Required for Tomato and Mango Concentrate .............................................................. 19
Table 9 Conversion Ratio for Tomato and Mango Concentrate ........................................................................... 20
Table 10 Step-by-Step Details of Concentrate Production Process ...................................................................... 21
Table 11 Lump-sum Price Estimate for Concentrate Production Line .................................................................. 22
Table 12 List of Staff and Monthly Salaries for Concentrate Production Line ...................................................... 23
Table 13 Projected Income Statements for Concentrate Production Line (EGP thousands) ............................... 27
Table 14 Projected Cash Flow Statement for Concentrate Production Line (EGP thousands) ............................. 28
Table 15 Egypt’s Top Importers of Cane Molasses in 2016 .................................................................................. 32
Table 16 Egypt’s Top Importers of Other Sugars in 2016 ..................................................................................... 33
Table 17 Target Market Size for Syrups ................................................................................................................ 33
Table 18 Production Schedule according to Seasonality of Sugarcane and Dates in Luxor and Qena ................. 35
Table 19 Prices of Sugarcane and Dates for 2016-2017 ....................................................................................... 35
Table 20 Specific Consumption for each product and Expected EGP per ton for Year 1 ..................................... 36
Table 21 Seasonal Labor Required for Black Honey and Date Syrup .................................................................... 36
Table 22 Conversion Ratio for Sugarcane and Date into Syrup ............................................................................ 37
Table 23 Step-by-Step Details of Syrup Production Process................................................................................. 37
Table 24 Lump-sum Price Estimate for Syrup Production Line............................................................................. 38
Table 25 List of Staff and Monthly Salaries for Concentrate Production Line ...................................................... 39
Table 26 Projected Income Statements for Syrup Production Line (EGP thousands) .......................................... 43
Table 27 Projected Cash Flow Statement for Syrup Production Line (EGP thousands)........................................ 44
Table 28 Initial and Final Moisture Content of Dried Products ............................................................................ 47
Table 29 Egypt’s Top Importers of Fresh and Dried Tomatoes in 2016................................................................ 48
Table 30 Egypt’s Top Importers of Fresh and Dried Bananas in 2016 .................................................................. 49
Table 31 Egypt’s Top Importers of Fresh and Dried Mangoes in 2016 ................................................................. 50
Table 32 Target Market Size for Dried Fruit and Vegetables ................................................................................ 50
Table 33 Production Schedule according to Seasonality of Tomatoes, Bananas and Mangoes in Luxor and Qena
..................................................................................................................................................................... 51
Table 34 Prices of Fresh Tomatoes, Bananas and Mangoes for 2016-2017 ......................................................... 52

Medium and Large Scale Investment Opportunities in Luxor
VII
Table 35 Specific Consumption and Expected Cost per ton for Year 1 ................................................................. 52
Table 36 Seasonal Labor Required for Fruit and Vegetable Drying ...................................................................... 52
Table 37 Conversion Ratio for Dried Products...................................................................................................... 53
Table 38 Step-by-Step Details of Fruit and Vegetable Drying Process ................................................................. 54
Table 39 Price Estimate for Fruit and Vegetable Drying Line ............................................................................... 55
Table 40 List of Staff and Monthly Salaries for Concentrate Production Line ...................................................... 56
Table 41 Projected Income Statements for Fruit and Vegetable Drying Line (EGP thousands) ........................... 60
Table 42 Projected Cash Flow Statement for Fruit and Vegetable Drying Line (EGP thousands) ........................ 61
Table 43 Egypt’s Top Importers of Fresh and Dried Tomatoes in 2016................................................................ 65
Table 44 Egypt’s Top Importers of Fresh and Dried Grapes in 2016 .................................................................... 66
Table 45 Egypt’s Top Importers of Fresh and Dried Mangoes in 2016 ................................................................. 66
Table 46 Target Market Size for Packed Fruit and Vegetables ............................................................................. 67
Table 47 Production Schedule according to Seasonality of Tomatoes, Grapes and Mangoes in Luxor and Qena
..................................................................................................................................................................... 68
Table 48 Prices of Fresh Tomatoes, Grapes and Mangoes for 2016-2017 ........................................................... 69
Table 49 Specific Consumption and Expected Cost per ton for Year 1 ................................................................. 69
Table 50 Seasonal Labor Required for Fruit and Vegetable Packing .................................................................... 69
Table 51 Step-by-Step Details of Fresh Tomato Packing Process ......................................................................... 70
Table 52 Step-by-Step Details of Fresh Grapes Packing Process .......................................................................... 71
Table 53 Step-by-Step Details of Fresh Mangoes Packing Process ....................................................................... 72
Table 54 Price Estimate for Fruit and Vegetable Packing Line ............................................................................. 73
Table 55 List of Staff and Monthly Salaries for Fruit and Vegetable Packing Line ................................................ 74
Table 56 Projected Income Statements for Fruit and Vegetable Packing Line ..................................................... 78
Table 57 Projected Cash Flow Statement for Fruit and Vegetable Packing Line .................................................. 79
Table 58 Egypt’s Top Exporters of MDF in 2016 ................................................................................................... 83
Table 59 Target Market Size for MDF ................................................................................................................... 83
Table 60 Production Schedule according to Seasonality of Sugarcane in Luxor and Qena .................................. 85
Table 61 Urea Formaldehyde Specifications Required in MDF Production Process ............................................ 85
Table 62 Specific Consumption and Expected Cost per ton for Year 1 ................................................................. 86
Table 63 Seasonal Labor Required for MDF Production ....................................................................................... 86
Table 64 Conversion Ratio for MDF ...................................................................................................................... 87
Table 65 Step-by-Step Details of MDF Production Process .................................................................................. 87
Table 66 Price Estimate for MDF Production Line ................................................................................................ 89
Table 67 List of Staff and Monthly Salaries for MDF Production Line .................................................................. 89
Table 68 Projected Income Statements for MDF Production Line (EGP thousands) ............................................ 94
Table 69 Projected Cash Flow Statement for MDF Production Line (EGP thousands) ......................................... 95
Table 70 Local Clinker Production (IFC, 2016) ...................................................................................................... 97

Medium and Large Scale Investment Opportunities in Luxor
VIII
Table 71 Thermal Consumption Needs in Pellet Equivalent (IFC, 2016) .............................................................. 98
Table 72 Thermal Consumption Needs in Pellet Equivalent for Local Plants ....................................................... 98
Table 73 Top Importing European Markets of Wood Pellets ............................................................................... 98
Table 74 Target Market Size for Pellets ................................................................................................................ 99
Table 75 Seasonality of Sugarcane and Corn in Luxor and Qena ....................................................................... 100
Table 76 Specific Consumption and Expected Cost per ton for Year 1 ............................................................... 100
Table 77 Seasonal Labor Required for Biomass Fuel Pellets Production ............................................................ 101
Table 78 Conversion Ratio for Biomass Fuel Pellets ........................................................................................... 101
Table 79 Step-by-Step Details of Biomass Fuel Pellets Production Process ....................................................... 102
Table 80 Price Estimate for Biomass Fuel Pellet Production Line ....................................................................... 103
Table 81 List of Staff and Monthly Salaries for Biomass Fuel Pellets Production Line ....................................... 104
Table 82 Projected Income Statements for Biomass Fuel Pellets Production Line ............................................ 108
Table 83 Projected Cash Flow Statement for Biomass Fuel Pellets Production Line .......................................... 109
Table 84 Growth and Inflation Rate Assumptions .............................................................................................. 113
Table 85 Plant Utilization Assumptions .............................................................................................................. 114
Table 86 Working Capital Roll-Forward Assumptions ........................................................................................ 114

Medium and Large Scale Investment Opportunities in Luxor
9
Executive Summary
Luxor governorate has been struggling due to the downturn in tourism which has resulted in high levels of
unemployment. Luxor has diverse opportunities in the sustainable agriculture and food production, waste
management and sustainable energy sectors.
In the framework of IMKAN project for youth employability and entrepreneurship in Upper Egypt (in short
IMKAN) implemented by UNIDO together with the Ministry of Trade and Industry and Luxor Governorate and
with funding from the Government of Japan,1 UNIDO carried out an extensive assessment of the economic
texture of Luxor and identified potential clusters in these sectors, that have a high economic and social return,
with a positive environmental impact. This uncovered a number of opportunities on multiple scales of capital
and value addition that can drive the local economy forward. While startups and MSEs are an important element
of a cluster, medium and large firms are crucial to its growth. In addition to supporting to small-scale business
activity in these sectors, UNIDO is supporting the creation of larger industrial-scale businesses through medium-
to-large sized investments upwards of EGP 20m.
This report shows the pre-feasibility analysis conducted on 6 selected investment opportunities in the
aforementioned sectors, as part of the effort to illustrate the untapped potential in Luxor, with the aim of
mobilizing public stakeholders in taking concrete action in alleviating barriers to the realization of the highest
value-added industrial activities, while simultaneously whetting the appetite of potential investors. It is worth
noting that all the opportunities maximize utilization of local agriculture produce or waste and overlap in the
three strategic sectors of sustainable agriculture and food production, waste management and renewable
energy. The identified opportunities have the potential to create 157 direct local jobs, in addition to 124 seasonal
jobs.
They are summarized below.
Investment Opportunity 1 – Tomato and Fruit Concentrate Production Facility
This opportunity initially set out to take advantage of the abundant supply of tomatoes harvested in and around
Luxor. Tomatoes are usually harvested and transported outside the governorate as fresh crop, so there was a
clear opportunity in establishing a facility that can process some of that supply and add value to the crop locally.
This would increase the demand on local tomatoes, bringing more stability to the price over time and help
reduce the amount of losses incurred during transportation to the Delta. However, due to seasonality issues and
price volatility of tomatoes, it was wise to use another local crop in the off-season to better utilize the facility.
Therefore, the facility would produce tomato concentrate during the winter harvest and mango concentrate
during the summer harvest. Both products would be targeted for export to the food processing industries in
Europe and the Gulf, where Egypt already exports a significant amount with plenty of room left to improve
current market shares. The technology used is an industrial standard concentrate production line, which is
manufactured and assembled locally.
Investment Opportunity 2 – Black Honey and Date Syrup Production Facility
Similar to IO1, this opportunity set out to take advantage of large production of sugarcane in and around Luxor.
Sugarcane is primarily used in raw sugar production but there are also traditional producers of black honey from
fresh sugarcane (as opposed to molasses resulting from the process of sugar production). Hence, there was a
clear opportunity in establishing a facility to industrialize the process of black honey production, to upgrade both
1 IMKAN project was implemented from July 2016 to December 2017.

Medium and Large Scale Investment Opportunities in Luxor
10
the quality and quantity of current production methods. Sugarcane is only harvested during the winter months,
so to account for seasonality and better utilize the facility, dates were selected as a secondary crop. Using the
same technology, with slight modifications in how the raw material is handled in the beginning of the process,
date can be used to produce date syrup or honey, which is an alternative sweetener like black honey. Both
products would be targeted for both local and export markets, sold as ‘white label’ goods in bulk to companies
that specialize in marketing and distribution. The potential lies more in import substitution rather than export,
as Egypt imports a significant amount of alternative sweeteners each year. The technology used is an industrial
standard syrup production line (similar to the concentrate production line used in IO1), which is manufactured
and assembled locally.
Investment Opportunity 3 – Fruit and Vegetable Drying Facility
This opportunity aims to add value to local crops through drying, i.e. the extraction of water from fruit and
vegetables using dehydration, which improves its shelf-life while maintaining its nutritional value as much as
possible. The selected crops, based on abundance and seasonality, are tomatoes, bananas and mangoes. Dried
tomatoes are used mostly for cooking, while banana and mango chips are usually consumed as snacks.
Dehydrated fruits and vegetables have major potential in export, as well as growing demand locally. There are
food drying operations currently taking place around the country but on a small-scale, usually reliant on
traditional sun-drying techniques. Establishing a facility with quick drying technology could produce dried fruits
and vegetables on a larger scale suitable for bigger markets. There are many technologies used in food drying
that vary according the feedstock, the specifications of the final product, the production capacity, etc. The
technology selected for this opportunity is called ‘swell-drying’ or DIC, which is a French technology that uses
heat to dehydrate foods to a quality that is similar to freeze-drying but at much lower capital and running costs.
It is versatile enough to accommodate most fruits and vegetables, and even medicinal and aromatic plants.
Investment Opportunity 4 – Fruit and Vegetable Packing Facility
This opportunity aims to add value to local crops through improved packaging, making it more suitable for export
and local niche markets. The selected crops, based on abundance and seasonality, are tomatoes, grapes and
mangoes. The packing facility receives the fresh harvest that undergoes fumigation and quality packaging,
transported in refrigerated trucks to the relevant ports. Egypt already exports a significant amount of its crops,
especially to the Gulf and Europe, and this facility will improve access for local farmers to these markets. The
technology selected for this packing facility is mainly imported which consists mostly of packaging lines, waxing
stations and cooling rooms. Luxor is already home to a packing facility which is not operating at maximum
capacity due to a limitation in refrigerated transport from facility to ports (mainly Alexandria), which is addressed
in this study.
Investment Opportunity 5 – MDF Production Facility
This opportunity aims to add value to the large amount of agricultural waste generated in and around Luxor.
Bagasse, which is the fiber discarded from the process of sugar production from sugarcane, is considered a high-
quality material input for the production of medium density fiber board, or MDF. Establishing an MDF production
facility in Luxor makes sense to be close to the sugar production facilities in the region and will add significant
value to sugarcane bagasse. The potential here lies mainly in the local market as Egypt imports a significant
amount of MDF, and wood in general. Export markets do have potential as well since MDF made from bagasse
can meet export quality standards. MDF boards are used mainly in furniture and fixtures, and are commonly
used as a replacement for natural wood boards. The technology is expensive, and a refurbished production line
can be imported from Japan or Italy. However, the return on investment is quite high compared with the other
opportunities (see Summary below).

Medium and Large Scale Investment Opportunities in Luxor
11
Investment Opportunity 6 – Alternative Fuel Production Facility
This opportunity also takes advantage of local waste streams such as sugarcane bagasse, wood cutting and
sawdust, corn stalk, palm tree fronds and banana trees. The final product is high-calorific value biomass pellets
that can burned on-site at energy intensive factories such as cement plants. The potential lies in serving the local
market such as cement plants in Qena and Assiut, which are preparing to receive all kinds of alternative fuel to
meet the energy demands. However, for this opportunity to remain financially sustainable, at least half the
production must be aimed towards export because of the discrepancy in selling prices. The technology used is
mainly imported from Europe and the USA (or possibly China but at a fraction of the productivity), which is used
to shred the agricultural waste, and pelletize it.
Summary of Feasibility Analysis
IO1 IO2 IO3 IO4 IO5 IO6
Summary Concentrate Syrup Drying Packing MDF Fuel
Capital Expenditures EGP 16,700 EGP 13,350 EGP 14,100 EGP 14,000 EGP 67,100 EGP 38,070
Working Capital Required EGP 14,947 EGP 7,707 EGP 5,598 EGP 27,913 EGP 36,266 EGP 8,868
Minimum Investment EGP 31,647 EGP 21,057 EGP 19,698 EGP 41,913 EGP 103,366 EGP 46,938
Direct Investment (Equity) EGP 9,494 EGP 6,317 EGP 5,909 EGP 12,574 EGP 31,010 EGP 14,081
Debt Financing EGP 22,153 EGP 14,740 EGP 13,788 EGP 29,339 EGP 72,356 EGP 32,857
Enterprise Value EGP 66,730 EGP 42,513 EGP 117,376 EGP 114,898 EGP 917,367 EGP 157,075
Internal Rate of Return 30% 29% 56% 34% 73% 39%
Simple Payback 5.9 years 5.9 years 2.2 years 4.4 years 2.8 years 3.1 years
Discounted Payback 8.3 years 8.0 years 3.4 years 8.0 years 2.3 years 5.4 years
Profitability Index 2.11 2.02 5.96 2.74 8.87 3.35
Note: EGP numbers are in thousands.

Medium and Large Scale Investment Opportunities in Luxor
12
1 Background
1.1 Diversifying the Local Economy in Luxor
Luxor governorate has been struggling due to the downturn in tourism which has resulted in high levels of
unemployment. On the surface Luxor may seem unready for other economic activities, yet UNIDO on-the-
ground work shows otherwise.
Luxor has diverse opportunities in the sustainable agriculture and food production, waste management and
sustainable energy sectors. These opportunities are highly profitable and leverage the unique resources of the
governorate in sustainable manner. More importantly, Luxor has a local business community that is willing to
capture such opportunities.
However, a limited but challenging set of barriers hindering the realization of the highest value-added industrial
activities exists. Under the aegis of the Ministry of Trade and Industry and Luxor governorate, UNIDO, in the
framework of IMKAN project for youth employability and entrepreneurship in Upper Egypt, brought together
both public and private stakeholders to take actions to remove such obstacles and pave the way for local
industrial development.
1.2 Laying Seeds of Industrial Clusters
UNIDO, through its IMKAN project, has carried out an extensive mapping of the economic texture of Luxor
governorate with the purpose of diversifying the local economy. The mapping aimed at determining potential
industrial clusters that can evolve in Luxor and business opportunities within those clusters that can have high
economic and social return, and a positive environmental impact.
The clusters aim at leveraging the competitive edge of Luxor and build upon existing activities. Focus was given
to clusters in sustainable agriculture and food production, waste management, and sustainable energy. The
mapping lead to identifying business opportunities on multiple scales of capital and value addition that can drive
the local economy forward. UNIDO proceeded to work on laying the seed of such clusters and supported 22
start-ups and micro and small enterprises (MSEs) to start and grow their business in pre-determined business
opportunities.
UNIDO also built the capacity of local service providers and NGOs so they may support the creation of startups
in the sector. In addition, UNIDO raised the capacity of local investors and financing institutions to support start-
ups and MSEs. The 22 supported enterprises are expected to create 146 direct local jobs within the next two
years. These businesses require initial investments of varying scale, from as small as 30,000 up to 1,000,000 EGP
per enterprise. In 2014, in Southern Upper Egypt, UNIDO attracted investment locally for startups and micro
enterprises in the range of capital investment of 50,000 to 250,000 EGP per enterprise. In that year EGP 1.25m
were facilitated in investments in 8 startups and micro enterprises.
1.3 Attracting Larger Investments
While startups and MSEs are an important element of a cluster, medium and large firms are crucial to its growth.
In addition to leveraging investment for start-ups and MSEs, UNIDO is supporting the creation of larger
industrial-scale businesses through medium-to-large sized investments upwards of EGP 20m. Opportunities that
can absorb such capital have been defined through technical and market experts. More importantly, a group of
local investors has already shown interest in such investment opportunities.

Medium and Large Scale Investment Opportunities in Luxor
13
The UNIDO approach in attracting investment opportunities is unique in the sense that it:
leverages existing competitive edge;
utilizes extended field visits, data collection, stakeholders’ discussions, and technical expertise;
is carried out in consultation of the private sector and in partnership with local investors;
develops opportunities that have high economic, social and environmental impact.
Pre-feasibility analysis has been prepared for 6 selected investment opportunities to illustrate the untapped
potential in Luxor and whet investor appetite.
The investment opportunities are diverse, targeting both local and export markets, feeding into other industries
or straight to consumers. They are as follows:
1. tomato and fruit (mango) concentrate production for food processing industries
2. black honey and date syrup production for consumers
3. dried fruit and vegetable production for consumers
4. fresh fruit and vegetable packing for export
5. MDF panels manufacturing for local furniture industry
6. biomass fuel pellets production as alternative fuel for energy-intensive industries
All opportunities maximize utilization of local agriculture produce or waste and overlap in the three strategic
sectors of sustainable agriculture and food production, waste management and sustainable energy. The
identified opportunities have the potential to create 157 direct local jobs, in addition to 124 seasonal jobs.
1.4 Why Invest in Luxor?
Luxor enjoys a central geographical location amongst the governorates of Southern Upper Egypt and is
considered Egypt’s southern portal to Africa. It is also the commercial gateway between the Red Sea governorate
and Upper Egypt. It already has an active agricultural sector due to its optimum climate, and is specialized in the
cultivation of tomatoes, sugarcane, grapes, bananas, mangoes, dates, corn/maize and medical/aromatic plants
such as hibiscus.
Luxor is already home to three industrial zones; Boghdadi (311 acres) in the center of the governorate; New Tiba
(382.71 acres) to the North; and Armant (1011.73 acres) to the South. These zones are currently under-utilized
but are being readied to become more attractive for investment. Furthermore, there are several major industrial
activities within proximity that can be clustered around such as the sugar factories in Armant, south of Luxor as
well as the sugar processing, paper/cardboard manufacturing and cement plants in neighboring Qena.
Luxor’s worldwide reputation as the tourism capital of Egypt has unparalleled brand value. It is known for being
the ‘world’s largest open-air museum’ with over a third of the ancient world’s ruins located on its grounds. This
had mobilized major capital into the creation of local services such as hospitality, conference centers, etc. which
can equally serve the business community as it does for tourism.

Medium and Large Scale Investment Opportunities in Luxor
14
2 IO1 - Tomato and Fruit Concentrate Production Facility
2.1 Overview
This opportunity aims to add value to local crops by producing concentrates suitable for export to food
processing industries in the Gulf and Europe. The crops in focus are tomatoes and mangoes mainly, because of
their local abundance and seasonality.
Initially the focus was on tomatoes, which was highlighted as a crop that is widely cultivated yet undergoes little
processing locally. The opportunity is to establish a local facility that can take advantage of that supply and
produce value-added products such as concentrates, purees and pastes.
Mangoes were later selected as a suitable secondary crop to offset seasonal price volatility in tomatoes during
the summer months. This way the facility operates on locally sourced crops only; tomatoes during the winter
and mangoes during the summer, using the same technology for both.
2.2 Market Demand
This section provides a description of the products and targeted markets, including a brief analysis on the current
market structure, the potential for import substitution and export where applicable.
2.2.1 Product Description
This investment opportunity primarily focuses on producing two products:
Product A: tomato concentrate for the tomato processing industry, such as the production of paste, soups,
sauces and ketchup.
Tomato is processed into several forms such as puree, paste, salsa, etc. which are
differentiated by the amounts of solids they contain. Concentrate typically has the
highest solid content, which is commonly measured using Brix value, which is a
measure of Total Soluble Solids (TSS) that are typically sugars. Tomato concentrate
is usually around 36-38% TSS, as shown below, which is higher than other forms of
processed tomato. Concentrate was selected as it has the highest solid content that
makes it suitable feed for a wider range of food industries, which can then take it and
dilute accordingly.
Table 1 Brix Values for Processed Tomato
Specifications Solid Content (Brix)
Puree 12-15%
Paste 28-30%
Concentrate 36-38%
Product B: mango concentrate for the fruit juice manufacturing industry.
The same production line can be used to produce concentrate from other fruits and
vegetables. Mango has been identified as a suitable feedstock from which to
produce concentrate for the juice making industry to mitigate supply chain risks
(explained in more detail in Section 1.3). Mango concentrate typically has a final
Brix value of 28-32%.
For illustrative purposes only.
For illustrative purposes only.

Medium and Large Scale Investment Opportunities in Luxor
15
The final product is packaged in industry standard aseptic bags, weighing 200kg each, with a shelf-life of 24
months.
2.2.2 Current Market Structure
According to Trade Map data(International Trade Centre 2017), Egypt ranked 9th in world exports of tomato
sauces and ketchup in 2016, but that only presents a 1.9% market share. The global market is dominated by
USA, Netherland, Germany, Italy and Belgium. The world market for exports in this category was worth USD 1.6b
in 2016. Egypt exports seem to have plateaued the last three years, despite a decent jump in 2013, while imports
have remained relatively steady as shown below.
Figure 1 Egypt Export vs Import in USD for years 2012-2016 for Tomato Sauces and Ketchup
Egypt’s biggest importers in 2016 are shown in Table 2. Despite ranking high in the respective country’s imports,
the market shares are considered quite low, except for Sudan. This leaves significant room for improvement in
market share for the main markets currently targeted.
Table 2 Egypt’s Top Importers of Tomato Sauces and Ketchup in 2016
Value
exported
in 2016
(USD
thousand)
Share in
Egypt's
exports
(%)
Quantity
exported
in 2016
Share in
Country's
Imports
(%)
Rank in
Country's
Exports
Average
Price per
ton (USD
thousand)
1 Sudan 6,898 22.7 5,501 98.1 1st 1.25
2 Morocco 4,881 16.1 3,893 6.3 5th 1.25
3 Saudi Arabia 3,685 12.1 2,939 13.4 3rd 1.25
4 United Arab Emirates 3,039 10.0 2,424 12.3 2nd 1.25
5 Jordan 2,062 6.8 1,644 13.8 4th 1.25
The stability in import levels also indicates that current local production can satisfy most of the demand from a
local market perspective, so the opportunity there may be limited. However, it is important to note that
consultations with stakeholders did state that local demand is growing and can easily absorb increases in
production.
As for the market for fruit pastes and purees (the data available does not single out mango products), Egypt
ranked 21st globally. This accounts for only 1.2% of the global market, which is around USD 3.1 billion, as of 2016.
Exports have been erratic in the last 5 years, and Egypt remains a net exporter by almost 2:1. While there is no
breakdown of the data available to show how much mango specifically contributes to these numbers, it can be
18
,44
1
48
,60
0
32
,09
4
31
,35
6
30
,37
0
32
,17
2
1,1
78
77
8
1,3
21
2,1
83
1,0
24
1,2
97
2 0 1 2 2 0 1 3 2 0 1 4 2 0 1 5 2 0 1 6 5 - Y R A V G
Export Import

Medium and Large Scale Investment Opportunities in Luxor
16
assumed that there is both export growth and import substitution potential when it comes to this category of
products. The following figure shows import and export trends for the last 5 years.
Figure 2 Egypt Export vs Import in USD for years 2012-2016 for Fruit Pastes and Purees
Egypt’s biggest importers in this category for 2016 are shown in Table 3. Except for the United States, Egypt
ranks quite high on the list of neighboring countries. While it controls a decent market share in both Algeria and
Sudan, there is significant improvement to be made in the case of Saudi Arabia and United Arab Emirates.
Table 3 Egypt’s Top Importers of Fruit Pastes and Purees in 2016
Value
exported
in 2016
(USD
thousand)
Share in
Egypt's
exports
(%)
Quantity
exported
in 2016
Share in
Country's
Imports
(%)
Rank in
Country's
Exports
Average
Price per
ton (USD
thousand)
1 Algeria 9,528 31.5 4,364 50.8 1st 2.18
2 United Arab Emirates 3,191 10.5 1,462 11.4 3rd 2.18
3 Saudi Arabia 2,039 6.7 934 73.7 1st 2.18
4 Sudan 2,019 6.7 925 9.4 4th 2.18
5 United States of America 1,912 6.3 876 0.7 25th 2.18
In the fruit paste and purees category (which also includes products like jams and jellies) there is untapped
potential in the Gulf countries despite ranking high. From a local perspective, there is measurable demand that
relies on importing in this category. However, it is safer to assume that importing concentrates from fruits that
are readily harvested in Egypt such as mango accounts for a small portion of the amount imported in this
category.
2.2.3 Target Market Size
The trailing 5-year average for values exported and imported in tomato sauces and ketchup category and the
fruit pastes and purees categories are as follows:
Table 4 Target Market Size for Concentrates
5-yr trailing average 2012-2016 (USD
thousand)
Tomato Pastes
and Ketchup
Fruit Pastes and
Purees
Totals Target % Target Value
13
,95
2
24
,62
8
42
,20
8
25
,78
4
30
,26
3
27
,36
7
4,5
86
4,6
70
8,3
69
9,9
50
10
,69
1
7,6
53
2 0 1 2 2 0 1 3 2 0 1 4 2 0 1 5 2 0 1 6 5 - Y R A V G
Export Import

Medium and Large Scale Investment Opportunities in Luxor
17
Export 32,172 27,367 59,539 50% 29,770
Import 1,297 7,653 8,950 10% 895
USD 33,469 35,020 USD 30,665
The target market size was estimated using the assumption that there is more room for growth from an export
market perspective. With aggressive marketing and quality control, total exports in these categories can improve
by 50%. From an import substitution perspective, the potential market size is assumed to be 10% of current
import levels. This brings the total estimated target market size to USD 31m (EGP 558m)
Expected Selling Prices: The markets to target are export mainly to take advantage of the lucrative pricing post-
EGP flotation, followed by local food industry. A ton of tomato concentrate is expected to sell somewhere in
the range of USD 900 – 1,500 per ton (EGP 16,000 – 27,000). Mango concentrate is expected to export at prices
between USD 2,000 – 2,200 per ton (EGP 36,000 – 40,000). Local prices for these products are expected to be
within the same ranges however on the lower side.
Anticipated Competition: There are two neighboring tomato processers already in operation, UEFOCO in Minya
(800 ton per day capacity) and El-Wady in Qena (300 ton per day capacity). However, the expected competition
is minimal as consultations have indicated that demand for tomato concentrate is not satisfied at a local level,
and there is always room for export, especially considering added competitiveness post-EGP flotation.
2.2.4 Estimated Annual Sales and Forecasts
The plant, described in more detail under Project Engineering, is assumed to start operating at 50% capacity in
Year 1 and reach around 91% by Year 10 as part of the conservative assumptions resorted to in the present
document. Revenue growth forecasts to account for in price inflation and better capacity utilization in
subsequent years are assumed, with an aggressive marketing push in the first 5 years, as shown in Annex I:
This translates to estimated production and annual sales for Year 1 as follows:
1,429 tons of tomato concentrate, which will bring in EGP 29m in revenue during the winter harvest,
which occurs in Upper Egypt. Sourcing tomatoes from the Delta during the summer may be too costly.
1,200 tons of mango concentrate, which will bring in an additional EGP 42m in revenue during the
summer harvest, also sourced locally.
This brings Year 1 revenues to a total of EGP 71m. This study projects to Year 10 on the above growth and
inflation rates. The following graph shows a comparison of the target market and expected revenues in the first
five years.
Figure 3 Comparison between Target Market Size and Year 1-5 Revenues for Concentrate
EGP
12
24
m
EGP
55
8m
EGP
72
m
EGP
18
0m
C U R R E N T V A L U E ( 2 0 1 6 ) T A R G E T I M P R O V E M E N T ( P O S T - 2 0 1 7 )
Y E A R 1 ( 2 0 1 8 ) R E V E N U E S
Y E A R 5 ( 2 0 2 3 ) R E V E N U E S

Medium and Large Scale Investment Opportunities in Luxor
18
2.2.5 Estimated Marketing Costs
Marketing the product on the global stage will require a considerable budget and it is assumed that the
marketing budget will account for around 7.5% of sales targets stated above. These sales targets after all are
highly contingent on aggressive marketing before operations. This brings the total marketing budget for Year 1
to over EGP 5m.
2.3 Direct Inputs Required
This section describes the main raw materials required for the process, including other inputs such as additives,
etc., as well as the expected costs, their availability (including seasonality when referring to crops) and any risks
expected in securing each input and how to mitigate it. It also shows the utilities required, specific consumption
benchmarks used, as well as direct labor requirements and any other direct inputs.
2.3.1 Crops Required
The two main crops required for this process are tomatoes and mangoes. Tomatoes are the focus given their
abundance in both Luxor and neighboring Qena as well as the significant market demand for tomato-based
products. Qena figures were added as they present a valid local source of the required crops. While total feddans
cultivated add up to around 16 thousand feddans for 2014-2015, this number could be as high as 20 thousand
currently, according to local sources.
While tomato is cultivated all year round across Egypt, it is mainly a winter crop in Upper Egypt, and therefore
unavailable in the summer months starting June, only to become available for harvest again in November.
The process required to produce concentrate from tomato can be used to produce concentrates from other
fruits and vegetables. To fill the seasonal gap, mango was selected based on its local availability and increasing
demand, as well as the fact that it is a summer crop, available from June till August2.
The following table provides the figures for feddans cultivated and tons produced are according to figures
provided by the CAPMAS Annual Bulletin for Statistical Crop Area and Plant Production for the years 2014-2015.
Table 5 Production Schedule according to Seasonality of Tomato and Mango in Luxor and Qena
Crop Name Luxor Qena Seasonality / Production Schedule
feddans Tons feddans tons Jan
Feb
Mar
Ap
r
Ma y Jun
Jul
Au
g
Sep
Oct
No
v
Dec
Tomatoes 9,619 184,133 6,718 134,487 x x x x
Mangoes 1,911 6,181 708 2,147 x x x
The market prices for the crops are presented in the following table based on 2016-2017 levels. These prices are based on direct buying from farmers. When buying from traders, around 8% is added as a margin, plus EGP 0.25 per kg for transportation.
Table 6 Prices of Tomato and Mango for 2016-2017
Crop Price
Tomato EGP 1-8 per kg
Mango EGP 6-9 per kg
This study assumes tomatoes are sourced locally only at an average price of EGP 2 per kg, although that can go down to as low as EGP 0.70 per kg when sourcing for factories. Sourcing from the Delta during the summer can
2 Interviews with local stakeholders indicated that current agricultural production levels have climbed higher than official figures provided by CAPMAS for years 2014-15 as shown in Table 5.

Medium and Large Scale Investment Opportunities in Luxor
19
push prices up to EGP 8, which makes tomato concentrate production unfeasible. The mangoes are assumed to be sourced locally at EGP 9 per kg.
2.3.2 Utilities
Assuming today’s tariffs for electricity, natural gas and water, the following specific consumption rates were
calculated for the two main products, tomato and mango concentrate. The rates change due to different water
requirements, thermal energy for heating and technical modifications for handling of feedstock3.
Table 7 Specific Consumption and Utility Bill for Tomato and Fruit Concentrate for Year 1
Specific Consumption Expected Bill
Utilities – Tomato
Electricity 150 kWh/ton 115.05 EGP/ton
Gas 2,300 kWh/ton 713.00 EGP/ton
Water 230 m3/ton 713.46 EGP/ton
Wastewater 90 m3/ton 240.30 EGP/ton
Utilities – Mango
Electricity 1,200 kWh/ton 920.40 EGP/ton
Gas 1,900 kWh/ton 589.00 EGP/ton
Water 20 m3/ton 62.04 EGP/ton
Wastewater 20 m3/ton 53.40 EGP/ton
The above tariffs are for the fiscal year 2017/2018 and are assumed to be tied to inflation projections over the
consequent years, as shown in Annex I.
2.3.3 Direct Labor
Seasonal labor will be required for each harvest to handle the fresh tomatoes and mangoes coming during
production months. The following table shows how many workers will be required for each season of
production.
Table 8 Seasonal Labor Required for Tomato and Mango Concentrate
Production – Seasonal No. of Workers EGP per ton handled
Workers – Tomato Season 10 50
Workers – Mango Season 10 50
2.3.4 Packaging
The aseptic bags required for storage are not available locally according to the data gathered and must be
imported in bulk. They are widely available as industry standard packaging. These usually carry around 200kg of
product each and stored in steel drums for transportation. The expected cost of one aseptic bag ranges between
USD 2-3 and are ordered in bulks of 7,000-8,000 bags.
2.3.5 Other Inputs
Tomato and other concentrates require the addition of preservatives when packaged such as ascetic or citric
acid. This is normally around 4-5g per ton of product, which is negligible from a cost perspective.
3 The specific consumption rates were obtained from the European Commission’s (EC) Best Available Techniques Reference Documents (BREFs) as well as the SCOoPE project, also funded by the EC, as well as from industry experts and practitioners.

Medium and Large Scale Investment Opportunities in Luxor
20
2.4 Project Engineering
This section describes the production process in detail, any specific technologies used, the estimated plant
capacity, as well as the main components required along with an estimate for civil engineering works (factory
infrastructure, etc.) and the total area required.
2.4.1 Description of Technology
The process selected to produce concentrate from tomatoes and other fruits and vegetables is the industry
standard used around the world, using technology that is widely available, mature and available from local
manufacturers. Stainless steel structures are fabricated locally and assembled with components such as gauges,
motors, etc.
2.4.2 Estimated Plant Capacity
The plant capacity is expected to handle up to 200 tons of tomato per day and 80 tons of mango (or similar fruit)
per day. Each feedstock has its own conversion ratio, which is presented in the following table.
Table 9 Conversion Ratio for Tomato and Mango Concentrate
Crop Input (tons/day) Conversion Ratio Max. Output (tons) Yield
Tomato 200 7:1 29 15%
Mango 80 5:2 32 40%
It is assumed that production will take place in the same months as the harvest and only then. Production can
take place in the gap months but will require investment in storage facilities to keep the raw material fresh for
months. This will increase initial investment required so it was not taken into account in this study. However, it
is safe to assume that these assets can be funded through the company’s operating cash flow in future years,
increasing productivity beyond this study’s projections.
2.4.3 Process Flow
The process is illustrated in the following figure.
Figure 4 Process Flow Diagram of Concentrate Production

Medium and Large Scale Investment Opportunities in Luxor
21
The process steps illustrated in Figure 4 are described in detail in the following table.
Table 10 Step-by-Step Details of Concentrate Production Process
# Name Description
Step 1 Receiving raw
material
Tomatoes arrive at the plant in trucks, which are directed to the offloading area.
Step 2 Washing Tomatoes are washed under water streams to eliminate any dirt. Water is
continuously pumped into the collection channel. This water carries the tomatoes,
rinses them, and conveys them to the sorting station.
Step 3 Sorting At the sorting station, staff remove material other than tomatoes, as well as the
green, damaged and discolored tomatoes. These are placed on a reject conveyor
and then collected in a storage unit to be taken away. In some facilities, the sorting
process is automated.
Step 4 Chopping / De-
Stoning
The tomatoes suitable for processing are pumped to the chopping station where
they are chopped.
Mangoes are put through a de-stoning machine to separate stones from fruit.
Step 5 Breaking
(Tomatoes Only)
There are two types of tomato paste: Hot Break and Cold Break. They are used to
make different end products. To make Hot Break paste, the fresh tomatoes heated
after chopping to a very high temperature (ranging from 85 to 100°C). Cold Break
paste requires the fresh, chopped tomatoes to be heated at a lower temperature
(ranging from 65 to 75°C). Hot Break paste is usually used for ketchup and different
types of tomato sauce requiring a 28-30° Brix, while Cold Break paste is mainly used
for triple concentrate paste at 36-38° Brix.
Step 6 Centrifuging The pulp (consisting of fiber, juice, skin and seeds) is then pumped through
centrifuging system to remove the seeds and skin. Typically, 95% of the pulp is the
juice that ends up in the final product. The remaining 5%, comprised of fiber, skin
and seeds, considered waste and is transported out of the facility to be sold as cattle
feed.
Step 7 Holding tank At this point the refined juice is collected in a large holding tank, which constantly
feeds the evaporator.
Step 8 Evaporation Evaporation is the most energy-intensive step of the whole process – this is where
the water is extracted, and the juice that is still only 5% solid reaches a Brix value of
36% tomato concentrate. The evaporator automatically regulates juice intake and
finished concentrate output; the operator only must set the Brix value on the
evaporator’s control panel to determine the level of concentration. As the juice
inside the evaporator passes through different stages, its concentration gradually
increases until the required density is obtained in the final “finisher” stage. The
entire concentration/evaporation process takes place under vacuum conditions, at
temperatures significantly below 100°C.
Step 9 Sterilizing Sterilization and pasteurization occurs before it is packed; the paste is pumped to a
deposit tank and from there to a heat exchanger where pasteurization takes place at
110°C for 2 min or at 96°C for 3 min. After the thermal treatment, the product is
cooled at 30°C to conserve its color, aroma, and taste qualities.
Step 10 Packaging Most facilities package the finished product using aseptic bags, so that the product
in the evaporator never comes into contact with air until it reaches the customer.
Once packaged, the concentrate can be kept up to 24 months. Some facilities choose
to package their finished product under non-aseptic conditions. This paste must go
through an additional step after packaging, it is heated to pasteurize the paste, and
then kept under observation for 14 days before being released to the customer.
Alternative Feedstock: As mentioned before, this process can be easily adjusted to account for other fruits and
vegetables, as well as changing the specifications for the tomato concentrate itself. As mangoes have been
selected as the most suitable complimentary feedstock to keep this production line in operation for most of the

Medium and Large Scale Investment Opportunities in Luxor
22
year, it will require minimal adjustments to how the raw material is received and changing the evaporator
settings to achieve the required Brix value of the mango concentrate, as demanded by the market. For example,
mango will require a de-stoner to remove the stones at the chopping/crushing stage. The production line needs
to be properly cleaned and washed before switching raw materials.
2.4.4 Main Components and Equipment
The following is a list of the main components of the production line:
Lift/Elevator
De-stoner (for fruits such as mango)
Washer
Crusher
Pre-Heating Machine
Pulping/Refining Machine
Holding Tank
Juice Extractor
Vacuum Concentrator
Tube-in-tube sterilizer
Bulk Aseptic Filler
This production line can be manufactured locally from start to finish. Separate prices for the components were
unavailable, but the local manufacturer provided the following lump-sum quotations:
Table 11 Lump-sum Price Estimate for Concentrate Production Line
Maximum Capacity Total Lump-Sum Price in EGP
Handles 200 ton of tomato per day EGP 10m
Handles 300 ton of tomato per day EGP 13m
The estimated useful life of this production line, assuming proper maintenance and care, can go up to 30 years.
Important Note: This study explores the first option as it assumes initial actual operating capacity at only 50%,
which does not justify a higher initial nominal capacity for the production line and the additional capital
expenditure associated with it.
2.4.5 Civil Engineering Works
In addition to the production line, there are key components of the factory’s infrastructure that need to be
considered, such as:
Boiler for steam generation
Electrical Generator
Piping etc.
Total infrastructure costs are estimated to be around EGP 3 million for a factory of this size.
2.4.6 Area Required
The area required for this production line is estimated to be around 1,000 m2. The land is assumed to cost around
EGP 3,000 per m2, which amounts to EGP 3m for land acquisition. Building structure and office space is estimated
to cost an additional EGP 700,000.

Medium and Large Scale Investment Opportunities in Luxor
23
Important Note: Land is expected to be given for free in the Boghdadi industrial zone (IDA jurisdiction) by Luxor
governorate. However, it is sold against a fee in New Tiba (NUCA jurisdiction). To be conservative, land was
assumed to be bought against a fee.
2.5 Selling, General and Administrative Expenses (SG&A)
This section provides details on the selling, general and administrative expenses associated with the facility,
otherwise known as overhead costs.
2.5.1 Salaries and Wages
This opportunity is expected to employ around 25 permanent staff plus an additional 20 seasonal workers (10
for each of the two harvest seasons). They are summarized below:
Table 12 List of Staff and Monthly Salaries for Concentrate Production Line
Position Staff Monthly
Management
CEO 1 15.000
…
Production - Permanent
Plant Manager 1 10.000
Quality Control 2 6.000
Hall Supervisors 2 6.000
Engineering 1 5.000
Workers 4 3.000
…
Sales, General and Administration
Procurement 2 5.000
Sales Manager 1 8.000
Sales 2 5.000
Marketing 2 5.000
Finance & Accounting 2 5.000
HR Manager 1 10.000
Maintenance 4 3.000
Security 2 2.000
…
Total 27 staff
Salaries for permanent staff amount to EGP 86,000 per month in Year 1, which is EGP 1.6m total for the year.
That is only 2% of total revenue for Year 1.
Wages for seasonal workers amount to EGP 500,000 for the tomato harvest and EGP 150,000 for the mango
harvest. This assumes 10 workers per harvest season, getting paid EGP 50 per ton of feedstock handled.
2.5.2 Factory
Factory overheads that fall outside human resource expenses and production costs are expected to be at a
minimum. Maintenance and storage costs are estimated to be around EGP 10,000 and EGP 2,000 per month
respectively.

Medium and Large Scale Investment Opportunities in Luxor
24
2.5.3 Other Selling, General and Administrative
The main line item in this category is the marketing budget, which is determined as 7.5% of expected sales. This
amounts to EGP 5.3m for Year 1.
Utilities associated with administrative office space are expected to be around EGP 4,000 per month.
2.6 Organizational Structure
2.6.1 Organizational Chart
2.7 Financial Analysis and Investment
This section provides details of revenues, cost of goods sold (variable costs), margin analysis by product, selling,
general and administrative (SG&A) expenses (aka overheads), fixed assets (initial capital expenditures) for the
first year. The total initial investment is provided, and a 10-year projection of the income statements and
statements of cash flow are calculated. Finally, the results of the feasibility and sensitivity analyses are provided
as a summary of the key findings of the financial model.
2.7.1 Revenues
The estimated revenues for Year 1 are summarized below:
Product Months of
Production
Total Tons
Produced
Selling Price
(EGP/ton)
Revenue
(EGP 000s)
Tomato Concentrate Dec – Mar 1,429 tons 20,000 28,571
Mango Concentrate Jun - Aug 1,200 tons 35,000 42,000
Total EGP 70,571
2.7.2 Cost of Goods Sold
The estimated total COGS for Year 1 are summarized below:
CEO
Factory Plant Manager
Quality Control
Hall Supervisors
Engineering
Workers (Permanent)
Workers (Seasonal)
Administration
Procurement Manager
Sales Manager Sales Officers
Marketing Manager
Financial Manager
HR Manager Maintenance

Medium and Large Scale Investment Opportunities in Luxor
25
Inputs Quantity Units
Fresh Tomatoes
Tons bought 10,000 tons
Cost per ton 2,000 EGP/ton
Cost per month 20,000 EGP 000s
Fresh Mangoes
Tons bought 3,000 tons
Cost per ton 9,000 EGP/ton
Cost per month 27,000 EGP 000s
Seasonal Labor
Workers – Tomatoes 500 EGP 000s
Workers – Mangoes 150 EGP 000s
Packaging - Aseptic Bags
Number of bags used 11,948 bags
Cost per year 478 EGP 000s
Utilities
Electricity 1,269 EGP 000s
Gas 1,725 EGP 000s
Water 1,094 EGP 000s
Wastewater 407 EGP 000s
Total Utilities 4,495 EGP 000s
Total COGS 52,623 EGP 000s
2.7.3 Gross Margin Analysis by Product
Looking at each product’s line items separately, gross margin can be calculated to show how profitable each
product is and how much it contributes in covering overheads, ultimately increasing bottom line figures.
Tomato Concentrate Mango Concentrate
EGP 000s EGP 000s
Revenues 28,571 50,400
Raw Material 20,000 27,000
Seasonal Labor 500 150
Packaging 260 218
Electricity 164 1,104
Gas 1,019 707
Water 1,019 74
Wastewater 343 64
Total COGS 23,305 29,318
Gross Margin 18.4% 30.2%
(-) Overheads 10.2% 10.2%
Operating Margin 8.3% 20.0%
2.7.4 Selling, General and Administrative Expenses
SG&A for Year 1 is summarized below:

Medium and Large Scale Investment Opportunities in Luxor
26
Human Resources EGP 000s
Total Permanent Staff Salaries 1,680
Overheads
Factory
Maintenance 120
Storage 24
General & Administrative -
Marketing (7.5% of Sales) 5,293
Utilities 48
Total Overheads 5,485
Total SG&A 7,165
2.7.5 Fixed Assets
The following table summarized the fixed assets (aka Property, Plant and Equipment) required for operation of
the facility, along with the associated yearly depreciation expense.
Fixed Assets Cost Dep. Life Yearly Dep. Exp.
EGP 000s EGP 000s
Production Line 10,000 10 yrs. 1,000
Infrastructure 3,000 15 yrs. 200
Building 500 30 yrs. 17
Office 200 10 yrs. 20
Land 3,000 0 yrs. N/A
Total CAPEX 16,700 1,237
2.7.6 Minimum Investment Required
The minimum investment required will be the total fixed asset purchases required for operation plus 3-months’
worth of working capital.
EGP 000s
Initial Capital Expenditures on Fixed Assets 16,700
Working Capital for 3 months 14,947
Total Investment Required 31,647
Important Note: A general assumption was made in all studies that at least 3 months of working capital be
covered in the initial investment. This clearly pushes up the initial ask in this particular case and can be reviewed
at the feasibility study stage.

Medium and Large Scale Investment Opportunities in Luxor
27
2.7.7 Projected Income Statements
The following is the projected income statements for the first 10 years of operation:
Table 13 Projected Income Statements for Concentrate Production Line (EGP thousands)

Medium and Large Scale Investment Opportunities in Luxor
28
2.7.8 Projected Cash Flow Statements
The following is the projected cash flow statements for the first 10 years of operation:
Table 14 Projected Cash Flow Statement for Concentrate Production Line (EGP thousands)

Medium and Large Scale Investment Opportunities in Luxor
29
2.7.9 Feasibility Analysis
The following table summarizes the key findings from the feasibility analysis:
Key Metric (based on 10-yr projections) Result (EGP 000s)
Capital Expenditures Required EGP 16,700
Working Capital Required for first 3 months EGP 14,947
Minimum Investment Required EGP 31,647
Direct Investment (Equity) EGP 9,494
Debt Financing EGP 22,153
Enterprise Value EGP 66,730
Internal Rate of Return 30%
Simple Payback 5.9 years
Discounted Payback 8.3 years
Profitability Index 2.11
2.7.10 Sensitivity Analysis
The feasibility of this opportunity is most sensitive to fluctuations in crop prices, which are compounded by the
low yields, especially in the case of tomatoes. A calculation was made to see how far up prices can go before
gross margins reach 0%, while holding selling prices at current global prices for tomato and fruit concentrates.
The results were as follows:
Tomatoes can only go up as high as EGP 2.53 per kg. This study assumes an average price of EGP 2.00
per kg. A change of EGP 0.50 can change the gross margin on tomato concentrate by 15%.
Mango prices have more room to move and go up as high as EGP 13.23 before erasing gross margins.
This model assumes mangoes will sourced at EGP 9.00 per kg.
The idea of adding a second feedstock such as mango to this production line is essential not just for seasonality
issues, but for the better margins and less risk of price fluctuations. The yield from mangoes is better than
tomatoes and this affects how sensitive the margins are to changes in the feed prices.
In addition, selling prices of mango concentrate are higher, which improves margins further. While the
seasonality gaps in tomato supplies can be remedied by sourcing feedstock from the Delta during off-season,
the cost per kg can be as high as EGP 8.00 per kg, which would render this business model unfeasible.
2.8 Impact
Economic - Value added to local crops such as tomato and mango is quite significant. Based on this study’s
assumptions, before deducting other COGS and overheads:
7 kg of tomatoes cost EGP 14, to produce 1 kg of concentrate selling at EGP 20 – that is 30% value added
to the crop.
2.5 kg of mangoes cost EGP 22.5, to produce 1 kg of concentrate selling at EGP 35 – that is 36% value
added to the crop.
Social - Direct jobs created by this facility will include 27 permanent plant staff plus another 20-30 seasonal
workers. Indirect jobs created will be mainly in logistics, marketing and distribution, and increased dedicated
farming to supply the plant over time.

Medium and Large Scale Investment Opportunities in Luxor
30
Environmental – This opportunity helps decrease losses of fresh produce, specifically tomatoes, during
transportation over long distances to processing in other regions, as well as poor post-harvest handling. This is
currently estimated to be around 25-30% and can exceed 60% in the case of tomatoes.

Medium and Large Scale Investment Opportunities in Luxor
31
3 IO2 - Black Honey and Date Syrup Production Facility
3.1 Overview
This opportunity aims to add value to local crops by producing syrups suitable for both export and local
consumption as alternative sweeteners. The crops in focus are sugarcane and dates mainly, because of their
local abundance and seasonality.
Initially the focus was on sugarcane, which was highlighted as a crop that is widely cultivated locally. It is mainly
used for sugar processing in several factories in the region, such as Armant and Qus. It is also used to produce
black honey but through rudimentary techniques that affect quality and capacity. This opportunity aims to
upgrade both the quality and quantity of black honey being produced in Luxor.
Dates were later selected as a suitable secondary crop to better utilize the facility. This way the facility operates
on locally sourced crops only; sugarcane during the winter and dates during the summer, using the same
technology for both.
3.2 Market Demand
This section provides a description of the products and targeted markets, including a brief analysis on the current
market structure, the potential for import substitution and export where applicable.
3.2.1 Product Description
This investment opportunity primarily focuses on producing two products:
Product A: black honey extracted from fresh sugarcane for retail consumption,
both local and export.
Black honey is a black and highly viscous syrup with a high nutritional value,
produced from sugarcane with a sugar concentration of at least 70%. It can
also be produced from molasses, which is a byproduct of the sugar refining
process. It contains vitamins, protein and beneficial salts such as calcium, iron,
phosphors, etc. Black honey is a good source of energy as it contains
carbohydrates and sugars, while low in both fat content and fiber.
It is a nourishing sweetener which contains a considerable amount of nutrients
that are essential for the functioning of the body, unlike refined white sugar,
which only contains simple carbohydrates and other components like
aspartame, which is not very healthful for the body.
One of the reasons for the popularity of "black honey" is the many health benefits that eating it provides. It is
said to be a digestive, an antidote for anxiety, an energy booster, and studies have proven that it is an anti-
oxidant and good source of iron. It is beneficial in anemia and acidity to the high iron content. It is rich in
vitamins, especially folic acid and vitamin B1; contains manganese which helps release energy; calms nerves and
relieves throat infections and improves circulatory performance; eases coughing and disinfects lungs; used as a
source of sugar for the food industry.
Product B: date syrup extracted from palm dates, also for retail consumption, both local and export.
Like black honey, date syrup (also known as date honey or silan, or dibs balah in Arabic) is a thick brown, very
sweet fruit syrup extracted from palm dates and is widely used in Middle Eastern and North African cooking. It
For illustrative purposes only.

Medium and Large Scale Investment Opportunities in Luxor
32
is rich in the monosaccharides glucose and fructose, and so most of its sugar content is absorbed into the
bloodstream in the mouth, meaning that it raises the blood glucose levels more efficiently and immediately than
other syrups. It also contains minerals such as potassium and calcium, that are abundant in whole dates. It is
therefore highly suitable for people suffering from hypoglycemia, or for those with sucrose intolerance or those
with pancreatic problems who have difficulty absorbing disaccharides.
The final products will be packaged in standard 450g ‘white label’ jars (i.e. to be marketed by different
distribution companies, either locally or internationally).
3.2.2 Current Market Structure
According to Trade Map (International Trade Centre 2017), Egypt ranked 7th in world exports of cane molasses
(the category which includes black honey for human consumption) in 2016, which represents a 4.6% market
share. The global market is dominated by USA, China, Netherlands, Canada and Germany. The world market for
exports in this category was worth USD 500m in 2016. Egypt exports seem to have plateaued the last three
years, despite a decent jump in 2013, while imports have remained relatively steady as shown in the following
figure.
Figure 5 Egypt Export vs Import in USD for years 2012-2016 for Cane Molasses
Egypt’s biggest importers in 2016 are shown in Table 15. Despite ranking high in the respective country’s
imports, the market shares are considered quite low for markets such as Italy and Spain. This leaves significant
room for improvement in market share for the main markets currently targeted.
Table 15 Egypt’s Top Importers of Cane Molasses in 2016
Value
exported
in 2016
(USD
thousand)
Share in
Egypt's
exports
(%)
Quantity
exported
in 2016
Share in
Country's
Imports
(%)
Rank in
Country's
Exports
Average
Price per
ton (USD
thousand)
1 Italy 8,147 35.8 46,718 8.1 2nd 0.17
2 Turkey 3,840 16.9 22,021 38.9 1st 0.17
3 Portugal 3,371 14.8 19,332 51.2 1st 0.17
4 Spain 3,281 14.4 18,816 1.6 6th 0.17
5 Tunisia 846 3.7 4,849 100.0 1st 0.17
The low import values also indicate that current local production can satisfy most of the demand from a local
market perspective. The local market size is difficult to determine because of limited data on local consumption
patterns for this product.
24
,61
0 30
,78
6
23
,49
1
21
,77
0
22
,75
6
24
,68
3
12
4 63
- 27
0
70
2 0 1 2 2 0 1 3 2 0 1 4 2 0 1 5 2 0 1 6 5 - Y R A V G
Export Import

Medium and Large Scale Investment Opportunities in Luxor
33
As for date syrup, the specific data available is limited. Looking at the general category for other sugars – which
includes chemically pure lactose, maltose, glucose and fructose, in solid form; sugar syrups not containing added
flavoring or coloring matter; artificial honey, whether mixed with natural honey; caramel – Egypt ranked 45th
globally. This accounts for only 0.11% of the global market, which is around USD 5.4 billion, as of 2016. It can be
assumed that there is both export growth and import substitution potential when it comes to this category of
products. The following figure shows import and export trends for the last 5 years.
Figure 6 Egypt Export vs Import in USD for years 2012-2016 for Other Sugars
Egypt’s biggest importers in this category for 2016 are shown in Table 16. While it controls a decent market
share in Syria, there is significant improvement to be made in the rest of the countries shown in the table.
Table 16 Egypt’s Top Importers of Other Sugars in 2016
Value
exported
in 2016
(USD
thousand)
Share in
Egypt's
exports
(%)
Quantity
exported
in 2016
Share in
Country's
Imports
(%)
Rank in
Country's
Exports
Average
Price per
ton (USD
thousand)
1 Syria 3,031 49.3 7,910 34.0 1st 0.38
2 Algeria 1,021 16.6 2,638 5.7 6th 0.39
3 Tunisia 630 10.3 N/A 10.3 5th N/A
4 Saudi Arabia 504 8.2 N/A 1.4 13th N/A
5 Sudan 235 3.8 547 2.5 4th 0.43
Other Sugars is a large category and it is difficult to estimate what the actual values that are specific to date
syrup are. The data does suggest that the potential for this product is more from an import substitution
perspective, than export.
3.2.3 Target Market Size
The trailing 5-year average for values exported and imported in the two categories are as follows:
Table 17 Target Market Size for Syrups
5-yr trailing average 2012-2016 (USD
thousand)
Cane Molasses Fructose Syrup Totals Target % Target Value
Export 24,683 6,678 31,360 20% 6,272
6,4
69
6,1
55
6,4
56
8,1
63
6,1
46
6,6
78
29
,07
1
27
,87
0
41
,29
8
31
,80
4
18
,65
3
29
,73
9
2 0 1 2 2 0 1 3 2 0 1 4 2 0 1 5 2 0 1 6 5 - Y R A V G
Export Import

Medium and Large Scale Investment Opportunities in Luxor
34
Import 70 29,739 29,809 10% 2,981
USD 24,752 USD 36,417 USD 9,253
The target market size was estimated using the assumption that there is more room for growth from an export
market perspective for the black honey and more room from an import perspective for the date syrup. However,
since the data provided by Trade Map where for wider categories, the assumption was a conservative 10%
improvement on current export levels and only 5% for imports. This brings the total estimated target market
size to USD 9.25m (EGP 167m).
Expected Selling Prices: The markets to target are export mainly to take advantage of the lucrative pricing post-
EGP flotation, followed by local retail. A ton of black honey or date honey (packaged in white label jars for retail)
is expected to sell somewhere in the range of USD 1,000 – 1,350 per ton (EGP 18,000 – 22,000). Local prices for
these products are expected to be within the same ranges however on the lower side.
Anticipated Competition: There is around 70 producers using traditional methods in Qena and Menia. According
to data gathered from interviews on the ground in Luxor, they reportedly sell white label products to local
markets as they cannot get product quality up for export standards. There are a handful of factories around the
country that produce export quality product but export little compared to global demand.
3.2.4 Estimated Annual Sales and Forecasts
The plant, described in more detail under Project Engineering, is assumed to start operating at 50% capacity in
Year 1 and reach around 91% by Year 10 as part of the conservative assumptions typical resorted to in the
present document. Revenue growth forecasts to account for in price inflation and better capacity utilization in
subsequent years are assumed, with an aggressive marketing push in the first 5 years, as shown in Annex I.
This translates to estimated production and annual sales for Year 1 as follows:
300 tons of black honey, which will bring in EGP 7.5m in revenue during the winter harvest.
1,200 tons of date syrup, which bring in EGP 30m in revenue during the summer harvest.
This brings Year 1 revenues to a total of EGP 40m. The following graph shows a comparison of the target market
and expected revenues in the first five years.
Figure 7 Comparison between Target Market Size and Year 1-5 Revenues for Syrup Production Line
EGP
10
98
m
EGP
32
4m
EGP
38
m
EGP
94
m
C U R R E N T V A L U E ( 2 0 1 6 ) T A R G E T I M P R O V E M E N T ( P O S T - 2 0 1 7 )
Y E A R 1 ( 2 0 1 8 ) R E V E N U E S
Y E A R 5 ( 2 0 2 3 ) R E V E N U E S

Medium and Large Scale Investment Opportunities in Luxor
35
3.2.5 Estimated Marketing Costs
Marketing the product on the global stage will require a considerable budget and it is assumed that the
marketing budget will account for around 7.5% of sales targets stated above. These sales targets after all are
highly contingent on aggressive marketing before operations. This brings the total marketing budget for Year 1
to EGP 2.8m.
3.3 Direct Inputs Required
This section describes the main raw materials required for the process, including other inputs such as additives,
etc., as well as the expected costs, their availability (including seasonality when referring to crops) and any risks
expected in securing each input and how to mitigate it. It also shows the utilities required, specific consumption
benchmarks used, as well as direct labor requirements and any other direct inputs.
3.3.1 Crops Required
The two main crops required for this process are sugarcane and dates. Qena figures were added as they present
a valid local source of the required crops.
Sugarcane is a winter crop and is harvested during the months starting January until April and is only cultivated
in Upper Egypt. It is not available to source all year round. Dates provide a suitable alternative feedstock to
utilize during the summer harvest, which is usually harvested between July and September.
The following table provides the figures for feddans cultivated and tons produced are according to figures
provided by the CAPMAS Annual Bulletin for Statistical Crop Area and Plant Production for the years 2014-2015.
Table 18 Production Schedule according to Seasonality of Sugarcane and Dates in Luxor and Qena
Crop Name Luxor Qena Seasonality / Production Schedule
feddans Tons feddans tons Jan
Feb
Mar
Ap
r
May
Jun
Jul
Au
g
Sep
Oct
No
v
Dec
Sugarcane 67,422 3,257,224 118,089 5,690,000 x x x x
Dates 552 11,040 1,039 20,780 x x x
The market prices for the crops are presented in the following table based on 2016-2017 levels. These prices are based on direct buying from farmers. When buying from traders, around 8% is added as a margin, plus EGP 0.25 per kg for transportation.
Table 19 Prices of Sugarcane and Dates for 2016-2017
Crop Price
Sugarcane EGP 0.70-1.0 per kg
Dates EGP 5-6 per kg
This study assumes sugarcane is sourced locally at an average price of EGP 1 per kg, although that can go down to as low as EGP 0.62 per kg. Dates are assumed to be sourced locally at EGP 6 per kg.

Medium and Large Scale Investment Opportunities in Luxor
36
3.3.2 Utilities
Assuming today’s tariffs for electricity, natural gas and water, the following specific consumption rates were
calculated for the two main products, black honey and date syrup. The rates for both were assumed to be the
same4.
Table 20 Specific Consumption for each product and Expected EGP per ton for Year 1
Specific Consumption Expected Bill
Utilities – Black Honey & Date Syrup
Electricity 1,200 kWh/ton 920.40 EGP/ton
Gas 1,900 kWh/ton 589.00 EGP/ton
Water 20 m3/ton 62.04 EGP/ton
Wastewater 20 m3/ton 53.40 EGP/ton
The above tariffs are for the fiscal year 2017/2018 and are assumed to be tied to inflation projections over the
consequent years, as shown in Annex I.
3.3.3 Direct Labor
Seasonal labor will be required for each harvest to handle the fresh tomatoes and mangoes coming during
production months. The following table shows how many workers will be required for each season of
production.
Table 21 Seasonal Labor Required for Black Honey and Date Syrup
Production – Seasonal No. of Workers EGP per ton handled
Workers – Sugarcane Season 5 50
Workers – Date Season 5 50
3.3.4 Packaging
The final product will be packaged in white label jars. The standard size is 450g, which is equivalent to 1 lb.,
which is the size most used for this kind of product. The customer, which will be mainly marketing and
distribution companies, will simply package their jars in their branding, ready to be placed on supermarket
shelves. These jars can be sourced from local manufacturers. They are expected to cost EGP 2 per jar when
ordered in bulks of 5,000 or more.
3.4 Project Engineering
This section describes the production process in detail, any specific technologies used, the estimated plant
capacity, as well as the main components required along with an estimate for civil engineering works (factory
infrastructure, etc.) and the total area required.
3.4.1 Description of Technology
The process selected to produce syrups from sugarcane and dates is the industry standard used around the
world, using technology that is widely available, mature and available from local manufacturers. Stainless steel
structures are fabricated locally and assembled with components such as gauges, motors, etc.
4 The specific consumption rates were obtained from the European Commission’s (EC) Best Available Techniques Reference Documents (BREFs) as well as the SCOoPE project, also funded by the EC, as well as from industry experts and practitioners.

Medium and Large Scale Investment Opportunities in Luxor
37
3.4.2 Estimated Plant Capacity
The plant capacity is expected to handle up to 200 tons of tomato per day and 80 tons of mango (or similar fruit)
per day. Each feedstock has its own conversion ratio, which is presented in the following table.
Table 22 Conversion Ratio for Sugarcane and Date into Syrup
Crop Input (tons/day) Conversion Ratio Max. Output (tons) Yield
Sugarcane 48 8:1 6 13%
Dates 48 2:1 24 50%
It is assumed that production will take place in the same months as the harvest and only then. Production can
take place in the gap months but will require investment in storage facilities to keep the raw material fresh for
months. This will increase initial investment required so it was not taken into account in this study. However, it
is safe to assume that these assets can be funded through the company’s operating cash flow in future years,
increasing productivity beyond this study’s projections.
3.4.3 Process Flow
The process is illustrated in the following figure.
Figure 8 Process Flow Diagram of Syrup Production
The process steps illustrated in Figure 4 are described in detail in the following table.
Table 23 Step-by-Step Details of Syrup Production Process
# Name Description
Step 1 Receiving raw
material
Sugarcane/Dates arrive at the plant in trucks, which are directed to the offloading
area.
Step 2 Washing Sugarcane/Dates are washed under water streams to eliminate any dirt. Water is
continuously pumped through water channels and material is conveyed to
chopping/de-stoning station.
Step 3 Chopping / De-
Stoning
Sugarcane is chopped and readied to be fed into special squeezer.
Dates are fed into special de-stoning machine to remove pits.
Step 4 Squeezing /
Grinding
Sugarcane is fed into squeezer to be crushed to extract the juice. The crushing
process must break up the hard nodes of the cane and flatten the stems.
Sugarcane bagasse is the byproduct in this step, which can be sold to MDF
manufacturers as well as animal feed and compost producers.

Medium and Large Scale Investment Opportunities in Luxor
38
Dates with pits removed are grinded to extract juice. Pre-soaking helps moisten the
dates and extract more juice.
Step 5 Filtration The amount of non-sugars and other particulates in the juice will affect its purity,
resulting in discoloration and reduced sweetness. Therefore, filtration is essential
and if done with care can remove up to 60% of non-sugars from the juice. A filter
press, if available, will give the best results but can be expensive for small-scale
operations. However, reasonable levels of filtration can be achieved by allowing the
juice to stand for a few hours to allow particulates to precipitate out. The tanks
should be fitted with a fine mesh lid, through which the juice is poured to filter out
large particles of bagasse and other foreign bodies
Step 6 Holding tank At this point the refined juice is collected in a large holding tank, which constantly
feeds the evaporator.
Step 7 Boiling For syrup production, the juice is boiled until the required concentration is reached
and the strike is made at around 105ºC when most of the moisture has been boiled
off and just before crystallization occurs. If the juice is over-boiled, then crystals may
be present which may cause discoloration. If under-boiled, too much moisture will
remain in the syrup which may, with time, cause cloudiness and shorten its shelf
life.
Step 8 Cooling The syrup is then poured or ladled from the boiling pan into containers where it is
allowed to cool.
Step 9 Packaging Cooled syrup is then fed into jar packing machine. Jars carry around 450g of syrup,
equivalent to 1 lb., and then stored in a cool dry place. Shelf life for jars is around 48
months.
3.4.4 Main Components and Equipment
The following is a list of the main components of the production line:
Washer
De-pitter for dates
Crusher/Squeezer
Holding Tank
Pulping/Refining Machine
Juice Extractor
Tube-in-tube sterilizer
Cooling Stations
Jar Packaging Machine
This production line can be manufactured locally from start to finish. Separate prices for the components were
unavailable, but the local manufacturer provided the following lump-sum quotations:
Table 24 Lump-sum Price Estimate for Syrup Production Line
Maximum Capacity Total Lump-Sum Price in EGP
Handles 48 ton of feedstock per day EGP 8m
The estimated useful life of this production line, assuming proper maintenance and care, can go up to 30 years.
3.4.5 Civil Engineering Works
In addition to the production line, there are key components of the factory’s infrastructure that need to be
considered, such as:

Medium and Large Scale Investment Opportunities in Luxor
39
Boiler for steam generation
Electrical Generator
Piping etc.
Total infrastructure costs are estimated to be around EGP 2 million for a factory of this size.
3.4.6 Area Required
The area required for this production line is estimated to be around 1,000 m2. The land is assumed to cost around
EGP 3,000 per m2, which amounts to EGP 3m for land acquisition. Building structure and office space is estimated
to cost an additional EGP 700,000.
Important Note: Land is expected to be given for free in the Boghdadi industrial zone (IDA jurisdiction) by Luxor
governorate. However, it is sold against a fee in New Tiba (NUCA jurisdiction). To be conservative, land was
assumed to be bought against a fee.
3.5 Selling, General and Administrative Expenses (SG&A)
This section provides details on the selling, general and administrative expenses associated with the facility,
otherwise known as overhead costs.
3.5.1 Salaries and Wages
This opportunity is expected to employ around 25 permanent staff plus an additional 10 seasonal workers (5 for
each of the two harvest seasons). They are summarized below:
Table 25 List of Staff and Monthly Salaries for Concentrate Production Line
Position Staff Monthly
Management
CEO 1 15.000
…
Production - Permanent
Plant Manager 1 10.000
Quality Control 2 6.000
Hall Supervisors 2 6.000
Engineering 1 5.000
Workers 4 3.000
…
Sales, General and Administration
Procurement 2 5.000
Sales Manager 1 8.000
Sales 2 5.000
Marketing 2 5.000
Finance & Accounting 2 5.000
HR Manager 1 10.000
Maintenance 4 3.000
Security 2 2.000
…
Total 27 staff
Salaries for permanent staff amount to EGP 140,000 per month in Year 1, which is EGP 1.7m total for the year.
That is only 4% of total revenue for Year 1.

Medium and Large Scale Investment Opportunities in Luxor
40
Wages for seasonal workers amount to EGP 120,000 for each of the sugarcane and date harvests. This assumes
5 workers per harvest season, getting paid EGP 50 per ton of feedstock handled.
3.5.2 Factory
Factory overheads that fall outside human resource expenses and production costs are expected to be at a
minimum. Maintenance and storage costs are estimated to be around EGP 10,000 and EGP 2,000 per month
respectively.
3.5.3 Other Selling, General and Administrative
The main line item in this category is the marketing budget, which is determined as 7.5% of expected sales. This
amounts to EGP 2.8m for Year 1.
Utilities associated with administrative office space are expected to be around EGP 4,000 per month.
3.6 Organizational Structure
3.6.1 Organizational Chart
3.7 Financial Analysis and Investment
This section provides details of revenues, cost of goods sold (variable costs), margin analysis by product, selling,
general and administrative (SG&A) expenses (aka overheads), fixed assets (initial capital expenditures) for the
first year. The total initial investment is provided, and a 10-year projection of the income statements and
statements of cash flow are calculated. Finally, the results of the feasibility and sensitivity analyses are provided
as a summary of the key findings of the financial model.
3.7.1 Revenues
The estimated revenues for Year 1 are summarized below:
CEO
Factory Plant Manager
Quality Control
Hall Supervisors
Engineering
Workers (Permanent)
Workers (Seasonal)
Administration
Procurement Manager
Sales Manager Sales Officers
Marketing Manager
Financial Manager
HR Manager Maintenance

Medium and Large Scale Investment Opportunities in Luxor
41
Product Months of
Production
Total Tons
Produced
Selling Price
(EGP/ton)
Revenue
(EGP 000s)
Black Honey Jan - Apr 300 tons 25,000 7,500
Date Syrup Jul - Oct 1,200 tons 25,000 30,000
Total EGP 37,500
3.7.2 Cost of Goods Sold
The estimated total COGS for Year 1 are summarized below:
Inputs Quantity Units
Sugarcane
Tons bought 2,400 tons
Cost per ton 1,000 EGP/ton
Cost per month 2,400 EGP 000s
Dates
Tons bought 2,400 tons
Cost per ton 6,000 EGP/ton
Cost per month 14,400 EGP 000s
Seasonal Labor
Workers – Sugarcane 120 EGP 000s
Workers – Dates 120 EGP 000s
Packaging – 450g Jars
Number of jars used 3,333,333 jars
Cost per year 6,667 EGP 000s
Utilities
Electricity 1,381 EGP 000s
Gas 884 EGP 000s
Water 93 EGP 000s
Wastewater 80 EGP 000s
Total Utilities 2,437 EGP 000s
Total COGS 26,144 EGP 000s
3.7.3 Gross Margin Analysis by Product
Looking at each product’s line items separately, gross margin can be calculated to show how profitable each
product is and how much it contributes in covering overheads, ultimately increasing bottom line figures.
Black Honey Date Syrup
EGP 000s EGP 000s
Revenues 7,500 30,000
Raw Material 2,400 14,400
Seasonal Labor 120 120
Packaging 1,333 5,333
Electricity 276 1,104
Gas 177 707

Medium and Large Scale Investment Opportunities in Luxor
42
Water 19 74
Wastewater 16 64
Total COGS 4,341 21,803
Gross Margin 42.1% 27.3%
(-) Overheads 12.5% 12.5%
Operating Margin 29.6% 14.8%
3.7.4 Selling, General and Administrative Expenses
SG&A for Year 1 is summarized below:
Human Resources EGP 000s
Total Permanent Staff Salaries 1,680
Overheads
Factory
Maintenance 120
Storage 24
General & Administrative -
Marketing (7.5% of Sales) 2,813
Utilities 48
Total Overheads 3,005
Total SG&A 4,685
3.7.5 Fixed Assets
The following table summarized the fixed assets (aka Property, Plant and Equipment) required for operation of
the facility, along with the associated yearly depreciation expense.
Fixed Assets Cost Dep. Life Yearly Dep. Exp.
EGP 000s EGP 000s
Production Line 8,000 10 yrs. 800
Infrastructure 2,000 15 yrs. 133
Building 250 30 yrs. 8
Office 100 10 yrs. 10
Land 3,000 0 yrs. N/A
Total CAPEX 13,350 1,237
3.7.6 Minimum Investment Required
The minimum investment required will be the total fixed asset purchases required for operation plus 3-months’
worth of working capital.
EGP 000s
Initial Capital Expenditures on Fixed Assets 13,350
Working Capital for 3 months 7,707
Total Investment Required 21,057

Medium and Large Scale Investment Opportunities in Luxor
43
3.7.7 Projected Income Statements
The following is the projected income statements for the first 10 years of operation:
Table 26 Projected Income Statements for Syrup Production Line (EGP thousands)

Medium and Large Scale Investment Opportunities in Luxor
44
3.7.8 Projected Cash Flow Statements
The following is the projected cash flow statements for the first 10 years of operation:
Table 27 Projected Cash Flow Statement for Syrup Production Line (EGP thousands)

Medium and Large Scale Investment Opportunities in Luxor
45
3.7.9 Feasibility Analysis
The following table summarizes the key findings from the feasibility analysis:
Key Metric (based on 10-yr projections) Result (EGP 000s)
Capital Expenditures Required EGP 13,350
Working Capital Required for first 3 months EGP 7,707
Minimum Investment Required EGP 21,057
Direct Investment (Equity) EGP 6,317
Debt Financing EGP 14,740
Enterprise Value EGP 42,513
Internal Rate of Return 29%
Simple Payback 5.9 years
Discounted Payback 8.0 years
Profitability Index 2.02
3.7.10 Sensitivity Analysis
The feasibility of this opportunity is most sensitive to fluctuations in crop prices, which are compounded by the
low yields, especially in the case of sugarcane. However, the price of the sugarcane is low enough to allow room
for future price increases with minimal risk. While dates have less room to move up in price, the feasibility of
date syrup is less sensitive to price fluctuations due to higher yields.
A calculation was made to see how far up prices can go before gross margins reach 0%, while holding selling
prices at current global prices for black honey and date syrup. The results were as follows:
Sugarcane can go up as high as EGP 1.93 per kg. This study assumes an average price of EGP 1.00 per
kg. A change of EGP 0.50 can change the gross margin by 13%.
Date prices have slightly less room to move and can go up as high as EGP 7.85 before erasing gross
margins. This model assumes dates will sourced at EGP 6.00 per kg. A change of EGP 0.50 can change
the gross margin by only 4%.
The idea of adding a second feedstock such as dates to this production line is essential not just for seasonality
issues, but for the better margins and less risk of price fluctuations. The yield from dates is better than sugarcane
and this affects how sensitive the margins are to changes in the feed prices.
However, it’s important that despite the price sensitivity in sugarcane and the lower yields, the value added
(operating margin) is much higher than dates (29.6% vs. 14.8%), so there is clear tradeoff between low risk and
high returns.
3.8 Impact
Economic - Value added to local crops such as sugarcane and dates is quite significant. Based on this study’s
assumptions, before deducting other COGS and overheads:
8 kg of sugarcane cost EGP 8 to produce 1 kg of black honey selling at EGP 25 – that is 68% value added
to the crop.
2 kg of dates cost EGP 6, to produce 1 kg of syrup selling at EGP 25 – that is 52% value added to the
crop.

Medium and Large Scale Investment Opportunities in Luxor
46
Social - Direct jobs created by this facility will include 27 permanent plant staff plus another 10-15 seasonal
workers. Indirect jobs created will be mainly in logistics, marketing and distribution, and increased dedicated
farming to supply the plant over time.
Environmental – This opportunity will help decrease post-harvest losses as demand for second grade dates,
which are suitable for date syrup production, increases. Sugarcane bagasse will be generated in larger
concentrated quantities in an industrial facility, as opposed to traditional production methods, which can be
sold directly as raw material to paper, medium density fiberboard (MDF) manufacturers for extra revenue.

Medium and Large Scale Investment Opportunities in Luxor
47
4 IO3 - Fruit and Vegetable Drying Facility
4.1 Overview
This opportunity aims to add value to local crops by producing dehydrated fruits and vegetables suitable for
both export and local consumption as either snacks or cooking ingredients. Dehydrated foods have a longer
shelf-life and maintain nutritional value, and add significant economic value to crops, while solving issues such
as oversupply and the spoilage associated with it. The crops in focus are tomato, banana, grapes and mango
because of their local abundance and compatible seasonality.
Food dehydration is a vast field that involves diverse technologies, each with its own advantages and
disadvantages that vary according to the feedstock and final product specifications. Therefore, it was important
to select a technology that can accommodate as many different fruits and vegetables as possible throughout
the year. The selected technology uses a process called swell-drying, which can dehydrate most fruits and
vegetables, as well as medicinal and aromatic plants.
4.2 Market Demand
This section provides a description of the products and targeted markets, including a brief analysis on the current
market structure, the potential for import substitution and export where applicable.
4.2.1 Product Description
By removing moisture content in fruits and vegetables, the shelf-life is extended
dramatically while maintaining flavor and nutritional value. While there are simpler,
cheaper drying techniques, this opportunity looks at producing dried fruit and
vegetables on an industrial scale, using state of the art technology for niche and high-
end markets, including export.
This investment opportunity primarily focuses on producing three main products,
which are anchored on local supply:
Product A: Dried tomato slices, mainly for cooking, as a substitute for sun-dried
tomatoes.
Product B: Dried banana chips, mainly consumed as a healthy snack.
Product C: Dried mango chips, mainly consumed as a healthy snack.
The following table shows the target final moisture content of the three selected
crops:
Table 28 Initial and Final Moisture Content of Dried Products
Crop Initial MC Final MC
Tomato 92% 18%
Banana 74% 18%
Mango 87% 18%
All products are aimed at different segments such as hotels, confectionaries, restaurants, high-end supermarkets
– both local and export, and therefore will be sold and distributed through different channels. They will be
packaged in 50kg sealed bags for possible re-packaging later.
For illustrative purposes only.

Medium and Large Scale Investment Opportunities in Luxor
48
4.2.2 Current Market Structure
Important Note: the following statistics include quantities for fresh and dried products, as data available did not
differentiate between them. An assumption was made that the dried component does not exceed 5% of the
total traded, and this is reflected in the Target Market calculations.
According to Trade Map (International Trade Centre 2017), Egypt ranked 16th in world exports of fresh and dried
tomatoes in 2016, which represents a 0.8% market share. The global market is dominated by Mexico, Spain,
Netherlands, Canada and Morocco. The world market for exports in this category was worth USD 7.9b in 2016.
Egypt exports seem to have plateaued the last three years, despite a decent jump in 2013, while imports have
remained relatively steady as shown in Figure 5.
Figure 9 Egypt Export vs Import in USD for years 2012-2016 for Fresh and Dried Tomatoes
Egypt’s biggest importers in 2016 are shown in Table 29. Despite ranking high in the respective country’s
imports, the market shares are considered quite low for markets such as Turkey and UAE. This leaves significant
room for improvement in market share for the main markets currently targeted.
Table 29 Egypt’s Top Importers of Fresh and Dried Tomatoes in 2016
Value
exported
in 2016
(USD
thousand)
Share in
Egypt's
exports
(%)
Quantity
exported
in 2016
Share in
Country's
Imports
(%)
Rank in
Country's
Exports
Average
Price per
ton (USD
thousand)
1 Saudi Arabia 35,923 54.4 34,082 35.4 2nd 1.05
2 United Arab Emirates 9,912 15.0 9,404 7.9 5th 1.05
3 Turkey 5,701 8.6 5,409 8.6 2nd 1.05
4 Kuwait 4,038 6.1 3,831 17.4 2nd 1.05
5 Russia 2,976 4.5 2,824 1.1 9th 1.05
As for bananas, Egypt ranked 48th globally. This accounts for only 0.1% of the global export market, which is
around USD 10.9 billion, as of 2016. However, Egypt imports a significant amount of bananas and there could
be an important substitution potential for this product. The following figure shows import and export trends for
the last 5 years for bananas.
28
,73
5
60
,53
1
70
,93
6
72
,86
9
65
,99
9
59
,81
4
20
4
- - 9
- 43
2 0 1 2 2 0 1 3 2 0 1 4 2 0 1 5 2 0 1 6 5 - Y R A V G
Export Import

Medium and Large Scale Investment Opportunities in Luxor
49
Figure 10 Egypt Export vs Import in USD for years 2012-2016 for Fresh and Dried Bananas
Egypt’s biggest importers in this category for 2016 are shown in Table 30, which indicates Jordan as a top
importer. However the trade data for other countries seems to be missing or incomplete.
Table 30 Egypt’s Top Importers of Fresh and Dried Bananas in 2016
Value
exported
in 2016
(USD
thousand)
Share in
Egypt's
exports
(%)
Quantity
exported
in 2016
Share in
Country's
Imports
(%)
Rank in
Country's
Exports
Average
Price per
ton (USD
thousand)
1 Jordan 8,500 98.9 11,655 30.0 1st 0.73
2 Kuwait 55 Negligible 75 Negligible Negligible 0.73
3 Saudi Arabia 42 Negligible 58 Negligible Negligible 0.72
The above data suggests that despite abundance of bananas in Upper Egypt, there is trouble accessing export
markets, or even markets in the Delta. Dried bananas could therefore offer a way around logistical challenges,
due to increased shelf-life and easier transportation, and increase access to the local crop.
For mangoes, Egypt ranks 12th in the global export market, but only represents 2.3% of the USD 5.4b market, as
of 2016. The following figure shows import and export trends for the last 5 years for fresh and dried mangoes.
Figure 11 Egypt Export vs Import in USD for years 2012-2016 for Fresh and Dried Mangoes
Egypt’s biggest importers in this category for 2016 are shown in Table 31. Middle Eastern markets dominate the
table, and while market share is already quite high in Lebanon and Saudi Arabia, there is room for improvement
in the United Arab Emirates and Jordan.
3,8
09
9,0
22
11
,06
2
5,3
15
8,5
97
7,5
61
22
,81
9
22
,55
2
18
,31
5
54
,70
2
11
,04
9
25
,88
7
2 0 1 2 2 0 1 3 2 0 1 4 2 0 1 5 2 0 1 6 5 - Y R A V G
Export Import
25
,66
3
23
,54
1 35
,00
5
39
,83
8 5
3,9
32
35
,59
6
- - 1
7 11
6
25
2 0 1 2 2 0 1 3 2 0 1 4 2 0 1 5 2 0 1 6 5 - Y R A V G
Export Import

Medium and Large Scale Investment Opportunities in Luxor
50
Table 31 Egypt’s Top Importers of Fresh and Dried Mangoes in 2016
Value
exported
in 2016
(USD
thousand)
Share in
Egypt's
exports
(%)
Quantity
exported
in 2016
Share in
Country's
Imports
(%)
Rank in
Country's
Exports
Average
Price per
ton (USD
thousand)
1 Saudi Arabia 17,576 32.6 11,717 42.0 1st 1.50
2 United Arab Emirates 8,143 15.1 5,429 9.5 3rd 1.50
3 Lebanon 7,622 14.1 5,081 73.1 1st 1.50
4 Jordan 5,940 11.0 3,960 10.2 4th 1.50
5 Kuwait 5,356 9.9 3,571 32.6 2nd 1.50
The above data suggests that while neighboring countries account for the lion’s share of Egypt’s mango exports,
it is worth exploring new markets in Europe, which seem to favor importing their mangoes from South America
and Southeast Asia.
4.2.3 Target Market Size
The trailing 5-year average for values exported and imported in the two categories are as follows:
Table 32 Target Market Size for Dried Fruit and Vegetables
5-yr trailing average 2012-2016 (USD
thousand)
Tomatoes Bananas Mangoes Total (Fresh
+Dried)
Total
(Dried)
Target % Target Value
Export 59,814 7,561 35,596 102,971 5,149 200% 10,297
Import 43 25,887 25 25,955 1,298 200% 2,595
USD 59,857 USD 33,448 USD 35,621 USD 128,926 USD 6,446 USD 12,893
The target market size was estimated using the assumption that 5% of the total traded crops are dried, since the
data available from Trade Map include both fresh and dried. Egypt already exports significantly when it comes
to fresh tomatoes and fresh mangoes, compared to bananas. While demand for dried products is difficult to
gauge from the above data, there is huge interest in this field. Investor sentiment indicates that at least a 200%
improvement in export levels and import substitution can be made. This brings the total estimated target market
size to USD 12.89m (EGP 232m).
Expected Selling Prices: The markets to target are export mainly to take advantage of the lucrative pricing post-
EGP flotation, followed by local niche retail. Expected selling prices for the products are:
1 kg of dried tomato is expected to sell between USD 2-5 per kg. That is EGP 54-90 wholesale.
1 kg of dried banana chips is expected to sell between USD 3-20 per kg. That is EGP 50-180 wholesale.
1 kg of dried mango chips is expected to sell between USD 5-30 per kg. That is EGP 90-540 wholesale.
Local prices for these products are expected to be within the same ranges however on the lower side. The lowest
of these ranges were considered for feasibility analysis.
4.2.4 Estimated Annual Sales and Forecasts
The plant, described in more detail under Project Engineering, is assumed to start operating at 50% capacity in
Year 1 and reach around 91% by Year 10 as part of the conservative assumptions typical resorted to in the
present document. Revenue growth forecasts to account for in price inflation and better capacity utilization in
subsequent years are assumed, with an aggressive marketing push in the first 5 years, as shown in Annex I.

Medium and Large Scale Investment Opportunities in Luxor
51
This translates to estimated production and annual sales for Year 1 as follows:
111 tons of dried tomatoes, bringing in EGP 4.4m
236 tons of dried banana, bringing in EGP 14.2m
129 tons of dried mango, bringing in EGP 16.8m
This brings Year 1 revenues to a total of EGP 35.3m. The following graph shows a comparison of the target
market and expected revenues in the first five years.
Figure 12 Comparison between Target Market Size and Year 1-5 Revenues for Dried Fruits and Vegetable Production Line
4.2.5 Estimated Marketing Costs
Marketing the product on the global stage will require a considerable budget and it is assumed that the
marketing budget will account for around 7.5% of sales targets stated above. These sales targets after all are
highly contingent on aggressive marketing before operations. This brings the total marketing budget for Year 1
to EGP 2.6m.
4.3 Direct Inputs Required
This section describes the main raw materials required for the process, including other inputs such as additives,
etc., as well as the expected costs, their availability (including seasonality when referring to crops) and any risks
expected in securing each input and how to mitigate it. It also shows the utilities required, specific consumption
benchmarks used, as well as direct labor requirements and any other direct inputs.
4.3.1 Crops Required
The three main crops required for this process are tomatoes, bananas and mangoes. Qena figures were added
as they present a valid local source of the required crops. The three crops complement each other in terms of
seasonality, and all are cultivated locally and therefore abundant.
The following table provides the figures for feddans cultivated and tons produced are according to figures
provided by the CAPMAS Annual Bulletin for Statistical Crop Area and Plant Production for the years 2014-2015.
Table 33 Production Schedule according to Seasonality of Tomatoes, Bananas and Mangoes in Luxor and Qena
Crop Name
Luxor Qena Seasonality / Production Schedule
feddans tons feddans Tons Jan
Feb
Mar
Ap
r
May
Jun
Jul
Au
g
Sep
Oct
No
v
Dec
Tomatoes 9,619 184,133 6,718 134,487 x x x
Bananas 6,012 66,638 5,838 88,752 x x x x
EGP
72
m EGP
14
4m
EGP
36
m EGP
72
m
C U R R E N T V A L U E ( 2 0 1 6 )
T A R G E T I M P R O V E M E N T ( P O S T - 2 0 1 7 )
Y E A R 1 ( 2 0 1 8 ) R E V E N U E S
Y E A R 5 ( 2 0 2 3 ) R E V E N U E S

Medium and Large Scale Investment Opportunities in Luxor
52
Mangoes 1,911 6,181 708 2,147 x x x
The market prices for the crops are presented in the following table based on 2016-2017 levels. These prices are
based on direct buying from farmers. When buying from traders, around 8% is added as a margin, plus EGP 0.25
per kg for transportation.
Table 34 Prices of Fresh Tomatoes, Bananas and Mangoes for 2016-2017
Crop Price
Tomatoes EGP 1 – 8 per kg
Bananas EGP 6 – 10 per kg
Mangoes EGP 6 – 16 per kg
This study assumes tomatoes are sourced locally only at an average price of EGP 4 per kg, to ensure higher
quality tomatoes needed for this kind of product. Higher quality bananas and mangoes are also sourced at the
higher end of the range, at EGP 10 and EGP 16 per kg respectively.
4.3.2 Utilities
Assuming today’s tariffs for electricity, natural gas and water, the following specific consumption rates were
calculated for the three main products. Taking into account the different thermal requirements to reduce
moisture content in each, depending on initial and final moisture content, an average rate was taken for all three
products5.
Table 35 Specific Consumption and Expected Cost per ton for Year 1
Specific Consumption Expected Bill
Utilities – Black Honey & Date Syrup
Electricity 800 kWh/ton 613.60 EGP/ton
Gas 7,200 kWh/ton 2,232.00 EGP/ton
Water 20 m3/ton 62.04 EGP/ton
Wastewater 20 m3/ton 53.40 EGP/ton
The above tariffs are for the fiscal year 2017/2018 and are assumed to be tied to inflation projections over the
consequent years, as shown in Annex I.
4.3.3 Direct Labor
Seasonal labor will be required for each harvest to handle the fresh tomatoes and mangoes coming during
production months. The following table shows how many workers will be required for each season of
production.
Table 36 Seasonal Labor Required for Fruit and Vegetable Drying
Production – Seasonal No. of Workers EGP per ton handled
Workers – Tomatoes Season 5 50
Workers – Bananas Season 5 50
Workers – Mangoes Season 5 50
5 The specific consumption rates were obtained from the European Commission’s (EC) Best Available Techniques Reference Documents (BREFs) as well as the SCOoPE project, also funded by the EC, as well as from industry experts and practitioners.

Medium and Large Scale Investment Opportunities in Luxor
53
4.3.4 Packaging
The final product will be packaged in vacuum sealed bags, to avoid rehydration and spoilage. The standard size
is 50kg, which is the size most used for this kind of product. They are expected to cost USD4-5, or EGP 75 per
bag, and are usually ordered in bulks.
4.4 Project Engineering
This section describes the production process in detail, any specific technologies used, the estimated plant
capacity, as well as the main components required along with an estimate for civil engineering works (factory
infrastructure, etc.) and the total area required.
4.4.1 Description of Technology
The technology selected for the process of food dehydration is called DIC, which uses instant controlled pressure
drop treatment to improve the drying process of organic materials. It is considered a relatively new technology
in the field of food dehydration, but has been successfully commercialized and considered a decent economical
alternative to more traditional and expensive methods. In this study, it is combined with industry standard batch
convectional hot-air dryers that can be locally manufactured. The DIC reactor can be imported from ABCAR-DIC
Process in France.
4.4.2 Estimated Plant Capacity
The plant capacity is expected to handle up to 12 tons of fresh fruit and vegetable per day. Each feedstock has
its own conversion ratio, which has been calculated according to initial and final moisture contents and is
presented in the following table.
Table 37 Conversion Ratio for Dried Products
Crop Input (tons/day) Conversion Ratio Max. Output (tons) Yield
Tomatoes 12 4:1 2.9 25%
Bananas 12 5:2 4.7 39%
Mangoes 12 7:2 3.4 29%
It is assumed that production will take place in the same months as the harvest and only then. Production can
take place in the gap months but will require investment in storage facilities to keep the raw material fresh for
months. This will increase initial investment required so it was not taken into account in this study. However, it
is safe to assume that these assets can be funded through the company’s operating cash flow in future years,
increasing productivity beyond this study’s projections.
4.4.3 Process Flow
The process is illustrated in the following figure.

Medium and Large Scale Investment Opportunities in Luxor
54
Figure 13 Process Flow Diagram of Fruit and Vegetable Drying
The process steps illustrated above are described in detail in the following table.
Table 38 Step-by-Step Details of Fruit and Vegetable Drying Process
# Name Description
Step 1 Receiving raw
material
Tomatoes/Bananas/Mangoes arrive at the plant in trucks, which are directed to
the offloading area.
Step 2 Washing Tomatoes/Mangoes are washed to remove any dirt. Bananas skip this step and go
straight to sorting.
Step 3 Sorting All raw material is sorted to remove any off-specification items before moving onto
cutting and slicing. Tomatoes should be unblemished, firm, red and ripe.
Bananas/mangoes should be ripe and sweet but not soft and brown.
Step 5 Cutting/ Slicing Tomato stalks are removed, then sliced into quarters or eighths, removing seeds.
Bananas should be peeled and cut into thin slices (5-7mm thick). Mangoes should
be peeled and cut into thin slices (6-8mm thick).
Step Pre-Drying Freshly cut slices are then subjected to a stream of hot-air at 50 degrees Celsius
until they reach around 25% residual moisture content.
Step 7 DIC texturing/
sterilization
The DIC process has been defined as two main stages of: (1) thermal treatment
carried out under a high saturated steam pressure, which allows the temperature
of the product to attain between 100 and 160 degrees Celsius, for a short duration
of 5–60 s followed by: (2) an abrupt pressure drop towards a vacuum with a very
high decompression rate, which is generally maintained for 5–20 seconds. During
the first stage, steam condensation on the surface of the product helps heat it. This
superficial moisture requires time to diffuse down to the core and reach
homogeneous moisture and temperature levels before the pressure drops. This
step helps to de-bacterize and stop enzymatic processes (same effect as blanching)
to help preserve texture (instant cooling prevents structure from collapsing),
flavor, and color, before undergoing finally drying. It also reduces final drying time
required.
Step 8 Final drying The product is placed in static bed air-dryers for the final drying stage, which is
when the product loses most of its moisture content. The target final moisture
content for these products is 18%.
Step 9 Packaging Using a vacuum sealing machine, the final product is packed into polythene bags
and sealed to prevent contamination and rehydration. This can be stored for up to
one year.
4.4.4 Main Components and Equipment
The following is a list of the main components of the production line:
Washer

Medium and Large Scale Investment Opportunities in Luxor
55
Cutting / De-stoning machine
DIC reactor
Hot-air convectional batch driers
Vacuum sealing and packing machine
The DIC reactor needs to be imported from France. Other parts can be sourced locally. The prices for the main
components are below:
Table 39 Price Estimate for Fruit and Vegetable Drying Line
Component Price
Pre-Driers – manufactured locally EGP 500,000
DIC Reactor + Post-Driers
• Imported from France
• Handles 48 tons of feedstock per day
EUR 310,000 (EGP 6.2m)
Vacuum Sealing Machine USD 30,000 (EGP 600,000)
Total EGP 7,300,000
The estimated useful life of this production line, assuming proper maintenance and care, can go up to 15 years.
4.4.5 Civil Engineering Works
In addition to the production line, there are key components of the factory’s infrastructure that need to be
considered, such as:
Boiler for steam generation
Electrical Generator
Air compression system
Cooling system
Piping etc.
Total infrastructure costs are estimated to be around EGP 2 million for a factory of this size.
4.4.6 Area Required
The area required for this production line is estimated to be around 1,200 m2. The land is assumed to cost around
EGP 3,000 per m2, which amounts to EGP 3.6m for land acquisition. Building structure and office space is
estimated to cost an additional EGP 1.2m.
Important Note: Land is expected to be given for free in the Boghdadi industrial zone (IDA jurisdiction) by Luxor
governorate. However, it is sold against a fee in New Tiba (NUCA jurisdiction). To be conservative, land was
assumed to be bought against a fee.
4.5 Selling, General and Administrative Expenses (SG&A)
This section provides details on the selling, general and administrative expenses associated with the facility,
otherwise known as overhead costs.
4.5.1 Salaries and Wages
This opportunity is expected to employ around 22 permanent staff plus an additional 15 seasonal workers (5 for
each harvest season). They are summarized below:

Medium and Large Scale Investment Opportunities in Luxor
56
Table 40 List of Staff and Monthly Salaries for Concentrate Production Line
Position Staff Monthly
Management
CEO 1 15.000
…
Production - Permanent
Plant Manager 1 10.000
Quality Control 1 6.000
Hall Supervisors 1 6.000
Engineering 1 5.000
Workers 2 3.000
…
Sales, General and Administration
Procurement 2 5.000
Sales Manager 1 8.000
Sales 2 5.000
Marketing 2 5.000
Finance & Accounting 1 5.000
HR Manager 1 10.000
Maintenance 4 3.000
Security 2 2.000
…
Total 22 staff
Salaries for permanent staff amount to EGP 140,000 per month in Year 1, which is EGP 1.4m total for the year.
That is only 4% of total revenue for Year 1.
Wages for seasonal workers amount to around EGP 30,000 for each harvest. This assumes 5 workers per harvest
season, getting paid EGP 50 per ton of feedstock handled.
4.5.2 Factory
Factory overheads that fall outside human resource expenses and production costs are expected to be at a
minimum. Maintenance and storage costs are estimated to be around EGP 7,500 and EGP 10,000 per month
respectively.
4.5.3 Other Selling, General and Administrative
The main line item in this category is the marketing budget, which is determined as 7.5% of expected sales. This
amounts to EGP 2.8m for Year 1.
Utilities associated with administrative office space are expected to be around EGP 4,000 per month.

Medium and Large Scale Investment Opportunities in Luxor
57
4.6 Organizational Structure
4.6.1 Organizational Chart
4.7 Financial Analysis and Investment
This section provides details of revenues, cost of goods sold (variable costs), margin analysis by product, selling,
general and administrative (SG&A) expenses (aka overheads), fixed assets (initial capital expenditures) for the
first year. The total initial investment is provided, and a 10-year projection of the income statements and
statements of cash flow are calculated. Finally, the results of the feasibility and sensitivity analyses are provided
as a summary of the key findings of the financial model.
4.7.1 Revenues
The estimated revenues for Year 1 are summarized below:
Product Months of
Production
Total Tons
Produced
Selling Price
(EGP/ton)
Revenue
(EGP 000s)
Dried Tomatoes Jan - Apr 147 tons 40,000 5,894
Dried Bananas Sep - Dec 236 tons 60,000 14,155
Dried Mangoes Jun - Aug 129 tons 130,000 16,766
Total EGP 36,816
4.7.2 Cost of Goods Sold
The estimated total COGS for Year 1 are summarized below:
Inputs Quantity Units
Tomatoes
Tons bought 600 tons
Cost per ton 4 EGP 000s/ton
Cost per month 2,400 EGP 000s
CEO
Factory Plant Manager
Quality Control
Hall Supervisors
Engineering
Workers (Permanent)
Workers (Seasonal)
Administration
Procurement Manager
Sales Manager Sales Officers
Marketing Manager
Financial Manager
HR Manager Maintenance

Medium and Large Scale Investment Opportunities in Luxor
58
Bananas
Tons bought 600 tons
Cost per ton 10 EGP 000s/ton
Cost per month 6,000 EGP 000s
Mangoes
Tons bought 450 tons
Cost per ton 16 EGP 000s/ton
Cost per month 7,200 EGP 000s
Seasonal Labor
Workers – Tomatoes 30 EGP
Workers – Bananas 30 EGP
Workers - Mangoes 23 EGP
Packaging – 50k polythene bags
Number of bags used 10,245 bags
Cost per year 768 EGP 000s
Utilities
Electricity 314 EGP 000s
Gas 1,143 EGP 000s
Water 32 EGP 000s
Wastewater 27 EGP 000s
Total Utilities 1,517 EGP 000s
Total COGS 17,968 EGP 000s
4.7.3 Gross Margin Analysis by Product
Looking at each product’s line items separately, gross margin can be calculated to show how profitable each
product is and how much it contributes in covering overheads, ultimately increasing bottom line figures.
Dried Tomato Dried Banana Dried Mango
EGP 000s EGP 000s EGP 000s
Revenues 5,894 14,155 16,766
Raw Material 2,400 6,000 7,200
Seasonal Labor 30 30 23
Packaging 221 354 193
Electricity 90 145 79
Gas 329 527 288
Water 9 15 8
Wastewater 8 13 7
Total COGS 3,087 7,082 7,798
Gross Margin 47.6% 50.0% 53.5%
(-) Overheads 12.0% 12.0% 12.0%
Operating Margin 35.6% 38.0% 41.5%

Medium and Large Scale Investment Opportunities in Luxor
59
4.7.4 Selling, General and Administrative Expenses
SG&A for Year 1 is summarized below:
Human Resources EGP 000s
Total Permanent Staff Salaries 1,404
Overheads
Factory
Maintenance 90
Storage 120
General & Administrative -
Marketing (7.5% of Sales) 2,761
Utilities 48
Total Overheads 3,019
Total SG&A 4,423
4.7.5 Fixed Assets
The following table summarized the fixed assets (aka Property, Plant and Equipment) required for operation of
the facility, along with the associated yearly depreciation expense.
Fixed Assets Cost Dep. Life Yearly Dep. Exp.
EGP 000s EGP 000s
Production Line 7,300 10 yrs. 730
Infrastructure 2,000 15 yrs. 133
Building 1,000 30 yrs. 33
Office 200 10 yrs. 20
Land 3,600 0 yrs. N/A
Total CAPEX 14,100 917
4.7.6 Minimum Investment Required
The minimum investment required will be the total fixed asset purchases required for operation plus 3-months’
worth of working capital.
EGP 000s
Initial Capital Expenditures on Fixed Assets 14,100
Working Capital for 3 months 5,598
Total Investment Required 19,698

Medium and Large Scale Investment Opportunities in Luxor
60
4.7.7 Projected Income Statements
The following is the projected income statements for the first 10 years of operation:
Table 41 Projected Income Statements for Fruit and Vegetable Drying Line (EGP thousands)

Medium and Large Scale Investment Opportunities in Luxor
61
4.7.8 Projected Cash Flow Statements
The following is the projected cash flow statements for the first 10 years of operation:
Table 42 Projected Cash Flow Statement for Fruit and Vegetable Drying Line (EGP thousands)

Medium and Large Scale Investment Opportunities in Luxor
62
4.7.9 Feasibility Analysis
The following table summarizes the key findings from the feasibility analysis:
Key Metric (based on 10-yr projections) Result (EGP 000s)
Capital Expenditures Required EGP 14,100
Working Capital Required for first 3 months EGP 5,598
Minimum Investment Required EGP 19,698
Direct Investment (Equity) EGP 5,909
Debt Financing EGP 13,788
Enterprise Value EGP 117,376
Internal Rate of Return 56%
Simple Payback 2.2 years
Discounted Payback 3.4 years
Profitability Index 5.96
4.7.10 Sensitivity Analysis
The feasibility of this opportunity is most sensitive to fluctuations in crop prices, which are compounded by
conversion factors, as all crops lose weight due to moisture loss. However, since the value added (around 57-
59%) to these crops is quite high, the risk exposure to crop price fluctuations is minimal.
A calculation was made to see how far up prices can go before operating margins reach 0%, while holding selling
prices at current global prices for these dried products. The results were as follows:
Tomatoes can go up as high as EGP 7.50 per kg. This study assumes an average price of EGP 4.00 per
kg. A change of EGP 0.50 can change the gross margin by only 5%.
Bananas can go up as high as EGP 18.95 per kg. This study assumes an average price of EGP 10.00 per
kg. A change of EGP 0.50 can change the gross margin by only 3%.
Bananas can go up as high as EGP 31.45 per kg. This study assumes an average price of EGP 10.00 per
kg. A change of EGP 0.50 can change the gross margin by only 3%.
The analysis above shows that all three products have decent operating margins and have room to withstand
increases in crop prices without increasing selling prices. This means these are high value-added products that
take advantage of low local crop prices and are able to compete with global selling prices.
4.8 Impact
Economic - Value added to local crops such as tomato and mango is quite significant. Based on this study’s
assumptions, before deducting other COGS and overheads:
• 4 kg of fresh tomatoes cost EGP 20 to produce 1 kg of dried tomatoes selling at EGP 40 – that is 50%
value added to the crop.
• 2.5kg of fresh bananas cost EGP 30 to produce 1kg of dried banana chips selling at EGP 60 – that is 50%
value added to the crop.
• 3.5kg of fresh mangoes cost EGP 70 to produce 1kg of dried mango chips selling at EGP 140 – that is
50% value added to the crop.
Social - Direct jobs created by this facility will include 22 permanent plant staff plus another 15-20 seasonal
workers. Indirect jobs created will be mainly in logistics, marketing and distribution, and increased dedicated
farming to supply the plant over time.

Medium and Large Scale Investment Opportunities in Luxor
63
Environmental – This opportunity will help decrease post-harvest losses as demand for raw materials for
dehydration can reduce oversupply. Dehydrated foods are more easily transported and stored due to decreased
weight, increased shelf-life, which curbs overall carbon emissions.

Medium and Large Scale Investment Opportunities in Luxor
64
5 IO4 - Fruit and Vegetable Packing Facility
5.1 Overview
This opportunity aims to add value to local crops through improved packaging, making it more suitable for export
and local niche markets. The selected crops, based on abundance and seasonality, are tomatoes, grapes and
mangoes.
The packing facility receives the fresh harvest that undergoes fumigation and quality packaging, transported in
refrigerated trucks to the relevant ports. Egypt already exports a significant amount of its crops, especially to
the Gulf and Europe, and this facility will improve access for local farmers to these markets, and possibly open
new markets in Africa. The technology selected for this packing facility is mainly imported which consists mostly
of packaging lines, waxing stations and cooling rooms. Luxor is already home to a packing facility which is not
operating at maximum capacity due to limitations in refrigerated transport from facility to ports (mainly
Alexandria).
5.2 Market Demand
This section provides a description of the products and targeted markets, including a brief analysis on the current
market structure, the potential for import substitution and export where applicable.
5.2.1 Product Description
Product A: Fresh tomatoes, packaged according to destination market specifications.
Product B: Fresh grapes, packaged according to destination market specifications.
Product C: Fresh mangoes, packaged according to destination market specifications.
The fresh produce undergoes little processing such as washing, fumigation and refrigeration, and is finally
packaged in export grade containers, ready for shipment.
5.2.2 Current Market Structure
According to Trade Map (International Trade Centre 2017), Egypt ranked 16th in world exports of fresh and dried
tomatoes in 2016, which represents a 0.8% market share. The global market is dominated by Mexico, Spain,
Netherlands, Canada and Morocco. The world market for exports in this category was worth USD 7.9b in 2016.
Egypt exports seem to have plateaued the last three years, despite a decent jump in 2013, while imports have
remained relatively steady as shown in the following figure.
For illustrative purposes only.

Medium and Large Scale Investment Opportunities in Luxor
65
Figure 14 Egypt Export vs Import in USD for years 2012-2016 for Fresh and Dried Tomatoes
Egypt’s biggest importers in 2016 are shown in Table 43. Despite ranking high in the respective country’s
imports, the market shares are considered quite low for markets such as Turkey and UAE. This leaves significant
room for improvement in market share for the main markets currently targeted.
Table 43 Egypt’s Top Importers of Fresh and Dried Tomatoes in 2016
Value
exported
in 2016
(USD
thousand)
Share in
Egypt's
exports
(%)
Quantity
exported
in 2016
Share in
Country's
Imports
(%)
Rank in
Country's
Exports
Average
Price per
ton (USD
thousand)
1 Saudi Arabia 35,923 54.4 34,082 35.4 2nd 1.05
2 United Arab Emirates 9,912 15.0 9,404 7.9 5th 1.05
3 Turkey 5,701 8.6 5,409 8.6 2nd 1.05
4 Kuwait 4,038 6.1 3,831 17.4 2nd 1.05
5 Russia 2,976 4.5 2,824 1.1 9th 1.05
As for grapes, Egypt ranked 13th globally. This accounts for 2.2% of the global export market, which is around
USD 9.5 billion, as of 2016. Figure 2 shows import and export trends for the last 5 years for grapes.
Figure 15 Egypt Export vs Import in USD for years 2012-2016 for Fresh and Dried Grapes
Egypt’s biggest importers in this category for 2016 are shown in Table 44. It is clear that the main market is
Europe. However, there remains significant room for improvement in market share.
28
,73
5
60
,53
1
70
,93
6
72
,86
9
65
,99
9
59
,81
4
20
4
- - 9
- 43
2 0 1 2 2 0 1 3 2 0 1 4 2 0 1 5 2 0 1 6 5 - Y R A V G
Export Import
22
5,1
85
18
3,7
30
24
5,5
04
24
3,0
36
21
2,9
64
22
2,0
84
10
,72
3
8,6
97
7,6
08
11
,54
7
8,4
08
9,3
97
2 0 1 2 2 0 1 3 2 0 1 4 2 0 1 5 2 0 1 6 5 - Y R A V G
Export Import

Medium and Large Scale Investment Opportunities in Luxor
66
Table 44 Egypt’s Top Importers of Fresh and Dried Grapes in 2016
Value
exported
in 2016
(USD
thousand)
Share in
Egypt's
exports
(%)
Quantity
exported
in 2016
Share in
Country's
Imports
(%)
Rank in
Country's
Exports
Average
Price per
ton (USD
thousand)
1 United Kingdom 72,501 34.0 38,549 6.3 5th 1.88
2 Netherlands 46,010 21.6 24,464 5.0 7th 1.88
3 Germany 17,470 8.2 9,289 4.1 8th 1.88
4 Russia 16,331 7.7 8,683 7.2 8th 1.88
5 Saudi Arabia 8,357 3.9 4,437 11.1 4th 1.88
The above data suggests that Egypt already does well on the global stage in terms of exporting grapes and could
benefit from increasing its market share in Europe and the Gulf by producing more export-grade grapes for these
markets.
For mangoes, Egypt ranks 12th in the global export market, but only represents 2.3% of the USD 5.4b market, as
of 2016. The following figure shows import and export trends for the last 5 years for fresh and dried mangoes.
Figure 16 Egypt Export vs Import in USD for years 2012-2016 for Fresh and Dried Mangoes
Egypt’s biggest importers in this category for 2016 are shown in Table 45. Middle Eastern markets dominate the
table, and while market share is already quite high in Lebanon and Saudi Arabia, there is room for improvement
to be done in the United Arab Emirates and Jordan.
Table 45 Egypt’s Top Importers of Fresh and Dried Mangoes in 2016
Value
exported
in 2016
(USD
thousand)
Share in
Egypt's
exports
(%)
Quantity
exported
in 2016
Share in
Country's
Imports
(%)
Rank in
Country's
Exports
Average
Price per
ton (USD
thousand)
1 Saudi Arabia 17,576 32.6 11,717 42.0 1st 1.50
2 United Arab Emirates 8,143 15.1 5,429 9.5 3rd 1.50
3 Lebanon 7,622 14.1 5,081 73.1 1st 1.50
4 Jordan 5,940 11.0 3,960 10.2 4th 1.50
5 Kuwait 5,356 9.9 3,571 32.6 2nd 1.50
25
,66
3
23
,54
1 3
5,0
05
39
,83
8
53
,93
2
35
,59
6
- - 1
7 11
6
25
2 0 1 2 2 0 1 3 2 0 1 4 2 0 1 5 2 0 1 6 5 - Y R A V G
Export Import

Medium and Large Scale Investment Opportunities in Luxor
67
The above data suggests that while neighboring countries account for the lion’s share of Egypt’s mango exports,
it is worth exploring new markets in Europe, which seem to favor importing their mangoes from South America
and Southeast Asia.
5.2.3 Target Market Size
The trailing 5-year average for values exported and imported in the two categories are as follows:
Table 46 Target Market Size for Packed Fruit and Vegetables
5-yr trailing average 2012-2016 (USD thousand)
Tomatoes Mangoes Grapes Totals Target % Target Value
Export 59,814 35,596 222,084 317,494 50% 158,747
Import 43 25 9,397 9,464 0% -
USD 59,857 USD 35,621 USD 231,480 USD 326,958 USD 158,747
Egypt already exports significantly when it comes to the selected crops, especially grapes. While there are
companies already active and dedicated to exporting fresh produce, demand in export is still unsatisfied and
there remains decent potential for Egypt to compete, especially in Europe. A 50% improvement in export levels
(import substitution potential is limited). This brings the total estimated target market size to USD 158.75m (EGP
2.86bn).
Expected Selling Prices: The markets to target are export mainly to take advantage of the lucrative pricing post-
EGP flotation. Expected selling prices for the products are:
1 kg of fresh tomato is expected to sell around USD 1.0 per kg (EGP 18 per kg).
1 kg of fresh grapes is expected to sell around USD 1.8 per kg (EGP 32 per kg).
1 kg of fresh mangoes is expected to sell around USD 1.7 per kg (EGP 30 per kg).
5.2.4 Estimated Annual Sales and Forecasts
The plant, described in more detail under Project Engineering, is assumed to start operating at 50% capacity in
Year 1 and reach around 91% by Year 10 as part of the conservative assumptions typical resorted to in the
present document. Revenue growth forecasts to account for in price inflation and better capacity utilization in
subsequent years are assumed, with an aggressive marketing push in the first 5 years, as shown in Annex I.
This translates to estimated production and annual sales for Year 1 as follows:
2,500 tons of fresh tomatoes, bringing in EGP 40.0m
1,250 tons of fresh grapes, bringing in EGP 37.5m
1,875 tons of fresh mango, bringing in EGP 52.5m
This brings Year 1 revenues to a total of EGP 130.0m. The following graph shows a comparison of the target
market and expected revenues in the first five years.

Medium and Large Scale Investment Opportunities in Luxor
68
Figure 17 Comparison between Target Market Size and Year 1-5 Revenues for Fresh Fruits and Vegetable Packing Line
5.2.5 Estimated Marketing Costs
Marketing the product on the global stage will require a considerable budget and it is assumed that the
marketing budget will account for around 7.5% of sales targets stated above. These sales targets after all are
highly contingent on aggressive marketing before operations. This brings the total marketing budget for Year 1
to EGP 9.8m.
5.3 Direct Inputs Required
This section describes the main raw materials required for the process, including other inputs such as additives,
etc., as well as the expected costs, their availability (including seasonality when referring to crops) and any risks
expected in securing each input and how to mitigate it. It also shows the utilities required, specific consumption
benchmarks used, as well as direct labor requirements and any other direct inputs.
5.3.1 Crops Required
The three main crops required for this process are tomatoes, grapes and mangoes. Qena figures were added as
they present a valid local source of the required crops. The three crops complement each other in terms of
seasonality, and all are cultivated locally and therefore abundant.
The following table provides the figures for feddans cultivated and tons produced are according to figures
provided by the CAPMAS Annual Bulletin for Statistical Crop Area and Plant Production for the years 2014-2015.
Table 47 Production Schedule according to Seasonality of Tomatoes, Grapes and Mangoes in Luxor and Qena
Crop Name
Luxor Qena Seasonality / Production Schedule
feddans tons feddans tons Jan
Feb
Mar
Ap
r
May
Jun
Jul
Au
g
Sep
Oct
No
v
Dec
Tomatoes 9,619 184,133 6,718 134,487 x x x x
Grapes 799 5,114 349 2,017 x x
Mangoes 1,911 6,181 708 2,147 X x x
The market prices for the crops are presented in the following table based on 2016-2017 levels. These prices are
based on direct buying from farmers. When buying from traders, around 8% is added as a margin, plus EGP 0.25
per kg for transportation.
EGP
58
86
m
EGP
28
62
m
EGP
13
0m
EGP
32
7m
C U R R E N T V A L U E ( 2 0 1 6 ) T A R G E T I M P R O V E M E N T ( P O S T - 2 0 1 7 )
Y E A R 1 ( 2 0 1 8 ) R E V E N U E S
Y E A R 5 ( 2 0 2 3 ) R E V E N U E S

Medium and Large Scale Investment Opportunities in Luxor
69
Table 48 Prices of Fresh Tomatoes, Grapes and Mangoes for 2016-2017
Crop Price
Tomatoes EGP 1 – 8 per kg
Grapes EGP 4 – 10 per kg
Mangoes EGP 6 – 16 per kg
This study assumes tomatoes are sourced locally only at an average price of EGP 4 per kg, to ensure higher
quality tomatoes needed for this kind of product. Higher quality grapes and mangoes are also sourced at the
higher end of the range, at EGP 10 and EGP 16 per kg respectively.
5.3.2 Utilities
Assuming today’s tariffs for electricity, natural gas and water, the following specific consumption rates were
calculated for the three main products. The main utilities are electrical for cooling, and water/wastewater for
washing, while no thermal energy is required in the process6.
Table 49 Specific Consumption and Expected Cost per ton for Year 1
Specific Consumption Expected Bill
Utilities
Electricity 150 kWh/ton 115.05 EGP/ton
Gas 0 kWh/ton 0.00 EGP/ton
Water 20 m3/ton 62.04 EGP/ton
Wastewater 20 m3/ton 53.40 EGP/ton
The above tariffs are for the fiscal year 2017/2018 and are assumed to be tied to inflation projections over the
consequent years.
5.3.3 Direct Labor
Seasonal labor will be required for each harvest to handle the fresh tomatoes and mangoes coming during
production months. The following table shows how many workers will be required for each season of
production.
Table 50 Seasonal Labor Required for Fruit and Vegetable Packing
Production – Seasonal No. of Workers EGP per ton handled
Workers – Tomatoes Season 10 180
Workers – Bananas Season 10 240
Workers – Mangoes Season 10 180
5.3.4 Other Inputs
The final packaging for each product will differ according to market requirements. Additional inputs such as
sulphur dioxide (required for fumigation with grapes), ethylene (required for ripening of tomatoes) waxing
emulsion, special pallets, etc. are required before final packaging.
An estimate was calculated and an average of EGP 800 per 100 kg was determined.
6 The specific consumption rates were obtained from the European Commission’s (EC) Best Available Techniques Reference Documents (BREFs) as well as the SCOoPE project, also funded by the EC, as well as from industry experts and practitioners.

Medium and Large Scale Investment Opportunities in Luxor
70
5.4 Project Engineering
This section describes the production process in detail, any specific technologies used, the estimated plant
capacity, as well as the main components required along with an estimate for civil engineering works (factory
infrastructure, etc.) and the total area required.
5.4.1 Description of Technology
The facility uses industry standard pack house equipment to receive fresh produce for quality inspection,
washed, sorted, treated and packed in different ways according to client/market needs.
5.4.2 Estimated Plant Capacity
The plant capacity is expected to handle up to 50 tons of fresh fruit and vegetable per day. Since this is a packing
facility, there is no processing done to the fresh produce, i.e. there are no conversion ratios/yields to account
for, losses from off-specification items notwithstanding.
It is assumed that production will take place in the same months as the harvest as shown in Table 33 and only
then.
5.4.3 Process Flow
The process is illustrated in the following figure.
Figure 18 Process Flow Diagram of Fruit and Vegetable Packing
The process steps illustrated are described in detail in the following tables. Each table shows the steps required
for each crop separately, since there are major variations in post-harvest handling that is key for producing a
final product of export standards.
Table 51 Step-by-Step Details of Fresh Tomato Packing Process
# Name Description
Step 1 Harvest Tomatoes should be removed from the plant by gently twisting or rotating them in
order to cleanly remove the stem from the fruit. The stems in most field-type tomato
cultivars release at the point of attachment to the fruit.

Medium and Large Scale Investment Opportunities in Luxor
71
Tomatoes should be picked during the coolest part of the day, such as early morning or
late afternoon. If they are picked in the morning, harvest should be delayed until the
moisture has dried off the fruit surface. Tomatoes should never be picked in the rain or
when they are wet.
Step 2 Preparation for
Market
The harvested tomatoes should be taken to the packing area soon after picking to begin
the process of cleaning, grading, and packing. During all operations, from harvest
through packing, the fruit should be handled carefully to avoid bruising and injury to
the tissue.
Step 3 Cleaning The initial step in preparing tomatoes for market is to clean the surface of the fruit and
remove any dirt, surface stains, or adhering leaf tissue.
Step 5 Waxing A thin water-wax emulsion spray coating can also be applied to the fruit as the final
step in the cleaning process. Waxing the fruit will enhance its appearance and make it
glossier. Waxing can reduce fruit shriveling and increase market life.
Step 6 Grading All tomatoes must be sorted and graded before packing for market. The main fruit
characteristics used to grade tomatoes are size, color, shape, appearance, and firmness.
The fruit should also have a well-formed uniform shape typical of the cultivar.
Deformed or cat faced fruit should be culled out and not be packed for market.
Step 7 Packing The fruit surface must be free of moisture before packing in order to reduce storage
rots. The type of container used for packing tomatoes depends on the market
destination.
Step 8 Ripening Ripening of tomatoes is initiated by ethylene, a natural ripening hormone produced by
the tomato fruit. Application of additional external ethylene may be used to promote
faster and more uniform ripening of mature-green tomatoes. Fruit beyond the breaker
stage do not benefit from supplemental ethylene because their ripening processes
already have been initiated by their own ethylene.
Table 52 Step-by-Step Details of Fresh Grapes Packing Process
# Name Description
Step 1 Harvest Once the decision to harvest grape has been made based on maturity index
interpretation, harvest crews should follow recommended picking and field
accumulation procedures.
Harvested grapes should be protected from exposure to direct sunlight while they await
transport to the packing house.
Step 2 Transport to
Packing houses
If fruit transport requires traveling lengthy distances, producers should observe the
considerations below to minimize the adverse effects on quality that transport to the
packinghouse might cause to the fruit.
Step 3 Field packing The picker usually trims the fruit to remove defective berries and obtain a better bunch
shape and size. Bunches are then placed carefully into field crates (‘lugs’) or baskets
which are made from plastic. The picking lugs are then transferred a short distance to
the packer, who works at a small, shaded portable stand in the avenue between
vineyard blocks.
Step 5 Shed packing Shed-packed fruit is harvested by pickers and placed in field lugs. These are then moved
into the shade of the vines to await transport to the shed. At the packing shed the field
lugs are distributed to packers who select, trim and pack the fruit. In some operations,
trimming, color sorting, and a first quality sorting may have occurred in the field.
Step 6 Packing Whether field or shed packed, grapes are nearly always packed on a scale to facilitate
packing to a precise net weight.
Both forms of packaging provide consumer-sized units and reduce the drop of loose
berries.
Step 7 Sulphur dioxide
(SO2) fumigation
After packing the grapes, SO2 generator sheets were added to each carton on the top
of grapes.
Step 8 Palletization After packing with grapes, cartons are palletized on disposable or recycled pallets.
These pallet loads are unitized, usually by strapping or netting. In shed-packing

Medium and Large Scale Investment Opportunities in Luxor
72
operations, some palletizing glue is used to bond the corrugated containers vertically
on the pallet so that only horizontal strapping is required.
Step 9 Cooling and
storage
After palletization is completed, the pallets are moved to a pre-cooling room. In any
case, pre-cooling must start as soon as possible. After pre-cooling is completed, the
pallets are moved to a storage room to await transport.
Table 53 Step-by-Step Details of Fresh Mangoes Packing Process
# Name Description
Step 1 Harvest When to harvest is one of the most important decisions a grower faces when it comes
to providing the marketplace with superior-quality fruit.
Once the decision to harvest mangos has been made based on maturity index
interpretation, harvest crews should follow recommended picking and field
accumulation procedures.
Harvested mangos should be protected from exposure to direct sunlight while they
await transport to the packinghouse.
Step 2 Transport to
Packinghouses
If fruit transport requires traveling lengthy distances, producers should observe the
considerations below to minimize the adverse effects on quality that transport to the
packing house might cause to the mango fruit.
Step 3 Fruit Staging at
Packinghouses Prior
to Packing
Most of the mangos wait inside transport trucks for unloading. Unloaded fruit are
almost immediately dumped on the reception line. This system optimizes the use of
space in the packinghouse and also the efficiency of resources on the reception line. The
down side is that mangos wait for unloading under adverse conditions inside transport
trucks.
The second type of mango staging system involves a large unloading area, where fruit
are unloaded from trucks and clearly identified as lots to be processed in the reception
line once quality-control and quarantine inspections have been conducted. Large, open
unloading areas protect mangos awaiting reception from sunlight, provide appropriate
ventilation, and permit a more representative sampling of mangos for both quarantine
and quality-control purposes.
Step 5 Washing Upon arrival at the packing house, mangos should be processed as soon as possible
unless they are being rested to avoid potential latex problems. Mangos are normally
transferred into a water flume system (dump tank) at reception for gentle transfer to
the sizing line. This transfer may be done manually or automatically. After the fruit leave
the dump tank, it is advisable to use a spray and brush operation to remove soil, latex,
and other materials that may adhere to the fruit.
Step 6 Grading, Sizing and
Sorting
Fruit grading at the packinghouse is done to remove unmarketable fruits. This eliminates
the waste of time, money, and energy that accompanies shipping unmarketable fruit to
the exported country that must eventually be removed from palletized cartons and
discarded.
Sizing Mangos for hot water treatment may be accomplished manually or automatically
by weight or dimension. If dimensional sizing is used, fruit weights must be checked
frequently to ensure that the proper fruit weight classifications are being achieved.
Step 7 Waxing Waxing mango fruit, usually with carnauba-based formulations, improves its
appearance by increasing the natural fruit gloss and reducing water loss, which causes
mango fruit to appear dull. Brushing during wax application helps to obtain uniform wax
distribution on the fruit.
Water-soluble coatings should be avoided because they can be dissolved during later
handling when condensation occurs on fruit surfaces, such as when cold fruit is
transferred to warmer temperatures.
Step 8 Packing It is important to train packing line workers to pack mango cartons without injuring the
fruit. While mango cartons should be packed tightly in order to immobilize the fruit
during transit to avoid vibration injury (surface abrasion), the fruit should not be forced
into the cartons by pounding, etc.

Medium and Large Scale Investment Opportunities in Luxor
73
Step 9 Palletization and
Staging for
Cooling/Storage/Shi
pping
Palletization facilitates handling efficiency and reduces physical injury to mangos by
reducing handling of individual cartons.
5.4.4 Main Components and Equipment
The following is a list of the main components of the production line:
1 Packing and sizing line
2 Cooling stations
Pre-cooling stations
Washing stations (basins, etc.)
Waxing stations
Storage
Some components must be imported while others can be acquired locally. The prices for the main components
are below:
Table 54 Price Estimate for Fruit and Vegetable Packing Line
Component Price
Packing Sizing Line x1 USD 300,000 (EGP 5.4m)
Cooling Stations x2 EGP 1.3m
Pre-cooling Station EGP 1.0m
Total EGP 7,700,000
The estimated useful life of this production line, assuming proper maintenance and care, can go up to 15 years.
5.4.5 Civil Engineering Works
In addition to the production line, there are key components of the factory’s infrastructure that need to be
considered, such as:
Electrical Generator
Air compression system
Cooling system
Piping etc.
Total infrastructure costs are estimated to be around EGP 1.5 million for a facility of this size.
5.4.6 Area Required
The area required for this production line is estimated to be around 1,200 m2. The land is assumed to cost around
EGP 3,000 per m2, which amounts to EGP 3.6m for land acquisition. Building structure and office space is
estimated to cost an additional EGP 1.2m.
Important Note: Land is expected to be given for free in the Boghdadi industrial zone (IDA jurisdiction) by Luxor
governorate. However, it is sold against a fee in New Tiba (NUCA jurisdiction). To be conservative, land was
assumed to be bought against a fee.

Medium and Large Scale Investment Opportunities in Luxor
74
5.5 Selling, General and Administrative Expenses (SG&A)
This section provides details on the selling, general and administrative expenses associated with the facility,
otherwise known as overhead costs.
5.5.1 Salaries and Wages
This opportunity is expected to employ around 25 permanent staff plus an additional 30 seasonal workers (10
for each harvest season). They are summarized below:
Table 55 List of Staff and Monthly Salaries for Fruit and Vegetable Packing Line
Position Staff Monthly
Management
CEO 1 15.000
…
Production - Permanent
Plant Manager 1 10.000
Quality Control 2 6.000
Hall Supervisors 2 6.000
Engineering 2 5.000
Workers 2 3.000
…
Sales, General and Administration
Procurement 2 5.000
Sales Manager 1 8.000
Sales 2 5.000
Marketing 2 5.000
Finance & Accounting 1 5.000
HR Manager 1 10.000
Maintenance 4 3.000
Security 2 2.000
…
Total 25 staff
Salaries for permanent staff amount to EGP 134,000 per month in Year 1, which is EGP 1.6m total for the year.
That is only 4% of total revenue for Year 1.
Wages for seasonal workers amount to range between EGP 300,000 to EGP 450,000 for each harvest. This
assumes 10 workers per harvest season, getting paid between EGP 180-240 per ton of feedstock handled.
5.5.2 Factory
Factory overheads that fall outside human resource expenses and production costs are expected to be at a
minimum. Maintenance and storage costs are estimated to be around EGP 10,000 and EGP 20,000 per month
respectively.
5.5.3 Other Selling, General and Administrative
The main line item in this category is the marketing budget, which is determined as 7.5% of expected sales. This
amounts to EGP 9.8m for Year 1.
Utilities associated with administrative office space are expected to be around EGP 4,000 per month.

Medium and Large Scale Investment Opportunities in Luxor
75
5.6 Organizational Structure
5.6.1 Organizational Chart
5.7 Financial Analysis and Investment
This section provides details of revenues, cost of goods sold (variable costs), margin analysis by product, selling,
general and administrative (SG&A) expenses (aka overheads), fixed assets (initial capital expenditures) for the
first year. The total initial investment is provided, and a 10-year projection of the income statements and
statements of cash flow are calculated. Finally, the results of the feasibility and sensitivity analyses are provided
as a summary of the key findings of the financial model.
5.7.1 Revenues
The estimated revenues for Year 1 are summarized below:
Product Months of
Production
Total Tons
Produced
Selling Price
(EGP/ton)
Revenue (EGP 000s)
Fresh Tomatoes Jan - Mar 2,500 tons 16,000 40,000
Fresh Grapes Apr - May 1,250 tons 30,500 37,500
Fresh Mangoes Jun - Aug 1,875 tons 28,000 52,500
Total EGP 130,000
5.7.2 Cost of Goods Sold
The estimated total COGS for Year 1 are summarized below:
Inputs Quantity Units
Tomatoes
Tons bought 2,500 tons
Cost per ton 16 EGP 000s/ton
Cost per month 40,000 EGP 000s
CEO
Factory Plant Manager
Quality Control
Hall Supervisors
Engineering
Workers (Permanent)
Workers (Seasonal)
Administration
Procurement Manager
Sales Manager Sales Officers
Marketing Manager
Financial Manager
HR Manager Maintenance

Medium and Large Scale Investment Opportunities in Luxor
76
Grapes
Tons bought 1,250 tons
Cost per ton 30 EGP 000s/ton
Cost per month 37,500 EGP 000s
Mangoes
Tons bought 1,875 tons
Cost per ton 28 EGP 000s/ton
Cost per month 52,500 EGP 000s
Seasonal Labor
Workers – Tomatoes 450 EGP
Workers – Grapes 300 EGP
Workers - Mangoes 338 EGP
Packaging
Average of additional inputs (SO2, wax, materials,
etc.)
EGP 800 per 100kg
Cost per year 45,000 EGP 000s
Utilities
Electricity 647 EGP 000s
Gas - EGP 000s
Water 349 EGP 000s
Wastewater 300 EGP 000s
Total Utilities 1,297 EGP 000s
Total COGS 99,884 EGP 000s
5.7.3 Gross Margin Analysis by Product
Looking at each product’s line items separately, gross margin can be calculated to show how profitable each
product is and how much it contributes in covering overheads, ultimately increasing bottom line figures.
Packed Tomato Packed Grapes Packed Mangoes
EGP 000s EGP 000s EGP 000s
Revenues 40,000 37,500 52,500
Raw Material 10,000 12,500 30,000
Seasonal Labor 450 300 338
Packaging 20,000 10,000 15,000
Electricity 288 144 216
Gas - - -
Water 155 78 116
Wastewater 134 67 100
Total COGS 31,026 23,088 45,770
Gross Margin 22.4% 38.4% 12.8%
(-) Overheads 9.1% 9.1% 9.1%
Operating Margin 13.4% 29.4% 3.8%

Medium and Large Scale Investment Opportunities in Luxor
77
5.7.4 Selling, General and Administrative Expenses
SG&A for Year 1 is summarized below:
Human Resources EGP 000s
Total Permanent Staff Salaries 1,608
Overheads
Factory
Maintenance 120
Storage 240
General & Administrative -
Marketing (7.5% of Sales) 9,750
Utilities 48
Total Overheads 10,158
Total SG&A 11,766
5.7.5 Fixed Assets
The following table summarized the fixed assets (aka Property, Plant and Equipment) required for operation of
the facility, along with the associated yearly depreciation expense.
Fixed Assets Cost Dep. Life Yearly Dep. Exp.
EGP 000s EGP 000s
Production Line 7,700 10 yrs. 770
Infrastructure 2,000 15 yrs. 100
Building 1,000 30 yrs. 33
Office 200 10 yrs. 20
Land 3,600 0 yrs. N/A
Total CAPEX 14,000 923
5.7.6 Minimum Investment Required
The minimum investment required will be the total fixed asset purchases required for operation plus 6-months’
worth of working capital.
EGP 000s
Initial Capital Expenditures on Fixed Assets 14,000
Working Capital for 3 months 27,913
Total Investment Required 41,913
Important Note: A general assumption was made in all studies that at least 3 months of working capital be
covered in the initial investment. This clearly pushes up the initial ask in this particular case and can be reviewed
at the feasibility study stage.

Medium and Large Scale Investment Opportunities in Luxor
78
5.7.7 Projected Income Statements
The following is the projected income statements for the first 10 years of operation:
Table 56 Projected Income Statements for Fruit and Vegetable Packing Line

Medium and Large Scale Investment Opportunities in Luxor
79
5.7.8 Projected Cash Flow Statements
The following is the projected cash flow statements for the first 10 years of operation:
Table 57 Projected Cash Flow Statement for Fruit and Vegetable Packing Line

Medium and Large Scale Investment Opportunities in Luxor
80
5.7.9 Feasibility Analysis
The following table summarizes the key findings from the feasibility analysis:
Key Metric (based on 10-yr projections) Result (EGP 000s)
Capital Expenditures Required EGP 14,000
Working Capital Required for first 3 months EGP 27,913
Minimum Investment Required EGP 41,913
Direct Investment (Equity) EGP 12,574
Debt Financing EGP 29,339
Enterprise Value EGP 114,898
Internal Rate of Return 34%
Simple Payback 4.4 years
Discounted Payback 8.0 years
Profitability Index 2.74
5.7.10 Sensitivity Analysis
The feasibility of this opportunity will be most sensitive to fluctuations in crop prices. However, since the yields
are assumed at 100% (losses from off-specifications notwithstanding), as the crop undergoes little processing
and value addition is mainly in how it is packaged, there is no compounding effect as seen in other processes
with high conversion ratios.
Nonetheless, a calculation was made to see how far up prices can go up for each crop before their corresponding
operating margins reach 0%, while holding selling prices at current global prices for these products. The results
were as follows:
• Tomatoes can go up as high as EGP 6.14 per kg. This study assumes an average price of EGP 4.00 per
kg. A change of EGP 0.50 can change the gross margin by only 3%.
• Grapes can go up as high as EGP 18.81 per kg. This study assumes an average price of EGP 10.00 per kg.
A change of EGP 0.50 can change the gross margin by only 2%.
• Mangoes can go up as high as EGP 17.06 per kg. This study assumes an average price of EGP 16.00 per
kg. A change of EGP 0.50 can change the gross margin by only 2%.
This analysis shows that the grapes have the most value added out of the three crops, and therefore are less
susceptible to price fluctuations. Tomatoes and mangoes however, are already operating at low operating
margins (13.4% and 3.8% respectively), so have less room for prices to move before offloading that extra cost
down the value chain via higher selling prices.
5.8 Impact
Economic - Value added to local crops such as tomato and mangoes is quite significant. Based on this study’s
assumptions, before deducting other COGS and overheads:
• 1 kg of export-grade fresh tomatoes cost EGP 4 sold at EGP 18 (USD 1) – that is 78% value added to the
crop.
• 1kg of export-grade grapes cost EGP 10 sold at EGP 30 (USD 1.8) – that is 69% value added to the crop.
• 1kg of export-grade mangoes cost EGP 16 sold at EGP 30 (USD 1.7) – that is 47% value added to the
crop.

Medium and Large Scale Investment Opportunities in Luxor
81
Social - Direct jobs created by this facility will include 25 permanent plant staff plus another 30 seasonal workers.
Indirect jobs created will be mainly in logistics, marketing and distribution, and increased dedicated farming to
supply the plant over time.
Environmental – This opportunity will help decrease post-harvest losses as demand for raw materials for export
can reduce oversupply and improve quality of harvest.

Medium and Large Scale Investment Opportunities in Luxor
82
6 IO5 - Medium Density Fiberboard Production Facility
6.1 Overview
This opportunity aims to add value to the large amount of agricultural waste generated in and around Luxor.
Bagasse, which is the fiber discarded from the process of sugar production from sugarcane, is considered a high-
quality material input for the production of medium density fiberboard, or MDF. Establishing an MDF production
facility in Luxor makes sense to be close to the sugar production facilities in the region and will add significant
value to sugarcane bagasse.
The potential here lies mainly in the local market as Egypt imports a significant amount of MDF, and wood in
general. Export markets do have potential as well since MDF made from bagasse can meet export quality
standards. MDF boards are used mainly in furniture and fixtures, and are commonly used as a replacement for
natural wood boards.
6.2 Market Demand
This section provides a description of the products and targeted markets, including a brief analysis on the current
market structure, the potential for import substitution and export where applicable.
6.2.1 Product Description
This opportunity looks at producing one product only:
Product A: Medium Density Fiberboard (MDF) panels with the following
specifications:
• Dimensions of 1220mm x 2440mm – this is the standard area used in
the market and most widely circulated. The panels then get modified
according to their end use as they move up the value chain to
customers.
• Thickness 3mm and 25mm, this study assumes 16mm.
• Density between 600-800 kg/m3, study assumes 680 kg/m3, as it is the
most common density used.
Important Note: It is important to determine the dimensions and density of the final product as it affects
conversion ratios of the raw material (sugarcane bagasse, bought in tons) and the final product (MDF panels,
sold in m3). The higher the thickness, the lower the output of panels per m3, which lowers yield and revenues.
The higher the density, the more raw materials required per m3, which increases input costs.
6.2.2 Current Market Structure
Egypt lacks sources of natural wood and therefore imports all kinds of wood (and paper). Local production has
not been able to keep up with local demand for these products. Egypt imported over USD 70m of MDF boards
alone in 2016 (last 5-year average is around USD 67m), with negligible exports to offset the balance. The
following figure shows import-export trends in the last 5 years.
For illustrative purposes only.

Medium and Large Scale Investment Opportunities in Luxor
83
Figure 19 Egypt Export vs Import in USD for years 2012-2016 for MDF
This shows a clear gap in the market. Local production capacity does not satisfy local demand. Hence, local MDF
production is a pure import substitution play. This suggests that target market size is at least USD 70m per year,
to at least cover local demand and reduce imports. The main suppliers are China, Indonesia and Romania, as
shown in the following table.
Table 58 Egypt’s Top Exporters of MDF in 2016
Value
imported in
2016 (USD
thousands)
Share in
Egypt's
imports (%)
Quantity
imported in
2016
Average Price
per ton (USD
thousands)
1 China 20,878 30.2 31,361 0.67
2 Indonesia 16,447 23.8 24,707 0.67
3 Romania 11,314 16.4 16,995 0.67
4 Italy 6,376 9.2 9,577 0.67
5 Malaysia 4,354 6.3 6,540 0.67
With growing domestic demand, the gap is expected to become wider. Locally manufactured MDF panels can
easily compete with the quality of imported materials. MDF made from sugarcane bagasse is known for its high
quality and there is potential to leverage the amounts of bagasse available in Upper Egypt to satisfy local demand
for wood and its alternatives.
6.2.3 Target Market Size
The trailing 5-year average for values exported and imported in the two categories are as follows:
Table 59 Target Market Size for MDF
5-yr trailing average 2012-2016
(USD thousands)
MDF Target % Target Value
Export 651 0% 0
Import 67,008 100% 67,008
USD 67,659 USD 67,008
Since this is primarily an import substitution play, the target market should be at least to substitute 100% of
import requirements. This brings the total estimated target market size to USD 67.0m (EGP 1.21bn).
Expected Selling Prices: The markets to target are mainly local and compete with imports of similar goods. This
makes price competition a key strategy. As shown in the market data for imports, the average price for a ton of
1,1
54
74
4
1,2
22
13
6
1 65
1
57
,67
8
50
,31
8 69
,05
2 88
,85
5
69
,13
6
67
,00
8
2 0 1 2 2 0 1 3 2 0 1 4 2 0 1 5 2 0 1 6 5 - Y R A V G
Export Import

Medium and Large Scale Investment Opportunities in Luxor
84
MDF was around USD 670 per ton. Assuming a density of 680 kg/m3, that translates to USD 985 (EGP 17,700)
per m3. This number seemed too optimistic however, and primary data collection from the local market
suggested that the price is in the EGP 10,000 – 13,000 range per m3. This study assumes the lowest of the range
at EGP 10,000 per m3.
6.2.4 Estimated Annual Sales and Forecasts
The plant, described in more detail under Project Engineering, is assumed to start operating at 50% capacity in
Year 1 and reach around 91% by Year 10 as part of the conservative assumptions typical resorted to in the
present document. Revenue growth forecasts to account for in price inflation and better capacity utilization in
subsequent years are assumed, with an aggressive marketing push in the first 5 years, as shown in Annex I.
This translates to estimated production and annual sales for Year 1 as follows:
25,500 m3 of MDF panels, bringing in EGP 255m in revenue.
The following graph shows a comparison of the target market and expected revenues in the first five years.
Figure 20 Comparison between Target Market Size and Year 1-5 Revenues for MDF Production Line
6.2.5 Estimated Marketing Costs
Marketing the product as an alternative to imported wood may require a considerable budget and it is assumed
that the marketing budget will account for around 7.5% of sales targets stated above. These sales targets after
all are highly contingent on aggressive marketing before operations. This brings the total marketing budget for
Year 1 to EGP 19.13m.
6.3 Direct Inputs Required
This section describes the main raw materials required for the process, including other inputs such as additives,
etc., as well as the expected costs, their availability (including seasonality when referring to crops) and any risks
expected in securing each input and how to mitigate it. It also shows the utilities required, specific consumption
benchmarks used, as well as direct labor requirements and any other direct inputs.
6.3.1 Material Required
This opportunity relies on sugarcane bagasse as a primary raw material. Other types of agricultural waste can
be put in the mix, but this study assumes 100% reliance on bagasse, as the non-wood fiber required to
manufacture MDF. The following table provides the figures for feddans cultivated and tons produced are
EGP
12
60
m
EGP
12
60
m
EGP
25
5m
EGP
64
0m
C U R R E N T I M P O R T S ( 2 0 1 6 )
T A R G E T S U B S T I T U T I O N ( P O S T - 2 0 1 7 )
Y E A R 1 ( 2 0 1 8 ) R E V E N U E S
Y E A R 5 ( 2 0 2 3 ) R E V E N U E S

Medium and Large Scale Investment Opportunities in Luxor
85
according to figures provided by the CAPMAS Annual Bulletin for Statistical Crop Area and Plant Production for
the years 2014-2015.
Table 60 Production Schedule according to Seasonality of Sugarcane in Luxor and Qena
Crop Name
Luxor Qena Seasonality / Production Schedule
feddans tons feddans tons Jan
Feb
Mar
Ap
r
May
Jun
Jul
Au
g
Sep
Oct
No
v
Dec
Sugarcane 67,422 3,257,224 118,089 5,690,000 x x x x x x
Based on Ministry of Agriculture 2014 data, there is enough local supply in Southern Upper Egypt (which includes
Luxor, Qena, Sohag, Aswan and Assiut), it is estimated that sugarcane fields in the region (Luxor, Qena, Sohag,
Aswan) generate over 1 million tons of waste per year. Furthermore, sugar factories in the region such as in Qus
and Armant are significant sources of bagasse. Armant alone generates around 62,000 tons of unused bagasse
annually.
Sugarcane bagasse will likely be sourced from nearby sugar factories. They are priced comparably to the price
of fuels like mazut since the waste bagasse is normally re-used as an alternative fuel in the sugar refining process.
It is assumed that 5 tons of bagasse are equivalent to 1 ton of mazut, which is currently priced at a maximum of
EGP 3,500 per ton (this is the price cement factories pay for, other industries only pay EGP 2,500 per ton). This
brings the price of 1 ton of sugarcane bagasse to EGP 700. However, it is expected a premium will be paid to
secure supply, so 1 ton will cost no less than EGP 1,000.
6.3.2 Resin Required
Another major input is urea formaldehyde (UF) which is the main resin used in this production process. The
following table shows the specifications normally used.
Table 61 Urea Formaldehyde Specifications Required in MDF Production Process
Item Value
Solid Content 60 %
PH 6.8-7.1
Viscosity 30-45 sec
Density 1.28 g/cm3
Gel time 50- 65 sec
Free Formaldehyde 2 % max.
It is calculated that for every cubic meter of MDF produced, 90 kg of UF is required. UF is manufactured in Egypt
at a handful of facilities and is sold for EGP 15 per kg.
6.3.3 Transportation
Transportation costs were also accounted for in this study. It is expected that the facility will bear the costs of
transporting the product to the local markets, which are concentrated up north in the Delta region (Damietta
furniture cluster, etc.). Transporting such a heavy product will incur costs deemed material to this study. It is
assumed that each ton transported will cost around EGP 500, which translates to around EGP 515 per m3 of MDF
produced.

Medium and Large Scale Investment Opportunities in Luxor
86
6.3.4 Utilities
Assuming today’s tariffs for electricity, natural gas and water, the following specific consumption rates were
calculated for the main product. The main utilities are thermal for pressing, and water/wastewater for
cooking/de-fibering, with medium electricity requirements7.
Table 62 Specific Consumption and Expected Cost per ton for Year 1
Specific Consumption Expected Bill
Utilities
Electricity 300 kWh/m3 230.10 EGP/m3
Gas 1,000 kWh/m3 310.00 EGP/m3
Water 2 m3/m3 6.20 EGP/m3
Wastewater 2 m3/m3 5.34 EGP/m3
The above tariffs are for the fiscal year 2017/2018 and are assumed to be tied to inflation projections over the
consequent years.
6.3.5 Direct Labor
Seasonal labor will be required during the months of production and its estimated that a total of 30 workers will
be required, working in groups of 15 for each of the two shifts per day. The following table shows how many
workers will be required during the sugarcane harvest.
Table 63 Seasonal Labor Required for MDF Production
Production – Seasonal No. of Workers EGP per ton handled
Workers per Season 30 50
6.4 Project Engineering
This section describes the production process in detail, any specific technologies used, the estimated plant
capacity, as well as the main components required along with an estimate for civil engineering works (factory
infrastructure, etc.) and the total area required.
6.4.1 Description of Technology
The MDF production line uses industry standard technology that is available from a few countries. The
production line cannot be sourced locally, it is usually imported from countries like Italy and Japan, who are
known for their specialty in manufacturing these lines. There are providers from China as well that can
manufacture similar lines, albeit at lower capacities.
This study assumes that a refurbished production line will be imported from Japan and re-assembled at the
selected site (i.e. not newly manufactured, but previously used and decommissioned).
6.4.2 Estimated Plant Capacity
The plant capacity is estimated to produce a maximum of 340 m3 of MDF per day (assuming 22 hours of
operation, two shifts plus maintenance). As stated in the product description, it is important to note the
7 The specific consumption rates were obtained from the European Commission’s (EC) Best Available Techniques Reference Documents (BREFs) as well as the SCOoPE project, also funded by the EC, as well as from industry experts and practitioners.

Medium and Large Scale Investment Opportunities in Luxor
87
dimensions and density of the panels, as it affects the yield of the feedstock. It is assumed that around 30% of
losses in mass occur during the drying stage, as moisture content (MC) is reduced.
The following table summarizes the conversion ratios used in the study.
Table 64 Conversion Ratio for MDF
Feedstock Max.
Output
(m3/day)
Density of
MDF
(kg/m3)
Input
(tons/day) –
assuming
no losses
Conversion
Ratio
Factor in
MC Losses
Final Input
(tons/day)
Final
Conversion
Ratio
Bagasse 340 680 230 1.48 30% 330 1.03
6.4.3 Process Flow
The process is illustrated in the following figure.
Figure 21 Process Flow Diagram of MDF Production
The process steps illustrated are described in detail in the following table.
Table 65 Step-by-Step Details of MDF Production Process
# Name Description
Step 1 Receiving Raw
Material
Sugarcane bagasse is received in loading area and prepared for chipping step.
Step 2 Chipping / Milling Bagasse is taken through knife system to be cut up and sliced into smaller pieces. A
disc or drum chipper is used to produce chips of bagasse. Each particle reduction
(milling) process will produce a range of particle sizes. Different chip size/type used
for surface and core layers –fine chips or particles on the surface (good finish),
coarser chips in the core. It is important to produce chip surfaces with as little
damage as possible to improve particle-particle bonding; a mechanically weak
surface layer will lead to possible break-down of the glue-line, resulting in degraded
board properties.
Step 3 Steaming / De-
Fibering
Batch steaming system is used for cooking the bagasse. A sufficient quantity of
bagasse is transferred into the steaming vessel and saturated steam is then
injected. After a short pre-steaming time to equalize the steam pressure and
temperature inside the steaming vessel, the exhaust valve is closed, and steam
pressure and temperature are raised up to the start point of steaming condition.
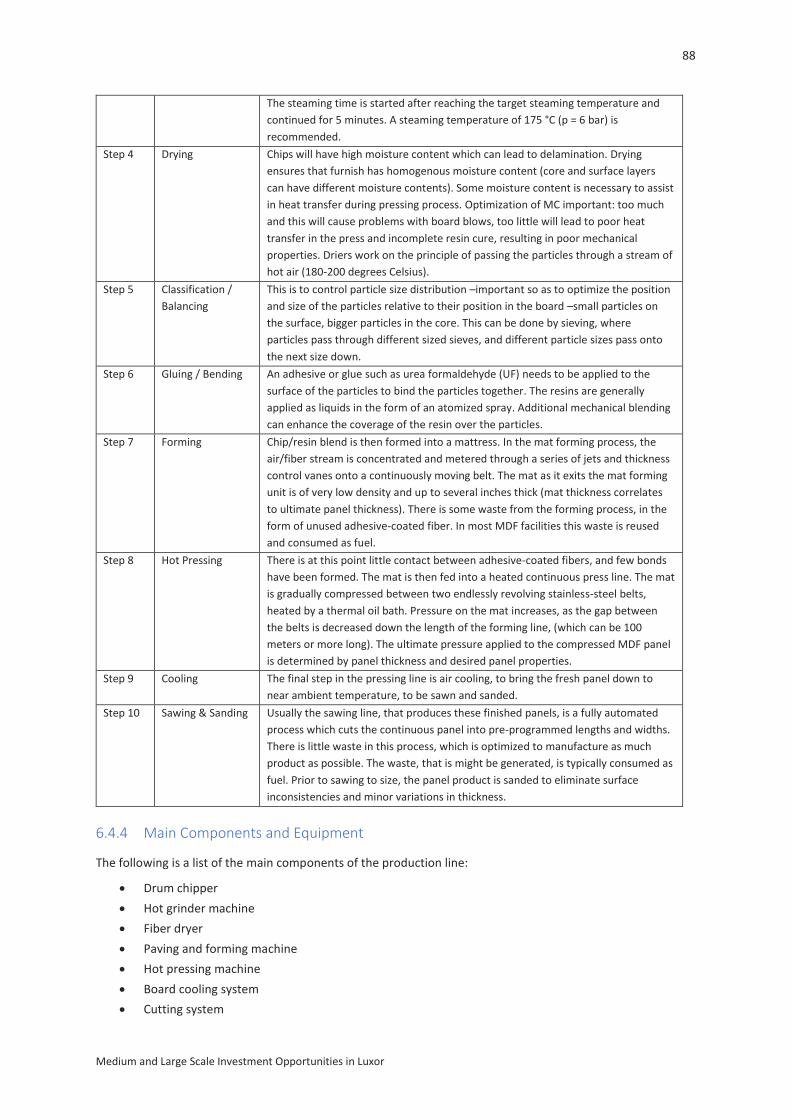
Medium and Large Scale Investment Opportunities in Luxor
88
The steaming time is started after reaching the target steaming temperature and
continued for 5 minutes. A steaming temperature of 175 °C (p = 6 bar) is
recommended.
Step 4 Drying Chips will have high moisture content which can lead to delamination. Drying
ensures that furnish has homogenous moisture content (core and surface layers
can have different moisture contents). Some moisture content is necessary to assist
in heat transfer during pressing process. Optimization of MC important: too much
and this will cause problems with board blows, too little will lead to poor heat
transfer in the press and incomplete resin cure, resulting in poor mechanical
properties. Driers work on the principle of passing the particles through a stream of
hot air (180-200 degrees Celsius).
Step 5 Classification /
Balancing
This is to control particle size distribution –important so as to optimize the position
and size of the particles relative to their position in the board –small particles on
the surface, bigger particles in the core. This can be done by sieving, where
particles pass through different sized sieves, and different particle sizes pass onto
the next size down.
Step 6 Gluing / Bending An adhesive or glue such as urea formaldehyde (UF) needs to be applied to the
surface of the particles to bind the particles together. The resins are generally
applied as liquids in the form of an atomized spray. Additional mechanical blending
can enhance the coverage of the resin over the particles.
Step 7 Forming Chip/resin blend is then formed into a mattress. In the mat forming process, the
air/fiber stream is concentrated and metered through a series of jets and thickness
control vanes onto a continuously moving belt. The mat as it exits the mat forming
unit is of very low density and up to several inches thick (mat thickness correlates
to ultimate panel thickness). There is some waste from the forming process, in the
form of unused adhesive-coated fiber. In most MDF facilities this waste is reused
and consumed as fuel.
Step 8 Hot Pressing There is at this point little contact between adhesive-coated fibers, and few bonds
have been formed. The mat is then fed into a heated continuous press line. The mat
is gradually compressed between two endlessly revolving stainless-steel belts,
heated by a thermal oil bath. Pressure on the mat increases, as the gap between
the belts is decreased down the length of the forming line, (which can be 100
meters or more long). The ultimate pressure applied to the compressed MDF panel
is determined by panel thickness and desired panel properties.
Step 9 Cooling The final step in the pressing line is air cooling, to bring the fresh panel down to
near ambient temperature, to be sawn and sanded.
Step 10 Sawing & Sanding Usually the sawing line, that produces these finished panels, is a fully automated
process which cuts the continuous panel into pre-programmed lengths and widths.
There is little waste in this process, which is optimized to manufacture as much
product as possible. The waste, that is might be generated, is typically consumed as
fuel. Prior to sawing to size, the panel product is sanded to eliminate surface
inconsistencies and minor variations in thickness.
6.4.4 Main Components and Equipment
The following is a list of the main components of the production line:
Drum chipper
Hot grinder machine
Fiber dryer
Paving and forming machine
Hot pressing machine
Board cooling system
Cutting system

Medium and Large Scale Investment Opportunities in Luxor
89
Sanding system
The production line is imported all together. The price for the line is provided as a lump-sum below.
Table 66 Price Estimate for MDF Production Line
Maximum Capacity Total Lump-Sum Price in EGP
Daily Output of 340 m3 of MDF panels USD 3.3m (EGP 59.4m)
The estimated useful life of this production line, assuming proper maintenance and care, can go up to 15 years.
6.4.5 Civil Engineering Works
In addition to the production line, there are key components of the factory’s infrastructure that need to be
considered, such as:
Boiler system for heating oil
Electrical Generator
Air compression system
Cooling system
Piping etc.
Total infrastructure costs are estimated to be around EGP 2.0 million for a facility of this size.
6.4.6 Area Required
The area required for this production line is estimated to be around 1,500 m2. The land is assumed to cost around
EGP 3,000 per m2, which amounts to EGP 4.5m for land acquisition. Building structure and office space is
estimated to cost an additional EGP 1.2m.
Important Note: Land is expected to be given for free in the Boghdadi industrial zone (IDA jurisdiction) by Luxor
governorate. However, it is sold against a fee in New Tiba (NUCA jurisdiction). To be conservative, land was
assumed to be bought against a fee.
6.5 Selling, General and Administrative Expenses (SG&A)
This section provides details on the selling, general and administrative expenses associated with the facility,
otherwise known as overhead costs.
6.5.1 Salaries and Wages
This opportunity is expected to employ around 28 permanent staff plus an additional 30 seasonal workers (2x15
for the season). They are summarized below:
Table 67 List of Staff and Monthly Salaries for MDF Production Line
Position Staff Monthly
Management
CEO 1 15.000
…
Production - Permanent
Plant Manager 1 10.000
Quality Control 2 6.000
Hall Supervisors 2 6.000
Engineering 2 5.000

Medium and Large Scale Investment Opportunities in Luxor
90
Workers 4 3.000
…
Sales, General and Administration
Procurement 2 5.000
Sales Manager 1 8.000
Sales 2 5.000
Marketing 2 5.000
Finance & Accounting 2 5.000
HR Manager 1 10.000
Maintenance 4 3.000
Security 2 2.000
…
Total 28 staff
Salaries for permanent staff amount to EGP 145,000 per month in Year 1, which is EGP 1.74m total for the year.
That is only 1% of total revenue for Year 1.
Wages for seasonal workers amount to EGP 1.24m for each production season. This assumes 30 workers per
season, getting paid between EGP 50 per ton of feedstock handled.
6.5.2 Factory
Factory overheads that fall outside human resource expenses and production costs are expected to be at a
minimum. Maintenance and storage costs are estimated to be around EGP 10,000 and EGP 15,000 per month
respectively.
6.5.3 Other Selling, General and Administrative
The main line item in this category is the marketing budget, which is determined as 7.5% of expected sales. This
amounts to EGP 19.13m for Year 1.
Utilities associated with administrative office space are expected to be around EGP 4,000 per month.

Medium and Large Scale Investment Opportunities in Luxor
91
6.6 Organizational Structure
6.6.1 Organizational Chart
6.7 Financial Analysis and Investment
This section provides details of revenues, cost of goods sold (variable costs), margin analysis by product, selling,
general and administrative (SG&A) expenses (aka overheads), fixed assets (initial capital expenditures) for the
first year. The total initial investment is provided, and a 10-year projection of the income statements and
statements of cash flow are calculated. Finally, the results of the feasibility and sensitivity analyses are provided
as a summary of the key findings of the financial model.
6.7.1 Revenues
The estimated revenues for Year 1 are summarized below:
Product Months of
Production
Total m3
Produced
Selling Price
(EGP/m3)
Revenue (EGP 000s)
MDF Panels Dec – May 25,502 tons 10,000 255,024
6.7.2 Cost of Goods Sold
The estimated total COGS for Year 1 are summarized below:
Inputs Quantity Units
Sugarcane
Tons bought 24,750 tons
Cost per ton 2,000 EGP/ton
Cost per year 49,500 EGP 000s
Additives – UF Resin
Tons bought 2,295 tons
Cost per ton 20,000 EGP/ton
CEO
Factory Plant Manager
Quality Control
Hall Supervisors
Engineering
Workers (Permanent)
Workers (Seasonal)
Administration
Procurement Manager
Sales Manager Sales Officers
Marketing Manager
Financial Manager
HR Manager Maintenance

Medium and Large Scale Investment Opportunities in Luxor
92
Cost per year 45,904 EGP 000s
Seasonal Labor
Workers 1,238 EGP
Transportation
Cost per ton 500 EGP/ton
Cost per m3 515 EGP/ton
Cost per year 13,139 EGP 000s
Utilities
Electricity 5,868 EGP 000s
Gas 7,906 EGP 000s
Water 158 EGP 000s
Wastewater 136 EGP 000s
Total Utilities 14,068 EGP 000s
Total COGS 87,623 EGP 000s
6.7.3 Gross Margin Analysis by Product
Looking at each product’s line items separately, gross margin can be calculated to show how profitable each
product is and how much it contributes in covering overheads, ultimately increasing bottom line figures.
MDF Panels
EGP 000s
Revenues 255,024
Raw Material 49,500
Resin 45,904
Seasonal Labor 1,238
Transportation 13,139
Electricity 5,868
Gas 7,906
Water 158
Wastewater 136
Total COGS 126,164
Gross Margin 50.5%
(-) Overheads 8.3%
Operating Margin 42.2%
6.7.4 Selling, General and Administrative Expenses
SG&A for Year 1 is summarized below:
Human Resources EGP 000s
Total Permanent Staff Salaries 1,740
Overheads
Factory
Maintenance 120
Storage 180

Medium and Large Scale Investment Opportunities in Luxor
93
General & Administrative -
Marketing (7.5% of Sales) 19,127
Utilities 48
Total Overheads 19,475
Total SG&A 21,215
6.7.5 Fixed Assets
The following table summarized the fixed assets (aka Property, Plant and Equipment) required for operation of
the facility, along with the associated yearly depreciation expense.
Fixed Assets Cost Dep. Life Yearly Dep. Exp.
EGP 000s EGP 000s
Production Line 59,400 10 years 5,940
Infrastructure 2,000 15 years 133
Building 1,000 30 years 33
Office 200 10 years 20
Land 4,500 0 years N/A
Total CAPEX 67,100 6,127
6.7.6 Minimum Investment Required
The minimum investment required will be the total fixed asset purchases required for operation plus 3-months’
worth of working capital.
EGP 000s
Initial Capital Expenditures on Fixed Assets 67,100
Working Capital for 3 months 36,266
Total Investment Required 103,366
Important Note: A general assumption was made in all studies that at least 3 months of working capital be
covered in the initial investment. This clearly pushes up the initial ask in this particular case and can be reviewed
at the feasibility study stage.

Medium and Large Scale Investment Opportunities in Luxor
94
6.7.7 Projected Income Statements
The following is the projected income statements for the first 10 years of operation:
Table 68 Projected Income Statements for MDF Production Line (EGP thousands)

Medium and Large Scale Investment Opportunities in Luxor
95
6.7.8 Projected Cash Flow Statements
The following is the projected cash flow statements for the first 10 years of operation:
Table 69 Projected Cash Flow Statement for MDF Production Line (EGP thousands)

Medium and Large Scale Investment Opportunities in Luxor
96
6.7.9 Feasibility Analysis
The following table summarizes the key findings from the feasibility analysis:
Key Metric (based on 10-yr projections) Result (EGP 000s)
Capital Expenditures Required EGP 67,100
Working Capital Required for first 3 months EGP 36,266
Minimum Investment Required EGP 103,366
Direct Investment (Equity) EGP 31,010
Debt Financing EGP 72,356
Enterprise Value EGP 917,367
Internal Rate of Return 73%
Simple Payback 2.8 years
Discounted Payback 2.3 years
Profitability Index 8.87
6.7.10 Sensitivity Analysis
The feasibility of this opportunity will be most sensitive to fluctuations in bagasse prices. Holding all other
relevant factors constant, such as MDF target density, resin prices, moisture content loss during production, etc.
a calculation was made to see how far up prices can go before operating margins reach 0%, while holding selling
prices at EGP 10,000. The results were as follows:
• Bagasse can go up as high as EGP 6,900 per ton. This study assumes an average price of EGP 2,000 per kg
only, which is already quite conservative, as market prices are currently at EGP 700-1,000 per ton.
Since resin is an important factor, and contributes to around 39.3% of COGS, the sensitivity of its price was also
calculated, holding the other variables constant:
• UF resin can go as high as EGP 77.66 per kg. This study assumes prices of EGP 20.00 per kg, which are
higher than current market prices of EGP 15.00 per kg.
It is clear from the above that this opportunity creates value, as it takes very cheap raw materials such as
sugarcane bagasse that is normally regarded as waste, and creates a product that is in huge demand locally and
is currently being heavily imported each year to meet growing demand.
6.8 Impact
Economic - Value added to local agricultural waste is quite significant. Based on this study’s assumptions, before
deducting other COGS and overheads, 680 kg of bagasse, costing EGP 680, produces 1 m3 of MDF panels, selling
at EGP 6,000 per m3 – that is 89% value added to the waste.
Social - Direct jobs created by this facility will include 28 permanent plant staff plus another 30 seasonal workers.
Indirect jobs created will be mainly in logistics, marketing and distribution.
Environmental – This opportunity helps mitigate open burning of agricultural waste and therefore reducing
carbon emissions.

Medium and Large Scale Investment Opportunities in Luxor
97
7 IO6 Biomass Fuel Pellets Production Facility
7.1 Overview
This opportunity takes advantage of local waste streams, mainly sugarcane residue, corn stalk, as well as wood
cuttings and sawdust, palm tree fronds and banana tree leaves. The final product is high-calorific value biomass
pellets that can be burned on-site at energy intensive factories such as cement kilns. With growing energy
demand from local industries and increasing political will to enable the use of such technologies and valorize
abundant supplies of agricultural waste, this opportunity fills a clear market gap that has already seen players
enter in the last few years, especially with the backdrop of conventional energy subsidy removal.
The potential mainly lies in serving local energy-intensive industries, which have already started preparing their
factories to receive alternative fuels, such as the cement plants in Qena and Assiut. However, for this opportunity
to remain financially sustainable, more than half the production must be aimed towards export to take
advantage of higher selling prices abroad.
7.2 Market Demand
This section provides a description of the products and targeted markets, including a brief analysis on the current
market structure, the potential for import substitution and export where applicable.
7.2.1 Product Description
This opportunity looks at producing one product only:
Product A: biomass pellets made from agriwaste,
mainly sugarcane residue and corn stalk, with calorific
value of at least 5,000 kcal/kg.
7.2.2 Current Market Structure
One way to assess local demand for fuel pellets is to look at the thermal needs of local cement production. Local
cement producers are the primary target market segment, as their demand for thermal energy is growing. This
sector suffered from shortages in natural gas in recent years, which saw it switch to other sources such as coal.
This switch was controversial, as not only it is polluting, but it had to be imported as Egypt does not produce any
coal. Biomass fuel pellets provide a cleaner, local abundant alternative that is already in high demand by local
cement plants all over the country.
The IFC conducted a valuable study, published in 2016, that provides data on clinker production in Egypt and
the associated thermal needs, with projections to the future. They are summarized in the following table.
Table 70 Local Clinker Production (IFC, 2016)
Unit 2015 2020 2025
Clinker Production million tons 48.70 62.10 72.00
Thermal Consumption million gcal 46.00 58.70 68.00
Thermal Consumption gcal/ton 0.94 0.95 0.94
The associated thermal consumption can be used to estimate the amount of pellets required. Assuming that a
ton of pellets provides 5 gcal (i.e. 5 kcal per kg) and is sold at EGP 600 per ton, the above thermal consumption
forecasts can be translated to tonnage and market value. The following table summarizes the calculations.
For illustrative purposes only.

Medium and Large Scale Investment Opportunities in Luxor
98
Table 71 Thermal Consumption Needs in Pellet Equivalent (IFC, 2016)
Unit 2015 2020 2025
Equivalent in Pellets million tons 9.20 11.74 13.60
Equivalent in Pellets millions EGP 5,520.00 7,044.00 8,160.00
Equivalent in Pellets millions USD 306.67 391.33 453.33
The numbers above provide a measure of thermal demands of the cement industry on a national scale.
Estimating thermal demands on a more local scale, the two major cement plants in Qena governorate were
selected; Misr Qena and El Nahda plants. Redoing the same calculations above, and assuming no future increase
in current capacities, the thermal needs of these two local plants are summarized below.
Table 72 Thermal Consumption Needs in Pellet Equivalent for Local Plants
Unit Current
Misr Qena million tons 1.40
El Nahda million tons 1.71
Total Production Capacity million tons 3.11
Thermal Consumption million gcal 2.94
Equivalent in Pellets million tons 0.59
Equivalent in Pellets millions EGP 352.51
Equivalent in Pellets millions USD 19.58
From an export perspective, Egypt currently does poorly. In 2016, Egypt exported 611 tons of “wood pellets”
according to Trade Map, which are worth USD 92,000 only, to two countries; Italy and Cyprus. Looking at the
top importing countries in Europe alone, the market potential is huge. The following table shows the top
European countries that import “wood pellets”, the category which includes wood pellets burnt for fuel. The
data available does not distinguish fuel pellets separately.
Table 73 Top Importing European Markets of Wood Pellets
Value imported in
2016 (USD
thousand)
Quantity imported
in 2016
Quantity Unit Unit value
(USD/unit)
1 United Kingdom 1,237,511 7,086,469 tons 175
2 Italy 317,709 1,663,820 tons 191
3 Denmark 298,185 2,053,682 tons 145
4 Belgium 155,205 906,477 tons 171
5 Germany 70,563 422,808 tons 167
Total Imported 12.13 million tons 170 (avg./ton)
Thermal Equivalent 60.67 million gcal
Total Value 1,819.99 million USD
This opportunity requires a portion of the production to be directed towards export due to better selling prices
and therefore make the investment attractive. Thermal energy demand by European industry as shown above
is high and is expected to keep growing. Furthermore, European industry is already sold on the idea of biomass
pellets as an alternative fuel and is equipped to take advantage of it technologically.
7.2.3 Target Market Size
Assuming 20% of the European wood pellet market is used as alternative fuel, and assuming that only the local
cement industry accounts for total potential local demand for biomass fuel pellets, the overall market size can
be determined. The target market share is only 5% of the export potential and 10% of local consumption, as

Medium and Large Scale Investment Opportunities in Luxor
99
constrained by the capacities of this plant. The attractiveness of this opportunity is there is ample demand both
locally and abroad, and this can be captured with subsequent investments in capacity.
Table 74 Target Market Size for Pellets
5-yr trailing average 2012-2016
(USD thousands)
Pellets Target % Target Value
Export to European Industry 363,998 5% 18,200
Local Cement Industry 306,667 10% 30,667
USD 670,664 USD 48,867
Expected Selling Prices: As stated before, the selling prices will differ from local and export, and because of this
discrepancy it is vital to export a portion to make the opportunity feasible. Local selling prices are expected to
be around EGP 600 per ton, while export prices can go higher than USD 170 per ton. This study assumed the
local to export ration at 1:1 (50% each), selling locally at EGP 600 per ton at current market rates, and exporting
at USD 150 (EGP 2,700). This brings the average price sold to EGP 1,650 per ton.
7.2.4 Estimated Annual Sales and Forecasts
The plant, described in more detail under Project Engineering, is assumed to start operating at 50% capacity in
Year 1 and reach around 91% by Year 10 as part of the conservative assumptions typical resorted to in the
present document. Revenue growth forecasts to account for in price inflation and better capacity utilization in
subsequent years are assumed, with an aggressive marketing push in the first 5 years, as shown in Annex I.
This translates to estimated production and annual sales for Year 1 as follows:
33,750 tons of biomass fuel pellets, bringing in EGP 55.7m in revenue.
The following graph shows a comparison of the target market and expected revenues in the first five years.
Figure 22 Comparison between Target Market Size and Year 1-5 Revenues for Biomass Fuel Pellets Production Line
7.2.5 Estimated Marketing Costs
Marketing the product on the global stage will require a considerable budget and it is assumed that the
marketing budget will account for around 7.5% of sales targets stated above. These sales targets after all are
highly contingent on aggressive marketing before operations. This brings the total marketing budget for Year 1
to EGP 4.18m.
EGP
12
07
2m
EGP
88
0m
EGP
56
m
EGP
14
0m
C U R R E N T V A L U E ( 2 0 1 6 ) T A R G E T M A R K E T ( P O S T -2 0 1 7 )
Y E A R 1 ( 2 0 1 8 ) R E V E N U E S
Y E A R 5 ( 2 0 2 3 ) R E V E N U E S

Medium and Large Scale Investment Opportunities in Luxor
100
7.3 Direct Inputs Required
This section describes the main raw materials required for the process, including other inputs such as additives,
etc., as well as the expected costs, their availability (including seasonality when referring to crops) and any risks
expected in securing each input and how to mitigate it. It also shows the utilities required, specific consumption
benchmarks used, as well as direct labor requirements and any other direct inputs.
7.3.1 Material Required
This opportunity relies on sugarcane residue and corn stalk as a primary raw material. Other types of agricultural
waste can be put in the mix, and the production schedule is not expected to be affected by seasonality of the
two crops. It is assumed that production will be consistent throughout the year by making up for seasonal gaps
through storage and sourcing other kinds of agricultural waste such as wood cuttings and sawdust, palm tree
fronds and banana tree leaves
The following table provides the figures for feddans cultivated and tons produced are according to figures
provided by the CAPMAS Annual Bulletin for Statistical Crop Area and Plant Production for the years 2014-2015.
Table 75 Seasonality of Sugarcane and Corn in Luxor and Qena
Crop Name
Luxor Qena Seasonality
feddans tons feddans tons Jan
Feb
Mar
Ap
r
May
Jun
Jul
Au
g
Sep
Oct
No
v
Dec
Sugarcane 67,422 3,257,224 118,089 5,690,000 x x x x x x
Corn 24,999 46,890 80,283 130,591 x x
Based on Ministry of Agriculture 2014 data, there is enough local supply in Southern Upper Egypt (which includes
Luxor, Qena, Sohag, Aswan and Assiut), it is estimated that sugarcane fields in the region (Luxor, Qena, Sohag,
Aswan) generate over 1 million tons of waste per year. Corn fields in the same area are estimated to generate a
further 186 thousand tons of waste. Other sources include tree trimmings and wood cuttings/sawdust. This
more than covers the material needs of the facility.
It is expected that a ton of mixed agricultural waste will cost an average of EGP 500 per ton.
7.3.2 Utilities
Assuming today’s tariffs for electricity, natural gas and water, the following specific consumption rates were
calculated for the main product. The main utilities are thermal for pressing, and water/wastewater for
cooking/de-fibering, with medium electricity requirements8.
Table 76 Specific Consumption and Expected Cost per ton for Year 1
Specific Consumption Expected Bill
Utilities
Electricity 30.00 kWh/ton 23.01 EGP/ton
Diesel 3.40 liter/ton 12.41 EGP/ton
Water 0 m3/ton 0.00 EGP/ton
Wastewater 0 m3/ton 0.00 EGP/ton
8 The specific consumption rates were obtained from the European Commission’s (EC) Best Available Techniques Reference Documents (BREFs) as well as the SCOoPE project, also funded by the EC, as well as from industry experts and practitioners.

Medium and Large Scale Investment Opportunities in Luxor
101
The above tariffs are for the fiscal year 2017/2018 and are assumed to be tied to inflation projections over the
consequent years.
7.3.3 Direct Labor
Manual labor will be required during the months of production and its estimated that a total of 30 workers will
be required, working in groups of 15 for each of the two shifts per day. The following table shows how many
workers will be required for production.
Table 77 Seasonal Labor Required for Biomass Fuel Pellets Production
Production – Seasonal No. of Workers EGP per ton handled
Workers per Season 10 10
7.3.4 Packaging
The final product is usually packaged in jumbo bags that carry around 500kg worth of pellets. They are widely
available from local suppliers, and one bag is expected to cost around EGP 75. They must be ordered in bulk.
Year 1 will require around 67,500 bags.
7.4 Project Engineering
This section describes the production process in detail, any specific technologies used, the estimated plant
capacity, as well as the main components required along with an estimate for civil engineering works (factory
infrastructure, etc.) and the total area required.
7.4.1 Description of Technology
The biomass fuel pellet production line consists of several key components which are usually are sourced
separately. The highest qualities and capacities are found mainly in Europe and the US, but components can also
be sourced from China at lower costs, albeit at lower capacities. The production line does not use any special
patented technologies, it is rather a combination of industry standard mechanical processes such as shredding,
drying and pelletizing. The quality of the final product is affected by removing impurities such as ash content,
and the calorific value of the input itself.
7.4.2 Estimated Plant Capacity
The plant capacity is estimated to receive a maximum of 300 tons of agriwaste per day, which is expected to
yield around 225 tons of biomass fuel pellets. The losses mainly are due to loss of moisture content at the drying
stage.
The following table summarizes the conversion ratios used in the study.
Table 78 Conversion Ratio for Biomass Fuel Pellets
Feedstock Max. Output
(tons/day)
Losses
Expected
Input
(tons/day)
Conversion
Ratio
Final Input
(tons/day)
Yield
Mixed Agriwaste 225 25% 225 4:3 300 75%
7.4.3 Process Flow
The process is illustrated in the following figure.

Medium and Large Scale Investment Opportunities in Luxor
102
Figure 23 Process Flow Diagram of Biomass Fuel Pellets Production
The process steps illustrated are described in detail in the following table.
Table 79 Step-by-Step Details of Biomass Fuel Pellets Production Process
# Name Description
Step 1 Raw Material
Preparation
Sugarcane bagasse and mixed agriwaste such as corn stalk, sawdust, etc. is received
and prepared to undergo initial size reduction.
Step 2 Initial Size
Reduction
The raw materials must undergo initial size reduction. This is normally done in a
crusher or shredder which cuts up the material into pieces with a diameter that
does not exceed 40mm.
Step 3 Drying After initial size reduction, the chips are fed into a rotary drum dryer, which is the
most cost-effective method of drying this kind of material. Drying is necessary to
produce high quality pellets. Moisture content of the mixed material should range
between 8-12%.
Step 4 Initial sieving After the drying process, the raw material will be sieved to separate the
contaminants such as stone and metal particles away from the wood raw materials.
These contaminants may cause the mechanical failure of the pellet mills, so if the
raw materials of the pellet plant have the potential to be contaminated by these
solid particles, it is necessary for to sieve the raw materials before feeding them
into the pellet mill. The machines for the initial sieving process is normally a de-
stoner or magnetic separator
Step 5 Grinding Grinding is also a size reduction step to make wood pellet. During the grinding
process, the raw materials are fed into a hammer mill which will grind the raw
materials into smaller pieces with a diameter under 5mm. Note: the hammer mill
can only process raw materials with a diameter no more than 50mm, therefore,
necessitating the initial size reduction step in the crusher/shredder.
Step 6 Pelletizing After the grinding process, the material now should have the size and moisture
requirements for pellet manufacture. The material is fed into a pellet mill.
Generally, there are two kinds of pellet mills, ring die pellet mill for large capacities
and flat die pellet mill for lower capacities.
Step 7 Cooling After the pelletizing process, the pellet is vulnerable to deformation, as it remains
warm from the constant pressing inside the pellet mill. To make the pellet regain its
proper rigidity and temperature, it must be fed into a pellet cooler right after the
pelletizing process. The types of pellet cooler can be divided into three types, the
horizontal cooler, the vertical cooler and the counter flow cooler, the latter of
which is recommended.

Medium and Large Scale Investment Opportunities in Luxor
103
Step 8 Final sieving Final sieving is different from initial sieving and is designed to remove fine particles
from the final product. This is normally done using a vibrating screen or a trommel
screen.
Step 9 Packaging The pellets are finally packaged into jumbo bags, each carrying around 500kg of
pellets, ready for shipping to the client.
7.4.4 Main Components and Equipment
The following is a list of the main components of the production line:
• Crusher/Shredder
• Hammer Mill
• Pelletizer
• Rotary or Drum Dryer
• Silos
• Truck Scale
• Counter flow cooler
• Trommel screen
Components are sourced separately, some local, some imported from different countries. The table below
shows the expected prices of the main components.
Table 80 Price Estimate for Biomass Fuel Pellet Production Line
Component Price
Crusher/Shredder (German/Italian/Belgian) USD 300,000 (EGP 5.4m)
Raw Mill (American) USD 390,000 (EGP 7m)
Pelletizer (Chinese) USD 400,000 (EGP 7.2m)
Drum Dryers (European, refurbished) EUR 500,000 (EGP 10m)
3xSilos (Local) EGP 500,000
Truck Scale (Local) EGP 250,000
Trommel Screen (Local) EGP 1.5m
Total EGP 31,870,000
The estimated useful life of this production line, assuming proper maintenance and care, can go up to 15 years.
7.4.5 Civil Engineering Works
In addition to the production line, there are key components of the factory’s infrastructure that need to be
considered, such as:
Boiler system for heating oil
Electrical Generator
Air compression system
Cooling system
Piping etc.
Total infrastructure costs are estimated to be around EGP 2m for a facility of this size.
7.4.6 Area Required
The area required for this production line is estimated to be around 1,000 m2. The land is assumed to cost around
EGP 3,000 per m2, which amounts to EGP 3m for land acquisition.

Medium and Large Scale Investment Opportunities in Luxor
104
Building structure and office space is estimated to cost an additional EGP 1.2m.
Important Note: Land is expected to be given for free in the Boghdadi industrial zone (IDA jurisdiction) by Luxor
governorate. However, it is sold against a fee in New Tiba (NUCA jurisdiction). To be conservative, land was
assumed to be bought against a fee.
7.5 Selling, General and Administrative Expenses (SG&A)
This section provides details on the selling, general and administrative expenses associated with the facility,
otherwise known as overhead costs.
7.5.1 Salaries and Wages
This opportunity is expected to employ around 28 permanent staff plus an additional 10 seasonal workers. They
are summarized below:
Table 81 List of Staff and Monthly Salaries for Biomass Fuel Pellets Production Line
Position Staff Monthly
Management
CEO 1 15.000
…
Production - Permanent
Plant Manager 1 10.000
Quality Control 2 6.000
Hall Supervisors 2 6.000
Engineering 2 5.000
Workers 4 3.000
…
Sales, General and Administration
Procurement 2 5.000
Sales Manager 1 8.000
Sales 2 5.000
Marketing 2 5.000
Finance & Accounting 2 5.000
HR Manager 1 10.000
Maintenance 4 3.000
Security 2 2.000
…
Total 28 staff
Salaries for permanent staff amount to EGP 145,000 per month in Year 1, which is EGP 1.74m total for the year.
That is only 1% of total revenue for Year 1.
Wages for seasonal workers amount to EGP 450,000 for each production season. This assumes 10 workers per
season, getting paid between EGP 50 per ton of feedstock handled.
7.5.2 Factory
Factory overheads that fall outside human resource expenses and production costs are expected to be at a
minimum. Maintenance and storage costs are estimated to be around EGP 10,000 and EGP 15,000 per month
respectively.

Medium and Large Scale Investment Opportunities in Luxor
105
7.5.3 Other Selling, General and Administrative
The main line item in this category is the marketing budget, which is determined as 7.5% of expected sales. This
amounts to EGP 4.18m for Year 1.
Utilities associated with administrative office space are expected to be around EGP 4,000 per month.
7.6 Organizational Structure
7.6.1 Organizational Chart
7.7 Financial Analysis and Investment
This section provides details of revenues, cost of goods sold (variable costs), margin analysis by product, selling,
general and administrative (SG&A) expenses (aka overheads), fixed assets (initial capital expenditures) for the
first year. The total initial investment is provided, and a 10-year projection of the income statements and
statements of cash flow are calculated. Finally, the results of the feasibility and sensitivity analyses are provided
as a summary of the key findings of the financial model.
7.7.1 Revenues
The estimated revenues for Year 1 are summarized below:
Product Months of Production Tons Produced Selling Price Revenue (000s)
Pellets (Local) All Year
16,875 tons EGP 600 per ton EGP 10,125
Pellets (Export) 16,875 tons USD 150 per ton USD 2,531
Total 33,750 tons EGP 1,6509 (avg.) EGP 55,688
9 The average selling price was calculated based on the assumption that 50% of production would be directed to local energy-intensive industries, while the other 50% for export. USDEGP rate used is 18.
CEO
Factory Plant Manager
Quality Control
Hall Supervisors
Engineering
Workers (Permanent)
Workers (Seasonal)
Administration
Procurement Manager
Sales Manager Sales Officers
Marketing Manager
Financial Manager
HR Manager Maintenance

Medium and Large Scale Investment Opportunities in Luxor
106
7.7.2 Cost of Goods Sold
The estimated total COGS for Year 1 are summarized below:
Inputs Quantity Units
Mixed Agriwaste
Tons bought 45,000 tons
Cost per ton 0.500 EGP 000s/ton
Cost per year 22,500 EGP 000s
Seasonal Labor
Workers 450 EGP
Packaging – Jumbo Bags
Cost per bag of 500kg 0.750 EGP 000s/ton
Number of bags needed 67,500 bags
Cost per year 5,063 EGP 000s
Utilities
Electricity 777 EGP 000s
Gas 419 EGP 000s
Water - EGP 000s
Wastewater - EGP 000s
Total Utilities 1,195 EGP 000s
Total COGS 29,208 EGP 000s
7.7.3 Gross Margin Analysis by Product
Looking at each product’s line items separately, gross margin can be calculated to show how profitable each
product is and how much it contributes in covering overheads, ultimately increasing bottom line figures.
Biomass Fuel Pellets
EGP 000s
Revenues 55,688
Raw Material 22,500
Seasonal Labor 450
Packaging 5,063
Electricity 777
Gas 419
Water -
Wastewater -
Total COGS 29,208
Gross Margin 47.6%
(-) Overheads 11.2%
Operating Margin 36.3%
7.7.4 Selling, General and Administrative Expenses
SG&A for Year 1 is summarized below:

Medium and Large Scale Investment Opportunities in Luxor
107
Human Resources EGP 000s
Total Permanent Staff Salaries 1,740
Overheads
Factory
Maintenance 120
Storage 180
General & Administrative -
Marketing (7.5% of Sales) 4,177
Utilities 48
Total Overheads 4,525
Total SG&A 6,265
7.7.5 Fixed Assets
The following table summarized the fixed assets (aka Property, Plant and Equipment) required for operation of
the facility, along with the associated yearly depreciation expense.
Fixed Assets Cost Dep. Life Yearly Dep. Exp.
EGP 000s EGP 000s
Production Line 31,870 10 years 3,187
Infrastructure 2,000 15 years 133
Building 1,000 30 years 33
Office 200 10 years 20
Land 3,000 0 years N/A
Total CAPEX 38,070 3,374
7.7.6 Minimum Investment Required
The minimum investment required will be the total fixed asset purchases required for operation plus 3-months’
worth of working capital.
EGP 000s
Initial Capital Expenditures on Fixed Assets 38,070
Working Capital for 3 months 8,868
Total Investment Required 46,938

Medium and Large Scale Investment Opportunities in Luxor
108
7.7.7 Projected Income Statements
The following is the projected income statements for the first 10 years of operation:
Table 82 Projected Income Statements for Biomass Fuel Pellets Production Line

Medium and Large Scale Investment Opportunities in Luxor
109
7.7.8 Projected Cash Flow Statements
The following is the projected cash flow statements for the first 10 years of operation:
Table 83 Projected Cash Flow Statement for Biomass Fuel Pellets Production Line

Medium and Large Scale Investment Opportunities in Luxor
110
7.7.9 Feasibility Analysis
The following table summarizes the key findings from the feasibility analysis:
Key Metric (based on 10-yr projections) Result (EGP 000s)
Capital Expenditures Required EGP 38,070
Working Capital Required for first 3 months EGP 8,868
Minimum Investment Required EGP 46,938
Direct Investment (Equity) EGP 14,081
Debt Financing EGP 32,857
Enterprise Value EGP 157,075
Internal Rate of Return 39%
Simple Payback 3.1 years
Discounted Payback 5.4 years
Profitability Index 3.35
7.7.10 Sensitivity Analysis
The feasibility of this opportunity will be most sensitive to fluctuations in agriwaste prices. Holding all other
relevant factors constant, a calculation was made to see how far up prices can go before operating margins reach
0%. The results were as follows:
Agriwaste can go up as high as EGP 949 per ton. This study assumes an average price of EGP 500 per ton as per
current market prices, while holding selling prices at an average of EGP 1,650 (50% local, 50% export).
Also, since exporting part of production is vital to keeping this business sustainable with the way local prices are,
another calculation was made is the least percentage of production that can be direct towards export before
operating margins reach 0%. The results were as follows:
Export component can go down to 19% before wiping operating margins, assuming selling prices are held
constant at EGP 600 per ton locally and USD 150 per ton globally. The 50-50% distribution is assumed to make
the investment attractive (to keep IRR above 30%).
7.8 Impact
Economic - Value added to local agricultural waste is quite significant. Based on this study’s assumptions, before
deducting other COGS and overheads:
1 ton of agriwaste, costing EGP 500, produces around 0.75 tons of biomass pellets, selling at an average
price of EGP 1,600– that is 60% value added to the waste.
Social - Direct jobs created by this facility will include 28 permanent plant staff plus another 5-10 seasonal
workers. Indirect jobs created will be mainly in logistics, marketing and distribution.
Environmental – This opportunity helps mitigate the open burning of agricultural waste and therefore reducing
carbon emissions.

Medium and Large Scale Investment Opportunities in Luxor
111
8 Key Considerations
8.1 Overview
This section highlights the main challenges that need to be taken into consideration when assessing these
investment opportunities. Most of the risks and mitigation measures are cross-cutting as the main input are
agricultural produce or their wastes, while in many occasions the final product is food.
Macroeconomic factors such as currency effects also affect all the investment opportunities, whether due to the
importation of technology, or export of product. The macro-economic and financial assumptions used in this
study are explained in more detail in Annex I.
There are regulatory factors as well, which are detailed in Annex II.
8.2 EGP Devaluation Effects
These opportunities take advantage of the abundant supplies of local crops such as tomatoes, mangoes, grapes,
bananas, sugarcane and dates to produce in-demand value-added products that are mainly geared towards
export (with the exception of IO5). It is clear from the analysis that due to the effects of the EGP devaluation,
exporting provides a more attractive business model due to the higher top-line numbers (revenues).
However, this fact is somewhat negated in the case the technology is imported, as this has also increased in cost
due to devaluation. This is especially clear in IO5 and IO6, which import already-expensive technology from the
US and Europe, and presents a clear barrier to investment. While the minimum investment required is pushed
high by this effect, it does not take away from the attractiveness of the investment.
For opportunities where the production line will be mostly manufactured locally, EGP devaluation has had a
minimal effect on initial capital expenditure requirements. This combination of a sharp increase in export prices
because of the EGP devaluation, as well as uptick in demand due to price competitiveness, with the relatively
lower increase in local costs both in capital expenditure requirements and inputs (raw materials, labor, etc.)
make these opportunities especially attractive.
8.3 Supply Chain Risks and Mitigation
A major challenge is the level of losses caused by inefficiencies in the production, process and transportation of
fruits and vegetables in general in Egypt, and more so in the production of tomatoes. On average, approximately
25-30% of all crops are lost because of poor post-harvest handling, which can exceed 60% in the case of
tomatoes. This poses a supply chain risk for IO1, IO3 and IO4.
Furthermore, only 3% of that supply is currently directed to food processors. Farming tomatoes for industrial
purposes remains very limited. To compound the problem further, tomato farmers in Upper Egypt are largely
smallholders (5 feddans or less) which makes contract farming for industrial scale operations more complicated.
There is a genuine risk that farmers do not honor contracts post-harvest, especially due to infamous price
fluctuations throughout the year. This issue is less risky for in other crops, but still needs mitigation through
proper mapping of the suppliers in the feasibility study stage to identify those that can provide secure, consistent
supplies and are willing to engage in contract farming.

Medium and Large Scale Investment Opportunities in Luxor
112
8.4 Conversion Factors and Yields
Supply chain risks are amplified due to high conversion factors, or low yields of fresh produce relative to final
product i.e. to produce just 1 kg of final product, a multiple of that weight is required as input. This makes these
opportunities highly sensitive to supply chain shocks, whether in the form of price fluctuations or inconsistency
in quantity and quality. In other words, the lower the yield (the higher the amount of kg input required for 1kg
output) the more sensitive the business is to this risk.
As shown in the sensitivity analysis of each opportunity, the feasibility of the model is highly sensitive to the
prices of the main inputs; agricultural produce or waste. This problem becomes obvious in crops like tomatoes.
Due to their high-water content (92%), they have a low yield when it comes to producing paste (7:1), which
poses a threat given the price volatility of tomatoes over the course of the year.
These risks can be mitigated by buying in bulk when prices are low and boost production in shorter periods to
take advantage of the long shelf-lives these products have (apart from IO4, which packs fresh produce for
export).
In addition, a leverage point for factories is that wholesale traders who compete for the same supply normally
reject around 20% of what is harvested to avoid the risk of losses when selling to the consumer market. This
places industrial facilities well as a market for fresh produce, as it may have a lower rejection rate on bulk orders.
This is mainly because the quality standard required for industrial processing is expected to be lower than
consumer markets for fresh produce, which means farmers will be more encouraged to sell to them alongside
existing markets.
Moreover, it is expected that food processing facilities that are visible, due to proximity, to the local farmers can
create a shift in agricultural practices that have previously led to oversupply, and inconsistent quality and prices,
especially in the case of tomatoes. Having a clear, large, accessible source of demand for their produce alleviates
the risks and uncertainties they normally deal with.
8.5 Marketing and Distribution
All the opportunities without exception require an aggressive marketing campaign to boost. This is the reason
that a marketing budget of 7.5% of Year 1 revenues was set across the board. One of the issues that persistently
came up during data collection and field visits is that marketing is key.
Effective marketing enables the potential of the investment opportunity to be fully captured, and there is a local
culture does not place enough emphasis on its importance for business, especially in sectors like agribusiness.
For opportunities like those selected in this study, entering competitive spaces both locally and internationally,
marketing is essential in creating the necessary demand for these products.

Medium and Large Scale Investment Opportunities in Luxor
113
9 Annex I – Financial Model and Key Assumptions
This section provides details as to how the financial models were built for each of the investment opportunities
in this study, and the key assumptions used.
9.1 Methodology for Financial Model
This section provides an explanation of the methodology used.
9.1.1 Income Statement for Year 1
Year 1 estimations are first provided for the following:
Revenues
o Number of revenue streams
o Production schedule
o Quantities produced and sold
o Expected selling prices
Cost of Goods Sold (COGS)
o Main inputs required and their amounts to produce 1 unit of output, taking into account yields
o Cost structure of final product, including other inputs
o Specific consumption to calculate utilities
Selling, General and Administrative Expenses (SG&A)
o Staff and expected salaries
o Maintenance, storage and utilities
o Marketing expenses
This is to determine the income statement for Year 1 from which to project onwards till Year 10 in the financial
model, using the percentage of sales method. Assumptions were used to determine future growth and inflation
rates, which were used to project future sales and operating capacity. These assumptions were as follows:
Table 84 Growth and Inflation Rate Assumptions
Year 1 Year 2 Year 3 Year 4 Year 5 Year 6-10 Onwards
Growth Rate - 40.0% 30.0% 20.0% 15.0% 7.0% 3%
Expected Inflation - 14.0% 10.0% 8.0% 7.5% 7.0% 3%
9.1.2 Plant Utilization
Another important assumption made is plant utilization i.e. what is actual operating capacity in Year 1 and how
that scales going forward. This affects production and resulting revenues. For simplicity a general assumption
was made for all opportunities; that the plant will begin to operate at 50% of that capacity initially for two main
reasons:
To reduce working capital requirements, specifically how much raw material is required, and in turn reduced
total initial investment. Due to yield factors stated in 8.4, the raw material requirements account for a huge
portion of operating expenses.
To give room for growth in sales in consequent years without the requirement for additional capital
expenditures in the first 10 years projected.

Medium and Large Scale Investment Opportunities in Luxor
114
The expected operating capacity across the 10-year projection period, as previously mentioned, is shown again
below, taking into account the growth in revenue, with more effort to boost capacity utilization focused in the
first 5 years of operation:
Table 85 Plant Utilization Assumptions
Year 1 Year 2 Year 3 Year 4 Year 5 & Onwards
Expected Utilization 50.0% 63.0% 75.6% 84.7% 91.0%
Based on Year 1 income statement, gross margin, SG&A margin and a tax rate of 22.5% was used to project until
Year 10. It was assumed that these margins hold all the way through. This is a more conservative approach as
margins should increase going forward.
9.1.3 Working Capital Roll-Forward
Working capital roll-forward is conducted to determine changes in accounts receivable, inventory and accounts
payable. These are balance sheet items, but it was decided that projected balance sheets were not needed for
the purposes of this study. However, these items influence free cash flow as they determine the cash conversion
cycle and therefore need to be calculated. The following shows the assumptions used to project accounts
receivable, inventory, and accounts payable going forward, using the average number of days method. These
assumptions were made based on data collected from industry experts and practitioners.
Table 86 Working Capital Roll-Forward Assumptions
Working Capital Roll-Forward IO1 IO2 IO3 IO4 IO4 IO5 IO6
Days of Sale Outstanding (DSO) 60 days 60 days 60 days 60 days 60 days 60 days 60 days
Inventory Turnover 30 days 30 days 30 days 30 days 3 days 45 days 30 days
Days Payable Outstanding (DPO) 15 days 15 days 15 days 15 days 7 days 7 days 7 days
9.1.4 Fixed Assets and Investment in Capacity
Fixed Assets (initial capital expenditures) purchased are determined along with their respective depreciation
schedules. Simple straight-line depreciation was used. It was assumed that there are no other investments in
capacity made during the 10-year projection period.
9.1.5 Initial Working Capital Requirements
Working capital requirements are determined as well to calculate the total initial investment required. It was
assumed that a minimum of three months working capital be covered in the initial investment across the board
for simplicity reasons.
9.1.6 Capital Structure and Financing
Suggested capital structure (Debt to Equity ratio) and means of financing are summarized and reflected in the
cash flow statement. The initial investment will be financed through debt and equity. The debt portion is
expected to account for 70%. The loan is assumed to be 7 years long, with quarterly payments, at an annual
interest rate of 18%. The following table shows the debt schedule for each year. The other 30% will be financed
through equity, with the promise of a 30% payout ratio.
Financing
Debt-to-Equity Ratio 70%
Dividend Payout Ratio 30%
Loan Duration 7 years

Medium and Large Scale Investment Opportunities in Luxor
115
Payment Frequency Quarterly
Annual Interest Rate 18%
9.1.7 Cash Flow Statements
After calculating working capital requirements, investing cash flow to purchase fixed assets, and financing cash
flows (which include debt service payments, dividend payments in addition to the cash received through debt
and equity), the cash flow statements can be calculated.
9.1.8 Free Cash Flow and Feasibility Metrics Used
Free cash flow to firm is calculated (FCFF) based on the 10-year income and cash flow statement projections.
The following feasibility metrics are calculated:
Enterprise Value
Internal Rate of Return – using the perpetuity method.
Simple Payback Period
Discounted Payback Period
Profitability Index
To calculate the above metrics, the following discount rates and terminal growth (g) rate were used:
Valuation
Cost of Equity 23%
Weighted Average Cost of Capital 20%
Terminal Growth Rate into Perpetuity 3.0%
9.1.9 Foreign Exchange Rates
In most of the opportunities, there are items quoted in USD or EUR terms, whether related to selling prices of
products on export markets or for technology imported from abroad. The rates assumed were deliberately
higher than current levels to provide a more conservative analysis, given the volatile nature of the EGP following
its flotation, which coincided with the preparation of this report.
The rates used were as follows:
USDEGP at 18.
EUREGP at 20.

Medium and Large Scale Investment Opportunities in Luxor
116
10 Annex II – Regulatory Requirements
10.1 For Food Processing Industries
Food processing industry (FPI) falls within the intersecting sectors of industry and agriculture. The regulatory
requirements for the overlapping sectors of the business corresponds to permits from various stakeholders. The
regulations explained here affect Investment Opportunities 1-4.
In brief, the various sets of regulatory requirements include that of registering the company, securing a plot at
the Industrial Zone to establish the production facility, negotiating a deal and obtaining permits from the
governorate directorate for waste collection, issuing the operational license of the facility, and complying with
the EOS – Egyptian Organization for Standardization and Quality Control – standards after production on a
regular basis.
Moreover, the FPI sector is more challenging – especially for exports – for the certificates required to obtain and
the necessity to comply with international standards. The two main lines of standards enforced by the World
Trade Organization concerning FPI industries are the SPS and TBT measures (Ali Abdallah et. al, 2015). The SPS
stands for the sanitary and phytosanitary measures while the TBT measures refer to the technical regulations
and procedures for assessment of conformity with technical regulations and standards – excluding those
covered by the SPS agreement.
Imbedded within these two global agreements are the Codex Alimentarius Commission (CAC) guidelines which
include the specific guidelines for the FPI standards for export and trade. The Egyptian Organization for
Standardization and Quality Control (EOS) adopts the Codex guidelines to monitor the compliance of FPIs with
food safety regulations and standards. It is under the Ministry of Industry and Foreign Trade. Other than safety
regulations, there are specific standards for packaging and labelling in which the FPIs should follow.
In Egypt, the Egyptian Accreditation Council under the Ministry of Trade and Industry is responsible for
accrediting the inspection bodies and testing laboratories that facilitate the process of accreditation for FPI
industries (IMC, 2005). Most of the 115 labs are public.
The National Food Safety Authority (NFSA) was created in January 2017 as a single regulator, which replaces
around 17 agencies units. Its main power and functions include handling everything related to food safety,
inspections of imports and exports, licensing, certifications, regulations of genetically modified foods, and
setting/enforcing penalties for violations.
Major Laws or Decrees Impacting Food Exports and Imports (GAIN Report, 2015):
Ministerial Decree 770/2005 Concerning the Executive Regulation to Implement Import and Export Law
no.118/1975 as well as Inspection and Control Procedures of Imported and Exported Goods
Prime Ministerial Decree 1186/2003 Inspection and Control Measures of Exports and Imports
Law 82/2002 The Protection of Intellectual Property Rights
Law 121/1982 The Registration of Importers
Presidential Decree 106/2000 Facilitating Inspection and Control Procedures of Exported and Imported
Goods
Law 118/1975 Import and Export
FPI industries are also required to register with the Export Council for Food Processing Industries, and obtain the
following ISO certifications specifically for export:
ISO 22000
ISO 9002

Medium and Large Scale Investment Opportunities in Luxor
117
Complying with requirements of food safety is a challenge within a largely informal food-processing-industry in
Egypt. However, a regular operating license is sufficient to sell products on the local market.
10.2 For Waste Management
Investment Opportunities 5 and 6 involve the management of agricultural waste and the manufacturing of useful
products from material otherwise deemed as waste.
The regulatory requirements for the overlapping sectors of the business corresponds to permits from various
stakeholders. In a nutshell, the various sets of regulatory requirements include that of registering the company,
securing a plot at the Industrial Zone to establish the production facility, negotiating a deal and obtaining permits
from the Governorate Directorate for waste collection, issuing the operational license of the facility, and
complying with the EOS – Egyptian Organization for Standardization and Quality Control – standards after
production on a regular basis.
The following presents some of the Waste and Alternative Fuel Related Laws and Regulations in Egypt (IFC,
2016). The most important of which is Law number 4/1994 and its amendments by law number 9/2009 and its
executive regulations: This law is concerned with regulating all issues related to the protection of the
environment. It also encourages the recycling and reuse of waste along the different value chains. Article 37 of
law 4/1994 and article 38 of its executive regulations considers the use of waste as an Alternative Fuel a part of
the legally approved recycling processes.
Approval of the location for waste storage or treatment facilities by EEAA.
Requirement that all facilities involved in waste recycling and treatment conduct an Environmental
Impact study
Requirements for the operation of waste management facilities
Operational permit from the governorate
Waste transportation contractors
Environmental register
Approval system for waste collection
Environmental register for handling any hazardous waste

Medium and Large Scale Investment Opportunities in Luxor
118
11 References
Ali Abdallah et.al, 2015. Skills for Trade and Economic Diversification (STED) in Egypt - The case of the Food
Processing Sector. Accessed on: 29 May, 2017. Available at:
http://www.ilo.org/wcmsp5/groups/public/---africa/---ro-addis_ababa/---sro-
cairo/documents/publication/wcms_469089.pdf
European IPPC Bureau. n.d. “Reference Documents under the IPPC Directive and the IED.” Joint Research
Centre - Circular Economy and Industrial Leadership. Accessed March 17, 2018. Available at:
http://eippcb.jrc.ec.europa.eu/reference/
GAIN Report. 2015. Global Agriculture Information Network: Egypt. Accessed on: 29 May, 2017.
Available at: http://www.docureader.top/doc/21770
IFC, 2016. Unlocking Value Alternative Fuels for Egypt’s Cement Industry. Accessed on: 29 May 2017. Available
at: http://www.ifc.org/wps/wcm/connect/aaa24840-cb94-40c6-9ab1-
bb0252a6d2fb/IFC+AFR+Report+_+Web_+1-11-2016.pdf?MOD=AJPERES
IMC. 2005. “Egyptian Processed Food Sector Review - Final Report - Submitted to the Industrial Modernization
Center.” Rotterdam, April 2005. Available at: http://www.imc-
egypt.org/index.php/en/studies/viewcategory/59-executive-summery.
International Trade Centre. 2017. “Trade Map - Trade Statistics for International Business Development.” 2017.
Available at: https://trademap.org/Index.aspx.
SCOoPE project. n.d. “Publications & Reports.” SCOoPE Project (blog). Accessed March 17, 2018. Available at:
https://scoope.eu/publications-reports/

Medium and Large Scale Investment Opportunities in Luxor
119