PQ and Harmonic Assessment Issues on Low-Cost Smart ...
27
sensors Article PQ and Harmonic Assessment Issues on Low-Cost Smart Metering Platforms: A Case Study Giovanni Artale 1 , Giuseppe Caravello 1 , Antonio Cataliotti 1 , Valentina Cosentino 1, * , Dario Di Cara 2, * , Nunzio Dipaola 3 , Salvatore Guaiana 2 , Nicola Panzavecchia 2 , Marilena G. Sambataro 3 and Giovanni Tinè 2 1 Department of Engineering, Università degli Studi di Palermo, 90128 Palermo, Italy; [email protected] (G.A.); [email protected] (G.C.); [email protected] (A.C.) 2 Institute of Marine Engineering (INM), National Research Council (CNR), 90146 Palermo, Italy; [email protected] (S.G.); [email protected] (N.P.); [email protected] (G.T.) 3 STMicroelectronics S.r.l., 95121 Catania, Italy; [email protected] (N.D.); [email protected] (M.G.S.) * Correspondence: [email protected] (V.C.); [email protected] (D.D.C.) Received: 30 September 2020; Accepted: 4 November 2020; Published: 7 November 2020 Abstract: This paper presents a feasibility study on how to implement power quality (PQ) metrics in a low-cost smart metering platform. The study is aimed at verifying the possibility of implementing PQ monitoring in distribution networks without replacing existing smart metering devices or adding new modules for PQ measurements, thus zeroing the installation costs. To this aim, an electronic board, currently used for remote energy metering, was chosen as a case study, specifically the STCOMET platform. Starting from the specifications of this device, the possibility of implementing power quality metrics is investigated in order to verify if compliance with standard requirements for PQ instruments can be obtained. Issues related to device features constraints are discussed; possible solutions and correction algorithms are presented and experimentally verified for different PQ metrics with a particular focus on harmonic analysis. The feasibility study takes into account both the use of on-board voltage and current transducers for low voltage applications and also the impact of external instrument transformers on measurement results. Keywords: power quality; smart meter; voltage and current sensing; harmonic analysis 1. Introduction Nowadays smart metering devices have widespread use in many countries around the world to enable automatic meter reading (AMR) and other smart grid functionalities. Typical features include the measurement of different quantities, such as energy consumptions, supply voltages, frequency, absorbed currents and powers, as well as communication functionalities for enabling meter interaction with the grid and information exchange between customers and utilities. In this framework, several studies and proposals can be found in literature concerning both AMR, enhanced smart grid applications, and related measurement and communication issues. For example, in [1] and [2] main smart metering and communications technologies are surveyed, in the viewpoint of their integration in smart grid and industrial contexts; main features of metering and communication equipment and methods are analyzed, putting in evidence the advantages and open issues concerning advanced measurement and communication features. In [3], an overview is given of the enabling technologies and standards for communication, sensing, and monitoring purposes, also from the viewpoint of the full integration of distributed generation and storage systems at the customer level. In [4], a study is made on the possible integration of AMR with further sensing and IoT functionalities. Sensors 2020, 20, 6361; doi:10.3390/s20216361 www.mdpi.com/journal/sensors
-
Upload
khangminh22 -
Category
Documents
-
view
0 -
download
0
Transcript of PQ and Harmonic Assessment Issues on Low-Cost Smart ...
sensors
Article
PQ and Harmonic Assessment Issues on Low-CostSmart Metering Platforms: A Case Study
Giovanni Artale 1 , Giuseppe Caravello 1, Antonio Cataliotti 1 , Valentina Cosentino 1,* ,Dario Di Cara 2,* , Nunzio Dipaola 3, Salvatore Guaiana 2, Nicola Panzavecchia 2,Marilena G. Sambataro 3 and Giovanni Tinè 2
1 Department of Engineering, Università degli Studi di Palermo, 90128 Palermo, Italy;[email protected] (G.A.); [email protected] (G.C.); [email protected] (A.C.)
2 Institute of Marine Engineering (INM), National Research Council (CNR), 90146 Palermo, Italy;[email protected] (S.G.); [email protected] (N.P.); [email protected] (G.T.)
3 STMicroelectronics S.r.l., 95121 Catania, Italy; [email protected] (N.D.);[email protected] (M.G.S.)
* Correspondence: [email protected] (V.C.); [email protected] (D.D.C.)
Received: 30 September 2020; Accepted: 4 November 2020; Published: 7 November 2020 �����������������
Abstract: This paper presents a feasibility study on how to implement power quality (PQ) metrics in alow-cost smart metering platform. The study is aimed at verifying the possibility of implementing PQmonitoring in distribution networks without replacing existing smart metering devices or adding newmodules for PQ measurements, thus zeroing the installation costs. To this aim, an electronic board,currently used for remote energy metering, was chosen as a case study, specifically the STCOMETplatform. Starting from the specifications of this device, the possibility of implementing powerquality metrics is investigated in order to verify if compliance with standard requirements for PQinstruments can be obtained. Issues related to device features constraints are discussed; possiblesolutions and correction algorithms are presented and experimentally verified for different PQ metricswith a particular focus on harmonic analysis. The feasibility study takes into account both the use ofon-board voltage and current transducers for low voltage applications and also the impact of externalinstrument transformers on measurement results.
Keywords: power quality; smart meter; voltage and current sensing; harmonic analysis
1. Introduction
Nowadays smart metering devices have widespread use in many countries around the worldto enable automatic meter reading (AMR) and other smart grid functionalities. Typical featuresinclude the measurement of different quantities, such as energy consumptions, supply voltages,frequency, absorbed currents and powers, as well as communication functionalities for enablingmeter interaction with the grid and information exchange between customers and utilities. In thisframework, several studies and proposals can be found in literature concerning both AMR, enhancedsmart grid applications, and related measurement and communication issues. For example, in [1]and [2] main smart metering and communications technologies are surveyed, in the viewpoint oftheir integration in smart grid and industrial contexts; main features of metering and communicationequipment and methods are analyzed, putting in evidence the advantages and open issues concerningadvanced measurement and communication features. In [3], an overview is given of the enablingtechnologies and standards for communication, sensing, and monitoring purposes, also from theviewpoint of the full integration of distributed generation and storage systems at the customer level.In [4], a study is made on the possible integration of AMR with further sensing and IoT functionalities.
Sensors 2020, 20, 6361; doi:10.3390/s20216361 www.mdpi.com/journal/sensors

Sensors 2020, 20, 6361 2 of 27
In [5,6], some power line communication solutions for AMR applications are presented; refs. [7,8]wireless communication solutions for smart grid applications are addressed instead. Security issuesand a possible privacy-preserving solution based on blockchain technology are investigated in [9].The problem of real-time monitoring of low voltage distribution grids with distributed energyresources is addressed in [10,11], where proposed Information and Communication Technologies (ICT)architectures can integrate metering equipment at both users, prosumers, and distribution systemoperator level, to enable energy management and real-time grid monitoring. In [12], a metering andcommunication solution is proposed for the remote monitoring and control of distributed energyresources connected to low-voltage grids.
At the grid level, measurement instruments, such as power quality analyzers (PQAs) or phasormeasurement units (PMUs), can be installed in different grid nodes (typically in transmission anddistribution substations), for grid monitoring and management purposes, including PQ assessment [13].This allows for the achievement of some data about the occurrence of PQ disturbances. In this framework,from the viewpoint of metering features, measurement reliability, and data availability, several issueshave been investigated in the literature concerning this kind of instrumentation. For example,in [14] a solution is proposed to enhance distributed PMU availability during wired network failures.In [15,16], PMU new solutions are presented, aimed at reaching a good tradeoff between low costand proper accuracy requirements. In [17], a study is carried out concerning the accuracy of signalprocessing algorithms for PMU measurements in the presence of disturbances in power systemoperating conditions. In [18], an enhanced solution for distribution system state estimation is presented,based on PMUs measurements and the cloud-based Internet of Things (IoT) paradigm. In [19–21],PQAs exploitation for power flows analysis at the distribution level is investigated, proposing properlydistributed measurement systems and related power flows estimation algorithms able to also dealwith partial data availability. In [22], PQ meters are integrated into a heterogeneous communicationinfrastructure to allow for the analysis of voltage dips in distribution networks.
However, more complete information about PQ levels across the grid could be reached by alsoincluding in the distributed measurement infrastructure PQ meters at the user level. For example,this could allow the implementation of billing strategies based not only on energy consumption butalso on supply quality. In this framework, in [23] the study of a cost-effective microcontroller-basedpower quality meter is presented, which can be exploited at the user level for real-time monitoring ofsome PQ parameters. In [24], a prototype of an electronic power meter is developed, to integrate themeasurement of typical power quality parameters and additional power terms for load characterization.In [25], a smart sensor network is proposed for non-intrusive load and power quality monitoring inboth residential and industrial contexts. Among PQ disturbances, harmonic distortion is of greatimportance, especially in distribution grids, where the increasing presence of non-linear loads andpower electronics in distributed generation and storage systems can strongly deteriorate the quality ofsupplied power and several electronic appliances and loads (at the home, commercial, and industriallevel) are very sensitive to supply quality, especially in terms of harmonic distortion [26].
To enable diffused PQ measurements, it is important to introduce new technologies that canprovide both end-users and distribution system operators with suitable information about the qualityof the power supply at reasonable costs. In this framework, some studies and proposals can be found inresearch papers concerning the use of new energy meters, specifically developed for PQ measurementapplications [27–33]. For example, in [27,28], an open-source energy and power quality meter isdeveloped for low voltage applications at the user level. Further solutions for PQ measurements havebeen proposed in [29–31], which are based on microcontrollers and Raspberry-Pi. In [32], a multipurposeplatform is developed for power system monitoring and analysis, which combines several measurementfunctionalities, i.e., power quality (PQ) analyzer, PMU, event logger, etc. A solution for a home areanetwork application is proposed in [33], where the meter unit can be installed even on single loadsand measured data are transmitted through a Radio-Frequency (RF) link to a wireless terminal unit,which works as a data logger and as a human–machine interface. In [34], a prototype is presented

Sensors 2020, 20, 6361 3 of 27
of a device and related metering algorithms for PQ monitoring, based on the Arduino NANO V3ATmega328 microprocessor; the proposed device is integrated into a system for power supply reliabilityand power quality monitoring at both sides of switching devices.
It should be noticed that, in the viewpoint of widespread diffusion of PQ measurements atthe user level, the installation of sophisticated and expensive instrumentation is not economicallyfeasible. On the other hand, low-cost devices have been proposed to implement PQ measurement tasks;in this case, such additional instrumentation should be installed alongside the currently employedenergy meters or new integrated platforms should replace those already used in distribution networks.In [35], the authors have investigated an alternative approach to the problem, i.e., the possibility ofimplementing PQ metrics on existing smart metering platforms; thus, exploiting current installedinstrumentation and hardware architectures, by only modifying firmware and implemented metrics.This allows for the zeroing of the installation costs. The integration of PQ metrics into existing smartmeters could open new market opportunities for both energy traders and manufacturers; moreover,this can allow users to easily monitor the quality of supplied power, without the need to handledifferent metering devices.
PQ phenomena measurements and limits are covered by specific standards [36–40]. The mainreference is the IEC 61000-4-30, which defines the methods for PQ parameter measurement and therelated accuracy requirements; as regards, harmonics (and interharmonics) measurements, it refersto IEC 61000-4-7. The instrument’s compliance with such standards is crucial to enable their usefor monitoring or even billing purposes. In more detail, IEC 61000-4-30 defines two classes ofmeasurements, i.e., classes A and S (correspondent to classes I and II of IEC 61000-4-7, respectively).Class A instruments are meant to be used for contractual applications or compliance verification withallowed disturbances limits; class S instruments are allowed for statistical applications such as surveysor power quality assessment and they obviously entail processing requirements lower than those ofclass A.
When dealing with PQ and harmonics measurements, another important issue to be considered isthe influence of measurement transducers on the metrological accuracy of the whole measurement chain(i.e., transducers plus instrument) [41–47]. In fact, it is known that transducers can introduce relevantuncertainty contributions, especially when measured signals are not purely sinusoidal, because oftransducer nonlinearities, frequency response, and bandwidth. In this viewpoint, PQ standards do notcover the presence of measurement transducers external to the instrument, and accuracy requirementsdo not include the transducers contribution. This problem is considered in the technical report IEC TR61869-103 [38], which specifically deals with the use of instrument transformers (both inductive andelectronic) for power quality measurements.
Starting from the aforesaid standard requirements for PQ and harmonic measurements, this paperinvestigates the issues related to the integration of PQ metrics on commercial platforms for smartmetering. The device used as a case study is the STCOMET by STMicroelectronics [48], which iscurrently used in different countries for energy meter deployment. In detail, this paper is an extensionof a previous author’s work [35], where a first implementation of some PQ metrics was presented.STCOMET already implements some PQ parameter metrics, such as frequency, RMS, dips, and swells.In [35], the compliance of on-board metrics with IEC 61000-4-30 was evaluated and some correctionmetrics were implemented and experimentally tested. In this way, the STCOMET measurementperformances of the above-mentioned PQ parameters were found compatible with the accuracy classS requirements (in some cases even class A requirements were met). This paper investigates thepossibility of implementing further metrics for harmonics measurement. Taking into account theconstraints due to STCOMET technical specifications, a harmonic analysis algorithm was designedand implemented. Experimental tests were performed using the reference calibrator Fluke 6100A [49],in order to evaluate the compatibility between measurement errors and standard limits, according to IEC61000-4-7. Furthermore, the impact of external measurement transducers on the whole measurement

Sensors 2020, 20, 6361 4 of 27
system accuracy is also analyzed; harmonics amplitude and phase errors were evaluated with andwithout external current transducers, to distinguish their contribution to measurement accuracy.
The paper is organized as follows. In Section 2, STCOMET specifications are analyzed from theviewpoint of obtaining measurement compliance with standard prescriptions, highlighting the mainmeasurement issues to be considered for each accuracy class. Section 3 describes the implementationof the different PQ metric on STCOMET, the required correction algorithms, with a special focus onharmonic analysis. Section 4 reports the experimental characterization results for voltage and currentmeasurements, both in sinusoidal and distorted conditions; tests were carried out both with andwithout an external current transformer, to evaluate its influence on the final measurement accuracy.
2. STCOMET Specifications and Standards Requirements
The evaluation kit for the STCOMET platform, named EVLKSTCOMET10-1 [48], was usedas a case study to demonstrate the feasibility of the PQ measurement capability of an electronicboard currently used for remote energy metering. EVLKSTCOMET10-1 includes a Cortex ™ -M4microcontroller, a metrology section, and a power line communication (PLC) transceiver in a singledevice. The embedded PLC coupling circuit allows the STCOMET device to transmit and receivecommunication signals on the low voltage mains. More in detail, single carriers or OFDM (orthogonalfrequency-division multiplexing) multi-carrier signals up to 500 kHz can be selected, enabling automaticmeter reading (AMR) applications. The device functional block diagram is shown in Figure 1.
Sensors 2020, 20, x FOR PEER REVIEW 4 of 25
The paper is organized as follows. In Section 2, STCOMET specifications are analyzed from the viewpoint of obtaining measurement compliance with standard prescriptions, highlighting the main measurement issues to be considered for each accuracy class. Section 3 describes the implementation of the different PQ metric on STCOMET, the required correction algorithms, with a special focus on harmonic analysis. Section 4 reports the experimental characterization results for voltage and current measurements, both in sinusoidal and distorted conditions; tests were carried out both with and without an external current transformer, to evaluate its influence on the final measurement accuracy.
2. STCOMET Specifications and Standards Requirements
The evaluation kit for the STCOMET platform, named EVLKSTCOMET10-1 [48], was used as a case study to demonstrate the feasibility of the PQ measurement capability of an electronic board currently used for remote energy metering. EVLKSTCOMET10-1 includes a Cortex ™ -M4 microcontroller, a metrology section, and a power line communication (PLC) transceiver in a single device. The embedded PLC coupling circuit allows the STCOMET device to transmit and receive communication signals on the low voltage mains. More in detail, single carriers or OFDM (orthogonal frequency-division multiplexing) multi-carrier signals up to 500 kHz can be selected, enabling automatic meter reading (AMR) applications. The device functional block diagram is shown in Figure 1.
As regards the measurement transducers, a resistive divider is used as a voltage sensor (Figure 2), while a shunt and a current transformer are available for current measurements (the shunt was used in experimental tests).
Figure 1. EVLKSTCOMET10-1 functional block diagram. Figure 1. EVLKSTCOMET10-1 functional block diagram.
As regards the measurement transducers, a resistive divider is used as a voltage sensor (Figure 2),while a shunt and a current transformer are available for current measurements (the shunt was used inexperimental tests).

Sensors 2020, 20, 6361 5 of 27
Sensors 2020, 20, x FOR PEER REVIEW 5 of 25
Figure 2. EVLKSTCOMET10-1 metrology reference application schematics.
The metrology section includes a three-channel analog front end (AFE) with 24-bit sigma-delta converters and a dedicated digital signal processor (DSP). Available memories are: 640 kB or 1 MB of embedded Flash; 128 kB of embedded SRAM (static RAM); 8 kB of embedded shared RAM. EVLKSTCOMET10-1 metrological specifications are summarized in Table 1.
Table 1. EVLKSTCOMET10-1 metrological main specifications.
Parameter Value Nominal input voltage 230 V Nominal line current 5 A
Nominal input frequency 50/60 Hz Sampling frequency (Fs) 7.8125 kHz
Bandwidth (–3 dB) 0–3.6 kHz Voltage/current RMS accuracy 0.5%
As mentioned in the introduction, IEC 61000-4-30 and IEC 61000-4-7 are the reference standards for PQ and harmonic measurements: IEC 61000-4-30 covers PQ measurement methods [36], referring to IEC 61000-4-7 for harmonics measurements [37]. Among the PQ parameters covered by the aforesaid standards, STCOMET base firmware already embeds metrics for power system frequency, voltage and current rms, and dips and swells. For those metrics, compatibility with standard requirements was analyzed in the paper, eventually suggesting correcting algorithms. The harmonic measurement metric is not available in the original firmware, thus it was developed, implemented, and tested.
According to IEC 61000-4-30, two possible classes are defined for measuring instruments: named A and S (corresponding to class I and II of IEC 61000-4-7, respectively). Class A is used when precise measurements are required (for example, in the case of billing applications that may require the resolution of disputes, detection of possible fraud, attribution of economical penalties for exceeding the standard limits, etc.) and class S is used for statistical applications (such as investigations of the origin of power quality disturbances, even with a limited subset of parameters PQ). For both classes, the base time interval (t.i.) for many measurements (voltage and current rms, harmonics, interharmonics, and unbalance) is 10/12 cycles for 50/60 Hz systems (i.e., 200 ms in the 50 Hz case). The 10/12 cycle values are then aggregated over three additional time intervals: 150/180 cycles, 10 min, and two hours.
As regards harmonic measurements, the IEC 61000-4-7 standard defines measurement requirements for harmonic distortion assessment both in terms of single harmonic component
Figure 2. EVLKSTCOMET10-1 metrology reference application schematics.
The metrology section includes a three-channel analog front end (AFE) with 24-bit sigma-deltaconverters and a dedicated digital signal processor (DSP). Available memories are: 640 kB or 1MB of embedded Flash; 128 kB of embedded SRAM (static RAM); 8 kB of embedded shared RAM.EVLKSTCOMET10-1 metrological specifications are summarized in Table 1.
Table 1. EVLKSTCOMET10-1 metrological main specifications.
Parameter Value
Nominal input voltage 230 V
Nominal line current 5 A
Nominal input frequency 50/60 Hz
Sampling frequency (Fs) 7.8125 kHz
Bandwidth (–3 dB) 0–3.6 kHz
Voltage/current RMS accuracy 0.5%
As mentioned in the introduction, IEC 61000-4-30 and IEC 61000-4-7 are the reference standardsfor PQ and harmonic measurements: IEC 61000-4-30 covers PQ measurement methods [36], referring toIEC 61000-4-7 for harmonics measurements [37]. Among the PQ parameters covered by the aforesaidstandards, STCOMET base firmware already embeds metrics for power system frequency, voltage andcurrent rms, and dips and swells. For those metrics, compatibility with standard requirements wasanalyzed in the paper, eventually suggesting correcting algorithms. The harmonic measurement metricis not available in the original firmware, thus it was developed, implemented, and tested.
According to IEC 61000-4-30, two possible classes are defined for measuring instruments: namedA and S (corresponding to class I and II of IEC 61000-4-7, respectively). Class A is used when precisemeasurements are required (for example, in the case of billing applications that may require theresolution of disputes, detection of possible fraud, attribution of economical penalties for exceeding thestandard limits, etc.) and class S is used for statistical applications (such as investigations of the originof power quality disturbances, even with a limited subset of parameters PQ). For both classes, the basetime interval (t.i.) for many measurements (voltage and current rms, harmonics, interharmonics,and unbalance) is 10/12 cycles for 50/60 Hz systems (i.e., 200 ms in the 50 Hz case). The 10/12 cyclevalues are then aggregated over three additional time intervals: 150/180 cycles, 10 min, and two hours.

Sensors 2020, 20, 6361 6 of 27
As regards harmonic measurements, the IEC 61000-4-7 standard defines measurementrequirements for harmonic distortion assessment both in terms of single harmonic componentamplitudes and global parameters, such as the total harmonic distortion (THD) factor. The standardalso provides indications regarding the general structure of measurement instruments, which ispreferably based on the use of the discrete Fourier transform (DFT) and implemented by means of thefast Fourier transform (FFT) algorithm for shorter computation time (see Figure 3).
Sensors 2020, 20, x FOR PEER REVIEW 6 of 25
amplitudes and global parameters, such as the total harmonic distortion (THD) factor. The standard also provides indications regarding the general structure of measurement instruments, which is preferably based on the use of the discrete Fourier transform (DFT) and implemented by means of the fast Fourier transform (FFT) algorithm for shorter computation time (see Figure 3).
Figure 3. General structure of the IEC 61000-4-7 instrument.
According to IEC 61000-4-7, the base time interval window must be synchronized to the fundamental power system frequency; the time between the leading edges of the first and the (N + 1)th sampling pulses (where N is the number of samples acquired in the observation window) shall be equal to the duration of the specified number of cycles, with a maximum allowable error of ±0.03% for class A instruments. Phase-locked loop or other synchronization systems are needed to properly generate the sampling frequency, in order to meet the aforesaid synchronization requirements. Hanning weighting is allowed only in the case of the loss of synchronization, even if in such occurrence the data shall be flagged and not used for the purpose of determining compliance with standard PQ limits.
On STCOMET, the input signal period is obtained by means of a zero-crossing method. Frequency is obtained from the period measurement. Using this method, it is necessary to filter harmonics and inter-harmonics, in order to minimize the effects of multiple zero crossings. This is in accordance with IEC 61000-4-30, which requires attenuating harmonics and inter-harmonics before measuring frequency. The STCOMET DSP calculates the period using the zero-crossing signal (ZRC) of the fundamental harmonic voltage, which is measured through a low-pass filter connected at the voltage channel. The resolution of the zero-crossing signal is 8 μs (given by the internal clock at 125 MHz); period measurement is updated every eight cycles of the input signal.
Even if the period is continuously measured, STCOMET sampling frequency cannot be synchronized to input signal frequency. In fact, as typically happens for many low-cost commercial platforms, STCOMET has a fixed sampling frequency. Thus, the synchronous sampling condition can be obtained only by properly choosing the number of acquired samples (N) in order to acquire an integer number of cycles of the input signal (10/12 cycles for the base time interval for power quality and harmonic measurements). In more detail, the STCOMET board has a fixed frequency sampling equal to fs = 7812.5 Hz (see Table 1), corresponding to a sampling period Ts = 128 μs. Considering a power system frequency of 50 Hz and the 10 cycles observation window Tw = 200 ms, the number of acquired samples is:
N = Tw × fs = 1562.5 ≈ 1563 (1
(2)
FFT spectral resolution is:
ΔF = fs/N = 4.9984 Hz (
(2)
The synchronization error, corresponding to 0.5 samples, is of E = 0.5 × Ts = 64 μs, which in percentage terms can be calculated as follows:
e% = (E/Tw) × 100 = 0.032% > 0.03% (class A limit) (3)
Figure 3. General structure of the IEC 61000-4-7 instrument.
According to IEC 61000-4-7, the base time interval window must be synchronized to thefundamental power system frequency; the time between the leading edges of the first and the(N + 1)th sampling pulses (where N is the number of samples acquired in the observation window)shall be equal to the duration of the specified number of cycles, with a maximum allowable error of±0.03% for class A instruments. Phase-locked loop or other synchronization systems are needed toproperly generate the sampling frequency, in order to meet the aforesaid synchronization requirements.Hanning weighting is allowed only in the case of the loss of synchronization, even if in such occurrencethe data shall be flagged and not used for the purpose of determining compliance with standardPQ limits.
On STCOMET, the input signal period is obtained by means of a zero-crossing method. Frequency isobtained from the period measurement. Using this method, it is necessary to filter harmonics andinter-harmonics, in order to minimize the effects of multiple zero crossings. This is in accordancewith IEC 61000-4-30, which requires attenuating harmonics and inter-harmonics before measuringfrequency. The STCOMET DSP calculates the period using the zero-crossing signal (ZRC) of thefundamental harmonic voltage, which is measured through a low-pass filter connected at the voltagechannel. The resolution of the zero-crossing signal is 8 µs (given by the internal clock at 125 MHz);period measurement is updated every eight cycles of the input signal.
Even if the period is continuously measured, STCOMET sampling frequency cannot besynchronized to input signal frequency. In fact, as typically happens for many low-cost commercialplatforms, STCOMET has a fixed sampling frequency. Thus, the synchronous sampling condition canbe obtained only by properly choosing the number of acquired samples (N) in order to acquire aninteger number of cycles of the input signal (10/12 cycles for the base time interval for power qualityand harmonic measurements). In more detail, the STCOMET board has a fixed frequency samplingequal to fs = 7812.5 Hz (see Table 1), corresponding to a sampling period Ts = 128 µs. Considering apower system frequency of 50 Hz and the 10 cycles observation window Tw = 200 ms, the number ofacquired samples is:
N = Tw × fs = 1562.5 ≈ 1563 (1)
FFT spectral resolution is:∆F = fs/N = 4.9984 Hz (2)

Sensors 2020, 20, 6361 7 of 27
The synchronization error, corresponding to 0.5 samples, is of E = 0.5 × Ts = 64 µs, which inpercentage terms can be calculated as follows:
e% = (E/Tw) × 100 = 0.032% > 0.03% (class A limit) (3)
Therefore, the instrument based on STCOMET cannot be classified in class A; thus, in the performedfeasibility study class S requirements have been considered as a target for the implementation andverification of PQ and harmonics measurement metrics.
As regards the data aggregation over additional intervals, class S requirements are depicted inFigures 4 and 5. In more detail, the data for the 150/180-cycles (i.e., 3 s) time interval shall be aggregatedfrom fifteen contiguous 10/12-cycles (200 ms) base time intervals (see Figure 4). The aggregated dataare calculated as the square root of the arithmetic mean of the squared input values measured in thebase time intervals. For example, this is the case of RMS measurements. On the other hand, gaps arepermitted for harmonics, inter-harmonics, mains signaling voltage, and unbalance (see Figure 5);in this case, a minimum of three 10/12-cycles values shall be used every 150/180-cycle time interval,i.e., at least one 10/12-cycles value shall be used every 50/60 cycles (1 s). This allows for the exploitingof the permitted gaps to reduce both the number of data to be aggregated (a minimum of one 10/12cycles t.i. of every 50/60 cycles, for a total of three to mediate) and the computational time requirements.Slightly different aggregation intervals are defined in [38]; for example, 1 min aggregation intervalsare considered for the assessment of voltage variations. In this framework, in [50] some comparativeanalyses have been made on the application of 1 and 10 min aggregation t.i., showing how the differentt.i. and the requirements to have 100% of the measured data in the permissible range can pose someissues for the event assessment sensitivity, i.e., a single 1 min value can cause a negative assessment ofvoltage variation.
Sensors 2020, 20, x FOR PEER REVIEW 7 of 25
Therefore, the instrument based on STCOMET cannot be classified in class A; thus, in the performed feasibility study class S requirements have been considered as a target for the implementation and verification of PQ and harmonics measurement metrics.
As regards the data aggregation over additional intervals, class S requirements are depicted in Figures 4 and 5. In more detail, the data for the 150/180-cycles (i.e., 3 s) time interval shall be aggregated from fifteen contiguous 10/12-cycles (200 ms) base time intervals (see Figure 4). The aggregated data are calculated as the square root of the arithmetic mean of the squared input values measured in the base time intervals. For example, this is the case of RMS measurements. On the other hand, gaps are permitted for harmonics, inter-harmonics, mains signaling voltage, and unbalance (see Figure 5); in this case, a minimum of three 10/12-cycles values shall be used every 150/180-cycle time interval, i.e., at least one 10/12-cycles value shall be used every 50/60 cycles (1 s). This allows for the exploiting of the permitted gaps to reduce both the number of data to be aggregated (a minimum of one 10/12 cycles t.i. of every 50/60 cycles, for a total of three to mediate) and the computational time requirements. Slightly different aggregation intervals are defined in [38]; for example, 1 min aggregation intervals are considered for the assessment of voltage variations. In this framework, in [50] some comparative analyses have been made on the application of 1 and 10 min aggregation t.i., showing how the different t.i. and the requirements to have 100% of the measured data in the permissible range can pose some issues for the event assessment sensitivity, i.e., a single 1 min value can cause a negative assessment of voltage variation.
Figure 4. Aggregation intervals for Class S: parameters for which gaps are not permitted.
Figure 5. Aggregation intervals for class S: parameters for which gaps are permitted.
IEC 61000-4-7 accuracy requirements are reported in Table 2 for class I and class II instruments; the maximum allowable errors refer to single-frequency and steady-state signals, in the operating frequency range and under rated operating conditions indicated by the manufacturer (temperature and/or humidity ranges, rated supply voltage, etc.). No specific accuracy requirements are given for phase angle measurement.
Another important aspect to be addressed when dealing with power quality and harmonic measurements is the impact of measurement transducers. In fact, it is known that they are a key component of the measurement chain, which has a great impact on the overall measurement accuracy. In IEC 61000-4-30 the effect of transducers is acknowledged but not addressed in detail and external transducers and their associated uncertainty is not included in the accuracy requirements. The nature
Figure 4. Aggregation intervals for Class S: parameters for which gaps are not permitted.
Sensors 2020, 20, x FOR PEER REVIEW 7 of 25
Therefore, the instrument based on STCOMET cannot be classified in class A; thus, in the performed feasibility study class S requirements have been considered as a target for the implementation and verification of PQ and harmonics measurement metrics.
As regards the data aggregation over additional intervals, class S requirements are depicted in Figures 4 and 5. In more detail, the data for the 150/180-cycles (i.e., 3 s) time interval shall be aggregated from fifteen contiguous 10/12-cycles (200 ms) base time intervals (see Figure 4). The aggregated data are calculated as the square root of the arithmetic mean of the squared input values measured in the base time intervals. For example, this is the case of RMS measurements. On the other hand, gaps are permitted for harmonics, inter-harmonics, mains signaling voltage, and unbalance (see Figure 5); in this case, a minimum of three 10/12-cycles values shall be used every 150/180-cycle time interval, i.e., at least one 10/12-cycles value shall be used every 50/60 cycles (1 s). This allows for the exploiting of the permitted gaps to reduce both the number of data to be aggregated (a minimum of one 10/12 cycles t.i. of every 50/60 cycles, for a total of three to mediate) and the computational time requirements. Slightly different aggregation intervals are defined in [38]; for example, 1 min aggregation intervals are considered for the assessment of voltage variations. In this framework, in [50] some comparative analyses have been made on the application of 1 and 10 min aggregation t.i., showing how the different t.i. and the requirements to have 100% of the measured data in the permissible range can pose some issues for the event assessment sensitivity, i.e., a single 1 min value can cause a negative assessment of voltage variation.
Figure 4. Aggregation intervals for Class S: parameters for which gaps are not permitted.
Figure 5. Aggregation intervals for class S: parameters for which gaps are permitted.
IEC 61000-4-7 accuracy requirements are reported in Table 2 for class I and class II instruments; the maximum allowable errors refer to single-frequency and steady-state signals, in the operating frequency range and under rated operating conditions indicated by the manufacturer (temperature and/or humidity ranges, rated supply voltage, etc.). No specific accuracy requirements are given for phase angle measurement.
Another important aspect to be addressed when dealing with power quality and harmonic measurements is the impact of measurement transducers. In fact, it is known that they are a key component of the measurement chain, which has a great impact on the overall measurement accuracy. In IEC 61000-4-30 the effect of transducers is acknowledged but not addressed in detail and external transducers and their associated uncertainty is not included in the accuracy requirements. The nature
Figure 5. Aggregation intervals for class S: parameters for which gaps are permitted.
IEC 61000-4-7 accuracy requirements are reported in Table 2 for class I and class II instruments;the maximum allowable errors refer to single-frequency and steady-state signals, in the operatingfrequency range and under rated operating conditions indicated by the manufacturer (temperature

Sensors 2020, 20, 6361 8 of 27
and/or humidity ranges, rated supply voltage, etc.). No specific accuracy requirements are given forphase angle measurement.
Table 2. Maximum errors of voltage and current according to IEC 61000-4-7.
Class Measurement Conditions Maximum Error
I
Voltage Um ≥ 1% UnomUm < 1% Unom
±5% Um±0.05% Unom
Current Im ≥ 3% InomIm < 3% Inom
±5% Im±0.15% Inom
Power Pm ≥ 150WPm < 150W
±1% Pm±1.5W
II
Voltage Um ≥ 3% UnomUm < 3% Unom
±5% Um±0.15% Unom
Current Im ≥ 10% InomIm < 10% Inom
±5% Im±0.5% Inom
Another important aspect to be addressed when dealing with power quality and harmonicmeasurements is the impact of measurement transducers. In fact, it is known that they are a keycomponent of the measurement chain, which has a great impact on the overall measurement accuracy.In IEC 61000-4-30 the effect of transducers is acknowledged but not addressed in detail and externaltransducers and their associated uncertainty is not included in the accuracy requirements. The natureof this problem is better addressed in IEC TR 61869-103 [38], which specifically deals with theuse of instrument transformers (both inductive and electronic) for power quality measurements.As detailed in [38], to evaluate transducer influence on the overall uncertainty on the measurementof a given power quality parameters, it is necessary to simultaneously consider the behavior of thetransducer for a given disturbance and the related measurement method. Typically, the nonlinearityof the transducer can determine a worsening of the measurement uncertainty when the input signal(voltage or current) is not sinusoidal. The transducer impact on the overall uncertainty can be quantifiedas an added uncertainty that combines with the uncertainty of the measuring system. In this viewpoint,harmonic measurements can be negatively affected by the transducer presence, because of its frequencyresponse (and bandwidth).
In this framework, the issues related to the implementation of harmonic analysis on STCOMETare analyzed in Section 3.2 with the aim of investigating the possibility of developing an instrumentfor harmonic measurements compliant with IEC 61000-4-7 accuracy requirements (class II). For phaseangles measurements, quality metering specifications of IEC TR 61869-103 have [38] been used forreference; according to quality metering requirements of [38], phase errors at harmonics should bebelow 1◦ for 1st and 2nd harmonic and below 5◦ for other harmonics.
3. PQ Metrics Implementation on STCOMET
3.1. On-Board Metrics Compliance Verification and Correction Algorithms
As mentioned in the previous section, STCOMET already implements the measurement of: powersystem frequency; voltage and current RMS; and voltage dips and swells. The comparison between theIEC 61000-4-30 requirements for class S instruments and the STCOMET on-board metrics is reported inTable 3. To meet IEC 61000-4-30 requirements for on-board metrics, some correction algorithms havebeen implemented, as described in [35]. In brief:
− For frequency measurement, the main difference between IEC 61000-4-30 requirements andSTCOMET on-board metric is the measurement time (10 s vs. 8 µs, i.e., STCOMET measurementsare updated every 8 µs); thus the measurement over 10 s has been obtained as the mean of thefrequency values (updated at every 8 µs) over the time interval of 10 s.

Sensors 2020, 20, 6361 9 of 27
− For voltage/current RMS measurement, the main difference between the IEC 61000-4-30requirements and STCOMET on-board metric is the observation window in subsequentmeasurements. In fact, IEC 61000-4-30 requires that the measurements shall be obtained over thebase time interval (e.g., 10 cycles at 50 Hz); subsequent time intervals shall be contiguous, and notoverlapping. STCOMET calculates RMS over the aforesaid base time interval; however, the RMSmeasurement is updated every 128 µs, i.e., once a new signal sample is available from the analogto digital converter (ADC). Thus, in the correction algorithm, the measurement reading updatehas been modified in order to obtain one RMS reading every 10 cycles.
− Main on-board metrics modifications were made for swells, dips, and interruptions.In fact, for swells and dips, IEC 61000-4-30 requires the measurement of a pair of data,i.e., the maximum/residual/voltage (i.e., the maximum/minimum voltage value recorded duringthe swell/dip) and the event duration, which is the difference between start and end times of theswell/dip (i.e., the time when the voltage RMS rises above/falls below the swell/dip threshold,and the time when the voltage RMS equals or goes back below/above the threshold); in this case,the RMS shall be measured over half a cycle or one cycle (Urms(1/2) or Urms(1), respectively).For interruptions, only event duration shall be measured. The STCOMET on-board metric wasvery different from the IEC 61000-4-30 one. Thus, a new algorithm was implemented, based onthe measurement of Urms(1), as summarized in Table 3.
The aforesaid metrics were experimentally validated in [35]. In the following, further results arereported for frequency and RMS measurements, in both sinusoidal and distorted conditions whichconfirm the class S requirements compliance.
As regards the metrics not already on-board on STCOMET, in this study, voltage and currentharmonics measurements have been implemented and tested, as described in the next sections.
3.2. Harmonics Analysis Implementation on STCOMET
As already mentioned, the EVLKSTCOMET10-1 uses a zero-crossing method for measuring thesignal period/frequency, therefore this value can be used for the synchronization of the observationwindow Tw of 10/12 cycles of the 50/60 Hz input signal, i.e., 200 ms. If the frequency is not 50 Hz, thewindow would be greater or less than 200 ms. In accordance with [37], DFT/FFT algorithms have beenevaluated for harmonic analysis. DFT can be performed with any number of samples N, but it has ahigher computational cost (O(N2)); on the other hand, the FFT has a much lower computational cost(O(NlogN)), however, it needs a number of samples equal to a power of two to be performed (i.e., N= 1024, 2048, etc). An analysis of the computational time required for the algorithm executions withSTCOMET leads to choose FFT (DFT execution time was not compatible with timing requirements forharmonic analysis even considering gaps).
To use the FFT, the closest values for N should be 2048. On the other hand, the STCOMET hasa fixed sampling frequency of 7812.5 Hz, then the acquisition of 2048 samples would lead to a notsynchronous observation window (i.e., Tw = 2048 × 128 µs ≈ 262 ms , 200 ms). Thus, a time-domaininterpolation algorithm has been implemented to obtain N = 2048 samples over the time interval of10 cycles.
Figure 6 shows a flow chart representing the operations of the algorithm implementedon STCOMET.

Sensors 2020, 20, 6361 10 of 27
Table 3. STCOMET on-board metrics vs. IEC 61000-4-30 requirements (class S) [33].
ParameterIEC 61000-4-30 STCOMET Metric Main
Features Correction AlgorithmsMeasurement Range Time Interval (t.i.) Maximum Error
FrequencyPeriod
42.5 ÷ 57.5 Hz(for 50 Hz syst.)
10 s(not overlapping)
− Number of integer cyclesduring the 10-s t.i.divided by theircumulative duration
− Harmonics andinterharmonicsare attenuated
− Measurement fromzero-crossing (voltagechannel, with a low passfilter).
− Frequency range between32.55 and 81.38 Hz
− Resolution of 8 µs− Period is calculated as the
mean of the last eightmeasured periods
− Single frequency value isobtained as periodreciprocal(on-board metric)
− Frequency measurementis calculated as the meanof the single frequencyvalues over 10 s
RMS 20 ÷ 120% Udin200 ms
(10 cycles for 50 Hz)no gaps
− The r.m.s. value includes,by definition, harmonics,interharmonics, etc.
− Every 10/12-cycle intervalshall be contiguous andnot overlapping
− Not used for dips, swells,voltage interruptions,and transients
− RMS measurement isobtained fromvoltage/current samples
− Voltage/current arenot filtered
− Integration time is10 cycles
− RMS value is updatedevery 128 µs
− No modifications ofon-board metric
− Measurement reading isupdated every 10 cycles,in order to have notoverlapping t.i.

Sensors 2020, 20, 6361 11 of 27
Table 3. Cont.
ParameterIEC 61000-4-30 STCOMET Metric Main
Features Correction AlgorithmsMeasurement Range Time Interval (t.i.) Maximum Error
DipsSwells
Interruptions— —
− The basic measurementshall be the RMS over ahalf cycle or full cycle(Urms(1/2) or Urms(1))
− Measured data aremaximum/residualvoltage (i.e., the max./min.voltage value during theevent) and duration (i.e.,the difference betweenstart and end times ofthe event)
− For interruptions onlyduration is measured
− The fundamentalcomponent of voltage(RMS) is compared to a10-bit threshold
− An internal time counteris incremented until themomentary voltage valueis below/abovethe threshold
− Maximum/residualvoltage is not calculated
− Interruptionsmeasurement isnot on-board
− (Urms(1)) hasbeen implemented
− Urms(1) is compared withthe event threshold toobtain event start, end,and duration
− An internal counter isincremented until Urms(1)value is below/abovethe threshold
− Urms(1) measurement isused to store theresidual/max. voltage
Harmonics 10 ÷ 100% of harmoniclimits, up to 40th order
200 ms (gaps allowed)± 0.03%
max. synchr. error(optional)
− DFT/FFT− t.i. synchronized to the
power system frequency− Rectangular window
(Hanning in case of lossof synchronization
− Not on-board − New algorithm(see Section 3.2)
Sensors 2020, 20, 6361 12 of 27
Sensors 2020, 20, x FOR PEER REVIEW 12 of 25
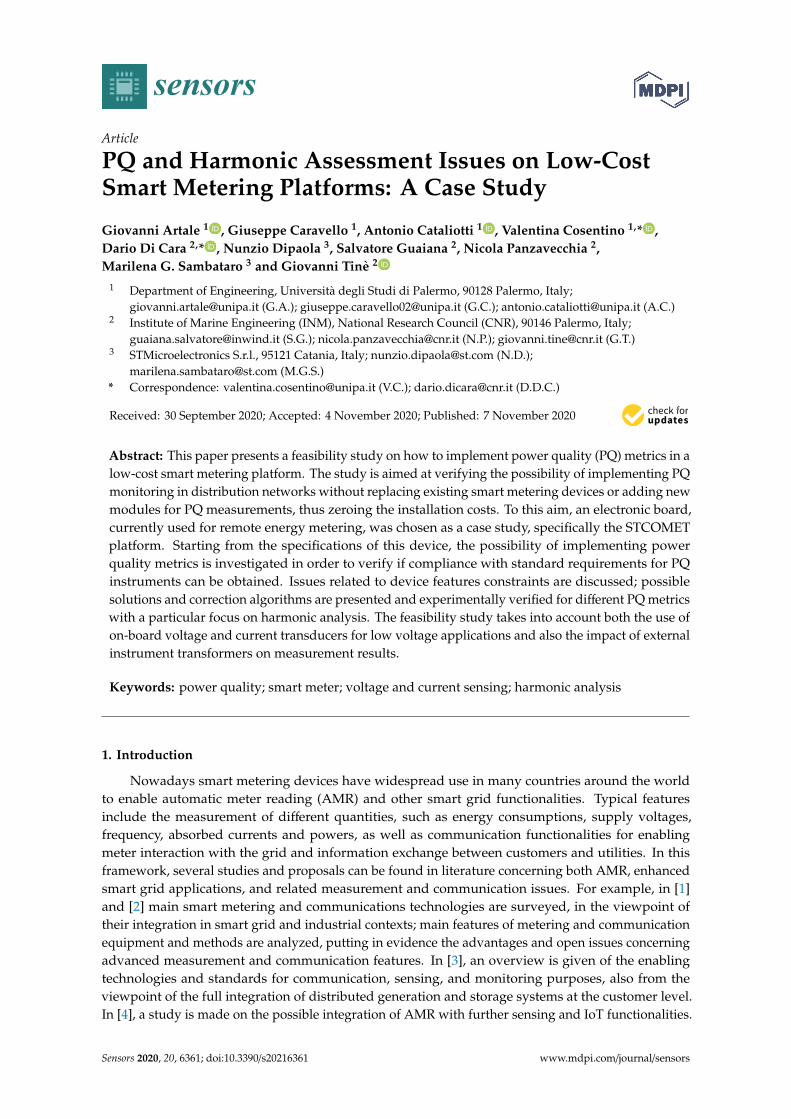
Figure 6. Flow operations performed by STCOMET.
In this way, whatever the input signal period is, the algorithm is able to virtually synchronize the observation window, in order to minimize the synchronization error. In addition, the “virtual re-sampling” of the signal allows for the calculation of the FFT on 2048 samples in the observation window of 10 signal periods, thus minimizing leakage and scallop loss errors. The adoption of a simple linear interpolation algorithm allows for the limiting of the computational cost of the harmonic calculation (FFT + interpolation). To demonstrate this, the FFT computation time was experimentally measured, both with and without the interpolation; as shown in Figure 7, the overall time needed for FFT with interpolation is 11.4 ms (a time of 9.6 ms was measured in the case of FFT calculation without interpolation). It should be noted that while executing the interpolation and FFT algorithms, the device continues acquiring the samples of the subsequent observation window, which are stored in memory for the next FFT calculation.
CALCULATE OBSERVATION WINDOW
(Tw = 10 Ts)
ACQUIRE SAMPLE N++
NO
YES
INTERPOLATE
(TIME DOMAIN - 2048 SAMPLES)
(Fc_virtual = 2048 / Tw)
N = Tw *Fc
CALCULATE FFT
START
MEASURE PERIOD (Ts) (Tsignal)
(Tw = 10 Tsignal)
(N = Tw · fs)
(fs_virtual = 2048 / Tw)
Figure 6. Flow operations performed by STCOMET.
1. Starting from the measurement of the signal period Tsignal (carried out by STCOMET viazero-crossing, ZRC), an observation window equal to Tw = 10 Tsignal is set (for example, in thecase of a 50 Hz signal, Tsignal = 20 ms, Tw = 200 ms).
2. The number of samples to be acquired and used for the algorithm is set: N = Tw × fs, where fs= 7812.5 Hz is the STCOMET sampling frequency (M = 1562.5 samples, rounding to the upperinteger, i.e., 1563).
3. The time-domain interpolation of the acquired N samples is carried out to obtain 2048 samplesfor the FFT algorithm (a simple linear interpolation algorithm was used in the implementation,to minimize the computational cost). A virtual sampling frequency is determined, fs_virtual,which, in the same observation window Tw, would lead to the acquisition of the aforesaid2048 samples:
fs_virtual = 2048/Tw (4)
In the case of Tw = 200 ms, fs_virtual = 10,240 Hz.
4. The FFT is calculated on the 2048 samples.

Sensors 2020, 20, 6361 13 of 27
As regards the memory requirements, in the case of f = 50 Hz, Tw = 200 ms, and fs = 7812.5 Hz,the number of samples acquired is M = Tw/fs = 1563, so the number of bytes allocated in the STCOMETmemory for samples storage is:
K = 1563 × 32 = 6.252 kB (5)
Considering that for the FFT calculation it is necessary to store 2048 samples (with both real andimaginary part), memory occupation is equal to 2048 × 32 × 2 = 16 kB. Furthermore, to allow theacquisition of samples of the subsequent observation window while performing the FFT calculation,it is necessary to instantiate a second register of 16 kB size. This was made in order to investigate thepossibility of harmonic measurements without gaps between the observation windows. In summary,32 kB are needed for samples storage and the FFT calculation algorithm; this requirement is compliantwith STCOMET features, since the device has a RAM of 128 kB.
In this way, whatever the input signal period is, the algorithm is able to virtuallysynchronize the observation window, in order to minimize the synchronization error. In addition,the “virtual re-sampling” of the signal allows for the calculation of the FFT on 2048 samples in theobservation window of 10 signal periods, thus minimizing leakage and scallop loss errors. The adoptionof a simple linear interpolation algorithm allows for the limiting of the computational cost of theharmonic calculation (FFT + interpolation). To demonstrate this, the FFT computation time wasexperimentally measured, both with and without the interpolation; as shown in Figure 7, the overalltime needed for FFT with interpolation is 11.4 ms (a time of 9.6 ms was measured in the case of FFTcalculation without interpolation). It should be noted that while executing the interpolation andFFT algorithms, the device continues acquiring the samples of the subsequent observation window,which are stored in memory for the next FFT calculation.Sensors 2020, 20, x FOR PEER REVIEW 13 of 25
Figure 7. Time measured for the FFT calculation FFT.
Figure 8 shows the plots of the FFT calculated by STCOMET without interpolation (a) and with interpolation (b) (test with sinusoidal voltage, f = 50 Hz, Vrms = 230 V); as expected, the use of interpolation drastically reduces leakage and scallop loss errors.
(a)
(b)
Figure 8. (a) FFT without interpolation; (b) FFT with interpolation.
Figure 7. Time measured for the FFT calculation FFT.
Figure 8 shows the plots of the FFT calculated by STCOMET without interpolation (a) and withinterpolation (b) (test with sinusoidal voltage, f = 50 Hz, Vrms = 230 V); as expected, the use ofinterpolation drastically reduces leakage and scallop loss errors.

Sensors 2020, 20, 6361 14 of 27
Sensors 2020, 20, x FOR PEER REVIEW 13 of 25
Figure 7. Time measured for the FFT calculation FFT.
Figure 8 shows the plots of the FFT calculated by STCOMET without interpolation (a) and with interpolation (b) (test with sinusoidal voltage, f = 50 Hz, Vrms = 230 V); as expected, the use of interpolation drastically reduces leakage and scallop loss errors.
(a)
(b)
Figure 8. (a) FFT without interpolation; (b) FFT with interpolation. Figure 8. (a) FFT without interpolation; (b) FFT with interpolation.
4. Experimental Results
4.1. Test System
A measuring test bench was been set up as shown in Figure 9. To evaluate the PQ measurementperformances, a calibrator was used as a reference for both voltage and current. The calibrator modelused for experimental tests was the Fluke 6100A. Full accuracy specifications of the calibrator for PQparameters are reported in the instrument manual [48]. Main accuracy specifications for the tests hereinpresented are the following: 50 ppm for frequency (setting the resolution to 0.1 Hz); up to ± (190 ppmof output + 33 mV) for fundamental and harmonic voltage amplitudes in the range from 70 to 1008 Vfor frequencies from 16 to 850 Hz and ± (524 ppm of output + 33 mV) for frequencies from 850 Hz to 6kHz; up to ± (267 ppm of output + 720 µA) for fundamental and harmonic current amplitudes in therange from 2 to 21 A for frequencies from 16 to 850 Hz; up to 0.080◦ for current to voltage phase shift,for frequencies from 16 to 850 Hz and amplitudes from 0.5% to 40% of range. For the feasibility studypresented in this work, the calibrator was assumed as a reference for the STCOMET characterization;for each measured quantity, the measurement system error was calculated as the difference betweenthe value set on the calibrator and that measured with STCOMET.
Sensors 2020, 20, 6361 15 of 27
Sensors 2020, 20, x FOR PEER REVIEW 14 of 25
4. Experimental Results
4.1. Test System
A measuring test bench was been set up as shown in Figure 9. To evaluate the PQ measurement performances, a calibrator was used as a reference for both voltage and current. The calibrator model used for experimental tests was the Fluke 6100A. Full accuracy specifications of the calibrator for PQ parameters are reported in the instrument manual [48]. Main accuracy specifications for the tests herein presented are the following: 50 ppm for frequency (setting the resolution to 0.1 Hz); up to ± (190 ppm of output + 33 mV) for fundamental and harmonic voltage amplitudes in the range from 70 to 1008 V for frequencies from 16 to 850 Hz and ± (524 ppm of output + 33 mV) for frequencies from 850 Hz to 6 kHz; up to ± (267 ppm of output + 720 μA) for fundamental and harmonic current amplitudes in the range from 2 to 21 A for frequencies from 16 to 850 Hz; up to 0.080° for current to voltage phase shift, for frequencies from 16 to 850 Hz and amplitudes from 0.5% to 40% of range. For the feasibility study presented in this work, the calibrator was assumed as a reference for the STCOMET characterization; for each measured quantity, the measurement system error was calculated as the difference between the value set on the calibrator and that measured with STCOMET.
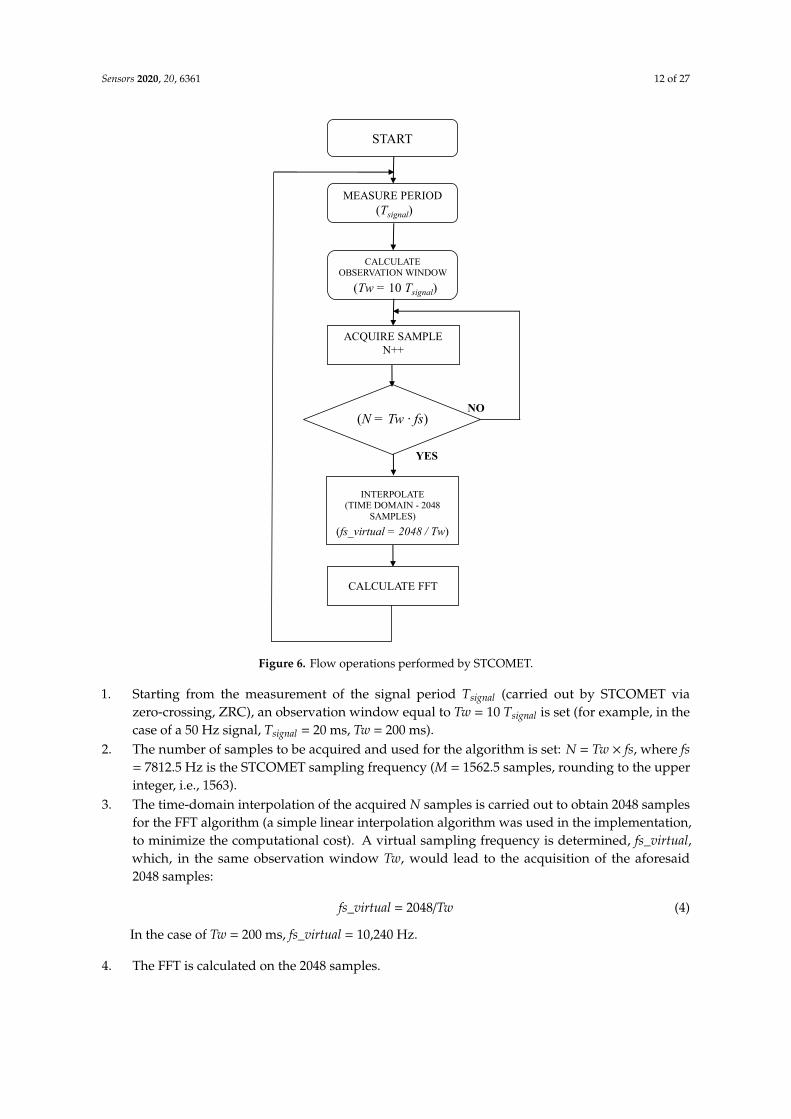
Voltage measurements were directly acquired by STCOMET. To investigate the impact of external measurement transducers, current measurements were carried out with and without an external current transformer (CT); in both cases, the STCOMET current channel with internal shunt was used. The external current transformer is an open window CT used by Italian utilities to connect energy meters to low voltage distribution networks. The CT-rated data are summarized in Table 4. The window diameter is 3 cm. The EVLKSTCOMET10-1 has been connected to a PC via USB JTAG J-linkOB. STCOMET firmware was updated with both the corrected on-board metrics and the harmonic analysis algorithm using the IAR Embedded Workbench.
Tests were carried out reproducing different PQ phenomena (harmonics, dips, and swell interruptions) and for different frequencies of the test signal (in the range of 42.5 ÷ 57.5 Hz). Some results for dips, swells, and interruptions can be found in [35]. In the following sections, some results for frequency and voltage/current RMS and harmonics measurements are presented. For current measurements, both amplitudes and phase errors are shown.
Figure 9. Test bench.
Figure 9. Test bench.
Voltage measurements were directly acquired by STCOMET. To investigate the impact of externalmeasurement transducers, current measurements were carried out with and without an external currenttransformer (CT); in both cases, the STCOMET current channel with internal shunt was used. Theexternal current transformer is an open window CT used by Italian utilities to connect energy metersto low voltage distribution networks. The CT-rated data are summarized in Table 4. The windowdiameter is 3 cm. The EVLKSTCOMET10-1 has been connected to a PC via USB JTAG J-linkOB.STCOMET firmware was updated with both the corrected on-board metrics and the harmonic analysisalgorithm using the IAR Embedded Workbench.
Table 4. External current transformer rated data.
CT
Transformer ratio 125/5 A/A
Standard burden 2.5 VA
Class 0.5
Rated frequency 50 Hz
Rated voltage 400 V
Tests were carried out reproducing different PQ phenomena (harmonics, dips, and swellinterruptions) and for different frequencies of the test signal (in the range of 42.5 ÷ 57.5 Hz).Some results for dips, swells, and interruptions can be found in [35]. In the following sections,some results for frequency and voltage/current RMS and harmonics measurements are presented. Forcurrent measurements, both amplitudes and phase errors are shown.
4.2. Voltage Measurements
Tests have been made in both sinusoidal and distorted conditions.Results obtained with the FFT algorithm are shown, together with RMS and frequency
measurements; as already mentioned, errors between values generated by the calibrator and thosemeasured by STCOMET are calculated and compared with IEC 61000-4-30 and IEC 61000-4-7 accuracyrequirements. In more detail, calculated errors are listed in Table 5.
Sensors 2020, 20, 6361 16 of 27
Table 5. Error definitions.
Parameter Description
E = |f_FFT − f_gen| Error, in mHz, on the frequency measurements both for fundamentaland harmonics obtained via FFT
e% = 100 × |V_FFT − V_gen|/V_genPercentage error on amplitude measurements obtained via FFT(fundamental and harmonics of amplitude greater than 3% of therated voltage, V_nom, i.e., 230 V)
e% = 100 × |V_FFT − V_gen|/V_nom Percentage error on amplitude measurements obtained through FFT(harmonics of amplitude less than 3% of the nominal voltage V_nom)
where:
• f_FFT e V_FFT are frequency and amplitude (in RMS) measured by STCOMET (fundamental andharmonics);
• f_gen e V_gen are frequency and amplitude (in RMS) generated by the calibrator (fundamentaland harmonics).
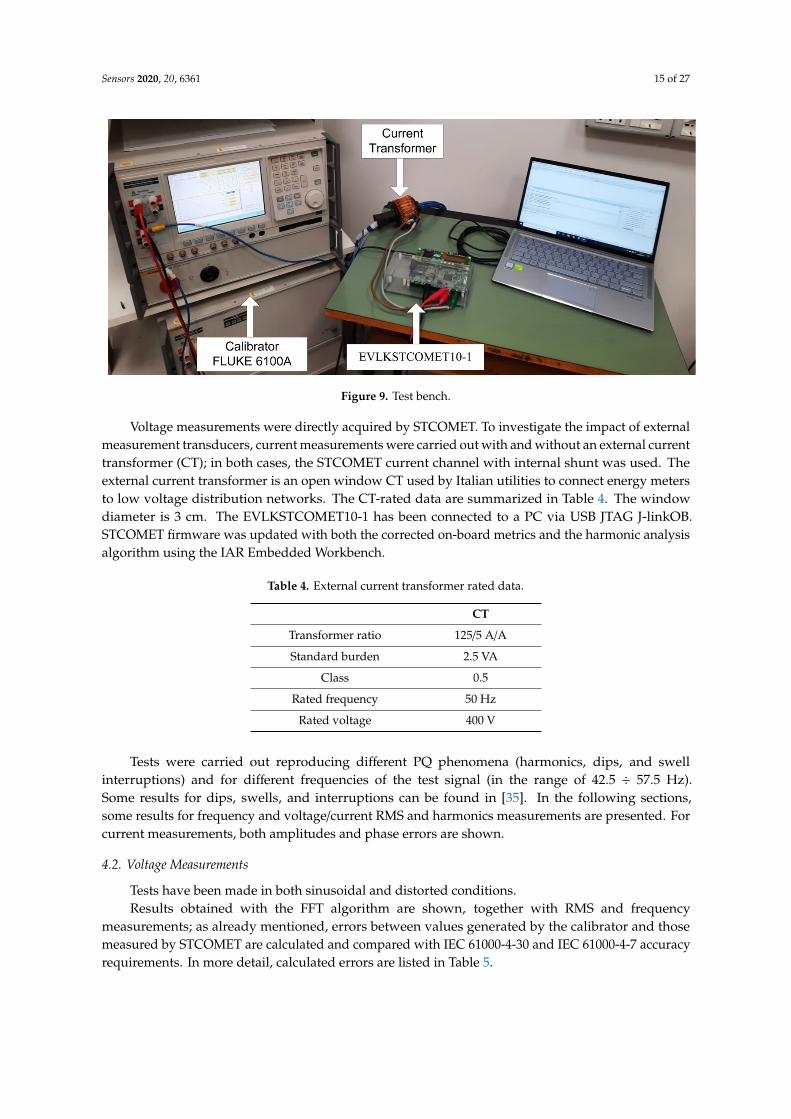
Some results of tests with sinusoidal voltage are reported in Table 6, for different frequency values(50, 42.5, and 57.5 Hz). Figures 10–12 show the spectra obtained at the three frequencies 50, 42.5,and 57.5 Hz, respectively. The obtained errors are compatible with the limits set by IEC 61000-4-30 forclass S instruments (equal to ±50 mHz and ±0.5% for frequency and RMS measurements, respectively).
Table 6. Voltage measurements in sinusoidal tests at different frequencies.
Calibrator SettingsSTCOMET Measurements and Related Errors
Output FFT
f_gen(Hz)
V_gen(V)
f1_FFT(Hz)
E(mHz)
V1_FFT(V) e%
50.0 230 50.0000 0.0 229.26 0.32
42.5 230 42.5025 2.5 229.28 0.31
57.5 230 57.524 24 229.27 0.31Sensors 2020, 20, x FOR PEER REVIEW 16 of 25
Figure 10. FFT plot values obtained with STCOMET using interpolation (V = 230 V, f = 50 Hz).
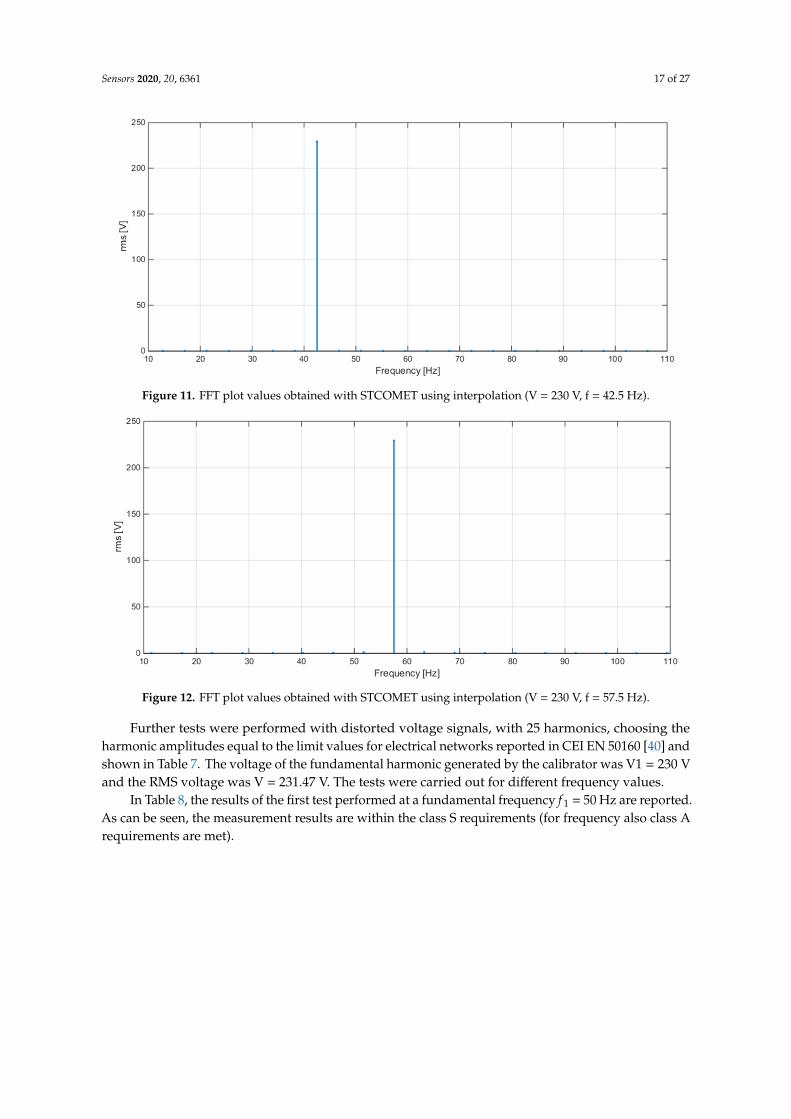
Figure 11. FFT plot values obtained with STCOMET using interpolation (V = 230 V, f = 42.5 Hz).
Figure 12. FFT plot values obtained with STCOMET using interpolation (V = 230 V, f = 57.5 Hz).
Figure 10. FFT plot values obtained with STCOMET using interpolation (V = 230 V, f = 50 Hz).
Sensors 2020, 20, 6361 17 of 27
Sensors 2020, 20, x FOR PEER REVIEW 16 of 25
Figure 10. FFT plot values obtained with STCOMET using interpolation (V = 230 V, f = 50 Hz).
Figure 11. FFT plot values obtained with STCOMET using interpolation (V = 230 V, f = 42.5 Hz).
Figure 12. FFT plot values obtained with STCOMET using interpolation (V = 230 V, f = 57.5 Hz).
Figure 11. FFT plot values obtained with STCOMET using interpolation (V = 230 V, f = 42.5 Hz).
Sensors 2020, 20, x FOR PEER REVIEW 16 of 25
Figure 10. FFT plot values obtained with STCOMET using interpolation (V = 230 V, f = 50 Hz).
Figure 11. FFT plot values obtained with STCOMET using interpolation (V = 230 V, f = 42.5 Hz).
Figure 12. FFT plot values obtained with STCOMET using interpolation (V = 230 V, f = 57.5 Hz). Figure 12. FFT plot values obtained with STCOMET using interpolation (V = 230 V, f = 57.5 Hz).
Further tests were performed with distorted voltage signals, with 25 harmonics, choosing theharmonic amplitudes equal to the limit values for electrical networks reported in CEI EN 50160 [40] andshown in Table 7. The voltage of the fundamental harmonic generated by the calibrator was V1 = 230 Vand the RMS voltage was V = 231.47 V. The tests were carried out for different frequency values.
In Table 8, the results of the first test performed at a fundamental frequency f 1 = 50 Hz are reported.As can be seen, the measurement results are within the class S requirements (for frequency also class Arequirements are met).

Sensors 2020, 20, 6361 18 of 27
Table 7. CEI EN 50160—harmonic voltages amplitudes at the power supply terminals (% of thefundamental voltage).
Odd HarmonicsEven Harmonics
Non-Multiple of 3 Multiple of 3
HarmonicOrder h
RelativeAmplitude Uh
HarmonicOrder h
RelativeAmplitude Uh
HarmonicOrder h
RelativeAmplitude Uh
5 6.0% 3 5.0% 2 2.0%
7 5.0% 9 1.5% 4 1.0%
11 3.5% 15 0.5% 6 . . . 24 0.5%
13 3.0% 21 0.5%
17 2.0%
19 1.5%
23 1.5%
25 1.5%
Table 8. RMS and frequency measurement results. Distorted voltage signal with 25 harmonics,f 1 = 50 Hz.
Supply Values MeasuredValue Error Maximum Error IEC
61000-4-30 Class A/S
RMS 231.47 (V) 230.70 (V) 0.33% ±0.5% Udin1 S
Frequency 50.0 (Hz) 50.0000 [Hz] 0.0 (mHz) ±10 mHz A1 Udin is the declared supply voltage.
The measured errors for each harmonic are reported in Table 9. Comparing these values with thatof the limits reported in Table 2, it is possible to observe that the measuring system is compatible withthe class II requirements (in some cases measurement results comply also with class I limits).
• f_gen is the frequency generated by the calibrator;• V_gen is the voltage generated by the calibrator;• f_FFT is the frequency measured using the FFT algorithm;• E is the absolute error between f_FFT and f_gen expressed in mHz;• V_FFT is the measured voltage;• Em is the error on the measured value calculated (see Table 2);• En is the error on the nominal value (see Table 2).
The same test with 25 harmonics was repeated for different signal frequencies. Some results arereported in the following tables for 42.5 Hz (see Tables 10 and 11) and 57.5 Hz (see Tables 12 and 13).Even in these cases, measurement results are within the class S maximum allowable errors for RMSand frequency and they are compatible with the class II requirements for harmonic measurements (forfrequency also class A requirements are met and in many cases errors on harmonics are within classI limits).

Sensors 2020, 20, 6361 19 of 27
Table 9. FFT results. Distorted voltage signal with 25 harmonics; f 1 = 50 Hz.
f_gen V_gen V_gen f_FFT E V_FFT Em En Class I Class II Class
(Hz) (V) (%) (Hz) (mHz) (V) (%) (%) Limits Limits Limits
1 50 230 100% 50.0000 0.0 229.25 0.33% 0.32% True True I
2 100 4.6 2.0% 100.000 0.0 4.586 0.30% 0.006% True True I
3 150 11.5 5.0% 150.000 0.0 11.460 0.35% 0.017% True True I
4 200 2.3 1.0% 200.000 0.0 2.289 0.48% 0.005% True True I
5 250 13.8 6.0% 250.000 0.0 13.705 0.69% 0.041% True True I
6 300 1.15 0.5% 300.000 0.0 1.139 0.98% 0.005% True True I
7 350 11.5 5.0% 350.000 0.0 11.38 1.0% 0.051% True True I
8 400 1.15 0.5% 400.000 0.0 1.136 1.3% 0.006% True True I
9 450 3.45 1.5% 450.000 0.0 3.402 1.4% 0.021% True True I
10 500 1.15 0.5% 500.000 0.0 1.130 1.8% 0.009% True True I
11 550 8.05 3.5% 550.000 0.0 7.890 2.0% 0.070% True True I
12 600 1.15 0.5% 600.000 0.0 1.124 2.2% 0.011% True True I
13 650 6.9 3.0% 650.000 0.0 6.720 2.6% 0.079% True True I
14 700 1.15 0.5% 700.000 0.0 1.115 3.1% 0.015% True True I
15 750 1.15 0.5% 750.000 0.0 1.113 3.2% 0.016% True True I
16 800 1.15 0.5% 800.000 0.0 1.106 3.8% 0.019% True True I
17 850 4.6 2.0% 850.000 0.0 4.40 4.3% 0.086% True True I
18 900 1.15 0.5% 900.000 0.0 1.096 4.7% 0.023% True True I
19 950 3.45 1.5% 950.000 0.0 3.27 5.2% 0.079% False True II
20 1000 1.15 0.5% 1000.00 0.0 1.083 5.8% 0.029% True True I
21 1050 1.15 0.5% 1050.00 0.0 1.078 6.2% 0.031% True True I
22 1100 1.15 0.5% 1100.00 0.0 1.070 7.0% 0.035% True True I
23 1150 3.45 1.5% 1150.00 0.0 3.19 7.6% 0.11% False True II
24 1200 1.15 0.5% 1200.00 0.0 1.058 8.0% 0.040% True True I
25 1250 3.45 1.5% 1250.00 0.0 3.15 8.8% 0.13% False True II
Table 10. RMS and frequency measurement results. Distorted voltage signal with 25 harmonics,f 1 = 42.5 Hz.
Supply Values MeasuredValue
Error withRespect to the
Calibrator
Maximum Error IEC61000-4-30 Class A/S
RMS 231.47 (V) 230.66 (V) 0.35% ±0.5% Udin S
Frequency 42.5 (Hz) 42.5025 (Hz) 2.5 mHz ±10 mHz A

Sensors 2020, 20, 6361 20 of 27
Table 11. FFT results. Distorted voltage signal with 25 harmonics, f 1 = 42.5 Hz.
Harmf_gen V_gen V_gen f_FFT E V_FFT Em En Class I Class II Class
(Hz) (V) (%) (Hz) (mHz) (V) (%) (%) Limits Limits Limits
1 42.5 230 100% 42.5026 2.6 229.33 0.29% 0.289% True True I
2 85 4.6 2.0% 85.0051 5.1 4.588 0.26% 0.005% True True I
3 127.5 11.5 5.0% 127.508 7.7 11.462 0.33% 0.016% True True I
4 170 2.3 1.0% 170.010 10 2.290 0.46% 0.005% True True I
5 212.5 13.8 6.0% 212.513 13 13.726 0.53% 0.032% True True I
6 255 1.15 0.5% 255.015 15 1.1435 0.56% 0.003% True True I
7 297.5 11.5 5.0% 297.518 18 11.408 0.80% 0.040% True True I
8 340 1.15 0.5% 340.020 20 1.1423 0.67% 0.003% True True I
9 382.5 3.45 1.5% 382.523 23 3.415 1.0% 0.015% True True I
10 425 1.15 0.5% 425.026 26 1.138 1.1% 0.005% True True I
11 467.5 8.05 3.5% 467.528 28 7.93 1.5% 0.051% True True I
12 510 1.15 0.5% 510.031 31 1.131 1.7% 0.008% True True I
13 552.5 6.9 3.0% 552.533 33 6.76 2.0% 0.061% True True I
14 595 1.15 0.5% 595.036 36 1.126 2.1% 0.010% True True I
15 637.5 1.15 0.5% 637.538 38 1.122 2.4% 0.012% True True I
16 680 1.15 0.5% 680.041 41 1.118 2.8% 0.014% True True I
17 722.5 4.6 2.0% 722.543 43 4.47 2.9% 0.058% True True I
18 765 1.15 0.5% 765.046 46 1.114 3.1% 0.016% True True I
19 807.5 3.45 1.5% 807.548 48 3.32 3.7% 0.055% True True I
20 850 1.15 0.5% 850.051 51 1.103 4.0% 0.020% True True I
21 892.5 1.15 0.5% 892.554 54 1.101 4.3% 0.021% True True I
22 935 1.15 0.5% 935.056 56 1.094 4.9% 0.024% True True I
23 977.5 3.45 1.5% 977.559 59 3.27 5.2% 0.079% False True II
24 1020 1.15 0.5% 1020.061 61 1.083 5.9% 0.029% True True I
25 1063 3.45 1.5% 1062.564 64 3.23 6.4% 0.095% False True II
Table 12. RMS and frequency measurement results. Distorted voltage signal with 25 harmonics, f 1 =
57.5 Hz.
Supply Values MeasuredValue
Error with Respectto the Calibrator
Maximum Error IEC61000-4-30 Class A/S
RMS 231.47 (V) 230.70 (V) 0.33% ±0.5% Udin S
Frequency 57.5 (Hz) 57.4977 (Hz) 2.3 mHz ±10 mHz A

Sensors 2020, 20, 6361 21 of 27
Table 13. FFT results. Distorted voltage signal with 25 harmonics, f 1 = 57.5 Hz.
Harmf_gen V_gen V_gen f_FFT E V_FFT Em En Class I Class II Class(Hz) (V) (%) (Hz) (mHz) (V) (%) (%) Limits Limits Limits
1 57.5 230 100% 57.4977 2.3 229.31 0.30% 0.300% True True I
2 115 4.6 2.0% 114.9954 4.6 4.585 0.32% 0.006% True True I
3 172.5 11.5 5.0% 172.4931 6.9 11.454 0.40% 0.020% True True I
4 230 2.3 1.0% 229.9908 9.2 2.288 0.52% 0.005% True True I
5 287.5 13.8 6.0% 287.489 12 13.69 0.81% 0.049% True True I
6 345 1.15 0.5% 344.986 14 1.139 0.93% 0.005% True True I
7 402.5 11.5 5.0% 402.484 16 11.36 1.2% 0.062% True True I
8 460 1.15 0.5% 459.982 18 1.132 1.6% 0.008% True True I
9 517.5 3.45 1.5% 517.479 21 3.384 1.9% 0.029% True True I
10 575 1.15 0.5% 574.977 23 1.124 2.2% 0.011% True True I
11 632.5 8.05 3.5% 632.475 25 7.84 2.6% 0.091% True True I
12 690 1.15 0.5% 689.972 28 1.116 3.0% 0.015% True True I
13 747.5 6.9 3.0% 747.470 30 6.66 3.4% 0.10% True True I
14 805 1.15 0.5% 804.968 32 1.10 4.1% 0.021% True True I
15 862.5 1.15 0.5% 862.466 35 1.09 5.2% 0.026% True True I
16 920 1.15 0.5% 919.963 37 1.09 5.1% 0.025% True True I
17 977.5 4.6 2.0% 977.461 39 4.34 5.7% 0.11% False True II
18 1035 1.15 0.5% 1034.959 41 1.07 6.5% 0.032% True True I
19 1093 3.45 1.5% 1092.456 44 3.21 6.9% 0.10% False True II
20 1150 1.15 0.5% 1149.954 46 1.06 7.8% 0.039% True True I
21 1208 1.15 0.5% 1207.452 48 1.05 9.0% 0.045% True True I
22 1265 1.15 0.5% 1264.949 51 1.04 9.3% 0.046% True True I
23 1323 3.45 1.5% 1322.447 53 3.10 10% 0.15% False True II
24 1380 1.15 0.5% 1379.945 55 1.03 10% 0.053% True True I
25 1438 3.45 1.5% 1437.443 58 3.05 11% 0.17% False True II
Further tests were carried out by changing the phase shift between harmonic and fundamentalcomponents of the voltage test signal. This allowed for the investigation of the influence of harmonicphase shift, which can negatively affect the measurement accuracy, especially in the presence ofmeasurement transducers. Tests herein presented were performed with a distorted voltage withfundamental frequency f 1 = 50 Hz, fundamental amplitude V1 = 230 V, and four harmonics, i.e., the II,III, VI, and XI order harmonics. Each harmonic has an amplitude equal to 10% of the fundamental.For each harmonic, phase shift with respect to the fundamental harmonic was changed from −180◦
to +180◦, with steps of 30◦. Tables 14 and 15 show amplitude and phase errors in harmonic voltagemeasurements, respectively. It can be seen that the proposed measurement system complies with classI requirements.

Sensors 2020, 20, 6361 22 of 27
Table 14. Voltage module error for II, IV, VI, and XI order harmonics.
Amplitude Error
Harmonic Order Min Max Average
II 0.013% 0.13% 0.071%
III 0.001% 0.12% 0.047%
VI 0.084% 0.12% 0.11%
XI 0.12% 0.32% 0.27%
Table 15. Voltage phase error for II, IV, VI, and XI order harmonics.
Phase Error (deg)
Harmonic Order Min Max Average
II 0.089 0.15 0.12
III 0.028 0.088 0.043
VI 0.065 0.11 0.086
XI 0.089 0.14 0.12
4.3. Current Measurements
The tests made for voltage were repeated also for currents. As regards RMS and FFT measurements,the results obtained were similar to those obtained for voltage measurements.
The tests with harmonics at different phase-shifts were carried out with and without the externalCT, in order to investigate not only the STCOMET behavior in current measurements but also theexternal CT influence on the measurement results. Tests herein presented were carried out at 50 Hz,with fundamental current amplitude I1 = 5A; II, III, VI, and XI order harmonics have been considered,with an amplitude equal to the 10% of fundamental current and variable phase shift from −180◦ to+180◦, with steps of 30◦.
Tables 16 and 17 show amplitude and phase errors in harmonic current measurements, respectively,for the tests without the external CT. Also, in this case, the proposed measurement system complieswith class I requirements.
Table 16. Current amplitude error for II, IV, VI, and XI order harmonics.
Amplitude Error
Harmonic Order Min Max Average
II 0.087% 0.31% 0.21%
III 0.073% 0.53% 0.28%
VI 0.020% 0.5% 0.32%
XI 0.039% 1.12% 0.27%
Table 17. Current phase error for II, IV, VI, XI order harmonics.
Phase Error (deg)
Harmonic Order Min Max Average
II 0.050 0.31 0.18
III 0.015 0.25 0.096
VI 0.001 0.13 0.062
XI 0.024 0.24 0.11

Sensors 2020, 20, 6361 23 of 27
The aforesaid tests were repeated with the external CT, whose secondary winding was connectedto the on-board shunt (see test bench of Figure 9). To obtain the rated current (125 A), a 10-turnsprimary winding was set up. Each turn had a very large diameter compared to the CT windowdiameter. Moreover, the 10 loops of the winding were wound in a compact group, with a small sectioncompared to the CT window area. In this way, the current generated by the calibrator was 12.5 A andit had the same magnetic effects as a 125 A equivalent current flowing in a single cable.
Tables 18 and 19 show amplitude and phase errors in current measurements, respectively. It canbe seen that the measured errors are higher in comparison to those of Tables 16 and 17 because they arestrongly influenced by the CT behavior. Moreover, they have a large variability with the harmonicphase shift with respect to fundamental. This behavior is in agreement with what was found inprevious works on the CT metrological performances in distorted conditions [47].
Table 18. Current amplitude error with externa CT.
Amplitude Error
Harmonic Order Min Max Average
II 0.57% 1.6% 1.1%
III 0.49% 1.7% 0.96%
VI 0.29% 2.0% 1.0%
XI 0.16% 1.4% 0.73%
Table 19. Current phase error with externa CT.
Current Phase Error
Harmonic Order Min Max Average
II 0.017 0.38 0.25
III 0.019 0.44 0.29
VI 0.065 1.8 0.96
XI 0.98 2.4 1.8
5. Conclusions
The paper has verified the possibility to implement PQ metrics into smart meters used for remoteenergy metering purposes. The aim of this feasibility study was to demonstrate that PQ distributedmonitoring can be performed in a distribution network without replacing already installed smartmeters or adding new PQ modules. In fact, the proposed solution entails a firmware upgrade,which implements the power quality metrics using the available calculation capabilities. Moreover,using the metering infrastructure already installed and the power line communication capabilities ofthe smart meters, PQ measurements can be collected, and statistical analysis can be performed all overdistribution networks.
The feasibility of PQ metrics implementation in smart meters was demonstrated by choosingthe real case study of STCOMET, an electronic board widely used for remote energy meteringpurposes in different countries. Starting from an analysis of the electronic board specifications, it wasverified that the fixed sampling frequency value results in a synchronization error outside class Arequirements. Thus, class S instrument prescriptions were considered as a reference both for PQmetrics and for data aggregation over additional intervals. Different correction algorithms of on-boardmetrics were implemented in order to comply with standard requirements for each parameter to bemeasured, i.e., frequency, voltage, and current RMS; voltage dips and swells. As regards harmonicmeasurements, the considered board has no predefined metrics. Thus, different solutions wereconsidered for harmonic analysis implementation. The analysis led to the choice of the FFT algorithm

Sensors 2020, 20, 6361 24 of 27
with interpolation. In this way, the signal is “virtually re-sampled” minimizing leakage and scalloploss errors. The adoption of a simple linear interpolation algorithm allows for the limiting of thecomputational cost of the harmonic calculation (FFT + interpolation), which is compatible with theboard capabilities. Moreover, the calculation times were measured and found to be compatible withstandard requirements, thus confirming the feasibility of the proposed solution. The compliancewith accuracy standard requirements was then verified with experimental tests. Different distortedconditions were tested, varying the frequency of the signal and the harmonic content, in terms of bothharmonic component amplitudes and phase shifts. Summarizing the results of all the tested cases,the study has shown that correction algorithms applied to on-board metrics allowed for the meetingof IEC 61000-4-30 requirements for class S instruments for the following measurement quantities:frequency; voltage and current, RMS; interruptions, voltage dips, and swells. Moreover, thanks tothe developed harmonic measurement algorithm, the smart meter fulfills the class II requirementsfor harmonic measurements according to IEC 61000-4-7. In many cases, errors on harmonics wereeven found within class I limits. However, the compatibility with class S and class II requirementsgrants that smart meters enhanced with the developed firmware can be correctly used for statisticalapplications, such as surveys or power quality assessment all over an LV network. In this viewpoint,future work will be focused on using these new measurement capabilities in a distributed measurementarchitecture, developing and testing new algorithms for fault detection and fault diagnosis, extensivepower quality surveys, and harmonic distortion assessment.
Finally, some tests were performed to study the effect on harmonic measurements of additionalexternal transducers, specifically a current transformer used to couple energy meters to LV networks.As expected, larger errors were found which have a larger variability with harmonic phase shift withrespect to fundamental. Future work will be focused on implementing on-board correction techniquesof CT errors in distorted condition, thus reducing the total uncertainty associated with the wholemeasurement chain.
Author Contributions: Conceptualization, A.C., V.C., D.D.C., N.D., and G.T.; data curation, G.A., S.G., N.P.,and G.C.; investigation, A.C., V.C., D.D.C., and G.T.; methodology, A.C., V.C., D.D.C., N.P., N.D., and G.T.;software, G.A., S.G., N.P., and G.C.; supervision, A.C., V.C., D.D.C., M.G.S., and G.T.; validation, G.A., A.C., V.C.,D.D.C., S.G., N.P., G.C., M.G.S., and G.T.; writing—original draft, G.A., S.G., N.P., and G.C.; writing—review andediting, A.C., V.C., D.D.C., N.D., M.G.S., and G.T. All authors have read and agreed to the published version ofthe manuscript.
Funding: This research was funded by the following grant: PO FESR Sicilia 2014–2020, Action 1.1.5, Project n.08000PA90246, Project acronym: I-Sole, Project title: “Smart grids per le isole minori (Smart grids for smallislands)”, CUP: G99J18000540007.
Conflicts of Interest: The authors declare no conflict of interest.
References
1. Kabalci, Y. A survey on smart metering and smart grid communication. Renew. Sustain. Energy Rev. 2016, 57,302–318. [CrossRef]
2. O’Driscoll, E.; O’Donnell, G.E. Industrial power and energy metering—A state-of-the-art review. J. Clean. Prod.2013, 41, 53–64. [CrossRef]
3. Bayram, I.S.; Ustun, T.S. A survey on behind the meter energy management systems in smart grid.Renew. Sustain. Energy Rev. 2017, 72, 1208–1232. [CrossRef]
4. Mlakic, D.; Baghaee, H.R.; Nikolovski, S.; Vukobratovic, M.; Balkic, Z. Conceptual design of iot-based amrsystems based on iec 61850 microgrid communication configuration using open-source hardware/softwareied. Energies 2019, 12, 4281. [CrossRef]
5. Elgenedy, M.; Papadopoulos, T.A.; Galli, S.; Chrysochos, A.I.; Papagiannis, G.K.; Al-Dhahir, N. MIMO-OFDMNB-PLC designs in underground medium-voltage networks. IEEE Syst. J. 2019, 13, 3759–3769. [CrossRef]
6. Bali, M.C.; Rebai, C. Improved maximum likelihood S-FSK receiver for PLC modem in AMR. J. Electr.Comput. Eng. 2012, 2012, 452402. [CrossRef]

Sensors 2020, 20, 6361 25 of 27
7. Kim, K.; Jin, S.-I. Branch-Based centralized data collection for smart grids using wireless sensor networks.Sensors 2015, 15, 11854–11872. [CrossRef]
8. Martinez-Sandoval, R.; Garcia-Sanchez, A.-J.; Garcia-Sanchez, F.; Garcia-Haro, J.; Flynn, D. A comprehensivewsn-based approach to efficiently manage a smart grid. Sensors 2014, 14, 18748–18783. [CrossRef]
9. Fan, H.; Liu, Y.; Zeng, Z. Decentralized privacy-preserving data aggregation scheme for smart grid based onblockchain. Sensors 2020, 20, 5282. [CrossRef]
10. Lu, S.; Repo, D.G.; Della, F.A.; Figuerola, A.L.; Pikkarainen, M. Real-time low voltage network monitoring-ICTarchitecture and field test experience. IEEE Trans. Smart Grid 2015, 6, 2002–2012. [CrossRef]
11. Pereira, R.; Figueiredo, J.; Melicio, R.; Mendes, V.M.F.; Martins, J.; Quadrado, J.C. Consumer energymanagement system with integration of smart meters. Energy Rep. 2015, 1, 22–29. [CrossRef]
12. Cataliotti, A.; Cosentino, V.; di Cara, D.; Guaiana, S.; Panzavecchia, N.; Tine, G. A new solution forlow-voltage distributed generation interface protection system. IEEE Trans. Instrum. Meas. 2015, 64,2086–2095. [CrossRef]
13. Artale, G.; Caravello, G.; Cataliotti, A.; Cosentino, V.; Di Cara, D.; Guaiana, S.; Nguyen Quang, N.; Palmeri, M.;Panzavecchia, N.; Tinè, G. A virtual tool for load flow analysis in a micro-grid. Energies 2020, 13, 3173.[CrossRef]
14. Castello, P.; Ferrari, P.; Flammini, A.; Muscas, C.; Pegoraro, P.A.; Rinaldi, S. A distributed pmu for electricalsubstations with wireless redundant process bus. IEEE Trans. Instrum. Meas. 2015, 64, 1149–1157. [CrossRef]
15. Delle Femine, A.; Gallo, D.; Landi, C.; Luiso, M. The design of a low cost phasor measurement unit. Energies2019, 12, 2648. [CrossRef]
16. Tosato, P.; Macii, D.; Luiso, M.; Davide, B.; Daniele, G.; Carmine, L. A tuned lightweight estimation algorithmfor low-cost phasor measurement units. IEEE Trans. Instrum. Meas. 2018, 67, 1047–1057. [CrossRef]
17. Castello, P.; Ferrero, R.; Pegoraro, P.A.; Toscani, S. Effect of unbalance on positive-sequence synchrophasor,frequency, and rocof estimations. IEEE Trans. Instrum. Meas. 2018, 67, 1036–1046. [CrossRef]
18. Pegoraro, P.A.; Meloni, A.; Atzori, L.; Castello, P.; Sulis, S. PMU-Based distribution system state estimationwith adaptive accuracy exploiting local decision metrics and iot paradigm. IEEE Trans. Instrum. Meas. 2017,66, 704–714. [CrossRef]
19. Cataliotti, A.; Cervellera, C.; Cosentino, V.; Di Cara, D.; Gaggero, M.; Maccio, D.; Marsala, G.; Ragusa, A.;Tine, G. An improved load flow method for MV networks based on LV load measurements and estimations.IEEE Trans. Instrum. Meas. 2018, 68, 430–438. [CrossRef]
20. Cataliotti, A.; Cosentino, V.; Di Cara, D.; Tinè, G. LV Measurement device placement for load flow analysis inmv smart grids. IEEE Trans. Instrum. Meas. 2016, 65, 999–1006. [CrossRef]
21. Artale, G.; Cataliotti, A.; Cosentino, V.; Di Cara, D.; Guaiana, S.; Telaretti, E.; Panzavecchia, N.; Tinè, G.Incremental heuristic approach for meter placement in radial distribution systems. Energies 2019, 12, 3917.[CrossRef]
22. Rinaldi, S.; Della Giustina, D.; Ferrari, P.; Flammini, A. Distributed monitoring system for voltage dipclassification over distribution grid. Sustain. Energy Grids Netw. 2016, 6, 70–80. [CrossRef]
23. Bucci, G.; Ciancetta, F.; D’Innocenzo, F.; Fiorucci, E.; Ometto, A. Development of a low cost power meterbased on a digital signal controller. Int. J. Emerg. Electr. Power Syst. 2018, 19. [CrossRef]
24. De Souza, W.A.; Marafao, F.P.; Liberado, E.V.; Diniz, I.S.; Serni, P.J.A. Power quality, smart meters andadditional information from different power terms. IEEE Latin America Trans. 2015, 13, 158–165. [CrossRef]
25. Morales-Velazquez, L.; de Jesus Romero-Troncoso, R.; Herrera-Ruiz, G.; Morinigo-Sotelo, D.;Osornio-Rios, R.A. Smart sensor network for power quality monitoring in electrical installations. Measurement2017, 103, 133–142. [CrossRef]
26. Caramia, P.; Carpinelli, G.; Verde, P. Power Quality Indices in Liberalized Markets; John Wiley & Sons, Ltd.:Chichester, UK, 2009.
27. Viciana, E.; Alcayde, A.; Montoya, F.G.; Baños, R.; Arrabal-Campos, F.M.; Zapata-Sierra, A.;Manzano-Agugliaro, F. OpenZmeter: An efficient low-cost energy smart meter and power quality analyzer.Sustainability 2018, 10, 4038. [CrossRef]
28. Viciana, E.; Alcayde, A.; Montoya, F.G.; Baños, R.; Arrabal-Campos, F.M.; Manzano-Agugliaro, F. An openhardware design for internet of things power quality and energy saving solutions. Sensors 2019, 19, 627.[CrossRef]

Sensors 2020, 20, 6361 26 of 27
29. Tomesc, L.; Dobra, P.; Abrudean, M. Low-cost power quality analyzer. IFAC Proc. 2007, 40, 157–162.[CrossRef]
30. Leccese, F.; Cagnetti, M.; Di Pasquale, S.; Giarnetti, S.; Caciotta, M. A new power quality instrument basedon raspberry-pi. Electronics 2016, 5, 64. [CrossRef]
31. Castello, P.; Muscas, C.; Pegoraro, P.A.; Sulis, S. Low-cost energy meter with power quality functionalities.In Proceedings of the 24th Imeko TC 4 International Symposium and 22nd International Workshop on ADCand DAC Modelling and Testing, IMEKO TC-4, Palermo, Italy, 14–16 September 2020.
32. Atalik, T.; Cadirci, I.; Demirci, T.; Ermis, M.; Inan, T.; Kalaycioglu, A.S.; Salor, Ö. Multipurpose platform forpower system monitoring and analysis with sample grid applications. IEEE Trans. Instrum. Meas. 2014, 63,566–582. [CrossRef]
33. Rodrigues, E.M.G.; Godina, R.; Shafie-Khah, M.; Catalão, J.P.S. Experimental results on a wireless wattmeterdevice for the integration in home energy management systems. Energies 2017, 10, 398. [CrossRef]
34. Bolshev, V.; Vinogradov, A.; Jasinski, M.; Sikorski, T.; Leonowicz, Z.; Gono, R. Monitoring the number andduration of power outages and voltage deviations at both sides of switching devices. IEEE Access 2020, 8,137174–137184. [CrossRef]
35. Artale, G.; Cataliotti, A.; Cosentino, V.; Guaiana, S.; Di Cara, D.; Panzavecchia, N.; Tine, G.; Dipaola, N.;Sambataro, M.G. PQ Metrics Implementation on Low Cost Smart Metering Platforms. A Case Study Analysis.In Proceedings of the 9th IEEE International Workshop on Applied Measurements for Power Systems,Bologna, Italy, 26–28 September 2018.
36. IEC 61000-4-30, 2015. Electromagnetic Compatibility (EMC)—Part 4-30: Testing and MeasurementTechniques—Power Quality Measurement Methods; IEC: Geneva, Switzerland, 2015.
37. IEC 61000-4-7, 2002. Electromagnetic Compatibility (EMC)—Part 4-7: Testing and MeasurementTechniques—General Guide on Harmonics and Interharmonics Measurements and Instrumentation, for PowerSupply Systems and Equipment Connected Thereto; IEC: Geneva, Switzerland, 2002.
38. IEC/TR 61869-103:2012. Instrument Transformers—The Use of Instrument Transformers for Power QualityMeasurements; IEC: Geneva, Switzerland, 2012.
39. IEEE Standard 1459, 2010. IEEE Standard Definitions for the Measurement of Electric Power Quantities underSinusoidal, Nonsinusoidal, Balanced, or Unbalanced Conditions; IEEE: New York, NY, USA, 2010.
40. European Standard EN 50160: 2015. Voltage Characteristics of Electricity Supplied by Public Electricity Networks;CENELEC: Brussels, Belgium, 2015.
41. Crotti, G.; Gallo, D.; Giordano, D.; Landi, C.; Luiso, M. A characterized method for the real-time compensationof power system measurement transducers. IEEE Trans. Instrum. Meas. 2015, 64, 1398–1404. [CrossRef]
42. Delle Femine, A.; Gallo, D.; Landi, C.; Lo Schiavo, A.; Luiso, M. Low Power Contactless Voltage Sensor forLow Voltage Power Systems. Sensors 2019, 19, 3513. [CrossRef]
43. Faifer, M.; Laurano, C.; Ottoboni, R.; Toscani, S.; Zanoni, M. Harmonic distortion compensation in voltagetransformers for improved power quality measurements. IEEE Trans. Instrum. Meas. 2019, 68, 3823–3830.[CrossRef]
44. Collin, A.J.; Femine, A.D.; Gallo, D.; Langella, R.; Luiso, M. Compensation of current transformers’nonlinearities by tensor linearization. IEEE Trans. Instrum. Meas. 2019, 68, 3841–3849. [CrossRef]
45. Faifer, M.; Laurano, C.; Ottoboni, R.; Toscani, S.; Zanoni, M.; Crotti, G.; Giordano, D.; Barbieri, L.; Gondola, M.;Mazza, P. Overcoming frequency response measurements of voltage transformers: An approach based onquasi-sinusoidal volterra models. IEEE Trans. Instrum. Meas. 2018, 68, 2800–2807. [CrossRef]
46. Mingotti, A.; Peretto, L.; Tinarelli, R. A smart frequency domain-based modeling procedure of rogowski coilfor power systems applications. IEEE Trans. Instrum. Meas. 2020, 69, 6748–6755. [CrossRef]
47. Cataliotti, A.; Cosentino, V.; Crotti, G.; Delle Femine, A.; Di Cara, D.; Gallo, D.; Giordano, D.; Landi, C.;Luiso, M.; Modarres, M. Compensation of nonlinearity of voltage and current instrument transformers.IEEE Trans. Instrum. Meas. 2019, 68, 1322–1332. [CrossRef]
48. AN4732, Application Note. STCOMET Smart Meter and Power Line Communication System-on-Chip DevelopmentKit; STMIcroelectronics: Geneva, Switzerland, September 2017.
49. Fluke 6100A Electrical Power Standard, Users Manual, Version 6.0; Fluke Corporation: Everett, WA, USA,December 2008.

Sensors 2020, 20, 6361 27 of 27
50. Jasinski, M.; Sikorski, T.; Kostyła, P.; Kaczorowska, D.; Leonowicz, Z.; Rezmer, J.; Szymanda, J.; Janik, P.;Bejmert, D.; Rybianski, M.; et al. Influence of measurement aggregation algorithms on power qualityassessment and correlation analysis in electrical power network with PV power plant. Energies 2019, 12,3547. [CrossRef]
Publisher’s Note: MDPI stays neutral with regard to jurisdictional claims in published maps and institutionalaffiliations.
© 2020 by the authors. Licensee MDPI, Basel, Switzerland. This article is an open accessarticle distributed under the terms and conditions of the Creative Commons Attribution(CC BY) license (http://creativecommons.org/licenses/by/4.0/).