PowerPoint 演示文稿 - Huazhu Group
34
China Lodging Group (HTHT.US) Q3 2017 Earnings Call November 28, 2017
-
Upload
khangminh22 -
Category
Documents
-
view
0 -
download
0
Transcript of PowerPoint 演示文稿 - Huazhu Group

China Lodging Group (HTHT.US)Q3 2017 Earnings Call
November 28, 2017

1
Agenda
Strategy Review
Operational and Financial Review
Q & A
Appendix

2
• Upgrade for Economy Hotels
• Multi-brand Strategy - Fast Expansion of
Midscale Hotels
• Continuous Growth in Same-hotel RevPAR
Strategic Focus for 2017

3
HanTing Same-hotel RevPAR Growth
Accelerated to 9.8%
-5.8%-5.4%-4.4%-4.9%
-2.3%-3.3%
-0.9%
1.1%
5.2%
8.0%
9.8%
Q1'15 Q2'15 Q3'15 Q4'15 Q1'16 Q2'16 Q3'16 Q4'16 Q1'17 Q2'17 Q3'17

4
First HanTing Plus Open in Shanghai
this October
• RevPAR of
RMB358 in the first
operational month
• 40% year-over-
year after upgrade
• 23 hotels in
pipeline
New and refreshed layout of lobby:
Niiice Café + Self Check-in/-out
A wider choice of pillows for
customers’ needs
Simplified and functional layout of
room24 hours self storage and laundry
Photos from HanTing Plus Hotel, South Xizang Road, Shanghai,
upgrade from HanTing Hotel
5
Roll-out of Elan 1.0 – Smart
Renovation
6
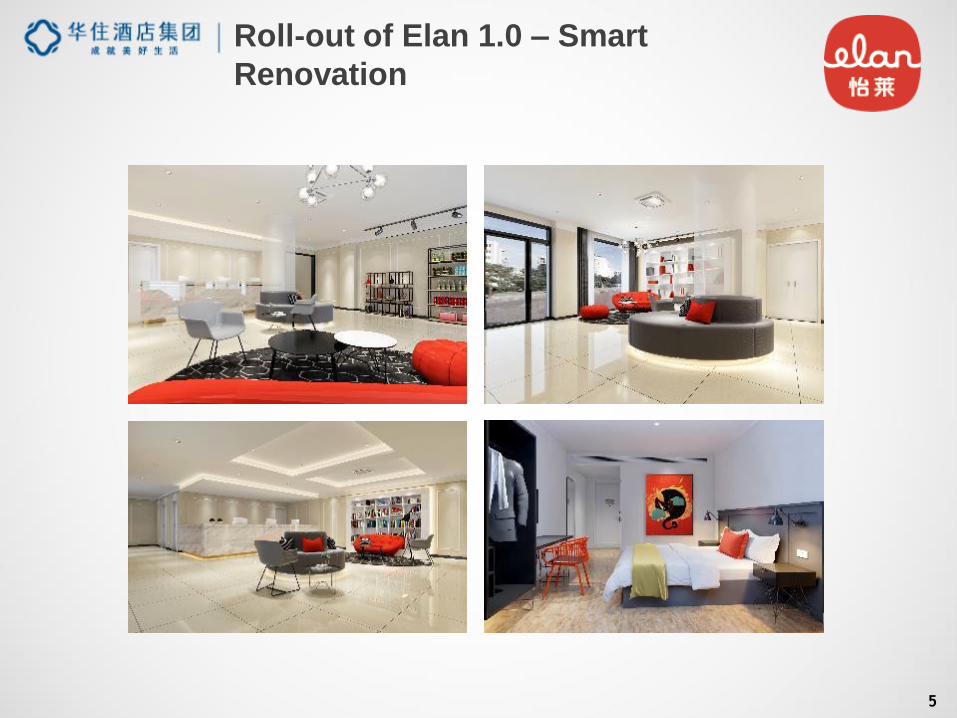
Roll-out of Hi Inn 4.0 – Optimized
Space Utilization

7
Standardized
In Core
Elements
Standardized
In StylesStandardized
Upper Midscale
Midscale
Entry Level
Midscale
桔子酒店·精选
Well-covered Brand Portfolio in Midscale
Segment
*
* Note: The newer version of ibis brand hotels is positioned as entry level midscale brands.
However, the ibis hotels continued to be classified as economy hotel in the reported hotel operating
statistics because majority of the current hotels are of the older versions.

8
economy, 59%
mid- and up-scale,
41%
Increasing Revenue Contribution from Mid-
and Up-Scale Hotels
Net Revenues Grew by 33.8% YOY;
Revenue Contribution from Mid-and-Upscale Hotels Increased by 13 percentage points
+33.8%
economy, 72%
mid- and up-scale,
28%
Q3’16 Q3’17

9
Increasing Proportion of Mid- and Up-Scale
Room Inventory
Mid- and Up-Scale Rooms
66%
Pipeline(17Q3)
23,481
40,687
60,539 63,442
84,94293,745
11%
15%
18%19%
24%
25%
6%
11%
16%
21%
26%
-
10,000
20,000
30,000
40,000
50,000
60,000
70,000
80,000
90,000
100,000
2014 2015 2016 2017Q1 2017Q2 2017Q3
Mid and Up Scale Rooms As % of Total Rooms
~41,500
Including acquisition of
Crystal Orange

10
Update on Crystal Orange
Same-hotel RevPAR
Strong and Accelerated RevPAR Growth Accomplishments
Integration of operational
and booking systems
Loyalty program
Back-office supports –
Finance, HR, Call Centre
304 342
June'16 June'17
+12.3%ADR +4.8%
OCC +5.6pts
320 367
Q3'16 Q3'17
+14.5%ADR +7.1%
OCC +5.6pts
Note: The RevPar for Crystal Orange hotels above are not included
in the reported company-wide same hotel RevPar statistics until they
have been in the Company’s system for more than 18 months.

11
Enhancing Huazhu Loyalty Program and
App
Huazhu Club Displayed on High-speed
Train Shanghai-Beijing Route
Hello, Huazhu - New Feature on App to
Bridge Communication with Guests
Convenient and customized digital booking
Lowest price from Huazhu’s direct online channels
First hotel booking app to incorporate communication feature with guests

12
5.18.4
15.1
31.8
49.1
78.6
96.9
2011 2012 2013 2014 2015 2016 2017Q3
(in millions)
Fast-growing Membership Program and
Strong Direct Channels
Rapid Growth in Membership Program Strong Direct Channels
Direct Channels,86%
(in room nights, Q3’17)Surpassed 100 million
in November, 2017

13
12%11%12%
2%
-2%
3%5% 5%
10%7%
5%2% 1% 0% 1% 1%
-1% 0% 0%-3%
-5% -4% -3% -3%-0.3%-1.2%
0.5%2.5%
5.8%8.3%
9.5%11%
7% 7%
3%
-1%
4%6% 7% 8%
10Q1 10Q3 11Q1 11Q3 12Q1 12Q3 13Q1 13Q3 14Q1 14Q3 15Q1 15Q3 16Q1 16Q3 17Q1 17Q3
All hotels Non-Shanghai hotels
Same-hotel RevPAR Growth
7%5%3%3%3%3% 3%
1%
3%3%3%3%
0%0%
2%0%
-1%
1%0%0%
0.8%
-0.7%0.4%
1.6%
1.8%
3%
4.5%
11Q1 11Q4 12Q3 13Q2 14Q1 14Q4 15Q3 16Q2 17Q1
Same-hotel ADR Growth
(2011, outside of Shanghai
-7%
-2%
3%4%5% 4%
2%
1%
-2%-4%-2%-2%
-1%
0%
-2%-3%-3%
-5%-3%
-3%-0.9%
-0.4%
0.2% 0.7%
3.3%4.5%
4.4%
11Q1 11Q4 12Q3 13Q2 14Q1 14Q4 15Q3 16Q2 17Q1
Same-hotel Occupancy Change
For hotels in operation for at least 18 months
Favorable Supply-Demand Relationship Drives
Same-hotel RevPAR Growth
Note: Crystal Orange hotels RevPAR are not included in our reported same-hotel RevPAR statistics
until they have been in Huazhu ‘s system for more than 18 months..

14
Strong Blended RevPAR Growth Driven by
ADR+Occupancy Growth and Mix Upgrade
-2.0% -1.5%
-1.0%
-4.6%
-6.2% -5.3%-3.3%-2.3%
1.1% 1.1%3.2%
5.7%
9.8%
14.0%
17.3%
Q1'14Q2'14Q3'14Q4'14Q1'15Q2'15Q3'15Q4'15Q1'16Q2'16Q3'16Q4'16Q1'17Q2'17Q3'17
Quarterly Blended RevPAR Year-over-Year Growth (Q1’14-Q3’17)
ADR +12.1%
OCC +4.2pts

15
194
218
9, +4.5%
15, +7.6%
Q3'16 Q3'17
The Room Rate Increase is Affordable to the
Chinese Consumers with their Consumption
Upgrade
Blended ADR increased by RMB24 year-over-year in Q3’17
28
(RMB)
24 <
Same-hotel
ADR growth
Mix change
+12.1%

16
2,309
2,627
3,003
3,296 3,383 3,452
2011 2012 2013 2014 2015 2016
Same-hotel RevPAR will Continue to Grow due
to Sustaining Strong Demand
1,931
2,271
2,628
3,031
3,420
3,899
2011 2012 2013 2014 2015 2016
(in RMB billions)
Domestic Travel Expenditures
Source: China National Tourism Administration
Disposable Income per capita
+2%
(USD)
+14%

17
… And the Slow-down in the Net Addition of
Branded Hotel Supply Growth Since 2016
3,757 5,120
7,314 9,924
12,727
16,375
21,481 24,150
952
1,363
2,194
2,610 2,803
3,648
5,106
2,669
0
1,000
2,000
3,000
4,000
5,000
6,000
0
5,000
10,000
15,000
20,000
25,000
30,000
2009 2010 2011 2012 2013 2014 2015 2016 2017E
# of branded hotels Net Addition
# of Branded Hotels
Source: Inntie, China National Tourism Administration

18
Agenda
Strategy Review
Operational and Financial Review
Q & A
Appendix

19
465 565 611 616 624 684
570
860
1,384
2,147
2,645 2,972
1,035
1,425
1,995
2,763
3,269
3,656
2012 2013 2014 2015 2016 2017Q3
Number of Hotels in Operation
Manachised and Franchised Hotels
Leased and owned Hotels
Continue Fast Expansion with Increasing
Focus on Quality
Hotel Opening/Closures 2016 – 2017 Q3
737
89
272
167
(231)
(22)(67) (52)
67 205 115
2016 17Q1 17Q2 17Q3 17YTD
Gross openings
528
Closures
Net
openings
(141)
387506

20
632
586
505
442
473
612 606 *
400
450
500
550
600
650
Q1'16 Q2'16 Q3'16 Q4'16 Q1'17 Q2'17 Q3'17
Hotel Pipeline Remained Robust
Number of Hotels in Pipeline (Q1’16-Q3’17)
* Includes 98 Accor’s brands and 73 Crystal Orange brands
500
21
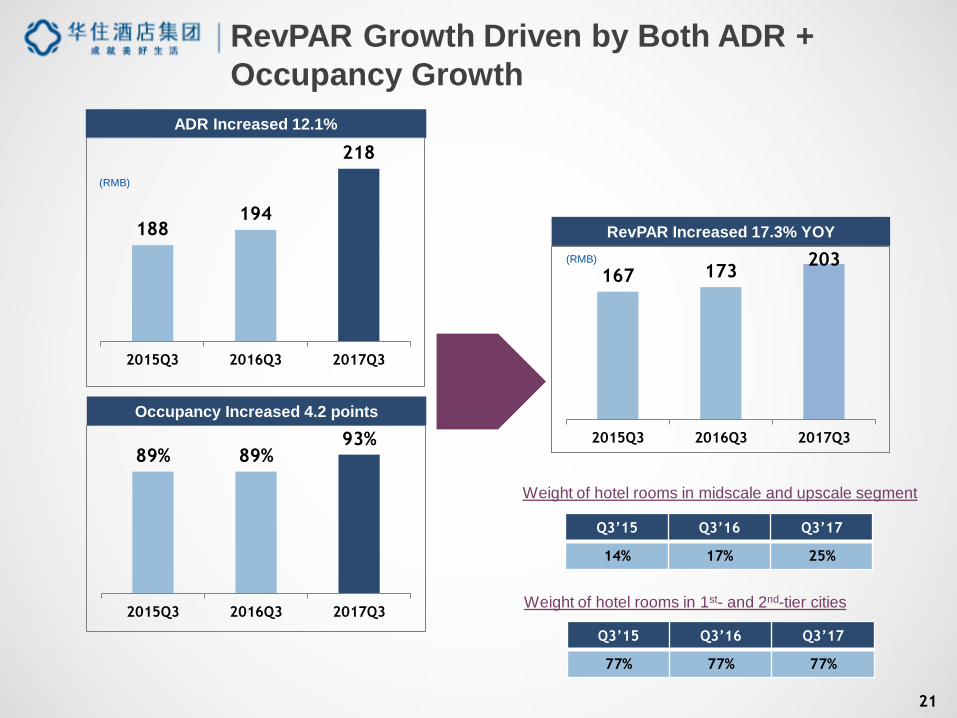
167 173 203
2015Q3 2016Q3 2017Q3
Occupancy Increased 4.2 points
ADR Increased 12.1%
RevPAR Increased 17.3% YOY
(RMB)
(RMB)
RevPAR Growth Driven by Both ADR +
Occupancy Growth
89% 89%93%
2015Q3 2016Q3 2017Q3
188 194
218
2015Q3 2016Q3 2017Q3
Weight of hotel rooms in 1st- and 2nd-tier cities
Weight of hotel rooms in midscale and upscale segment
Q3’15 Q3’16 Q3’17
77% 77% 77%
Q3’15 Q3’16 Q3’17
14% 17% 25%

22
1,774
2,373
Q3'16 Q3'17373
507
Q3'16 Q3'17
1,390
1,858
Q3'16 Q3'17
Net Revenues
(in RMB millions)
Net Revenues from Leased and Owned Hotels
(in RMB millions)
Net Revenues from Manachised and Franchised Hotels
(in RMB millions)
Net Revenues Increased 33.8% in 17Q3, at
High-end of Guidance
Net Manachised and Franchised Hotels Revenue
as % of Net Revenues
Q3’16 Q3’17
21.0% 21.4%

23
19.8%
24.9%
Q3'16 Q3'17
Income from Operations
as % of Net Revenues
Operating Margin Expanded by 5.1 Pts
70.6%
63.6%
Q3'16 Q3'17
0.9%
2.9%
Q3'16 Q3'17
8.7% 8.6%
Q3'16 Q3'17
7.0% 2.0% 0.1%
Hotel operating costs
and other operating costs as % of net
revenues
Pre-opening expenses
as % of net revenues
SG&A Expenses and other operating
income as % of net revenues
5.1%

24
294
470
Q3'16 Q3'17
Net Income
547
850
Q3'16 Q3'17
EBITDA
Profit Growth Remains Strong
(in RMB millions)
Profit Growth
(Margin 17%)
(Margin 20%)
(Margin 31%)
(Margin 36%)
5pts 3pts

25
2,980 3,334
888
(213)(271) (51)
3,333
Cash and cashequivalents at
6/30/17
Net Cash fromOperations
Capex formaintainance andnew developments
Investments Others Cash and cashequivalents at
9/30/17
Abundant Funding Resource for Expansion
(in RMB millions)
Strong Cash Balances Support Hotel
Expansion and Capital Investments
Free cash flow =
RMB 675 m

26
Issuance of Convertible Senior Notes
• US$475 million in aggregate principal amount of convertible
senior notes due 2022
• Coupon rate of 0.375%, payable semi-annually
• Conversion price at $221.31/ADS after capped call at 70%
premium
Key
transaction
metrics
Use of
proceeds
Financial
impact
• Saving on interest expense
• Shares dilution: ~3%
• EPS accretion
• Repaid the principal and interest of the loans borrowed from
a US$250 million revolving credit facility in November
• Make investments in related businesses
• Fund other general corporate purposes

27
Guidances
2017
• Expect Group’s Q4’17 net revenues to grow 29%
to 32% year-over-year, and full year 2017 net
revenues to grow 24% to 25%
• Maintain Gross Opening of 500 hotels in 2017, on
top of the 138 hotels consolidated from Crystal
Orange acquisition
2018
• Expect to accelerate gross opening to 650-700
hotels in 2018, 60% to 65% are mid- and up-
scale

28
Agenda
Strategy Review
Operational and Financial Review
Q & A
Appendix

29
Agenda
Strategy Review
Operational and Financial Review
Q & A
Appendix

30
2015 2016 2015 2016 2015 2016 2015 2016
Economy hotels 1,999 1,999 148 147 -1.2% 169 167 -0.7% 88% 88% -0.4%
Leased hotels 511 511 154 151 -1.6% 176 175 -0.5% 87% 86% -1.0%
Manachised and franchised hotels 1,488 1,488 146 145 -0.9% 165 164 -0.8% 88% 88% -0.1%
Midscale and upscale hotels 206 206 229 248 8.3% 275 290 5.4% 83% 86% 2.3%
Leased hotels 72 72 264 291 10.0% 304 324 6.5% 87% 90% 2.8%
Manachised and franchised hotels 134 134 195 207 5.9% 245 253 3.5% 80% 82% 1.8%
Total 2,205 2,205 157 158 0.4% 180 181 0.5% 87% 87% -0.1%
2016 2017 2016 2017 2016 2017 2016 2017
Economy hotels 2,144 2,144 133 139 5.0% 159 160 0.8% 84% 87% 3.5%
Leased hotels 503 503 139 147 5.7% 167 169 0.9% 83% 87% 3.9%
Manachised and franchised hotels 1,641 1,641 130 137 4.7% 155 156 0.8% 84% 87% 3.3%
Midscale and upscale hotels 236 236 214 233 9.2% 265 284 6.9% 81% 82% 1.7%
Leased hotels 76 76 257 279 8.9% 298 324 8.8% 86% 86% 0.1%
Manachised and franchised hotels 160 160 182 200 9.5% 239 252 5.4% 76% 79% 3.0%
Total 2,380 2,380 143 151 5.8% 172 175 1.8% 83% 87% 3.3%
yoy
change
2016 2017 2016 2017 2016 2017 2016 2017
Economy hotels 2,250 2,250 148 160 7.7% 168 172 2.2% 88% 93% 4.8%
Leased hotels 498 498 156 170 8.5% 180 184 2.7% 87% 92% 4.9%
Manachised and franchised hotels 1,752 1,752 146 156 7.5% 164 167 2.1% 89% 94% 4.7%
Midscale and upscale hotels 263 263 247 272 9.9% 288 306 6.1% 86% 89% 3.1%
Leased hotels 79 79 304 332 9.0% 333 357 7.3% 91% 93% 1.4%
Manachised and franchised hotels 184 184 207 230 10.9% 253 267 5.4% 82% 86% 4.2%
Total 2,513 2,513 162 175 8.3% 183 189 3.0% 88% 93% 4.5%
2016 2017 2016 2017 2016 2017 2016 2017
Economy hotels 2,316 2,316 162 177 9.4% 176 183 4.3% 92% 96% 4.5%
Leased and owned hotels 498 498 169 185 9.6% 186 196 5.3% 91% 94% 3.6%
Manachised and franchised hotels 1,818 1,818 159 174 9.3% 172 179 3.9% 92% 97% 4.8%
Midscale and upscale hotels 287 287 265 290 9.5% 303 319 5.2% 87% 91% 3.6%
Leased hotels 81 81 320 344 7.5% 346 365 5.4% 92% 94% 1.8%
Manachised and franchised hotels 206 206 233 259 11.0% 276 291 5.3% 84% 89% 4.6%
Total 2,603 2,603 177 193 9.5% 194 202 4.5% 91% 96% 4.4%
Number of hotels in operation Same-hotel RevPAR Same-hotel ADR Same-hotel Occupancy
As of For the quarter ended For the quarter ended For the quarter ended
June 30, June 30, June 30, yoy
change
June 30, yoy
change
Number of hotels in operation Same-hotel RevPAR Same-hotel ADR Same-hotel Occupancy
As of For the year ended For the year ended For the year ended
December 31, December 31, yoy
change
December 31, yoy
change
December 31, yoy
change
Number of hotels in operation Same-hotel RevPAR Same-hotel ADR Same-hotel Occupancy
yoy
change
As of For the quarter ended For the quarter ended For the quarter ended
March 31, March 31, yoy
change
March 31, yoy
change
March 31,
yoy
growth
Number of hotels in operation Same-hotel RevPAR Same-hotel ADR Same-hotel Occupancy
As of For the quarter ended For the quarter ended For the quarter ended
September 30, September 30, yoy
growth
September 30, yoy
growth
September 30,
Same-Hotel Operational Data by Segment

31
Hotel breakdown by brand
As of As of As of As of As of
12/31/2013 12/31/2014 12/31/2015 12/31/2016 9/30/2017
Economy hotels 1,309 1,819 2,453 2,813 2,939
HanTing Hotel 1,226 1,648 2,003 2,181 2,232
Leased hotels 473 502 495 486 465
Manachised hotels 753 1,146 1,508 1,694 1,763
Franchised hotels 1 4
Hi Inn 83 158 302 375 394
Leased hotels 41 41 38 36 32
Manachised hotels 42 117 251 294 316
Franchised hotels 13 45 46
Elan Hotel 13 148 185 213
Manachised hotels 13 128 149 180
Franchised hotels 20 36 33
ibis Hotel 72 91
Leased and owned hotels 14 16
Manachised hotels 12 29
Franchised hotels 46 46
Orange Hotel 9
Leased hotels 7
Manachised hotels 1
Franchised hotels 1
Midscale hotels and upscale hotels 116 176 310 456 717
JI Hotel 68 117 186 284 364
Leased hotels 48 62 75 81 91
Manachised hotels 20 55 111 201 270
Franchised hotels 2 3
Starway Hotel 46 55 118 136 162
Leased hotels 1 3 4 2 2
Manachised hotels 20 44 67 96 126
Franchised hotels 25 8 47 38 34
Joya Hotel 1 3 3 6 6
Leased hotels 1 2 2 3 3
Manachised hotels 1 1 3 3
Manxin Hotels & Resorts 1 1 2 2 8
Leased hotels 1 1 1 2
Manachised hotels 1 2 3
Franchised hotels 3
HanTing Plus Hotel 1
Manachised hotels 1
ibis Styles Hotel 10 11
Manachised hotels 7 7
Franchised hotels 3 4
Mercure Hotel 1 15 19
Leased hotels 1 2 2
Manachised hotels 12 14
Franchised hotels 1 3
Novotel Hotel 2 4
Manachised hotels 1 3
Franchised hotels 1 1
Grand Mercure Hotel 1 3
Leased hotels 1
Franchised hotels 1 2
Orange Selected 97
Leased hotels 44
Manachised hotels 35
Franchised hotels 18
Crystal Orange 42
Leased hotels 19
Manachised hotels 15
Franchised hotels 8
Total 1,425 1,995 2,763 3,269 3,656
Number of Hotels in Operation
Hotel Breakdown by Brands

32
Hotel breakdown by brand
As of As of As of As of As of
12/31/2013 12/31/2014 12/31/2015 12/31/2016 9/30/2017
Economy hotels 138,576 185,959 238,156 270,808 278,719
HanTing Hotel 130,747 172,341 205,577 221,157 223,165
Leased hotels 54,154 57,306 57,277 56,491 53,713
Manachised hotels 76,593 115,035 148,300 164,602 169,074
Franchised hotels 64 378
Hi Inn 7,829 12,551 21,340 25,600 26,232
Leased hotels 4,422 3,895 3,698 3,411 2,930
Manachised hotels 3,407 8,656 16,725 19,361 20,394
Franchised hotels 917 2,828 2,908
Elan Hotel 1,067 11,239 13,800 15,734
Manachised hotels 1,067 9,837 11,121 13,345
Franchised hotels 1,402 2,679 2,389
ibis Hotel 10,251 12,621
Leased and owned hotels 2,959
Manachised hotels 3,592
Franchised hotels 6,070
Orange Hotel 967
Leased hotels 804
Manachised hotels 85
Franchised hotels 78
Midscale hotels and upscale hotels 14,303 23,996 40,687 60,539 93,745
JI Hotel 9,106 17,052 27,559 39,664 49,944
Leased hotels 6,891 10,260 13,195 14,314 15,699
Manachised hotels 2,215 6,792 14,364 25,201 33,971
Franchised hotels 149 274
Starway Hotel 4,959 6,321 12,138 13,206 15,540
Leased hotels 131 451 604 386 386
Manachised hotels 2,222 4,939 7,183 9,577 12,103
Franchised hotels 2,606 931 4,351 3,243 3,051
Joya Hotel 141 515 515 1,131 1,131
Leased hotels 141 315 315 523 523
Manachised hotels 200 200 608 608
Manxin Hotels & Resorts 97 108 236 78 770
Leased hotels 97 108 108 - 277
Manachised hotels 128 78 389
Franchised hotels 104
HanTing Plus Hotel 96
Manachised hotels 96
ibis Styles Hotel 1,614 1,724
Manachised hotels 1,216
Franchised hotels 508
Mercure Hotel 239 4,026 4,543
Leased hotels 239 496
Manachised hotels 3,389
Franchised hotels 658
Novotel Hotel 629 1,699
Manachised hotels 1,376
Franchised hotels 323
Grand Mercure Hotel 191 731
Leased hotels 360
Franchised hotels 191 371
Orange Selected 11,948
Leased hotels 5,735
Manachised hotels 4,114
Franchised hotels 2,099
Crystal Orange 5,619
Leased hotels 2,686
Manachised hotels 1,949
Franchised hotels 984
Total 152,879 209,955 278,843 331,347 372,464
Number of rooms in operation
Room Breakdown by Brands