Power-laws in the genomic distribution of coding segments in several organisms
11
Power-laws in the genomic distribution of coding segments in several organisms: An evolutionary trace of segmental duplications, possible paleopolyploidy and gene loss Diamantis Sellis 1 , Yannis Almirantis ⁎ National Center for Scientific Research “Demokritos”, Institute of Biology, 153 10 Athens, Greece abstract article info Article history: Received 23 December 2008 Received in revised form 18 March 2009 Accepted 8 April 2009 Available online 8 July 2009 Received by J. Jurka Keywords: Power-laws Genome structure Long-range correlations Genome shuffling Genome evolution Large-scale features of the spatial arrangement of protein-coding segments (PCS) are investigated by means of the inter-PCS spacers' size distributions, which have been found to follow power-laws. Linearity in double- logarithmic scale extends to several orders of magnitude in the genomes of organisms as disparate as mammals, insects and plants. This feature is also present in the most compact eukaryotic genomes and in half of the examined bacteria, despite their very limited non-coding space. We have tried to determine the sequence of events in the course of genomes' evolution which may account for the formation of the observed size distributions. The proposed mechanism essentially includes two types of events: (i) segmental duplications (and possibly paleopolyploidy), and (ii) the subsequent loss of most of the duplicated genes. It is shown by computer simulations that the formulated scenario generates power-law-like inter-PCS spacers' size distributions, which remain robust for a variety of parameter choices, even if insertion of external sequences, such as viruses or proliferating retroelements is included. Moreover, power-laws are preserved after most of the non-coding DNA has been removed, thus explaining the finding of this pattern in genomes as compact as that of Takifugu rubripes. © 2009 Elsevier B.V. All rights reserved. 1. Introduction The distributions of genes, regulatory regions and several types of repetitive DNA in the genomic landscape are highly non-random and inter-related in complex ways. One decade ago, based on the relatively small number of large and reliably annotated genomic sequences available at that time, we studied the size distribution of the distances separating the protein-coding segments (PCS) in some model organisms. Despite the limited size of the considered sequences (less than 1% of the length of a typical eukaryotic chromosome), we often observed the formation of power-laws in the size distribution of the inter-PCS spacers, i.e. linearity in double-logarithmic scale (Almirantis and Provata, 1999). Recently, we have reported the existence of power-laws for several orders of magnitude in the size distribution of inter-repeat spacers in the human genome (Sellis et al., 2007) while preliminary results indicate that this feature is shared by different organisms and for several repeat classes. In the present article, a systematic investigation of the size distribution of spacers between coding segments is undertaken in a whole-genome scale for several sequenced genomes. Its content is organized as follows: the statistical concepts which will be used are briefly reviewed in the beginning of the “Results” section. Then, evidence about power-laws in the inter-PCS size distributions in several organisms is presented. In the “Discussion” section, the proposed segmental duplication – gene loss model is described and combined with other components of genome dynamics: repeat insertions, indel dynamics and sequence loss. Computer simulations of the model are presented and compared with evidence from genomic architecture of several organisms. A short discussion on the results of this work and on its limitations is included in the “Concluding remarks” section. 2. Results 2.1. Preliminaries We perform a systematic investigation of the size distribution of the distances separating consecutive Protein-Coding Segments (inter- PCS spacers) in the complete set of chromosomes of several genomes. In the Supplementary file 3 (size distributions) we show examples of the inter-PCS spacers' size distribution in both, semi-logarithmic and double-logarithmic scale. A linear region is observed in the double- log scale in most cases, but not in the semi-logarithmic scale. This Gene 447 (2009) 18–28 Abbreviations: E, extent of the linear region in a log-log plot; LINE, long interspersed repeats; Myr, million year(s); N(S), the number of spacers longer or equal to S; PCS, protein coding segments; r 2 , regression coefficient; S, spacers’ length; μ, the negative slope of the power-law in a cumulative log-log plot. ⁎ Corresponding author. Tel.: +30210 6503619; fax:+30 210 6511767. E-mail addresses: [email protected] (D. Sellis), [email protected] (Y. Almirantis). 1 Present address: Biology Department, Stanford University. Gilbert Building, Room 109 371 Serra Mall Stanford, CA 94305-5020, USA. 0378-1119/$ – see front matter © 2009 Elsevier B.V. All rights reserved. doi:10.1016/j.gene.2009.04.028 Contents lists available at ScienceDirect Gene journal homepage: www.elsevier.com/locate/gene
Transcript of Power-laws in the genomic distribution of coding segments in several organisms

Gene 447 (2009) 18–28
Contents lists available at ScienceDirect
Gene
j ourna l homepage: www.e lsev ie r.com/ locate /gene
Power-laws in the genomic distribution of coding segments in several organisms:An evolutionary trace of segmental duplications, possible paleopolyploidy andgene loss
Diamantis Sellis 1, Yannis Almirantis ⁎National Center for Scientific Research “Demokritos”, Institute of Biology, 153 10 Athens, Greece
Abbreviations: E, extent of the linear region in a log-lrepeats; Myr, million year(s); N(S), the number of spaprotein coding segments; r2, regression coefficient; S, sslope of the power-law in a cumulative log-log plot.⁎ Corresponding author. Tel.: +30 210 6503619; fax:
E-mail addresses: [email protected] (D. Sellis), ya(Y. Almirantis).
1 Present address: Biology Department, Stanford Uni109 371 Serra Mall Stanford, CA 94305-5020, USA.
0378-1119/$ – see front matter © 2009 Elsevier B.V. Aldoi:10.1016/j.gene.2009.04.028
a b s t r a c t
a r t i c l e i n f oArticle history:Received 23 December 2008Received in revised form 18 March 2009Accepted 8 April 2009Available online 8 July 2009
Received by J. Jurka
Keywords:Power-lawsGenome structureLong-range correlationsGenome shufflingGenome evolution
Large-scale features of the spatial arrangement of protein-coding segments (PCS) are investigated by means ofthe inter-PCS spacers' size distributions, which have been found to follow power-laws. Linearity in double-logarithmic scale extends to several orders ofmagnitude in the genomes of organisms as disparate asmammals,insects and plants. This feature is also present in the most compact eukaryotic genomes and in half of theexamined bacteria, despite their very limited non-coding space. We have tried to determine the sequence ofevents in the course of genomes' evolution which may account for the formation of the observed sizedistributions. The proposedmechanismessentially includes two types of events: (i) segmental duplications (andpossibly paleopolyploidy), and (ii) the subsequent loss of most of the duplicated genes. It is shown by computersimulations that the formulated scenario generates power-law-like inter-PCS spacers' size distributions, whichremain robust for a variety of parameter choices, even if insertion of external sequences, such as viruses orproliferating retroelements is included. Moreover, power-laws are preserved after most of the non-coding DNAhas been removed, thus explaining the finding of this pattern in genomes as compact as that of Takifugu rubripes.
© 2009 Elsevier B.V. All rights reserved.
1. Introduction
The distributions of genes, regulatory regions and several types ofrepetitive DNA in the genomic landscape are highly non-random andinter-related in complex ways. One decade ago, based on the relativelysmall number of large and reliably annotated genomic sequencesavailable at that time, we studied the size distribution of the distancesseparating the protein-coding segments (PCS) in some modelorganisms. Despite the limited size of the considered sequences(less than 1% of the length of a typical eukaryotic chromosome), weoften observed the formation of power-laws in the size distribution ofthe inter-PCS spacers, i.e. linearity in double-logarithmic scale(Almirantis and Provata, 1999).
Recently, we have reported the existence of power-laws for severalorders of magnitude in the size distribution of inter-repeat spacers in thehumangenome(Sellis et al., 2007)whilepreliminary results indicate thatthis feature is sharedbydifferentorganismsand for several repeat classes.
og plot; LINE, long interspersedcers longer or equal to S; PCS,pacers’ length; μ, the negative
+30 210 [email protected]
versity. Gilbert Building, Room
l rights reserved.
In the present article, a systematic investigation of the sizedistribution of spacers between coding segments is undertaken in awhole-genome scale for several sequenced genomes. Its content isorganized as follows: the statistical concepts which will be used arebriefly reviewed in the beginning of the “Results” section. Then,evidence about power-laws in the inter-PCS size distributions inseveral organisms is presented. In the “Discussion” section, theproposed segmental duplication – gene loss model is described andcombined with other components of genome dynamics: repeatinsertions, indel dynamics and sequence loss. Computer simulationsof the model are presented and compared with evidence fromgenomic architecture of several organisms. A short discussion on theresults of this work and on its limitations is included in the“Concluding remarks” section.
2. Results
2.1. Preliminaries
We perform a systematic investigation of the size distribution ofthe distances separating consecutive Protein-Coding Segments (inter-PCS spacers) in the complete set of chromosomes of several genomes.In the Supplementary file 3 (size distributions) we show examples ofthe inter-PCS spacers' size distribution in both, semi-logarithmic anddouble-logarithmic scale. A linear region is observed in the double-log scale in most cases, but not in the semi-logarithmic scale. This

19D. Sellis, Y. Almirantis / Gene 447 (2009) 18–28
indicates that the genomic inter-PCS distances follow a power-law-like distribution:
N4 Sð Þ~S− f = S−1−μ μ N 0
where, with N⁎(S) we denote the number of spacers with lengtharound S, and with μ the power-law parameter which indicates howdensely clustered are the PCSs.
Fig. 1. Inter-PCS spacers' size distributions. Examples of eukaryotic inter-PCS spacers' cumcorresponding to randomly distributed PCSs (for details see the Subsection 2.1 “Preliminari
Power-laws are often characterizing systems with long-rangecorrelations, i.e. systems whose remote parts exhibit correlatedstructure or behavior. This is usually measured using some form of acorrelation function and early in the nineties it has been shown thatlong-range correlations exist in the nucleotide sequences of non-coding genomic regions (Li and Kaneko, 1992; Peng et al., 1992; Voss,1992). Power-laws in size distributions are in general associated with
ulative size distributions accompanied by ten size distributions (continuous lines),es”).

Fig. 1. (continued)
20 D. Sellis, Y. Almirantis / Gene 447 (2009) 18–28
the geometrical features of self-similarity and fractality (Mandelbrot,1982; Feder, 1988), i.e. the distribution of the studied elements (in ourcase the coding segments of a genome) looks similar when examinedat several scales.
As discussed in the related literature, in order to study the sizedistributions of experimental data, it is better to use the cumulativeinstead of the simple (original) distribution (see e.g. Clauset et al., 2009;Newman, 2005). The cumulative distribution is independent of thebinning choice (see Supplementary file 3) and less scattered especiallyin the “tail” formed from the larger spacers. The corresponding region inthe original distribution is subjected to more statistical fluctuationsdue to the low number of large spacers. All size distributions presentedare plotted in a double-logarithmic scale (log–log plots), where thehorizontal axis corresponds to the logarithm of spacers' length (S) andthe vertical axis to the logarithm of the number of spacers longer orequal to S, denoted by N(S). Expressions for the original and cumulativesize distributions in terms of probabilities are given in Supplementaryfile 3 (see also Sellis et al., 2007). When μb2, it can be shown that thepower-law is characterized by infinite mean square (Newman 2005).For higher values of μ, the distribution becomes increasingly undistin-guishable from a short-ranged one, i.e. randomness tends to prevail inthe large length scales (large values of S). It is also shown that the use ofthe cumulative distribution does not introduce any bias in the extent ofthe linear region in the log–log plots.
For the purposes of our study, besides the parameter μ, the mostimportant variable is the extent (E) of the linear region in the log–logplot. E expresses the range of scales for which the PCSs are distributedon the chromosome in a self-similar way. The regression coefficient(r2), which is always very close to 1 (N0.97 in all cases), indicates thegoodness of the linear fit and is given in the Supplementary Table 1 foreukaryotes and in Table 2 for prokaryotes. Information about thesource and release version of the annotated genomic sequences usedis given in the Supplementary file 4 (technical details).
Additionally to genomic spacers' size distributions, all figures alsoinclude a bundle of ten simulated size distributions (continuous lines)where markers representing PCSs are positioned randomly in a
sequence. The number of the randomly positioned markers and thelength of the simulated sequence are equal to the number of PCSs andthe size of the considered chromosome respectively. The inclusion ofthese random (surrogate) data sets in the figures visualizes thedifference between observed and random distribution patterns.
2.2. Inter-PCS size distributions
Initially we examined separately the size distribution of inter-genespacers, i.e. excluding introns (data not shown). Power-laws observedin these cases always have a lower extent than that observed in thecorresponding inter-PCS spacer distributions. This result wasexpected, because inclusion of introns increases the extent of thepower-law towards lower length scales. Moreover, the length ofintrons in not conserved, as indicated by comparative studies of intronlength in homologous genes (Jeffares et al., 2006; Pozzoli et al., 2003),so the aggregative dynamics shaping the observed power-laws (seenext section) is expected to also affect intron size.
Examples of cumulative size distributions of inter-PCS spacers forseveral eukaryotes are given in Fig.1 and the values of the extent (E) ofthe power-law and the slope (μ) for the complete set of the examinedeukaryotic genomes are listed in Table 1. When a second linear regionin log–log plot is found, the corresponding values for E and μ are alsoincluded. An extended Table 1 is provided in the Supplementarymaterial including values of the regression coefficients (r2) for all thepower-laws found (Supplementary file 1: extended Table 1). Well-shaped power-laws were not observed in all examined chromosomesand there is variability between genomes in the percentage ofchromosomes lacking a well-shaped power-law. In many caseswhere a power-law is absent, the distributions still deviate signifi-cantly from random, as can be seen by comparing genomic withsurrogate data sets (see Supplementary file 2: plots); the same is truefor prokaryotes. A scatter diagram E−μ including all examinedeukaryotes is presented in Fig. 2 (only chromosomes with a uniquelinear region are shown). It is obvious that the values of power-lawextent and slope for different chromosomes of the same organism in
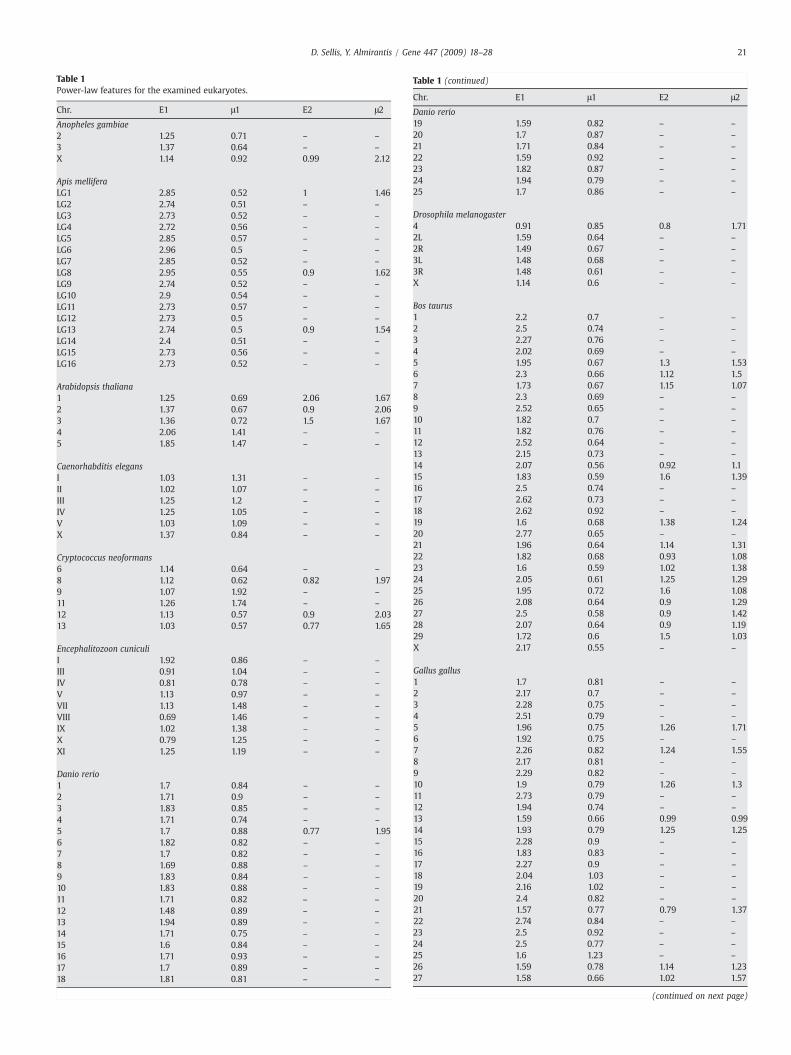
Table 1Power-law features for the examined eukaryotes.
Chr. E1 μ1 E2 μ2
Anopheles gambiae2 1.25 0.71 – –
3 1.37 0.64 – –
X 1.14 0.92 0.99 2.12
Apis melliferaLG1 2.85 0.52 1 1.46LG2 2.74 0.51 – –
LG3 2.73 0.52 – –
LG4 2.72 0.56 – –
LG5 2.85 0.57 – –
LG6 2.96 0.5 – –
LG7 2.85 0.52 – –
LG8 2.95 0.55 0.9 1.62LG9 2.74 0.52 – –
LG10 2.9 0.54 – –
LG11 2.73 0.57 – –
LG12 2.73 0.5 – –
LG13 2.74 0.5 0.9 1.54LG14 2.4 0.51 – –
LG15 2.73 0.56 – –
LG16 2.73 0.52 – –
Arabidopsis thaliana1 1.25 0.69 2.06 1.672 1.37 0.67 0.9 2.063 1.36 0.72 1.5 1.674 2.06 1.41 – –
5 1.85 1.47 – –
Caenorhabditis elegansI 1.03 1.31 – –
II 1.02 1.07 – –
III 1.25 1.2 – –
IV 1.25 1.05 – –
V 1.03 1.09 – –
X 1.37 0.84 – –
Cryptococcus neoformans6 1.14 0.64 – –
8 1.12 0.62 0.82 1.979 1.07 1.92 – –
11 1.26 1.74 – –
12 1.13 0.57 0.9 2.0313 1.03 0.57 0.77 1.65
Encephalitozoon cuniculiI 1.92 0.86 – –
III 0.91 1.04 – –
IV 0.81 0.78 – –
V 1.13 0.97 – –
VII 1.13 1.48 – –
VIII 0.69 1.46 – –
IX 1.02 1.38 – –
X 0.79 1.25 – –
XI 1.25 1.19 – –
Danio rerio1 1.7 0.84 – –
2 1.71 0.9 – –
3 1.83 0.85 – –
4 1.71 0.74 – –
5 1.7 0.88 0.77 1.956 1.82 0.82 – –
7 1.7 0.82 – –
8 1.69 0.88 – –
9 1.83 0.84 – –
10 1.83 0.88 – –
11 1.71 0.82 – –
12 1.48 0.89 – –
13 1.94 0.89 – –
14 1.71 0.75 – –
15 1.6 0.84 – –
16 1.71 0.93 – –
17 1.7 0.89 – –
18 1.81 0.81 – –
Table 1 (continued)
Chr. E1 μ1 E2 μ2
Danio rerio19 1.59 0.82 – –
20 1.7 0.87 – –
21 1.71 0.84 – –
22 1.59 0.92 – –
23 1.82 0.87 – –
24 1.94 0.79 – –
25 1.7 0.86 – –
Drosophila melanogaster4 0.91 0.85 0.8 1.712L 1.59 0.64 – –
2R 1.49 0.67 – –
3L 1.48 0.68 – –
3R 1.48 0.61 – –
X 1.14 0.6 – –
Bos taurus1 2.2 0.7 – –
2 2.5 0.74 – –
3 2.27 0.76 – –
4 2.02 0.69 – –
5 1.95 0.67 1.3 1.536 2.3 0.66 1.12 1.57 1.73 0.67 1.15 1.078 2.3 0.69 – –
9 2.52 0.65 – –
10 1.82 0.7 – –
11 1.82 0.76 – –
12 2.52 0.64 – –
13 2.15 0.73 – –
14 2.07 0.56 0.92 1.115 1.83 0.59 1.6 1.3916 2.5 0.74 – –
17 2.62 0.73 – –
18 2.62 0.92 – –
19 1.6 0.68 1.38 1.2420 2.77 0.65 – –
21 1.96 0.64 1.14 1.3122 1.82 0.68 0.93 1.0823 1.6 0.59 1.02 1.3824 2.05 0.61 1.25 1.2925 1.95 0.72 1.6 1.0826 2.08 0.64 0.9 1.2927 2.5 0.58 0.9 1.4228 2.07 0.64 0.9 1.1929 1.72 0.6 1.5 1.03X 2.17 0.55 – –
Gallus gallus1 1.7 0.81 – –
2 2.17 0.7 – –
3 2.28 0.75 – –
4 2.51 0.79 – –
5 1.96 0.75 1.26 1.716 1.92 0.75 – –
7 2.26 0.82 1.24 1.558 2.17 0.81 – –
9 2.29 0.82 – –
10 1.9 0.79 1.26 1.311 2.73 0.79 – –
12 1.94 0.74 – –
13 1.59 0.66 0.99 0.9914 1.93 0.79 1.25 1.2515 2.28 0.9 – –
16 1.83 0.83 – –
17 2.27 0.9 – –
18 2.04 1.03 – –
19 2.16 1.02 – –
20 2.4 0.82 – –
21 1.57 0.77 0.79 1.3722 2.74 0.84 – –
23 2.5 0.92 – –
24 2.5 0.77 – –
25 1.6 1.23 – –
26 1.59 0.78 1.14 1.2327 1.58 0.66 1.02 1.57
(continued on next page)
21D. Sellis, Y. Almirantis / Gene 447 (2009) 18–28

Table 1 (continued)
Chr. E1 μ1 E2 μ2
Gallus gallus28 1.72 0.79 1.01 1.42W 1.14 0.63 – –
Z 2.51 0.7 0.93 1.82
Homo sapiens1 1.35 0.66 1.71 1.332 1.72 0.7 1.37 1.363 2.25 0.77 – –
4 1.93 0.64 1.14 1.265 2.27 0.76 – –
6 1.72 0.62 1.6 1.397 1.82 0.68 1.16 1.658 1.95 0.66 0.91 1.189 2.07 0.79 – –
10 1.8 0.66 1.37 1.5811 1.59 0.63 1.94 1.2412 1.59 0.73 1.35 1.413 2.49 0.77 – –
14 1.46 0.68 1.71 1.2115 1.58 0.71 1.26 1.3716 2.27 0.92 – –
17 1.71 1.4 – –
18 1.81 0.61 1.26 1.0920 2.17 0.99 – –
21 3.17 0.87 – –
22 1.49 0.81 1.25 1.41X 2.27 0.63 – –
Y 3.09 0.46 1.38 1.21
Mus musculus1 2.05 0.72 1.39 1.442 1.95 0.72 1.48 1.373 2.5 0.7 – –
4 2.63 0.84 – –
5 2.74 0.88 – –
6 1.83 0.62 1.25 1.267 2.28 0.87 – –
8 2.5 0.75 – –
9 2.5 0.83 – –
10 2.16 0.69 1.25 1.4211 1.49 0.72 2.05 1.2412 2.72 0.76 – –
13 2.15 0.65 1.27 1.7514 2.15 0.69 0.93 1.4215 2.74 0.83 – –
16 2.61 0.83 – –
17 2.51 0.96 – –
18 1.94 0.63 1.49 1.2219 2.62 1.01 – –
X 2.14 0.52 1.15 1.46Y 2.61 0.64 – –
Rattus norvegicus1 1.83 0.66 1.24 1.282 2.51 0.65 – –
3 2.63 0.8 – –
4 1.95 0.62 1.48 1.555 2.74 0.75 – –
6 2.51 0.78 – –
7 2.17 0.66 1.26 1.388 2.63 0.81 – –
9 2.26 0.67 1.26 1.4910 1.72 0.75 1.58 1.4711 2.75 0.74 – –
12 2.04 0.75 1.25 1.6413 2.05 0.65 1.37 1.9914 2.19 0.66 1.49 1.2215 2.76 0.74 – –
16 2.85 0.72 – –
17 2.07 0.59 – –
18 2.84 0.76 – –
19 2.62 0.81 – –
20 1.72 0.67 1.47 1.23X 2.15 0.52 1.15 1.75Oryza sativa1 1.94 0.54 – –
Table 1 (continued)
Chr. E1 μ1 E2 μ2
Oryza sativa2 2.04 0.54 – –
3 2.05 0.56 1.24 2.224 2.17 0.52 1.14 1.565 2.29 0.54 0.91 2.016 2.6 0.52 – –
7 2.27 0.52 – –
8 2.27 0.5 1.01 2.069 2.4 0.5 – –
10 2.4 0.48 – –
11 2.48 0.47 – –
12 2.4 0.52 – –
Saccharomyces cerevisiaeI 1.6 1.02 – –
II 0.79 1.58 – –
IV 0.91 1.8 – –
Schizosaccharomyces pombeI 0.92 2.37 – –
II 1.14 2.28 – –
Takifugu rubripes1 2.26 0.62 1.02 1.42 1.61 0.78 1.32 1.713 1.71 0.55 1.2 1.534 2.62 0.68 – –
5 2.05 0.79 – –
6 1.7 0.58 1.13 1.497 1.83 0.61 1.25 1.168 1.27 0.85 – –
9 1.81 0.54 1.26 1.2410 2.05 0.56 1.13 1.07
Tribolium castaneumLG1 2.05 0.89 – –
LG2 2.05 0.91 – –
LG3 2.17 0.82 – –
LG4 2.16 1.05 – –
LG5 1.93 0.95 – –
LG6 1.59 1.01 – –
LG7 1.71 1.06 – –
LG8 2.17 0.96 – –
LG9 1.95 0.96 – –
LG10 2.27 0.84 – –
22 D. Sellis, Y. Almirantis / Gene 447 (2009) 18–28
most cases are clustered. This means that the dynamics leading to theobserved power-laws in the inter-PCS size distributions is a proceduresufficiently slow in evolutionary time, allowing a relative intra-genomic uniformity due to the shuffling of genomes by inter-chromosomal rearrangements. The pattern is clearly different from
Fig. 2. Scatter diagram E−μ. Scatter diagram E (extent of the power-law)−μ (slope)for chromosomes with a unique linear region in their inter-PCS spacers' sizedistributions. The chromosomes of each species are clustered.

Fig. 3. Inter-PCS spacers' size distributions. Examples of prokaryotic inter-PCS spacers' cumulative size distributions accompanied by ten size distributions (continuous lines),corresponding to randomly distributed PCSs (for details see the Subsection 2.1 “Preliminaries”).
23D. Sellis, Y. Almirantis / Gene 447 (2009) 18–28
the one emerging for the size distribution of inter-repeat spacers inthe human genome (Sellis et al., 2007) and in other examined species(article in preparation), where inter-chromosomal differences aremore pronounced.
Examples of prokaryotic genomes are shown in Fig. 3 and the fullset of the examined prokaryotes is given in Table 2. We observe thatwell-shaped power-laws in the inter-genic spacers' size distributionare formed in ~50% of them, despite the very low percentage of non-coding sequence in these genomes.
3. Discussion
3.1. Aggregative models can generate power-laws
There is awide corpus of literature aiming to explain the appearanceof power-law size distributions in several phenomena, ranging from
physics and biology to social sciences and linguistics, see e.g. Adamicand Huberman (2002), Feder (1988), Li (2002), Mandelbrot (1982).Aggregative growth occurs when smaller particles merge togethergenerating bigger ones. This procedure has been proven, boththeoretically and through simulations, to produce long-range correla-tions in large systems and to be at the basis of power-law sizedistributions (Jullien and Botet,1987; Vicsek,1989). Genomic dynamicsinclude several types of eventswhichmay bemodeled as “aggregative”.Chromosomes can expand due to segmental duplications and integra-tion of extrinsic genomic material (gene transfer common in prokar-yotic lineages, insertions of sequences of viral origin, retropositions,incorporation of other self-proliferating sequences etc.).
For particle aggregation in a generic context, let us assume a systemformed by “internal” particles, while occasionally “external” particlesenter the system. Particles are characterized by their proper “size”(mass, charge or length, as in the case of genomic sequence segments).

Table 2Power-law features for the examined prokaryotes.
Taxon Accession number Extent (E) Slope (μ) Regression coefficient (r2)
Bacillus halodurans C-125 NC_002570.2 – – –
Bacillus subtilis subsp. subtilis str. 168 NC_000964.2 – – –
Borrelia burgdorferi B31 NC_001318.1 – – –
Buchnera aphidicola str. Bp (Baizongia pistaciae) NC_004545.1 1.02 1.91 0.9816Buchnera aphidicola str. Sg (Schizaphis graminum) NC_004061.1 1.49 1.17 0.9888“Candidatus Blochmannia floridanus” NC_005061.1 1.18 1.92 0.9859Chlamydia trachomatis D/UW-3/CX NC_000117.1 – – –
Escherichia coli K12 NC_000913.2 – – 0.9940Escherichia coli O157:H7 str. Sakai NC_002695.1 1.48 1.48 0.9966Mycobacterium leprae TN NC_002677.1 – – –
Mycobacterium tuberculosis F11 NC_009565.1 – – –
Mycoplasma genitalium G37 NC_000908.2 1.71 1.00 0.9701Mycoplasma pneumoniae M129 NC_000912.1 – – –
Rickettsia prowazekii str. Madrid E NC_000963.1 0.80a 0.72a 0.9891Salmonella enterica subsp. enterica serovar Paratyphi A str. ATCC 9150 NC_006511.1 1.49 1.43 0.9824Salmonella enterica subsp. enterica serovar Typhi str. CT18 NC_003198.1 1.48 1.48 0.9896Salmonella enterica subsp. enterica serovar Typhi str. Ty2 NC_004631.1 1.60 1.41 0.9898Shigella flexneri 2a str. 301 NC_004337.1 1.03/0.69 1.08/2.08 0.9917/0.9974Staphylococcus aureus subsp. aureus Mu50 NC_002758.2 – – –
Streptococcus pyogenes MGAS315 NC_004070.1 – – –
Vibrio cholerae O1 biovar eltor str. N16961 NC_002505.1 1.71 1.38 0.9832Vibrio cholerae O1 biovar eltor str. N16961 NC_002506.1 1.37 1.80 0.9856Wigglesworthia glossinidia endosymbiont of Glossina brevipalpis NC_004344.2 – – –
Yersinia pestis CO92 NC_003143.1 1.35 1.71 0.9953
Power-law parameters (Extent E and slope μ) and regression coefficient (r2) for inter-PCS spacers' size distributions. Dashes indicate lack of well-defined power-law.a Marginally follows a power-law.
24 D. Sellis, Y. Almirantis / Gene 447 (2009) 18–28
Takayasu et al. (1991) have shown, proposing an analytically solvablemodel, that the combination of: (A) aggregation (fusion) of internalparticles and (B) intrusion of “external” particles (injection), whicheventually aggregatewith internal particles, can lead asymptotically tothe appearance of power-laws in the particles' size distribution.
Implementing this approach in a genomic system, as “particles”wedenote the spacers between PCSs (or between repeats of a givenfamily, or between members of another population of genomicelements), while PCSs themselves are viewed as delimiters. In thisone-dimensional system aggregation is the result of PCS loss events,which lead to the fusion of the two neighboring spacers (particles).
Recently, we have used this theoretical framework for theformulation of a model explaining the power-laws observed in theinter-repeat spacers' size distributions in the human genome (Selliset al., 2007). This approach takes into account (a) the tolerance of thegenome for repeat elimination, as these sequences do not have, ingeneral, a survival value for the organism and (b) the well establishedevidence for the existence of mechanisms systematically removingrepeats from genomes through recombination-based elimination(Deininger and Batzer, 2002; Hackenberg et al., 2005; Pavlicek et al.,2001): these eliminations lead the spacers adjacent to the deletedrepeat to aggregate. However, in order to explain the size distributionof inter-PCS spacers we have to focus on the evolution of genes, whichhave high survival value, thus excluding the possibility of massive lossunder normal conditions.
3.2. Genomic duplications and gene loss
If we take into account the systematic and continuous occurrenceof segmental duplication events in the evolutionary past of virtuallyall eukaryotes we can gain insight into the inter-PCS spacers power-law formation (De Grassi et al., 2008; Kehrer-Sawatzki and Cooper,2008; Kirsch et al., 2008; McLysaght et al., 2002; Shapira and Finnerty,1986). Additionally, as growing evidence indicates, most extant taxahave experienced paleopolyploidy during their evolution (i.e. dupli-cation of the whole genome and subsequent reduction to diploidy),see e.g. Adams andWendel (2005), Gibson and Spring (2000), Sémonand Wolfe (2007) and references therein. Segmental duplicationand polyploidisation generate copies of some or all the genes of an
organism. Thus, there are three possibilities for the evolution of theduplicated genes (Adams and Wendel, 2005; De Grassi et al., 2008;Lynch and Conery, 2000): In some cases one member of the gene pairadopts a new function while the other remains unchanged. In othercases, the two copies continue to survive in the genome dividing themultiple functions of the initial gene between them. However, as allauthors agree, see e.g. Adams and Wendel (2005), Kasahara (2007),Lynch and Conery (2000), Sémon and Wolfe (2007), the fate of mostduplicated genes is that one copy is silenced, losing the ability to betranscribed, and then disintegrates progressively by random muta-tions, while it is also exposed to the possibility of excision due torecombination driven eliminations.
In the ancestry of modern plants, multiple rounds of polyploidisa-tion events have occurred, often followed by massive silencing andelimination of duplicated genes (Adams and Wendel, 2005). EvenArabidopsis thaliana which has a particularly small genome is nowbelieved to be a paleopolyploid (Grant et al., 2000). There is anextensive literature about the plausibility of the occurrence of tworounds of genome duplication in the evolution of vertebrates. This so-called 2R hypothesis, expressed first by SusumuOhno (1970) is now atthe epicenter of a vivid controversy, with some approaches confirmingit and others not, see e.g. Gibson and Spring (2000), Hokamp et al.(2003), Kasahara (2007), Wolfe (2001).
Even if complete genomic duplications cannot be proven to haveoccurred with certainty in all cases, our present knowledge ofgenomic structure indicates repeated occurrence of segmentalduplication. It is shown that at least 10% of the non-repetitivehuman genome consists of identifiable segmental duplications (Baileyet al., 2002). It is estimated that 50% of all genes in a genome areexpected to duplicate giving an “offspring” at least once on time scalesof 35 to 350 million years, not taking into account events ofpolyploidization (Lynch and Conery, 2000). Both complete genomeduplications and repeated segmental duplications satisfy the neces-sary conditions for the implementation of a genomic duplication —
gene loss model, as the fate of most of the duplicated genes iselimination rather than preservation. The extent of the power-lawobserved in a species' genome cannot be used as a criterion todifferentiate between paleopolyploidisation events and multiplesegmental duplications in its past. Notice that, in many cases, even

25D. Sellis, Y. Almirantis / Gene 447 (2009) 18–28
advanced in silico search cannot definitively distinguish betweenthese two possibilities (McLysaght et al., 2002; Wolfe, 2001).
The sequencing and analysis of the human genome has shown thatsegmental duplications and gene loss are widespread phenomena ofgenome remodeling during evolution. An example of relatively recentgene loss is that ~60% of the olfactory receptors in the human genome(~1000 genes and pseudogenes in total) have disrupted ORFs andappear to be pseudogenes, which is consistent with findings suggest-ing massive functional gene loss in the last 10 Myr (IHGSC, 2001).
The events described above are incorporated into an evolutionarymodel which explains the power-laws observed in inter-PCS spacers'size distributions. Our model includes:
(i) Segmental duplications of extended regions of a chromosome/genome.
(ii) Elimination of PCSs close or equal to the number of duplicatedones.
(iii) Insertions of repeats.(iv) Deletions of segments not containing coding or regulatory
sequences.
Events of the type (iii) are numerically shown not to be requiredfor the emergence of power-laws in the inter-PCS distances. Theirinclusion tests the robustness of the model, as for many organismsimportant parts of the genome represent repeat proliferation. Eventsof type (iv) represent either deletion of sequence regions usually dueto unequal recombination or gradual shrinkage by a balance of indelevents favoring decrease of the sequence length.
Here, we further deviate from the analytically solvable modelintroduced by Takayasu et al., and from the evolutionary scenarioproposed for the explanation of power-laws in the inter-repeat
Fig. 4. Simulations of the segmental duplication— gene loss model. (a, b) The minimal versioincluded). (c, d) Repeat proliferation events are also simulated in order to check the ability ofdetails see the Subsection 3.2 “Genomic duplications and gene loss” and Supplementary file
distances (Sellis et al., 2007), as in the present model theindispensable for the emergence of power-law length increase isprovided by the segmental duplications. Segmental duplications alsoproduce the duplicated genes, whose elimination is essential for theaggregation of adjacent spacers. The presented simulations aredescribed in detail in the Supplementary file 4.
In Fig. 4a, b only type (i) and (ii) events are simulated (segmentalduplications followed by gene loss). We see that, as observed in realchromosomes, power-law-like curves are formed in the inter-PCSspacers' size distributions with one or two linear regions. In Fig. 4c, dthe inclusion of repeat proliferation (events of type (iii)) does nothinder the emergence of linearity in log–log plots. The same is trueeven if we include elimination of non-coding segments (events oftype (iv)) (data not shown).
3.3. Genome size reduction in eukaryotes and power-laws
Takifugu rubripes is an extreme example of an organismwith smallgenome size, equal to about one seventh of that of human or mouse(Sémon and Wolfe, 2007; McLysaght et al., 2000). The variation ofgenome size, in a way apparently unrelated to the organismcomplexity (the C-value paradox), remains a puzzling question.Here, as in several other questions arising in the framework ofgenomic biology, the attempts to explain the problem are usuallyformulated in terms of either an adaptive perspective attributingseveral possible functions to DNA overabundance, see e.g. Hsu (1975),Vinogradov (1998) or a mutationist view, where extra DNA is justtolerated up to a limit (Doolittle and Sapienza, 1980; Orgel and Crick,1980). Petrov et al. have proposed, based on a strong correlationbetween the rate of mutational DNA loss and genome size, that the
n of the model is simulated here (segmental duplications and PCSs eliminations are onlythis evolutionary scenario to preserve the power-laws under this realistic constraint (for4).

26 D. Sellis, Y. Almirantis / Gene 447 (2009) 18–28
observed genome sizes are the product of an equilibrium establishedbetween genome shrinkage due to DNA loss through small deletions,and DNA gain through large insertions (Oliver et al., 2007; Petrov,2002).
When genome shrinkage is observed, it is not clear if power-lawsin the size distribution of distances between evolutionary conservedelements (such as PCSs) will be preserved. Several approachesestablish the existence of important differences in the rate of indelsas well as in the tendency for large scale duplications and deletions,even between organisms having a relatively recent common ancestor(Bensasson et al., 2001; Robertson, 2000; Sémon and Wolfe, 2007).The dispersion of repeats in a genome can further contribute togenomic instabilities leading to deletions due to recombinationevents, provided that the viability of the organism is not affected(Hackenberg et al., 2005; Jurka et al., 2007). As a consequence a verydense genome could be created when such events favor genome sizereduction and it is of interest to check whether simulating suchgenome size reductions leave intact preexisting power-laws.
In Fig. 5a, b we present two cases where power-laws alreadyformed are exposed to genome shrinkage (taking as initial states thesequences finally produced during the simulations presented inFig. 4b, c respectively). Here we present simulations of genome sizereduction up to a length ~13.5% of the initial sequence, which is closeto the ratio of sizes between the genome of Takifugu rubripes andtypical vertebrate genomes. We obtain qualitatively the same resultsindependently of the mean size of the eliminated segments (data notshown). In the lower limit (for small mean length of the eliminatedsegments) the procedure simulates the continuous action of indeldynamics favoring genome reduction (Oliver et al., 2007; Petrov,2002), while eliminated segments with mean values of the order ofkilobases simulates recombinogenic excision of sequence regions. Inthe presented cases no PCSs excisions are tolerated. In simulationswhere a fraction of them is allowed to be removed during thesegmental deletions the power-laws are still preserved.
3.4. Further aspects of inter-PCS spacers' size distributions
The examined organisms show differences in their propensity toform power-laws in the inter-PCS spacers' size distributions, whichcannot be correlated to differences in genomic structure betweenthem, but are probably related to the high selective value andantiquity of genes. Several factors that could contribute to theemergence of power-laws in the inter-PCS size distributions arethought to have changed during the slow evolution of genearrangement. Thus, some of the observed distributional features
Fig. 5. Simulations of the model under conditions of “genome shrinkage”. (a, b) Artificiasegmental duplication— gene loss model) are taken as initial states. Then, short sequence seg13.5% of its initial length (about the same percentage as reducing the human genome to the sthe shrunk artificial chromosomes (for details see the Subsection 3.3 “Genome size reducti
(presence or absence of power-laws and their linear extend in log–logplots) may be remnants of past states of the present-day genomes.This is corroborated by the finding that, once produced, power-lawsare robust to genome shrinkage (Fig. 5). Of course, intense or long-lasting genomic shuffling would alter and finally destroy them. As aconsequence, it is difficult to correlate the actual state of the observedpower-laws with the structure and known history of the examinedgenomes, as these power-laws may be results of the remote genomicpast (as the presented simulations indicate).
If we look for regions with marked differences in the quantitiesof “inserted material” during the last few tenths of million years(repeats, viruses, simple sequences etc.), the detected differencessignificantly correlate with the extent of the power-law in the inter-repeat distances size distribution for several repeat families such asAlu and LINE1, whose ages are of the same order with the age ofthe studied inserted material. The existence of this correlation wassystematically examined (Sellis et al., 2007) in order to assess theability of the “aggregation–elimination model” to explain the inter-repeat power-laws. If we try to compare quantities of insertedmaterial for a considerably older time span, attempting to correlatethem with inter-PCS spacers' power-laws, we find that the insertedmaterial for such time intervals looks much more homogeneouslydistributed, thus not allowing neither inter- nor intra-genomiccomparisons.
It has also been pointed out that in the human genome, the GCcontent of genomic regions correlates positively or negatively to theextent of inter-repeat distances' power-laws, depending on thenegative or positive co-localization tendency of the studied repeatfamily with high GC regions (Sellis et al., 2007). This property ofpower-laws in inter-repeat distances corroborates the action of anaggregation–elimination mechanism, as it is shown that Alu andLINE1 have a clear tendency to be eliminated in regions deviating fromtheir own nucleotide composition (see e.g. Deininger and Batzer,2002; Hackenberg et al., 2005; Jurka et al., 2004; Pavlicek et al., 2001).We do not expect however such correlations for the inter-PCS sizedistributions in terms of the model proposed herein, since the co-localization of genes with GC-rich regions (remaining a complex andyet not fully understood phenomenon) was never attributed to asimple tendency of genes to be eliminated in AT-rich isochors(Bernardi, 1995).
Another feature of inter-repeat spacers' size distributions (notshared by inter-genic spacers) is their propensity for extended power-laws (when sufficient population sizes may be found) in organismswhich have experienced genome shrinkage in their evolutionary past(article in preparation) e.g. A. thaliana, D. melanogaster and C. elegans.
l chromosomes where markers' distances follow power-laws (after the action of thements not hosting markers (PCSs) are eliminated, until the sequence is reduced to aboutize of the Takifugu rubripes genome). Inter-PCS distances' power-laws are still present inon in eukaryotes and power-laws” and Supplementary file 4).

27D. Sellis, Y. Almirantis / Gene 447 (2009) 18–28
This is well understood for the repeats, as the exposure to high DNAdeletion rates increases the occurrence of eliminations and under suchconditions the “aggregation–elimination model” produces moreextended power-laws as simulations have shown. On the otherhand, the high survival value of genes preserves them from deletioneven in cases of extended genomic shrinkage. Thus, no dependence ofthe extent of inter-PCS power-laws on the degree of DNA deletionrates is expected or found (see Table 1).
There is an interesting and long-lasting discussion in the literatureabout the existence or not of extended non-coding regions (intronsand inter-genic sequences), in the ancestor of modern prokaryotesand their subsequent loss due to “stream-lining” for shorter replica-tion times. For a review, see Roy (2003) and references given therein.The genome size reduction conjectured to have occurred in the past ofprokaryotes is not only a simple aggregative phenomenon, as in themodel proposed herein, since it has been mediated by inversetranscription and re-insertion into the genome of processed mRNAs(after intron elimination) and extended redistribution of regulatingfunctionality in the remaining non-coding DNA. Thus, further genomesize reduction has not been attempted in our simulations. Never-theless, the existence of power-laws in ~50% of the examinedprokaryotic genomes is compatible with the hypothesis that prokar-yotes' ancestors possessed extended inter-PCS spacers lost duringevolution. We observe that in closely related prokaryotic species suchas Mycoplasma genitalium and M. pneumoniae (Ciccareli et al., 2006)or the E. coli strains K12 and O157 one follows a power-law in its inter-genic spacers' size distribution, while the other does not. This featureprobably means that the existence of power-laws in prokaryotes is aremnant of an ancestral (rich in non-coding) genomic structure andextant prokaryotes possess power-laws or not, depending onrelatively small differences in their evolutionary history.
4. Concluding remarks
Genomic dynamics exhibits a variety of non-linear and self-amplifying features. These features led to the emergence of severalpatterns of spatial order, some of them being short-ranged, like similarnucleotide cluster formation (Almirantis and Provata, 1997; Almir-antis, 1999), which however affect the large scale features ofchromosomes, while others involved directly long-range correlationsas revealed by studies using concepts like DNA-walks, criticalexponents, 1/f noise, wavelet analysis etc. See e.g. Li and Kaneko(1992), Peng et al. (1992), Voss (1992), Mantegna et al. (1994),Arneodo et al. (1995), Audit et al. (2001).
In the present work, the systematic occurrence of power-laws inthe size distribution of inter-PCS spacers has been investigated in avariety of eukaryotic genomes. An aggregative model based on well-known events of chromosomal dynamics including gene duplicationsand eliminations, repeat proliferation and genome size reduction istested and found compatible with the reported genomic inter-PCS sizedistributions.
We have to keep in mind that the presented minimal evolutionaryscenario captures only limited aspects of the global genomicdynamics, ignoring, inevitably, selective constraints which contributecapitally to the global chromosomal architecture. Moreover, genomicshuffling which probably contributes to the similarity of power-lawsintra-genomically (see Fig. 2 and remark in Section 2.2 Preliminaries)is likely to affect the integrity of the reported power-laws leading tothe observed truncation of the tails formed by large inter-genicspacers (see Figs. 1, 3 and plots in Supplementary file 2). Nevertheless,“gene deserts” (Ovcharenko et al., 2005) are relatively frequent ingenomic architecture, inducing the idea that once created, they oftenremain stable resisting chromosomal rearrangements due to somefunctionality (e.g. hosting regulatory elements). The presented modeloffers an explanation for the initial emergence of these particularlylarge gene-empty regions.
As discussed in Section 3.4 Further aspects of inter-PCS spacers'size distribution, power-laws' resistance to destruction when reduc-tion of genome size occurs, and the highly conserved character ofcoding regions may explain the observed lack of correspondencebetween the actual extent of power-laws in different organisms anddifferences in their genomic structure and history. The quasi-ubiquitous occurrence of inter-genic power-laws is compatible withthe assignment of their existence to an evolutionary scenario based onwidespread molecular events, as is the case in the segmentalduplication – gene elimination model proposed herein.
Acknowledgements
Weare grateful toMrs. N. Chousou-Polydouri forhelpful discussionsand for her valuable suggestions during the final preparation of themanuscript.
Appendix A. Supplementary data
Supplementary data associated with this article can be found, inthe online version, at doi:10.1016/j.gene.2009.04.028.
References
Adamic, L.A., Huberman, B.A., 2002. Zipf's law and the Internet. Glottometrics 3,143–150.
Adams, K.L., Wendel, J.F., 2005. Polyploidy and genome evolution in plants. Curr. Opin.Plant Biol. 8, 135–141.
Almirantis, Y., 1999. A standard deviation based quantification differentiates codingfrom non-coding DNA sequences and gives insight to their evolutionary history.J. Theor. Biol. 196, 297–308.
Almirantis, Y., Provata, A., 1997. The “clustered structure” of the purines/pyrimidinesdistribution in DNA distinguishes systematically between coding and non-codingsequences. Bull. Math. Biol. 59, 975–992.
Almirantis, Y., Provata, A., 1999. Long- and short-range correlations in genomeorganization. J. Stat. Phys. 97, 233–262.
Arneodo, A., Bacry, E., Graves, P.V.,Muzy, J.F.,1995. Characterizing long-range correlationsin DNA-sequences from wavelet analysis. Phys. Rev. Lett. 74, 3293–3296.
Audit, B., Thermes, C., Vaillant, C., D'aubenton-Carafa, Y., Muzy, J.F., Arneodo, A., 2001.Long-range correlations in genomic DNA. A signature of the nucleosomal structure.Phys. Rev. Lett. 86, 2471–2474.
Bailey, J.A., et al., 2002. Recent segmental duplications in the human genome. Science297, 1003–1007.
Bensasson, D., Petrov, D.A., Zhang, D.X., Hartl, D.L., Hewitt, G.M., 2001. Genomic gigantism.DNA loss is slow in mountain grasshoppers. Mol. Biol. Evol. 8 (2), 246–253.
Bernardi, G., 1995. The human genome: organization and evolutionary history. Annu.Rev. Genet. 29, 445–476.
Ciccareli, F.D., Doerks, T., von Mering, C., Creevey, C.J., Snel, B., Bork, P., 2006. Towardautomatic reconstruction of a highly resolved tree of life. Science 311, 1283–1287.
Clauset, A., Shalizi, C.R., Newman, M.E.J., 2009. Power-law distributions in empiricaldata. arXiv.0706.1062v2 [physics.data-an].
De Grassi, A., Lanave, C., Saccone, C., 2008. Genome duplication and gene-familyevolution: the case of three OXPHOS gene families. Gene 421, 1–6.
Deininger, P.L., Batzer,M.A., 2002.Mammalian retroelements. Genome Res.12,1455–1465.Doolittle, W.F., Sapienza, C., 1980. Selfish genes, the phenotype paradigm and genome
evolution. Nature 284, 601–603.Feder, J., 1988. Fractals. Plenum Press, New York.Gibson, T.J., Spring, J., 2000. Evidence in favour of ancient octaploidy in the vertebrate
genome. Biochem. Soc. Trans. 28, 259–264.Grant, D., Cregan, P., Shoemaker, R.C., 2000. Genome organization in dicots. Genome
duplication in Arabidopsis and synteny between soybean and Arabidopsis. Proc.Natl. Acad. Sci. U. S. A. 97, 4168–4173.
Hackenberg, M., Bernaola-Galvan, P., Carpena, P., Oliver, J.L., 2005. The biaseddistribution of Alus in human isochores might be driven by recombination.J. Mol. Evol. 60, 365–377.
Hokamp, K., McLysaght, A., Wolf, K.H., 2003. The 2R hypothesis and the human genomesequence. J. Struct. Funct. Genomics 3, 95–110.
Hsu, T.C., 1975. A possible function of constitutive heterochromatin. The bodyguardhypothesis. Genetics 79 (Suppl.), 137–150.
IHGSC, 2001. Initial sequencing and analysis of the human genome. Nature 409,860–921.
Jeffares, D.C., Mourier, T., Penny, D., 2006. The biology of intron gain and loss. TrendsGenet. 22, 17–22.
Jullien, R., Botet, R., 1987. Aggregation and Fractal Aggregates. World Scientific, Singapore.Jurka, J., Kohany, O., Pavlicek, A., Kapitonov, V.V., Jurka, M.V., 2004. Duplication,
co-clustering, and selection of human Alu retrotransposons. Proc. Natl. Acad. Sci.U. S. A. 101, 1268–1272.
Jurka, J., Kapitonov, V.V., Kohany, O., Jurka, M.V., 2007. Repetitive sequences in complexgenomes. Structure and evolution. Annu. Rev. Genom. Hum. Genet. 8, 241–259.

28 D. Sellis, Y. Almirantis / Gene 447 (2009) 18–28
Kasahara, M., 2007. The 2R hypothesis. An update. Curr. Opin. Immunol. 19, 547–552.Kehrer-Sawatzki, H., Cooper, D.N., 2008. Molecular mechanisms of chromosomal
rearrangement during primate evolution. Chromosome Res. 16, 41–56.Kirsch, S., et al., 2008. Evolutionary dynamics of segmental duplications from human
Y-chromosomal euchromatin/heterochromatin transition regions. Genome Res. 18,1030–1042. doi:10.1101/gr.076711.108.
Li, W., 2002. Zipf's law everywhere. Glottometrics 5, 14–21.Li, W., Kaneko, K., 1992. Long-range correlation and partial 1/f-alpha spectrum in a
noncoding DNA-sequence. Europhys. Lett. 17, 655–660.Lynch, M., Conery, J.S., 2000. The evolutionary fate and consequence of duplicate genes.
Science 290, 1151–1155.Mandelbrot, B.B., 1982. The Fractal Geometry of Nature. W.H. Freeman, San Francisco.Mantegna, R.N., et al., 1994. Linguistic features of noncoding DNA-sequences. Phys. Rev.
Lett. 73, 3169–3172.McLysaght, A., Enright, A.J., Skrabanek, L., Wolfe, K.H., 2000. Estimation of synteny
conservation and genome compaction between pufferfish (Fugu) and human. Yeast17, 22–36.
McLysaght, A., Hokamp, K., Wolfe, K.H., 2002. Extensive genomic duplication duringearly chordate evolution. Nat. Genet. 31, 200–204.
Newman, M.E.J., 2005. Power laws, Pareto distributions and Zipf's law. Contemp. Phys.46, 323–351.
Ohno, S., 1970. Evolution by Gene Duplication. New York. Springer; 1970. George Allen &Unwin, London.
Oliver, M.J., Petrov, D., Ackerly, D., Falkowski, P., Schofield, O.M., 2007. The mode andtempo of genome size evolution in eukaryotes. Genome Res. 17, 594–601.
Orgel, L.E., Crick, F.H., 1980. Selfish DNA. The ultimate parasite. Nature 284, 604–607.Ovcharenko, I., Loots, G.G., Nobrega, M.A., Hardison, R.C., Miller, W., Stubbs, L., 2005.
Evolution and functional classification of vertebrate gene deserts. Genome Res. 15,137–145.
Pavlicek, A., Jabbari, K., Paces, J., Paces, V., Hejnar, J., Bernardi, G., 2001. Similar integrationbut different stability of Alus and LINEs in the human genome. Gene 276, 39–45.
Peng, C.K., et al., 1992. Long-range correlations in nucleotide-sequences. Nature 356,168–170.
Petrov, D.A., 2002. Mutational equilibrium model of genome size evolution. Theor.Popul. Biol. 61, 531–544.
Pozzoli, U., et al., 2003. Comparative analysis of vertebrate dystrophin loci indicateintron gigantism as a common feature. Genome Res. 13, 764–772.
Robertson, H.M., 2000. The large srh family of chemoreceptor genes in Caenorhabditisnematodes reveals processes of genome evolution involving large duplications anddeletions and intron gains and losses. Genome Res. 10, 192–203.
Roy, S.W., 2003. Recent evidence for the exon theory of genes. Genetica 118, 251–266.Sellis, D., Provata, A., Almirantis, Y., 2007. Alu and LINE1 distributions in the human
chromosomes. Evidence of global genomic organization expressed in the form ofpower laws. Mol. Biol. Evol. 24, 2385–2399.
Sémon, M., Wolfe, K.H., 2007. Reciprocal gene loss between Tetraodon and zebrafishafter whole genome duplication in their ancestor. Trends Genet. 23, 108–112.
Shapira, S.K., Finnerty, V.G., 1986. The use of genetic complementation in the study ofeukaryotic macromolecular evolution. Rate of spontaneous gene duplication at twoloci of Drosophila melanogaster. J. Mol. Evol. 23, 159–167.
Takayasu, H., Takayasu, M., Provata, A., Huber, G., 1991. Statistical properties ofaggregation with injection. J. Stat. Phys. 65, 725–745.
Vicsek, T., 1989. Fractal Growth Phenomena. World Scientific, Singapore.Vinogradov, A.E., 1998. Buffering. A possible passive-homeostasis role for redundant
DNA. J. Theor. Biol. 193, 197–199.Voss, R.F., 1992. Evolution of long-range fractal correlations and 1/f noise in DNA-base
sequences. Phys. Rev. Lett. 68, 3805–3808.Wolfe, K.H., 2001. Yesterday's polyploids and the mystery of diploidization. Nat. Rev.,
Genet. 2, 334–341.