Potentiometric Titrations of Maleic Acid Copolymers in Dilute Aqueous Solution: Experimental Results...
12
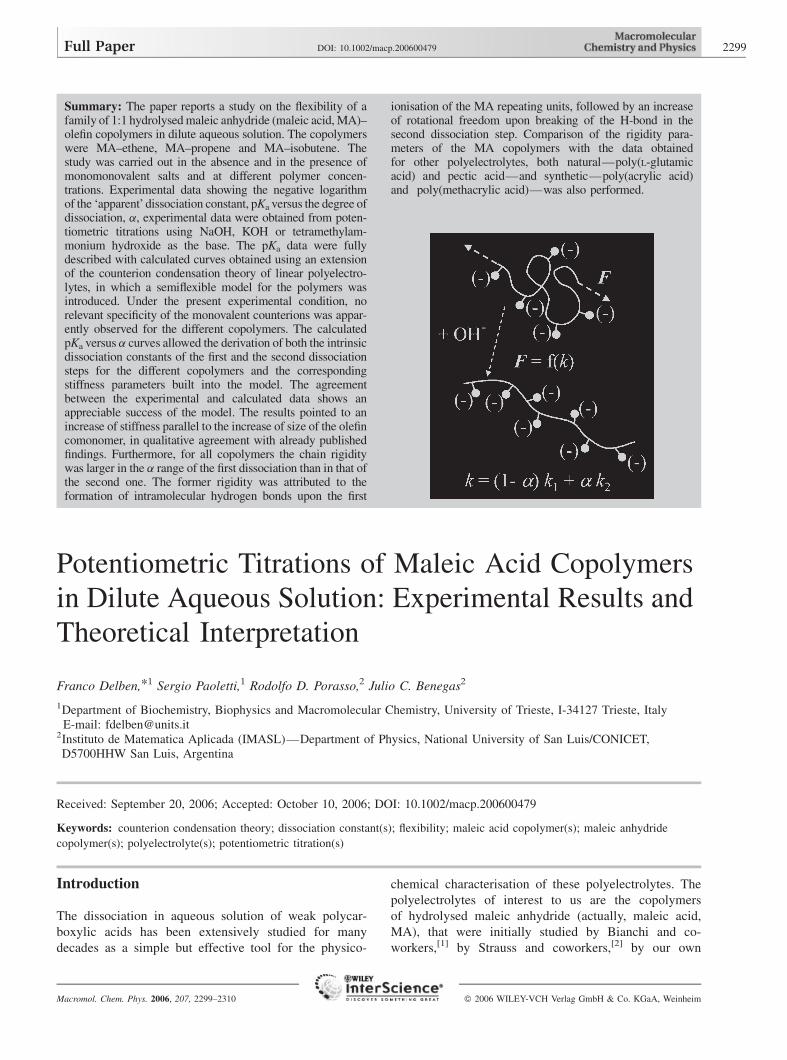
Potentiometric Titrations of Maleic Acid Copolymers in Dilute Aqueous Solution: Experimental Results and Theoretical Interpretation Franco Delben, * 1 Sergio Paoletti, 1 Rodolfo D. Porasso, 2 Julio C. Benegas 2 1 Department of Biochemistry, Biophysics and Macromolecular Chemistry, University of Trieste, I-34127 Trieste, Italy E-mail: [email protected] 2 Instituto de Matematica Aplicada (IMASL)—Department of Physics, National University of San Luis/CONICET, D5700HHW San Luis, Argentina Received: September 20, 2006; Accepted: October 10, 2006; DOI: 10.1002/macp.200600479 Keywords: counterion condensation theory; dissociation constant(s); flexibility; maleic acid copolymer(s); maleic anhydride copolymer(s); polyelectrolyte(s); potentiometric titration(s) Introduction The dissociation in aqueous solution of weak polycar- boxylic acids has been extensively studied for many decades as a simple but effective tool for the physico- chemical characterisation of these polyelectrolytes. The polyelectrolytes of interest to us are the copolymers of hydrolysed maleic anhydride (actually, maleic acid, MA), that were initially studied by Bianchi and co- workers, [1] by Strauss and coworkers, [2] by our own Full Paper DOI: 10.1002/macp.200600479 2299 Summary: The paper reports a study on the flexibility of a family of 1:1 hydrolysed maleic anhydride (maleic acid, MA)– olefin copolymers in dilute aqueous solution. The copolymers were MA–ethene, MA–propene and MA–isobutene. The study was carried out in the absence and in the presence of monomonovalent salts and at different polymer concen- trations. Experimental data showing the negative logarithm of the ‘apparent’ dissociation constant, pK a versus the degree of dissociation, a, experimental data were obtained from poten- tiometric titrations using NaOH, KOH or tetramethylam- monium hydroxide as the base. The pK a data were fully described with calculated curves obtained using an extension of the counterion condensation theory of linear polyelectro- lytes, in which a semiflexible model for the polymers was introduced. Under the present experimental condition, no relevant specificity of the monovalent counterions was appar- ently observed for the different copolymers. The calculated pK a versus a curves allowed the derivation of both the intrinsic dissociation constants of the first and the second dissociation steps for the different copolymers and the corresponding stiffness parameters built into the model. The agreement between the experimental and calculated data shows an appreciable success of the model. The results pointed to an increase of stiffness parallel to the increase of size of the olefin comonomer, in qualitative agreement with already published findings. Furthermore, for all copolymers the chain rigidity was larger in the a range of the first dissociation than in that of the second one. The former rigidity was attributed to the formation of intramolecular hydrogen bonds upon the first ionisation of the MA repeating units, followed by an increase of rotational freedom upon breaking of the H-bond in the second dissociation step. Comparison of the rigidity para- meters of the MA copolymers with the data obtained for other polyelectrolytes, both natural—poly(L-glutamic acid) and pectic acid—and synthetic—poly(acrylic acid) and poly(methacrylic acid)—was also performed. Macromol. Chem. Phys. 2006, 207, 2299–2310 ß 2006 WILEY-VCH Verlag GmbH & Co. KGaA, Weinheim
Transcript of Potentiometric Titrations of Maleic Acid Copolymers in Dilute Aqueous Solution: Experimental Results...
Full Paper DOI: 10.1002/macp.200600479 2299
Summary: The paper reports a study on the flexibility of afamily of 1:1 hydrolysed maleic anhydride (maleic acid, MA)–olefin copolymers in dilute aqueous solution. The copolymerswere MA–ethene, MA–propene and MA–isobutene. Thestudy was carried out in the absence and in the presence ofmonomonovalent salts and at different polymer concen-trations. Experimental data showing the negative logarithmof the ‘apparent’ dissociation constant, pKa versus the degree ofdissociation, a, experimental data were obtained from poten-tiometric titrations using NaOH, KOH or tetramethylam-monium hydroxide as the base. The pKa data were fullydescribed with calculated curves obtained using an extensionof the counterion condensation theory of linear polyelectro-lytes, in which a semiflexible model for the polymers wasintroduced. Under the present experimental condition, norelevant specificity of the monovalent counterions was appar-ently observed for the different copolymers. The calculatedpKa versus a curves allowed the derivation of both the intrinsicdissociation constants of the first and the second dissociationsteps for the different copolymers and the correspondingstiffness parameters built into the model. The agreementbetween the experimental and calculated data shows anappreciable success of the model. The results pointed to anincrease of stiffness parallel to the increase of size of the olefincomonomer, in qualitative agreement with already publishedfindings. Furthermore, for all copolymers the chain rigiditywas larger in the a range of the first dissociation than in that ofthe second one. The former rigidity was attributed to theformation of intramolecular hydrogen bonds upon the first
ionisation of the MA repeating units, followed by an increaseof rotational freedom upon breaking of the H-bond in thesecond dissociation step. Comparison of the rigidity para-meters of the MA copolymers with the data obtainedfor other polyelectrolytes, both natural—poly(L-glutamicacid) and pectic acid—and synthetic—poly(acrylic acid)and poly(methacrylic acid)—was also performed.
Potentiometric Titrations of Maleic Acid Copolymers
in Dilute Aqueous Solution: Experimental Results and
Theoretical Interpretation
Franco Delben,*1 Sergio Paoletti,1 Rodolfo D. Porasso,2 Julio C. Benegas2
1Department of Biochemistry, Biophysics and Macromolecular Chemistry, University of Trieste, I-34127 Trieste, ItalyE-mail: [email protected]
2Instituto de Matematica Aplicada (IMASL)—Department of Physics, National University of San Luis/CONICET,D5700HHW San Luis, Argentina
Received: September 20, 2006; Accepted: October 10, 2006; DOI: 10.1002/macp.200600479
Keywords: counterion condensation theory; dissociation constant(s); flexibility; maleic acid copolymer(s); maleic anhydride
copolymer(s); polyelectrolyte(s); potentiometric titration(s)
Introduction chemical characterisation of these polyelectrolytes. The
polyelectrolytes of interest to us are the copolymers
The dissociation in aqueous solution of weak polycar-
boxylic acids has been extensively studied for many
decades as a simple but effective tool for the physico-
Macromol. Chem. Phys. 2006, 207, 2299–2310
of hydrolysed maleic anhydride (actually, maleic acid,
MA), that were initially studied by Bianchi and co-
workers,[1] by Strauss and coworkers,[2] by our own
� 2006 WILEY-VCH Verlag GmbH & Co. KGaA, Weinheim

2300 F. Delben, S. Paoletti, R. D. Porasso, J. C. Benegas
group,[3] by Kawaguchi and coworkers,[4] and, more
recently, by other research groups.[5–8]
Among the experimental techniques used, there is no
doubt that acid–base potentiometric titrations were the most
extensively applied. Provided that the concentration and the
value of the intrinsic dissociation constant of the poly-
carboxylic acid are known, potentiometric titrations allow
the computation of the values of the apparent dissociation
constant and hence the values of the excess electrostatic free
energy of dissociation, DGdiss, as a function of the degree of
dissociation, a. The intrinsic (at a¼ 0) and the ‘apparent’
dissociation constants (at a> 0) are usually expressed
through their negative logarithm, that is, pK0 and pKa,
respectively. Once other thermodynamic parameters (for
example, DH or DV) are obtained through independent
experimental or theoretical ways, the knowledge of DGdiss
enables full thermodynamic characterisation or interpreta-
tion of the behaviour of the polyelectrolyte in solution.
In some cases, the inspection of the curve of pKa versus
a was used to ascertain the presence of cooperative
conformational transitions occurring by varying the pH of
the polymer solution. In fact, the presence of anomalous
trends, and in particular the presence of ‘bumps’ in the
potentiometric curve profile, are usually considered as the
experimental evidence of a conformational transition,[9]
unless such peculiarities can be attributed to aggregation–
disaggregation phenomena occurring as a function of
pH.[10a,10b] For some ‘hydrophobic’ polyelectrolytes,
including certain MA copolymers,[3i,3j] and poly(metha-
crylic acid),[11] it is very difficult (and sometimes even
impossible) to discriminate between chain separation and
dissolution of aggregates, on one side, and cooperative
conformational transitions, on the other, both of which can
occur on increasing pH. This is a severe limit for a correct
interpretation of the experimental evidence of potentio-
metric titrations of these systems. The introduction of
suitable methods for determining pK0, which is one of the
aims of this paper, could be very helpful in this respect.
Since many biopolymers of high biological relevance
are polycarboxylic acids, the physicochemical character-
isation of their conformation in solution takes a practical,
as well as a theoretical, importance, being related to their
biological activity. The present attempt at simulating the
experimental data of pKa (or DGdiss) with theoretical
curves, obtained using suitable expressions derived from
physical modelling, must be seen in the same light.
In the present study, we compared the experimental
titration data obtained for three different 1:1 MA copolymers
with a-olefins (namely, ethene, propene and isobutene),
hereafter labelled MAE, MAP and MAiB, respectively,[3c]
with the curves calculated from our model, in which the
flexibility characteristic of each copolymer was explicitly
considered.
The counterion condensation (CC) theory, based on first
principles,[12] which has been elaborated on mainly by
Macromol. Chem. Phys. 2006, 207, 2299–2310 www.mcp-journal.de
Manning,[13] has been judged by many researchers to be
simple and reliable. As a matter of fact, it was successful in
describing different types of experimental data.[10a,14a]
Our laboratory has been active in developing extensions
of the CC theory to improve its range of application.[14] We
have also presented a model of semiflexible polyelectro-
lytes to take into account the thermodynamic conforma-
tional averaging that takes place in a polymeric solu-
tion.[15a] This model was introduced to make the CC model
assumption on the chain conformation a more realistic one.
In its original form, it considers the polymer as an (infinite)
line of equally spaced charges, that is, an infinite rigid rod,
ignoring the rich conformational space usually available to
a polymer in solution. Model analysis of potentiometric
titration data of highly charged weak polyelectrolytes, such
as poly(glutamic acid) (PGA)[15b] or more recently
poly(acrylic acid) (PAA),[15c,15d] has shown that properly
averaging the thermodynamic functions over the available
conformational space is mandatory in order to efficiently
compare experimental data and model calculations. These
studies also showed that such a sampling of the confor-
mational space can be represented just by an energy term of
the Hooke type, that is simply added to the polyelectrolytic
excess energy terms provided by the CC theory.
Another significant development of the theory was more
recently reached, to account for possible differences in the
intrinsic ionisation of the different functional groups pre-
sent on a polyelectrolytic chain.[14d] As a matter of fact, the
theoretical analysis of the experimental titration data of
copolymeric polycarboxylates is more complicated than
that of the corresponding data for homopolymers. In the
former case one has to determine the number of different
types of ionisable functional groups, i, their corresponding
fractional abundances, Xi, and the values of pK i0 for each
type of functional group. In a first application of this model,
Paoletti et al were able to interpret the bump that appears
in the pKa versus a curves of the ionic polysaccharide
succinoglycan, without invoking any conformational
transition induced by the change of pH, in agreement
with experiment.[14d]
This extension of the CC theory of linear polyelec-
trolytes for the dissociation process of a copolymer with
different functional groups was the prelude to another re-
finement of the theory proposed by Porasso et al that
allowed for the analysis of potentiometric titration data of
natural multifunctional polyelectrolytes, such as humic
acid.[15e]
The present approach eliminates the necessity of using two
different titration equations for the dissociation of the first and
the second ionising group, respectively, as performed in the
older attempts.[2] Also, it overcomes difficulties related with
the choice of the most appropriate value(s) for pK0, which is a
severe limit in the usual approach.[3i,8a]
The inspection of specific polycarboxylate–counterion
interactions was outside the aims of the present work.
� 2006 WILEY-VCH Verlag GmbH & Co. KGaA, Weinheim

Potentiometric Titrations of Maleic Acid Copolymers in Dilute Aqueous Solution: . . . 2301
However, since the potentiometric titrations in the absence
of added salts were performed using as the base in some
cases NaOH while in others KOH, we have also looked for
the possibility of any difference, which could be attributed
to specific interactions of these counterions with the copo-
lymers studied.
Experimental Part
Materials
The MA-olefin copolymers MAE, MAP and MaiB are knownto be of the 1:1 alternating type because of their polymerisa-tion mechanism. They were obtained by hydrolysis at 90 8C indilute NaOH of the corresponding MA–olefin copolymersreceived from the Monsanto Chemical Co., at present DowChemical Co. After hydrolysis, the basic solutions weredialysed exhaustively against water, passed through a cation-exchange column in the Hþ form, dialysed again, andconcentrated under reduced pressure at about 40 8C.
The average number molecular weight was about 105
g �mol�1 in all cases.[1] In view of the free radical process ofsynthesis, the copolymers were believed to be essentiallyatactic. Stock solutions of the polyacids were prepared byweight. Their concentrations were determined by potentio-metric titrations of a small volume of the solution at roomtemperature, using standard Carlo Erba Normex NaOH, in thepresence of 2 M NaCl to enhance accuracy in the detection ofthe equivalent points. The concentration was expressed inequivalents (eq) L�1, that is, mole of charge per litre.
Certified 0.1 N Normex from Carlo Erba (NaOH) orNormadose Prolabo (KOH) solutions were used to obtain thetitration pH versus (volume of base) curves. HCl solutionsused in the cation-exchange column were prepared by dilutionof certified 0.1 N Normex from Carlo Erba solutions.
Pure tetramethylammonium perchlorate (TMAClO4) wasprepared by neutralisation of Fluka cold aqueous tetramethy-lammonium hydroxide (TMAOH) with Carlo Erba RPconcentrated perchloric acid. The white precipitate wascollected, washed with cold water, then with methanol, andfinally dried under vacuum overnight and stored undervacuum over P4O10. The purity of the final product waschecked by elemental analysis with a Carlo Erba model 1106Elemental Analyzer. Deionized water which was doublydistilled under special glass was used. Its specific conductivitywas approximately 10�6 ohm�1 � cm�1.
Methods and Instruments
Potentiometric titrations from this laboratory have alreadybeen reported.[3h] New ones were performed on freshly pre-pared solutions in glass vessels, thermostated at 25.00�0.05 8C, using a Radiometer PHM52 digital pH meter withRadiometer GK2301C or GK2321C combined electrodes.Standardisation was checked at pH 4.01 (�0.01) and 7.00(�0.01) with Radiometer buffer solutions. Pure nitrogen wasfluxed only for pH values above 9.
Macromol. Chem. Phys. 2006, 207, 2299–2310 www.mcp-journal.de
The potentiometric titrations were performed with 1 N KOHor NaOH solutions, so that the polyelectrolyte concentrationdid not vary significantly during titration. For each copolymer,a number of potentiometric titrations have been carried out.Careful and frequent control of the calibration of the pH meterwith standard buffer solutions yielded highly reproducible pHdata for all cases. On the basis of this analysis, the pKa valuesmay thus be considered to be accurate to within �0.02 pKa
units. The titrations were carried out at low polymer concen-tration in order to avoid any chain aggregation at low a values.The latter was never reported in any previous paper. It wasconfirmed in this study by the complete absence of turbidity ofall the solutions at low pH.
From the titration data points the values of the overalldegree of dissociation a were computed with the followingexpression:
a ¼ an þ10�pH
Cp
¼ vðaÞva¼1
þ V0 þ vðaÞCo
p � V0� 10�pH; (1)
where an is the degree of neutralisation, and Cp and Cop are the
actual and the initial equivalent concentration of the poly-electrolyte, respectively. v(a) and V0 stay for the volume oftitrant (base) and the initial volume of the polyacid,respectively, and va¼ 1 is the volume of base necessary forcomplete neutralisation of the polyacid.
The values of pKa were then computed as a function of ausing the well-known Henderson-Hasselbalch equation:
pKa ¼ pHþ log1� a
a
� �: (2)
Theory
Counterion Condensation Theory
The usual starting point in the CC theory of linear poly-
electrolytes is to replace the real chain by an infinitely long
charged line.[10b,16] The fundamental assumption in this
approximation is that the total polyelectrolyte charge, as
seen by a probe charge away from the polyelectrolytic
domain, can be modelled as uniformly spread over the
polymer, which permits a definition of a (mean) structural
charge density to be made, j, given by:[14b]
j ¼ lB
b¼ e2
" kBTb; (3)
where lB is the Bjerrum length, b is the average distance
between consecutive charges projected onto the polymer
axis, e is the value of the elementary charge, e is the bulk
dielectric constant, kB is the Boltzmann’s constant and T is
the absolute temperature.
Following the procedure already described,[10a] one can
write the analytical expressions for the polyelectrolytic
� 2006 WILEY-VCH Verlag GmbH & Co. KGaA, Weinheim

2302 F. Delben, S. Paoletti, R. D. Porasso, J. C. Benegas
(Gpol) and entropic (Gentr) contributions to the total
(excess) ionic free energy of the polyelectrolyte solution:
�pKa
Macrom
Gion ¼ Gpol þ Gentr: (4)
Proper derivation of this free energy yields the functional
form of the thermodynamic function of interest,[16] which
for the present study is the apparent dissociation constant,
Ka, given in general by:
pKaðaÞ ¼ pK0 þ DpKaðaÞ: (5)
For a monoprotic weak polyacid, pK0 is the intrinsic pK
characteristic of the isolated ionisable repeat unity making
up the polymer, while the change in pKa due to the
ionisation of the polyelectrolyte is included in the term
DpKa. If the ionic free energy function, Gion, is known, we
can readily calculate:
DpKaðaÞ ¼1
np2:303 RT
dGionðaÞda
¼ Gdissða;j;Cp;C1;T ;"Þ; (6)
where np is the number of polymeric charge units, R is
the gas constant, and Cp and C1 stand for the analytical
concentrations of polymeric units and monovalent counter-
ions from the supporting 1:1 electrolyte, respectively.
Within the framework of CC theory, the analytical ex-
pression of the DpKa function has been shown to be the
following: [10a] a) for j� jcrit¼ 1
�pKað�Þ ¼ ���
2:3032 ln 1� exp ��b
�
� �� �þ �b
� exp �b�
� �� 1
� � �
2½�þ 2R1�� 1
� �( ); ð7aÞ
where: R1 ¼ C1Cp
and k2¼ l (aCpþ 2Cl), with l ¼ 8pe2NA
"kBT103
(NA is Avogadro’s number), and b) for j> jcrit¼ 1
ð�Þ ¼ 1
2:303� 1
��2 ln 1� exp � �b
�
� �� �þ � bSU
� exp �b�
� �� 1
� �" #(
þ r log�r
r þ R1
1
VpCP
� �þ ð1� rÞlog �þ R1 � �r
ð�þ R1Þð1� VpCPÞ
� �;
ð7bÞ
where:
SU ¼ 1
2
að1� rÞ2ðað1� rÞ þ 2R1
� �� 1
and
k2 ¼ l½aCpð1� rÞ þ 2C1�
ol. Chem. Phys. 2006, 207, 2299–2310 www.mcp-journal.de
jcrit is the critical value of j at which a fraction r of coun-
terions is condensed into the condensation volume, Vp,
surrounding the polymer axis. For monovalent counterions
of the titrating base (for example, MeOH, withMeþ an alkali
metal cation or TMAþ), jcrit¼ 1. For details of the derivation
of these equations, see reference [7].
We have previously shown that, for heterogeneous
weak polyelectrolytes made by any number, i, of different
functional groups (i is 2 for our copolymers) having
fractional abundance Xi and intrinsic dissociation constant
pK i0, the overall intrinsic pK0 is a function of the degree of
ionisation a given by:[15e]
pK0ðaÞ ¼ pKi0 þ log
bi
ð1� biÞð1� aÞ
a
� �; (8)
where bi corresponds to the ionisation degree of the
ith functional group.
The insertion of Equations (7a) or (7b) and (8) into
Equation (5) allows for the calculation of theoretical
potentiometric titration curves.
Chain Stiffness and Potentiometric Titration
In order to compare experimental data and model calcu-
lations, previous studies from our group[15a–15d,17] have
shown that it is necessary to consider the thermodynamic
averaging of Equation (5) over the conformational space
available to the polyelectrolyte in solution.
In principle, according to the predictions of Manning’s
theory, the pKa(a) curve of a weak polyacid – having
the charge density jmax at a¼ 1 - monotonously increases
from pK0.[15f] Actually, that theory is able only to make
predictions on the difference between pKa(a) and pK0,
DpKa(a), which is directly related to the increase of
the polyelectrolytic free energy upon charging (that is,
increase of a). pK0 is considered as an intrinsic property
of the polyacid chain, stemming from the overall balance
of chemical interactions of the dissociating group, and is
� 2006 WILEY-VCH Verlag GmbH & Co. KGaA, Weinheim
Potentiometric Titrations of Maleic Acid Copolymers in Dilute Aqueous Solution: . . . 2303
supposed to be independent of the ionisation state of the
polyelectrolyte. The DpKa(a) curve increases very rapidly
from a¼ 0 to a1¼ (jmax)�1, corresponding to j¼ 1. Beyond
a1, the predicted curve increase is very small indeed. The
peculiar aspect is that although the pKa(a) curve is
continuous, its first derivative,dpKaðaÞ
da, is discontinuous at
a1. No pKa(a) curve of a weak polyacid has ever been
reported showing such a behaviour. However, if one assumes
a family of several pKa(a) curves having a distribution (for
example, without loss of generality, a Gaussian distribution)
of jmax values around a central value j0max, the ensuing
convoluted pKa(a) curve, which is derived from thermo-
dynamic averaging, will be smoother with no discontinuity
ofdpKaðaÞ
da, perfectly resembling the experimentally deter-
mined pKa(a) curves. The smoothness of the convoluted
curve clearly depends on the width of the distribution: a very
broad distribution will produce slowly increasing DpKa(a)
curves, whereas a narrow distribution will give rise to more
‘asymmetric’ DpKa(a) curves. The curve predicted by
Manning’s theory in its simple form corresponds to the
limiting case of a Dirac’s delta distribution curve. In our
previous works on the matter,[15a] we assumed that such a
distribution reflects a distribution of pseudohelical segments
of different extension. In turn, such distribution was sup-
posed to derive from the interplay of the polyelectrolyte
potential (which depends on intercharge distance) and the
conformational energy of the polyacid chain, since, in
general, different values of the conformational rotation
angles correspond to different values of chain elongation.
Passing from potentials to forces, the ionisation process of a
weak polyacid can be visualised as follows. The increase of
chain charging is expected to bring about a parallel increase
of chain segment extension: the polymer counterbalances
the increase of the (polyelectrolyte) ionic free energy,
Gion(a), by increasing the average distance between the
charges. However, such a (polyelectrolytic) expansion force
which stretches the chain segments is contrasted by the
retreating force originating from the intrinsic stiffness of the
polymer chain.
The system can be visualised as an electrically charged
spring undergoing (electrostatic) stretching, responding with
a conformational restoring force of the Hooke’s type,
characterised by a rigidity constant, k, which reflects the
distribution of (or, more precisely, the possibility of distri-
buting over) conformational states. So far, no systematic
attempts at correlating the values of k with properties such as
the persistence length (or the Kuhn’s length), or the so-called
Smidsrød’s ‘B empirical parameter of stiffness’ from
viscosity/ionic strength studies have been reported. Still,
in the case of carboxymethylamylose the predictions of the
viscosity behaviour by the theoretical approach derived from
the configurational statistics of the (uncharged) amylose
chain were in excellent agreement with the experiments.[15a]
Moreover, this finding clearly points to the fact that
k should be correlated with the ‘intrinsic’ or ‘bare’
Macromol. Chem. Phys. 2006, 207, 2299–2310 www.mcp-journal.de
persistence length, and not with the ‘total’ or with its
‘electrostatic’ part. In our works it was shown that a single
value of k was sufficient to provide an excellent fit of the
DpKa(a) curves of a weak monoprotic polyacid, even
including the case of pH-induced conformational transi-
tion.[15b] The fitting of the pKa(a) curve of a polyacid - the
j0maxvalue of which is supposed to be known - is basically
modulated by two parameters, namely pKa0, corresponding
to the intrinsic dissociation constant, and k, accounting for
the smoothness of the DpKa(a) curve and related to the
intrinsic chain stiffness. The task at hand in this paper is to
extend the approach to the case of weak diprotic polyacids.
For the present case of perfectly alternating copolymers, it
seems reasonable to assume that the polymeric confor-
mational states are affected by the state of ionisation of
the two types of functional groups, with the resulting
dependence of polymer flexibility upon the ionisation state.
Therefore, in the present analysis, the total flexibility of the
polymeric chain is considered to be a combination of two
limiting stiffness values, one corresponding to the flexi-
bility of the polymer at low values of the degree of disso-
ciation (initial dissociation of the first functional group),
and another representing the polymer flexibility at high
values of the degree of dissociation, that is, when only the
dissociation of the second functional group is taking place.
Hence, we consider an overall stiffness parameter k given
by:
k ¼ ð1� aÞk1 þ ak2; (9)
k1 and k2 being the stiffness parameters in the regions of
low and high values of the degree of ionisation, res-
pectively.
The fitting of the experimental data with the thermo-
dynamic function pKa(a) was obtained using a MatLab
computer program written by the authors. Basically, this
program uses one of the minimisation subroutines in the
MatLab environment, applying least square fitting to the
set of nonlinear Equations (5–8) in order to obtain the best
values of the free parameters of the model, that is the pK i0
of each functional group and the stiffness parameters ki.
The procedure was iterated until convergence of the four
parameters was reached, which always occurred in no more
than four iterative steps.
Determining the Free Parameters of the Model
For the copolymers studied here, the fraction Xi of both
dissociating groups was fixed at 0.5 for structural reasons,
which reduced the parameters to be obtained by the model
analysis.[15e] With this simplification, in the present case
the titration curves of all copolymers were successfully
reproduced by the model using only four free parameters
� 2006 WILEY-VCH Verlag GmbH & Co. KGaA, Weinheim

2304 F. Delben, S. Paoletti, R. D. Porasso, J. C. Benegas
Figure 1. Experimental pKa versus a data (squares) for MAiB inaqueous solution at 25 8C without any added salt, using KOH asthe titrant base. The initial polymer concentration was9.933� 10�3eq � L�1. The lines show the theoretical calculationsin the low (------) and high (—) ionisation regions. They show theasymptotic behaviour that yields the initial values of the stiffnessparameters k1 and k2.
2
4
6
8
10
0,80,60,40,20,0
pK a
corresponding to the two stiffness parameters, k1 and k2,
and the two intrinsic dissociation constants, pK10 and pK2
0 .
We first evaluated the two stiffness parameters by
separately fitting the limiting behaviour of the potentio-
metric titration data in the low (a� 0.35) and high
(a� 0.65) ionisation regions of the potentiometric titration
with the proper pKa(a) function. This procedure essentially
considers the copolymer as monoprotic in these limiting
ionisation regions. In practice, it therefore applies the
type of data analysis successfully used with PGA[15b]
and PAA.[15c,15d] The result for the potentiometric titration
of MAiB is represented in Figure 1 as a sample case. It is
readily seen that a good fit of the data was obtained
in both limiting ionisation regions. The procedure not
only provided an independent initial determination of
the two stiffness parameters, but also gave support to the
assumption that the chain flexibility changes upon ioni-
sation.
Using this set of initial values of the two stiffness para-
meters, the intrinsic ionisation constants pK10 and pK2
0
of the two types of functional groups were determined
by least square fitting of the whole titration. Due to the
complexity of the conformational averaging of the
theoretical pKa(a) function [Equation (5)], it was necessary
to develop a program in MatLab in order to match the
thermodynamic average of the calculated pKa function
with the experimental data points, as explained above.
αFigure 2. Experimental pKa versus a data for the MA copoly-mers in aqueous solution at 25 8C without any added salt, usingKOH as the titrant base. The polyelectrolytes initial equivalentconcentrations were: (&) MAE, 10.046� 10�3eq � L�1; (�)MAP, 10.080� 10�3eq � L�1; (*) MAiB, 9.933� 10�3eq � L�1.The corresponding theoretical curves: (------) MAE; (– – –) MAP;(—) MAiB, were calculated with the parameters reported inTable 1 and 2.
Results and Discussion
Previous potentiometric titrations carried out on different
MA-olefin copolymers in the presence of 1:1 added
salt showed that the pH jump in the half neutralisation
region (a¼ 0.5) could reach as much as a few units, the
Macromol. Chem. Phys. 2006, 207, 2299–2310 www.mcp-journal.de
phenomenon being more and more relevant on passing
from MAE to MAP to MAiB.[3h] As a consequence,
the pKa values also changed up to several units of pKa at
full ionisation with respect to the value at a¼ 0. On the
basis of calorimetric, potentiometric and dilatometric data,
this effect was essentially attributed to the variations in the
enthalpy of ionisation of the second dissociating group,
that becomes more unfavourable by about 3.3 kcal mol�1
on passing from MAE to MAP to MAiB.[3c] These data
indicate that the intrinsic pK0 of the second dissociating
group of MAiB is clearly higher than the intrinsic pK0 of
the second group of MAP, which in turn is higher than the
corresponding value for MAE.
Figure 2 shows new experimental pKa data, plotted as a
function of a, for the three MA-olefin copolymers,
obtained in water solution (that is, without any added
simple salt). Concentrated KOH was used as the titrating
base. The initial polymer concentrations are reported in
Table 1. In the case of MAiB, the presence of two different
ionisable groups is clearly shown in the potentiometric
titration data, namely, a large increase in pKa occurs around
a¼ 0.5, and there is a notable total change in pKa (about
6 pKa units), from low to high ionisation. With MAP and
MAE, the total change in pKa was also noticeable, but
progressively smaller than in the previous case (about 4 and
3 pKa units, respectively). In the same figure the results of
the theoretical calculations are also included. These results,
presented as curves, were obtained using the pK10 and pK2
0
values (reported in Table 1) and the k1 and k2 values
(reported in Table 2), which resulted from the fitting
process described in the Experimental Part. The total
change in pKa of the MAE copolymer, although the
smallest of the series, is much larger than for PAA, which
is a monoprotic weak carboxylic polyelectrolyte with the
same charge density as MAE in the trans conformation
(jPAA¼ jMAE¼ 2.828).[3l]
� 2006 WILEY-VCH Verlag GmbH & Co. KGaA, Weinheim

Potentiometric Titrations of Maleic Acid Copolymers in Dilute Aqueous Solution: . . . 2305
Table 1. Intrinsic ionization values for three MA-olefin copolymers in aqueous solutions at 25 8C. j¼ 2.828 in all cases.a)
Property MAE (m¼ 0)b) MAP (m¼ 1)b) MAiB (m¼ 2)b)
water solvent aq. 0.05 M
TMAClO4 solventwater
solventAq. 0.05 M
TMAClO4
solvent
watersolvent
aq. 0.05 M
TMAClO4
solvent
Cp (eq � L�1� 103) 10.046 (Kþ)c) 44.78 (Naþ)c) 10.019 10.080 (Kþ)c) 9.953 9.933 (Kþ)c) 39.84 (Naþ)c) 9.641
pK10
4.0 3.8 3.7 3.6 3.4 3.0 2.7 2.9
pK20
6.3 6.1 6.3 7.4 7.4 8.7 8.6 8.7
DpK0 (¼ pK20 � pK1
0 ) 2.3 2.3 2.6 3.8 4.0 5.7 5.9 5.8
sd) 0.12 0.14 0.14 0.10 0.20 0.13 0.12 0.51
a) The structural charge density, j, was 2.828 in all cases.[14b]
b) m denotes the number of side methyl groups in the repeat units.c) Cation of the titrant base. In aqueous TMAClO4, the titrations were performed using TMAOH as the base.
d) Quality of fit, given by s ¼ffiffiffiffiffiffiffiffiffiffiffiffiffiffiffiffiffiffiffiffiffiffiffiffiffiffiffiffiffiffiffiffiffiffiffiffiffiffiffiffiffiffiffi1n
Pni¼1ðpKi
exp � pKitheoÞ
2
s, where pKi
exp and pKitheostand for the experimental and the calculated pKi,
respectively.
The MAiB and MAP experimental data and the corres-
ponding calculated curves are in very good agreement, as
indicated by the low value of the root mean square
deviation between experimental data and calculated values
(s), shown in the bottom row of Table 1. The agreement
between experimental data and the calculated curves is
good also for the MAE copolymer, for which, however,
some differences in the central ionisation range are
detectable. It should be noted that the pK i0values of MAiB
obtained with the present model analysis are in close agree-
ment with data recently obtained on similar systems.[5c,8a]
In order to analyse the effect of the ionic strength, we
studied the same systems in the presence of 0.05 M
TMAClO4. This salt was chosen because of its well-known
low tendency for giving ion pairs. The experimental pKa
versus a data for MAiB, MAP and MAE copolymers in the
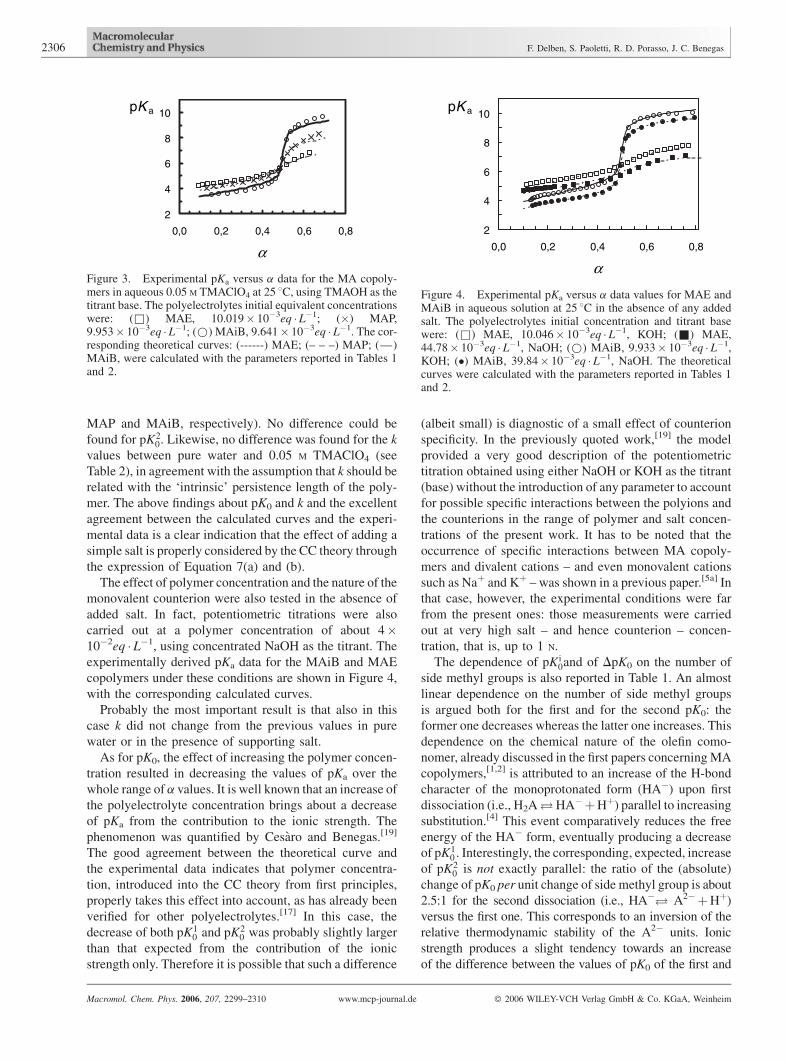
presence of TMAClO4 are reported in Figure 3. The trend
of the data preserved the overall characteristics of the
Table 2. Stiffness parameters for different polycarboxylates in aqu
Polymer Condition j
MAE 1st dissociation, MAE-I 2.828MAE 2nd dissociation, MAE-IIMAP 1st dissociation, MAP-I 2.828MAP 2nd dissociation, MAP-IIMaiB 1st dissociation, MAiB-I 2.828MaiB 2nd dissociation, MAiB-IIPAA 2.828PMA a> 0.3 2.828PLGA Ordered, helix 4.76PLGA Disordered 2.09PA Ordered (a< 0.4) 1.64PA Disordered (a> 0.4) 1.64
Macromol. Chem. Phys. 2006, 207, 2299–2310 www.mcp-journal.de
corresponding copolymer potentiometric titration in water,
but a general decrease of pH, and hence of pKa, throughout
all the a range was noted. This effect is well known and is
usually interpreted as a direct consequence of the screening
of the fixed charges on the polyion by the ionic atmos-
phere.[18] The same explanation also reasonably holds for
the observed slightly smaller total change in pKa from
low to high ionisation, that is, the ‘steepness’ of the
pKa curve. The latter being a direct measure of ðdGion=daÞ,or ðdGion=djÞ, it is immediately evident that any increase of
the ionic strength, that is, of k, would smooth the increase
of the electrostatic potential, as already noticed in the
potentiometric titration data of monoprotic poly-
electrolytes.
From Table 1 it can be seen that the values of pK0 of the
first dissociating groups show a very slight decrease upon
increase of the ionic strength and upon an increase of
substituent hindrance (namely, 0.3, 0.2 and 0.1 for MAE,
eous solutions at 25 8C.
Solvent k
kcal �mol�1 � A�2
Water or aqueous 0.05 M TMAClO4 0.100.050.190.100.240.14
Water 0.240.24
Water or aqueous 0.01 M NaCl 0.70.34
Water or aqueous 0.05 M NaClO4 0.30.1
� 2006 WILEY-VCH Verlag GmbH & Co. KGaA, Weinheim
2306 F. Delben, S. Paoletti, R. D. Porasso, J. C. Benegas
2
4
6
8
10
0,80,60,40,20,0
α
pK a
Figure 3. Experimental pKa versus a data for the MA copoly-mers in aqueous 0.05 M TMAClO4 at 25 8C, using TMAOH as thetitrant base. The polyelectrolytes initial equivalent concentrationswere: (&) MAE, 10.019� 10�3eq � L�1; (�) MAP,9.953� 10�3eq � L�1; (*) MAiB, 9.641� 10�3eq � L�1. The cor-responding theoretical curves: (------) MAE; (– – –) MAP; (—)MAiB, were calculated with the parameters reported in Tables 1and 2.
2
4
6
8
10
0,80,60,40,20,0
α
pK a
Figure 4. Experimental pKa versus a data values for MAE andMAiB in aqueous solution at 25 8C in the absence of any addedsalt. The polyelectrolytes initial concentration and titrant basewere: (&) MAE, 10.046� 10�3eq � L�1, KOH; (&) MAE,44.78� 10�3eq � L�1, NaOH; (*) MAiB, 9.933� 10�3eq � L�1,KOH; (�) MAiB, 39.84� 10�3eq � L�1, NaOH. The theoreticalcurves were calculated with the parameters reported in Tables 1and 2.
MAP and MAiB, respectively). No difference could be
found for pK20. Likewise, no difference was found for the k
values between pure water and 0.05 M TMAClO4 (see
Table 2), in agreement with the assumption that k should be
related with the ‘intrinsic’ persistence length of the poly-
mer. The above findings about pK0 and k and the excellent
agreement between the calculated curves and the experi-
mental data is a clear indication that the effect of adding a
simple salt is properly considered by the CC theory through
the expression of Equation 7(a) and (b).
The effect of polymer concentration and the nature of the
monovalent counterion were also tested in the absence of
added salt. In fact, potentiometric titrations were also
carried out at a polymer concentration of about 4�10�2eq � L�1, using concentrated NaOH as the titrant. The
experimentally derived pKa data for the MAiB and MAE
copolymers under these conditions are shown in Figure 4,
with the corresponding calculated curves.
Probably the most important result is that also in this
case k did not change from the previous values in pure
water or in the presence of supporting salt.
As for pK0, the effect of increasing the polymer concen-
tration resulted in decreasing the values of pKa over the
whole range of a values. It is well known that an increase of
the polyelectrolyte concentration brings about a decrease
of pKa from the contribution to the ionic strength. The
phenomenon was quantified by Cesaro and Benegas.[19]
The good agreement between the theoretical curve and
the experimental data indicates that polymer concentra-
tion, introduced into the CC theory from first principles,
properly takes this effect into account, as has already been
verified for other polyelectrolytes.[17] In this case, the
decrease of both pK10 and pK2
0 was probably slightly larger
than that expected from the contribution of the ionic
strength only. Therefore it is possible that such a difference
Macromol. Chem. Phys. 2006, 207, 2299–2310 www.mcp-journal.de
(albeit small) is diagnostic of a small effect of counterion
specificity. In the previously quoted work,[19] the model
provided a very good description of the potentiometric
titration obtained using either NaOH or KOH as the titrant
(base) without the introduction of any parameter to account
for possible specific interactions between the polyions and
the counterions in the range of polymer and salt concen-
trations of the present work. It has to be noted that the
occurrence of specific interactions between MA copoly-
mers and divalent cations – and even monovalent cations
such as Naþ and Kþ – was shown in a previous paper.[5a] In
that case, however, the experimental conditions were far
from the present ones: those measurements were carried
out at very high salt – and hence counterion – concen-
tration, that is, up to 1 N.
The dependence of pK i0and of DpK0 on the number of
side methyl groups is also reported in Table 1. An almost
linear dependence on the number of side methyl groups
is argued both for the first and for the second pK0: the
former one decreases whereas the latter one increases. This
dependence on the chemical nature of the olefin como-
nomer, already discussed in the first papers concerning MA
copolymers,[1,2] is attributed to an increase of the H-bond
character of the monoprotonated form (HA�) upon first
dissociation (i.e., H2A !HA�þHþ) parallel to increasing
substitution.[4] This event comparatively reduces the free
energy of the HA� form, eventually producing a decrease
of pK10 . Interestingly, the corresponding, expected, increase
of pK20 is not exactly parallel: the ratio of the (absolute)
change of pK0 per unit change of side methyl group is about
2.5:1 for the second dissociation (i.e., HA� ! A2�þHþ)
versus the first one. This corresponds to an inversion of the
relative thermodynamic stability of the A2� units. Ionic
strength produces a slight tendency towards an increase
of the difference between the values of pK0 of the first and
� 2006 WILEY-VCH Verlag GmbH & Co. KGaA, Weinheim
Potentiometric Titrations of Maleic Acid Copolymers in Dilute Aqueous Solution: . . . 2307
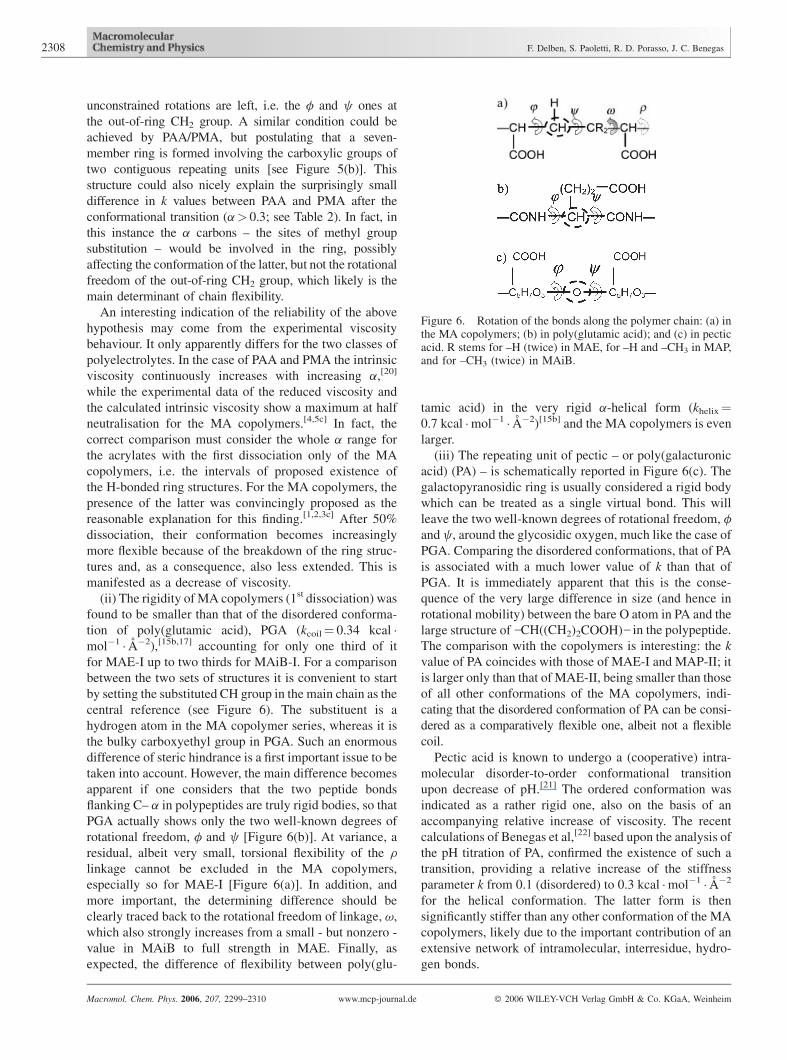
Figure 5. Rotation of the bonds along the polymer chain at halfneutralisation: (a) in MA copolymers and (b) in polyacrylic(R¼ –H) and polymethacrylic (R¼ –CH3) acids. In (a) the tworesidues –R denote two –H, –H and –CH3, and two –CH3 in MAE,MAP, and MAiB, respectively.
the second dissociating groups ðDpK0 pK20 � pK1
0Þ, a
characteristic already noted when analysing the potentio-
metric titration data of humic acids,[15e] which are also
multifunctional natural polymers.
As for the k1 and k2 parameters, it can be concluded that
the semiflexible characteristics of the MA copolymers
persist in the whole range of polymer and salt concentra-
tions explored in the present study (see Table 2). However,
the k2 values are smaller than the corresponding k1 values
for all three copolymers (see Table 2). The straightforward
explanation is that the higher rigidity of k1 stems from the
intramolecular H-bond which characterises the first
dissociation with respect to the second one, as postulated
on the basis of the above pKa results. This hypothesis also
accounts for the observation that an increasing number of
side methyl groups increases both k1 and k2 (see Table 2),
but with a significantly larger effect on k1. In practice, the
absolute value of Dk (i.e., k2� k1) increases from MAE to
MAiB, much like DpK0, pointing to the nicely converging,
albeit independent, information provided by the two sets of
different parameters.
It should be recalled that the comparison of calorimetric
experiments with theories[3l] already led to the conclusion
that the chemical nature of the comonomers influenced the
rigidity of the chain. In particular, the observed behaviour
was found to be compatible with a linear (wormlike) chain
model and with rigidity varying according to composition
in the order MAP<MAiB, i.e. proportional to the amount
of hindering methyl groups. It was proposed that in the case
of MAE the chain flexibility may lead to very flexible
coiled conformations, due to the lack of large substituents
on the olefinic part. This could explain the small discre-
pancy between the calculated curve and the experi-
mental pKa values at low a for this copolymer (see
Figure 2).
Finally, the stiffness parameters here derived were
compared with the results of previous studies, performed
on both synthetic and natural polyelectrolytes under
similar experimental conditions (see Table 2). In spite of
the uncertainty in the calculated values of the k parameters,
which averaged �0.05 in all cases, this comparison can
help by providing some indications to properly place the
copolymers of this family in the correct order of relative
flexibility, on the basis of the chemical structure of the
corresponding polyelectrolyte. The main findings are as
follows.
(i) The MA copolymers share the value of the average
structural charge density with the monoprotic polyelec-
trolytes PAA and poly(methacrylic acid) (PMA) that were
recently studied by Benegas et al[15c] and by Porasso
et al.,[15d] respectively. In particular, PAA and PMA are
structural isomers of MAE and MAiB, respectively. Be-
cause of this, at a first glance one could expect that the
two poly(monoprotic) acids and the corresponding two
poly(diprotic) acids have similar flexibility in aqueous
Macromol. Chem. Phys. 2006, 207, 2299–2310 www.mcp-journal.de
solution, mainly because of the same number (four) of
single bonds in the corresponding dicarboxylic repeating
unit (see Figure 5). In fact, it is well known that the number
of single bonds in a polymer repeating unit, with the
associated rotational freedom, ranks first among the factors
influencing chain flexibility. The detailed dependence of
the conformational energy on linkage rotation, albeit
important, is certainly less so. Possibly, in this respect, just
a slight difference could be expected in the present
comparison to stem from the nonexact conformational
correspondence of the linkage sequence f2, c2 in PAA and
PMA with the sequence v, r in the MA copolymers.
Inspection of Table 2 shows that only the stiffness
parameter of MAiB in the low ionisation regime (k1) is
similar to those reported for PAA and for PMA after
transition (a> 0.3),[15d] all the others being from slightly to
significantly lower. This observation, taken together with
the already assessed presence of an intramolecular H-bond in
the structures H2A and HA� involved in the first dissociation
of MAiB (conventionally called here ‘MAiB-I’, whereas
MAE-I, MAP-I, MAE-II, MAP-II, and MAiB-II in the
following text stand for the first dissociation of MAE and
MAP and for the second dissociation of MAE, MAP and
MAiB, respectively), leads to the postulation of a rather
different structural (and/or conformational) view of both the
MA copolymers and the acrylic polymers, schematically
depicted in Figure 5(a) and 5(b), respectively. In MAiB-I the
rotational freedom of linkage, r, is very likely close to zero,
because of the H-bond which enables the formation of a
six-member ring involving the two carboxylic groups (the
hydrogen atom is ignored, as usual). This structure, coupled
with the presence of two methyl groups on the neighbouring
C atom, is similarly expected to dramatically reduce the
rotational freedom of linkage, v. In practice, only two rather
� 2006 WILEY-VCH Verlag GmbH & Co. KGaA, Weinheim
2308 F. Delben, S. Paoletti, R. D. Porasso, J. C. Benegas
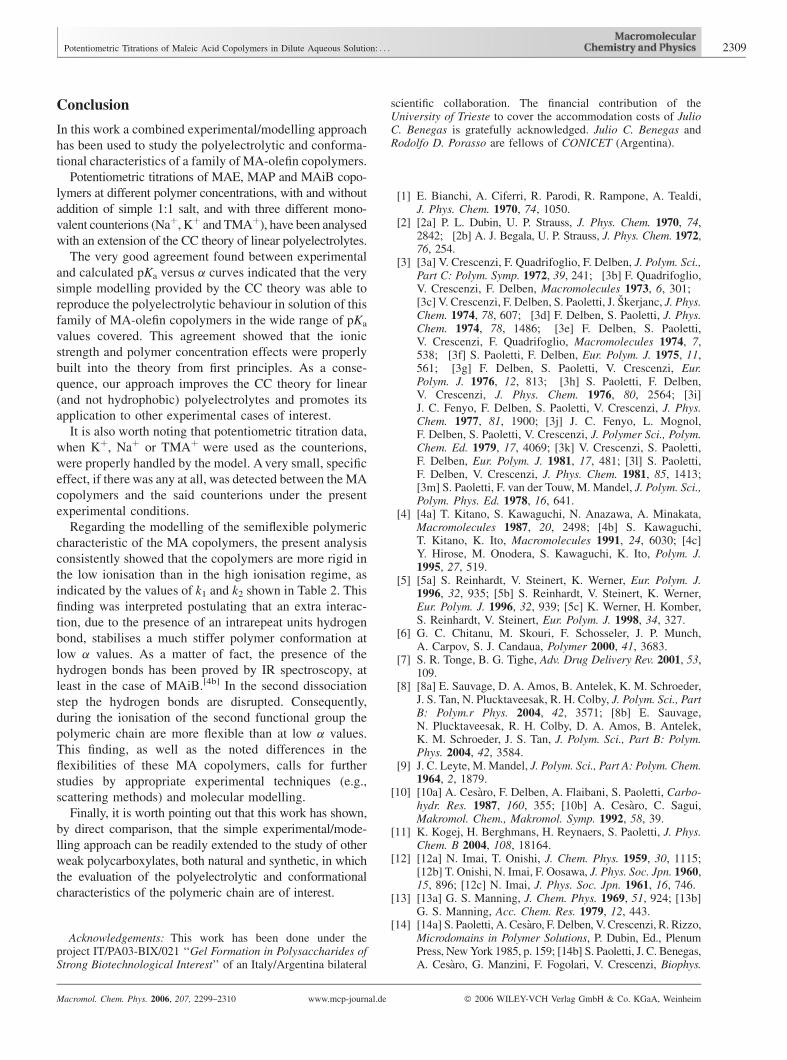
Figure 6. Rotation of the bonds along the polymer chain: (a) inthe MA copolymers; (b) in poly(glutamic acid); and (c) in pecticacid. R stems for –H (twice) in MAE, for –H and –CH3 in MAP,and for –CH3 (twice) in MAiB.
unconstrained rotations are left, i.e. the f and c ones at
the out-of-ring CH2 group. A similar condition could be
achieved by PAA/PMA, but postulating that a seven-
member ring is formed involving the carboxylic groups of
two contiguous repeating units [see Figure 5(b)]. This
structure could also nicely explain the surprisingly small
difference in k values between PAA and PMA after the
conformational transition (a> 0.3; see Table 2). In fact, in
this instance the a carbons – the sites of methyl group
substitution – would be involved in the ring, possibly
affecting the conformation of the latter, but not the rotational
freedom of the out-of-ring CH2 group, which likely is the
main determinant of chain flexibility.
An interesting indication of the reliability of the above
hypothesis may come from the experimental viscosity
behaviour. It only apparently differs for the two classes of
polyelectrolytes. In the case of PAA and PMA the intrinsic
viscosity continuously increases with increasing a,[20]
while the experimental data of the reduced viscosity and
the calculated intrinsic viscosity show a maximum at half
neutralisation for the MA copolymers.[4,5c] In fact, the
correct comparison must consider the whole a range for
the acrylates with the first dissociation only of the MA
copolymers, i.e. the intervals of proposed existence of
the H-bonded ring structures. For the MA copolymers, the
presence of the latter was convincingly proposed as the
reasonable explanation for this finding.[1,2,3c] After 50%
dissociation, their conformation becomes increasingly
more flexible because of the breakdown of the ring struc-
tures and, as a consequence, also less extended. This is
manifested as a decrease of viscosity.
(ii) The rigidity of MA copolymers (1st dissociation) was
found to be smaller than that of the disordered conforma-
tion of poly(glutamic acid), PGA (kcoil¼ 0.34 kcal �mol�1 � A�2),[15b,17] accounting for only one third of it
for MAE-I up to two thirds for MAiB-I. For a comparison
between the two sets of structures it is convenient to start
by setting the substituted CH group in the main chain as the
central reference (see Figure 6). The substituent is a
hydrogen atom in the MA copolymer series, whereas it is
the bulky carboxyethyl group in PGA. Such an enormous
difference of steric hindrance is a first important issue to be
taken into account. However, the main difference becomes
apparent if one considers that the two peptide bonds
flanking C– a in polypeptides are truly rigid bodies, so that
PGA actually shows only the two well-known degrees of
rotational freedom, f and c [Figure 6(b)]. At variance, a
residual, albeit very small, torsional flexibility of the rlinkage cannot be excluded in the MA copolymers,
especially so for MAE-I [Figure 6(a)]. In addition, and
more important, the determining difference should be
clearly traced back to the rotational freedom of linkage, v,
which also strongly increases from a small - but nonzero -
value in MAiB to full strength in MAE. Finally, as
expected, the difference of flexibility between poly(glu-
Macromol. Chem. Phys. 2006, 207, 2299–2310 www.mcp-journal.de
tamic acid) in the very rigid a-helical form (khelix¼0.7 kcal �mol�1 � A�2)[15b] and the MA copolymers is even
larger.
(iii) The repeating unit of pectic – or poly(galacturonic
acid) (PA) – is schematically reported in Figure 6(c). The
galactopyranosidic ring is usually considered a rigid body
which can be treated as a single virtual bond. This will
leave the two well-known degrees of rotational freedom, f
and c, around the glycosidic oxygen, much like the case of
PGA. Comparing the disordered conformations, that of PA
is associated with a much lower value of k than that of
PGA. It is immediately apparent that this is the conse-
quence of the very large difference in size (and hence in
rotational mobility) between the bare O atom in PA and the
large structure of –CH((CH2)2COOH)– in the polypeptide.
The comparison with the copolymers is interesting: the k
value of PA coincides with those of MAE-I and MAP-II; it
is larger only than that of MAE-II, being smaller than those
of all other conformations of the MA copolymers, indi-
cating that the disordered conformation of PA can be consi-
dered as a comparatively flexible one, albeit not a flexible
coil.
Pectic acid is known to undergo a (cooperative) intra-
molecular disorder-to-order conformational transition
upon decrease of pH.[21] The ordered conformation was
indicated as a rather rigid one, also on the basis of an
accompanying relative increase of viscosity. The recent
calculations of Benegas et al,[22] based upon the analysis of
the pH titration of PA, confirmed the existence of such a
transition, providing a relative increase of the stiffness
parameter k from 0.1 (disordered) to 0.3 kcal �mol�1 � A�2
for the helical conformation. The latter form is then
significantly stiffer than any other conformation of the MA
copolymers, likely due to the important contribution of an
extensive network of intramolecular, interresidue, hydro-
gen bonds.
� 2006 WILEY-VCH Verlag GmbH & Co. KGaA, Weinheim
Potentiometric Titrations of Maleic Acid Copolymers in Dilute Aqueous Solution: . . . 2309
Conclusion
In this work a combined experimental/modelling approach
has been used to study the polyelectrolytic and conforma-
tional characteristics of a family of MA-olefin copolymers.
Potentiometric titrations of MAE, MAP and MAiB copo-
lymers at different polymer concentrations, with and without
addition of simple 1:1 salt, and with three different mono-
valent counterions (Naþ, Kþ and TMAþ), have been analysed
with an extension of the CC theory of linear polyelectrolytes.
The very good agreement found between experimental
and calculated pKa versus a curves indicated that the very
simple modelling provided by the CC theory was able to
reproduce the polyelectrolytic behaviour in solution of this
family of MA-olefin copolymers in the wide range of pKa
values covered. This agreement showed that the ionic
strength and polymer concentration effects were properly
built into the theory from first principles. As a conse-
quence, our approach improves the CC theory for linear
(and not hydrophobic) polyelectrolytes and promotes its
application to other experimental cases of interest.
It is also worth noting that potentiometric titration data,
when Kþ, Naþ or TMAþ were used as the counterions,
were properly handled by the model. A very small, specific
effect, if there was any at all, was detected between the MA
copolymers and the said counterions under the present
experimental conditions.
Regarding the modelling of the semiflexible polymeric
characteristic of the MA copolymers, the present analysis
consistently showed that the copolymers are more rigid in
the low ionisation than in the high ionisation regime, as
indicated by the values of k1 and k2 shown in Table 2. This
finding was interpreted postulating that an extra interac-
tion, due to the presence of an intrarepeat units hydrogen
bond, stabilises a much stiffer polymer conformation at
low a values. As a matter of fact, the presence of the
hydrogen bonds has been proved by IR spectroscopy, at
least in the case of MAiB.[4b] In the second dissociation
step the hydrogen bonds are disrupted. Consequently,
during the ionisation of the second functional group the
polymeric chain are more flexible than at low a values.
This finding, as well as the noted differences in the
flexibilities of these MA copolymers, calls for further
studies by appropriate experimental techniques (e.g.,
scattering methods) and molecular modelling.
Finally, it is worth pointing out that this work has shown,
by direct comparison, that the simple experimental/mode-
lling approach can be readily extended to the study of other
weak polycarboxylates, both natural and synthetic, in which
the evaluation of the polyelectrolytic and conformational
characteristics of the polymeric chain are of interest.
Acknowledgements: This work has been done under theproject IT/PA03-BIX/021 ‘‘Gel Formation in Polysaccharides ofStrong Biotechnological Interest’’ of an Italy/Argentina bilateral
Macromol. Chem. Phys. 2006, 207, 2299–2310 www.mcp-journal.de
scientific collaboration. The financial contribution of theUniversity of Trieste to cover the accommodation costs of JulioC. Benegas is gratefully acknowledged. Julio C. Benegas andRodolfo D. Porasso are fellows of CONICET (Argentina).
[1] E. Bianchi, A. Ciferri, R. Parodi, R. Rampone, A. Tealdi,J. Phys. Chem. 1970, 74, 1050.
[2] [2a] P. L. Dubin, U. P. Strauss, J. Phys. Chem. 1970, 74,2842; [2b] A. J. Begala, U. P. Strauss, J. Phys. Chem. 1972,76, 254.
[3] [3a] V. Crescenzi, F. Quadrifoglio, F. Delben, J. Polym. Sci.,Part C: Polym. Symp. 1972, 39, 241; [3b] F. Quadrifoglio,V. Crescenzi, F. Delben, Macromolecules 1973, 6, 301;[3c] V. Crescenzi, F. Delben, S. Paoletti, J. Skerjanc, J. Phys.Chem. 1974, 78, 607; [3d] F. Delben, S. Paoletti, J. Phys.Chem. 1974, 78, 1486; [3e] F. Delben, S. Paoletti,V. Crescenzi, F. Quadrifoglio, Macromolecules 1974, 7,538; [3f] S. Paoletti, F. Delben, Eur. Polym. J. 1975, 11,561; [3g] F. Delben, S. Paoletti, V. Crescenzi, Eur.Polym. J. 1976, 12, 813; [3h] S. Paoletti, F. Delben,V. Crescenzi, J. Phys. Chem. 1976, 80, 2564; [3i]J. C. Fenyo, F. Delben, S. Paoletti, V. Crescenzi, J. Phys.Chem. 1977, 81, 1900; [3j] J. C. Fenyo, L. Mognol,F. Delben, S. Paoletti, V. Crescenzi, J. Polymer Sci., Polym.Chem. Ed. 1979, 17, 4069; [3k] V. Crescenzi, S. Paoletti,F. Delben, Eur. Polym. J. 1981, 17, 481; [3l] S. Paoletti,F. Delben, V. Crescenzi, J. Phys. Chem. 1981, 85, 1413;[3m] S. Paoletti, F. van der Touw, M. Mandel, J. Polym. Sci.,Polym. Phys. Ed. 1978, 16, 641.
[4] [4a] T. Kitano, S. Kawaguchi, N. Anazawa, A. Minakata,Macromolecules 1987, 20, 2498; [4b] S. Kawaguchi,T. Kitano, K. Ito, Macromolecules 1991, 24, 6030; [4c]Y. Hirose, M. Onodera, S. Kawaguchi, K. Ito, Polym. J.1995, 27, 519.
[5] [5a] S. Reinhardt, V. Steinert, K. Werner, Eur. Polym. J.1996, 32, 935; [5b] S. Reinhardt, V. Steinert, K. Werner,Eur. Polym. J. 1996, 32, 939; [5c] K. Werner, H. Komber,S. Reinhardt, V. Steinert, Eur. Polym. J. 1998, 34, 327.
[6] G. C. Chitanu, M. Skouri, F. Schosseler, J. P. Munch,A. Carpov, S. J. Candaua, Polymer 2000, 41, 3683.
[7] S. R. Tonge, B. G. Tighe, Adv. Drug Delivery Rev. 2001, 53,109.
[8] [8a] E. Sauvage, D. A. Amos, B. Antelek, K. M. Schroeder,J. S. Tan, N. Plucktaveesak, R. H. Colby, J. Polym. Sci., PartB: Polym.r Phys. 2004, 42, 3571; [8b] E. Sauvage,N. Plucktaveesak, R. H. Colby, D. A. Amos, B. Antelek,K. M. Schroeder, J. S. Tan, J. Polym. Sci., Part B: Polym.Phys. 2004, 42, 3584.
[9] J. C. Leyte, M. Mandel, J. Polym. Sci., Part A: Polym. Chem.1964, 2, 1879.
[10] [10a] A. Cesaro, F. Delben, A. Flaibani, S. Paoletti, Carbo-hydr. Res. 1987, 160, 355; [10b] A. Cesaro, C. Sagui,Makromol. Chem., Makromol. Symp. 1992, 58, 39.
[11] K. Kogej, H. Berghmans, H. Reynaers, S. Paoletti, J. Phys.Chem. B 2004, 108, 18164.
[12] [12a] N. Imai, T. Onishi, J. Chem. Phys. 1959, 30, 1115;[12b] T. Onishi, N. Imai, F. Oosawa, J. Phys. Soc. Jpn. 1960,15, 896; [12c] N. Imai, J. Phys. Soc. Jpn. 1961, 16, 746.
[13] [13a] G. S. Manning, J. Chem. Phys. 1969, 51, 924; [13b]G. S. Manning, Acc. Chem. Res. 1979, 12, 443.
[14] [14a] S. Paoletti, A. Cesaro, F. Delben, V. Crescenzi, R. Rizzo,Microdomains in Polymer Solutions, P. Dubin, Ed., PlenumPress, New York 1985, p. 159; [14b] S. Paoletti, J. C. Benegas,A. Cesaro, G. Manzini, F. Fogolari, V. Crescenzi, Biophys.
� 2006 WILEY-VCH Verlag GmbH & Co. KGaA, Weinheim
2310 F. Delben, S. Paoletti, R. D. Porasso, J. C. Benegas
Chem. 1991, 41, 73; [14c] R. D. Porasso, J. C. Benegas, M. A.G. T. van den Hoop, S. Paoletti, Phys. Chem. Chem. Phys.2001, 3, 1057; [14d] S. Paoletti, R. Gilli, L. Navarini,V. Crescenzi, Glycoconjugate J. 1997, 14, 513.
[15] [15a] A. Cesaro, S. Paoletti, R. Urbani, J. Benegas, Int. J.Biol. Macromol. 1989, 11, 65; [15b] A. Cesaro, S. Paoletti,S. P. Guidugli, J. C. Benegas, Biophys. Chem. 1991, 39, 9;[15c] J. C. Benegas, R. F. M. J. Cleven, M. A. G. T. van denHoop, Anal. Chim. Acta 1998, 369, 109; [15d]R. D. Porasso, J. C. Benegas, M. A. G. T. van den Hoop,J. Phys. Chem. B. 1999, 103, 2361; [15e] R. Porasso, M. vanden Hoop, J. Benegas, S. Paoletti, Biophys. Chem. 2000, 85,59; [15f] S. Paoletti, A. Cesaro, C. Arce Samper, J. C.Benegas, Biophys. Chem. 1989, 34, 301.
Macromol. Chem. Phys. 2006, 207, 2299–2310 www.mcp-journal.de
[16] G. S. Manning, Q. Rev. Biophys 1978, 11, 179.[17] A. Cesaro, S. Paoletti, J. C. Benegas, Biophys. Chem. 1991,
39, 1.[18] R. W. Amstrong, U. P. Strauss, Encycl. Polym. Sci. Technol.
1964–1972, 10, 806.[19] A. Cesaro, J. C. Benegas, Makromol. Chem., Rapid Com-
mun. 1989, 10, 547.[20] G. Barone, V. Crescenzi, F. Quadrifoglio, V. Vitagliano, Ric.
Sci. 1966, 36, 447.[21] A. Cesaro, A. Ciana, F. Delben, G. Manzini, S. Paoletti,
Biopolymers 1982, 21, 431.[22] J. C. Benegas, S. P. Guidugli, A. Cesaro, S. Paoletti, Ann.
Argentine Phys. Soc. 1990, 1, 348.
� 2006 WILEY-VCH Verlag GmbH & Co. KGaA, Weinheim

![Potentiometric Study Of Metal Complexes Of Some Imidazole Contained Ligandsc Part II: The Determination Of Dissociation Constant Of 2-[4,5-Bis(4-Methylphenyl)-1H- Imidazol-2-Yl] Phenol](https://static.fdokumen.com/doc/165x107/631abaf8d43f4e176304945d/potentiometric-study-of-metal-complexes-of-some-imidazole-contained-ligandsc-part.jpg)