
An investigation of Cu(II) adsorption by raw and acid-activated bentonite: A combined...
10
Available online at www.sciencedirect.com Journal of Hazardous Materials 151 (2008) 682–691 An investigation of Cu(II) adsorption by raw and acid-activated bentonite: A combined potentiometric, thermodynamic, XRD, IR, DTA study E. Eren ∗ , B. Afsin Department of Chemistry, Faculty of Arts and Sciences, Ondokuz Mayis University, 55139 Kurupelit-Samsun, Turkey Received 13 April 2007; received in revised form 12 June 2007; accepted 12 June 2007 Available online 16 June 2007 Abstract Adsorption of Cu(II) by raw bentonite (RB) and acid-activated bentonite (AAB) samples was investigated as a function of the initial Cu(II) concentration, solution pH, ionic strenght, temperature, the competitive and complexation effects of ligands (Cl − , SO 4 2− , PO 4 3− ). Langmuir monolayer adsorption capacity of the RB (42.41 mg g −1 ) was found greater than that of the AAB (32.17 mg g −1 ). The effect of structural charges on the reactivity of the edge groups was evidenced by the particular proton adsorption behaviour of the bentonite samples. The spontaneity of the adsorption process is established by decrease in G which varied from −0.34 to −0.71 kJ mol −1 (RB), −1.13 to −1.49 kJ mol −1 (AAB) in temperature range 303–313 K. Infrared (IR) spectra of the bentonite samples showed that the positions and shapes of the fundamental vibrations of the OH and Si–O groups were influenced by the adsorbed Cu(II) cations. Differential thermal analysis (DTA) results showed that adsorbed Cu(II) cations have a great effect on the thermal behaviour of the bentonite samples. The X-ray diffraction (XRD) spectra indicated that the Cu(II) adsorption onto the bentonite samples led to changes in unit cell dimensions and symmetry of the parent bentonites. © 2007 Elsevier B.V. All rights reserved. Keywords: Clay; Adsorption; Thermodynamic; Surface charge; Heavy-metal 1. Introduction Heavy-metal pollution occurs in many industrial wastewater such as those produced by metal plating facilities, mining oper- ations, battery manufacturing process, the production of paints and pigments, and the glass production industry. Due to their accumulation through food chain and persistent in nature, it is necessary to remove toxic heavy-metals from wastewater. Intake of excessively large doses of copper by man leads to severe mucosal irritation and corrosion, widespread capillary damage, hepatic and renal damage and central nervous system irritation followed by depression. Severe gastrointestinal irritation and possible necrotic changes in the liver and kidney could occur [1]. Conventional technologies for the removal of heavy-metal such as chemical precipitation, electrolysis, ion exchange and ∗ Corresponding author. Tel.: +90 362 312 19. E-mail address: [email protected] (E. Eren). reverse osmosis are often neither effective nor economical. Among the physico-chemical treatment process adsorption is higly effective, cheap and easy to adapt [2]. Adsorption has been proven to be a successful method for removal of heavy metals from wastewater. Activated carbon is higly effective in adsorbing heavy metals from wastewater but high cost limits its use. The abundance of clay minerals and their low cost are a strong candidate as an adsorbent for removal of heavy-metal from wastewater. Because of their high specific surface area and exchange capacity, clay minerals also play a significant role in determining the availability and transport of metal species in soils and waters. Bentonite is a natural clay mineral that is found in many places of the world. Any clay of volcanic origin that contains montmorillonite is referred to as bentonite. It belongs to the 2:1 clay family, the basic structural unit of which is composed of two tetrahedrally coordinated sheets of silicon ions surrounding a sandwiched octahedrally coordinated sheet of aluminum ions. The isomorphous substitution of Al 3+ for Si 4+ in the tetrahe- dral layer and Mg 2+ or Zn 2+ for Al 3+ in the octahedral layer 0304-3894/$ – see front matter © 2007 Elsevier B.V. All rights reserved. doi:10.1016/j.jhazmat.2007.06.040
Transcript of An investigation of Cu(II) adsorption by raw and acid-activated bentonite: A combined...
A
cmottoCa©
K
1
saaanomhfp[
s
0d
Available online at www.sciencedirect.com
Journal of Hazardous Materials 151 (2008) 682–691
An investigation of Cu(II) adsorption by raw and acid-activatedbentonite: A combined potentiometric, thermodynamic,
XRD, IR, DTA study
E. Eren ∗, B. AfsinDepartment of Chemistry, Faculty of Arts and Sciences, Ondokuz Mayis University, 55139 Kurupelit-Samsun, Turkey
Received 13 April 2007; received in revised form 12 June 2007; accepted 12 June 2007Available online 16 June 2007
bstract
Adsorption of Cu(II) by raw bentonite (RB) and acid-activated bentonite (AAB) samples was investigated as a function of the initial Cu(II)oncentration, solution pH, ionic strenght, temperature, the competitive and complexation effects of ligands (Cl−, SO4
2−, PO43−). Langmuir
onolayer adsorption capacity of the RB (42.41 mg g−1) was found greater than that of the AAB (32.17 mg g−1). The effect of structural chargesn the reactivity of the edge groups was evidenced by the particular proton adsorption behaviour of the bentonite samples. The spontaneity ofhe adsorption process is established by decrease in �G which varied from −0.34 to −0.71 kJ mol−1 (RB), −1.13 to −1.49 kJ mol−1 (AAB) inemperature range 303–313 K. Infrared (IR) spectra of the bentonite samples showed that the positions and shapes of the fundamental vibrations
f the OH and Si–O groups were influenced by the adsorbed Cu(II) cations. Differential thermal analysis (DTA) results showed that adsorbedu(II) cations have a great effect on the thermal behaviour of the bentonite samples. The X-ray diffraction (XRD) spectra indicated that the Cu(II)dsorption onto the bentonite samples led to changes in unit cell dimensions and symmetry of the parent bentonites.2007 Elsevier B.V. All rights reserved.
rAhbmaiafeds
eywords: Clay; Adsorption; Thermodynamic; Surface charge; Heavy-metal
. Introduction
Heavy-metal pollution occurs in many industrial wastewateruch as those produced by metal plating facilities, mining oper-tions, battery manufacturing process, the production of paintsnd pigments, and the glass production industry. Due to theirccumulation through food chain and persistent in nature, it isecessary to remove toxic heavy-metals from wastewater. Intakef excessively large doses of copper by man leads to severeucosal irritation and corrosion, widespread capillary damage,
epatic and renal damage and central nervous system irritationollowed by depression. Severe gastrointestinal irritation andossible necrotic changes in the liver and kidney could occur
1].Conventional technologies for the removal of heavy-metaluch as chemical precipitation, electrolysis, ion exchange and
∗ Corresponding author. Tel.: +90 362 312 19.E-mail address: [email protected] (E. Eren).
pmctaTd
304-3894/$ – see front matter © 2007 Elsevier B.V. All rights reserved.oi:10.1016/j.jhazmat.2007.06.040
everse osmosis are often neither effective nor economical.mong the physico-chemical treatment process adsorption isigly effective, cheap and easy to adapt [2]. Adsorption haseen proven to be a successful method for removal of heavyetals from wastewater. Activated carbon is higly effective in
dsorbing heavy metals from wastewater but high cost limitsts use. The abundance of clay minerals and their low cost arestrong candidate as an adsorbent for removal of heavy-metal
rom wastewater. Because of their high specific surface area andxchange capacity, clay minerals also play a significant role inetermining the availability and transport of metal species inoils and waters.
Bentonite is a natural clay mineral that is found in manylaces of the world. Any clay of volcanic origin that containsontmorillonite is referred to as bentonite. It belongs to the 2:1
lay family, the basic structural unit of which is composed of
wo tetrahedrally coordinated sheets of silicon ions surroundingsandwiched octahedrally coordinated sheet of aluminum ions.he isomorphous substitution of Al3+ for Si4+ in the tetrahe-ral layer and Mg2+ or Zn2+ for Al3+ in the octahedral layer
ardou
rpaammsg
s[pci9ab
assagi
2
2
Ttfw
sntwg
twsfs
2
2
woCfbo
T8Saattbm1
dpa
sestfatsTH
2
ssbpeisot0ovcauapAttatoSt
E. Eren, B. Afsin / Journal of Haz
esults in a net negative surface charge on the clay [3]. Com-ared with other clay types, it has excellent sorption propertiesnd possesses sorption sites available within its interlayer spaces well as on the outer surface and edges [4]. Adsorption ofetal ions onto montmorillonite appears to involve two distinctechanism: (i) an ion exchange reaction at permanent charge
ites, and (ii) formation of complexes with the surface hydroxylroups [5,6].
IR spectroscopy has significantly contributed to the under-tanding of the structure, bonding, and reactivity of clay minerals7–13]. The examination of the IR spectra (4000–400 cm−1)rovides information on fundamental vibrational modes of theonstituent units of these materials. OH stretching and bend-ng vibrations occur in the spectral region of 3750–3500 and50–600 cm−1, respectively. Si–O and Al–O stretching modesre found in the 1200–700 cm−1 range, while Si–O and Al–Oending modes dominate the 600–400 cm−1 region.
The objective of this study is to investigate comparativedsorption characteristics for removal of Cu(II) from aqueousolution by the use of RB and AAB. The influence of pH, ionictrength, ligands (Cl−, SO4
2−, PO43−) and temperature on the
dsorption of Cu(II) by the RB and AAB samples was investi-ated to better understand the Cu(II) adsorption process and thempact of metal and ligands on this process.
. Experimental
.1. Materials
Preparation of RB: The bentonite sample (from Unye,urkey) was grounded and washed in deionized water several
imes at a 1:10 bentonite/water ratio. The mixture was stirredor 3 h and then kept standing overnight, followed by separation,ashing and drying at 60 ◦C.Preparation of AAB: The RB was treated under mechanical
tirring with 2.0 M H2SO4 solution at 90 ◦C for 4 h in a two-ecked glass flask under reflux. The mass ratio of the bentoniteo the acid solution was 1:1. After activation the solids wereashed by deionized water until SO4
2− free, dried at 60 ◦C, androunded to pass through a 78–120 �m size sieve.
Preparation of Cu(II)-saturated bentonites: 1 g of the ben-onite sample and 100 mL of Cu(NO3)2·5H2O solution (0.1 M)ere used to obtain Cu(II)-saturated RB (Cu-RB) and Cu(II)-
aturated AAB (Cu-AAB). The resulting mixtures were stirredor 7 day at pH ≈ 5, followed by seperation, washing and dryinglowly at 60 ◦C.
.2. Methods
.2.1. Characterization proceduresThe mineralogical compositions of the RB and AAB samples
ere determined from the XRD patterns of the products takenn a Rigaku 2000 automated diffractometer using Ni filtered
u K� radiation. XRD analysis of the montmorillonite was per-ormed using the three-principal lines [14]. IR spectra of theentonite samples were recorded in the region 4000–400 cm−1
n a Mattson-1000 FTIR spectrometer at 4 cm−1 resolution.
oaSt
s Materials 151 (2008) 682–691 683
hermal analysis was performed simultaneously on a Rigaku TG110 thermal analyzer combined with TAS (Thermal Analysisystem) 100 (range 25–1000 ◦C) under static air atmosphere atheating rate of 10 ◦C min−1. Calcined �-alumina was taken asreference. Surface areas were measured by nitrogen adsorp-
ion at 77 K using Quantachromosorb. Moisture and gases onhe solid surface or penetrated in the open pores were removedy heating at 120 ◦C for 2 h prior to the surface area measure-ents. The values determined for RB and AAB were 36.61 and
10.36 m2 g−1, respectively.The cation exchange capacities (CEC) of the samples were
etermined by the adsorption of Cu(II)–ethylene diamine com-lex [15]. The values of CEC for the RB and AAB were 15.87nd 8.89 mg Cu(II) g−1 bentonite, respectively.
Potentiometric titrations was made in 10−3, 10−2 and 10−1 Molutions of NaCl, 0.4 g of the bentonite sample and 50 cm−3 oflectrolyte solution were titrated in polyethylene vessels. Theuspension was mixed with a magnetic stirrer. Prior to the titra-ion the suspension was equilibrated under N2 at its natural pHor 4 h. Following equilibration, the pH value was adjusted bydding of 0.1 M HCl solution. Suspension was then titrated byhe addition of 0.1 M NaOH solution. After each addition of amall amount base, it was stable for 5 min and pH was recorded.o check reversibility, suspension was back titrated with 0.1 MCl solution [16].
.2.2. Cu(II) adsorption proceduresAll reagents used were of analytical grade. Cu(II) adsorption
tudies were followed as described by Sarkar et al. [17,18]. Aolution of 2.94 mM Cu(II) was prepared from Cu(NO3)2·5H2Oy dissolving in deionisied water. The stock was diluted to pre-are a working solution of 2.94 �M Cu(II). The backgroundlectrolyte solutions were 0.01, 0.1 and 0.5 KNO3. The exper-mental procedure involved the equilibration of 0.1 g bentoniteample in 24 mL of background electrolyte solution with 6 mLf Cu(II) working solution in 50 mL polyethylene centrifugeubes. This resulted in concentrations of 3.3 g L−1 of solid and.6 �M Cu(II). Solution pH was adjusted with 0.1 M HNO3r 0.1 M NaOH, such that the equilibrium solutions had pHalues ranging from 3.0 to 6.5. Preliminary kinetic studies indi-ated that Cu(II) adsorption was characterized by a rapid initialdsorption (within 1 h) followed by a much slower, continiousptake. A 24-h contacting period was found to be sufficient tochieve equilibrium. The separation of the liquid from the solidhase was achieved by centrifugation at 4500 rpm for 20 min.dsorbed Cu(II) was calculated from the difference between
he Cu(II) initially added to the system and that remaining inhe solution after equilibration by a Unicam 929 model flametomic absorption spectrophotometer. The dilutions induced byhe pH controls were considered while computing the amountf Cu(II) adsorbed. Cu(II) adsorption in the presence of Cl−,O4
2−, and PO43− was performed by equilibrating 0.1 g of ben-
onite in 21 mL of 0.1 M KNO3 background electrolyte, 6 mL
f Cu(II) working solution, and 3 mL of a NaCl, Na2SO4, orNa2HPO4 working solution (achieveing 0.01 M Cl−, 0.01 MO42−, or 0.01 M PO43−) in 50-mL polyethylene centrifuge
ubes. These experiments were performed in duplicate.
684 E. Eren, B. Afsin / Journal of Hazardous Materials 151 (2008) 682–691
Table 1Chemical composition of the samples
Sample SiO2 (%) Al2O3 (%) Fe2O3 (%) CaO (%) MgO (%) Na2O (%) K2O (%)
RA
3
3
3
wmaoshi
3
Oop
σ
wcocta
pt
Fs
atbbtzenpicddihta
3s
3b
tfF
B 62.70 20.10 2.16AB 67.15 17.20 1.66
. Results and discussion
.1. Adsorbent characterization
.1.1. Chemical analysisThe chemical compositions of the RB and AAB samples
as given in Table 1. The sample obtained after acid treat-ent showed a decrease in Al, Mg and Fe (octahedral cations)
nd an enrichment in SiO2 coming from the tetrahedral layerf the montmorillonite and from the impurities of insolubleilicates (quartz and mica). These results indicate that the octa-edral cations pass into the solution while silica, owing to itsnsolubility in acid solution, remains in the sample.
.1.2. Surface properties of bentonite samplesIn electrolyte solutions of NaCl, the interaction of the H+ and
H− ions with the bentonite surface was reflected in the shiftf the titration curves. The surface charge is calculated from theotentiometric titration curves according to the relationship:
H = F (Ca − Cb + [OH−] − [H+])
mS(1)
here σH is the surface charge density (C m−2), F the Faradayonstant (C mol−1), Ca and Cb the concentrations (mol dm−3)f the acid and base added to the suspension [OH−] and [H+] theoncentration of OH− and H+ measured from the pH of the solu-ion, m the mass of the bentonite sample in the solution (g dm−3),
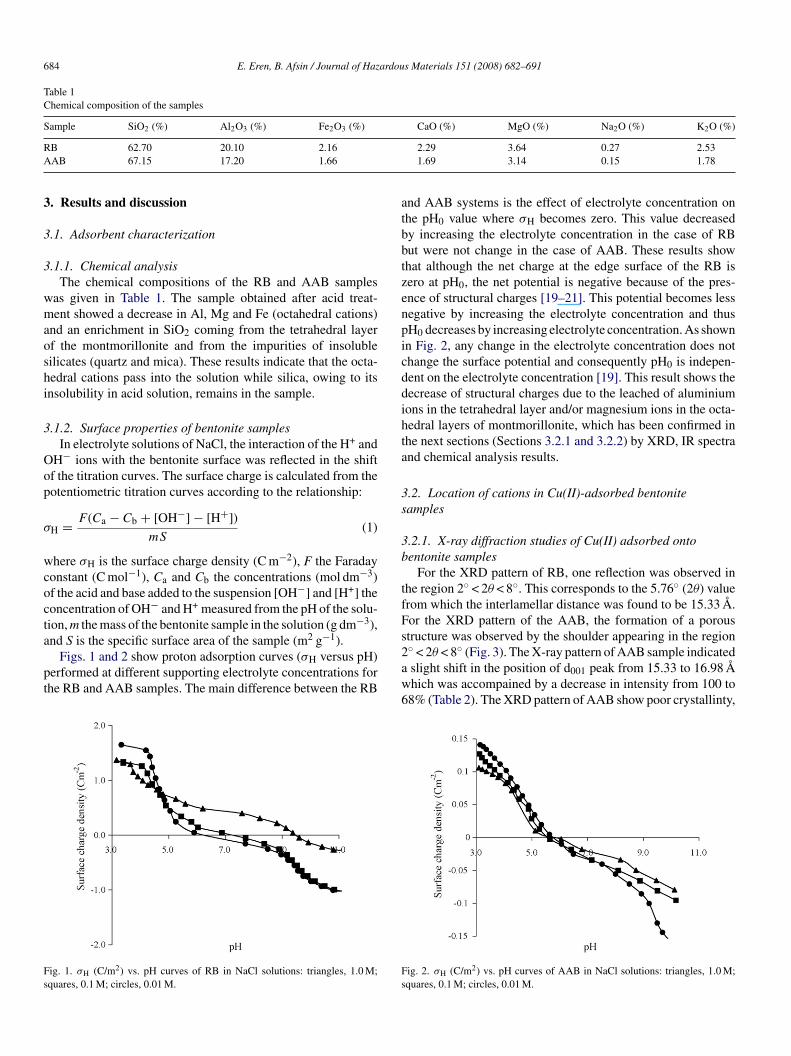
nd S is the specific surface area of the sample (m2 g−1).Figs. 1 and 2 show proton adsorption curves (σH versus pH)erformed at different supporting electrolyte concentrations forhe RB and AAB samples. The main difference between the RB
ig. 1. σH (C/m2) vs. pH curves of RB in NaCl solutions: triangles, 1.0 M;quares, 0.1 M; circles, 0.01 M.
s2aw6
Fs
2.29 3.64 0.27 2.531.69 3.14 0.15 1.78
nd AAB systems is the effect of electrolyte concentration onhe pH0 value where σH becomes zero. This value decreasedy increasing the electrolyte concentration in the case of RBut were not change in the case of AAB. These results showhat although the net charge at the edge surface of the RB isero at pH0, the net potential is negative because of the pres-nce of structural charges [19–21]. This potential becomes lessegative by increasing the electrolyte concentration and thusH0 decreases by increasing electrolyte concentration. As shownn Fig. 2, any change in the electrolyte concentration does nothange the surface potential and consequently pH0 is indepen-ent on the electrolyte concentration [19]. This result shows theecrease of structural charges due to the leached of aluminiumons in the tetrahedral layer and/or magnesium ions in the octa-edral layers of montmorillonite, which has been confirmed inhe next sections (Sections 3.2.1 and 3.2.2) by XRD, IR spectrand chemical analysis results.
.2. Location of cations in Cu(II)-adsorbed bentoniteamples
.2.1. X-ray diffraction studies of Cu(II) adsorbed ontoentonite samples
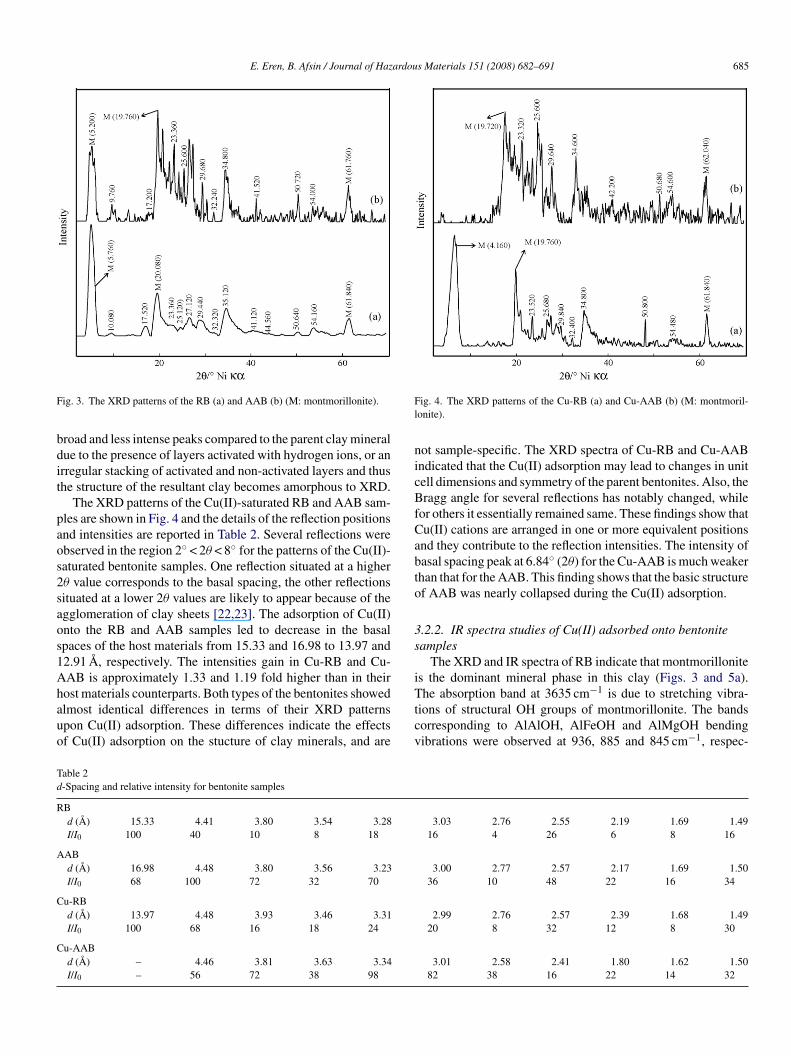
For the XRD pattern of RB, one reflection was observed inhe region 2◦ < 2θ < 8◦. This corresponds to the 5.76◦ (2θ) valuerom which the interlamellar distance was found to be 15.33 A.or the XRD pattern of the AAB, the formation of a poroustructure was observed by the shoulder appearing in the region◦ ◦
< 2θ < 8 (Fig. 3). The X-ray pattern of AAB sample indicatedslight shift in the position of d001 peak from 15.33 to 16.98 Ahich was accompained by a decrease in intensity from 100 to8% (Table 2). The XRD pattern of AAB show poor crystallinty,ig. 2. σH (C/m2) vs. pH curves of AAB in NaCl solutions: triangles, 1.0 M;quares, 0.1 M; circles, 0.01 M.
E. Eren, B. Afsin / Journal of Hazardous Materials 151 (2008) 682–691 685
F
bdit
paos2saos1Ahauo
Fl
nicBfCabto
3s
i−1
Td
R
A
C
C
ig. 3. The XRD patterns of the RB (a) and AAB (b) (M: montmorillonite).
road and less intense peaks compared to the parent clay mineralue to the presence of layers activated with hydrogen ions, or anrregular stacking of activated and non-activated layers and thushe structure of the resultant clay becomes amorphous to XRD.
The XRD patterns of the Cu(II)-saturated RB and AAB sam-les are shown in Fig. 4 and the details of the reflection positionsnd intensities are reported in Table 2. Several reflections werebserved in the region 2◦ < 2θ < 8◦ for the patterns of the Cu(II)-aturated bentonite samples. One reflection situated at a higherθ value corresponds to the basal spacing, the other reflectionsituated at a lower 2θ values are likely to appear because of thegglomeration of clay sheets [22,23]. The adsorption of Cu(II)nto the RB and AAB samples led to decrease in the basalpaces of the host materials from 15.33 and 16.98 to 13.97 and2.91 A, respectively. The intensities gain in Cu-RB and Cu-AB is approximately 1.33 and 1.19 fold higher than in their
ost materials counterparts. Both types of the bentonites showedlmost identical differences in terms of their XRD patternspon Cu(II) adsorption. These differences indicate the effectsf Cu(II) adsorption on the stucture of clay minerals, and areTtcv
able 2-Spacing and relative intensity for bentonite samples
Bd (A) 15.33 4.41 3.80 3.54 3.28I/I0 100 40 10 8 18
ABd (A) 16.98 4.48 3.80 3.56 3.23I/I0 68 100 72 32 70
u-RBd (A) 13.97 4.48 3.93 3.46 3.31I/I0 100 68 16 18 24
u-AABd (A) – 4.46 3.81 3.63 3.34I/I0 – 56 72 38 98
ig. 4. The XRD patterns of the Cu-RB (a) and Cu-AAB (b) (M: montmoril-onite).
ot sample-specific. The XRD spectra of Cu-RB and Cu-AABndicated that the Cu(II) adsorption may lead to changes in unitell dimensions and symmetry of the parent bentonites. Also, theragg angle for several reflections has notably changed, while
or others it essentially remained same. These findings show thatu(II) cations are arranged in one or more equivalent positionsnd they contribute to the reflection intensities. The intensity ofasal spacing peak at 6.84◦ (2θ) for the Cu-AAB is much weakerhan that for the AAB. This finding shows that the basic structuref AAB was nearly collapsed during the Cu(II) adsorption.
.2.2. IR spectra studies of Cu(II) adsorbed onto bentoniteamples
The XRD and IR spectra of RB indicate that montmorillonites the dominant mineral phase in this clay (Figs. 3 and 5a).
he absorption band at 3635 cm is due to stretching vibra-ions of structural OH groups of montmorillonite. The bandsorresponding to AlAlOH, AlFeOH and AlMgOH bendingibrations were observed at 936, 885 and 845 cm−1, respec-
3.03 2.76 2.55 2.19 1.69 1.4916 4 26 6 8 16
3.00 2.77 2.57 2.17 1.69 1.5036 10 48 22 16 34
2.99 2.76 2.57 2.39 1.68 1.4920 8 32 12 8 30
3.01 2.58 2.41 1.80 1.62 1.5082 38 16 22 14 32

6 ardou
tvatSbvo
cSbTt1wApo
(cota3iboI
samtiwbimtrbb
3b
5toferent water species coordinated to the interlayer cations andsurface humidity. Especially, the second endothermic peak atabout 150 ◦C represents stronger hydrogen bonding betweenwater molecules and exchangeable cations. The third endother-
86 E. Eren, B. Afsin / Journal of Haz
ively. A complex band at 1038 cm−1 is related to the stretchingibrations of Si–O groups, while the bands at 527 and 470 cm−1
re due to Al–O–Si and Si–O–Si bending vibrations, respec-ively. The band at 629 cm−1 was assigned to coupled Al–O andi–O out-of-plane vibrations. Water in montmorillonite gave aroad band at 3415 cm−1 corresponding to the H2O-stretchingibrations, with a shoulder near 3330 cm−1, due to an overtonef the bending vibration of water observed at 1651 cm−1 [11].
The changes in the Si environment after acid activation pro-ess were reflected in both the position and the shape of thei–O stretching band near 1038 cm−1. A slight shift of thisand to higher frequencies indicates alteration of the structure.he IR spectrum of the AAB (Fig. 5b) shows, in addition to
he tetrahedral Si–O band near 1063 cm−1, absorption band at114 cm−1, assigned to Si–O vibrations of amorphous silicaith a three-dimensional framework [7]. The spectrum of theAB sample, has all absorption bands characteristics of amor-hous silica (1114, 808 and 476 cm−1) confirms a high degreef structural decomposition (Fig. 5b).
Detailed analysis of IR spectra in the whole spectral region4000–400 cm−1) can be use for discern of the location of Cu(II)ations [8,10]. The structural modifications of the tetrahedral andctahedral sheets due to the adsorbed Cu(II) cations influencedhe fundamental vibrations of the Si–O and OH groups (Fig. 5cnd d). For example, the stretching OH band was shifted up to643 cm−1 and moreover, a new band appeared near 3514 cm−1
n the spectra of all Cu(II)-saturated bentonite samples. Thisand, assigned to AlMgCuOH vibration, confirms the presencef the Cu(II) ions in the former vacant octahedral sites. TheR patterns of the Cu(II)-saturated bentonite samples showed a
Fig. 5. IR spectra of the RB (a), AAB (b), Cu-RB (c), and Cu-AAB (d).F(
s Materials 151 (2008) 682–691
trong broad band of water near 3463 and 3438 cm−1 for the RBnd AAB samples, respectively, due to the overlapping asym-etric ν3 and symmetric ν1 (H–O–H) stretching vibrations and
he absorption near 1635 cm−1 related to the ν2 (H–O–H) bend-ng vibrations (Fig. 5c and d). The band of RB at 3361 cm−1
as ascribed to an overtone (2ν2) of the bending mode [24]. Theroad band near 1038 cm−1, assigned to complex Si–O stretch-ng vibrations in the tetrahedral sheet, upon saturation process
oved to 1049 cm−1 for the RB sample (Fig. 5c). The posi-ion of the Si–O bending vibration at 527 cm−1, due to Si–O–Alemained basically unchanged for the Cu(II)-saturated samples,ut some broadening and a decrease in intensity of the Si–O–Aland were observed (Fig. 5c and d).
.2.3. Thermal analysis study of the Cu(II) adsorbed ontoentonite samples
The curve related to the RB exhibited mass losses by 5.80 and.50% in temperature ranges 20–200 and 200–700 ◦C, respec-ively (Fig. 6a). The two endothermic peaks in the DTA curvef RB in the range of 20–200 ◦C denote the release of dif-
ig. 6. Thermal analysis curves of the RB (a), AAB (b), Cu-RB (c), and Cu-AABd).
ardous Materials 151 (2008) 682–691 687
mos2a(pbDdctordT6stcs
3
3
tai[
wt(tra(ctLwcpsCatewditf
Fs
ce
alf
l
wcdv
tvpbvalues for the RB and AAB are 0.42 and 0.82, respectively)for both the bentonite samples, and indicating that the adsorp-tion of Cu(II) onto bentonite samples under studied conditionsis favorable. The Freundlich adsorption capacity (Kf) was
E. Eren, B. Afsin / Journal of Haz
ic peak centered at 624 ◦C were related to the dehydroxylationf the layer silicate minerals. The curve relating to the AABample exhibited mass loss 6.85% at 20–200 ◦C and 2.43% at00–680 ◦C, which due to the thermal evolution of moisturend interlayer water, and structural OH groups, respectivelyFig. 6b). The DTA curve of Cu-RB showed two endothermiceaks about 110 and 170 ◦C, related to the water moleculesound to the interlayer cations (Fig. 6c). The examination ofTA curves for the RB and Cu-RB samples indicates that theehydroxylation of Cu-RB occurs at low temperature (612 ◦C) asompared to RB sample (624 ◦C), revealing the stronger interac-ion between OH and the Cu(II) ions, and a different compositionf the octahedral sheet after Cu(II) adsorption [25,26]. Thisesult show that the structure of the dehydroxylation productepends on the acidity of the adsorbed Cu(II) cation [27,28].he dehydroxylation peak of Cu-AAB in temperature range00–700 ◦C was not showed due to the dehydroxylation processtarted at low temperature (Fig. 6d). Because the dehydroxyla-ion process may be catalysed by protons originating from wateroordinated to the Cu(II) cation, and thus dehydroxylation couldtarted before the complete evolution of water [27,28].
.3. Adsorption of Cu(II) by bentonite samples
.3.1. Adsorption modelThe Langmuir and Freundlich isotherm models were applied
o establish the relationship between the amounts of Cu(II)dsorbed by the RB and AAB bentonite samples. The exper-mental data conformed to the linear form of Langmuir model29] expressed as the following equation:
Ce
qe= Ce
qm+ 1
KLqm(2)
here Ce is the equilibrium concentration of metal (mg L−1), qehe amount of the metal adsorbed (mg) by per unit of bentoniteg), and qm and KL are the Langmuir constant related to adsorp-ion capacity (mg g−1) and the energy of adsorption (L g−1),espectively. qm and KL constant were evaluated from slopend intercept of the linear plots of Ce/qe versus Ce, respectivelyFig. 7). It is well known that Langmuir monolayer adsorptionapacity (qm) gives the amount of Cu(II) required to occupy allhe available sites in unit mass of the bentonite samples. Theangmuir monolayer adsorption capacities for RB and AABere found as 32.17 and 42.41 mg g−1, respectively. This result
an be conclude that the adsorption of Cu(II) over these sam-les could not be modeled by only a cation exchange reaction,ince adsorbed amount of Cu(II) seem to be higher than theECs of the bentonite samples (the values of CEC for the RBnd AAB were 15.87 and 8.89 mg Cu(II) g−1 bentonite, respec-ively). Thus, the Cu(II) adsorption is occurred not only ionxchange in exchangeable cations, but also specific adsorption,hich can be described by surface complexation model which
efine a reaction between functional surface groups and Cu(II)ons [30–32]. The Langmuir equilibrium coefficient, b, relatedo the equilibrium constant of the process. The lower b valueor the AAB (0.01 L g−1) compared to the RB (0.20 L g−1) indi-Fs
ig. 7. Linear plots of Langmuir isotherms of Cu(II) adsorption on bentoniteamples: circle, RB; squares, AAB.
ate that acid activation process influenced the Cu(II) adsorptionquilibirium.
The Freundlich adsorption isotherm is applicable to thedsorption on heterogeneous clay surfaces. The adsorption equi-ibrium data was applied to the Freundlich model in logaritmicorm [33] given as follows:
og qe = log Kf + 1
nlog Ce (3)
here Kf and n are Freundlich constants related to adsorptionapacity and adsorption intensity, respectively. Kf and 1/n wereetermined from the intercept and slope of linear plot of log qeersus log Ce, respectively (Fig. 8).
The Freundlich plots have good linearity for both the ben-onite samples (r2 = 0.990 and 0.997) at 298 K (Fig. 8). Thealues of the adsorption coefficients, computed from Freundlichlots are given in the Table 3. The adsorption intensity giveny the Freundlich coefficient (1/n) is smaller than 1 (these
ig. 8. Linear plots of Freundlich isotherms of Cu(II) adsorption on bentoniteamples: circle, RB; squares, AAB.
688 E. Eren, B. Afsin / Journal of Hazardou
Table 3Adsorption isotherm constants for the adsorption of Cu(II) onto bentonite sam-ples (qm: mmol/g, KL: L/mol, Kf: mmol(1−1/n) L1/n/g)
Sample Langmuir model Freundlich model
qm KL r2 1/n Kf r2
RA
fr
3
fboabtgfbi
Ffd
ttog[ttraCabsTtpcTov
B 32.17 0.20 0.992 0.42 8.77 0.990AB 42.41 0.01 0.996 0.82 0.55 0.997
ound to be 8.77 and 0.55 for the RB and AAB samples,espectively.
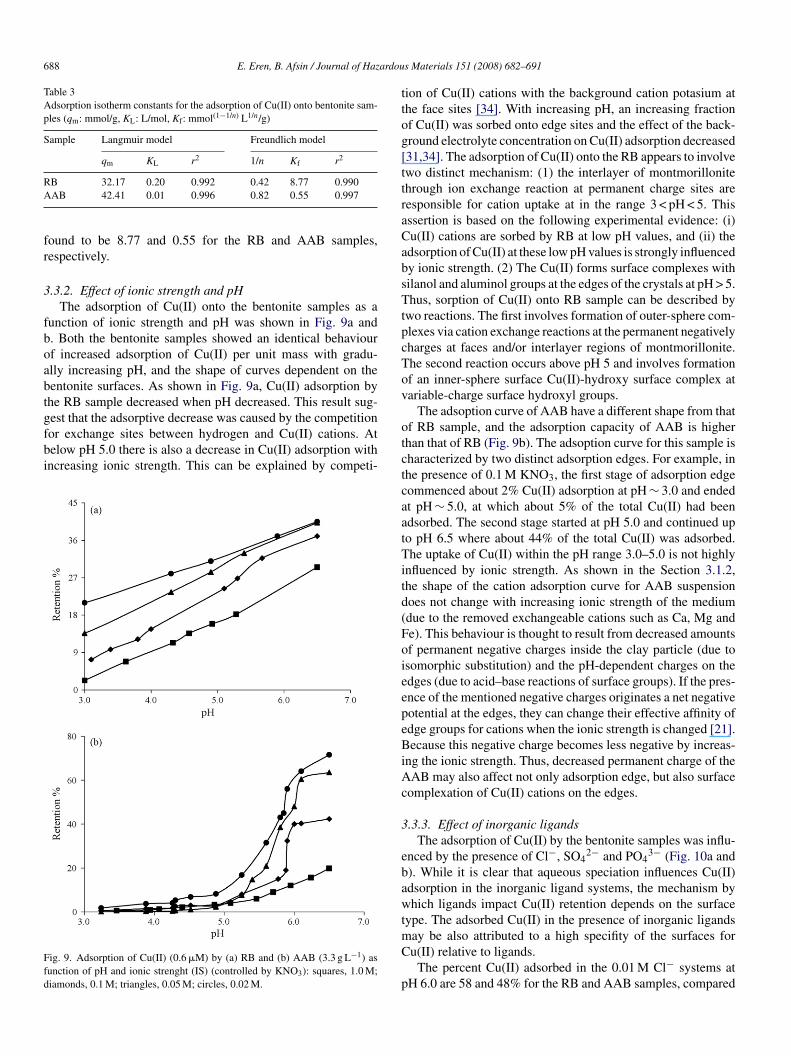
.3.2. Effect of ionic strength and pHThe adsorption of Cu(II) onto the bentonite samples as a
unction of ionic strength and pH was shown in Fig. 9a and. Both the bentonite samples showed an identical behaviourf increased adsorption of Cu(II) per unit mass with gradu-lly increasing pH, and the shape of curves dependent on theentonite surfaces. As shown in Fig. 9a, Cu(II) adsorption byhe RB sample decreased when pH decreased. This result sug-
est that the adsorptive decrease was caused by the competitionor exchange sites between hydrogen and Cu(II) cations. Atelow pH 5.0 there is also a decrease in Cu(II) adsorption withncreasing ionic strength. This can be explained by competi-ig. 9. Adsorption of Cu(II) (0.6 �M) by (a) RB and (b) AAB (3.3 g L−1) asunction of pH and ionic strenght (IS) (controlled by KNO3): squares, 1.0 M;iamonds, 0.1 M; triangles, 0.05 M; circles, 0.02 M.
otctcaatTitd(FoieepeBiAc
3
ebawtmC
p
s Materials 151 (2008) 682–691
ion of Cu(II) cations with the background cation potasium athe face sites [34]. With increasing pH, an increasing fractionf Cu(II) was sorbed onto edge sites and the effect of the back-round electrolyte concentration on Cu(II) adsorption decreased31,34]. The adsorption of Cu(II) onto the RB appears to involvewo distinct mechanism: (1) the interlayer of montmorillonitehrough ion exchange reaction at permanent charge sites areesponsible for cation uptake at in the range 3 < pH < 5. Thisssertion is based on the following experimental evidence: (i)u(II) cations are sorbed by RB at low pH values, and (ii) thedsorption of Cu(II) at these low pH values is strongly influencedy ionic strength. (2) The Cu(II) forms surface complexes withilanol and aluminol groups at the edges of the crystals at pH > 5.hus, sorption of Cu(II) onto RB sample can be described by
wo reactions. The first involves formation of outer-sphere com-lexes via cation exchange reactions at the permanent negativelyharges at faces and/or interlayer regions of montmorillonite.he second reaction occurs above pH 5 and involves formationf an inner-sphere surface Cu(II)-hydroxy surface complex atariable-charge surface hydroxyl groups.
The adsoption curve of AAB have a different shape from thatf RB sample, and the adsorption capacity of AAB is higherhan that of RB (Fig. 9b). The adsoption curve for this sample isharacterized by two distinct adsorption edges. For example, inhe presence of 0.1 M KNO3, the first stage of adsorption edgeommenced about 2% Cu(II) adsorption at pH ∼ 3.0 and endedt pH ∼ 5.0, at which about 5% of the total Cu(II) had beendsorbed. The second stage started at pH 5.0 and continued upo pH 6.5 where about 44% of the total Cu(II) was adsorbed.he uptake of Cu(II) within the pH range 3.0–5.0 is not highly
nfluenced by ionic strength. As shown in the Section 3.1.2,he shape of the cation adsorption curve for AAB suspensionoes not change with increasing ionic strength of the mediumdue to the removed exchangeable cations such as Ca, Mg ande). This behaviour is thought to result from decreased amountsf permanent negative charges inside the clay particle (due tosomorphic substitution) and the pH-dependent charges on thedges (due to acid–base reactions of surface groups). If the pres-nce of the mentioned negative charges originates a net negativeotential at the edges, they can change their effective affinity ofdge groups for cations when the ionic strength is changed [21].ecause this negative charge becomes less negative by increas-
ng the ionic strength. Thus, decreased permanent charge of theAB may also affect not only adsorption edge, but also surface
omplexation of Cu(II) cations on the edges.
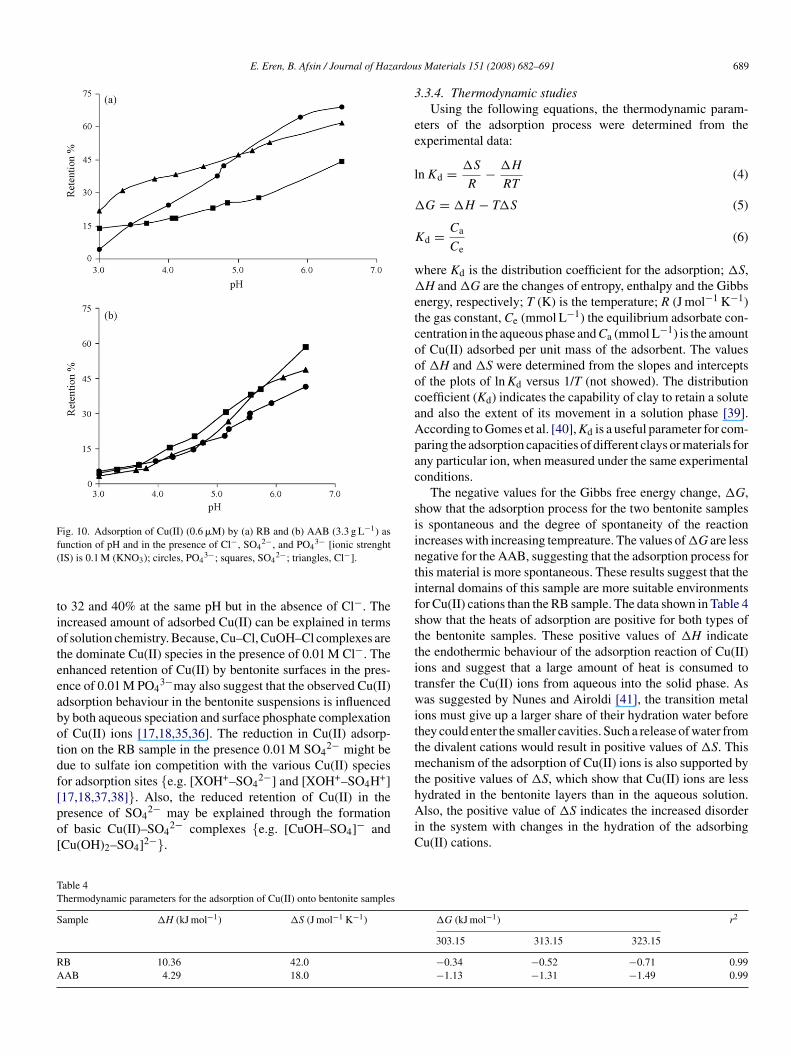
.3.3. Effect of inorganic ligandsThe adsorption of Cu(II) by the bentonite samples was influ-
nced by the presence of Cl−, SO42− and PO4
3− (Fig. 10a and). While it is clear that aqueous speciation influences Cu(II)dsorption in the inorganic ligand systems, the mechanism byhich ligands impact Cu(II) retention depends on the surface
ype. The adsorbed Cu(II) in the presence of inorganic ligands
ay be also attributed to a high specifity of the surfaces foru(II) relative to ligands.The percent Cu(II) adsorbed in the 0.01 M Cl− systems atH 6.0 are 58 and 48% for the RB and AAB samples, compared
E. Eren, B. Afsin / Journal of Hazardou
Fig. 10. Adsorption of Cu(II) (0.6 �M) by (a) RB and (b) AAB (3.3 g L−1) asf(
tioteeabotdf[po[
3
ee
l
�
K
w�
etcooocaApac
siintifsttitwittmt
TT
S
RA
unction of pH and in the presence of Cl−, SO42−, and PO4
3− [ionic strenghtIS) is 0.1 M (KNO3); circles, PO4
3−; squares, SO42−; triangles, Cl−].
o 32 and 40% at the same pH but in the absence of Cl−. Thencreased amount of adsorbed Cu(II) can be explained in termsf solution chemistry. Because, Cu–Cl, CuOH–Cl complexes arehe dominate Cu(II) species in the presence of 0.01 M Cl−. Thenhanced retention of Cu(II) by bentonite surfaces in the pres-nce of 0.01 M PO4
3−may also suggest that the observed Cu(II)dsorption behaviour in the bentonite suspensions is influencedy both aqueous speciation and surface phosphate complexationf Cu(II) ions [17,18,35,36]. The reduction in Cu(II) adsorp-ion on the RB sample in the presence 0.01 M SO4
2− might beue to sulfate ion competition with the various Cu(II) speciesor adsorption sites {e.g. [XOH+–SO4
2−] and [XOH+–SO4H+]
17,18,37,38]}. Also, the reduced retention of Cu(II) in theresence of SO42− may be explained through the formationf basic Cu(II)–SO4
2− complexes {e.g. [CuOH–SO4]− andCu(OH)2–SO4]2−}.
hAiC
able 4hermodynamic parameters for the adsorption of Cu(II) onto bentonite samples
ample �H (kJ mol−1) �S (J mol−1 K−1)
B 10.36 42.0AB 4.29 18.0
s Materials 151 (2008) 682–691 689
.3.4. Thermodynamic studiesUsing the following equations, the thermodynamic param-
ters of the adsorption process were determined from thexperimental data:
n Kd = �S
R− �H
RT(4)
G = �H − T�S (5)
d = Ca
Ce(6)
here Kd is the distribution coefficient for the adsorption; �S,H and �G are the changes of entropy, enthalpy and the Gibbs
nergy, respectively; T (K) is the temperature; R (J mol−1 K−1)he gas constant, Ce (mmol L−1) the equilibrium adsorbate con-entration in the aqueous phase and Ca (mmol L−1) is the amountf Cu(II) adsorbed per unit mass of the adsorbent. The valuesf �H and �S were determined from the slopes and interceptsf the plots of ln Kd versus 1/T (not showed). The distributionoefficient (Kd) indicates the capability of clay to retain a solutend also the extent of its movement in a solution phase [39].ccording to Gomes et al. [40], Kd is a useful parameter for com-aring the adsorption capacities of different clays or materials forny particular ion, when measured under the same experimentalonditions.
The negative values for the Gibbs free energy change, �G,how that the adsorption process for the two bentonite sampless spontaneous and the degree of spontaneity of the reactionncreases with increasing tempreature. The values of �G are lessegative for the AAB, suggesting that the adsorption process forhis material is more spontaneous. These results suggest that thenternal domains of this sample are more suitable environmentsor Cu(II) cations than the RB sample. The data shown in Table 4how that the heats of adsorption are positive for both types ofhe bentonite samples. These positive values of �H indicatehe endothermic behaviour of the adsorption reaction of Cu(II)ons and suggest that a large amount of heat is consumed toransfer the Cu(II) ions from aqueous into the solid phase. Asas suggested by Nunes and Airoldi [41], the transition metal
ons must give up a larger share of their hydration water beforehey could enter the smaller cavities. Such a release of water fromhe divalent cations would result in positive values of �S. Thisechanism of the adsorption of Cu(II) ions is also supported by
he positive values of �S, which show that Cu(II) ions are less
ydrated in the bentonite layers than in the aqueous solution.lso, the positive value of �S indicates the increased disordern the system with changes in the hydration of the adsorbingu(II) cations.
�G (kJ mol−1) r2
303.15 313.15 323.15
−0.34 −0.52 −0.71 0.99−1.13 −1.31 −1.49 0.99
6 ardou
4
ePcataattiiootctappboIisicoTsts
R
[
[
[
[
[
[
[
[
[
[
[
[
[
[
[
[
[
[
[
[
[
[
[
[
[
90 E. Eren, B. Afsin / Journal of Haz
. Conclusions
The adsorption of Cu(II) by bentonite samples was influ-nced by pH, ionic strenght, and the presence of Cl−, SO4
2−,O4
3−. The adsorption of Cu(II) by the bentonite samples is aomplex process controlled by a number of environmental vari-bles. The isotherm studies suggest that Cu(II) sorption ontohe RB sample occurs in two stages. The first stage involvesdsorption on permanent charge sites and the second involvesdsorption on variable charge sites. The adsorption capacity ofhe RB (15.87 mg Cu(II) g−1 bentonite) was much greater thanhat of the AAB (8.89 mg Cu(II) g−1 bentonite). This behaviours related to the higher cation exchange and H+ adsorption capac-ties of the RB with respect to the AAB. The endothermic naturef the proceses can be accounted for by the partial dehydrationf Cu(II) before its sorption on the bentonite samples. Generaly,he ligands enhanced Cu(II) retention, perhaps by the surfaceomplexation of Cu(II) species by specifically adsorbed ligandshat resulted in a bridging surface complex. The presence of Cl−nd PO4
3− increased Cu(II) adsorption by the RB, however, theresence of SO4
2− also decreased the Cu(II) adsorption. Theresence of Cl−, SO4
2− and PO43− increased Cu(II) adsorption
y the AAB. The findings require confirmation by direct meth-ds such as extended X-ray absorption fine structure (EXAFS).R studies showed that Cu(II) cations replaced the original metalons in the interlayer or locate into hexagonal cavities of Si–Oheet in the Cu(II)-saturated bentonite samples. Structural mod-fication of tetrahedral sheets due to the presence of Cu(II)ations either in hexagonal holes and/or in the previously vacantctahedral sites induces changes in the Si–O vibration modes.he lower dehydroxylation temperature values for the Cu(II)-aturated bentonite samples than the parent materials showedhe higher dehydroxylation rate, and the decomposed bentonitetructure.
eferences
[1] M. Ajmal, A.H. Khan, S. Ahmad, A. Ahmad, Role of sawdust in theremoval of copper(II) from industrial wastes, Water Res. 32 (1998) 3085–3091.
[2] A.K. Bhattacharya, S.N. Mandal, S.K. Das, Adsorption of Zn(II) fromaqueous solution by using different adsorbents, Chem. Eng. J. 123 (2006)43–51.
[3] P.F. Luckham, S. Rossi, The colloidal and rheological properties of ben-tonite suspensions, Adv. Colloid Interface Sci. 82 (1999) 43–92.
[4] A. Tabak, B. Afsin, S.F. Aygun, E. Koksal, Structural charactristics oforgano-modified bentonites of different origin, J. Therm. Anal. Calorim.87 (2007) 375–381.
[5] O. Abollino, M. Aceto, M. Malandrino, C. Sarzanini, E. Mentasti, Adsorp-tion of heavy metals on Na-montmorillonite, Effect of pH and organicsubstances, Water Res. 37 (2003) 1619–1627.
[6] E. Alvarez-Ayuso, A. Garcıa-Sanchez, Removal of heavy metals fromwaste waters by natural and Na-exchanged bentonites, Clays Clay Miner.51 (2003) 475–480.
[7] J. Madejova, J. Bujdak, M. Janek, P. Komadel, Comparative FT-IR study
of structural modifications during acid treatment of dioctahedral smectitesand hectorite, Spectrochim. Acta A 54 (1998) 1397–1406.[8] J. Madejova, B. Arvaiova, P. Komadel, FTIR spectroscopic characterizationof thermally treated Cu2+, Cd2+, and Li+ montmorillonites, Spectrochim.Acta A 55 (1999) 2467–2476.
[
[
s Materials 151 (2008) 682–691
[9] J. Madejova, M. Janek, P. Komadel, H.J. Herbert, H.C. Moog, FTIR analy-ses of water in MX-80 bentonite compacted from high salinary salt solutionsystems, Appl. Clay Sci. 20 (2002) 255–271.
10] J. Madejova, H. Palkova, P. Komadel, Behaviour of Li+ and Cu2+ in heatedmontmorillonite: evidence from far-, mid-, and near-IR regions, Vib. Spec-trosc. 40 (2006) 80–88.
11] J. Madejova, FTIR techniques in clay mineral studies, Vib. Spectrosc. 31(2003) 1–10.
12] W.P. Gates, P. Komadel, J. Madejova, J. Bujdak, J.W. Stucki, R.J.Kirkpatrick, Electronic and structural properties of reduced-charge mont-morillonites, Appl. Clay Sci. 16 (2000) 257–271.
13] P. Komadel, J. Madejova, J.W. Stucki, Structural Fe(III) reduction in smec-tites, Appl. Clay Sci. 34 (2006) 88–94.
14] R.W. Grimshaw, The Chemistry and Physics of Clays, Ernest Benn Ltd.,London, 1971, pp. 968–979.
15] F. Bergaya, M. Vayer, CEC of clays: measurement by adsorption of a copperethylenediamine complex, Appl. Clay Sci. 12 (1997) 275–280.
16] G. Atun, G. Hisarli, A study of surface properties of red mud by potentio-metric method, J. Colloid Interface Sci. 228 (2000) 40–45.
17] D. Sarkar, M.E. Essington, K.C. Misra, Adsorption of mercury(II) by vari-able charge surfaces of quartz and gibbsite, J. Am. Soil Sci. Soc. 63 (1999)1626–1636.
18] D. Sarkar, M.E. Essington, K.C. Misra, Adsorption of mercury(II) by kaoli-nite, J. Am. Soil Sci. Soc. 64 (2000) 1968–1975.
19] M.J. Avena, Acid–base behaviour of clay surfaces in aqueous media, Enc.Surf. Colloid Sci. (2002) 37–63.
20] M.J. Avena, C.P. De Pauli, Proton adsorption and electrokinetics of anArgentinean montmorillonite, J. Colloid Interface Sci. 202 (1998) 195–204.
21] M.J. Avena, M.M. Mariscal, C.P. De Pauli, Proton binding at clay surfacesin water, Appl. Clay Sci. 24 (2003) 3–9.
22] G. Szollosi, A. Mastalir, M. Bartok, Effect of ion exchange by an organiccation on platinum immobilization on clays, React. Kinet. Catal. Lett. 74(2001) 241–249.
23] D. Dermatas, M.S. Dadachov, Rietveld quantification of montmorillonitesin lead-contaminated soils, Appl. Clay Sci. 23 (2003) 245–255.
24] J.L. Bishop, C.M. Pieters, J.O. Edwards, Infrared spectroscopic analyseson the nature of water in montmorillonite, Clays Clay Miner. 42 (1994)702–716.
25] H.P. He, J.G. Guo, X.D. Xie, J.L. Peng, Location and migration of cationsin Cu2+-adsorbed montmorillonite, Environ. Int. 26 (2001) 347–352.
26] Z. Ding, R.L. Frost, Study of copper adsorption on montmorillonitesusing thermal analysis methods, J. Colloid Interface Sci. 269 (2004) 296–302.
27] S. Yariv, Ir evidence for migration of protons in H-montmorillonites andorgano-montmorillonites, Clays Clay Miner. 21 (1973) 199.
28] V. Balek, Z. Malek, S. Yariv, G. Matuschek, Characterization of mont-morillonite saturated with various cations, J. Therm. Anal. Cal. 56 (1999)67–76.
29] I. Langmuir, The adsorption of gases on plane surfaces of glass, mica andplatinum, J. Am. Soc. 40 (1918) 1361–1403.
30] S. Nir, G. Rytwo, U. Yermiyahu, L. Margulies, A model for cation adsorp-tion to clays and membranes, Colloid Polym. Sci. 272 (1994) 619–632.
31] A.M.L. Kraepiel, K. Keller, F.M.M. Morel, A model for metal adsorptionon montmorillonite, J. Colloid Interface Sci. 210 (1999) 43–54.
32] C.H. Weng, C.Z. Tsai, S.H. Chu, Y.C. Sharma, Adsorption characteris-tics of copper(II) onto spent activated clay, Sep. Purif. Technol. 54 (2007)187–197.
33] H. Freundlich, Uber die adsorption in losungen, Zeitschrift fur Physikalis-che Chemie (Leipzig) 57 385–470.
34] I. Heidmann, I. Christl, C. Leu, R. Kretzschmar, Competitive sorption ofprotons and metal cations onto kaolinite: experiments and modeling, J.Colloid Interface Sci. 282 (2005) 270–282.
35] S. Mustafa, A. Naeem, S. Murtaza, N. Rehana, H.Y. Samad, Comparativesorption properties of metal(III) phosphates, J. Colloid Interface Sci. 220(1999) 63–74.
36] A. Naeem, S. Mustafa, N. Rehana, B. Dilara, S. Murtaza, The sorption ofdivalent metal ions on AlPO4, J. Colloid Interface Sci. 252 (2002) 6–14.

ardou
[
[
[
[
Soil Sci. Soc. Am. 65 (2001) 1115–1121.
E. Eren, B. Afsin / Journal of Haz
37] P.J. Swedlund, J.G. Webster, Cu and Zn ternary surface complex formationwith SO4
2− on ferrihydrite and schwertmannite, Appl. Geochem. 16 (2001)503–511.
38] K.O. Adebowale, I.E. Unuabonah, B.I. Olu-Owolabi, Adsorption of someheavy metal ions on sulfate- and phosphate-modified kaolin, Appl. ClaySci. 29 (2005) 145–148.
39] M.R. Reddy, S.J. Dunn, Distribution coefficients for nickel and zinc insoils, Environ. Pollut. 11 (1986) 303–313.
[
s Materials 151 (2008) 682–691 691
40] P. Gomes, M. Fontes, A.G. Silva, E.S. Mendonca, A.R. Metto, Selectivitysequence and competitive adsorption of heavy metals by Brazilian soils,
41] L.M. Nunes, C. Airoldi, Some features of crystalline �-titaniumhydrogenphosphate, modified sodium and n-butylammonium forms andthermodynamics of ionic exchange with K+ and Ca2+, Thermochim. Acta328 (1999) 297–305.


![Potentiometric Study Of Metal Complexes Of Some Imidazole Contained Ligandsc Part II: The Determination Of Dissociation Constant Of 2-[4,5-Bis(4-Methylphenyl)-1H- Imidazol-2-Yl] Phenol](https://static.fdokumen.com/doc/165x107/631abaf8d43f4e176304945d/potentiometric-study-of-metal-complexes-of-some-imidazole-contained-ligandsc-part.jpg)


