Posterior Visual Pathway Dysfunction in Two Animal Models ...
173
UNIVERSITY OF CALIFORNIA RIVERSIDE Posterior Visual Pathway Dysfunction in Two Animal Models of Multiple Sclerosis: Understanding Pathology for Regeneration and Repair A Dissertation submitted in partial satisfaction of the requirements for the degree of Doctor of Philosophy in Bioengineering by Maria Sekyi September 2019 Dissertation Committee: Dr. Seema Tiwari-Woodruff, Chairperson Dr. B. Hyle Park Dr. Victor G. Rodgers
-
Upload
khangminh22 -
Category
Documents
-
view
2 -
download
0
Transcript of Posterior Visual Pathway Dysfunction in Two Animal Models ...

UNIVERSITY OF CALIFORNIA
RIVERSIDE
Posterior Visual Pathway Dysfunction in Two Animal Models of Multiple Sclerosis:
Understanding Pathology for Regeneration and Repair
A Dissertation submitted in partial satisfaction
of the requirements for the degree of
Doctor of Philosophy
in
Bioengineering
by
Maria Sekyi
September 2019
Dissertation Committee:
Dr. Seema Tiwari-Woodruff, Chairperson
Dr. B. Hyle Park
Dr. Victor G. Rodgers

Copyright by
Maria Sekyi
2019

The Dissertation of Maria Sekyi is approved:
Committee Chairperson
University of California, Riverside

iv
Acknowledgements
I am immensely grateful to my supervisor Dr. Tiwari-Woodruff, for her guidance
and support throughout my work and growth into a professional scientist. I am also grateful
to my labmates: Kelley Atkinson, Hawra Karim, Andrew Lapato, Hana Yamate-Morgan,
and Dr. Kelli Lauderdale as well as numerous undergraduate students for their scientific
input, and significant experimental assistance throughout my PhD. I would also like to
thank my committee members for their important insight to the research project as well as
the guidance they have given me. Special thanks also, to my friends and family who have
supported me throughout this journey.
This work was supported by the National Institutes of Health Grants NIH R01 NS081141-
01A1 to STW, and NIH R01 DK015556 to JAK, National Multiple Sclerosis Society Grant
NMSS RG 4853A3/2 and the NSF graduate research fellowship to MS under Grant No.
DGE-1326120.

v
ABSTRACT OF THE DISSERTATION
Posterior Visual Pathway Dysfunction in Two Animal Models of Multiple Sclerosis:
Understanding Pathology for Regeneration and Repair
by
Maria Sekyi
Doctor of Philosophy, Graduate Program in Bioengineering University of California, Riverside, September 2019
Dr. Seema Tiwari-Woodruff, Chairperson
Visual dysfunction is pronounced in multiple sclerosis (MS) an autoimmune,
demyelinating, neurodegenerative disease. To understand deficits in the visual pathway
during MS a broader understanding of pathology and function across the visual system is
needed. Here, afferent visual pathway pathology is first assessed in the most commonly
used animal model of MS, experimental autoimmune encephalomyelitis (EAE). A
remyelinating agent is then assessed for its therapeutic efficacy in attenuating visual
pathway dysfunction. Although treatment results in robust remyelination across the visual
pathway, severe axon damage remains and functional loss is not attenuated possibly due to
treatment timing. The time course of posterior visual pathway pathology is then assessed
in EAE in order to identify an ideal therapeutic window for remyelination, prior to
irreversible axon damage and functional loss. The therapeutic window, corresponding to a
period of significant demyelination but minimal axon damage, is found to occur after EAE
onset, but prior to peak clinical disease. Visual pathway pathology is then assayed in

vi
another animal model for MS, the cuprizone (CPZ) demyelination model, which induces
CNS demyelination absent of a peripherally mediated immune response. Similar to EAE,
visual pathway demyelination is a prominent feature of CPZ pathology, however axon
damage and severe functional deficits are not. These results reveal a significant role of
inflammatory demyelination in causing visual pathway neurodegeneration in EAE as com-
pared to minimal axon damage with CPZ demyelination, mimicking diverse pathology ob-
served in MS patients.

vii
Table of Contents
Acknowledgements ............................................................................................................ iv
Abstract of Dissertation .......................................................................................................v
Table of Contents .............................................................................................................. vii
List of Figures ......................................................................................................................x
List of Tables ................................................................................................................... xiii
CHAPTER ONE: Introduction ............................................................................................1
1.1 Visual impairment and multiple sclerosis (MS) .........................................................1
1.2 An overview of the afferent visual system .................................................................5
1.2.1 The retina .............................................................................................................7
1.2.1.1 Glial cells of the retina .................................................................................8
1.2.1.2 Retinal processing ......................................................................................11
1.2.2 The optic nerve, optic chiasm, and optic tracts .................................................13
1.2.3 The LGN and optic radiations ...........................................................................14
1.2.4 The visual cortex ...............................................................................................17
1.3 Pathologies associated with the visual system in MS ..............................................19
CHAPTER TWO: Experimental methods .........................................................................22
2.1 Animals ....................................................................................................................22
2.2 EAE induction ..........................................................................................................22
2.3 EAE clinical scoring .................................................................................................24
2.4 Optical coherence tomography (OCT) ....................................................................24

viii
2.5 Electroretinograms (ERGs) and visual evoked potentials (VEPs) ..........................25
2.6 Perfusions and tissue preparation ............................................................................27
2.7 Immunohistochemistry (IHC) .................................................................................28
2.8 Microscopy ..............................................................................................................29
2.9 Electron microscopy ................................................................................................31
2.10 Statistics ................................................................................................................31
CHAPTER THREE: Axon damage in the visual pathway interferes with remyelination
induced functional recovery in a mouse model of MS ......................................................33
3.1 Introduction ..............................................................................................................33
3.2 Methods ....................................................................................................................36
3.3 Results ......................................................................................................................38
3.4 Discussion ................................................................................................................64
CHAPTER FOUR: Posterior visual pathway pathology is a significant aspect of EAE
pathophysiology .................................................................................................................73
4.1 Introduction ..............................................................................................................73
4.2 Methods ....................................................................................................................76
4.3 Results ......................................................................................................................78
4.4 Discussion ................................................................................................................97
CHAPTER FIVE: Cuprizone (CPZ) diet results in significant demyelination of the visual
system but few functional deficits ...................................................................................106
5.1 Introduction ............................................................................................................106
5.2 Methods ..................................................................................................................108
5.3 Results ....................................................................................................................110

ix
5.4 Discussion ..............................................................................................................126
CHAPTER SIX: Conclusion and prospects .....................................................................132
6.1 Summary of major results ......................................................................................132
6.2 Future Directions ....................................................................................................134
Appendix ..........................................................................................................................138
A.1 Supplementary figures ...........................................................................................138
A.2 References .............................................................................................................139

x
List of Figures
Figure 1.1 Line diagram of human and mouse visual pathway ...........................................5
Figure 2.1 EAE induction protocol ...................................................................................23
Figure 3.1 Experimental design for assessment of IndCl therapeutic effects in visual
pathway of EAE mice .......................................................................................................37
Figure 3.2 Therapeutic treatment with ERβ ligand IndCl improves RGC survival during
EAE ...................................................................................................................................41
Figure 3.3 EAE retinas exhibit increased microglial and astrocytic activation which is
attenuated with IndCl treatment ........................................................................................43
Figure 3.4 IndCl treatment attenuates demyelination, OL loss, and leukocytic infiltration
but not axonal degeneration in the optic nerve of EAE mice ...........................................46
Figure 3.5 IndCl treatment improves myelination in the optic nerve of EAE mice .........48
Figure 3.6 IndCl treatment ameliorates myelin loss and astrogliosis but not leukocytic
infiltration in the optic tract of EAE mice ........................................................................51
Figure 3.7 IndCl treatment ameliorates myelin loss and astrogliosis but not leukocytic
infiltration in the optic tract of EAE mice ........................................................................54
Figure 3.8 Treatment with IndCl attenuates myelin loss in the visual cortex of EAE mice
............................................................................................................................................57
Figure 3.9 IndCl treatment does not affect thinning of the RNFL or changes in the
thickness of posterior retinal layers during EAE ..............................................................59
Figure 3.10 EAE mice show few improvements in retina function with IndCl treatment as
measured by ERGs ............................................................................................................61
Figure 3.11 EAE mice exhibit severe deficits in visual function as measured by VEPs,
which are not changed by IndCl treatment .......................................................................63
Figure 3.12 Model of visual pathway dysfunction and IndCl effects on visual system
during EAE .......................................................................................................................65

xi
Figure 4.1 Experimental design for longitudinal assessment of visual pathway pathology
in EAE ...............................................................................................................................77
Figure 4.2 The optic tract exhibits significant demyelination and oligodendrocyte (OL)
loss early in EAE and throughout EAE progression .........................................................80
Figure 4.3 Optic tracts from EAE mice exhibit inflammation at peak disease, and
progressive astrogliosis and axonal damage .....................................................................82
Figure 4.4 The dLGN exhibits progressive demyelination and extensive OL loss early in
EAE and throughout disease progression .........................................................................84
Figure 4.5 EAE-induced effects in the dLGN include astrogliosis, but not microglial
activation or neuronal loss ................................................................................................86
Figure 4.6 EAE visual cortex shows significant demyelination and OL loss compared to
normal controls .................................................................................................................88
Figure 4.7 EAE visual cortex exhibits inflammation, astrogliosis, and progressive
parvalbumin+ (PV) interneuron loss ..................................................................................91
Figure 4.8 OCT imaging reveals EAE-induced pathological decreases in anterior retinal
layer thicknesses and changes to RPE layer thickness throughout disease progression ...93
Figure 4.9 ERG latencies after flash stimulus are impaired early in EAE, whereas
amplitude deficits are evident throughout disease progression ........................................95
Figure 4.10 VEP latencies after flash stimulus are impaired at onset and peak EAE,
whereas N2 amplitude deficits are present throughout disease progression .....................96
Figure 5.1 Experimental design for longitudinal assessment of visual pathway pathology
in CPZ .............................................................................................................................109
Figure 5.2 Toxic 0.2% CPZ diet induces significant demyelination after 3, 6, and 12
weeks, and mature myelinating OL loss after 6, 9 and 12wks in the optic tract .............111
Figure 5.3 CPZ demyelination results in significant microglial activation after 3, 6, and
9wks, and astrogliosis after 3, 6, 9, and 12wks, but does not cause observable axon
damage in the optic tract .................................................................................................113
Figure 5.4 CPZ diet results in progressive demyelination of the dLGN, coupled with
changes to OL populations ..............................................................................................115

xii
Figure 5.5 CPZ demyelination induces early inflammatory responses, some of which are
resolved, and decreases in PV immunoreactivity late in disease within the dLGN ........117
Figure 5.6 Progressive demyelination and OL loss are evident in V1 of CPZ mice .......119
Figure 5.7 Toxic CPZ diet induces early microglial activation and late astrogliosis, but
insignificant changes to neuron numbers in V1 ...............................................................121
Figure 5.8 CPZ diet induces pathological changes in posterior retinal layers ................123
Figure 5.9 Retinas of CPZ mice exhibit few functional deficits .....................................124
Figure 5.10 CPZ diet and visual pathway demyelination elicits minimal changes to visual
pathway function .............................................................................................................125
Figure A.1 EAE does not induce significant changes to the broadness of the VEP peak
..........................................................................................................................................138

xiii
List of Tables
Table 1 Primary antibodies used for examining myelin, leukocytes, astrocytes,
parvalbumin positive interneurons, RGCs, apoptosis and ERβ reactivity ........................29

1
Chapter 1: Introduction
1.1 Visual impairment and multiple sclerosis (MS)
Multiple sclerosis (MS) is an autoimmune demyelinating and neurodegenerative
disease of the central nervous system (CNS) which affects 2-2.5 million people in the
world, making it one of the world’s most prevalent non-traumatic debilitating neurological
disorders (Browne et al., 2014). During disease progression, MS patients exhibit visual,
motor, and cognitive impairments, which severely detract from quality of life
(Chiaravalloti and DeLuca, 2008; Dobson and Giovannoni, 2019; Hunter, 2016; Jasse et
al., 2013). Furthermore, MS most frequently affects middle-aged adults often within the
prime of their lives.
Visual disabilities associated with MS can have significant impacts, not only for
patients, but also for their caretakers and society as a whole. The highly myelinated nature
of the visual pathway makes it particularly susceptible to MS-induced inflammatory
demyelination. Visual deficits are often the initial presenting sign of MS and persist in
almost all patients throughout the progression of the disease (Costello, 2016; Roodhooft,
2009). Symptoms including visual field impairment, ocular motor disorders, and decreased
contrast sensitivity often result in acute or progressive vision loss (Nerrant and Tilikete,
2017; Ortiz-Perez et al., 2016). In cases of severe vision loss, patients experience
difficulties in performing basic tasks and impaired mobility, which lead to increased risk
of injury, dependence on others, and reduced quality of life (National Academies of
Sciences et al., 2016). Individuals with visual impairment also exhibit higher rates of

2
depression, anxiety and other psychological problems (Kempen et al., 2012). Additionally,
the severity visual field impairment in MS is correlated to the extent of neuroaxonal injury
within the CNS, and associated with a higher risk of MS disability progression(Ortiz-Perez
et al., 2016).
Visual dysfunction has been a well-known aspect of MS pathology since the 19th
century. At that time another disorder, optic neuritis (ON), had been well characterized
and found to be frequently associated with MS (Buzzard, 1893; Volpe, 2008). ON is an
inflammatory pathology which damages the optic nerve resulting in sudden onset of vision
loss in one or both eyes. It is an acute disorder, with partial vision returning to the patient
within one to three months. ON quite frequently results in demyelinating lesions within the
optic nerve, similar to those observed in other areas of the CNS in MS (Toosy et al., 2014).
In the late 19th century and first half of the 20th century, a subset of medical research was
focused on finding a cure for ON although with limited success. In the 1950’s, development
of corticosteroids led to their frequent prescription for ON treatment, even though
corticosteroid treatment had been reported to be ineffective in improving optic neuritis
outcomes (Volpe, 2008).
This discrepancy, and the association between MS and ON, led to the seminal ON
treatment trial, the goals of which were to evaluate the effectiveness of corticosteroid
treatment for ON and to determine the risk of developing MS after ON episodes. The results
of the trial confirmed the lack of efficacy of corticosteroids for treating ON, and that a
significant number patients who had ON would go on to develop MS within two years
(Beck et al., 1992). The results of the ON treatment trial spurred a wealth of research into

3
visual dysfunction in MS and the potential of using visual outcomes as a biomarker for
disease progression, and efficacy of therapeutic intervention.
It has been difficult to study MS-induced visual pathology in human patients, due
to limitations associated with in vivo access to the CNS. Most pathological investigations
to date have employed optical coherence tomography (OCT) and magnetic resonance
imaging (MRI) to evaluate structural changes within the retina and visual pathway
respectively, as well as diffusion tensor imaging (DTI) to investigate diffusional
abnormalities in MS(Andersen et al., 2018; Graham and Klistorner, 2017; Manogaran et
al., 2016). To assess functional deficits in the visual pathway, techniques such as
electroretinograms (ERGs) which assess retinal function, visual evoked potentials (VEPs)
which assess visual pathway function as a whole, and neurological assessments of visual
function, can also be performed in living patients(Balcer et al., 2017; Graham and
Klistorner, 2017; Janaky et al., 2017). Although these have provided a wealth of
information about the progression of visual pathology in MS, the underlying cellular and
molecular changes precipitating macroscopic structural changes and functional loss are not
accessible without post mortem histology. As a result, post-mortem analyses are frequently
employed to study MS pathology in other brain regions, however only a few studies have
investigated visual pathway structures(Evangelou et al., 2001; Kerrison et al., 1994). A
significant drawback of post-mortem assessments in humans is their inability to provide
information about disease onset and progression, making it difficult to gain etiological
insights.

4
To approach these challenges primate and rodent animal models of MS can be used
to study the functional and pathological progression of disease at individual histological
timepoints. Primate models are particularly useful due to the close similarities between
primate and human visual systems. However, research in primates presents significant
institutional and ethical difficulties, making such studies relatively difficult to complete.
The rodent visual system is comprised of many of the same structures present in the human
visual system, however the cellular organization and circuitry within those structures are
distinctly different. Still, the accessibility of rodents in research studies and the similarities
which do exist between rodent and human visual systems, make them useful for studying
progression of visual pathway pathology. To this end, translationally relevant in vivo
assessments such as OCT, MRI, DTI, ERGs, and VEPs can be performed in conjunction
with timed histological assessments which cannot be completed in humans.
Most studies in rodent models for MS have primarily focused on the anterior
portions of the visual system, as they are the historical target of ON. However, visual
pathology in MS has been reported to affect not only the retina and optic nerve, but also
more posterior visual pathway structures such as the optic tract, lateral geniculate nucleus
(LGN), and visual cortex (Balk et al., 2015; Gabilondo et al., 2014; Gabilondo et al., 2017;
Papadopoulou et al., 2019; Shen et al., 2019). Thus, investigations into posterior visual
pathway pathology are needed. The following work evaluates the rodent visual system as
a screening tool for preclinical therapeutics, and provides the first cohesive assessment of
posterior visual pathway pathology in two animal models of MS. Because visual
deterioration is particularly devastating to MS patients, who consider it the second most

5
valuable bodily function at risk after motor function (Heesen et al., 2008; Mowry et al.,
2009), such studies focused on understanding visual pathway pathology and developing
therapies which can improve visual function are of dire need.
1.2 An overview of the afferent visual system
The visual system can be segregated into the afferent and efferent pathways, both
of which are affected in MS. The afferent system is the primary route by which visual
stimuli are received and processed by the eye and brain. In contrast, the efferent system is
comprised of a series of CNS circuits which modulate and employ input from the afferent
system to control secondary events such as oculomotor function and circadian responses.
In primates, the afferent visual system is composed of the retina, optic nerve, optic
tracts, lateral geniculate nucleus (LGN), optic radiations, and the primary visual cortex
(V1) (Figure 1.1A). Among many other cell types, the retina contains retinal ganglion cells
Figure 1.1 Line diagram of human and mouse visual pathway.
Retina
Optic Nerve
Optic Tract
LGN
Optic
Radiation
Visual
Cortex
A. Human Visual Pathway B. Mouse Visual Pathway
Optic Chiasm

6
(RGCs), the axons of which leave the retina and form the optic nerve. At the optic chiasm,
axons of the optic nerve decussate: some axons cross to the contralateral hemisphere of the
brain and others remaining ipsilateral to the originating eye. The axons then enter the brain
via the ipsilateral or contralateral optic tract, then travel to distinct synaptic targets in the
visual system. Many RGC axons synapse on the LGN while other axons or collaterals
synapse on various efferent visual pathway targets such as the superior colliculus,
suprachiasmatic nucleus, olivary pretectal nucleus, and accessory optic system. Rodents
have similar nuclei and tracts; however, mice and rats do not have prominent optic
radiations (Figure 1.1B).
Other major differences between primate and rodent visual systems include the
degree of overlap between the visual field of the left and right eyes, the position of the eyes
in the head, the extent of axon crossover from the eye to the contralateral side of the brain
via the optic chiasm, and visual acuity. In humans and many primates, the eyes are situated
just lateral to the nose and facing directly forward. As a result, the visual field of each eye
extends about 95 degrees temporal from center and 60 degrees nasal, with a binocular
overlap of approximately 120 degrees, or 63% (Spector, 1990). Almost all fibers from the
nasal half of the retina cross to the contralateral hemisphere of the brain, while fibers from
the temporal region remain on the ipsilateral side, resulting in approximately 55%
crossover (Creel, 1995b). With these traits, integration of information from both eyes in
downstream synaptic targets is possible and allows for clear depth perception and visual
isolation of camouflaged entities. Primates also tend to have much higher visual acuities

7
than rodents. These physiological attributes are common features in animals which need to
hunt for prey or search for small vegetation (Mazade and Alonso, 2017).
In contrast, prey animals such as rodents primarily have eyes on opposing sides of
the head resulting in large horizontal visual fields, but narrow binocular overlap (Mazade
and Alonso, 2017). For instance, the mouse visual field encompasses 320 degrees, 13% of
which is binocular vision. This configuration is especially useful for scanning the
surroundings for potential predators. It is not surprising then that, only 3% of RGC axons
remain on an ipsilateral trajectory as, minimal binocular integration is necessary (Wilks et
al., 2013).
1.2.1 The retina
Light information first enters the visual system in the retina. The retina is positioned
in the posterior of the eye and rests upon the pigment epithelium and choroid (Kels et al.,
2015). Axons from RGCs across the retina comprise the intraocular optic nerve. These
axons accumulate at the optic nerve head, traverse the retina and exit the posterior region
of the eye to form the extraocular portion of the optic nerve, which then travels to the brain.
The retinal nerve fiber layer, the most anterior layer of the retina, is composed of
intraocular RGC axons. More posterior regions include an inner limiting membrane which
forms a diffusion barrier between the retina and the vitreous humor, three distinct nuclear
layers containing cell bodies, two fibrous plexiform layers which contain dendritic
arborizations and are the primary location for synaptic transmission, the photoreceptor
layer (PL), and the aneural pigment epithelium (RPE) (Kolb, 1995). Retinal layers posterior
to the RNFL in sequence include the ganglion cell layer (GCL) inner plexiform layer (IPL),
8
inner nuclear layer (INL), outer plexiform layer (OPL), outer nuclear layer (ONL), PL, and
RPE (Kolb, 1995; Masland, 2012).
The neural portion of the retina is home to numerous neuronal cell types including
RGCs, amacrine cells, bipolar cells, horizontal cells, and photoreceptors. The cell bodies
of RGCs and some displaced amacrine cells are located in the GCL, those of bipolar cells,
horizontal cells, and most amacrine cells in the INL, and those of photoreceptors in the
ONL. The IPL contains neuropil from RGCs, amacrine cells, and apical dendrites of
bipolar cells, whereas the OPL is composed of dendritic arborizations from photoreceptors,
horizontal cells, and basal dendrites of bipolar cells. The transmission of visual information
within the retina can be described as such:
1. Light casts an image on the eye, passing through most layers to reach the PL.
2. Photoreceptors process the light stimulus and transfer information to bipolar
cells.
3. Horizontal cells, connected to large numbers of bipolar cells and to some
photoreceptors, as well as amacrine cells, connected to multiple bipolar cells
modulate the final bipolar cell output.
4. The final bipolar cell output is transmitted to RGCs which relay visual
information to nuclei in the brain.
1.2.1.1 Glial cells of the retina
Glial cells of the retina including astrocytes, Muller glia, and microglia maintain
retinal homeostasis by providing structural support, assisting in metabolic processes,
phagocytosis of neuronal debris, selective release of some neurotransmitters, potassium

9
buffering, and maintenance of the blood-retinal barrier (BRB) (Vecino et al., 2016). Muller
cells constitute 90% of all glia in the retina and traverse the entire retina from the inner
limiting membrane bordering the vitreous, to the external limiting membrane between the
PL and ONL. The radial morphology characteristic of Muller glia allows for interaction
with cell bodies and processes of all retinal neurons. Functions include the promotion of
synapse formation during development, maintenance of synaptic function and supply of
neurotransmitter precursors and energy substrates to neuronal synapses (Pfrieger and
Barres, 1996). In contrast, astrocytes in the retina are primarily associated with retinal
blood vessels, thus astrocyte distribution varies significantly between species (Vecino et
al., 2016). Astrocytes have been implicated in retinal blood vessel formation both in normal
developmental and pathological conditions due to their primary role in the production of
vascular endothelial growth factor (Ozaki et al., 2000; Stone et al., 1995). Astrocytes also
provide neurotrophic support, structural support for degenerating axons, and contribute to
the preservation of the BRB (Vecino et al., 2016). However, in disease conditions,
astrocytes produce various cytokines, chemokines, and complement proteins promoting
retinal pathological degradation (Kim et al., 2006). And upregulate matrix
metalloproteinase 9, a neutrophil chemoattractant which is also involved in extracellular
matrix breakdown, leading to BRB compromise (Delclaux et al., 1996; Zhang et al., 2004).
Microglia are tissue macrophages within the CNS which not only play an important role in
innate immune responses, but like astrocytes and Muller glia are important for maintaining
retinal homeostasis, and neural networks (Hanisch and Gertig, 2014; Ransohoff and
Brown, 2012).

10
In some vertebrate species such as rabbits and dogs, there is a fourth type of retinal
glial cell: the oligodendrocyte (OL). Primary functions of OLs in the CNS include
myelination of axons, trophic support, and maintenance of saltatory conduction. Unlike
primates, rodents and cats in which RGC axons do not become myelinated until exiting the
optic nerve head and traversing the lamina cribrosa, species with OLs in the retina have
myelinated RGC axons within the RNFL(Miyake et al., 2004; Reichenbach et al., 1988).
Furthermore, in about 1% of the human population, intraretinal myelination of ganglion
cell axons does occur (FitzGibbon and Nestorovski, 2013). However most vertebrate
species do not exhibit this trait.

11
1.2.1.2 Retinal processing
The human retina has four major types of photoreceptors: rods which respond to
low light conditions, long-wavelength cones (l-cones) which respond maximally to red
light, medium wavelength cones which respond primarily to green light, and short
wavelength cones which respond to blue light(Ebrey and Koutalos, 2001). In contrast, the
rodent retina has three photoreceptor types: rods, s-cones, and l-cones. Photoreceptors
convert visual stimuli to electrochemical impulses through the use of opsins: G-protein
coupled receptors which contain the chromophore 11-cis retinal.
Under dark conditions, photoreceptors are depolarized and constitutively release
glutamate. A photon of light impinging on a photoreceptor induces a conversion of 11-cis
retinal to all-trans retinal, resulting in a conformational change of the opsin to
metarhodopsin II. Metarhodopsin II activates the transducin G-protein causing a signaling
cascade which results in the hydrolysis of cyclic guanosine monophosphate (cGMP) by
phosphodiesterase (PDE), lowering the intracellular concentration of cGMP. cGMP gated
sodium channels close, however continuing potassium efflux results in hyperpolarization
of the photoreceptor, and closure of voltage gated calcium channels(Arshavsky et al., 2002;
V. Kolesnikov et al., 2014). Decreased intracellular calcium inhibits glutamate release to
bipolar cell targets.
Bipolar cells can be categorized in numerous ways based on morphology, chemical
attributes, synaptic inputs, and electrophysiological responses to differing stimulus types.
Although as many as 13 distinct types of bipolar cells have been characterized(Masland,
2011), bipolar cells can be classified into three overarching categories depending on

12
photoreceptor input and the bipolar cell response: Rod ON bipolar cells, Cone ON bipolar
cells, and Cone OFF bipolar cells. As the names indicate, rod and cone bipolar cells receive
their primary synaptic input from rod and cone photoreceptors respectively. The ON or
OFF designation indicates the response of the bipolar cell to a photoreceptor which has
been stimulated by light. ON bipolar cells increase activity in response to light stimulus in
the center of their receptive field whereas OFF bipolar cells undergo inhibition.
Horizontal cells receive synaptic inputs from photoreceptors, as well as gap-
junction mediated inputs from neighboring cells, and thus transmit surrounding neuronal
signals to bipolar cells(Jeon et al., 1998; Kolb, 2003; Masland, 2012). Thus, the receptive
field of bipolar cells can be characterized into the center: photoreceptor direct input, and
the surround: horizontal cell inputs comprising responses from neighboring
photoreceptors, horizontal cells, and other bipolar cells. Stimulus of the surround results in
reversal of the bipolar cell output: ON bipolar cells are inhibited, and OFF bipolar cells
excited(Fahey and Burkhardt, 2003). These modulations are especially important in the
edge detection and contrast sensitivity required in the vertebrate visual system.
Amacrine cells receive inputs from bipolar and other amacrine cells and provide
synaptic input to RGCs. There are around 30 different known types of amacrine cells with
many specialized functions, however the overarching role of the amacrine cell within the
vertebrate retina is to modulate the RGC output(Gollisch and Meister, 2010; Masland,
2012).
RGCs, are the sole output neuron of the retina. RGC dendritic arborizations reside
in the IPL and receive direct inputs from bipolar cells and amacrine cells. As a result, RGC

13
receptive fields exhibit a similar center-surround morphology with on-center RGCs
increasing activity in response to center-oriented stimuli and decreasing activity in
response to surround oriented stimuli(Kuffler, 1953). Other designations for RGCs include
parasol, which constitute approximately 10% of RGCs, and midget constituting 80% of the
population. While parasol RGCs primarily detect the orientation, position, and motion of
objects in space, midget RGCs respond to fine detail, and color(Kolb, 2003). RGC axons
transmit the final visual output to afferent and efferent visual areas by way of the optic
nerve.
1.2.2 The Optic Nerve, Optic Chiasm, and Optic Tracts
The optic nerve, optic chiasm, and optic tracts are highly myelinated structures
within the visual system comprised of RGC axons, OLs, microglia and astrocytes. In
rodents, the optic nerve is unmyelinated for approximately 120-170µm after exiting the
eye and lacks OLs in this region (Sun et al., 2009). The unmyelinated region exhibits
densely packed astrocytes which, constitute the glial lamina border located at the junction
between the retina and the optic nerve. This region is especially susceptible to blood-brain
barrier disruption and is the point of origin of myelin loss and/or axonal degeneration in
many visual system pathologies including glaucoma and optic neuritis(Jakobs et al., 2005;
Soto et al., 2008; Stojic et al., 2019). Damage to one optic nerve results in monocular visual
field deficits ipsilateral to the damaged nerve.
In human development, fibers from the optic nerve reach the chiasm between 4 and
6 weeks, with crossing fibers observable at 11 weeks, and decussation and maturation at

14
15 weeks(Barber et al., 1954). In the mouse, RGC axons arrive at the midline around
embryonic day 14, pause in order to recognize inhibitory cues such as ephrinb2 and slit
proteins which are repulsive to RGCs expressing the EphB1 and Robo2 receptor
respectively, then revert to the ipsilateral path or continue to the contralateral hemisphere
from embryonic day 15 to 16 (Drager, 1985; Erskine and Herrera, 2014; Herrera and
Garcia-Frigola, 2008; Herrera et al., 2019; Lambot et al., 2005). This decussation occurs
primarily in fibers arising from RGCs located in the nasal hemiretina which receive
information from the temporal visual field. As a result, in animal species which have an
optic chiasm exhibiting partial axonal crossover such as primates, central chiasmatic
lesions can cause temporal visual field deficits in both eyes. Central chiasmatic lesions in
rodent species like mice which have approximately 95 percent axonal crossover result in
significant deficits across most of the visual field.
As axons leave the optic chiasm, they associate to form the optic tracts. The optic
tracts contain axons projecting from the contralateral nasal retina, and the ipsilateral
temporal retina. This allows for visual information impinging on corresponding points on
the left and right retinas to be processed at approximately the same retrochiasmatic sites in
each hemisphere(Fitzpatrick, 2004). Lesions in this region result in temporal visual field
deficiencies in the contralateral eye and nasal impairments in the ipsilateral eye.
1.2.3 The LGN and Optic Radiations
Axons from the optic chiasm travel to various synaptic targets within the afferent
and efferent pathway, however the major RGC target in the afferent pathway is the dorsal

15
LGN (dLGN). Though only 5-10% of inputs to the LGN come from the retina, it is the
main driver of activity in the LGN(Fisher et al., 2017; Hamos et al., 1987; Kerschensteiner
and Guido, 2017). The neurons within the human LGN are arranged in a distinct laminar
pattern which incorporates two magnocellular layers, four parvocellular layers, and six
koniocellular layers interleaved between magnocellular and parvocellular regions. Large
parasol and small midget RGCs, project to similarly large magnocellular and small
parvocellular thalamocortical projection neurons in the LGN which have similarly shaped
and sized center-surround receptive fields(Kolb, 2003; Usrey and Alitto, 2015). Akin to
parasol RGCs, magnocellular cells exhibit fast response times and excel in the detection of
swift movement across a stationary background. Parvocellular cells respond to stimuli with
high spatial frequencies, allowing for the resolution of fine detail. LGN neurons also
include local inhibitory interneurons which similarly receive retinogeniculate excitatory
input. In fact, the tight retinotopic mapping between the retinal mosaic and the LGN led to
the initially prevalent characterization of the dLGN as a simple relay station incapable of
complex visual processing(Kerschensteiner and Guido, 2017). However, individual LGN
neurons have been shown to receive monocular input from 1-5 RGCs of the same type
indicating the accepted relay function, but also to receive monocular input from 6-36
different types of RGCs indicating a newly described combinatorial
function(Kerschensteiner and Guido, 2017). Furthermore, a third category of convergence
of up to 90 retinal inputs from both eyes indicated a binocular combinatorial function, a
significant requirement for binocular vision processing and depth perception(Rompani et
al., 2017).

16
The mouse and rat LGN exhibit some similarities to the human LGN but also many
distinct differences. The mouse LGN includes three distinct structures: the dLGN, the
intergeniculate nucleus, and the ventral LGN. RGCs primarily project to the dLGN which
also provides the primary thalamocortical afferents. In contrast the intergeniculate leaflet
and the vLGN are important structures in the circadian system and thus are components of
the efferent visual system.
The well-defined laminar structure of the human LGN is absent in the rodent and
replaced by two visually indistinct but neuronally unique areas: a central core whose
primary inputs are provided by large-fast spiking RGCs analogous to parasol cells in the
human retina, an outer dorsal shell primarily driven by inputs from small slowly conducting
RGCs similar to midget ganglia, and a ventral region characterized by another even smaller
subtype of RGCs(Martin, 1986; Reese and Jeffery, 1983). Projections from the ipsilateral
eye synapse in the center of the dorsal core(Kerschensteiner and Guido, 2017). Similar to
humans and other primates, the rodent retina incorporates many types of direction sensitive
RGCs, as well as spatially responsive RGCs. These primarily project to the shell and core
respectively(Dhande and Huberman, 2014). Interestingly the shell also receives significant
excitatory input from the superficial layers of the superior colliculus, an efferent pathway
structure involved in visually mediated eye, head and body movements (Bickford et al.,
2015; Cruz-Martin et al., 2014). Thus, it is thought be important for transmitting stimulus
motion and eye position information to the visual cortex, a feature important for the
optokinetic response.

17
1.2.4 The Visual Cortex
The visual cortex is the primary locus for the formation of the visual image.
Thalamocortical projection neurons of the LGN primarily send afferents to layer 4 granule
cells of V1. Through the use of intracellular recordings and reconstructions of horse-radish
peroxidase filled cells within V1, Gilbert and Wiesel proposed the first theoretical model
of V1 microcircuitry in 1983. Specifically, layer 4 granule cells engage in pre-processing
then send axonal projections to pyramidal neurons of layer 2/3 in which recurrent networks
allow for the bulk of visual processing in V1. The major outputs of layer 2/3 neurons are
layer 5 neurons, which project to layer 6 neurons and drive subcortical efferent visual
structures such as the superior colliculus, thalamic reticular nucleus, pulvinar nucleus, as
well as cortical feedback to the LGN(Douglas and Martin, 2004; Gilbert and Wiesel, 1979;
Gilbert and Wiesel, 1983) and higher order visual areas (Glickfeld and Olsen, 2017). This
canonical circuit has primarily stood the test of time, with some revisions: thalamocortical
projections also innervate deep layers of the cortex (Bureau et al., 2006; Freund et al., 1985;
Humphrey et al., 1985) which can be activated independent of Layer 2/3
activity(Constantinople and Bruno, 2013; Huang et al., 1998; Schwark et al., 1986).
Furthermore, layer 2/3 has been elucidated as a locus for gain control modulation
(Quiquempoix et al., 2018).
The macroscopic organization, and the projection of the retinotopic map to V1 is
also well defined. The left visual field is mapped to the half of the occipital lobe located
right of the midline, and the right visual field to the opposite side. Visual stimuli in the
upper portion of the visual field generate responses in the lower half of the occipital

18
lobe(Ahlfors et al., 1992). The cortex is organized into ocular dominance columns, which
receive input either from the contralateral or ipsilateral eye. Pairs of ocular dominance
columns are described as hypercolumns in which one ocular dominance column receives
input from one eye, while the other receives input from the contralateral eye(Hubel and
Wiesel, 1974; Ts'o et al., 2009). Within the ocular dominance column are multiple
orientation columns interspersed with blobs. Orientation columns have neurons which are
primarily responsive to stimuli of a particular orientation, whereas blobs are responsive to
stimuli of particular colors(Livingstone and Hubel, 1988; Livingstone and Hubel, 1984).
Selectivity to individual orientations changes along horizontal and vertical planes of the
cortex, with adjacent orientation columns expressing selectivity to stimuli rotated by a few
degrees.
As discussed, the cortex contains pyramidal cells and inhibitory interneurons
responsible for visual processing. In orientation selective columns, pyramidal cells can be
divided into simple and complex cells. Simple cells have rectangular receptive fields which
receive inputs from multiple cells within the LGN. If stimuli from the LGN fits the
rectangular receptive field the simple cell fires in response(Georgiev, 2011; Hubel and
Wiesel, 1962). In contrast, complex cells similarly have varying shapes of receptive fields
and receive inputs from multiple simple cells(Hubel and Wiesel, 1962; Martinez and
Alonso, 2003).

19
1.3 Pathologies associated with the visual system in MS
Manifestations of MS pathology related to the afferent visual pathway can include
visual blurring as a result of increased body temperature or Uhthoff’s phenomenon, as well
as impairments in motion perception, contrast sensitivity, low-contrast letter acuity, and
color discrimination (Bock et al., 2012; Costello, 2016; Mowry et al., 2009; Villoslada et
al., 2012). Other important pathologies of the afferent visual system include uveitis, and
ON (Balcer et al., 2015; Beck et al., 1992; Costello, 2016). Approximately 50% of MS
patients experience ON prior to exhibiting initial symptoms, while 70% develop the
disorder at some point during disease progression (Toosy et al., 2014). ON-associated
visual deficits include retinal nerve fiber layer (RNFL) thinning, loss of RGCs, and
increased latency in VEPs (Balk et al., 2015; Bock et al., 2012; Fisher et al., 2006;
Gabilondo et al., 2014; Villoslada et al., 2012). In contrast, efferent visual pathway
dysfunction in MS can include ocular motility disorders, diplopia (double vision) and/or
oscillopsia (perceived oscillation of objects in the visual field)(Costello, 2016; Pula and
Reder, 2009; Subei and Eggenberger, 2012).
Of the numerous visual disorders associated with MS, ON is the most prominent
and well-studied. Significant progress has been made in understanding the relationship
between MS and ON partially because inflammation and demyelination of the optic nerve
has been represented in various animal models of MS. However, a rigorous pathological
and functional analysis of both anterior and posterior portions of the afferent visual system
in animal models is currently lacking. This is especially crucial because posterior visual

20
pathway structures such as the LGN, optic radiations, and visual cortex are significantly
affected in MS, with or without a history of ON. Specifically, MRI of the visual pathway
in MS patients shows decreases in the volume of the LGN, lesions in the optic radiations
(OR) and atrophy of the visual cortex (Balk et al., 2015; Gabilondo et al., 2014; Gabilondo
et al., 2017; Papadopoulou et al., 2019; Shen et al., 2019). Even in the absence of OR
lesions, significant increases in OR axial diffusivity (thought to be indicative of myelin
damage), are often evident in MS patients compared to non-MS controls (You et al., 2019).
Functional assessment of the visual pathway in MS using VEPs reveal latency changes
indicative of myelin loss, and amplitude deficits related to axonal damage(Blanco et al.,
2014; Laron et al., 2010; Pakrou et al., 2006; Rodriguez-Mena et al., 2013). Although there
are a few histological studies on the retina, optic nerve, optic tract, and LGN in
MS(Evangelou et al., 2001; Kerrison et al., 1994), these are limited in that they only
provide a snapshot of pathology at death, and cannot easily be correlated to progressive
functional deficits. Such assays of the time course of myelin changes and axonal damage
in animal models, for which histological studies are significantly more accessible than
human tissues, are especially crucial. Because all afferent visual nuclei and tracts
contribute to the final visual output in normal conditions, all visual system components
including the retina, optic nerve, optic tract, dLGN and visual cortex require investigation
in animal models. However, studies have primarily focused on the retina and optic nerve
anterior regions. Thus, in the following work, we:
a. Investigate posterior visual pathway pathology in the Experimental
autoimmune encephalomyelitis (EAE) mouse model for MS.
21
b. Evaluate the efficacy of therapeutic remyelination on attenuating visual
pathway pathology in EAE.
c. Determine a critical therapeutic window for remyelination in EAE.
d. Investigate posterior visual pathway pathology in the cuprizone (CPZ)
demyelination mouse model for MS with longitudinal studies.
22
Chapter 2: Experimental Methods
2.1 Animals
All procedures were conducted in accordance with the National Institutes of Health
guidelines and approved by the Institutional Care and Use of Laboratory Animals
Committee at the University of California, Riverside (UCR) and the University of
California, Los Angeles (UCLA). To understand the extent of EAE effects in OLs and
neurons, we made use of PLP_EGFP and Thy1-YFP mice respectively, in addition to
C57Bl/6 wild-type mice. Thy1-YFP transgenic mice were purchased from the Jackson
Laboratory. B6.Cg-Tg(Thy1- YFP)16Jrs/J mice (JAX #003709, Bar Harbor ME) were
backcrossed to wild type C57BL/6 mice for more than five generations(Feng et al., 2000).
PLP-EGFP breeding pairs backcrossed to C57BL/6 mice, a kind gift provided by Dr.
Wendy Macklin (University of Colorado, Denver CO, USA), were bred and housed in
UCLA and UCR vivarium facilities. The generation, characterization, and genotyping of
these mice has previously been reported (Mallon et al., 2002). Mice were all kept on a 12
hr light/dark cycle with unrestricted access to food and water.
2.2 EAE induction
EAE was induced in eight- to twelve-week-old male wildtype Thy1-YFP, PLP-
EGFP and C57Bl/6 mice (Figure 2.1A) as previously described (Hasselmann et al., 2017b;
Mangiardi et al., 2011). In brief, one-part lyophilized myelin oligodendrocyte protein

23
peptide 35-55 (MOG35-55) (Mimotopes, San Diego, CA) in Dulbecco’s phosphate buffered
saline without calcium or magnesium (DPBS) and 1.3 parts heat killed Mycobacterium
tuberculosis H37 Ra (Beckton Dickinson, Franklin Lakes NJ) in complete Freund’s
adjuvant (CFA; Becton Dickinson, Franklin Lakes NJ) were emulsified, resulting in a final
concentration for both MOG35-55 peptide and M. tuberculosis of 2 mg/mL. Mice were
anesthetized with 2% isoflurane gas in oxygen at a flow rate of 2 L/min.
Figure 2.1: EAE induction protocol. A. Eight- to twelve-week-old male Thy1-YFP, PLP-eGFP, and
C57Bl/6 mice were induced with EAE. B. EAE induction protocol involved initial MOG+CFA immunization
and PTX injection on day 0, second PTX injection on day 2, and second MOG+CFA immunization on day
7.
On the first day of induction (Day 0), 0.05 mL of the emulsion was injected
subcutaneously into the backs of the animals between the cervical vertebrae and left
shoulder and another 0.05 mL between the lumbar vertebrae and left thigh. Injections were
placed as such to maximize proximity to axillary and inguinal lymph nodes. Each mouse
was then injected intraperitoneally (IP) with 0.3 mL of Pertussis toxin (PTx; List Biological
Laboratories, Campbell CA) in DPBS at 1.667 µg/mL, returned to its home cage with free
access to water and food and monitored until recovered. Two days after induction (day 2),
the mice were given booster IP injections of PTx at the same concentration. Five days later
(day 7), motor function was assessed using clinical scores, then mice were injected with a
freshly made MOG35-55 /M. tuberculosis emulsion at the same ratios and concentrations

24
used on Day 0 (Figure 2.1B). Day 7 MOG35-55 injections at 0.05 mL each were placed
between the cervical vertebrae and right shoulder, and the lumbar vertebrae and right thigh.
2.3 EAE clinical scoring
Starting 7 days post induction (dpi), mice were scored daily for clinical disease
severity. The clinical scoring protocol was defined as: 0, unaffected; 1, complete tail
limpness; 2 failure to right upon attempt to roll over; 3, partial hind limb paralysis; 4,
complete hind limb paralysis; and 5, moribund (Hasselmann et al., 2017a). Mice reaching
clinical scores of 4.5 or higher were euthanized humanely with isoflurane anesthesia
followed by cervical dislocation.
2.4 OCT
OCT data plots of mouse retinas were acquired with spectral domain-OCT (R2200
840 nm HHP; Leica, Buffalo Grove IL) in tangent with Bioptigen InvivoVue software
(Leica, Buffalo Grove IL). Animals were anesthetized with IP injections of 100 mg/kg
body weight ketamine (Putney Veterinary Generics, Portland OR) and 10 mg/kg
bodyweight xylazine (Lloyd Laboratories, Marikina Phillipines) resulting in 1 to 1.5 hours
of sedation. After animal was fully sedated, eyes were dilated with 1% tropicamide (Alcon
Laboratories, Fort Worth TX) for 10 minutes. The animal was then placed on the OCT
system and arranged such that the temporal field of the retina was in full view. Systane

25
ultra-lubricant eye drops were applied to eye spears (Novartis, Basel Switzerland) and
applied intermittently throughout the procedure to prevent dehydration of the eye and
cataract formation. One thousand A-scans and one hundred B-scans were taken to generate
each OCT image. Each image was taken 3 times and averaged. After imaging, the eye was
lubricated with ophthalmic ointment (Dechra Veterinary Products, Northwich UK) to
prevent cataract formation during the remaining anesthesia period (You et al., 2015). Post-
experiment care included animals being placed in a large open-air container with a heating
pad set to 40˚C and monitored. Once awake, animals were returned to respective home
cages.
OCT data plots were analyzed just lateral to the optic nerve in order to minimize
fluctuations in layer thickness observed near the optic nerve. Automatic segmentation with
Bioptigen Diver 3.0 software (Leica Microsystems, Buffalo Grove IL) measured, then
averaged individual retinal layer thicknesses based on the optical elements of the system.
Software segmented individual retina images and avoided inclusion of blood vessel
diameter in RNFL calculations.
2.5 ERGs and VEPs
Ocuscience Handheld Multi-species ElectroRetinograph (Occuscience Henderson
NV) was used to measure changes in retinal and visual function by recording ERGs and
VEPs respectively before midday (00:00-12:00). Before recording mice were dark adapted
for at least five hours.

26
Animals were anesthetized with 2% isoflurane (Piramal Healthcare, Mumbai
India), in sterile medical grade oxygen delivered through an isoflurane/oxygen induction
chamber and/or face mask. Body temperature was maintained at 37°C. Eyes were dilated
with 1% tropicamide for 10 minutes before recording and visine dry eye drops were applied
every 2-3 minutes to hydrate eyes and prevent cataract formation (You et al., 2015).
Stainless steel subdermal electrodes (F-Needle Electrode (F-E2); OcuScience,
Henderson NV) were inserted on either side of the snout (reference electrodes). For ERG
recordings silver-embedded thread electrodes (1.5" Filament (2); OcuScience, Henderson
NV) were placed over the cornea and held in place with mini contact lenses filled with a
saline solution to optimize conductivity between the electrode and the cornea. During VEP
recordings subdermal electrodes were inserted 2-3 mm lateral to the midline above the
visual cortex on the left and right side (Hegedus et al., 2009; Yu et al., 2011). Mini contact
lenses filled with saline solution were placed over the eyes during VEP recordings to
prevent dehydration.
ERG and VEP traces were averaged using Occuscience ERG viewer. A minimum
of 5 traces for ERGs, and 25 traces for VEPs were averaged per mouse. The traces were
then filtered for 60 Hz noise, along with a low pass filter of 150 Hz with MATLAB. Trace
baselines were adjusted to 0 at the onset of the light stimulus. Only VEP traces were
smoothed (3rd order Savitzky-Golay, 50 points per window (Schulz et al., 2009)).
MATLAB was used to identify and measure ERG and VEP peak amplitudes and latencies.

27
2.6 Perfusions and tissue preparation
Mice were deeply anesthetized with isoflurane and intracardially perfused with ice
cold phosphate buffered saline (PBS) then 10% formalin in PBS (Fisher Scientific,
Waltham MA). Eyes, optic nerves, and brain were dissected and post-fixed in 10%
formalin for immunohistochemistry (IHC). After 24 hours, tissue excluding eyes was
transferred to 30% sucrose with 0.2% sodium azide for 2 days (Fisher Scientific, Waltham
MA) for cryoprotection. Tissue was embedded in a gelatin/sucrose solution (7.5% w/v
gelatin (Becton Dickinson, Franklin Lakes NJ) +15% w/v sucrose (Fisher Scientific,
Waltham MA) in Milli-Q water). Gelatin tissue blocks were placed in 10% formalin
overnight, followed by 30% sucrose+0.2% sodium azide solution until ready for
sectioning. Retina processing was initiated by removing cornea and lens from eyes. Retina
attached to sclera were transferred to 10% formalin for 24 hrs followed by 30% sucrose.
Retinas were embedded in optimal cutting temperature compound, then placed in 2-
methylbutane (EMD Millipore, Burlington MA) on dry ice to allow for uniform freezing.
Embedded retinas and optic nerve gelatin blocks were cut to 10 µm thick sagittal sections
using a cryostat and affixed directly to warm slides. Brain gelatin blocks were flash frozen
on dry ice, and cut to 40 µm thick coronal sections, then placed in PBS with 0.2% sodium
azide.

28
2.7 IHC
Prior to antibody application, tissue sections were thoroughly washed with PBS to
remove residual sodium azide, permeabilized with 0.3% Triton-X (Electron Microscopy
Sciences, Hatfield PA) and blocked in 20% normal goat serum (NGS) (Sigma-Aldrich, St.
Louis MO). Sections were incubated in 1:500 dilutions of primary antibodies (Table 1)
for 2 hours at room temperature followed by overnight at 4oC. The following day, the
sections were washed with PBS and then tris buffered saline (TBS). The sections were
incubated with the corresponding secondary antibodies in TBS: Goat anti-rabbit IgG Cy3
(EMD Millipore, Burlington MA), Goat anti-Rat IgG Cy5 (Invitrogen, Carlsbad CA), Goat
anti-mouse Cy5 IgG (Invitrogen Carlsbad, CA). Sections were co-stained with 4’,6-
Diamidino-2-Phenylindole (DAPI; EMD Millipore, Burlington MA) to quantify cell
numbers. Finally, the sections were washed again with TBS, mounted, and cover-slipped.

29
Antibody Target Vendor Catalog #
MBP Myelin basic protein Abcam ab40390
CD45 Cluster of differentiation 45; Pan
leukocytic antigen (clone 30-F11)
Becton Dickinson 550539
GFAP Glial fibrillary acidic protein Invitrogen 180063
Iba-1 Ionized calcium binding adaptor
molecule 1
Wako 019-19741
PV Parvalbumin (clone PARV-19) EMD Millipore MAB1572
RBPMS RNA binding protein with multiple
splicing
PhosphoSolutions 1830
Casp-3 Caspase-3 (clone AM1.31-11) EMD Millipore AM65
ERβ Estrogen Receptor β EMD Millipore 05-824
CC1
(APC)
Adenomatous polyposis coli (mature
myelinating OLs)
GeneTex GTX16794
Olig2 OL transcription factor 2 ThermoFisher P21954
NeuN Neuronal nuclei EMD Millipore ABN78
Table 1. Primary antibodies used for examining myelin, leukocytes, astrocytes, parvalbumin positive
interneurons, RGCs, apoptosis and ERβ reactivity. Antibodies were paired with either Cy5 or Cy3 secondary
antibodies for IHC.
2.8 Microscopy
Sections were imaged at similar light exposures using an Olympus BX61 spinning
disc confocal microscope equipped with 10x and 40x Super Apochromat objectives
(Olympus America Inc., Cypress CA) connected to a camera (Hamamatsu Photonics Orca-
R2, Hamamatsu Japan). Z-stack images were acquired, and projection images compiled
using Slidebook 6 software (Intelligent Imaging Innovations Inc, Denver CO).

30
Immunofluorescence intensity and cell numbers was assessed with NIH ImageJ software
(v1.50i http://rsb.info.nih.gov/ij/) and quantified for CD45, MBP, and GFAP
immunofluorescence, or cell counts for RBPMS+, casp-3+, ERβ+, PV+, Thy1-YFP+ and
PLP-EGFP+ cells. Histograms were adjusted evenly to match those of control images and
saved. Files were then converted to RGB tagged image format (.tif) files and transferred to
ImageJ where individual color channels were converted to gray scale. Brightness and
contrast were automatically adjusted using the to limit experimenter bias and a region of
interest was traced around an area encompassing the retina, optic nerve, optic tract, LGN,
or visual cortex. The threshold of staining for each image and thus the percentage of
fluorescent pixels in each area of interest was computed by the software and reported in a
table, which was transferred to Prism® (Graphpad, La Jolla CA) for statistical analysis.
For cell counts in the retina, images were taken at 40x and all relevant cells in the GCL
were counted, corresponding to a length of 0.25 mm. In the optic nerve, PLP images were
taken at 10x, GFAP and MBP and 20x, and Thy1 at 40x. For PLP images, PLP+ cells were
counted across the region of interest. Brain sections containing the optic tract, LGN, or
visual cortex were imaged at 10x, 20x, or 40x magnification depending on the stain. For
Thy1 and PV cell counts, an overlay grid with bin dimensions of 316.23 x 316.23 pixels
was placed over images and cells were counted in two or three of the grid areas
respectively, depending on the density of cells in the image. For axon swelling counts in
white matter tracts, single-channel images from Thy1 sections were thresholded in the
region of interest corresponding to the optic nerve or optic tract. The ImageJ analyze
particles function was used to count the number of axonal blebs (particles) present in the

31
thresholded image, within the region of interest. Results from all counts were analyzed in
GraphPad Prism as well.
2.9 Electron microscopy
Optic nerves dissected from paraformaldehyde perfused mice were post-fixed in
2% glutaraldehyde (Electron Microscopy Sciences, Hatfield PA) and 5% formalin (Fisher
Scientific, Waltham MA). Optic nerves were Epon embedded and stained with uranyl
acetate-lead citrate. Number of myelinated and unmyelinated axons and the g- ratio (the
ratio of the axon diameter to the total myelinated fiber diameter), was quantified as in
previous studies for at least 300 axons per group (Crawford et al., 2009a). For each axon,
two measurements for axon diameter were made.
2.10 Statistics
For IHC, two sections per mouse were taken for each area of interest in the brain
and three sections per mouse for retina and optic nerve tissues. There were 4-10 mice per
treatment group. For ERG, VEP and OCT in vivo studies n=4-8 mice per group were used.
Both eyes were assessed in all in vivo studies resulting in a minimum of n=8 eyes per group.
Statistics were performed using Prism® (GraphPad, La Jolla) program for
Windows. Graph values are expressed as mean + standard error of the mean. For histology,
EM, and in vivo studies statistical analysis of mean values was carried out using one-way

32
ANOVA if mean values passed a normality test, or Kruskal Wallis multiple comparison
test if they did not. For EAE clinical scores, statistics were performed using an ordinary
two-way ANOVA with Bonferroni post-hoc test as previously described (Hasselmann et
al., 2017a). Differences were considered significant at the *p<0.05, **p<0.01, ***p<0.001,
and ****p<0.0001 level.

33
Chapter 3: Axon damage in the visual pathway interferes
with remyelination induced functional recovery in a
mouse model of MS
3.1 Introduction
The EAE model is a commonly used model for MS which exhibits neurological deficits
similar to those seen in MS including ON (Bettelli et al., 2003; Shao et al., 2004). As such
it is used to understand these neurodegenerative events in the context of immune mediated
demyelination and is the most commonly used animal model for ON. Furthermore, it has
been invaluable in mechanistic studies of currently approved MS drugs and in screening
various therapeutic agents including neuroprotective estrogens, prior to clinical
trials(Tiwari-Woodruff and Voskuhl, 2009). In the following studies transgenic mice,
Thy1-YFP, which express green fluorescent protein under a neuron-specific promoter of
the Thy1 gene, are used to investigate EAE-induced effects on RGCs, optic nerve, optic
tract axons, and visual cortex pyramidal neurons (Feng et al., 2000; Porrero et al., 2010).
Whereas, PLP-EGFP transgenic mice, which express green fluorescent protein under the
OL specific proteolipid protein (PLP) promoter are used to assay changes in the number of
white matter OLs and myelin (Mallon et al., 2002). Imaging OCT analysis of the retina,
and IHC across the visual system is employed to assess structural changes in all afferent
visual pathway nuclei and tracts. Functional modalities, ERGs and VEPs are used to
evaluate EAE-induced functional changes to the retina and the afferent visual system.

34
OCT, ERG, and VEP analysis of the visual pathway are then evaluated as translationally
relevant tools for assessment of promising preclinical therapeutic agents.
ERbeta Ligands
It has long been observed that MS has a marked sex difference with up to three
times more incidence in women than in men (Whitacre, 2001) although paradoxically,
female sex hormones appear to confer a degree of protection from MS incidence and
symptoms(Gomez et al., 2013). In fact, pregnant women have fewer relapses during second
and third pregnancy trimesters concurrent with higher estrogen levels(Confavreux et al.,
1998; Vukusic et al., 2004), while menopausal female patients have aggravated symptoms,
matching a period of lower estrogen levels(Bove et al., 2014; Smith and Studd, 1992). This
incidence led to the investigation of estrogens in ameliorating MS pathology
Several studies have demonstrated the neuroprotective and therapeutic benefit of
estrogen-based treatments, which have been shown to reduce clinical signs and
inflammatory lesions in EAE (Ito et al., 2001; Matejuk et al., 2001). However, there are
significant side effects associated with estrogen treatment including feminizing effects in
males and increased risk for breast and uterine endometrial cancer (Thomas, 1984). These
deleterious effects appear to be mediated primarily through estrogen receptor α (ERα)
while estrogen receptor β (ERβ) is associated with tumor suppression and reduced cell
proliferation (Nilsson and Gustafsson, 2011). The ERβ agonist 3-Chloro-2-(4-
hydroxyphenyl)-2H-indazol-5-ol (IndCl) developed by Katzenellenbogen group (De
Angelis et al., 2005) has a >100 fold selectivity for ERβ over ERα (De Angelis et al., 2005)

35
and has demonstrated immunomodulatory, remyelinating, and neuroprotective effects in
spinal cord and callosal axons (Karim et al., 2018b; Moore et al., 2014b; Saijo et al., 2011).
Because remyelinating therapies are being rigorously investigated in pre-clinical and
clinical trials as the next wave of MS therapeutics, we evaluate the efficacy of IndCl, in
alleviating visual pathway pathology and dysfunction (Karim et al., 2018a; Moore et al.,
2014a). In addition, we assess its potential for improving functional deficits in the afferent
visual system, by way of ERGs and VEPs.
Our initial results indicate: i) Chronic EAE induced significant RGC death,
inflammation, demyelination, and axon damage throughout the visual pathway, as well as
functional deficits as assessed by ERG and VEP. ii) Therapeutic treatment with IndCl
during EAE significantly increased the number of myelinated axons in almost all major
white matter tracts within the visual pathway, and attenuated RGC loss in the retina.
However, these near global improvements in axon myelination were not sufficient to
attenuate axon degeneration nor recover functional deficits in the visual pathway of EAE
mice. Thus, to obtain meaningful functional recovery in demyelinating diseases, potential
therapeutics must not only target remyelination, but must also prevent further axonal
degeneration and neuron loss.

36
3.2 Methods
Eight- to twelve-week-old male Thy1-YFP, PLP-EGFP, and C57Bl/6 mice were
induced with EAE for two individual experiments: experiment (expt) “a” and expt “b”.
EAE disease onset occurred 10 to 13 dpi, reached peak disease severity between 15 and 21
dpi, and maintained severity through late EAE and euthanasia at 60 dpi (Figure 3.1). Mice
received daily drug or vehicle subcutaneous injections starting at peak disease, which
occurred 15 dpi for expt “a”, and 21 dpi for experiment expt “b” (Figure 3.1Aii, 3.1B).
Expt “a” mice underwent ERGs and VEP visual function assessments at 40dpi, OCT retinal
assessment at 45dpi, and were euthanized at 50dpi. Expt “b” mice were euthanized at 60
dpi for IHC. For treatment injections, mice were separated into vehicle and IndCl treatment
groups such that an even representation of clinical scores was evident in both groups.
Average mouse bodyweights were used to calculate drug dosage. IndCl at 5 mg/kg body
weight was dissolved in vehicle (10% ethyl alcohol; Electron Microscopy Sciences,
Hatfield PA and 90% Miglyol 812N; Cremer, Hamburg Germany). Vehicle and IndCl
syringes and mouse cages were color coded for blinded treatment effects. Naïve normal
controls did not develop clinical disease. Wild-type C57Bl/6 and these transgenic lines
undergo a similar EAE clinical disease course(Bannerman et al., 2005; Crawford et al.,
2010; Mangiardi et al., 2011). Treatment with IndCl at peak disease decreased clinical
disease severity over time, an effect that reached significance at 32 dpi and persisted
through experiment end similar to previously published results (Figure 3.1B)(Karim et al.,
2018b; Karim et al., 2019a; Moore et al., 2014a).

37
Figure 3.1: Experimental design for assessment of IndCl therapeutic effects in visual pathway of EAE
mice. A. EAE was induced in male Thy1-YFP, PLP-eGFP and C57Bl/6 mice in two experiments: expt. “a”
(blue) and expt “b” (green). Mice received daily therapeutic treatment, beginning during peak EAE at 15dpi
(expt “a”) or 21dpi (expt “b”) through experiment end. Expt “a” mice received ERG and VEP visual function
assessments at 40dpi, and retinal imaging with OCT at 45dpi. During late EAE, expt “a” mice were
euthanized 50dpi, and expt b mice at 60dpi. Tissue from expt “b” mice was processed for IHC or electron
microscopy. B. Representative clinical scores for Thy1-YFP and PLP-EGFP age-matched mice induced with
EAE (from expt “a”). One representative EAE experiment of two is shown. Disease onset occurred around
12 dpi with peak disease from 16 to 20 dpi. IndCl was given daily at 5mg/kg via subcutaneous injection
beginning 21 dpi. Treatment groups included normal controls (black), EAE + vehicle (10% ethanol, 90%
miglyol) (red), and EAE + IndCl (5mg/kg in vehicle) (purple). Normal controls do not show any changes in
clinical score from baseline. IndCl treated mice show decreased clinical scores over time, becoming
significantly lower than vehicle from 32 to 60 dpi. Statistical differences between groups were determined
using two-way unbalanced ANOVA with Dunnett’s multiple comparisons test n= 8 mice per group; **P
<0.01.

38
3.3 Results
The MOG35-55 EAE model leads to significant demyelination, inflammation, and
neurodegeneration along with motor deficits (Hasselmann et al., 2017a; Karim et al.,
2019b; Mangiardi et al., 2011). Pathology and functional deficits have been assessed in
the spinal cord, corpus callosum, cortex, hippocampus, and cerebellum (Crawford et al.,
2010; Kumar et al., 2013; Mangiardi et al., 2011; Ziehn et al., 2010). With respect to the
visual system pathological studies have primarily focused on the anterior portion of the
visual pathway, specifically the retina and optic nerve (Horstmann et al., 2016; Lin et al.,
2017; Nishioka et al., 2019; Stojic et al., 2019). In the current work, we assayed EAE-
induced visual pathway demyelination, inflammation, and neurodegeneration along with
functional outcomes (VEP and ERGs). In addition, the effect of treatment with a known
remyelinating ERβ ligand, IndCl was evaluated. As anterior and posterior visual pathway
dysfunction are both key aspects of MS pathology, the results presented here investigate
nuclei and tracts of the afferent visual pathway from the retina to the visual cortex.
The retina is a highly organized structure responsible for the initial conversion of
the visual image into nerve impulses and subsequent transmission to central visual nuclei.
This is achieved by photoreceptors which pass the visual information to interneurons, that
pass it to RGCs. Axons of RGCs travel through the optic nerve. RGCs have been shown
to be susceptible to damage during demyelinating disease. MS patients show significant
thinning of the RNFL, GCL and IPL, indicating loss of RGCs (Graham et al., 2016).

39
Rodent models of MS have also shown significant retinal pathology along with loss of
RGCs (Hobom et al., 2004; Shindler et al., 2006; Shindler et al., 2008).
Retina was isolated from normal, EAE+ vehicle, and EAE + IndCl groups of mice
and sectioned along the horizontal plane. Shown is a retina section containing the optic
nerve from a normal Thy1-YFP mouse (Figure 3.2A-i). In retina sections from normal
mice, Thy1 expression was evident in the GCL, IPL, INL, OPL and PL. This was slightly
different from another Thy-1 transgenic mouse (B6.Cg-Tg(Thy1-CFP)23Jrs/J reported by
Brecha lab) that showed CFP expression in the inner retina, GCL, RNFL and the optic
nerve (Raymond et al., 2008). Horizontal midline retinal sections were used for
immunostaining and imaged at 20X or 40X magnification lateral to the optic nerve (white
dashed box in A) (Figure 3.2A-ii).
Decreased retinal expression of ERβ in EAE mice is attenuated by IndCl treatment
Estrogen receptors are expressed in different cell types within the CNS (Mhyre and
Dorsa, 2006; Shughrue et al., 1997). The presence of ERβ has previously been confirmed
in the human (Munaut et al., 2001) but not in mouse retina. To assess ERβ expression,
retinal sections from Thy1-YFP normal, EAE + vehicle and EAE + IndCl groups was
immunostained with ERβ. ERβ expression was evident in almost all normal retinal nuclear
layers (Figure 3.2B). Retinal sections from vehicle-treated EAE mice showed decreased
ERβ immunoreactivity in the GCL as compared to normal. Retinas from IndCl treated mice
exhibited increased ERβ immunoreactivity in all retinal nuclear layers compared to vehicle.
Quantification of ERβ+ Thy1+ neurons in the GCL revealed, a significant decrease in the

40
number of ERβ+ Thy1+ cells in in GCL of EAE+vehicle groups as compared to normal.
This decrease in ERβ+ Thy1+ cells in in GCL was attenuated in sections from IndCl treated
mice (Figure 3.2E).
Increased RGC apoptosis with EAE is attenuated by, IndCl treatment.
RGC numbers were quantified by immunostaining for RBPMS, a selective marker
for RGCs (Kwong et al., 2010; Rodriguez et al., 2014). Robust immunostaining with
RBPMS was observed in normal retinal sections (Figure 3.2C, F). However, retinal
sections from EAE+vehicle group exhibited a significant decrease in RBPMS+ RGCs.
Treatment with IndCl mitigated the loss of RBPMS+ RGCs seen in EAE + vehicle group
with a return of robust RBPMS staining.
The decrease in ERβ+ Thy1+ and RBPMS+ immunoreactivity in the GCL was
investigated for potential EAE-induced GCL cell death. Immunostaining of retinal sections
with cell apoptosis marker, casp-3 revealed negligible activity in normal retinal sections
(Figure 3.2D). However, retinal sections of EAE+vehicle group revealed an increase in
EAE-induced cell apoptosis in the RGC and INL (Figure 3.2D). Similar EAE-induced
cell apoptosis in other CNS regions and RGCs have been previously reported (Al-Shamsi
et al., 2015; Duarte-Silva et al., 2018; Kim and Sung, 2017; Meyer et al., 2001). Retinal
sections from IndCl treated EAE group showed a significant decrease in casp-3 staining in
GCL as compared to vehicle (Figure 3.2D, G).
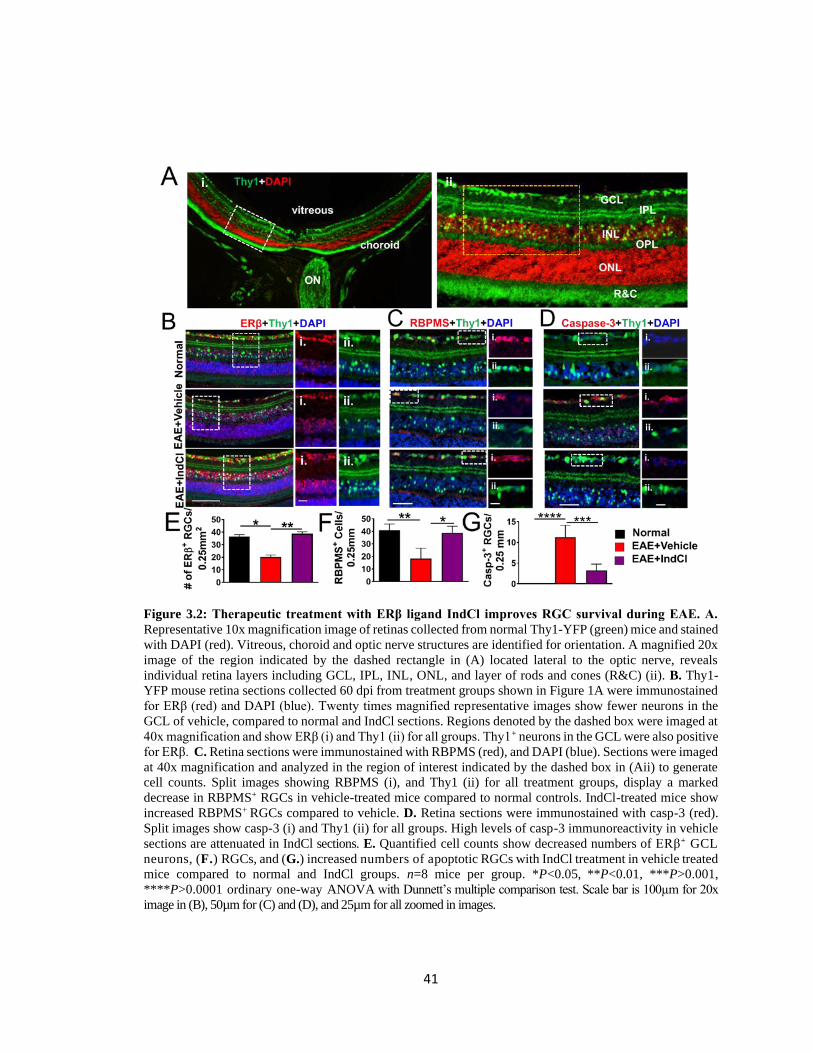
41
Figure 3.2: Therapeutic treatment with ERβ ligand IndCl improves RGC survival during EAE. A.
Representative 10x magnification image of retinas collected from normal Thy1-YFP (green) mice and stained
with DAPI (red). Vitreous, choroid and optic nerve structures are identified for orientation. A magnified 20x
image of the region indicated by the dashed rectangle in (A) located lateral to the optic nerve, reveals
individual retina layers including GCL, IPL, INL, ONL, and layer of rods and cones (R&C) (ii). B. Thy1-
YFP mouse retina sections collected 60 dpi from treatment groups shown in Figure 1A were immunostained
for ERβ (red) and DAPI (blue). Twenty times magnified representative images show fewer neurons in the
GCL of vehicle, compared to normal and IndCl sections. Regions denoted by the dashed box were imaged at
40x magnification and show ERβ (i) and Thy1 (ii) for all groups. Thy1+ neurons in the GCL were also positive
for ERβ. C. Retina sections were immunostained with RBPMS (red), and DAPI (blue). Sections were imaged
at 40x magnification and analyzed in the region of interest indicated by the dashed box in (Aii) to generate
cell counts. Split images showing RBPMS (i), and Thy1 (ii) for all treatment groups, display a marked
decrease in RBPMS+ RGCs in vehicle-treated mice compared to normal controls. IndCl-treated mice show
increased RBPMS+ RGCs compared to vehicle. D. Retina sections were immunostained with casp-3 (red).
Split images show casp-3 (i) and Thy1 (ii) for all groups. High levels of casp-3 immunoreactivity in vehicle
sections are attenuated in IndCl sections. E. Quantified cell counts show decreased numbers of ERβ+ GCL
neurons, (F.) RGCs, and (G.) increased numbers of apoptotic RGCs with IndCl treatment in vehicle treated
mice compared to normal and IndCl groups. n=8 mice per group. *P<0.05, **P<0.01, ***P>0.001,
****P>0.0001 ordinary one-way ANOVA with Dunnett’s multiple comparison test. Scale bar is 100µm for 20x
image in (B), 50µm for (C) and (D), and 25µm for all zoomed in images.

42
Microglia and Astrocyte Changes in Retina during EAE
The extent of microglia activation in the retina was examined by immunostaining
with calcium binding protein Iba-1 that is highly expressed in microglia. Retinal sections
from normal, EAE+vehicle and EAE+IndCl mice were investigated (Figure 3.3A, B).
EAE+vehicle retinal sections showed activated microglia with no significant increase in
Iba-1 cells as compared to normal. Similarly, retinal sections from EAE+IndCl showed a
decrease in activated microglial presence, with no significant increase in Iba-1
immunoreactivity as compared to EAE+vehicle.
To investigate the extent of gliosis in the retina, astrocytes were immunolabeled
with GFAP antibody. A significant increase in reactivity of astrocytes was observed in
EAE+vehicle retinal slices especially in the RGC layer as compared to normal slices
(Figure 3.3A, C). This indicates an increased expression of fibrillary acidic protein
accompanied with an activation of astrocytes triggered by inflammation and apoptosis of
RGCs. IndCl treatment decreased the number and reactivity of astrocytes in EAE+IndCl
groups as compared to EAE+vehicle groups (Figure 3.3A, C).

43
Figure 3.3: EAE retinas exhibit increased microglial and astrocytic activation which is attenuated with
IndCl treatment. A. Retina sections from groups shown in Figure 1A were collected 60dpi and
immunostained for Iba1 (green) and GFAP (red). Sections were imaged at 20x magnification with
representative images shown. Iba1 immunoreactivity is increased in the GCL, and GFAP immunoreactivity
in the GCL, IPL, INL, and OPL in EAE+vehicle sections compared to normal and EAE+IndCl sections. B.
Percent area quantification shows increased Iba1 and significantly increased GFAP (C.) immunoreactivity
in retina sections from vehicle groups compared to normal and IndCl groups.
EAE-induced leukocytic infiltration and demyelination, astrocytic activation and axon
damage in the optic nerve.
The optic nerve is a bundle of axons that originate from ganglion cells and enter
the brain. The optic nerve in humans and mice is initially unmyelinated inside the retina
and is heavily myelinated thereafter (De Moraes, 2013). Thus, the optic nerve represents a
model system to assess effects of inflammation and demyelination on myelinated and
unmyelinated axon health. Imaging studies in MS and pathology assessment in EAE have
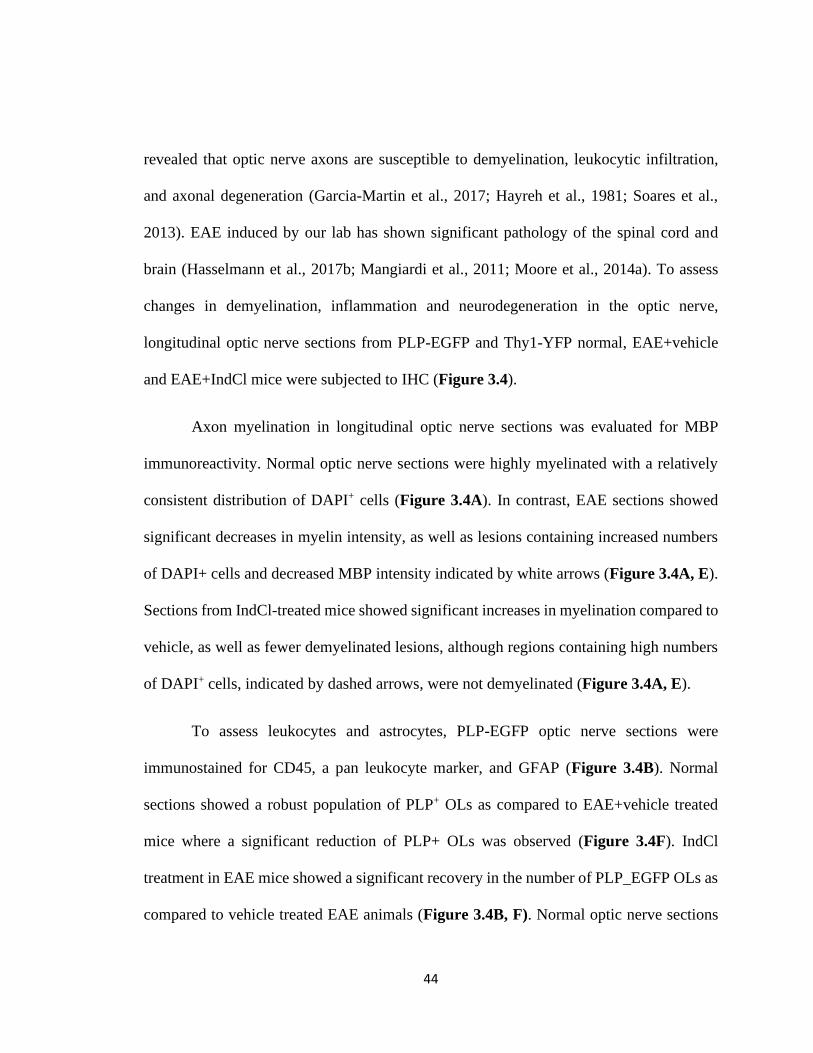
44
revealed that optic nerve axons are susceptible to demyelination, leukocytic infiltration,
and axonal degeneration (Garcia-Martin et al., 2017; Hayreh et al., 1981; Soares et al.,
2013). EAE induced by our lab has shown significant pathology of the spinal cord and
brain (Hasselmann et al., 2017b; Mangiardi et al., 2011; Moore et al., 2014a). To assess
changes in demyelination, inflammation and neurodegeneration in the optic nerve,
longitudinal optic nerve sections from PLP-EGFP and Thy1-YFP normal, EAE+vehicle
and EAE+IndCl mice were subjected to IHC (Figure 3.4).
Axon myelination in longitudinal optic nerve sections was evaluated for MBP
immunoreactivity. Normal optic nerve sections were highly myelinated with a relatively
consistent distribution of DAPI+ cells (Figure 3.4A). In contrast, EAE sections showed
significant decreases in myelin intensity, as well as lesions containing increased numbers
of DAPI+ cells and decreased MBP intensity indicated by white arrows (Figure 3.4A, E).
Sections from IndCl-treated mice showed significant increases in myelination compared to
vehicle, as well as fewer demyelinated lesions, although regions containing high numbers
of DAPI+ cells, indicated by dashed arrows, were not demyelinated (Figure 3.4A, E).
To assess leukocytes and astrocytes, PLP-EGFP optic nerve sections were
immunostained for CD45, a pan leukocyte marker, and GFAP (Figure 3.4B). Normal
sections showed a robust population of PLP+ OLs as compared to EAE+vehicle treated
mice where a significant reduction of PLP+ OLs was observed (Figure 3.4F). IndCl
treatment in EAE mice showed a significant recovery in the number of PLP_EGFP OLs as
compared to vehicle treated EAE animals (Figure 3.4B, F). Normal optic nerve sections

45
showed a negligible number of CD45+ leukocytes, and a baseline level of GFAP+
astrocytes. Vehicle treated EAE mice exhibited extensive CD45+ leukocyte
immunoreactivity and astrogliosis compared to normal (Figure 3.4B-C, G-H). Sections
from IndCl treated mice showed a significant decrease in CD45+ leukocytic
immunoreactivity but not astrogliosis, and an increase in PLP+ cells compared to vehicle.
Onset of demyelination in the optic nerve is associated with axon damage(Hobom
et al., 2004). To assess optic nerve axon health, optic nerve sections from normal, EAE +
vehicle and EAE + IndCl Thy1-YFP mice were imaged at 40x magnification. Normal optic
nerve sections showed coherent and linear Thy1-YFP+ axons (Figure 3.4D). However, in
vehicle-treated EAE mice a decrease in Thy1-YFP intensity along with a significant
increase in punctate, fragmented “axonal blebs” was observed (Figure 3.4D, I). IndCl
treatment, showed a modest recovery in Thy1-YFP intensity but showed similar number
of axon blebs as compared to EAE+vehicle group.

46
Figure 3.4: IndCl treatment attenuates demyelination, OL loss, and leukocytic infiltration but not
axonal degeneration in the optic nerve of EAE mice. A. Optic nerve sections from groups shown in Figure
3.1A, were collected 60 dpi immunostained for MBP (red) and DAPI (blue), and imaged at 20x. Normal
sections are highly myelinated. Sections from vehicle-treated mice exhibit less myelination overall as well
as regions completely absent of myelination and populated with clusters of DAPI positive cells (identified
by white arrows) indicative of lesions. IndCl treated sections show significant increases in myelination
compared to vehicle and very few unmyelinated regions, however clusters of DAPI positive cells (identified
by dashed white arrows) remain. B. PLP-EGFP (green) optic nerve sections were immunostained for CD45
(red) and DAPI. Sections were imaged at 20x magnification with representative images shown. CD45+
leukocytes are not evident in normal, however are abundant in vehicle, and minimally present in IndCl
sections. PLP+ OLs are abundant in normal, and depleted in vehicle but not IndCl sections. Insets show
magnified CD45+ and PLP+ cells in normal, vehicle, and IndCl sections. C. Optic nerve sections were
immunostained for GFAP (green) and DAPI. Sections from normal mice show some GFAP
immunoreactivity with astrocytes aligned along the horizontal axis of the optic nerve. Sections from vehicle-
and IndCl-treated mice have increased GFAP immunoreactivity with disruptions in the linear organization
of astrocytes. D. Thy1-YFP (green) optic nerve sections from groups shown in Figure 1A, were collected 60
dpi and stained with DAPI. Sections were imaged at 40x magnification with representative images shown.
Thy1-YFP axons show increased blebbing, swelling and transections in vehicle as compared to normal optic
nerve sections. IndCl sections exhibit blebbing and swollen axons as well, but more coherent axons than
vehicle. E. Quantification of all treatment groups shows significant decreases in MBP intensity, and numbers
of PLP+ OLs (F.) in the vehicle group compared to normal which is increased to baseline levels with IndCl
treatment. G. Vehicle sections show significantly increased CD45 intensity, GFAP intensity (H.), and Thy1+
axon blebs (I.) compared to normal. IndCl-treated sections show significantly decreased CD45
immunoreactivity, but not GFAP intensity or number of axon blebs compared to vehicle. *P<0.05, **P<0.01,
***P<0.001 ordinary one-way ANOVA with Kruskal-Wallis multiple comparison test. Scale bar is 100 µm.

47
Ultrastructure analysis of optic nerve axons in normal, vehicle-treated and IndCl treated
EAE groups.
To assess axon myelination integrity, ultrastructure EM analysis of the optic nerves
was performed. All myelinated and nonmyelinated axons within a given field were used to
assess mean ratio of inner axonal diameter to total outer diameter (g-ratio) (Figure 3.5A-
C) was calculated. Out of all the optic nerve axons measured by EM, vehicle-treated mice
showed increased numbers of nonmyelinated, 25 ± 4.6%, and thinly myelinated callosal
fibers compared with only 3 ± 0.78% nonmyelinated axons in normal mice. Nonmyelinated
axon numbers were decreased in Ind-Cl-treated mouse optic nerve sections to 13 ± 6%.
The mean g-ratio of vehicle-treated mice (0.90 ± 0.12) was higher than in normal mice
(0.86 ± 0.12), whereas g-ratios of Ind-Cl-treated groups (EAE+Ind-Cl, 0.87 ± 0.09 were
lower than in the vehicle-treated group (Figure 3.5A-C).

48
Figure 3.5: IndCl treatment improves myelination in the optic nerve of EAE mice. A. Electron
micrographs of optic nerve from normal, vehicle and IndCl treatment groups collected 60 dpi are shown.
Axon damage and demyelinated axons are present in EAE + vehicle sections. IndCl treated groups show
increased numbers of myelinated axons and overall improvement of axon morphology compared to vehicle.
B. Quantification of the number of unmyelinated axons reveals an 8-fold increase in vehicle compared to
normal. Optic nerves from IndCl-treated mice show an approximately 45% decrease in the number of
unmyelinated axons compared to vehicle. C. Calculated g-ratios are significantly increased in the vehicle
group compared to normal. This effect is attenuated in the IndCl group, representative of increased axon
myelination in the optic nerve. n=6 mice per group. *P<0.05, **P<0.01, ordinary one-way ANOVA with
Kruskal-Wallis multiple comparison test. Scale bar is 2.5 µm.
EAE-induced increases in optic tract leukocytes, astrocytes and axon demyelination, but
not axonal damage are attenuated by IndCl treatment.
Optic nerves from each eye leave the retina and travel toward the brain decussating
at the optic chiasm. RGC axons within the optic nerve remain in the ipsilateral region of
the chiasm and enter the brain via the ipsilateral optic tract or cross the chiasm and enter

49
on the contralateral side. In humans an estimated 53% of fibers cross to the contralateral
hemisphere whereas in rodents, approximately 97% crossover is evident (Herrera et al.,
2019; Kupfer et al., 1967). In the optic tract RGC axons remain heavily myelinated and are
susceptible to EAE-induced inflammation, demyelination, and axon damage.
To assay EAE effects on axon myelination in the optic tract, brain sections
corresponding to plates 43-45 of the Paxinos and Franklin brain atlas (Figure 3.6A-i) from
Thy1-YFP mice were immunostained for MBP and imaged in the dorsal region of the optic
tract (Figure 3.6A-ii) (Paxinos and Franklin, 2013). Optic tract sections showed significant
decreases in MBP immunoreactivity as compared to normal control optic tract section.
IndCl treatment attenuated the decrease in myelin intensity seen in EAE+vehicle groups
(Figure 3.6B, E).
EAE effects on inflammation and astrocytic activation in the optic tract were
assessed by immunostaining sections from Thy1-YFP mice for CD45 and GFAP, and
imaged in the dorsal region of the optic tract. CD45 and GFAP staining intensities were
significantly increased in vehicle groups compared to normal controls (Figure 3.6B, E).
IndCl treatment during EAE decreased GFAP intensity with no change in CD45 intensity
as compared to vehicle-treated mice.
To determine if RGC axonal degradation seen in optic nerve sections extended to
the optic tract, sections from Thy1-YFP mice were imaged in the dorsal region of the optic
tract. Axon fragmentation and blebbing was ubiquitous in sections from vehicle-treated

50
optic tract exons as compared to normal sections with coherent and intact Thy1+ axons.
Treatment with IndCl during showed increased axonal pathology similar to EAE+vehicle
groups (Figure 3.6D). Quantification of the punctate “axon blebs” showed significant
increases in vehicle-treated EAE groups which were not attenuated by IndCl treatmeent
(Figure 3.6H).
51
Figure 3.6: IndCl treatment ameliorates myelin loss and astrogliosis but not leukocytic infiltration in
the optic tract of EAE mice. A. Reference image of Paxinos plate 43 depicting a Nissl-stained mouse
coronal section(Paxinos and Franklin, 2013) (i). The area encompassed by the black dashed box highlights
the location of the optic tract within the larger section. Ten times magnified image of the optic tract region
in normal male Thy1-YFP mouse, with optic tract traced to highlight region of analysis (ii) B. Coronal
sections containing optic tract from normal, vehicle-treated, and IndCl-treated EAE male Thy1-YFP (green)
mice were collected 60 dpi. Sections were immunostained for MBP (red) and imaged at 20x magnification.
MBP immunofluorescence is decreased in vehicle sections, an effect mitigated by IndCl treatment. C.
Sections immunostained for CD45 (red), GFAP (green), and DAPI (blue) were imaged at 20x magnification.
Vehicle-treated groups show increased CD45 and GFAP immunoreactivity compared to normal. IndCl
groups show decreased GFAP but not CD45 immunofluorescence compared to vehicle. Insets show
magnified CD45+ cells (top) and GFAP+ astrocytes (bottom) in vehicle and IndCl groups. D. Thy1-YFP
sections were assessed for axonal integrity. Normal tissue shows coherent healthy axons however axon
damage as indicated by axon fragmentation and swelling is evident in the optic tract of EAE vehicle-treated
mice. Sections from IndCl-treated mice show a combination of fragmented swollen axons and intact axons.
Insets show magnified images of Thy1+ intact axons in normal, fragmented and swollen axons in vehicle,
and a combination of fragmented and intact axons in IndCl groups. E. MBP staining intensity is significantly
decreased in the vehicle group compared to normal but significantly increased in the IndCl group compared
to vehicle. F. CD45 intensity is significantly increased in the vehicle group compared to normal, and not
changed between vehicle and IndCl groups. G. GFAP staining intensity is significantly increased in vehicle
compared to normal, however the IndCl group shows decreased staining intensity compared to vehicle. H.
The number of Thy1+ axon blebs is minimal in normal, significantly increased in vehicle but not attenuated
in IndCl treatment groups. n=4 mice per group. *P<0.05, **P<0.01, *** P<0.001, ordinary one-way
ANOVA with Kruskal-Wallis multiple comparison test. Scale bar is 100 µm.

52
EAE pathology in the dLGN is not significantly altered by IndCl treatment.
RGC axons from the retina project to a number of synaptic targets in the visual
system, one of which is the LGN. In humans the LGN is composed of six distinct layers
with interleaved koniocellular regions. Retinal projections synapse on specific layers
depending on the originating eye, location in the retina and RGC type. In contrast, the
mouse LGN is composed of three individual regions: the ventral LGN, intergeniculate
nucleus, and dLGN. While the ventral and intergeniculate nuclei are also involved in the
visual system specifically the efferent visual pathway, the primary target for the afferent
visual system in the mouse is the dLGN. The dLGN is an important processing hub and
relay station which sends and receives geniculo-cortical projections to the visual cortex
where the final visual image is formed (Seabrook et al., 2017).
In order to evaluate the effect of EAE on the dLGN, coronal sections were obtained
from Thy1-YFP mice, corresponding to plates 51 to 53 of the Paxinos and Franklin mouse
brain atlas (Figure 3.7A-i)(Paxinos and Franklin, 2013). Sections were immunostained,
then imaged at 40x magnification in four locations within the dLGN (Figure 3.7A-ii).
Results from immunohistochemical analysis in each of the four regions were averaged for
quantification.
Axon myelination in the dLGN was assessed in brain sections from various groups.
Compared to normal sections which showed moderate myelination, MBP intensity from
vehicle treated sections revealed decreased myelination with a small but non-significant
increase in sections from IndCl-treated mice (Figure 3.7B, D).

53
Leukocyte assessment with CD45 immunoreactivity showed minimal presence in
normal sections as compared to EAE+vehicle group (Figure 3.7C, E). IndCl treatment did
not change the increase in CD45 intensity as compared to vehicle-treated EAE group
(Figure 3.7E). Astrocyte activation was observed in EAE+vehicle group as compared to
normal controls. However, IndCl treatment maintained the increase in astrocyte activation
similar to EAE+vehicle group (Figure 3.7F).

54
Figure 3.7: IndCl treatment improves myelin loss but not astrogliosis in the dLGN. A. Reference image
of Paxinos plate 51 depicting a Nissl-stained mouse coronal section(Paxinos and Franklin, 2013) (i). The area
encompassed by the black dashed box highlights the location of the dLGN within the larger section. Ten
times magnified image of the LGN region in normal Thy1-YFP (green) male mouse section stained with
MBP (red) and DAPI (blue), with dLGN traced to highlight region of analysis (ii). For immunohistochemical
analysis four 40x images were taken in the areas denoted by the yellow boxes, analyzed individually, then
averaged into one result for that mouse. B. Coronal sections containing dLGN were obtained from normal,
vehicle-treated, and IndCl-treated Thy1-YFP male mice 60 dpi and stained for MBP (green). Decreased MBP
immunoreactivity is evident in vehicle sections compared to normal, and is not significantly increased in the
IndCl group. C. Normal sections stained for CD45 (red) and GFAP (green) show few CD45+ cells, whereas
vehicle and IndCl sections show large numbers of CD45+ cells. GFAP immunoreactivity is minimal in normal
sections but high in vehicle and IndCl sections. D. Quantified MBP staining shows a significant decrease in
MBP intensity in vehicle sections compared to normal, which is not significantly changed in the IndCl group.
E. Quantified CD45 staining shows trends of increasing intensity in vehicle mice compared to normal which
do not reach significance. F. GFAP immunoreactivity is significantly increased in vehicle compared to
normal, but IndCl treatment effects are not different from vehicle. n=4 mice per group. *P<0.05, **P<0.001,
ordinary one-way ANOVA with Kruskal-Wallis multiple comparison test.

55
EAE-induced axon demyelination in V1
In mice and humans, the visual cortex is a major processing center for
thalamocortical inputs. It synthesizes information provided by the anterior regions of the
visual system described in this text, as well as other non-image forming areas and produces
a final image in the brain. Furthermore, the visual cortex is highly myelinated and so, is
particularly vulnerable to EAE-induced demyelination.
Axon myelination and neuronal changes were assessed in V1 of Thy1-YFP coronal
sections corresponding to plates 52-54 (Figure 3.8A-i) (Paxinos and Franklin, 2013).
Sections were analyzed in the demarcated region of interest which included layers two
through six (Figure 3.8A-ii). V1 axons in normal control sections were highly myelinated
in all layers analyzed but showed lower levels of myelination in more dorsal layers such as
layer 2. EAE+vehicle V1 underwent significant axon demyelination as assessed by a
decreased MBP mean intensity compared to normal group (Figure 3.8B, D). IndCl
treatment during EAE, significantly attenuated myelin loss observed in vehicle sections by
>6 fold (Figure 3.8B, D).
Thalamocortical neurons in the LGN project to layer 4 and synapse on resident
spiny stellate neurons of V1, as well as layers 5 and 6(Constantinople and Bruno, 2013).
Spiny stellate neurons are thought to preprocess afferent visual information and transfer it
to pyramidal neurons in layer 2-3 for further processing(Gilbert and Wiesel, 1979). Signals
from layer 2-3 propagate to layer 5 neurons which drive the function of many efferent
visual system nuclei, as well as extrastriate regions which further tune the visual

56
output(Gilbert and Wiesel, 1979). The complexity of visual processing occurring in layer
2-3 suggests that these pyramidal neurons contribute significantly to the formation of the
final visual image.
Thy1-YFP mice express Thy1 in a subset of cortical pyramidal neurons(Porrero et
al., 2010). In the B6.Cg-Tg(Thy1-YFP)16Jrs/J strain used for these studies, both layer 5
and layer 2/3 pyramidal neurons in the visual cortex expressed the fluorescent protein. To
assess the effect of EAE on these layer 2-3 cells, Thy1+ neurons were quantified in sections
from all treatment groups. Normal sections showed significant numbers of Thy1+
pyramidal neurons with intact apical dendrites (Figure 3.8C). Sections from EAE+vehicle
groups did not show significant changes to the number of Thy1+ cell bodies, however fewer
apical dendrites were evident (Figure 3.8C, E). EAE+IndCl group did not show any
difference in the number of Thy1+ cell bodies compared to normal, but did show
improvements in remaining apical dendrites.
PV positive interneurons regulate neuronal group firing and are important for
maintaining spike timing in the visual cortex (Agetsuma et al., 2018). PV interneuron
inactivation results in decreased synchrony of neuronal networks. To determine if EAE
engendered changes in PV+ neurons in the visual cortex, PV+ neurons were imaged and
counted between layers 2 and 5. No significant differences in the number of PV+ cells were
observed between groups (Figure 3.8C, F).

57
Figure 3.8: Treatment with IndCl attenuates myelin loss in the visual cortex of EAE mice A. Reference
image of Paxinos plate 51 depicting a Nissl-stained mouse coronal section(Paxinos and Franklin, 2013) (i).
The area encompassed by the black dashed box highlights the location of the visual cortex within the larger
section. Four times magnified image of the visual cortex region in normal Thy1-YFP (green) male mouse
section, with the region of analysis traced (ii). B. Coronal sections immunostained for MBP (green) in Figure
3.6D were imaged at 10x magnification and analyzed in the region of interest in (Aii) corresponding to V1
layers 2-6. Vehicle sections show decreased MBP immunoreactivity compared to normal. IndCl sections
showed increased MBP staining compared to vehicle. C. Thy1-YFP coronal sections were immunostained
for PV (red) and DAPI (blue) and imaged at 20x magnification in the visual cortex. Magnified split images
showing Thy1 (i), and PV (ii) for all treatment groups, show no difference in Thy1+ or PV+ cell bodies
between groups, however Thy1+ axonal projections in vehicle sections are less numerous than in normal. D.
MBP staining intensity was quantified in the visual cortex. Sections from vehicle mice show significantly
lower MBP staining intensity compared to normal, which is increased in IndCl treated groups compared to
vehicle. E-F. The number of PV+ and Thy1+ neurons was quantified in layers 2-3 of V1, but no significant
differences between groups are observed. n=4 mice per group. *P<0.05, **P<0.001, ordinary one-way
ANOVA with Kruskal-Wallis multiple comparison test. Scale bar is 200µm.

58
EAE induced decreases in retinal thickness as measured by OCT
OCT is an in vivo non-invasive imaging modality which can provide micron level
resolution of thin structures such as the retina. It is commonly used in clinical and
preclinical settings to resolve individual retinal layers and pathological changes to those
layers. MS patients show decreased RNFL thickness in early and late stages of disease
(Backner et al., 2019; Beck et al., 1992). Progressive decreases in RNFL thickness have
also been demonstrated in the early stages of EAE(Hein et al., 2012).
Changes in retina layer thickness during EAE was assessed in a separate group of
C57Bl/6 mice at 40dpi. The temporal retina was imaged approximately 0.3 mm lateral to
the optic nerve (Figure 3.9A). Unbiased and accurate automatic segmentation of OCT
images by system software was used to consistently demarcate the different layers of the
retina and minimize bias (Figure 3.9B). The GCL and IPL were combined for analysis due
to the difficulty associated with differentiating the two layers using OCT. Similar to OCT
analysis for human patients, retina interneuron layers (IPL+INL) and PLs (ONL+PR) were
grouped for simplicity (Al-Louzi et al., 2016; Walter et al., 2012).
Whole retina measurements did not show significant differences between normal
and EAE treatment groups (Figure 3.9C). Vehicle-treated EAE mice showed a significant
decrease in RNFL and the ONL+PR layer thickness as compared to normal that was not
attenuated in EAE+IndCl treated group (Figure 3.9C). Surprisingly, a significant increase
in the RPE thickness of vehicle-treated EAE group compared to normal was observed.

59
GCL+IPL and INL+OPL layers were not significantly different between groups (Figure
3.9C).
Figure 3.9: IndCl treatment does not affect thinning of the RNFL or changes in the thickness of
posterior retinal layers during EAE. A. Representative OCT retina scans of C57Bl/6 normal, EAE +
vehicle, and EAE + IndCl mice at 40 dpi, with optic nerve, choroid, vitreous, temporal and nasal regions
demarcated in normal image. OCT scans show no obvious differences in retina morphology between
treatment groups. B. The region indicated by the dashed rectangular box in (A), just lateral to the optic nerve,
was imaged and segmented into individual layers to detect small changes in individual layer thicknesses that
were not readily observable by eye. Automatic segmentation software demarcated and calculated individual
layer thicknesses of the whole retina, RNFL, IPL, INL, OPL, ONL, the outer limiting membrane, the
photoreceptor outer and inner segments (PR), RPE, and choroid. C. Quantification of retina layer thicknesses
shows no differences in whole retina, combined GCL+IPL, or combined ONL+PR layers between groups.
Vehicle mice show decreased RNFL and ONL+PR, but increased RPE thickness compared to normal. IndCl
treated mice show no change in RNFL, ONL+PR, and RPE layer thickness compared to vehicle. n=14 eyes,
6 mice per group. *P<0.05, **P<0.01, ordinary one-way ANOVA with Kruskal-Wallis multiple comparison
test. Scale bar is 200µm.
EAE induced changes in retina and visual pathway as measured by ERG and VEP
As demonstrated in the preceding histological analysis of afferent visual system
nuclei and tracts, significant demyelination, inflammation, and axonal damage is present

60
in the visual pathway during EAE, some of which IndCl treatment attenuates. However,
whether these effects result in functional changes to visual performance required further
assessment. The ERG provides an assessment of retinal function and has been well
characterized. The initial downward deflection of the voltage is identified as the a-wave
and is thought to result from photoreceptor firing, while the fast upward deflection is
identified as the b-wave and is generated by some retinal interneuron subtypes, Müller glia,
and RGC firing (Brown, 1968; Miller and Dowling, 1970; Smith et al., 2014). When mice
are dark-adapted, ERG and VEP responses are primarily driven by rod pathways (Ridder
Iii and Nusinowitz, 2006).

61
To characterize the functional consequence of retinal pathology during EAE, retinal
function in mice was assessed by recording ERGs in live, anesthetized, and dark-adapted
C57Bl/6 mice at 40 dpi. ERG traces from normal mice show a characteristic downward
deflection of the a-wave of about 200µV in amplitude, then an immediate ~500µV increase
in amplitude characteristic of the b-wave, followed by a gradual return to baseline (Figure
3.10A). Vehicle treated EAE mice show similar ERG a-wave amplitudes, latencies, and b-
wave latencies compared to normal, but a significant decrease in b-wave amplitudes
(Figure 3.10B-D). IndCl treated EAE mice did not show any significant differences in
ERG parameters compared to vehicle.
Figure 3.10: EAE mice show few improvements in retina function with IndCl treatment as measured
by ERGs. A. Retina function in female C57Bl/6 mice was assessed by recording ERGs from normal, EAE
+ vehicle, and EAE+ IndCl mice at 40 dpi. Recording silver thread electrodes were placed on the cornea,
reference needle electrodes in the snout, and a ground needle electrode in the tail. Sample ERG traces from
treatment groups are shown with a-wave and b-wave peaks demarcated by the black arrows. B. No significant
changes in a-wave amplitudes, a-wave latencies or b-wave latencies are observed between groups. Retinas
from vehicle-treated mice show decreased b-wave amplitudes compared to normal controls, and IndCl
treatment does not change this effect. *P<0.05, **P<0.001, ordinary one-way ANOVA with Kruskal-Wallis
multiple comparison test.

62
The VEP is less characterized than the ERG and is accepted to be a assessment of
afferent visual function as a whole. Thus, dysfunction in any part of the visual system
affects recorded VEPs (Ridder Iii and Nusinowitz, 2006). VEP traces have an initial
upward deflection described as the P1 peak, followed by a sharp downward deflection
described as the N2 peak, and a return to baseline. Amplitude changes are primarily caused
by axonal damage neuronal dysfunction (Pastare et al., 2013), whereas latency changes are
thought to arise from primarily demyelinating events(You et al., 2011).
Functional effects of visual pathway pathology were measured by recording VEPs
using subdermal electrodes resting on the skull above the visual cortex. In normal mice,
VEPs showed an approximately 30µV positive deflection, then fast 50µV decrease in
voltage, followed by a return to baseline (Figure 3.11A). Vehicle-treated EAE mice
showed significant 50% decreases in P1 and N2 amplitudes compared to normal, but no
change in latency (Figure 3.11B). IndCl treatment during EAE had minimal effects on
VEP parameters, P1 and N2 amplitude and N2 latency, as compared to EAE+ vehicle.
However, P1 latency was significantly decreased in EAE+IndCl treated mice as compared
to EAE+vehicle mice.

63
Figure 3.11: EAE mice exhibit severe deficits in visual function as measured by VEPs, which are not
changed by IndCl treatment. A. Visual function in female EAE mice was assessed by recording VEPs from
groups described in Figure 3.10A. Recording needle electrodes were placed subdermally above the visual
cortex, reference needle electrodes in the snout, and a ground needle electrode in the tail. Sample VEP traces
from all treatment groups are shown with P1 and N2 components indicated by the black arrows B. P1 and
N2 amplitudes are significantly decreased in vehicle compared to normal by approximately 50%, an effect
not changed by IndCl treatment. Vehicle mouse P1 and N2 latencies are not significantly different from
normal, however IndCl treatment reduces P1 latency compared to vehicle. n=8 eyes, 4 mice per group.
*P<0.05, **P<0.001, ordinary one-way ANOVA with Kruskal-Wallis multiple comparison test.

64
Discussion
This is the first study to assess the therapeutic potential of the ERβ ligand IndCl for
attenuating visual pathway pathology in EAE. Our results show extensive demyelination,
axon damage, and inflammation in visual pathway white matter tracts with corresponding
functional deficits during EAE. Similar to previously published data on the remyelinating
and neuroprotective properties of ERβ ligands within the CNS (Khalaj et al., 2013; Khalaj
et al., 2016; Moore et al., 2014b), IndCl treatment attenuated neurodegeneration in the
retina, and improved myelination in almost all regions surveyed, but was not
immunosuppressive (Figure 3.12). These effects were not sufficient to significantly
improve EAE-induced morphological changes in OCTs or functional outcomes in ERGs.

65
Figure 3.12: Model of visual pathway dysfunction and IndCl effects on visual system during EAE. A. Schematic
depicting normal visual pathway. (i) Photoreceptors form synapses with bipolar cells which then synapse onto RGCs.
Photoreceptor/bipolar cell and bipolar cell/RGC synaptic transmission is modulated by amacrine and horizontal cells.
Müller glia span the neural portion of the retina and interact with the neural retina. ERGs amplitudes are robust and
timely. (ii) Mature OLs myelinate most RGC axons in the optic nerve and optic tract thereby providing trophic support
and improving axon conduction. (iii) RGC axon terminals form synapses with thalamocortical neurons in the dLGN.
Myelinated thalamocortical neurons in the dLGN send projections to V1. (iv) With no disruption of the afferent visual
system, VEP amplitudes are robust and timely. B. Schematic depicting EAE visual pathway. (i) In EAE, RGC
cell bodies and their axons comprising the retinal nerve fiber layer are damaged. ERG amplitudes are
decreased, but response latencies remain similar to normal. EAE-induced effects on photoreceptors, retinal
interneurons, and Müller glia effects require further study. (ii) Breakdown of the blood-brain barrier during
EAE results in leukocytic infiltration into the optic nerve and optic tract. The inflammatory milieu including
pro-inflammatory factors from lymphocytes macrophages, and other immune cells leads to astrocytic
activation, myelin loss, axonal swelling and axonal degradation. (iii) Axonal degradation in anterior regions
of the visual pathway likely leads to a loss of synaptic input in the dLGN. Leukocytic infiltration into the
dLGN leads to a loss of myelination. Thalamocortical projection neurons of the dLGN are likely
demyelinated decreasing signal transmission to the visual cortex. (iv) Significant defects in the anterior
portion of the visual pathway, and a loss of myelination in the visual cortex lead to decreased VEP amplitudes.
C. Schematic depicting proposed effects of IndCl on the EAE visual pathway. (i) IndCl treatment protects
RGC somas but does not affect intraretinal RGC axons comprising the retinal nerve fiber layer. ERG
amplitudes are not improved with treatment. IndCl effects on photoreceptors, retinal interneurons, and Müller
glia need further investigation. (ii) IndCl treatment results in partial decreases in leukocytic presence in the
optic nerve, and astrocytic activation in the optic tract. IndCl also induces astrocytic production of the
neuroprotective chemokine CXCL1 and decreases IFN-γ production, thus promoting OL recruitment,
survival and differentiation(Karim et al., 2018a). This may be the mechanism by which IndCl promotes
myelination in the optic nerve and optic tract. This effect is not sufficient to prevent RGC axon degradation.
(iii) Persistent axonal damage in anterior visual pathway, even with robust remyelination, likely leads to a
loss of synaptic input to the dLGN. Minimal remyelination in the dLGN indicates that EAE induced deficits
to thalamocortical projections are likely not improved by IndCl treatment. (iv) Although the visual cortex
and anterior regions of the visual pathway show improved myelination with IndCl treatments, significant
axonal damage results in no improvements in VEP amplitudes and minimal effects to VEP latencies.
66
Retina
IndCl therapeutic treatment significantly attenuated RGC loss indicating a
neuroprotective role in the retina. Because these RGCs expressed ERβ, it is possible that
this effect was mediated either directly through ligand binding to RGC ERβs or indirectly
through binding to estrogen receptors on other cell types such as microglia or astrocytes.
Although few other studies have evaluated the effect of ERβ-specific agonists on RGC
health, many studies have looked at estrogenic compounds which target multiple ER types
concurrently. For instance, estrogen treatment is well accepted to have neuroprotective
effects on RGC survival in animal models of glaucoma and optic nerve transection
(Nakazawa et al., 2006; Prokai-Tatrai et al., 2013; Russo et al., 2008). These effects have
been shown to be partially mediated by reduction of mitochondrial-induced oxidative stress
in response to optic nerve axon damage(Kanamori et al., 2010a; Li et al., 2013; Li et al.,
2016; Lieven et al., 2006; Wang et al., 2015). Estrogenic compounds including ERβ-
specific and ERα-specific agents have also been shown to exert anti-oxidative and anti-
inflammatory effects through indirect mechanisms associated with astrocyte and microglial
signaling during inflammatory challenge with lipopolysaccharide(Bruce-Keller et al.,
2000; Cerciat et al., 2010; Kipp et al., 2007; Smith et al., 2011). Furthermore, estradiol can
act directly on astrocytes to induce release of neuroprotective agents and growth
factors(Arevalo et al., 2010; Azcoitia et al., 2010). Thus IndCl-induced RGC survival
within the retina was likely a result of various neuroprotective mechanism conferred by the
ERβ ligand.

67
Surprisingly RGC protection by IndCl did not translate to RGC axonal survival
within the RNFL. This may partially be because IndCl treatment did not improve axonal
health in the optic nerve and optic tract, even in the presence of robust OL survival and
myelination. Retrograde axonal degradation into the retina and subsequent thinning of the
RNFL is a well-accepted effect of optic nerve damage(Huang et al., 2018; Kanamori et al.,
2010b; Nagata et al., 2009), and is characteristic of our observations in the EAE optic
nerve. Although IndCl effected partial changes to microglial and astrocytic activation in
the optic nerve and tract, these cell types remained relatively active. Activated microglia
and astrocytes have been implicated in optic nerve degeneration in EAE, and in mouse
models of glaucoma (Feliciano-Sanchez et al., 2019; Mabuchi et al., 2003; Manogaran et
al., 2018; May and Mittag, 2006; Yuan and Neufeld, 2001). Thus, it is likely that although
RGC bodies were protected in the retina, the RNFL remained under significant stress from
ongoing RGC axonal degradation, inflammation, and astrogliosis in the optic nerve and
optic tract, and thus was not affected by IndCl treatment. However further studies are
needed to elucidate IndCl mechanisms of action on RGC and RGC axon survival.
Immunomodulation
IndCl did not extensively suppress leukocytic presence and astrocyte reactivity
during EAE, however it did exert moderate changes in select areas of the visual pathway,
indicating an immunomodulatory profile. We have previously shown that although IndCl
may not greatly modify the extent of leukocytic infiltration into the CNS it decreases the
production of pro-inflammatory cytokines by peripheral leukocytes such as TNFα, IFNγ

68
and CXCL10, while increasing production of anti-inflammatory cytokines like CXCL1
(Karim et al., 2018b; Moore et al., 2014b). Over-expression of IFNγ exacerbates EAE by
driving T-cells to a pro-inflammatory phenotype, enhancing cytokine and chemokine
secretion (Imitola et al., 2005), promoting OL death and inhibiting myelination(Balabanov
et al., 2006). Furthermore, intraocular injection of IFNγ increases latency measurements of
VEPs while exerting subtle changes in myelinated visual system axons(Brosnan et al.,
1989). CXCL10 is an IFNγ-inducible T cell and monocyte chemoattractant that promotes
neuronal(Sui et al., 2006) and OL apoptosis(Tirotta et al., 2011), while CXCL1 is a
neutrophil chemoattractant which attenuates EAE severity, axonal degeneration and
improves myelination(Omari et al., 2009). It is possible that similar to our previously
reported effects in the spinal cord, IndCl treatment attenuated IFNγ and CXCL10
production while promoting CXCL1 production within the visual system, thus mitigating
OL death and myelin loss (Karim et al., 2018b). Taken together, this indicates that
therapeutic IndCl treatment may have promoted remyelination partially by exerting
immunomodulatory effects on infiltrating and resident leukocytes, as well as astrocytes.
However, further research is necessary to evaluate these hypotheses.
Remyelination
The autoimmune profile of MS and EAE have long supported the importance of
immunomodulation in MS therapies, a requirement potentially addressed by IndCl.
However, there are a number of immunomodulatory MS therapies which, while effective
for managing MS in relapsing-remitting stages of the disease, are often inadequate in

69
preventing progression to chronic neurodegenerative stages(2001; Kapoor et al., 2018;
Ontaneda et al., 2017; Panitch et al., 2004; Wolinsky et al., 2007). Thus,
immunomodulatory remyelinating therapies have been increasingly studied.
In the current studies, IndCl was shown to remyelinate almost all white matter tracts
in the afferent visual pathway. Furthermore, we have previously demonstrated the
remyelinating capability of IndCl and other ERβ ligands in the corpus callosum and spinal
cord(Karim et al., 2018b; Karim et al., 2019a; Moore et al., 2014b). IndCl-induced
remyelination in the corpus callosum and spinal cord was also associated with improved
functional recovery in the motor system. However, in the visual system, EAE-induced ERG
and VEP functional deficits were not attenuated with treatment. This lack of functional
efficacy in the visual pathway was associated with ongoing axonal damage which was
similarly not improved with IndCl.
A possible reason for differential functional effects in motor and visual systems is
the timing of therapeutic treatment. In both studies, IndCl treatment is administered
therapeutically at peak clinical disease, between 16 and 24 dpi. This is an ideal therapeutic
window for attenuating motor dysfunction, but perhaps not for visual deficits. Studies in
other animal models for EAE have shown, that inflammatory infiltration to visual pathway
white matter tracts occurs as early as 7-8 dpi, demyelination 1-2 days after, and axonal
degeneration and neuron loss at 14 dpi, all prior to quantifiable motor deficits (Hu et al.,
2006; Shindler et al., 2008). Furthermore, neurodegenerative damage in visual pathway
nuclei and tracts is quite severe and often has trans-synaptic anterograde and retrograde

70
effects. For instance, optic nerve transection in rodents not only results in upstream RGC
death(Berkelaar et al., 1994), but also causes apoptosis of synaptic targets in the LGN(You
et al., 2012). Similarly, ablation of a region in the visual cortex induces apoptosis of
geniculocortical projection neurons(Al-Abdulla and Martin, 2002) as well as RGC loss
(Cowey, 1974) in animal models, while stroke-induced visual cortex damage in humans
causes progressive thinning of the RNFL (Jindahra et al., 2012). Thus, damage to any
visual pathway area has significant upstream and downstream neurodegenerative effects.
Given this disease profile, irrecoverable neuronal damage had likely occurred between the
optic tract, LGN, and visual cortex prior to IndCl treatment start, thus rendering
improvements in VEPs and ERGs relatively difficult to attain.
Studies which have assessed the capability of other remyelinating therapeutics to
attenuate functional deficits in VEPs have also shown meager improvements with
therapeutic treatment in animal models. Similar to IndCl (Karim et al., 2018b; Moore et
al., 2014b; Young et al., 2012), the oral sphingosine 1-phosphate receptor modulator,
fingolimod, was shown to improve EAE mediated paralysis, decrease demyelination in the
brain and spinal cord, and improve conduction in the CNS with therapeutic
treatment(Balatoni et al., 2007). However, although prophylactic fingolimod improved
VEP latencies, therapeutic treatment resulted in no identifiable recovery during EAE.
Similar to IndCl, fingolimod, glatiramer acetate, and interferon β-1b, other therapeutics
currently approved for MS treatment, have been shown to have remyelinating
effects(Aharoni et al., 2008; Miron et al., 2010; Njenga et al., 2000) which do not translate
to significant improvements in VEPs in EAE.

71
Studies in humans give conflicting reports on the efficacy of currently approved
MS drugs for alleviating VEP deficits in MS patients. Glatiramer acetate(Major et al.,
2013) and Interferon (IFN) β-1a(Liscic and Brecelj, 2004) show no improvement in VEPs,
while IFN β-1b(Anlar et al., 2003) and Natalizumab(Meuth et al., 2011) attenuate visual
dysfunction in the relapsing remitting form of MS. Some studies have shown
improvements in VEPs with Mitoxantrone(Hobom et al., 2004) and 4-aminopyridine
treatment(Jones et al., 1983), however it is unclear which patients in those studies had
chronic progressive and which had relapsing remitting MS. It is possible that the poor
improvements in VEPs measured in animal models and the conflicting therapeutic effects
reported in MS patients may be due to variable severity of visual pathway neuronal and
axonal pathology occurring prior to treatment start.
In this study, we established a preclinical drug assessment paradigm capable of
screening therapeutics for functional efficacy, remyelinating and neuroprotective potential
in the visual system. Because visual pathway dysfunction has significant detrimental
effects to the quality of life experienced by MS patients, understanding the
pathophysiology of the visual pathway in demyelinating disease is vital to therapeutic
development. Furthermore, correlating minimally invasive functional assessments to
pathological changes in the CNS during treatment has the potential to minimize drug
discovery time, and improve treatment procedures for patients. In this spirit, we assessed
the efficacy of IndCl, and demonstrated that IndCl had remyelinating effects across the
visual system, but did not attenuate axon degradation nor incur functionally relevant
improvements. We hypothesize that this lack of efficacy results from missing the critical

72
therapeutic window for improving visual function. Determining this critical window is
crucial for improving visual outcomes in MS. Thus, there is a need for longitudinal studies
of visual pathway pathology and axon damage in MS and its animal models.
73
Chapter 4: Posterior visual pathway pathology is a
significant aspect of EAE pathophysiology.
4.1 Introduction
The visual pathway is highly susceptible to MS induced neurodegenerative events,
partially due to its highly myelinated nature. Visual pathway pathology is commonly
assessed in MS patients, using in vivo techniques such as MRI, OCT, visual acuity tests,
ERGs, and VEPs (Backner and Levin, 2018; Balcer et al., 2017; Graham and Klistorner,
2017; Kuchling et al., 2017; Monsalve et al., 2018). However, although in vivo assays of
structural changes and functional deficits provide significant insights into disease
progression within the visual pathway, they cannot be used to probe the cellular and
molecular changes underlying macroscopic pathology. Furthermore, because no highly
specific biomarker for MS has been identified, patients are primarily diagnosed with MS
after significant motor, visual, or cognitive deficits separated in space and time have
appeared (McDonald et al., 2001; Poser and Brinar, 2004; Solomon and Corboy, 2017).
Thus, it is currently impossible to glean early information about the onset and development
of MS visual pathology. In contrast, post-mortem histological assays of MS patients, may
allow for the assessment cellular and molecular damage in the visual system, however only
at the time of death(Evangelou et al., 2001; Kerrison et al., 1994).
The use of animal models seeks to counter some of these disadvantages, and allows
for longitudinal assessments of visual pathway pathology before disease onset and
throughout disease progression. Importantly, they allow the evaluation of structural

74
changes and functional deficits at the macroscopic, cellular, and molecular level. However,
although there is significant evidence to indicate extensive posterior visual system (optic
tract, LGN and V1) pathology in MS patients, most longitudinal studies in the visual
system using animal models have been in the retina and optic nerve, anterior compartments
of the visual system.
Specifically, MS patients present with significant decreases in LGN and occipital
lobe volume, as well as lesions in in the optic radiations(Balk et al., 2015; Gabilondo et al.,
2014; Gabilondo et al., 2017; Papadopoulou et al., 2019; Shen et al., 2019). However, there
has only been one study by Araújo and colleagues assessing posterior visual system
pathology in the CPZ demyelination animal model for MS (Araujo et al., 2017), and
another in EAE looking at the occipital lobe(Diem et al., 2008). This especially surprising
because a number of studies in animal models correlate anterior visual pathology with
deficits in VEPs or visual functional tests such as visual acuity, and optokinetic nystagmus
(Arezzo et al., 1988; Castoldi et al., 2019; Gambi et al., 1987; Henderson et al., 2008;
Larabee et al., 2016; Lin et al., 2014; Nishioka et al., 2017). VEPs are recorded from V1
and provide an assessment of visual deficits throughout the anterior and posterior afferent
visual pathway (Creel, 1995a). Similarly, evaluations of visual cognition rely on the
function of all nuclei and tracts within the afferent visual system, and a number within the
efferent system. Thus, studies investigating longitudinal visual pathway pathology in
animal models for MS, specifically within the posterior visual system, are crucial.
The previous chapter discussed assessing anterior and posterior visual pathway
dysfunction in the EAE mouse model of MS, and the effectiveness of treatment with a

75
potent remyelinating agent for attenuating visual functional deficits. Therapeutic treatment
with the remyelinating agent IndCl starting at peak EAE disease, although robustly
successful in remyelinating almost all white matter tracts in the afferent visual pathway,
did not exert any functional improvements. This was in sharp contrast to its efficacy in
improving motor function(Karim et al., 2019a; Moore et al., 2014b). The differences
between the time course of motor degeneration (significant motor dysfunction is observed
15 to 21 dpi) and visual pathology (occurring between 7 to 14 dpi) indicate that treatment
with IndCl at peak disease may have missed a critical therapeutic window for attenuation
of visual dysfunction.
In order to investigate EAE-induced damage to the posterior visual system, and to
identify potential therapeutic windows, we assessed longitudinal posterior visual pathway
pathology in EAE. Demyelination, axon damage and functional deficits were observed in
the EAE model beginning as early as 15 dpi. However, axon damage was not observed to
be severe until peak disease around 27dpi. This indicated that a critical therapeutic window
for IndCl treatment in EAE may exist soon after disease onset and at maximum, before
peak clinical disease.

76
4.2 Methods
Twelve 8-12-week-old Thy1-YFP and PLP-EGFP male mice on a C57Bl/6
background were induced with EAE as has been described(Hasselmann et al., 2017a). EAE
disease onset occurred between 9 and 12 dpi, and reached peak severity between 20 and
23dpi, after which point clinical disease was slightly attenuated from a score of 3 at peak
disease to between 2 and 3 throughout late disease and euthanasia at 47 dpi (Figure 4.1A).
Mice were handled daily to determine clinical scores, and if necessary, to palpate bladders
or inject saline for hydration. Mice underwent in vivo ERGs and VEPs at 8-9 dpi, 21dpi,
and 40 dpi, and OCT at 13dpi, 20dpi and 38dpi (Figure 4.1B). Four EAE mice were
perfused for IHC at 3 different timepoints: 15 dpi, 26 dpi, and 47dpi. Ten PLP-eGFP and
four Thy1-YFP mice served as controls and were not euthanized for IHC until experiment
end.

77
Figure 4.1: Experimental design for longitudinal assessment of visual pathway pathology in EAE. A.
EAE was induced in 12-week-old male Thy1-YFP and PLP-eGFP mice with C57Bl/6 background. EAE
induction involved initial immunization with MOG 35-55 peptide in CFA, IP injection of PTX on day 0, a
second PTx injection at 2 dpi, and a final MOG+CFA immunization at 7dpi (i). EAE clinical scores (red)
show disease onset occurring between 9 and 12dpi, peak disease between 20 and 23dpi, and slight decreases
to average clinical score in the chronic disease stage between 25dpi and euthanasia at 47 dpi (ii). Clinical
scores of normal mice (black) remain 0 through entirety of experiment. B. After EAE induction, in vivo visual
assessments were performed around disease onset (i), peak disease (ii), and chronic disease stages (iii). ERGs
and VEPs (black) were performed at 8-9 dpi, 21dpi, and 40 dpi, and OCT (green) at 13dpi, 20dpi and 38dpi.
Four mice per timepoint were euthanized for IHC (red) just after onset (i), peak disease (ii) and late disease
(iii). Ten PLP-eGFP and four Thy1-YFP mice served as controls and were not euthanized for IHC until
experiment end.

78
4.3 Results
Posterior visual system damage is a key feature of MS pathophysiology. However,
to date there have been very few investigations into posterior visual pathway structures,
such as the optic tract, LGN, and visual cortex in EAE animal models. In the current work
we investigated EAE-induced visual pathway demyelination, inflammation and
neurodegeneration at onset, peak disease, and chronic disease stages using IHC. We then
performed in vivo translationally relevant assays of retinal pathology using OCT, and visual
pathway function using ERGs and VEPs.
EAE induces early demyelination and OL loss the optic tract.
The optic tract is an important white matter structure of the afferent visual pathway
by which RGC axons first enter the brain after decussation at the optic chiasm. In the optic
tract, RGC axons are heavily myelinated and are susceptible to EAE-induced
demyelination and OL death.
To characterize EAE-induced effects on myelin and OL loss, coronal sections
containing the optic tract were obtained from normal, and EAE mice at 15 dpi, 26 dpi, and
47 dpi. Sections were immunostained for MBP, and CC1, a mature myelinating OL marker,
then co-stained with DAPI. Normal sections showed robust myelination in the optic tract
and adjacent hypothalamus but minimal immunoreactivity observed in the adjacent
amygdala (Figure 4.2A). Sections from EAE mice showed decreased myelination in the
optic tract at all timepoints after EAE induction, and very little MBP immunoreactivity in
adjacent structures. A large number of CC1+ DAPI+ mature myelinating OLs were

79
observed in the optic tract of normal mice, however in EAE sections, very few
immunoreactive OLs were identified (Figure 4.2B). Quantification of MBP percent area
showed near significant EAE-induced decreases in optic tract myelination compared to
normal at 15dpi (p=0.0549). These decreases became significant at 26 and 47dpi (Figure
4.2C). CC1+ OL numbers were significantly depleted by at least four-fold at all EAE
timepoints compared to normal controls (Figure 4.2D).

80
Figure 4.2: The optic tract exhibits significant demyelination and OL loss early in EAE and throughout
EAE progression. A. Coronal sections containing the optic tract were obtained from normal and EAE Thy1-
YFP transgenic mice at 15dpi (yellow), 26dpi (red), and 47dpi (navy blue). Sections were stained for MBP
(red), co-stained for DAPI (blue) and imaged at 20x magnification. Optic tract and adjacent white matter
areas show decreased myelination at 15dpi, 26dpi, and 47 dpi. B. Coronal optic tract sections were stained
for CC1 (red), co-stained for DAPI, and imaged at 20x. Significant CC1 immunoreactivity is observed in
normal sections with CC1 positive cells exhibiting cytosolic staining. C. Percent area of MBP staining was
quantified in sections from normal and EAE groups. Decreased MBP area is observed at all timepoints but
is only significant at 26dpi and 47dpi. D. Cell counts of CC1+DAPI+ cells reveal significant and greater than
4-fold decreases in the number of mature myelinating OLs at all timepoints. n=4 mice per group. *P<0.05,
**P<0.01, *** P<0.001, ****P<0.0001, ordinary one-way ANOVA with Kruskal-Wallis multiple comparison
test. Scale bar is 100µm.

81
Inflammation, astrogliosis and axonal damage are most prominent during peak and
chronic disease stages in the optic tracts of EAE mice.
Microglia and macrophages accumulate in regions undergoing active
demyelination and neurodegeneration in MS and EAE (ESIRI and READING, 1987;
Ferguson et al., 1997; Kipp et al., 2017; Prineas et al., 2001). There they may amplify
dysfunctional signals from CNS or immune system cells and produce a number of pro-
inflammatory factors which can exacerbate myelin loss and axon damage (Carson, 2002).
Astrocytes respond to CNS injury through astrogliosis, a number of changes which can
include increases in the number of resident astrocytes and changes to morphology and
molecular expression(Sofroniew, 2009). These effects are often associated with blood-
brain barrier compromise, production of pro-inflammatory cytokines and chemokines,
enhanced neuroinflammation, and scar formation in MS and EAE(Lopes Pinheiro et al.,
2016).
To evaluate the progression microglial activation, astrogliosis and axonal damage
in the optic tract during EAE, coronal sections containing the optic tract were obtained
from Thy1-YFP transgenic mice and immunostained for Iba1 and GFAP, then co-stained
for DAPI. Normal sections showed some Iba1 and GFAP immunoreactivity indicative of
resident non-reactive microglia and astrocytes within the optic tract (Figure 4.3A). EAE
sections did not show overt levels of microglia activation or astrogliosis until 26dpi.
Microglial immunoreactivity remained high at 47dpi, however GFAP expression
decreased. Normal sections showed a high density of coherent and aligned Thy1-YFP
axons in the optic tract (Figure 4.3B). In EAE sections lower axon density and some axon
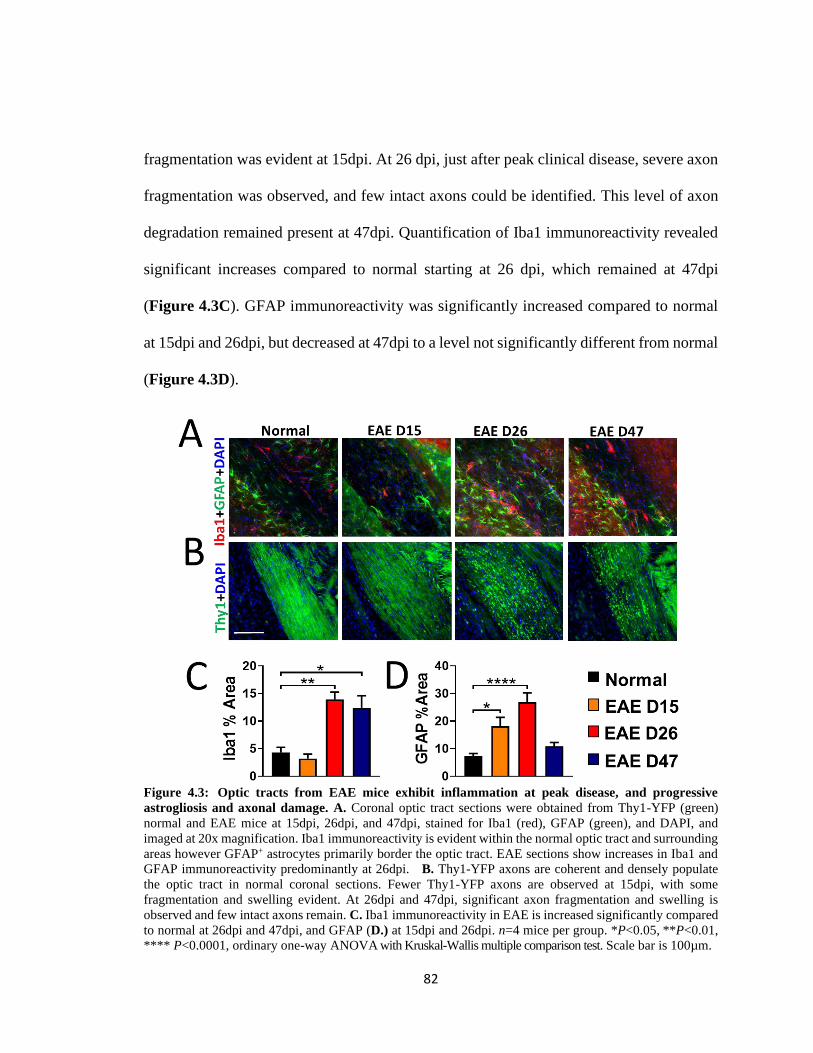
82
fragmentation was evident at 15dpi. At 26 dpi, just after peak clinical disease, severe axon
fragmentation was observed, and few intact axons could be identified. This level of axon
degradation remained present at 47dpi. Quantification of Iba1 immunoreactivity revealed
significant increases compared to normal starting at 26 dpi, which remained at 47dpi
(Figure 4.3C). GFAP immunoreactivity was significantly increased compared to normal
at 15dpi and 26dpi, but decreased at 47dpi to a level not significantly different from normal
(Figure 4.3D).
Figure 4.3: Optic tracts from EAE mice exhibit inflammation at peak disease, and progressive
astrogliosis and axonal damage. A. Coronal optic tract sections were obtained from Thy1-YFP (green)
normal and EAE mice at 15dpi, 26dpi, and 47dpi, stained for Iba1 (red), GFAP (green), and DAPI, and
imaged at 20x magnification. Iba1 immunoreactivity is evident within the normal optic tract and surrounding
areas however GFAP+ astrocytes primarily border the optic tract. EAE sections show increases in Iba1 and
GFAP immunoreactivity predominantly at 26dpi. B. Thy1-YFP axons are coherent and densely populate
the optic tract in normal coronal sections. Fewer Thy1-YFP axons are observed at 15dpi, with some
fragmentation and swelling evident. At 26dpi and 47dpi, significant axon fragmentation and swelling is
observed and few intact axons remain. C. Iba1 immunoreactivity in EAE is increased significantly compared
to normal at 26dpi and 47dpi, and GFAP (D.) at 15dpi and 26dpi. n=4 mice per group. *P<0.05, **P<0.01,
**** P<0.0001, ordinary one-way ANOVA with Kruskal-Wallis multiple comparison test. Scale bar is 100µm.

83
Progressive demyelination is coupled with severe OL loss in the dLGN of EAE mice.
The dLGN not only serves as an important intermediary between the retina and the
visual cortex in the afferent visual pathway, but also is significantly involved in processing
and modulation of the visual signal(Kerschensteiner and Guido, 2017; Rompani et al.,
2017). The human LGN consists of six cellular layers separated by thin sheets of
myelinated fibers, and thus is susceptible to MS-induced demyelination (Corbett and Chen,
2018). Myelination in the normal mouse dLGN and demyelination due to 5wks of CPZ
diet and the neurotoxin Ibotenic acid have previously been reported (Araujo et al., 2017;
Coffey et al., 1988). However, EAE-induced effects on myelination within the mouse
dLGN have not been previously assayed.
To assess longitudinal changes to myelination and OLs in the dLGN during EAE,
coronal sections from normal and EAE mice containing the dLGN were immunostained
for MBP, CC1, and Olig2 and co-stained with DAPI. Normal dLGN showed highly
myelinated fiber tracts across the dLGN, interleaved between partially myelinated cellular
layers (Figure 4.4A). Sections obtained from EAE mice at 15dpi, showed similar levels of
myelination as in normal, however a loss of the organization of the myelinated fiber tracts.
Sections from 26dpi and 47dpi EAE mice showed decreased overall levels of myelination,
as well as fragmentation of myelinated fiber tracts. Quantification of myelin percent area
revealed significant and progressive decreases in myelination at all EAE timepoints
(Figure 4.4C). Olig2 immunostaining in normal dLGN sections revealed a significant
presence of OL lineage cells which include OL precursors, premyelinating OLs, and
mature myelinating OLs (Figure 4.4B). Very few Olig2+ cells were observed in sections

84
from EAE mice at all timepoints. CC1 staining similarly revealed a significant presence of
mature myelinating OLs in normal, and few in EAE at any timepoint. Quantification of
Olig2+ cells (Figure 4.4D) and CC1+ cells (Figure 4.4E) showed almost complete ablation
of Olig2+ cells, and a 15-fold decrease in CC1+ cells at all EAE timepoints.
Figure 4.4: The dLGN exhibits progressive demyelination and extensive OL loss early in EAE and
throughout disease progression. A. Coronal sections containing the dLGN were obtained from normal and
EAE Thy1-YFP transgenic mice at 15dpi, 26dpi, and 47dpi. Sections were stained for MBP, co-stained for
DAPI and imaged at 20x magnification. Decreased organization of dLGN myelinated fiber tracts, and
decreased myelination is evident in EAE sections at 15dpi, 26dpi, and 47 dpi. B. Coronal dLGN sections
were stained for Olig2 (green) and CC1(red), co-stained for DAPI, and imaged at 20x. Significant Olig2 and
CC1 immunoreactivity is observed in normal sections with Olig2+ and CC1+ cells exhibiting nuclear and
cytosolic staining respectively. C. Percent area of MBP staining was quantified in sections from normal and
EAE groups. Significant and progressive decreases in MBP percent area is evident at all timepoints. D. Cell
counts of Olig2+ cells reveal almost complete ablation of OL lineage cells in the dLGN of EAE mice
compared to high numbers in normal. E. Cell counts of CC1+DAPI+ cells reveal significant and greater than
15-fold decreases in the number of mature myelinating OLs at all timepoints. n=4 mice per group. *P<0.05,
*** P<0.001, ****P<0.0001, ordinary one-way ANOVA with Kruskal-Wallis multiple comparison test. Scale
bar is 100µm.

85
The dLGN exhibits progressive increases in astrogliosis in EAE, but no change to
microglia, neuron numbers, or PV immunoreactivity.
Inflammatory demyelination incurred by CPZ diet has been shown to induce
significant increases in microglial and astrocytic reactivity in the dLGN(Araujo et al.,
2017). To probe EAE-induced longitudinal effects on the microglia and astrocyte
populations within the dLGN, coronal LGN sections were obtained from normal mice and
EAE mice euthanized at 15dpi, 26dpi, and 47dpi, immunostained for Iba1 and GFAP, and
co-stained for DAPI. Normal sections showed minimal levels of Iba1 immunoreactivity,
primarily located in the center of the dLGN, and GFAP immunoreactivity primarily located
at the borders of the dLGN (Figure 4.5A). Sections from EAE mice showed non-
significant changes to Iba1 immunoreactivity (Figure 4.5A, C) however progressive
increases in GFAP immunoreactivity which were significant at 26dpi and 47dpi (Figure
4.5A, D).
The dLGN is home to a number of thalamocortical projection neurons which send
afferents to layers 4-6 of V1, as well inhibitory interneurons which modulate information
transfer from the retina to the visual cortex. Loss of synaptic input from RGCs has been
shown to cause significant neuronal apoptosis in the LGN(You et al., 2012). The presence
of significant EAE-induced damage in RGC axons of the optic tract suggested possible
downstream neuronal loss in the dLGN. To quantify changes in dLGN neurons, normal
and EAE coronal sections containing the dLGN were immunostained for NeuN and PV. In
normal sections NeuN staining was evident in neuronal cell nuclei, while PV staining was
primarily observed in dendritic fibers and some cell bodies (Figure 4.5B). Interestingly,

86
thin streaks absent of PV immunoreactivity were evident across the LGN and likely
corresponded to the myelinated fiber tracts observed in figure 17A. EAE sections did not
show differences in NeuN staining, or NeuN+ cell numbers (Figure 4.5B, E). PV
immunoreactivity was likewise not overtly changed in EAE compared to normal, however
some loss of organization was observed in sections from all timepoints (Figure 4.5B, F).
Figure 4.5: EAE-induced effects in the dLGN include astrogliosis, but not microglial activation or
neuronal loss. A. Coronal sections containing the dLGN were obtained from normal and EAE mice at 15dpi,
26dpi, and 47dpi. Sections were stained for Iba1 and GFAP, co-stained for DAPI, and imaged at 20x
magnification. The dLGN shows minimal Iba1 and GFAP immunoreactivity in normal sections, and minimal
changes to Iba1+ microglia in EAE sections, but progressive EAE-induced increases in GFAP
immunoreactivity at 26pi and 47dpi. B. Coronal dLGN sections were immunostained for NeuN (red) and PV
(green), co-stained for DAPI, and imaged at 20x. Normal sections show extensive numbers of NeuN nuclei,
and PV+ neuropil which are absent in some elongated tracts. EAE sections from all timepoints show similar
numbers of NeuN nuclei, and similar overall PV+ staining, but some disorganization of neuropil. C.
Quantification of Iba1 percent area shows no significant difference in staining. D. GFAP percent area
quantification shows progressive increases in GFAP staining which become significant compared to normal
at 26dpi and 47dpi. E-F. No significant differences in NeuN+ neurons, or PV percent area are observed
between groups. n=4 mice per group. ** P<0.01, ordinary one-way ANOVA with Kruskal-Wallis multiple
comparison test. Scale bar is 100µm.

87
The visual cortex exhibits significant and persistent demyelination in EAE, which is
coupled with severe decreases to the OL population.
Thalamocortical neurons in the dLGN project to layer 4-6 of the visual cortex,
where synaptic inputs are processed and transferred to layer 2/3, 5 and 6 pyramidal
neurons. These neurons in conjunction with inhibitory circuits generated by cortical
inhibitory neurons, and feedback from higher order visual areas, form the final visual image
(Douglas and Martin, 2004; Gilbert and Wiesel, 1979; Gilbert and Wiesel, 1983; Glickfeld
and Olsen, 2017; Wood et al., 2017). Although the cortex is accepted to be a gray matter
region, a large number of cortical pyramidal neurons and PV+ interneurons are myelinated
(Micheva et al., 2016; Tomassy et al., 2014).
To evaluate the effects of EAE on myelination and OLs within V1, coronal sections
containing V1, as identified by the presence of a large and dense granular cell region in
layer 4A, were immunostained for MBP, CC1 and Olig2, then co-stained with DAPI.
Normal sections were myelinated in V1, with the densest MBP staining present in ventral
regions of the cortex (Figure 4.6A). A significant and almost 50% decrease in myelination
was observed in EAE sections at all timepoints (Figure 4.6A, C). Layer 4 normal V1 was
also highly populated by Olig2+ OL lineage cells as well as CC1+ mature myelinating OLs
(Figure 4.6B). Both cell types were significantly decreased by at least 4- fold, and in the
case of CC1+ cells, 5-fold (Figure 4.6B, D, E).

88
Figure 4.6: EAE visual cortex shows significant demyelination and OL loss compared to normal
controls. A. Coronal sections containing V1 and obtained from normal, and EAE groups were stained for
MBP and imaged at 10x magnification. Normal sections are myelinated, with densest regions of MBP
immunoreactivity in more ventral regions of the visual cortex. The corpus callosum, ventral and adjacent to
the visual cortex exhibits a higher density of MBP immunoreactivity than V1. EAE sections show depletion
of MBP immunoreactivity compared to normal in visual cortex and adjacent corpus callosum at all
timepoints. B. V1 coronal sections were immunostained for CC1 and Olig2, co-stained with DAPI, and
imaged at 20x magnification in layers 4. Olig2+ OL lineage cells, and CC1+ mature myelinating OLs were
ubiquitous in layer 4 of normal sections. EAE sections showed few Olig2+ or CC1+ cells. C. Significant
myelin loss is observed at all EAE timepoints compared to normal controls. D-E. Quantification in layer 4
reveals significant, OL-lineage-cell and OL loss in V1 at all EAE timepoints compared to normal. n=4 mice
per group. **** P<0.0001, ordinary one-way ANOVA with Kruskal-Wallis multiple comparison test. Scale bar
is 100µm.

89
Astrogliosis, present at early and peak EAE disease, precedes high levels of microglial
activation at peak disease in the cortex; these pathological changes are associated with
progressive loss of PV+ interneurons.
Cortical microglia have been shown to become ramified and hypertrophied in
chronic stages of EAE (Mangiardi et al., 2011). Astrocytes in the cortex have been shown
to express higher levels of GFAP, indicative of gliotic responses to injury, at peak,
remitting, and late disease stages of the relapsing remitting EAE model and at peak disease
in the MOG 35-55 peptide EAE model(Eilam et al., 2018; Jukkola et al., 2013). To evaluate
cortical changes in microglial, and astrocytic reactivity in V1, coronal sections containing
V1 were immunostained for Iba1 and GFAP respectively. Iba1 immunoreactivity was not
changed compared to normal except at 26dpi (Figure 4.7A, C), however GFAP showed
significant and progressive increase in immunoreactivity at 15dpi and 26dpi, but decreased
to a level not significantly different from normal at 47dpi (Figure 4.7A, D).
Neuronal cell types in the visual cortex primarily include pyramidal neurons,
granular cells, and inhibitory interneurons(Harris and Mrsic-Flogel, 2013). Granule cells
in layer 4 are the primary recipients of geniculo-cortical information, while pyramidal
neurons of layer 2-3, 5, and 6 are the primary excitatory neurons involved in visual
processing and transference of cortical information to other brain regions(Douglas and
Martin, 2004; Gilbert and Wiesel, 1979; Gilbert and Wiesel, 1983; Glickfeld and Olsen,
2017; Wood et al., 2017). In contrast, inhibitory neurons such as PV+ cells are associated
with modulation of visual processing(Wood et al., 2017). The loss of myelination from the

90
visual cortex had the potential to alter neuronal survival. Furthermore, V1 atrophy is a
primary feature of MS pathology, indicating the possibility of V1 neuronal death(Balk et
al., 2015; Gabilondo et al., 2014; Gabilondo et al., 2017).
In order to quantify EAE-induced neuronal pathology in V1, coronal sections from
normal and EAE mice were immunostained for NeuN and PV, co-stained with DAPI, and
imaged in layer 4. Normal sections showed robust numbers of NeuN+ cells and PV+ cells
interspersed throughout with a high density of PV+ fibers evident in layer 4B (Figure
4.7B). EAE sections showed similar amounts of NeuN+ cells but decreased numbers of
PV+ cells compared to normal at all timepoints. Quantification revealed no differences in
the number of NeuN+ cells across groups, although a progressive decline of PV+ cells
which was significantly lower than normal at all EAE timepoints, was evident (Figure 4.7
E, F).

91
Figure 4.7: EAE visual cortex exhibits inflammation, astrogliosis, and progressive PV+ interneuron
loss. A. Coronal sections obtained from normal and EAE groups, and containing V1 were stained for Iba1
and GFAP, and imaged at 10x magnification. Iba1 immunoreactivity is relatively similar across groups with
the exception of an increase in the EAE 26dpi group. GFAP immunoreactivity is increased in EAE sections
at 15dpi and 26dpi, but not at 47dpi as compared to normal. B. Coronal sections containing V1 were obtained
from normal and EAE mice, immunostained for NeuN and PV, and imaged in layer 4 of V1 at 20x
magnification. NeuN+ cell density does not overtly change between treatment groups, however the PV+
interneuron density is decreased in all EAE sections compared to normal. C-D. Quantification of Iba1 and
GFAP percent area show significant increases in Iba1 immunoreactivity at 26dpi, and in GFAP
immunoreactivity at 15 and 26dpi compared to normal. E-F. The number of NeuN+ cells is not significantly
changed between groups, however a progressive decrease in PV+ neurons is observed in EAE compared to
normal, and is significant at all EAE timepoints. n=4 mice per group. *P<0.05, **P<0.001, **** P<0.0001,
ordinary one-way ANOVA with Kruskal-Wallis multiple comparison test. Scale bar is 100µm.
In vivo studies of visual pathway pathology and function are crucial for
understanding longitudinal disease progression in both MS and EAE. Especially useful in
the assessment of the afferent visual pathway are translationally relevant methods such as

92
MRI, ERGs, VEPs, and OCT which can be assayed in animal models and transferred to
the clinic. Although MRI is the gold-standard for evaluation of MS pathology, it is
expensive and can be difficult to access for a number of MS and EAE researchers. As a
result, evoked potentials and OCT which are similarly translationally relevant have been
used with increasing frequency in evaluating MS pathology, and pathology in its animal
models (Pihl-Jensen et al., 2017). However, a longitudinal correlation between
histologically examined posterior visual pathway pathology, and in vivo OCT, ERGs, and
VEPs has been yet to be provided in EAE.
EAE mice show decreased RNFL thickness only at the chronic EAE stage, but changes to
posterior retinal layers throughout disease progression.
In order to evaluate EAE-induced pathological deficits in the retina, OCT was used
to image retinas from awake and anesthetized, normal and EAE cohorts of mice at 13dpi,
20dpi, and 38dpi. These timepoints corresponded to onset, peak, and chronic disease stages
respectively. Retinas from both eyes were imaged just temporal to the optic nerve (Figure
4.8A-i) and layer thicknesses measured across the retina, in the RNFL, GCL+IPL complex,
INL+OPL, ONL+PR, and RPE (Figure 4.8A-ii). Layer thicknesses were not significantly
different between groups in whole retina, INL+OPL, or ONL+PR measurements (Figure
4.8B). Significant decreases in thickness compared to normal were observed in the RNFL
at 38dpi, GCL+IPL complex at 20dpi, and RPE at 13dpi, possibly due to cellular damage

93
in these areas. The RPE also exhibited a significant increase in layer thickness at 38dpi
compared to normal possibly due to pathological swelling.
Figure 4.8: OCT imaging reveals EAE-induced pathological decreases in anterior retinal layer
thicknesses and changes to RPE layer thickness throughout disease progression. A. OCT dataplots were
obtained from the retinas of live and anesthetized mice temporal to the optic nerve (i). Automatic
segmentation by Leica/Bioptigen imaging software quantified retinal layer thicknesses in the RNFL,
GCL+IPL complex, INL, OPL, ONL, PR, and RPE regions (ii). For ease of analysis, INL+OPL, and
ONL+PR layers were combined. B. No differences in overall retinal thickness are observed between
treatment groups. RNFL shows significant decreases compared to normal only at 38dpi. GCL+IPL complex
shows significant decreases in EAE mice compared to normal at 20dpi. The RPE layer shows significant
decreases in layer thickness compared to normal during onset at 13dpi, and increases in the chronic stage at
38dpi. n=4 mice per group. *P<0.05, *** P<0.001, ordinary one-way ANOVA with Kruskal-Wallis multiple
comparison test.

94
Retinal function is significantly impaired in EAE mice
To ascertain EAE-induced functional deficits in the retina, ERGs in response to
three-candela-flash light stimulus were obtained from live anesthetized normal and EAE
mice at 8dpi, 21dpi, and 40dpi. These timepoints, similar to those in OCT, corresponded
to EAE onset, peak EAE, and chronic EAE disease stages respectively. Normal mice
exhibited robust ERGs with average latencies of response to light stimulus of 20ms and
40ms and average amplitudes of 200µV and 500µV for A-wave and B-wave respectively
(Figure 4.9A-C). EAE mice exhibited increased latency of response after light stimulus
compared to normal controls in the A-wave and B-wave at 8dpi but not at 21dpi or 40dpi
(Figure 4.9A, B). A-wave and B-wave amplitude deficits were also evident in EAE mice
compared to normal at 8dpi, and B-wave deficits persisted through 26dpi and 47dpi
(Figure 4.9A, C).

95
Figure 4.9: ERG latencies after flash stimulus are impaired early in EAE, whereas amplitude deficits
are evident throughout disease progression. A. ERGs in response to three-candela-flash light stimulus
were obtained from live and anesthetized normal and EAE mice. Representative traces depict averaged traces
for normal, 8dpi EAE, 21dpi EAE, and 40dpi EAE groups. A-wave and B-wave peaks are identified. B.
Normal ERG A-wave and B-wave peaks occur at approximately 20ms and 40ms after stimulus respectively.
EAE mice at 8dpi exhibit delays in A-wave and B-wave peak time after stimulus compared to normal. Peak
latencies of EAE mice at 21dpi and 40dpi are not significantly different from normal. C. Normal ERG A-
wave and B-wave peak amplitudes average approximately 200 and 500µV respectively. A-wave amplitudes
are significantly decreased compared to normal in EAE mice at 8dpi however not at 21dpi or 40dpi. B-wave
amplitudes are significantly decreased at all EAE timepoints compared to normal. n=4 mice per group.
**P<0.01, **** P<0.0001, ordinary one-way ANOVA with Kruskal-Wallis multiple comparison test.
Afferent visual function is significantly impaired in EAE mice
To characterize EAE-induced functional deficits across the afferent visual pathway,
VEPs in response to three-candela-flash light stimulus were obtained from live
anesthetized normal and EAE mice at 8dpi, 21dpi, and 40dpi. Normal controls exhibited
robust VEPs consisting of an initial positive P1 deflection, followed by a negative N2, and
gradual return to baseline (Figure 4.10A). Response times of P1 and N2 peaks averaged
20ms and 40ms, while amplitudes averaged 40µV, and 60µV respectively (Figure 4.10A-

96
C). EAE mice exhibited significant increases in P1 and N2 latencies at 8dpi and 21dpi, but
no difference compared to normal at 40dpi (Figure 4.10B). P1 amplitudes were not
significantly different between normal and EAE groups, however N2 amplitudes were
decreased at all EAE timepoints compared to normal (Figure 4.10C).
Figure 4.10: VEP latencies after flash stimulus are impaired at onset and peak EAE, whereas N2
amplitude deficits are present throughout disease progression. A. VEPs in response to three-candela-
flash light stimulus were obtained from live and anesthetized normal and EAE mice. Representative traces
depict averaged traces for normal, 8dpi EAE, 21dpi EAE, and 40dpi EAE groups. P1 and N2 peaks are
identified. B. Normal VEP P1 and N2 peaks occur at approximately 20ms and 40ms after stimulus
respectively. EAE mice at 8dpi and 21dpi exhibit delays in P1 and N2 peak time after stimulus compared to
normal. Peak latencies of EAE mice at 40dpi are not significantly different from normal. C. Normal VEP P1
and N2 peak amplitudes average approximately 40 and 60µV respectively. P1 amplitudes are not
significantly different between normal and EAE groups, however N2 amplitudes are decreased compared to
normal at all EAE timepoints. n=4 mice per group. *P<0.05, **P<0.01, ***P<0.001, **** P<0.0001,
ordinary one-way ANOVA with Kruskal-Wallis multiple comparison test.

97
4.4 Discussion
In the preceding study, EAE-induced visual pathway pathology was assessed in the
posterior visual system over the course of the disease. To this end, histological assessments,
in vivo assessments of retinal morphology, and in vivo functional assessments of the retina
and visual pathway were employed. Histological results revealed that significant
demyelination occurred throughout the visual system early in EAE, astrogliosis primarily
at early timepoints, microglial activation primarily at peak disease, and neurodegeneration
at peak to chronic disease stages. Retinal pathology was restricted to the RNFL and
GCL+IPL layers at chronic and peak disease stages respectively, and to the RPE at both
peak and chronic disease. The retina exhibited functional deficits associated with
photoreceptor activity at early timepoints, and associated with retina interneurons and
RGCs at all timepoints. Deficits in visual response times occurred primarily at early and
peak disease, whereas decreased amplitudes were measured at all disease stages.
Retinal pathology
MS patients with or without ON often show pathological thinning or thickening of
various retinal layers throughout disease progression. Anterior regions of the retina such
as the RNFL and GCL+IPL primarily exhibit progressive thinning(Al-Louzi et al., 2016;
Gabilondo et al., 2015; Saidha et al., 2011a). In medial areas such as the INL and OPL
there is often no MS-induced effect observed although one study indicated a correlation
between macular thinning, high expanded disability status scale scores, and thinning of the
98
middle retina (Saidha et al., 2011b). Outer neural retina areas such as the ONL and PR
can have varied responses after optic neuritis depending on disease stage. Acute swelling
of these layers often occurs within 1 month after ON onset, followed by either no
discernable difference in thickness from baseline, or a progressive decline(Al-Louzi et al.,
2016; Gabilondo et al., 2015; Seigo et al., 2012).
In the preceding work, we show significant EAE-induced decreases in the RNFL
at chronic disease stages, similar to observations in MS patients, who show higher levels
of RNFL atrophy with disease progression (Behbehani et al., 2017; Garcia-Martin et al.,
2017). In addition, GCL+IPL thinning was observed at peak disease similar to reports in
MS where it is often observed soon after optic neuritis(Al-Louzi et al., 2016; Saidha et al.,
2011b). Furthermore, two recently published studies in EAE have also reported decreased
GCIP (Manogaran et al., 2018; Nishioka et al., 2019).
Interestingly, GCL+IPL thinning appeared to be resolved at 40dpi, and was not
significantly different from normal. Previous OCT assessments of retina in EAE also show
no difference in GCIP thickness between normal and 40dpi (Figure 3.9C). It is unclear
why the GCIP thickness is so changed in the chronic stage however macular edema has
been reported in MS patients (Gelfand et al., 2012). Swelling of the GCIP after neuronal
damage may have contributed to observed increases in layer thickness.
The RPE has been reported to thicken in MS patients with optic neuritis (Droby et
al., 2016). In the current work, we report thinning of the RPE after 13dpi, a return to
baseline at 20dpi, and subsequent thickening at 38dpi. Although RPE pathology has not

99
been previously studied in animal models for MS, RPE thinning is commonly associated
with loss of pigment epithelial cells often due to aging, and thickening often due to chronic
inflammatory retinal damage (Bonilha, 2008; Gao and Hollyfield, 1992; Penfold et al.,
2001). It is possible that similar events occurred in EAE with early pigment epithelial cell
damage resulting in the observed thinning and the presence of a chronic inflammatory
response causing RPE hypertrophy. However, further investigations into RPE cellular
pathology during EAE are necessary.
ERGs
Retinal pathology identified by OCT was associated with functional deficits in
ERGs. A-wave amplitudes and latencies, results of photoreceptor activity, were both
impaired at 8dpi. ERGs obtained from MS patients show conflicting results with respect to
photoreceptor response time and amplitude of response, with some studies reporting no
differences compared to normal controls (Hamurcu et al., 2017; Papakostopoulos et al.,
1989), and others showing an impaired response(Forooghian et al., 2006; Hanson et al.,
2018). The contradictory responses reported in MS may be due to differential timing of
assessment. We report impairments in the A-wave only in early EAE, and prior to onset,
but not at peak disease or chronic disease. The transient nature of the response in EAE
indicates that some MS studies may have been completed outside of the window of
observable photoreceptor dysfunction. Because the A-wave is associated with
photoreceptor activity, and the photoreceptors are the first step in visual processing, it is
important to characterize early deficits in these cell types during MS and EAE.

100
In contrast, deficits in B-wave amplitudes and latencies are consistently reported in
MS patients(Forooghian et al., 2006; Hamurcu et al., 2017; Hanson et al., 2018;
Papakostopoulos et al., 1989). These are associated with cells post-synaptic to the
photoreceptors including bipolar cells, Müller glia, and RGCs (Perlman, 1995; Smith et
al., 2014). The deficits observed in the A-wave early in EAE, and the B-wave at all EAE
timepoints indicate significant pathology within the neural retina.
Visual pathway pathology
The visual pathway exhibits significant deficits in MS which include demyelinated
lesions throughout white matter tracts(Graham and Klistorner, 2017), and gray matter
atrophy(Balk et al., 2015; Gabilondo et al., 2014; Gabilondo et al., 2017; Papadopoulou et
al., 2019; Shen et al., 2019). In EAE, white and gray matter pathology of the posterior
visual pathway was observed throughout disease progression.
White matter pathology
White matter pathology included early demyelination and astrogliosis at all EAE
timepoints, as well as microglial activation and extensive axonal damage at peak and
chronic disease timepoints. It is unclear why early demyelination was not associated with
overt microglial activation in EAE, as acute demyelinating lesions in MS are generally
characterized by the presence of macrophages and microglia throughout the lesion area
(Kuhlmann et al., 2017). Among other roles, these pro-inflammatory cells engulf damaged
myelin and OLs as well as normal appearing white matter from MS patients (Hendrickx et
al., 2014) and as such play a major role in demyelination. However, an insight to how

101
demyelination could proceed in optic tract, in the absence of these cells could be provided
by the presence of hypertrophied and activated astrocytes, which also play a major role in
myelin removal under disease conditions(Morizawa et al., 2017).
Demyelination was also associated with early pathological increases in VEP
latencies in EAE, which were attenuated at peak and chronic disease stages. These results
support deficits observed in optic neuritis in which there is acute vision loss followed by
partial recovery(Toosy et al., 2014). One potential explanation for this is that axons which
are partially demyelinated at early disease stages can still conduct albeit more slowly than
fully myelinated axons. Demyelination of the axon results in a conduction block(Smith and
McDonald, 1999) and as the severity of demyelination and axon damage progresses these
axons would stop contributing to the VEP and thus no longer delay VEP peak times. Robust
axons which were minimally myelinated, and fire similarly to normally myelinated axons
could become primary contributors to the EAE VEP, and thus return the latency recorded
to normal levels.
However, this is unlikely for a few reasons. First, such a scenario would require
progressive decreases in VEP amplitudes. Because the VEP amplitude is a compound
action potential recorded in V1, it is a measure of the number of V1 neurons which can be
recruited to fire in response to the flash stimulus at the retina(Creel, 1995a). If the former
argument were correct, the amplitude of the VEP would remain close to normal levels at
early timepoints when latency deficits are most pronounced. In this case a large number of
V1 neurons would still contribute to the V1 amplitude even if they or their synaptic

102
precursors were partially demyelinated. However, significant deficits in VEP amplitudes
were observed in early disease stages, and these deficits did not become progressively
worse with disease progression.
Second, the presented histological results do not support this hypothesis.
Significant demyelination occurred early, and did not become progressively worse in the
optic tract, and visual cortex. The dLGN did show progressive demyelination but even so,
there was an almost 30% drop in myelination at the early timepoint compared to normal.
Finally, partially demyelinated axons still contributing to the VEP would be
expected to cause a broadening of VEP peaks compared to normal at early EAE timepoints,
as has been reported in other evoked potentials(Deguchi et al., 1992). However, measures
of the full width half maximum of VEP peaks revealed no significant differences in the
broadness of recorded peaks between groups (Appendix Figure A.1), indicating that the
presented hypothesis is incorrect.
Another potential explanation for spontaneous recovery of visual function could be
a reorganization of sodium channels after prolonged demyelination. Myelin internodes
generally exhibit low densities of sodium channels (>25 per µm2 compared to ~1000 per
µm2 at nodes of Ranvier)(G. Waxman, 2005). However, 14 days after demyelination,
sodium channels are distributed in relatively high densities in internodal regions (England
et al., 1990). Such changes to sodium channel expression have been reported in optic nerve
and spinal cord axons during EAE(Craner et al., 2003; Craner et al., 2004) and support the
observation that demyelinated axons exhibit an abrogated but not abolished ability to

103
conduct potentials(Bostock and Sears, 1978). Further investigations of sodium channel
distribution in the optic tract are necessary to elucidate this potential mechanism.
Axonal damage and loss are well-known features of MS pathophysiology, and
primary indicators of disability outcomes. Damaged axons are present throughout active
MS lesions and at the borders of inactive lesions (Ferguson et al., 1997; McDonald et al.,
1999). In the current work, we show the presence of some damaged axons within the optic
tract as early as 15dpi. The majority of axons at this timepoint were intact, but a few
swollen endbulbs, indicative of transection, were present. At 26dpi and 47 dpi, the number
of damaged axons increased greatly, and axons appeared fragmented. Thus, demyelination
at 15dpi appears to precede overt axonal damage at 26dpi. This is similar to reports in the
optic nerve which show demyelination at 11dpi and extensive axonal damage at
19dpi(Fairless et al., 2012). High numbers of activated microglia and macrophages were
associated with higher levels of axon fragmentation at 26dpi, indicating a possible role for
pro-inflammatory microglia in precipitating axonal loss. This is similarly observed in MS
lesions in which there is a correlation between the number of macrophages and the extent
of axonal damage(Ferguson et al., 1997).

104
Gray matter pathology
Extensive microglia and macrophage presence has been associated with
degradation of synaptic proteins in the cortex(Rasmussen et al., 2007), production of
reactive oxygen and nitrogen species precipitating axon degeneration (Nikic et al., 2011),
as well as irreversible neuronal damage in a number of neurodegenerative diseases(Tang
and Le, 2016). In the pathological brain, astrocytes express pro-inflammatory cytokines
implicated in demyelination, exhibit decreased levels of potassium buffering, and provide
insufficient fluid transfer, events which have been implicated in neurodegeneration (Lapato
and Tiwari-Woodruff, 2018; Olabarria and Goldman, 2017). In the dLGN and V1,
increases in microglial presence and astrogliosis were observed throughout EAE and may
play a role in the observed disruption of PV+ dendrites in the dLGN, and PV+ neuron loss
in V1. In fact, inflammatory demyelination has been shown to negatively impact inhibitory
synapses in the dLGN, and PV+ interneurons in the cortex(Araujo et al., 2017; Clements et
al., 2008; Falco et al., 2014; Lapato et al., 2017; Potter et al., 2016). Furthermore, PV+
neurons are myelinated and may be particularly susceptible to inflammatory demyelinating
events(Micheva et al., 2016).
In the visual cortex, PV+ neurons regulate network synchrony and their suppression
results in decreased responsiveness to natural visual stimuli(Agetsuma et al., 2018; Zhu et
al., 2015). VEPs obtained from EAE mice revealed significant deficits in amplitude of the
visual response, suggesting a similar decrease in responsiveness. Thus, the observed

105
deficits in VEP amplitudes may be directly related to PV pathology, however further
investigation is needed.
The pathophysiology of EAE in the posterior visual pathway is characterized by
extensive demyelination early in disease followed by irreversible neurodegeneration at
peak and late disease timepoints. These events are associated with microglial activation
and astrogliosis, which in EAE and MS, can exacerbate neurodegenerative events. Similar
results have been extensively reported on in the anterior portions of the visual system.
Thus, therapeutic intervention to attenuate visual pathway pathology may require early
treatment with remyelinating and immunomodulatory agents to attenuate inflammatory
responses and prevent irreversible axon and neuronal damage. In the event, however that
this is not possible therapeutic outcomes may be bleak.

106
Chapter 5: CPZ diet results in significant demyelination
of the visual system but few functional deficits
5.1 Introduction
The CPZ demyelination model is a frequently used animal model for MS which
relies on the toxic copper chelator CPZ, to induce regional demyelination within the brain.
Unlike EAE, it does not rely on peripheral immune lymphocytes crossing the BBB to
produce inflammatory factors that lead to demyelination and neurodegeneration in the
CNS. Rather, the CPZ diet results in a copper deficiency associated with OL apoptosis and
subsequent myelin loss. It is currently unclear the exact mechanism of action associated
with CPZ-induced demyelination. However, the induced copper deficit is associated with
dysfunction of mitochondrial enzymes such as cytochrome oxidase and monoamine
oxidase, which rely on copper for proper function and oxidative phosphorylation (citation
39,40,43 from matsushima paper). For high-energy demand CNS cell types like OLs
which rely significantly on mitochondrial activity, such deficits are particularly devastating
and may lead to the observed OL apoptosis in this model. However, it is unknown why
primarily OLs, and not similarly high-energy-demand CNS cell types like neurons, are
affected (Matsushima and Morell 2001).
Although the CPZ model is particularly useful for understanding the role of
demyelination in CNS pathology, very few studies have assessed CPZ-induced visual
pathway pathology. Such a study is of particular interest due to the utility of the CPZ model
for identifying remyelinating therapeutic agents (Alme et al., 2015; Ghaiad et al., 2017;

107
Moore et al., 2014b). Because successful pre-clinical agents are increasing evaluated in
clinical trials using visual outcome measures, further evaluation of CPZ diet effects on the
visual system is necessary.
In the following work, we present an assessment of CPZ-induced progressive visual
pathway pathology in the mouse through in vivo and immunohistochemical assessments of
the retina, optic tract, dLGN, and visual cortex. We evaluate functional changes, changes
to myelination, astrogliosis, microglial activation, and axonal health at regular timepoints
throughout disease progression until 12wks of CPZ diet. We report extensive and
progressive demyelination across visual system white matter tracts, which does not result
in overt axonal damage, or functional deficits.

108
5.2 Methods
Twenty-eight 8-12-week-old Thy1-YFP and PLP-EGFP male mice on a C57Bl/6
background received rodent chow infused with 0.2% CPZ (Envigo, Huntingdon UK)
(Figure 5.1A). Mice were split into two separate experiments. One cohort of eight mice
underwent longitudinal ERG and VEP assessments (Expt 1) at 6, 9, and 12weeks (Figure
5.1B-i). Another cohort of twenty mice were evaluated with OCT (Expt 2) (Figure 5.1B-
ii). Groups of five mice in Expt 2 were perfused after 3wks, 6wks, 9wks, and 12wks of
CPZ diet for IHC. Ten PLP-eGFP and four Thy1-YFP mice served as controls and were
not euthanized for IHC until experiment end.

109
Figure 5.1: Experimental design for longitudinal assessment of visual pathway pathology in CPZ. A.
Twenty-eight 10 to 12-week-old Thy-YFP and PLP-EGFP male mice on a C57Bl/6 background were placed
on 0.2% CPZ diet, provided in normal rodent chow (Envigo, Huntingdon UK), resulting in selective
demyelination within the CNS. B. Mice were split into two individual experiments: 20 mice for experiment
1, and 8 mice for experiment 2. Retina function of experiment 1 mice was evaluated after 3, 6, 9, and 12wks
of CPZ diet (i). Five mice from experiment 1 were perfused for IHC at each timepoint. The second cohort of
8 mice underwent ERGs and VEPs after 6, 9, and 12wks of CPZ diet (ii). Ten PLP-eGFP and four Thy1-
YFP mice served as controls and were not euthanized for IHC until experiment end.

110
5.3 Results
The CPZ diet has been reported to induce selective and reproducible demyelination
in various CNS regions including the corpus callosum(Atkinson et al., 2019; Baxi et al.,
2017; Lapato et al., 2017; Moore et al., 2014b; Steelman et al., 2012; Yamate-Morgan et
al., 2019), hippocampus(Baxi et al., 2017; Koutsoudaki et al., 2009; Lapato et al., 2017;
Norkute et al., 2009), cortex (Baxi et al., 2017; Gudi et al., 2009; Silvestroff et al., 2012),
and cerebellum(Groebe et al., 2009; Oakden et al., 2017; Skripuletz et al., 2010; Steelman
et al., 2012). Only one study has previously investigated CPZ demyelination within the
visual pathway, however the time course of CPZ demyelination was not assessed(Araujo
et al., 2017). The following work reports on longitudinal changes in myelination, microglia
and astrocyte populations, axonal health and functional changes over the course of 12wks
of 0.2% CPZ diet.
CPZ diet induces demyelination and mature OL loss after 3, 6, 9 and 12wks in the optic
tract.
To investigate CPZ-induced changes to myelination and OLs in the optic tract
coronal sections were obtained from PLP-EGFP mice either on normal diet, or on CPZ
diet. CPZ mice were perfused after 3, 6, 9, or 12wks of CPZ diet, immunostained for MBP
and CC1, then co-stained for DAPI. Sections from normal mice exhibited robust levels of
myelination in the optic tract and adjacent hypothalamic regions, but not in the amygdala
(Figure 5.2A). CPZ diet resulted in significant myelin loss evident at 3, 6, and 12wks of
diet, however optic tracts from 9wk CPZ mice showed increased levels of myelination, and

111
were not significantly different from normal (Figure 5.2A, C). Normal sections obtained
from PLP-EGFP mice and stained for CC1 showed robust numbers of PLP+ premyelinating
and mature OLs, and CC1+ mature OLs (Figure 5.2B). CPZ diet had no significant effect
on PLP+ cell numbers, but resulted in decreased numbers of CC1+ mature myelinating OLs
at 6, 9 and 12wks (Figure 5.2B, D, E).
Figure 5.2: Toxic 0.2% CPZ diet induces significant demyelination after 3, 6, and 12 weeks, and mature
myelinating OL loss after 6, 9 and 12wks in the optic tract. A. PLP-EGFP (green) mice were perfused
after 3 (blue), 6 (purple), 9 (green), and 12wks (dark purple) of 0.2% toxic CPZ diet for IHC. Sections
containing the optic tract were obtained, immunostained for MBP, co-stained with DAPI, and imaged at 20x
in the dorsal region. Normal sections show robust myelination in the optic tract and adjacent hypothalamic
region. Sections obtained from 3, 6, and 12 wk CPZ mice show patchy MBP staining and decreased overall
MBP immunoreactivity. The 9wk CPZ section shows increased MBP staining which is not as robust as
normal. B. Sections containing the optic tract and similarly obtained from normal, 3, 6, 9, and 12wk CPZ
PLP-EGFP mice were immunostained for CC1 and co-stained with DAPI. Normal sections show high
numbers of PLP+ cells and few CC1+ in more dorsal optic tract areas. In more ventral regions however, the
density of PLP+ cells remains similar but that of CC1+ cells is increased. Sections from mice at all CPZ
timepoints show high numbers of PLP+ cells, however CC1+ cells are depleted at 6wks, 9wks, and 12wks. C.
Quantification of MBP percent area reveals significant decreases in MBP coverage at 3, 6, and 12wks
compared to normal. D-E. Quantification of PLP+ cells, and CC1+ cells reveals no change in the former, but
significant decreases in the latter at 6, 9 and 12wks compared to normal controls. n=5 mice per group.
*P<0.05, **P<0.001, *** P<0.001, ordinary one-way ANOVA with Kruskal-Wallis multiple comparison test.
Scale bar is 100µm.

112
Inflammation and astrogliosis, but not axon damage, are prevalent in the optic tract of
CPZ mice.
The CPZ model does not exhibit a peripherally-induced immune response, nor
overt blood-brain barrier breakdown (Bakker and Ludwin, 1987; Kondo et al., 1987).
However, apoptotic OL and myelin debris results in early microglial and astrocytic
recruitment, and subsequent phagocytosis of debris(Blakemore, 1972). Furthermore,
significant astrocytic gliosis may precede microglial infiltration to demyelinated lesion
sites(Matsushima and Morell, 2001).
To assay CPZ induced microglial activation and astrogliosis in the optic tract,
coronal sections containing optic tract were obtained from normal, 3, 6, 9, and 12wk CPZ
PLP-EGFP mice. Sections were immunostained for Iba1 and GFAP then co-stained with
DAPI. Normal sections exhibited low levels of microglial immune reactivity throughout
the optic tract, indicative of resident non-reactive cells. GFAP immunoreactivity was
similarly low and primarily present in the borders of the optic tract (Figure 5.3A). Sections
from CPZ mice at 3, 6, and 9wks showed a significantly higher presence of Iba1 compared
to normal, with microglia exhibiting activated and hypertrophied morphology, (Figure
5.3A, B). Overall microglial presence was decreased in 12wk tissues, however reactive
morphology persisted. Astrogliosis was evident in at all CPZ timepoints however was most
pronounced after 3 and 6wks of CPZ diet (Figure 5.3A, C).
Axon damage has been reported in the corpus callosum after 3, 6, 9, and 12wks of
CPZ diet, after focal demyelination with lysolecithin, and in MS lesions (Crawford et al.,
2009b; Lapato et al., 2017; Schultz et al., 2017; Yamate-Morgan et al., 2019). In the EAE

113
model, axon damage within the optic nerve and optic tract is severe and occurs
early(Brambilla et al., 2012; Manogaran et al., 2019; Shindler et al., 2008). To probe
potential deficits in axon integrity due to CPZ demyelination, sections containing the optic
tract were obtained from normal and 12wk CPZ Thy1-YFP mice in which cell bodies and
axons of a subset of excitatory neurons fluoresce green. Normal sections showed intact,
aligned, and well-organized axons in the dorsal optic tract (Figure 5.3D). Sections from
12wk CPZ mice similarly show undamaged and well-aligned axons.
Figure 5.3: CPZ demyelination results in significant microglial activation after 3, 6, and 9wks, and
astrogliosis after 3, 6, 9, and 12wks, but does not cause observable axon damage in the optic tract. A.
Sections containing optic tract were obtained from normal, 3, 6, 9, and 12wk CPZ PLP-EGFP mice,
immunostained for Iba1 and GFAP, and co-stained for DAPI. Normal sections show low levels of Iba1
immunoreactivity, and low levels of GFAP immunoreactivity which are highest at the borders of the optic
tract. Sections from mice after 3, 6, and 9wk CPZ show high levels of Iba1, with microglia exhibiting
hypertrophied morphology. Sections from 12wk CPZ mice similarly show hypertrophied microglia, but an
overall decrease in Iba1 immunoreactivity. Astrogliosis as evidenced by GFAP staining is highest in 3 and
6wk CPZ sections, but still higher than normal in 9wk and 12wk. B-C. Quantification of Iba1 and GFAP
immunoreactivity show significant increases in Iba1 at 3, 6, and 9wk, and in GFAP at all CPZ timepoints,
compared to normal. D. Optic tract sections were obtained from normal and 12wk CPZ Thy1-YFP mice.
Normal and CPZ sections show intact and well aligned axons with no observable damage in 12wk CPZ. n=5
mice per group. *P<0.05, **P<0.001, *** P<0.001, **** P<0.0001, ordinary one-way ANOVA with Kruskal-
Wallis multiple comparison test. Scale bar is 100µm.

114
Progressive demyelination and OL loss are observed in the dLGN of CPZ mice.
The LGN is important for visual processing and the transference of visual
information from the retina to the visual cortex. Maintenance of myelination, glial
homeostasis, and neuronal health is crucial for proper function. As recently reported by
Araújo and colleagues, the mouse dLGN undergoes significant myelin loss after 3 and
5wks of CPZ diet which is associated with increased microglial and astrocytic presence
and changes to the balance between excitation and inhibition after 5 weeks (Araujo et al.,
2017). MS patients also present with LGN atrophy which may be indicative of myelin loss
and neuronal damage(Papadopoulou et al., 2019; Sepulcre et al., 2009). Such imbalances
could lead to progressive functional deficits in LGN visual processing. However, a
longitudinal time course study on LGN myelination, and changes to glial and neuronal
populations under CPZ challenge has not been previously described.
To assess progressive changes to LGN myelination in the CPZ model, coronal
sections containing the dLGN were obtained from normal, 3, 6, 9, and 12wk CPZ PLP-
EGFP mice. Sections were immunostained for MBP, then co-stained for DAPI. Normal
sections showed laminar layers of MBP immunoreactivity corresponding to myelinated
fiber tracts within the LGN (Figure 5.4A). Sections from 3wk CPZ mice showed
disorganization of fiber tracts, as well as demyelinated areas. Remaining sections showed
progressive decreases in myelination which reached significance in relation to normal after
9 and 12 wks CPZ diet (Figure 5.4A, C). To evaluate changes to OL populations in the
LGN, sections were immunostained for CC1 and co-stained with DAPI. Normal sections

115
exhibited high numbers of PLP+ premyelinating and CC1+ mature myelinating OLs, in
conjunction with PLP+ myelinated fiber tracts (Figure 5.4B). CPZ diet resulted in
significantly decreased numbers of PLP+ cells after 6wks and 12wks of CPZ diet, and CC1+
cells at the 6 and 9wk timepoint (Figure 5.4B, D, E).
Figure 5.4: CPZ diet results in progressive demyelination of the dLGN, coupled with changes to OL
populations. A. Coronal sections containing the dLGN were obtained from normal 3, 6, 9, and 12wk CPZ
PLP-EGFP mice, immunostained for MBP, and co-stained for DAPI. Sections were imaged at 20x
magnification. Normal sections show laminar myelinated tracts interspersed with regions with low MBP
immunoreactivity. CPZ diet results in progressive loss of myelin and little myelin remaining after 9 and
12wks CPZ diet. B. Sections from PLP-EGFP mice were immunostained for CC1 and co-stained with DAPI.
Normal sections show a high density of PLP+ and CC1+ cells. CPZ diet results in regional decreases in PLP+
cells and CC1+ cells between 6 and 12wks. C. Quantification of MBP percent area reveals progressive
decreases in dLGN myelination which reach significance compared to normal after 9 and 12wks of CPZ diet.
D-E. Cell counts of PLP+ and CC1+ cells show significantly decreased numbers of PLP+ cells after 6 and
12wks CPZ diet, and decreased numbers of CC1+ cells after 6 and 9wks CPZ diet. n=5 mice per group.
**P<0.001, *** P<0.001, ordinary one-way ANOVA with Kruskal-Wallis multiple comparison test. Scale bar is
100µm.

116
CPZ demyelination results in early inflammatory responses, decreases in PV
immunoreactivity in the dLGN.
To quantify the extent of microglial activation and astrogliosis in the dLGN
throughout progressive CPZ-induced demyelination, coronal sections from PLP-EGFP
normal, 3, 6, 9, and 12wk CPZ mice were immunostained for Iba1 and GFAP, then co-
stained with DAPI. Normal sections displayed Iba1 immunoreactivity throughout the
dLGN with microglia exhibiting ramified and thus “resting” morphology (Figure 5.5A).
In contrast, GFAP immunoreactivity was present primarily at the borders of the LGN.
Sections from CPZ mice showed increased Iba1 immunoreactivity compared to normal
after 3 and 6wks of CPZ diet but not at later timepoints such as 9 and 12wk (Figure 5.5A,
C). GFAP immunoreactivity was increased compared to normal after 3, 9 and 12wks of
CPZ diet but not at 6wks (Figure 5.5A, D).
To evaluate CPZ mediated effects on neuronal populations in the dLGN, sections
were immunostained for NeuN and PV, then co-stained with DAPI. In normal sections,
NeuN staining was localized to neuronal nuclei and remained fairly consistent across CPZ
groups (Figure 5.5B). Normal sections exhibited PV staining in a high density of fibers
primarily localized within the core of the dLGN. The pattern of PV immunoreactivity
changed substantially as CPZ demyelination progressed, with ectopic axonal staining
evident in 12wk CPZ sections both within the core and shell of the dLGN (white arrows).
PV immunoreactivity was also significantly decreased after 9 and 12wks of CPZ diet,
however the number of NeuN+ cells was unchanged at all CPZ timepoints compared to
normal (Figure 5.5E, F).

117
Figure 5.5: CPZ demyelination induces early inflammatory responses, some of which are resolved, and
decreases in PV immunoreactivity late in disease within the dLGN. A. Coronal sections containing the
dLGN were obtained from PLP-EGFP mice, immunostained for Iba1 and GFAP, co-stained for DAPI, and
imaged at 20x magnification. Normal sections show Iba1+ microglia throughout the dLGN with ramified
morphology, and GFAP+ astrocytes primarily constrained to the borders of the dLGN. Sections from 3wk
CPZ mice show increases in overall microglial immunoreactivity and the presence of two lesions. Microglia
which are not present in the lesions maintain a ramified structure, however those comprising the lesion appear
hypertrophied. No lesions are observed in sections from 6wk CPZ mice however Iba1 immunoreactivity
remains high compared to normal sections. Sections from 9wk CPZ mice show decreased Iba1
immunoreactivity throughout the dLGN, whereas 12wk CPZ sections show areas of high microglial presence
indicative of lesions, and areas almost completely absent of microglia. GFAP+ astrocytes show significant
infiltration into the dLGN from the dorsal borders after 3wk CPZ diet. A few astrocytes are present in the
interior of the dLGN after 9wk CPZ diet. Sections from 12wk CPZ mice exhibit extensive astrocytic presence
within the interior of the dLGN, primarily bordering lesions containing high numbers of microglia. B.
Sections were immunostained for NeuN and PV and imaged at 20x. NeuN immunoreactivity is localized to
neuronal nuclei, and remains relatively consistent between normal and CPZ groups. PV immunoreactivity in
normal sections is primarily localized to neuropil in the dLGN. CPZ groups exhibit substantial changes to
pattern of PV immunostaining and decreased overall PV immunoreactivity after 9 and 12wks of CPZ diet.
Sections from 12wk CPZ mice also show ectopic PV axonal staining indicated by the white arrows. C. Iba1
immunoreactivity is significantly increased compared to normal after 3 and 6wks of CPZ diet, but is
decreased to a point not significantly different from normal at 9 and 12wks. D. GFAP immunoreactivity is
significantly increased compared to normal after 3, 9 and 12wks CPZ diet, but not at 6wks. E. PV percent
area is significantly decreased after 9 and 12wks of CPZ diet compared to normal. F. The number of NeuN + cells is unchanged between groups. n=5 mice per group. *P<0.05, *** P<0.001, **** P<0.0001, ordinary
one-way ANOVA with Kruskal-Wallis multiple comparison test. Scale bar is 100µm.

118
CPZ diet induces progressive demyelination and OL loss in the visual cortex.
The visual cortex undergoes significant pathological changes in MS and in EAE
including decreased volume and demyelination(Gabilondo et al., 2014; Gabilondo et al.,
2017; Girolamo et al., 2011; Petracca et al., 2017). As described, the CPZ diet induces
demyelination, inflammatory responses, astrogliosis and neuronal loss in more anterior
portions of the visual pathway. Because the visual cortex is susceptible to demyelination
and inflammation induced neurodegenerative deficits, as well as trans-synaptic
neurodegeneration(You et al., 2012), an assessment of CPZ diet effects within the visual
cortex was necessary. V1 is the primary image forming locus of the visual system and thus
pathological changes due to CPZ diet may have significant implications for afferent visual
system function.
To determine CPZ diet induced changes to V1 myelination and OL populations,
sections were obtained from normal, 3, 6, 9, and 12wk CPZ PLP-EGFP mice, and
immunostained for MBP and CC1. Sections from normal mice showed high levels of MBP
immunoreactivity throughout the cortex, with slightly lower levels within the superficial
layers and layer 5-6 (Figure 5.6A). Similar to the LGN, V1 exhibited progressive
demyelination which reached significance compared to normal after 9 and 12wks of CPZ
diet (Figure 5.6A, C). In normal sections, PLP+ premyelinating and mature myelinating
OLs, and CC1+ mature myelinating OLs, were observed throughout layer 4 at medium
densities, with many cells expressing both markers (Figure 5.6B). The number of PLP+
cells in CPZ sections showed progressive decreases which reached significance after 9 and

119
12wk CPZ diet (Figure 5.6B, D). In contrast, CC1+ cell number was significantly reduced
compared to normal controls by at least 6-fold after 6, 9, and 12wks of CPZ diet (Figure
5.6B, E).
Figure 5.6: Progressive demyelination and OL loss are evident in V1 of CPZ mice. A. Coronal sections
containing V1 were obtained from normal controls, and 3, 6, 9, and 12wk CPZ PLP-EGFP mice,
immunostained for MBP, co-stained for DAPI, and imaged at 10x magnification. Normal sections show
robust myelination throughout V1 with some decreases evident in superficial cortical layers and layer 5-6.
CPZ diet results in progressive decreases in cortical myelination which are evident as early as after 3wks of
CPZ diet. After 9wks, almost no cortical myelin remains, and after 12wks, callosal myelin is severely
depleted as well. B. Sections were immunostained for CC1, co-stained for DAPI, and imaged at 20x
magnification. Normal sections show high numbers of PLP+ cells and CC1+ cells at medium densities
throughout layer 4 of V1. CPZ diet resulted in a progressive decrease in PLP+ cells, and CC1+ cells. C.
Quantification of MBP percent area revealed progressive demyelination in V1 which reaches significance
after 9 and 12wks CPZ diet. D. Progressive loss of PLP+ cells reaches significance after 9 and 12wks of CPZ
diet. E. CC1+ cell numbers are significantly decreased after 6, 9 and 12wks of CPZ diet. n=5 mice per group.
*P<0.05, **P<0.001, *** P<0.001, **** P<0.0001, ordinary one-way ANOVA with Kruskal-Wallis multiple
comparison test. Scale bar is 100µm.
120
Early inflammatory responses and late astrogliosis are features of CPZ-induced pathology
in the visual cortex.
Astrogliosis and changes to microglial presence in V1 were quantified by
immunostaining sections for Iba1 and GFAP. Normal sections showed medium densities
of Iba1+ microglia with ramified morphologies indicative of a “resting” phenotype (Figure
5.7A). Low densities of GFAP+ astrocytes were present in normal, with primary
immunoreactivity exhibited in the meningeal glia limitans border. V1 exhibited increased
microglial presence compared to normal primarily after 3, 6, and 9wks of CPZ diet (Figure
5.7A, C). In contrast significant increases to GFAP immunoreactivity were not observed
until after 9 and 12wks of CPZ diet (Figure 5.7A, D). Changes to microglia and astrocytes
in V1 are in stark contrast to observations in the optic tract (Figure 5.3A-C) and dLGN
(Figure 5.5A, C, D), in which astrogliosis occurs early and concurrently with increased
microglial presence. Neuron numbers and PV+ interneurons were quantified by
immunostaining V1 sections for NeuN and PV. Normal sections showed high densities of
smaller NeuN+ cells within layer 4A and 4C, and low densities of larger neurons in layer
4B. PV+ cells were present throughout layer 4 but at lower densities than NeuN+ cells.
PV+ neuropil was also observed, primarily within layer 4B (Figure 5.7B). No significant
differences in neuronal populations were observed between groups (Figure 5.7B, E, F).
There were, however, CPZ-induced decreases in PV+ neuropil staining compared to normal
in 3, 6, and 12wk CPZ sections (Figure 5.7B).

121
Figure 5.7: Toxic CPZ diet induces early microglial activation and late astrogliosis, but insignificant
changes to neuron numbers in V1. A. Coronal sections obtained from normal controls, and 3, 6, 9, and
12wk CPZ PLP-EGFP mice were immunostained for Iba1 and GFAP, co-stained for DAPI, and imaged at
10x magnification. Normal sections show low Iba1 immunoreactivity overall, primarily present in ramified
“resting” microglia. GFAP immunoreactivity is also low within the interior of the cortex and is highest within
the glia limitans of the meninges. CPZ diet induces increases in V1 Iba1 immunoreactivity in sections from
3, 6, 9 and 12wk CPZ mice, and V1 GFAP immunoreactivity in sections from 9 and 12wk CPZ mice. B.
Sections were immunostained for NeuN and PV, co-stained for DAPI, and imaged at 20x magnification.
Normal sections show high densities of small NeuN+ cells in layers 4A and 4C, and medium densities of
large NeuN+ cells in layer 4B. PV immunoreactivity is evident in low densities of neurons interspersed
throughout layer 4, and neuropil primarily within layer 4B. Sections from CPZ diet mice exhibit similar
numbers of NeuN+ cells and PV+ cells throughout layer 4, but decreased PV+ dendritic staining within layer
4B. C-D. Quantification of Iba1 and GFAP immunoreactivity reveals significantly increased microglial
presence after 3, 6, and 9wks, and significant astrogliosis after 9 and 12wks of CPZ diet. E-F. No differences
in NeuN+ or PV+ cells are observed between groups. n=5 mice per group. *P<0.05, **P<0.001, *** P<0.001,
**** P<0.0001, ordinary one-way ANOVA with Kruskal-Wallis multiple comparison test. Scale bar is 100µm.
Axons of RGCs, which leave the retina and comprise the optic nerve are
demyelinated and undergo significant changes to inflammatory glial populations under the
toxic CPZ diet. Demyelination, astrogliosis, and microglial activation after
lipopolysaccharide injection into the optic nerve are associated with upstream RGC loss
(Aranda et al., 2015), similar to events observed in EAE(Jin et al., 2019). Such pathological

122
deficits in the CPZ model may precipitate upstream RNFL and RGC degeneration and
dysfunction.
Additionally, photoreceptors within the retina have high energy demands and rely
heavily on their mitochondria for phototransduction of light stimuli(Country, 2017). Cells
of the RPE are also involved in phototransduction and similarly require high levels of
ATP(Country, 2017). Because CPZ-induced damage to OLs is thought to be partially
mediated by insufficient energy production due to significant deficiencies in copper
availability, photoreceptors and pigment epithelial cells within the retina may similarly be
susceptible to CPZ-induced damage and functional deficits.
CPZ diet results in posterior retinal pathology.
To evaluate retinal pathology in the CPZ model, retinas of live anesthetized normal
and CPZ diet PLP-EGFP mice were examined using OCT after 3, 6, 9, and 12wks of CPZ
diet. OCT dataplots of the temporal retina were obtained just lateral to the optic nerve
(Figure 5.8A-i). Bioptigen/Leica software was used to automatically segment retinal layers
(Figure 5.8A-ii) and quantify the thickness of the whole retina, RNFL, GCL+IPL,
INL+OPL, ONL+PR, and RPE. Overall retinal thickness was increased after 6 and 12wks
of CPZ diet compared to normal controls (Figure 5.8B). Interior retinal layers including
the RNFL, GCL+IPL, and INL+OPL were not changed at any CPZ timepoint. The PL
exhibited significant decreases in thickness after 9 and 12wks of CPZ diet whereas the
thickness of the RPE was increased after 6, 9 and 12wks.

123
Figure 5.8: CPZ diet induces pathological changes in posterior retinal layers. In vivo OCT data plots
were obtained from live anesthetized normal controls, and CPZ mice, after 3, 6, 9 and 12wks of CPZ diet.
Data plots were analyzed to determine individual layer thicknesses. A. Representative OCT data plot of the
temporal retina with optic nerve identified for orientation (i). Automatic segmentation was performed using
Bioptigen/Leica segmentation software. Retinal layers identified include the RNFL, GCL+IPL, INL, OPL,
ONL, OLM, PR, RPE and choroid (ii). B. Whole retina thickness is increased compared to normal after 6
and 12wks CPZ diet. RNFL, GCL+IPL, and INL+OPL layers are unaffected throughout CPZ administration.
CPZ diet induces significant decreases in ONL+PR thickness after 9 and 12wks, and increases in RPE
thickness after 6, 9 and 12wks compared to normal. n=5 mice per group. *P<0.05, **P<0.001, *** P<0.001,
**** P<0.0001, ordinary one-way ANOVA with Kruskal-Wallis multiple comparison test. Scale bar is 100µm.
Retinal function is not minimally impaired in CPZ mice.
In order to assess the effect of CPZ demyelination on retinal function, flash ERGs
were obtained from live anesthetized normal and CPZ mice after 3, 6, 9, and 12wks of CPZ
diet. Normal ERGs consist of an initial downward deflection of the ERG occurring around
20ms and labeled as the A-wave, followed by a sharp increase in electrical potential

124
peaking at 40ms and referred to as the B-wave (Figure 5.9A). Normal amplitudes average
at approximately 200 µV for the A-wave and 500µV for the B-wave. CPZ mice exhibited
minimal deficits in retinal function compared to normal controls. Photoreceptor generated
A-wave response time to stimulus were unaffected at all CPZ timepoints (Figure 5.9B).
However, B-wave response time to stimulus, a result of retinal interneuron, RGCs, and
Muller glia activity, were decreased compared to normal controls after 6 and 12wks of CPZ
diet, indicating hyperactivity of those cell types. Neither A-wave nor B-wave amplitudes
were significantly changed in CPZ diet groups (Figure 5.9C).
Figure 5.9: Retinas of CPZ mice exhibit few functional deficits. ERGs were obtained from live
anesthetized normal controls, and CPZ mice after 6, 9, and 12wks of CPZ diet. A. Sample traces obtained by
averaging ERG traces of all mice in individual experimental groups. A-wave and B-wave are identified for
orientation. In the normal ERG trace, the A-wave occurs at approximately 20ms with an amplitude of 200µV.
The B-wave occurs around 40ms with an amplitude of approximately 500µV. Traces from 6 and 9wk CPZ
groups exhibit slightly faster A- and B- wave response times, as well as increased B-wave amplitudes
compared to normal. B. Quantification of A- and B-wave response times reveal no significant differences in
A-wave latencies between groups, but significant decreases in B-wave response times after 6 and 9wks of
CPZ diet. C. Neither A- nor B- wave amplitudes are significantly different between normal and CPZ groups.
n=5 mice per group. *P<0.05, **P<0.001, ordinary one-way ANOVA with Kruskal-Wallis multiple
comparison test.

125
Visual function is partially impaired in CPZ mice.
To investigate CPZ-induced effects on visual pathway function, in vivo flash VEPs
were obtained from live anesthetized normal or 6, 9 and 12wk CPZ mice. Normal mice
exhibited robust VEPs, with P1 peaks typically occurring 20ms after stimulus, and with
amplitudes of approximately 50µV (Figure 5.10A). N2 peaks occurred approximately
40ms after stimulus and had an average amplitude of 90µV. The CPZ diet resulted in few
changes to VEPs compared to normal. The P1 latency of 9wk CPZ mice was significantly
decreased, and the N2 amplitude of 6wk CPZ mice significantly increased compared to
normal (Figure 5.10B, C).
Figure 5.10: CPZ diet and visual pathway demyelination elicits minimal changes to visual pathway
function. VEPs were obtained from live anesthetized normal controls, and CPZ mice after 6, 9, and 12wks
of CPZ diet. A. Sample traces obtained by averaging VEP traces of all mice in individual experimental
groups. P1 and N2 peaks are identified for orientation. In the normal VEP trace, the P1 occurs at
approximately 20ms with an amplitude of 50µV. N2 occurs around 40ms with an amplitude of approximately
90µV. Representative trace from the 6wk CPZ group shows higher N2 amplitude than those generated by
normal controls. Representative trace from the 9wk CPZ group exhibits slightly faster P1 response time, and
increased B-wave amplitude compared to normal. B. Quantification of P1 and N2 response times reveals no
significant differences in latencies between groups, except for a latency decrease in the P1 peak of 9wk CPZ
mice with respect to normal. C. P1 amplitudes are not changed between normal and CPZ groups, however
the N2 amplitude is significantly increased at the 6wk CPZ timepoint compared to normal. n=5 mice per
group. *P<0.05, **P<0.001, ordinary one-way ANOVA with Kruskal-Wallis multiple comparison test.

126
Discussion
In contrast to EAE, CPZ diet induced progressive and extensive demyelination
across the posterior visual pathway which was not coupled to overt functional deficits or
axon damage. Furthermore, CPZ animals exhibited increased levels of microglial
activation throughout disease progression. Microglia may have exerted neuroprotective
effects during CPZ demyelination that were not available in EAE.
CPZ-induced demyelination, microglial inflammation, and astrogliosis
During CPZ demyelination, mature OLs undergo apoptosis resulting in microglial
recruitment and subsequent demyelination(Matsushima and Morell, 2001). Activated
Microglia/macrophages are present in the corpus callosum within 2 weeks of starting CPZ
diet, increased at 3 weeks, and peak between 4-6 weeks(Hiremath et al., 1998). In fact, the
only immune cells which have been found in demyelinated areas are microglia and
macrophages (Hiremath et al., 2008). Similar to the above reports, we observed increased
levels of microglial presence prior to overt demyelination in posterior visual pathway
structures. We did not observe any changes to axon morphology indicating that CPZ
demyelination did not result in significant axonal damage in the posterior visual system.
This result was in stark contrast to the EAE model in which demyelination and
severe OL loss preceded overt microglial presence, and subsequent axonal damage.
Although the lack of microglial activation was surprising in EAE, the notable absence may
have contributed to the severity of axon damage later occurring in the optic tract, and
progressive neuronal loss in V1.

127
Among other roles, microglia/macrophages work to clear myelin debris at
demyelination sites(Blakemore, 1972; Smith, 1999). Furthermore, when exhibiting an
immunomodulatory M2 phenotype, they promote OPC migration survival and
differentiation (Butovsky et al., 2006; Miron et al., 2013; Miron, 2017; Morell et al., 1998;
Pang et al., 2013). In the CPZ model, microglia may express a similar M2 phenotype during
demyelination, as waves of remyelination were observed in the optic tract at 9wks, and the
number of OLs was not as severely depleted in most posterior visual pathway areas as in
EAE.
Microglia have also been shown to directly protect neurons during disease. Under
injury conditions, microglia have been shown to ensheathe injured neurons and reversibly
strip axosomatic inhibitory synapses, in a mechanism that is associated with
neuroprotection from subsequent damage(Blinzinger and Kreutzberg, 1968; Chen et al.,
2012; Chen et al., 2014). The removal of inhibitory synapses by microglia can result in
increased firing of synaptic NMDA receptors, which has been shown to stimulate anti-
apoptotic and anti-necrotic pathways(Chen et al., 2014; Hardingham and Bading, 2003).
In the posterior visual pathway, we observed increased microglial presence,
decreases in the area covered by PV+ neuropil in the dLGN, faster VEP response times to
light stimulus, and increased VEP amplitudes. Taken together these CPZ-induced changes
are indicative of decreased inhibition within the visual pathway. Hyperactivity in CPZ mice
is not limited to the visual pathway. Our lab and others have previously reported significant
increases in seizure activity in CPZ mice, indicating a loss of inhibition in other CNS

128
regions (Hoffmann et al., 2008; Lapato et al., 2017). It is possible that increased
hyperactivity of visual pathway function during CPZ diet may have been associated with
microglial removal of inhibitory synapses in the posterior visual system, however further
investigation is necessary.
Astrocytic activation was increased throughout CPZ demyelination in the optic
tract, and primarily after 9 and 12wks of CPZ in the dLGN and V1. Studies from our lab
and many other studies have reported similar CPZ-induced increases in astrogliosis in other
CNS regions such as the corpus callosum (Carlton, 1969; Gudi et al., 2009; Lapato et al.,
2017; Yamate-Morgan et al., 2019), hippocampus (Koutsoudaki et al., 2009; Lapato et al.,
2017), cortex(Skripuletz et al., 2008), cerebellum (Skripuletz et al., 2010), and basal
ganglia (Pott et al., 2009). Under CPZ demyelination conditions, astrocytes produce growth
factors that like microglial derived compounds, promote OPC proliferation, and regulate
OL differentiation and survival (Gudi et al., 2014). Astrocytes also assist microglia in their
invasion of demyelinated lesion sites and their ablation results in delayed removal of
myelin debris, OPC proliferation, remyelination, and decreased numbers of mature OLs
during remyelination (Skripuletz et al., 2013). As such astrocytes may also exert a
neuroprotective role during CPZ-induced demyelination of the visual pathway, and cross-
talk between astrocytes and microglia may also have contributed to the decreased level of
neuronal damage observed in CPZ as compared to EAE.

129
Retinal Pathology
CPZ diet resulted in changes in retinal layer thickness that were confined to the
posterior retina. The layers corresponding to the photoreceptors were significantly
decreased after prolonged CPZ diet, whereas the RPE layer thickened. RPE thickening
preceded thinning of the PLs indicating that RPE dysfunction may have precipitated
changes to the PL. Interestingly, morphological changes to the PLs did not result in direct
functional deficits, as the A-wave of the ERG was unaffected.
Thickening of the RPE has been reported in MS patients with optic neuritis(Droby
et al., 2016) and in pathological conditions associated with chronic inflammatory retinal
damage (Bonilha, 2008; Curcio et al., 2017; Gao and Hollyfield, 1992; Penfold et al.,
2001). Because photoreceptors rely heavily on the RPE for, re-isomerization of all-trans-
retinal to 11-cis-retinal, stabilizing ion composition in sub-retinal space and maintaining
photoreceptor excitability, and phagocytoses of shed photoreceptor outer segments, RPE
dysfunction is often associated with photoreceptor and retinal dysfunction (Strauss, 2005).
In addition, the RPE has a primary role in transporting ions and metabolic waste from the
subretinal space to the blood, transfer of nutrients from the blood to the subretinal space,
secretion of immunosuppressive factors, and maintenance of the blood retinal barrier
(Strauss, 2005). Thus CPZ-induced disruptions to the RPE could have significant effects
on retinal health, however further histological study is required to characterize cellular
changes in the retina during CPZ demyelination.
ERG

130
Retinal function as measured by ERGs was somewhat enhanced during CPZ
demyelination. ERG amplitudes were not significantly changed, however showed trends
toward increases at the 6 and 9wk timepoint. In contrast, one study of retinal function in
CPZ showed decreased amplitude of multifocal ERG (mfERG) after 6wks of CPZ diet,
contrary to our results (Namekata et al., 2014). The mfERG is the result of simultaneous
recordings of local ERG responses across many regions in the retina(Hood et al., 2003). In
contrast, the flash ERG used in this study utilizes one electrode to determine overall retinal
function. The stimulus paradigm is also vastly different in mfERGs, where rather than one
single illuminating stimulus across the retina, there are a number of hexagonal stimuli
which can be independently black or white at any given moment. As such, mfERGs can
confer changing edge-specific stimuli to retinal neurons. This results in increased
sensitivity to contrast-based deficits in the retina, which is not present in the flash ERG and
may explain the differing results observed.
Decreased latency of the b-wave was observed in CPZ mice after 6 and 9wks,
contrary to most results reported in MS patients in which b-wave latencies are either
unaffected or delayed (Coupland and Kirkham, 1982; Hamurcu et al., 2017;
Papakostopoulos et al., 1989). However, one recent study in MS patients similarly reported
shortened latencies of the b-wave in pattern ERGs which are particularly sensitive to RGC
activity (Monsalve et al., 2018). Monsalve and colleagues suggested that the increased
susceptibility of slower spiking midget RGCs to MS-induced optic neuritis, resulted in a
dropout of the contribution of these cells to the ERG, and thus faster overall latencies.
Midget RGCs contribute primarily to the parvocellular pathway, are particularly important

131
for identifying fine details (Sanes and Masland, 2015). The study confirmed that blurring
the edges of the pattern stimuli presented to normal patients, resulted in similar decreases
in latency (Monsalve et al., 2018). Furthermore, midget RGCs and the parvocellular
pathway have been previously been reported to be less robust to demyelination and axon
damage than their magnocellular counterparts (Evangelou et al., 2001; Mey and Thanos,
1993; Perez de Sevilla Muller et al., 2014).
Although overt axon damage axon damage was not observed in the optic tract in
CPZ mice, significant demyelination occurred. In fact virally induced demyelination of the
visual pathway including the optic nerve has also been shown to enhance ERG responses
rather than depress them (Tansey et al., 1986). To investigate the mechanisms associated
with demyelination induced enhancement of retinal responses, future studies may require
evaluating responses to pattern evoked potentials and histological assessments of midget
and parasol ganglion cells in 6 and 9wk CPZ mice.
In conclusion, the CPZ model can be employed to study progressive demyelination
in the visual pathway separate from peripheral immune involvement and axon damage.
Additionally, the potential neuroprotective role which microglia and astrocytes may have
under demyelinating conditions is intriguing and requires further study.

132
Chapter 6: Conclusion and prospects
6.1 Summary of Major Results
In the preceding work, the efficacy of the known remyelinating agent IndCl for
ameliorating visual pathway dysfunction was evaluated in the EAE mouse model of MS.
This model is the most commonly used animal model for MS as it closely recapitulates the
inflammatory demyelination and neurodegeneration observed in MS patients. Although
IndCl treatment resulted in robust remyelination of the visual pathway, this was not
associated with improvements in visual function, in contrast to currently and previously
published improvements to motor function(Karim et al., 2019b; Moore et al., 2014a). It
was hypothesized that a contributing factor to this discrepancy, was the extent of axon
damage present in the visual system in EAE mice: because loss of function in MS patients
is associated with progressive neuro-axonal damage, a remyelinating agent such as IndCl
given after overt neuro-axonal damage, may have been too little too late.
To evaluate this hypothesis, a longitudinal study of EAE induced damage to the
visual system was performed, with focus on the posterior visual system, as it has been
poorly studied in comparison to the anterior visual system in EAE. EAE mice exhibited
significant demyelination and OL loss at all assayed timepoints, but did not show severe
axon damage until after peak disease. Functional deficits were observed at all timepoints.
This indicated that an ideal therapeutic window could be between disease onset and at peak
disease. However further studies are needed in order to:
1. Further define the proposed therapeutic window.

133
2. Evaluate the efficacy of therapeutic IndCl in attenuating visual pathway
dysfunction, if given during the proposed therapeutic window.
Interestingly, ERG and VEP visual response times were increased early in EAE,
but were decreased back to normal levels at peak and late disease timepoints. This
phenomenon was indicative of spontaneous but partial functional recovery, and supports
observations in MS patients with optic neuritis who experience acute vision loss followed
by functional recovery. It was hypothesized that rather than being a result of spontaneous
remyelination, or progressive dropout of partially demyelinated axons leading to the VEP
primarily being contributed to fast-firing surviving axons, this event was due to
reorganization of sodium channels within the white matter tracts of the visual pathway.
However further study is required in order to:
3. Assess the progression of sodium channel reorganization in the optic
nerve and optic tract.
Posterior visual pathway pathology was then longitudinally investigated in another
commonly used animal model for MS, the CPZ demyelination model. Progressive
demyelination was observed in this model, but OL loss was not as severe as observed in
EAE, and axonal damage was not evident. Major differences between EAE and CPZ
pathological deficits include the presence of peripheral immune cell infiltration to the CNS
in EAE which is not an aspect of CPZ pathophysiology, and the observed higher levels of
microglial activation throughout the posterior visual pathway in CPZ compared to EAE.

134
Because lymphocytic infiltration has been implicated in exacerbated neuronal damage in
MS, and because microglia have been shown to exert neuroprotective effects on the CNS
during CPZ demyelination, it is postulated that these two factors may have may have
contributed to the exacerbated neurodegenerative damage in EAE. However, further
studies are needed to:
4. Investigate which aspect of the immune response contributes to axon
damage in the visual pathway.
6.2 Future Directions
1. Further investigation of the proposed therapeutic window
Future studies will require further examining the therapeutic window
proposed in this dissertation to determine an optimal timepoint for IndCl delivery
to attenuate visual pathway pathology. The ideal period would be after visual
deficits have been observed, such that subsequent findings would be translationally
relevant, but before overt axon damage. Furthermore, it is necessary to define a
point after which therapeutic treatment with IndCl, could no longer exert benefits
to visual function. Thus, it may be necessary to perform another longitudinal study
constrained to the times between EAE onset and EAE peak disease, and to observe
changes to axon morphology in the optic nerve and optic tract, as well as concurrent
changes to visual function.
2. Evaluation of the efficacy of therapeutic IndCl in attenuating visual pathway
dysfunction, if given during the proposed therapeutic window.

135
In conjunction with the proposed longitudinal study between EAE onset and
peak disease IndCl could be provided to a separate cohort of EAE mice starting at
each timepoint assessed in the longitudinal study, and through euthanasia. Axon
damage and neuronal loss could be assessed for each IndCl treatment group to
determine whether early remyelination with IndCl treatment prevents further
axonal damage. ERG and VEP functional assessments could also be performed on
each treatment group prior to euthanasia to determine the extent of axon damage
that can occur before treatment with IndCl becomes ineffective.
3. Assessment of the progression of sodium channel reorganization in the optic
nerve and optic tract during EAE.
Sections containing visual pathway structures from this and other
longitudinal studies could be stained for sodium channel markers such as Nav1.2
and Nav1.6 to investigate changes in the distribution of sodium channels
throughout EAE progression. Special focus could be given to the time periods
between EAE induction and EAE onset, and between EAE onset and EAE peak
disease as the most drastic changes to the VEP and ERGs during this period.
4. Investigation of which aspect of the immune response contributes to axon
damage in the visual pathway.
Remyelination was not sufficient to attenuate visual pathway dysfunction
in EAE, which in addition to the timing of administration, could also be due to the
involvement of peripheral lymphocytes in EAE pathophysiology. To isolate this
potential contribution, studies on lymphocyte involvement could be performed

136
using antibodies against T-cell and/or B-cell subtypes. A humanized version of
such antibody alemtuzumab, inhibits T cell responses, alleviates inflammatory
responses during relapses, and is already approved for use in MS patients however
has limited efficacy in preventing long-term disability progression in MS
patients(Ruck et al., 2015). If early axon damage were attenuated in mice treated
with alemtuzumab it could indicate that co-therapy with a remyelinating agent such
as IndCl and an immunomodulatory agent like alemtuzumab, may improve
therapeutic outcomes in the visual system, potentially even if given at peak disease.
Additionally, the peripherally mediated immune response may be
dominated by different inflammatory phenotypes at different stages of disease. For
instance, early and peak disease stages may be characterized by more pro-
inflammatory lymphocytes, and chronic disease stages by more quiescent
lymphocytes. Such differences could contribute to demyelination and axonal
damage in different ways. The adoptive transfer EAE model, in which
encephalitogenic T-lymphocytes are obtained from donor EAE mice and used to
induce EAE in a second cohort of naïve recipient mice, could be used to examine
the effects of T-lymphocytes obtained at early, peak and late disease stages on
demyelination and axon damage in the recipient mouse. Chemokine and cytokine
analyses could be performed on donor splenocytes, to ascertain the phenotypic
profile of these cells at different EAE timepoints, and potentially to correlate
pathological deficits in myelination and axon health to differential cytokine and
chemokine production. This could yield more focused immunomodulatory

137
therapeutic targets that could be provided in conjunction with a remyelinating
agent.
The results of the preceding study indicate that administration of
remyelinating agents at peak disease is insufficient to recover axons, and that early
administration prior to overt axon damage may be necessary to generate functional
benefits. Future studies should thus investigate the therapeutic potential of
remyelinating agents for the visual pathway when provided soon after disease
onset. However, such an approach is not always possible in MS patients who may
not be diagnosed with MS-induced visual deficits until significant
neurodegeneration within the visual pathway has occurred. As such, approaches
that can be used outside of the proposed therapeutic window, between onset and
peak clinical disease, are necessary. The extensive axon damage evident in the
lymphocyte-mediated EAE model is in sharp contrast to the minimal effects on
axon and neuron health observed in the non-lymphocyte-mediated CPZ model
within the visual system. These differential effects indicate a potential role for
lymphocytes in exacerbating axon and neuron damage in the visual system during
EAE. Further investigation of the peripherally mediated immune response in EAE
may yield therapeutic targets that when combined with remyelinating therapies may
attenuate neurodegenerative damage and thus is vital for the progression of MS
research.

138
Appendix
A.1 Supplementary figures
Figure A.1: EAE does not induce significant changes to the broadness of the VEP peak. A. Sample
normal VEP trace with widths used for calculating full width half maximums (FWHM) identified (i). P1
peak was plotted from baseline (red dashed line) fitted with gaussian curve (green line), and FWHM (a) was
calculated from gaussian curve (ii). N2 peak exhibited asymmetric features. N2 peak was split into individual
tails around the N2 peak amplitude. Individual tails were mirrored to generate N2 left peak (iii), and N2 right
peak (iv). N2 left and right peaks were fitted with two separate gaussians (blue and orange lines respectively,
and individual FWHM values were calculated for each mirrored peak. FWHM values were averaged to
approximate FWHM of original N2 data. B-C. No significant differences in peak broadness were observed
between groups for P1 or N2 peaks.

139
A.2 References
. MS Prevalence. Vol., ed.^eds. National Multiple Sclerosis Society.
2001. Randomized controlled trial of interferon- beta-1a in secondary progressive MS: Clinical
results. Neurology. 56, 1496-504.
Agetsuma, M., et al., 2018. Parvalbumin-Positive Interneurons Regulate Neuronal Ensembles in
Visual Cortex. Cereb Cortex. 28, 1831-1845.
Aharoni, R., et al., 2008. Demyelination arrest and remyelination induced by glatiramer acetate
treatment of experimental autoimmune encephalomyelitis. Proceedings of the National
Academy of Sciences of the United States of America. 105, 11358-11363.
Ahlfors, S.P., Ilmoniemi, R.J., Hamalainen, M.S., 1992. Estimates of visually evoked cortical
currents. Electroencephalogr Clin Neurophysiol. 82, 225-36.
Al-Abdulla, N.A., Martin, L.J., 2002. Projection neurons and interneurons in the lateral geniculate
nucleus undergo distinct forms of degeneration ranging from retrograde and transsynaptic
apoptosis to transient atrophy after cortical ablation in rat. Neuroscience. 115, 7-14.
Al-Louzi, O.A., et al., 2016. Outer retinal changes following acute optic neuritis. Mult Scler. 22,
362-72.
Al-Shamsi, M., et al., 2015. Bioenergetics of the spinal cord in experimental autoimmune
encephalitis of rats. BMC Neurosci. 16, 37.
Alme, M.N., et al., 2015. Fingolimod does not enhance cerebellar remyelination in the cuprizone
model. J Neuroimmunol. 285, 180-6.
Andersen, O., et al., 2018. Diffusion tensor imaging in multiple sclerosis at different final
outcomes. Acta Neurol Scand. 137, 165-173.
Anlar, O., et al., 2003. Visual evoked potentials in multiple sclerosis before and after two years of
interferon therapy. Int J Neurosci. 113, 483-9.
Aranda, M.L., et al., 2015. Experimental optic neuritis induced by the microinjection of
lipopolysaccharide into the optic nerve. Exp Neurol. 266, 30-41.
Araujo, S.E.S., et al., 2017. Inflammatory demyelination alters subcortical visual circuits. J
Neuroinflammation. 14, 162.
Arevalo, M.A., et al., 2010. Actions of estrogens on glial cells: Implications for neuroprotection.
Biochim Biophys Acta. 1800, 1106-12.
Arezzo, J.C., et al., 1988. Electrophysiological analysis of factors involved in the primary
demyelinating diseases: the rabbit eye model system. Brain Res. 462, 286-300.
Arshavsky, V.Y., Lamb, T.D., Pugh, E.N., Jr., 2002. G proteins and phototransduction. Annu Rev
Physiol. 64, 153-87.

140
Atkinson, K.C., et al., 2019. Diffusion tensor imaging identifies aspects of therapeutic estrogen
receptor beta ligand-induced remyelination in a mouse model of multiple sclerosis.
Neurobiol Dis. 130, 104501.
Azcoitia, I., et al., 2010. Role of astroglia in the neuroplastic and neuroprotective actions of
estradiol. European Journal of Neuroscience. 32, 1995-2002.
Backner, Y., Levin, N., 2018. Keep Your Eyes Wide Open: On Visual- and Vision-Related
Measurements to Better Understand Multiple Sclerosis Pathophysiology. J
Neuroophthalmol. 38, 85-90.
Backner, Y., et al., 2019. Vision and Vision-Related Measures in Progressive Multiple Sclerosis.
Front Neurol. 10, 455.
Bakker, D.A., Ludwin, S.K., 1987. Blood-brain barrier permeability during Cuprizone-induced
demyelination. Implications for the pathogenesis of immune-mediated demyelinating
diseases. J Neurol Sci. 78, 125-37.
Balabanov, R., et al., 2006. Suppressor of cytokine signaling 1 expression protects
oligodendrocytes from the deleterious effects of interferon-gamma. J Neurosci. 26, 5143-
52.
Balatoni, B., et al., 2007. FTY720 sustains and restores neuronal function in the DA rat model of
MOG-induced experimental autoimmune encephalomyelitis. Brain Res Bull. 74, 307-16.
Balcer, L.J., et al., 2015. Vision and vision-related outcome measures in multiple sclerosis. Brain.
138, 11-27.
Balcer, L.J., et al., 2017. Validity of low-contrast letter acuity as a visual performance outcome
measure for multiple sclerosis. Mult Scler. 23, 734-747.
Balk, L.J., et al., 2015. Bidirectional trans-synaptic axonal degeneration in the visual pathway in
multiple sclerosis. J Neurol Neurosurg Psychiatry. 86, 419-24.
Bannerman, P.G., et al., 2005. Motor neuron pathology in experimental autoimmune
encephalomyelitis: studies in THY1-YFP transgenic mice. Brain. 128, 1877-86.
Barber, A.N., Ronstrom, G.N., Muelling, R.J., Jr., 1954. DEVELOPMENT OF THE VISUAL
PATHWAY: OPTIC CHIASM. JAMA Ophthalmology. 52, 447-453.
Baxi, E.G., et al., 2017. Lineage tracing reveals dynamic changes in oligodendrocyte precursor
cells following cuprizone-induced demyelination. Glia. 65, 2087-2098.
Beck, R.W., et al., 1992. A randomized, controlled trial of corticosteroids in the treatment of acute
optic neuritis. The Optic Neuritis Study Group. N Engl J Med. 326, 581-8.
Behbehani, R., et al., 2017. Optical coherence tomography segmentation analysis in relapsing
remitting versus progressive multiple sclerosis. PLoS One. 12, e0172120.
Berkelaar, M., et al., 1994. Axotomy results in delayed death and apoptosis of retinal ganglion cells
in adult rats. J Neurosci. 14, 4368-74.

141
Bettelli, E., et al., 2003. Myelin oligodendrocyte glycoprotein-specific T cell receptor transgenic
mice develop spontaneous autoimmune optic neuritis. J Exp Med. 197, 1073-81.
Bickford, M.E., et al., 2015. Retinal and Tectal "Driver-Like" Inputs Converge in the Shell of the
Mouse Dorsal Lateral Geniculate Nucleus. J Neurosci. 35, 10523-34.
Blakemore, W.F., 1972. Observations on oligodendrocyte degeneration, the resolution of status
spongiosus and remyelination in cuprizone intoxication in mice. J Neurocytol. 1, 413-26.
Blanco, R., et al., 2014. Functional assessment of the visual pathway with multifocal visual evoked
potentials, and their relationship with disability in patients with multiple sclerosis. Mult
Scler. 20, 183-91.
Blinzinger, K., Kreutzberg, G., 1968. Displacement of synaptic terminals from regenerating
motoneurons by microglial cells. Zeitschrift für Zellforschung und Mikroskopische
Anatomie. 85, 145-157.
Bock, M., et al., 2012. Impairment of contrast visual acuity as a functional correlate of retinal nerve
fibre layer thinning and total macular volume reduction in multiple sclerosis. Br J
Ophthalmol. 96, 62-7.
Bonilha, V.L., 2008. Age and disease-related structural changes in the retinal pigment epithelium.
Clinical ophthalmology (Auckland, N.Z.). 2, 413-424.
Bostock, H., Sears, T.A., 1978. The internodal axon membrane: electrical excitability and
continuous conduction in segmental demyelination. J Physiol. 280, 273-301.
Bove, R., Chitnis, T., Houtchens, M., 2014. Menopause in multiple sclerosis: therapeutic
considerations. J Neurol. 261, 1257-68.
Brambilla, R., et al., 2012. Transgenic inhibition of astroglial NF-kappaB protects from optic nerve
damage and retinal ganglion cell loss in experimental optic neuritis. J Neuroinflammation.
9, 213.
Brosnan, C.F., et al., 1989. Preliminary studies of cytokine-induced functional effects on the visual
pathways in the rabbit. Journal of Neuroimmunology. 25, 227-239.
Brown, K.T., 1968. The electroretinogram: Its components and their origins. Vision Research. 8,
633-IN6.
Browne, P., et al., 2014. ATLAS OF MULTIPLE SCLEROSIS 2013: A GROWING GLOBAL
PROBLEM WITH WIDESPREAD INEQUITY. Neurology. 83, 1022-1024.
Bruce-Keller, A.J., et al., 2000. Antiinflammatory effects of estrogen on microglial activation.
Endocrinology. 141, 3646-56.
Bureau, I., von Saint Paul, F., Svoboda, K., 2006. Interdigitated Paralemniscal and Lemniscal
Pathways in the Mouse Barrel Cortex. PLOS Biology. 4, e382.
Butovsky, O., et al., 2006. Microglia activated by IL-4 or IFN-gamma differentially induce
neurogenesis and oligodendrogenesis from adult stem/progenitor cells. Mol Cell Neurosci.
31, 149-60.

142
Buzzard, T., 1893. Atrophy of the optic nerve as a symptom of chronic disease of the central
nervous system. The British Medical Journal. 2, 770-784.
Carlton, W.W., 1969. Spongiform encephalopathy induced in rats and guinea pigs by cuprizone.
Experimental and Molecular Pathology. 10, 274-287.
Carson, M.J., 2002. Microglia as liaisons between the immune and central nervous systems:
Functional implications for multiple sclerosis. Glia. 40, 218-231.
Castoldi, V., et al., 2019. Non-invasive visual evoked potentials to assess optic nerve involvement
in the dark agouti rat model of experimental autoimmune encephalomyelitis induced by
myelin oligodendrocyte glycoprotein. Brain Pathol.
Cerciat, M., et al., 2010. Selective estrogen receptor modulators decrease the production of
interleukin-6 and interferon-gamma-inducible protein-10 by astrocytes exposed to
inflammatory challenge in vitro. Glia. 58, 93-102.
Chen, Z., et al., 2012. Lipopolysaccharide-induced microglial activation and neuroprotection
against experimental brain injury is independent of hematogenous TLR4. J Neurosci. 32,
11706-15.
Chen, Z.H., et al., 2014. Microglial displacement of inhibitory synapses provides neuroprotection
in the adult brain. Nature Communications. 5, 12.
Chiaravalloti, N.D., DeLuca, J., 2008. Cognitive impairment in multiple sclerosis. Lancet Neurol.
7, 1139-51.
Clements, R.J., McDonough, J., Freeman, E.J., 2008. Distribution of parvalbumin and calretinin
immunoreactive interneurons in motor cortex from multiple sclerosis post-mortem tissue.
Exp Brain Res. 187, 459-65.
Coffey, P.J., et al., 1988. Ibotenic acid induced demyelination in the central nervous system: a
consequence of a local inflammatory response. Neurosci Lett. 84, 178-84.
Confavreux, C., et al., 1998. Rate of pregnancy-related relapse in multiple sclerosis. Pregnancy in
Multiple Sclerosis Group. N Engl J Med. 339, 285-91.
Constantinople, C.M., Bruno, R.M., 2013. Deep cortical layers are activated directly by thalamus.
Science. 340, 1591-4.
Corbett, J.J., Chen, J., 2018. Chapter 20 - The Visual System. In: Fundamental Neuroscience for
Basic and Clinical Applications (Fifth Edition). Vol., D.E. Haines, G.A. Mihailoff, ed.^eds.
Elsevier, pp. 286-305.e1.
Costello, F., 2016. Vision Disturbances in Multiple Sclerosis. Semin Neurol. 36, 185-195.
Country, M.W., 2017. Retinal metabolism: A comparative look at energetics in the retina. Brain
Research. 1672, 50-57.
Coupland, S.G., Kirkham, T.H., 1982. Flash electroretinogram abnormalities in patients with
clinically definite multiple sclerosis. Can J Neurol Sci. 9, 325-30.

143
Cowey, A., 1974. Atrophy of Retinal Ganglion Cells after Removal of Striate Cortex in a Rhesus
Monkey. Perception. 3, 257-260.
Craner, M.J., et al., 2003. Abnormal sodium channel distribution in optic nerve axons in a model
of inflammatory demyelination. Brain. 126, 1552-1561.
Craner, M.J., et al., 2004. Co‐localization of sodium channel Nav1.6 and the sodium–calcium
exchanger at sites of axonal injury in the spinal cord in EAE. Brain. 127, 294-303.
Crawford, D.K., Mangiardi, M., Tiwari-Woodruff, S.K., 2009a. Assaying the functional effects of
demyelination and remyelination: revisiting field potential recordings. J Neurosci
Methods. 182, 25-33.
Crawford, D.K., et al., 2009b. Functional recovery of callosal axons following demyelination: a
critical window. Neuroscience. 164, 1407-1421.
Crawford, D.K., et al., 2010. Oestrogen receptor beta ligand: a novel treatment to enhance
endogenous functional remyelination. Brain. 133, 2999-3016.
Creel, D., 1995a. Visually Evoked Potentials. In: Webvision: The Organization of the Retina and
Visual System. Vol., H. Kolb, E. Fernandez, R. Nelson, ed.^eds. University of Utah Health
Sciences Center
Copyright: (c) 2019 Webvision., Salt Lake City (UT).
Creel, D.J., 1995b. Visual and Auditory Anomalies Associated with Albinism. In: Webvision: The
Organization of the Retina and Visual System. Vol., H. Kolb, E. Fernandez, R. Nelson,
ed.^eds. University of Utah Health Sciences Center
Copyright: (c) 2019 Webvision., Salt Lake City (UT).
Cruz-Martin, A., et al., 2014. A dedicated circuit links direction-selective retinal ganglion cells to
the primary visual cortex. Nature. 507, 358-61.
Curcio, C.A., et al., 2017. Activated Retinal Pigment Epithelium, an Optical Coherence
Tomography Biomarker for Progression in Age-Related Macular Degeneration. Invest
Ophthalmol Vis Sci. 58, Bio211-bio226.
De Angelis, M., et al., 2005. Indazole Estrogens: Highly Selective Ligands for the Estrogen
Receptor β. Journal of Medicinal Chemistry. 48, 1132-1144.
De Moraes, C.G., 2013. Anatomy of the visual pathways. J Glaucoma. 22 Suppl 5, S2-7.
Deguchi, K., et al., 1992. Electrophysiological follow-up of acute and chronic experimental allergic
encephalomyelitis in the Lewis rat. Eur Arch Psychiatry Clin Neurosci. 242, 1-5.
Delclaux, C., et al., 1996. Role of gelatinase B and elastase in human polymorphonuclear neutrophil
migration across basement membrane. Am J Respir Cell Mol Biol. 14, 288-95.
Dhande, O.S., Huberman, A.D., 2014. Retinal ganglion cell maps in the brain: implications for
visual processing. Curr Opin Neurobiol. 24, 133-42.

144
Diem, R., et al., 2008. Autoimmune optic neuritis in the common marmoset monkey: comparison
of visual evoked potentials with MRI and histopathology. Invest Ophthalmol Vis Sci. 49,
3707-14.
Dobson, R., Giovannoni, G., 2019. Multiple sclerosis - a review. Eur J Neurol. 26, 27-40.
Douglas, R.J., Martin, K.A., 2004. Neuronal circuits of the neocortex. Annu Rev Neurosci. 27, 419-
51.
Drager, U.C., 1985. Birth dates of retinal ganglion cells giving rise to the crossed and uncrossed
optic projections in the mouse. Proc R Soc Lond B Biol Sci. 224, 57-77.
Droby, A., et al., 2016. A novel automated segmentation method for retinal layers in OCT images
proves retinal degeneration after optic neuritis. Br J Ophthalmol. 100, 484-90.
Duarte-Silva, E., et al., 2018. Sildenafil ameliorates EAE by decreasing apoptosis in the spinal cord
of C57BL/6 mice. Journal of Neuroimmunology. 321, 125-137.
Ebrey, T., Koutalos, Y., 2001. Vertebrate Photoreceptors. Progress in Retinal and Eye Research.
20, 49-94.
Eilam, R., et al., 2018. Astrocyte disruption of neurovascular communication is linked to cortical
damage in an animal model of multiple sclerosis. Glia. 66, 1098-1117.
England, J.D., et al., 1990. Changed distribution of sodium channels along demyelinated axons.
Proc Natl Acad Sci U S A. 87, 6777-80.
Erskine, L., Herrera, E., 2014. Connecting the retina to the brain. ASN neuro. 6,
1759091414562107.
ESIRI, M.M., READING, M.C., 1987. MACROPHAGE POPULATIONS ASSOCIATED WITH
MULTIPLE SCLEROSIS PLAQUES. Neuropathology and Applied Neurobiology. 13,
451-465.
Evangelou, N., et al., 2001. Size-selective neuronal changes in the anterior optic pathways suggest
a differential susceptibility to injury in multiple sclerosis. Brain. 124, 1813-20.
Fahey, P.K., Burkhardt, D.A., 2003. Center-surround organization in bipolar cells: symmetry for
opposing contrasts. Vis Neurosci. 20, 1-10.
Fairless, R., et al., 2012. Preclinical retinal neurodegeneration in a model of multiple sclerosis. J
Neurosci. 32, 5585-97.
Falco, A., et al., 2014. Reduction in parvalbumin-positive interneurons and inhibitory input in the
cortex of mice with experimental autoimmune encephalomyelitis. Exp Brain Res. 232,
2439-49.
Feliciano-Sanchez, A., et al., 2019. Development and optimisation of an animal model for the study
of ganglion cells in degenerative diseases of the retina and optic nerve. Arch Soc Esp
Oftalmol. 94, 263-272.
Feng, G., et al., 2000. Imaging neuronal subsets in transgenic mice expressing multiple spectral
variants of GFP. Neuron. 28, 41-51.

145
Ferguson, B., et al., 1997. Axonal damage in acute multiple sclerosis lesions. Brain. 120, 393-399.
Fisher, J.B., et al., 2006. Relation of visual function to retinal nerve fiber layer thickness in multiple
sclerosis. Ophthalmology. 113, 324-332.
Fisher, T.G., Alitto, H.J., Usrey, W.M., 2017. Retinal and Nonretinal Contributions to
Extraclassical Surround Suppression in the Lateral Geniculate Nucleus. The Journal of
Neuroscience. 37, 226.
FitzGibbon, T., Nestorovski, Z., 2013. Human intraretinal myelination: axon diameters and
axon/myelin thickness ratios. Indian journal of ophthalmology. 61, 567-575.
Fitzpatrick, D., 2004. Central Visual Pathways. In: Neuroscience. Sensation and Sensory
Processing, Vol., D. Fitzpatrick, ed.^eds. Sinauer Associates, Inc, Massachusetts, pp. 259-
282.
Forooghian, F., et al., 2006. Electroretinographic abnormalities in multiple sclerosis: possible role
for retinal autoantibodies. Doc Ophthalmol. 113, 123-32.
Freund, T.F., Martin, K.A.C., Whitteridge, D., 1985. Innervation of cat visual areas 17 and 18 by
physiologically identified X- and Y- type thalamic afferents. I. Arborization patterns and
quantitative distribution of postsynaptic elements. Journal of Comparative Neurology. 242,
263-274.
G. Waxman, S., 2005. Altered Distributions and Functions of Multiple Sodium Channel Subtypes
in Multiple Sclerosis and its Models. Vol., ed.^eds., pp. 101-118.
Gabilondo, I., et al., 2014. Trans-synaptic axonal degeneration in the visual pathway in multiple
sclerosis. Ann Neurol. 75, 98-107.
Gabilondo, I., et al., 2015. Dynamics of retinal injury after acute optic neuritis. Annals of
Neurology. 77, 517-528.
Gabilondo, I., et al., 2017. The influence of posterior visual pathway damage on visual information
processing speed in multiple sclerosis. Mult Scler. 23, 1276-1288.
Gambi, D., Onofrj, M., Di Trapani, G., 1987. Experimental allergic encephalomyelitis, a model of
demyelination in central nervous system (CNS). Riv Neurol. 57, 27-32.
Gao, H., Hollyfield, J.G., 1992. Aging of the human retina. Differential loss of neurons and retinal
pigment epithelial cells. Invest Ophthalmol Vis Sci. 33, 1-17.
Garcia-Martin, E., et al., 2017. Retinal and Optic Nerve Degeneration in Patients with Multiple
Sclerosis Followed up for 5 Years. Ophthalmology. 124, 688-696.
Gelfand, J.M., et al., 2012. Microcystic macular oedema in multiple sclerosis is associated with
disease severity. Brain. 135, 1786-93.
Georgiev, D., 2011. Photons do collapse in the retina not in the brain cortex: evidence from visual
illusions. NeuroQuantology. 9, 206‐230.
Ghaiad, H.R., et al., 2017. Resveratrol Promotes Remyelination in Cuprizone Model of Multiple
Sclerosis: Biochemical and Histological Study. Mol Neurobiol. 54, 3219-3229.

146
Gilbert, C.D., Wiesel, T.N., 1979. Morphology and intracortical projections of functionally
characterised neurones in the cat visual cortex. Nature. 280, 120-125.
Gilbert, C.D., Wiesel, T.N., 1983. Functional Organization of the Visual Cortex. In: Progress in
Brain Research. Vol. 58, J.P. Changeux, J. Glowinski, M. Imbert, F.E. Bloom, ed.^eds.
Elsevier, pp. 209-218.
Girolamo, F., et al., 2011. Cerebral cortex demyelination and oligodendrocyte precursor response
to experimental autoimmune encephalomyelitis. Neurobiology of Disease. 43, 678-689.
Glickfeld, L.L., Olsen, S.R., 2017. Higher-Order Areas of the Mouse Visual Cortex. Annu Rev Vis
Sci. 3, 251-273.
Gollisch, T., Meister, M., 2010. Eye smarter than scientists believed: neural computations in
circuits of the retina. Neuron. 65, 150-64.
Gomez, F.P., et al., 2013. Hormone and immune system interactions in demyelinating disease.
Horm Behav. 63, 315-21.
Graham, E.C., et al., 2016. Progressive Loss of Retinal Ganglion Cells and Axons in Nonoptic
Neuritis Eyes in Multiple Sclerosis: A Longitudinal Optical Coherence Tomography
Study. Invest Ophthalmol Vis Sci. 57, 2311-7.
Graham, S.L., Klistorner, A., 2017. Afferent visual pathways in multiple sclerosis: a review. Clin
Exp Ophthalmol. 45, 62-72.
Groebe, A., et al., 2009. Cuprizone treatment induces distinct demyelination, astrocytosis, and
microglia cell invasion or proliferation in the mouse cerebellum. Cerebellum. 8, 163-74.
Gudi, V., et al., 2009. Regional differences between grey and white matter in cuprizone induced
demyelination. Brain Res. 1283, 127-38.
Gudi, V., et al., 2014. Glial response during cuprizone-induced de- and remyelination in the CNS:
lessons learned. Frontiers in cellular neuroscience. 8, 73-73.
Hamos, J.E., et al., 1987. Synaptic circuits involving an individual retinogeniculate axon in the cat.
Journal of Comparative Neurology. 259, 165-192.
Hamurcu, M., et al., 2017. Analysis of multiple sclerosis patients with electrophysiological and
structural tests. Int Ophthalmol. 37, 649-653.
Hanisch, U.-K., Gertig, U., 2014. Microglial diversity by responses and responders. Frontiers in
Cellular Neuroscience. 8, 101.
Hanson, J.V.M., et al., 2018. Outer Retinal Dysfunction in the Absence of Structural Abnormalities
in Multiple Sclerosis. Invest Ophthalmol Vis Sci. 59, 549-560.
Hardingham, G.E., Bading, H., 2003. The Yin and Yang of NMDA receptor signalling. Trends
Neurosci. 26, 81-9.
Harris, K.D., Mrsic-Flogel, T.D., 2013. Cortical connectivity and sensory coding. Nature. 503, 51-
8.

147
Hasselmann, J.P., et al., 2017a. Consistent induction of chronic experimental autoimmune
encephalomyelitis in C57BL/6 mice for the longitudinal study of pathology and repair. J
Neurosci Methods.
Hasselmann, J.P.C., et al., 2017b. Consistent induction of chronic experimental autoimmune
encephalomyelitis in C57BL/6 mice for the longitudinal study of pathology and repair. J
Neurosci Methods. 284, 71-84.
Hayreh, S.S., et al., 1981. Experimental allergic encephalomyelitis. I. Optic nerve and central
nervous system manifestations. Invest Ophthalmol Vis Sci. 21, 256-69.
Heesen, C., et al., 2008. Patient perception of bodily functions in multiple sclerosis: gait and visual
function are the most valuable. Multiple Sclerosis Journal. 14, 988-991.
Hegedus, B., et al., 2009. Optic nerve dysfunction in a mouse model of neurofibromatosis-1 optic
glioma. J Neuropathol Exp Neurol. 68, 542-51.
Hein, K., et al., 2012. An optical coherence tomography study on degeneration of retinal nerve fiber
layer in rats with autoimmune optic neuritis. Invest Ophthalmol Vis Sci. 53.
Henderson, A.P., et al., 2008. An investigation of the retinal nerve fibre layer in progressive
multiple sclerosis using optical coherence tomography. Brain. 131, 277-87.
Hendrickx, D.A., et al., 2014. Enhanced uptake of multiple sclerosis-derived myelin by THP-1
macrophages and primary human microglia. J Neuroinflammation. 11, 64.
Herrera, E., Garcia-Frigola, C., 2008. Genetics and development of the optic chiasm. Front Biosci.
13, 1646-53.
Herrera, E., Erskine, L., Morenilla-Palao, C., 2019. Guidance of retinal axons in mammals.
Seminars in Cell & Developmental Biology. 85, 48-59.
Hiremath, M.M., et al., 1998. Microglial/macrophage accumulation during cuprizone-induced
demyelination in C57BL/6 mice. Journal of Neuroimmunology. 92, 38-49.
Hiremath, M.M., et al., 2008. MHC class II exacerbates demyelination in vivo independently of T
cells. J Neuroimmunol. 203, 23-32.
Hobom, M., et al., 2004. Mechanisms and time course of neuronal degeneration in experimental
autoimmune encephalomyelitis. Brain Pathol. 14, 148-57.
Hoffmann, K., et al., 2008. Epileptic seizures and hippocampal damage after cuprizone-induced
demyelination in C57BL/6 mice. Exp Neurol. 210, 308-21.
Hood, D.C., Odel, J.G., Winn, B.J., 2003. The multifocal visual evoked potential. J
Neuroophthalmol. 23, 279-89.
Horstmann, L., et al., 2016. Microglia response in retina and optic nerve in chronic experimental
autoimmune encephalomyelitis. Journal of Neuroimmunology. 298, 32-41.
Hu, P., et al., 2006. Microvascular and Cellular Responses in the Optic Nerve of Rats with Acute
Experimental Allergic Encephalomyelitis (EAE). Brain Pathology. 8, 475-486.

148
Huang, W., et al., 1998. Contribution of supragranular layers to sensory processing and plasticity
in adult rat barrel cortex. J Neurophysiol. 80, 3261-71.
Huang, X.R., Kong, W., Qiao, J., 2018. Response of the Retinal Nerve Fiber Layer Reflectance
and Thickness to Optic Nerve Crush. Invest Ophthalmol Vis Sci. 59, 2094-2103.
Hubel, D.H., Wiesel, T.N., 1962. Receptive fields, binocular interaction and functional architecture
in the cat's visual cortex. The Journal of physiology. 160, 106-154.
Hubel, D.H., Wiesel, T.N., 1974. Uniformity of monkey striate cortex: A parallel relationship
between field size, scatter, and magnification factor. Journal of Comparative Neurology.
158, 295-305.
Humphrey, A.L., et al., 1985. Projection patterns of individual X- and Y-cell axons from the lateral
geniculate nucleus to cortical area 17 in the cat. J Comp Neurol. 233, 159-89.
Hunter, S.F., 2016. Overview and diagnosis of multiple sclerosis. Am J Manag Care. 22, s141-50.
Imitola, J., Chitnis, T., Khoury, S.J., 2005. Cytokines in multiple sclerosis: from bench to bedside.
Pharmacology & Therapeutics. 106, 163-177.
Ito, A., et al., 2001. Estrogen treatment down-regulates TNF-alpha production and reduces the
severity of experimental autoimmune encephalomyelitis in cytokine knockout mice. J
Immunol. 167, 542-52.
Jakobs, T.C., et al., 2005. Retinal ganglion cell degeneration is topological but not cell type specific
in DBA/2J mice. J Cell Biol. 171, 313-25.
Janaky, M., et al., 2017. VEP and PERG in patients with multiple sclerosis, with and without a
history of optic neuritis. Doc Ophthalmol. 134, 185-193.
Jasse, L., et al., 2013. Persistent visual impairment in multiple sclerosis: prevalence, mechanisms
and resulting disability. Mult Scler. 19, 1618-26.
Jeon, C.J., Strettoi, E., Masland, R.H., 1998. The major cell populations of the mouse retina. J
Neurosci. 18, 8936-46.
Jin, J., et al., 2019. Glial pathology and retinal neurotoxicity in the anterior visual pathway in
experimental autoimmune encephalomyelitis. Acta Neuropathol Commun. 7, 125.
Jindahra, P., Petrie, A., Plant, G.T., 2012. The time course of retrograde trans-synaptic degeneration
following occipital lobe damage in humans. Brain. 135, 534-541.
Jones, R.E., et al., 1983. Effects of 4-aminopyridine in patients with multiple sclerosis. Journal of
the Neurological Sciences. 60, 353-362.
Jukkola, P., et al., 2013. Astrocytes differentially respond to inflammatory autoimmune insults and
imbalances of neural activity. Acta neuropathologica communications. 1, 70-70.
Kanamori, A., et al., 2010a. Superoxide is an associated signal for apoptosis in axonal injury. Brain.
133, 2612-25.
Kanamori, A., et al., 2010b. In vivo imaging of retinal ganglion cell axons within the nerve fiber
layer. Invest Ophthalmol Vis Sci. 51, 2011-8.

149
Kapoor, R., et al., 2018. Effect of natalizumab on disease progression in secondary progressive
multiple sclerosis (ASCEND): a phase 3, randomised, double-blind, placebo-controlled
trial with an open-label extension. Lancet Neurol. 17, 405-415.
Karim, H., et al., 2018a. Increase in chemokine CXCL1 by ERbeta ligand treatment is a key
mediator in promoting axon myelination. Proc Natl Acad Sci U S A.
Karim, H., et al., 2018b. Increase in chemokine CXCL1 by ERbeta ligand treatment is a key
mediator in promoting axon myelination. Proc Natl Acad Sci U S A. 115, 6291-6296.
Karim, H., et al., 2019a. Analogues of ERbeta ligand chloroindazole exert immunomodulatory and
remyelinating effects in a mouse model of multiple sclerosis. Sci Rep. 9, 503.
Karim, H., et al., 2019b. Analogues of ERβ ligand chloroindazole exert immunomodulatory and
remyelinating effects in a mouse model of multiple sclerosis. Scientific Reports. 9, 503.
Kels, B.D., Grzybowski, A., Grant-Kels, J.M., 2015. Human ocular anatomy. Clinics in
Dermatology. 33, 140-146.
Kempen, G.I., et al., 2012. The impact of low vision on activities of daily living, symptoms of
depression, feelings of anxiety and social support in community-living older adults seeking
vision rehabilitation services. Qual Life Res. 21, 1405-11.
Kerrison, J.B., Flynn, T., Green, W.R., 1994. Retinal pathologic changes in multiple sclerosis.
Retina. 14, 445-51.
Kerschensteiner, D., Guido, W., 2017. Organization of the dorsal lateral geniculate nucleus in the
mouse. Visual neuroscience. 34, E008-E008.
Khalaj, A.J., et al., 2013. Estrogen receptor (ER) beta expression in oligodendrocytes is required
for attenuation of clinical disease by an ERbeta ligand. Proc Natl Acad Sci U S A. 110,
19125-30.
Khalaj, A.J., et al., 2016. Nudging oligodendrocyte intrinsic signaling to remyelinate and repair:
Estrogen receptor ligand effects. Journal of Steroid Biochemistry and Molecular Biology.
160, 43-52.
Kim, J.H., et al., 2006. Blood-neural barrier: intercellular communication at glio-vascular interface.
J Biochem Mol Biol. 39, 339-45.
Kim, T.-W., Sung, Y.-H., 2017. Regular exercise promotes memory function and enhances
hippocampal neuroplasticity in experimental autoimmune encephalomyelitis mice.
Neuroscience. 346, 173-181.
Kipp, M., et al., 2007. Oestrogen and progesterone reduce lipopolysaccharide-induced expression
of tumour necrosis factor-alpha and interleukin-18 in midbrain astrocytes. J
Neuroendocrinol. 19, 819-22.
Kipp, M., et al., 2017. Multiple sclerosis animal models: a clinical and histopathological
perspective. Brain Pathology. 27, 123-137.

150
Kolb, H., 1995. Simple Anatomy of the Retina. In: Webvision: The Organization of the Retina and
Visual System. Vol., H. Kolb, E. Fernandez, R. Nelson, ed.^eds. University of Utah Health
Sciences Center
Copyright: (c) 2019 Webvision., Salt Lake City (UT).
Kolb, H., 2003. How the Retina Works: Much of the construction of an image takes place in the
retina itself through the use of specialized neural circuits. In: Scientific American. Vol. 91,
ed.^eds. Sigma Xi, The Scientific Research Society, North Carolina, pp. 28-35.
Kondo, A., Nakano, T., Suzuki, K., 1987. Blood-brain barrier permeability to horseradish
peroxidase in twitcher and cuprizone-intoxicated mice. Brain Res. 425, 186-90.
Koutsoudaki, P.N., et al., 2009. Demyelination of the hippocampus is prominent in the cuprizone
model. Neurosci Lett. 451, 83-8.
Kuchling, J., et al., 2017. Diffusion tensor imaging for multilevel assessment of the visual pathway:
possibilities for personalized outcome prediction in autoimmune disorders of the central
nervous system. Epma j. 8, 279-294.
Kuffler, S.W., 1953. Discharge patterns and functional organization of mammalian retina. J
Neurophysiol. 16, 37-68.
Kuhlmann, T., et al., 2017. An updated histological classification system for multiple sclerosis
lesions. Acta Neuropathol. 133, 13-24.
Kumar, S., et al., 2013. Estrogen receptor β ligand therapy activates PI3K/Akt/mTOR signaling in
oligodendrocytes and promotes remyelination in a mouse model of multiple sclerosis.
Neurobiol Dis. 0, 131-44.
Kupfer, C., Chumbley, L., Downer, J.C., 1967. Quantitative histology of optic nerve, optic tract
and lateral geniculate nucleus of man. J Anat. 101, 393-401.
Kwong, J.M., Caprioli, J., Piri, N., 2010. RNA binding protein with multiple splicing: a new marker
for retinal ganglion cells. Invest Ophthalmol Vis Sci. 51, 1052-8.
Lambot, M.A., et al., 2005. Mapping labels in the human developing visual system and the
evolution of binocular vision. J Neurosci. 25, 7232-7.
Lapato, A.S., et al., 2017. Chronic demyelination-induced seizures. Neuroscience. 346, 409-422.
Lapato, A.S., Tiwari-Woodruff, S.K., 2018. Connexins and pannexins: At the junction of neuro-
glial homeostasis & disease. J Neurosci Res. 96, 31-44.
Larabee, C.M., et al., 2016. Loss of Nrf2 exacerbates the visual deficits and optic neuritis elicited
by experimental autoimmune encephalomyelitis. Molecular vision. 22, 1503-1513.
Laron, M., et al., 2010. Comparison of multifocal visual evoked potential, standard automated
perimetry and optical coherence tomography in assessing visual pathway in multiple
sclerosis patients. Multiple Sclerosis Journal. 16, 412-426.

151
Li, H., et al., 2013. 17beta-estradiol impedes Bax-involved mitochondrial apoptosis of retinal nerve
cells induced by oxidative damage via the phosphatidylinositol 3-kinase/Akt signal
pathway. J Mol Neurosci. 50, 482-93.
Li, H., et al., 2016. 17beta-Estradiol Protects the Retinal Nerve Cells Suppressing TLR2 Mediated
Immune-Inflammation and Apoptosis from Oxidative Stress Insult Independent of PI3K. J
Mol Neurosci. 60, 195-204.
Lieven, C.J., et al., 2006. Retinal ganglion cell axotomy induces an increase in intracellular
superoxide anion. Invest Ophthalmol Vis Sci. 47, 1477-85.
Lin, T.-H., et al., 2014. Diffusion fMRI detects white-matter dysfunction in mice with acute optic
neuritis. Neurobiology of Disease. 67, 1-8.
Lin, T.H., et al., 2017. Diffusion MRI quantifies early axonal loss in the presence of nerve swelling.
J Neuroinflammation. 14, 78.
Liscic, R.M., Brecelj, J., 2004. Visual evoked potentials in multiple sclerosis patients treated with
interferon beta-1a. Croat Med J. 45, 323-7.
Livingstone, M., Hubel, D., 1988. SEGREGATION OF FORM, COLOR, MOVEMENT, AND
DEPTH - ANATOMY, PHYSIOLOGY, AND PERCEPTION. Science. 240, 740-749.
Livingstone, M.S., Hubel, D.H., 1984. Anatomy and physiology of a color system in the primate
visual cortex. J Neurosci. 4, 309-56.
Lopes Pinheiro, M.A., et al., 2016. Immune cell trafficking across the barriers of the central nervous
system in multiple sclerosis and stroke. Biochimica et Biophysica Acta (BBA) - Molecular
Basis of Disease. 1862, 461-471.
Mabuchi, F., et al., 2003. Optic nerve damage in experimental mouse ocular hypertension. Invest
Ophthalmol Vis Sci. 44, 4321-30.
Major, Z., et al., 2013. Glatiramer Acetate Treatment-Related Effects on Visual EPs and P300
Wave in Patients Suffering from Multiple Sclerosis, Vol. 45.
Mallon, B.S., et al., 2002. Proteolipid promoter activity distinguishes two populations of NG2-
positive cells throughout neonatal cortical development. J Neurosci. 22, 876-85.
Mangiardi, M., et al., 2011. An animal model of cortical and callosal pathology in multiple
sclerosis. Brain Pathol. 21, 263-78.
Manogaran, P., et al., 2016. Optical Coherence Tomography and Magnetic Resonance Imaging in
Multiple Sclerosis and Neuromyelitis Optica Spectrum Disorder. International journal of
molecular sciences. 17, 1894.
Manogaran, P., et al., 2018. Exploring experimental autoimmune optic neuritis using multimodal
imaging. NeuroImage. 175, 327-339.
Manogaran, P., et al., 2019. Retinal pathology in experimental optic neuritis is characterized by
retrograde degeneration and gliosis. Acta Neuropathol Commun. 7, 116.

152
Martin, P.R., 1986. The projection of different retinal ganglion cell classes to the dorsal lateral
geniculate nucleus in the hooded rat. Experimental Brain Research. 62, 77-88.
Martinez, L.M., Alonso, J.-M., 2003. Complex receptive fields in primary visual cortex. The
Neuroscientist : a review journal bringing neurobiology, neurology and psychiatry. 9, 317-
331.
Masland, R.H., 2011. Cell Populations of the Retina: The Proctor Lecture. Investigative
Ophthalmology & Visual Science. 52, 4581-4591.
Masland, R.H., 2012. The neuronal organization of the retina. Neuron. 76, 266-80.
Matejuk, A., et al., 2001. 17 beta-estradiol inhibits cytokine, chemokine, and chemokine receptor
mRNA expression in the central nervous system of female mice with experimental
autoimmune encephalomyelitis. J Neurosci Res. 65, 529-42.
Matsushima, G.K., Morell, P., 2001. The neurotoxicant, cuprizone, as a model to study
demyelination and remyelination in the central nervous system. Brain Pathol. 11, 107-16.
May, C.A., Mittag, T., 2006. Optic nerve degeneration in the DBA/2NNia mouse: is the lamina
cribrosa important in the development of glaucomatous optic neuropathy? Acta
Neuropathol. 111, 158-67.
Mazade, R., Alonso, J.M., 2017. Thalamocortical processing in vision. Visual neuroscience. 34,
E007-E007.
McDonald, W.I., Perry, V.H., Anthony, D.C., 1999. Axon damage and repair in multiple sclerosis.
Philosophical Transactions of the Royal Society of London. Series B: Biological Sciences.
354, 1641-1647.
McDonald, W.I., et al., 2001. Recommended diagnostic criteria for multiple sclerosis: guidelines
from the International Panel on the diagnosis of multiple sclerosis. Ann Neurol. 50, 121-7.
Meuth, S.G., et al., 2011. Natalizumab restores evoked potential abnormalities in patients with
relapsing-remitting multiple sclerosis. Mult Scler. 17, 198-203.
Mey, J., Thanos, S., 1993. Intravitreal injections of neurotrophic factors support the survival of
axotomized retinal ganglion cells in adult rats in vivo. Brain Res. 602, 304-17.
Meyer, R., et al., 2001. Acute neuronal apoptosis in a rat model of multiple sclerosis. J Neurosci.
21, 6214-20.
Mhyre, A.J., Dorsa, D.M., 2006. Estrogen activates rapid signaling in the brain: Role of estrogen
receptor α and estrogen receptor β in neurons and glia. Neuroscience. 138, 851-858.
Micheva, K.D., et al., 2016. A large fraction of neocortical myelin ensheathes axons of local
inhibitory neurons. eLife. 5, e15784.
Miller, R.F., Dowling, J.E., 1970. Intracellular responses of the Muller (glial) cells of mudpuppy
retina: their relation to b-wave of the electroretinogram. J Neurophysiol. 33, 323-41.
Miron, V.E., et al., 2010. Fingolimod (FTY720) enhances remyelination following demyelination
of organotypic cerebellar slices. The American journal of pathology. 176, 2682-2694.

153
Miron, V.E., et al., 2013. M2 microglia and macrophages drive oligodendrocyte differentiation
during CNS remyelination. Nature Neuroscience. 16, 1211.
Miron, V.E., 2017. Microglia-driven regulation of oligodendrocyte lineage cells, myelination, and
remyelination. J Leukoc Biol. 101, 1103-1108.
Miyake, E., Imagawa, T., Uehara, M., 2004. Fine structure of the retino-optic nerve junction in
dogs. J Vet Med Sci. 66, 1549-54.
Monsalve, P., et al., 2018. Retinal ganglion cell function in recovered optic neuritis: Faster is not
better. Clin Neurophysiol. 129, 1813-1818.
Moore, S.M., et al., 2014a. Multiple functional therapeutic effects of the estrogen receptor beta
agonist indazole-Cl in a mouse model of multiple sclerosis. Proc Natl Acad Sci U S A. 111,
18061-6.
Moore, S.M., et al., 2014b. Multiple functional therapeutic effects of the estrogen receptor beta
agonist indazole-Cl in a mouse model of multiple sclerosis. Proceedings of the National
Academy of Sciences of the United States of America. 111, 18061-18066.
Morell, P., et al., 1998. Gene expression in brain during cuprizone-induced demyelination and
remyelination. Mol Cell Neurosci. 12, 220-7.
Morizawa, Y.M., et al., 2017. Reactive astrocytes function as phagocytes after brain ischemia via
ABCA1-mediated pathway. Nat Commun. 8, 28.
Mowry, E.M., et al., 2009. Vision related quality of life in multiple sclerosis: correlation with new
measures of low and high contrast letter acuity. J Neurol Neurosurg Psychiatry. 80, 767-
72.
Munaut, C., et al., 2001. Presence of oestrogen receptor type beta in human retina. Br J Ophthalmol.
85, 877-82.
Nagata, A., et al., 2009. In vivo quantitative evaluation of the rat retinal nerve fiber layer with
optical coherence tomography. Invest Ophthalmol Vis Sci. 50, 2809-15.
Nakazawa, T., Takahashi, H., Shimura, M., 2006. Estrogen has a neuroprotective effect on
axotomized RGCs through ERK signal transduction pathway. Brain Res. 1093, 141-9.
Namekata, K., et al., 2014. Dock3 protects myelin in the cuprizone model for demyelination. Cell
Death & Disease. 5, e1395.
National Academies of Sciences, E., et al., 2016. The Impact of Vision Loss. In: Making Eye Health
a Population Health Imperative: Vision for Tomorrow. Vol., A. Welp, R.B. Woodbury,
M.A. McCoy, S.M. Teutsch, ed.^eds. National Academies Press (US)
Copyright 2016 by the National Academy of Sciences. All rights reserved., Washington (DC), pp.
135-162.
Nerrant, E., Tilikete, C., 2017. Ocular Motor Manifestations of Multiple Sclerosis. J
Neuroophthalmol. 37, 332-340.

154
Nikic, I., et al., 2011. A reversible form of axon damage in experimental autoimmune
encephalomyelitis and multiple sclerosis. Nat Med. 17, 495-9.
Nilsson, S., Gustafsson, J.A., 2011. Estrogen receptors: therapies targeted to receptor subtypes.
Clin Pharmacol Ther. 89, 44-55.
Nishioka, C., et al., 2017. Disease stage-dependent relationship between diffusion tensor imaging
and electrophysiology of the visual system in a murine model of multiple sclerosis.
Neuroradiology. 59, 1241-1250.
Nishioka, C., et al., 2019. Sequential phases of RGC axonal and somatic injury in EAE mice
examined using DTI and OCT. Multiple Sclerosis and Related Disorders. 27, 315-323.
Njenga, M.K., et al., 2000. Short-term treatment with interferon-alpha/beta promotes
remyelination, whereas long-term treatment aggravates demyelination in a murine model
of multiple sclerosis. J Neurosci Res. 59, 661-70.
Norkute, A., et al., 2009. Cuprizone treatment induces demyelination and astrocytosis in the mouse
hippocampus. J Neurosci Res. 87, 1343-55.
Oakden, W., et al., 2017. Early regional cuprizone-induced demyelination in a rat model revealed
with MRI. NMR Biomed. 30.
Olabarria, M., Goldman, J.E., 2017. Disorders of Astrocytes: Alexander Disease as a Model.
Annual Review of Pathology: Mechanisms of Disease. 12, 131-152.
Omari, K.M., et al., 2009. Neuroprotection and remyelination after autoimmune demyelination in
mice that inducibly overexpress CXCL1. Am J Pathol. 174, 164-76.
Ontaneda, D., et al., 2017. Progressive multiple sclerosis: prospects for disease therapy, repair, and
restoration of function. The Lancet. 389, 1357-1366.
Ortiz-Perez, S., et al., 2016. Visual field impairment captures disease burden in multiple sclerosis.
J Neurol. 263, 695-702.
Ozaki, H., et al., 2000. Blockade of vascular endothelial cell growth factor receptor signaling is
sufficient to completely prevent retinal neovascularization. Am J Pathol. 156, 697-707.
Pakrou, N., et al., 2006. Multifocal objective perimetry compared with Humphrey full-threshold
perimetry in patients with optic neuritis. Clinical & Experimental Ophthalmology. 34, 562-
567.
Pang, Y., et al., 2013. Differential roles of astrocyte and microglia in supporting oligodendrocyte
development and myelination in vitro. Brain and behavior. 3, 503-514.
Panitch, H., et al., 2004. Interferon beta-1b in secondary progressive MS: results from a 3-year
controlled study. Neurology. 63, 1788-95.
Papadopoulou, A., et al., 2019. Damage of the lateral geniculate nucleus in MS: Assessing the
missing node of the visual pathway. Neurology. 92, e2240-e2249.
Papakostopoulos, D., et al., 1989. The electroretinogram in multiple sclerosis and demyelinating
optic neuritis. Electroencephalogr Clin Neurophysiol. 74, 1-10.

155
Pastare, D., et al., 2013. Evaluation of axonal optic nerve damage using visual evoked potentials
and optical coherence tomography in patients with multiple sclerosis. Medicina (Kaunas).
49, 474-8.
Paxinos, G., Franklin, K.B.J., 2013. Paxinos and Franklin's The Mouse Brain in Stereotaxic
Coordinates, Vol., Elsevier, London, UK.
Penfold, P.L., et al., 2001. Immunological and Aetiological Aspects of Macular Degeneration.
Progress in Retinal and Eye Research. 20, 385-414.
Perez de Sevilla Muller, L., et al., 2014. Melanopsin ganglion cells are the most resistant retinal
ganglion cell type to axonal injury in the rat retina. PLoS One. 9, e93274.
Perlman, I., 1995. The Electroretinogram: ERG. In: Webvision: The Organization of the Retina
and Visual System. Vol., H. Kolb, E. Fernandez, R. Nelson, ed.^eds. University of Utah
Health Sciences Center
Copyright: (c) 2019 Webvision., Salt Lake City (UT).
Petracca, M., et al., 2017. Retinal degeneration in primary-progressive multiple sclerosis: A role
for cortical lesions? Mult Scler. 23, 43-50.
Pfrieger, F.W., Barres, B.A., 1996. New views on synapse—glia interactions. Current Opinion in
Neurobiology. 6, 615-621.
Pihl-Jensen, G., Schmidt, M.F., Frederiksen, J.L., 2017. Multifocal visual evoked potentials in optic
neuritis and multiple sclerosis: A review. Clin Neurophysiol. 128, 1234-1245.
Porrero, C., et al., 2010. Mapping of fluorescent protein-expressing neurons and axon pathways in
adult and developing Thy1-eYFP-H transgenic mice. Brain Research. 1345, 59-72.
Poser, C.M., Brinar, V.V., 2004. Diagnostic criteria for multiple sclerosis: an historical review.
Clin Neurol Neurosurg. 106, 147-58.
Pott, F., et al., 2009. Cuprizone effect on myelination, astrogliosis and microglia attraction in the
mouse basal ganglia. Brain Research. 1305, 137-149.
Potter, L.E., et al., 2016. Altered excitatory-inhibitory balance within somatosensory cortex is
associated with enhanced plasticity and pain sensitivity in a mouse model of multiple
sclerosis. J Neuroinflammation. 13, 142.
Prineas, J.W., et al., 2001. Immunopathology of secondary-progressive multiple sclerosis. Ann
Neurol. 50, 646-57.
Prokai-Tatrai, K., et al., 2013. 17beta-estradiol eye drops protect the retinal ganglion cell layer and
preserve visual function in an in vivo model of glaucoma. Mol Pharm. 10, 3253-61.
Pula, J.H., Reder, A.T., 2009. Multiple sclerosis. Part I: neuro-ophthalmic manifestations. Curr
Opin Ophthalmol. 20, 467-75.
Quiquempoix, M., et al., 2018. Layer 2/3 Pyramidal Neurons Control the Gain of Cortical Output.
Cell Reports. 24, 2799-2807.e4.

156
Ransohoff, R.M., Brown, M.A., 2012. Innate immunity in the central nervous system. The Journal
of Clinical Investigation. 122, 1164-1171.
Rasmussen, S., et al., 2007. Persistent activation of microglia is associated with neuronal
dysfunction of callosal projecting pathways and multiple sclerosis-like lesions in relapsing-
-remitting experimental autoimmune encephalomyelitis. Brain. 130, 2816-29.
Raymond, I.D., et al., 2008. Cyan fluorescent protein expression in ganglion and amacrine cells in
a thy1-CFP transgenic mouse retina. Molecular Vision. 14, 1559-1574.
Reese, B.E., Jeffery, G., 1983. Crossed and uncrossed visual topography in dorsal lateral geniculate
nucleus of the pigmented rat. J Neurophysiol. 49, 877-85.
Reichenbach, A., et al., 1988. Ultrastructure of rabbit retinal nerve fibre layer--neuro-glial
relationships, myelination, and nerve fibre spectrum. J Hirnforsch. 29, 481-91.
Ridder Iii, W.H., Nusinowitz, S., 2006. The visual evoked potential in the mouse—Origins and
response characteristics. Vision Research. 46, 902-913.
Rodriguez-Mena, D., et al., 2013. Electropysiologic Evaluation of the Visual Pathway in Patients
With Multiple Sclerosis. Journal of Clinical Neurophysiology. 30.
Rodriguez, A.R., de Sevilla Muller, L.P., Brecha, N.C., 2014. The RNA binding protein RBPMS
is a selective marker of ganglion cells in the mammalian retina. J Comp Neurol. 522, 1411-
43.
Rompani, S.B., et al., 2017. Different Modes of Visual Integration in the Lateral Geniculate
Nucleus Revealed by Single-Cell-Initiated Transsynaptic Tracing. Neuron. 93, 767-776.e6.
Roodhooft, J.M., 2009. Ocular problems in early stages of multiple sclerosis. Bull Soc Belge
Ophtalmol. 65-8.
Ruck, T., et al., 2015. Alemtuzumab in Multiple Sclerosis: Mechanism of Action and Beyond.
International journal of molecular sciences. 16, 16414-16439.
Russo, R., et al., 2008. 17Beta-estradiol prevents retinal ganglion cell loss induced by acute rise of
intraocular pressure in rat. Prog Brain Res. 173, 583-90.
Saidha, S., et al., 2011a. Visual dysfunction in multiple sclerosis correlates better with optical
coherence tomography derived estimates of macular ganglion cell layer thickness than
peripapillary retinal nerve fiber layer thickness. Multiple Sclerosis Journal. 17, 1449-1463.
Saidha, S., et al., 2011b. Primary retinal pathology in multiple sclerosis as detected by optical
coherence tomography. Brain. 134, 518-533.
Saijo, K., et al., 2011. An ADIOL-ERbeta-CtBP transrepression pathway negatively regulates
microglia-mediated inflammation. Cell. 145, 584-95.
Sanes, J.R., Masland, R.H., 2015. The types of retinal ganglion cells: current status and implications
for neuronal classification. Annu Rev Neurosci. 38, 221-46.
Schultz, V., et al., 2017. Acutely damaged axons are remyelinated in multiple sclerosis and
experimental models of demyelination. Glia. 65, 1350-1360.

157
Schulz, J.M., et al., 2009. Short-latency activation of striatal spiny neurons via subcortical visual
pathways. J Neurosci. 29, 6336-47.
Schwark, H.D., et al., 1986. Cat area 17. II. Response properties of infragranular layer neurons in
the absence of supragranular layer activity. J Neurophysiol. 56, 1074-87.
Seabrook, T.A., et al., 2017. Architecture, Function, and Assembly of the Mouse Visual System.
Annual Review of Neuroscience. 40, 499-538.
Seigo, M.A., et al., 2012. In vivo assessment of retinal neuronal layers in multiple sclerosis with
manual and automated optical coherence tomography segmentation techniques. Journal of
Neurology. 259, 2119-2130.
Sepulcre, J., et al., 2009. Contribution of white matter lesions to gray matter atrophy in multiple
sclerosis: evidence from voxel-based analysis of T1 lesions in the visual pathway. Arch
Neurol. 66, 173-9.
Shao, H., et al., 2004. Myelin/Oligodendrocyte Glycoprotein–Specific T-Cells Induce Severe Optic
Neuritis in the C57Bl/6 Mouse. Investigative Ophthalmology & Visual Science. 45, 4060-
4065.
Shen, T., et al., 2019. Differing Structural and Functional Patterns of Optic Nerve Damage in
Multiple Sclerosis and Neuromyelitis Optica Spectrum Disorder. Ophthalmology. 126,
445-453.
Shindler, K.S., et al., 2006. Retinal ganglion cell loss induced by acute optic neuritis in a relapsing
model of multiple sclerosis. Mult Scler. 12, 526-32.
Shindler, K.S., et al., 2008. Inflammatory demyelination induces axonal injury and retinal ganglion
cell apoptosis in experimental optic neuritis. Exp Eye Res. 87, 208-13.
Shughrue, P.J., Lane, M.V., Merchenthaler, I., 1997. Comparative distribution of estrogen receptor‐
α and ‐β mRNA in the rat central nervous system. Journal of Comparative Neurology. 388,
507-525.
Silvestroff, L., et al., 2012. Cuprizone-induced demyelination in the rat cerebral cortex and thyroid
hormone effects on cortical remyelination. Exp Neurol. 235, 357-67.
Skripuletz, T., et al., 2008. Cortical demyelination is prominent in the murine cuprizone model and
is strain-dependent. The American journal of pathology. 172, 1053-1061.
Skripuletz, T., et al., 2010. Cerebellar Cortical Demyelination in the Murine Cuprizone Model.
Brain Pathology. 20, 301-312.
Skripuletz, T., et al., 2013. Astrocytes regulate myelin clearance through recruitment of microglia
during cuprizone-induced demyelination. Brain. 136, 147-67.
Smith, B.J., et al., 2014. Contribution of retinal ganglion cells to the mouse electroretinogram. Doc
Ophthalmol. 128, 155-68.
Smith, J.A., et al., 2011. Estrogen or estrogen receptor agonist inhibits lipopolysaccharide induced
microglial activation and death. Neurochem Res. 36, 1587-93.

158
Smith, K.J., McDonald, W.I., 1999. The pathophysiology of multiple sclerosis: the mechanisms
underlying the production of symptoms and the natural history of the disease. Philos Trans
R Soc Lond B Biol Sci. 354, 1649-73.
Smith, M.E., 1999. Phagocytosis of myelin in demyelinative disease: a review. Neurochem Res.
24, 261-8.
Smith, R., Studd, J.W., 1992. A pilot study of the effect upon multiple sclerosis of the menopause,
hormone replacement therapy and the menstrual cycle. J R Soc Med. 85, 612-3.
Soares, R.M.G., et al., 2013. Optical neuritis induced by different concentrations of myelin
oligodendrocyte glycoprotein presents different profiles of the inflammatory process.
Autoimmunity. 46, 480-485.
Sofroniew, M.V., 2009. Molecular dissection of reactive astrogliosis and glial scar formation.
Trends in neurosciences. 32, 638-647.
Solomon, A.J., Corboy, J.R., 2017. The tension between early diagnosis and misdiagnosis of
multiple sclerosis. Nature Reviews Neurology. 13, 567.
Soto, I., et al., 2008. Retinal ganglion cells downregulate gene expression and lose their axons
within the optic nerve head in a mouse glaucoma model. J Neurosci. 28, 548-61.
Spector, R.H. (Ed.) 1990. Chapter 116. Visual Fields. Butterworths, Boston.
Steelman, A.J., Thompson, J.P., Li, J., 2012. Demyelination and remyelination in anatomically
distinct regions of the corpus callosum following cuprizone intoxication. Neurosci Res. 72,
32-42.
Stojic, A., et al., 2019. Preclinical stress originates in the rat optic nerve head during development
of autoimmune optic neuritis. Glia. 67, 512-524.
Stone, J., et al., 1995. Development of retinal vasculature is mediated by hypoxia-induced vascular
endothelial growth factor (VEGF) expression by neuroglia. J Neurosci. 15, 4738-47.
Strauss, O., 2005. The retinal pigment epithelium in visual function. Physiol Rev. 85, 845-81.
Subei, A.M., Eggenberger, E., 2012. Efferent manifestations of multiple sclerosis. Curr Opin
Ophthalmol. 23, 506-9.
Sui, Y., et al., 2006. CXCL10-induced cell death in neurons: role of calcium dysregulation. Eur J
Neurosci. 23, 957-64.
Sun, D., et al., 2009. The morphology and spatial arrangement of astrocytes in the optic nerve head
of the mouse. The Journal of comparative neurology. 516, 1-19.
Tang, Y., Le, W., 2016. Differential Roles of M1 and M2 Microglia in Neurodegenerative Diseases.
Molecular Neurobiology. 53, 1181-1194.
Tansey, E.M., Allen, T.G.J., Ikeda, H., 1986. ENHANCED RETINAL AND OPTIC NERVE
EXCITABILITY ASSOCIATED WITH DEMYELINATION IN MICE INFECTED
WITH SEMLIKI FOREST VIRUS. Brain. 109, 15-30.
Thomas, D.B., 1984. Do hormones cause breast cancer? Cancer. 53, 595-604.

159
Tirotta, E., Ransohoff, R.M., Lane, T.E., 2011. CXCR2 signaling protects oligodendrocyte
progenitor cells from IFN-γ/CXCL10-mediated apoptosis. Glia. 59, 1518-1528.
Tiwari-Woodruff, S., Voskuhl, R.R., 2009. Neuroprotective and anti-inflammatory effects of
estrogen receptor ligand treatment in mice. J Neurol Sci. 286, 81-5.
Tomassy, G.S., et al., 2014. Distinct profiles of myelin distribution along single axons of pyramidal
neurons in the neocortex. Science. 344, 319-24.
Toosy, A.T., Mason, D.F., Miller, D.H., 2014. Optic neuritis. The Lancet Neurology. 13, 83-99.
Ts'o, D.Y., Zarella, M., Burkitt, G., 2009. Whither the hypercolumn? The Journal of Physiology.
587, 2791-2805.
Usrey, W.M., Alitto, H.J., 2015. Visual Functions of the Thalamus. Annual Review of Vision
Science. 1, 351-371.
V. Kolesnikov, A., G. Kisselev, O., Kefalov, V., 2014. Signaling by Rod and Cone Photoreceptors:
Opsin Properties, G-protein Assembly, and Mechanisms of Activation. Vol., ed.^eds., pp.
23-48.
Vecino, E., et al., 2016. Glia-neuron interactions in the mammalian retina. Prog Retin Eye Res. 51,
1-40.
Villoslada, P., et al., 2012. Color vision is strongly associated with retinal thinning in multiple
sclerosis. Mult Scler. 18, 991-9.
Volpe, N.J., 2008. The Optic Neuritis Treatment Trial: A Definitive Answer and Profound Impact
With Unexpected Results. JAMA Ophthalmology. 126, 996-999.
Vukusic, S., et al., 2004. Pregnancy and multiple sclerosis (the PRIMS study): clinical predictors
of post-partum relapse. Brain. 127, 1353-60.
Walter, S.D., et al., 2012. Ganglion cell loss in relation to visual disability in multiple sclerosis.
Ophthalmology. 119, 1250-7.
Wang, S., et al., 2015. 17beta-estradiol ameliorates light-induced retinal damage in Sprague-
Dawley rats by reducing oxidative stress. J Mol Neurosci. 55, 141-151.
Whitacre, C.C., 2001. Sex differences in autoimmune disease. Nat Immunol. 2, 777-80.
Wilks, T.A., Harvey, A.R., Rodger, J., 2013. Seeing with Two Eyes: Integration of Binocular
Retinal projections in the Brain. In: Functional Brain Mapping and the Endeavor to
Understand the Working Brain. Vol., F. Signorelli, D. Chirchiglia, ed.^eds. IntechOpen.
Wolinsky, J.S., et al., 2007. Glatiramer acetate in primary progressive multiple sclerosis: results of
a multinational, multicenter, double-blind, placebo-controlled trial. Ann Neurol. 61, 14-24.
Wood, K.C., Blackwell, J.M., Geffen, M.N., 2017. Cortical inhibitory interneurons control sensory
processing. Current opinion in neurobiology. 46, 200-207.
Yamate-Morgan, H., et al., 2019. Functional Effects of Cuprizone-Induced Demyelination in the
Presence of the mTOR-Inhibitor Rapamycin. Neuroscience. 406, 667-683.

160
You, Y., et al., 2011. Latency delay of visual evoked potential is a real measurement of
demyelination in a rat model of optic neuritis. Invest Ophthalmol Vis Sci. 52, 6911-8.
You, Y., et al., 2012. Anterograde Degeneration along the Visual Pathway after Optic Nerve Injury.
PLOS ONE. 7, e52061.
You, Y., et al., 2015. Visual Evoked Potential Recording in a Rat Model of Experimental Optic
Nerve Demyelination. J Vis Exp. e52934.
You, Y., et al., 2019. Demyelination precedes axonal loss in the transneuronal spread of human
neurodegenerative disease. Brain. 142, 426-442.
Young, B., Eggenberger, E., Kaufman, D., 2012. Current electrophysiology in ophthalmology: a
review. Curr Opin Ophthalmol. 23, 497-505.
Yu, M., et al., 2011. Visual abnormalities associated with enhanced optic nerve myelination. Brain
research. 1374, 36-42.
Yuan, L., Neufeld, A.H., 2001. Activated microglia in the human glaucomatous optic nerve head.
J Neurosci Res. 64, 523-32.
Zhang, X., Cheng, M., Chintala, S.K., 2004. Kainic Acid–Mediated Upregulation of Matrix
Metalloproteinase-9 Promotes Retinal Degeneration. Investigative Ophthalmology &
Visual Science. 45, 2374-2383.
Zhu, Y., et al., 2015. Control of response reliability by parvalbumin-expressing interneurons in
visual cortex. Nature Communications. 6, 6802.
Ziehn, M.O., et al., 2010. Hippocampal CA1 atrophy and synaptic loss during experimental
autoimmune encephalomyelitis, EAE. Laboratory Investigation. 90, 774-786.