Porphyry Copper: Revisiting Mineral Resource Assessment ...
16
Citation: Hammarstrom, J.M. Porphyry Copper: Revisiting Mineral Resource Assessment Predictions for the Andes. Minerals 2022, 12, 856. https://doi.org/10.3390/ min12070856 Academic Editors: Panagiotis Voudouris, Anita Parbhakar-Fox and Nathan Fox Received: 2 June 2022 Accepted: 28 June 2022 Published: 4 July 2022 Publisher’s Note: MDPI stays neutral with regard to jurisdictional claims in published maps and institutional affil- iations. Copyright: © 2022 by the author. Licensee MDPI, Basel, Switzerland. This article is an open access article distributed under the terms and conditions of the Creative Commons Attribution (CC BY) license (https:// creativecommons.org/licenses/by/ 4.0/). minerals Article Porphyry Copper: Revisiting Mineral Resource Assessment Predictions for the Andes Jane Marie Hammarstrom U.S. Geological Survey, Reston, VA 20192, USA; [email protected] Abstract: A mineral resource assessment of porphyry copper deposits in the Andes Mountains of South America was done in 2005 in cooperation with geological surveys in South America. The study identified 590 million metric tons (Mt) of copper in identified resources. Continued exploration and development in the region over a 15-year period provide an opportunity to compare the predicted assessment results with new discoveries and resource growth in previously known deposits. The 2005 assessment estimated that 145 undiscovered deposits could contain a mean of 750 Mt of copper. The actual number of deposits increased (2005 to 2020) from 69 to 120 and the amount of identified copper resources increased from 590 Mt to 1600 Mt. Although most of the new deposits and copper resources are concentrated in Miocene-Pliocene and Eocene-Oligocene mineral belts, new deposits have been discovered in Jurassic and Cretaceous mineral belts. Resource growth in porphyry copper deposits known in the Andes in 2005 (1100 Mt copper) exceeds copper resources in new discoveries since 2005 (490 Mt copper) by a factor of 2. Keywords: porphyry copper; Andes; mineral resource assessment 1. Introduction Mineral resource assessments represent a synthesis of the state of knowledge about identified and potential undiscovered resources for a given deposit type in a given place at a given time. Ideally, mineral resource assessments are done on a recurring basis to incorporate new geologic data, improved digital map scales, and exploration results, evolving mineral system and mineral deposit concepts, and new assessment tools. The first global mineral resource assessment of porphyry copper deposits was completed over a period of more than 10 years using the U.S. Geological Survey (USGS) form of quantitative mineral resource assessment [1]. In this geology-based form of assessment, conducted at a scale of 1:1,000,000, geo- graphic areas are delineated as permissive for the occurrence of porphyry copper deposits using criteria in descriptive mineral deposit models. Grade and tonnage models of deposits that have well-defined identified resources are used as analogs for the endowment of undis- covered deposits. Probabilistic estimates of numbers of undiscovered deposits assumed to share descriptive and grade-tonnage characteristics with those in the models are combined with grade and tonnage models in a Monte Carlo simulation to provide a mean and a distribution of estimated amounts of undiscovered copper resources at different quantiles. The global assessment was done for different world regions by the USGS in cooperation with many international institutions and individual collaborators. Regions were assessed in a series of studies published between 2008 and 2019. Results of the assessment of both porphyry copper and sediment-hosted stratabound deposits were summarized in a fact sheet [2], a GIS [3], and in a summary report and atlas [4]. Porphyry copper deposits represent the largest source of global copper supply, as well as significant sources of molybdenum, gold, and silver. Porphyry copper deposits occur in subduction-related magmatic arcs, in volcanic island arcs, and in belts of magmatic rocks that formed in postconvergent tectonic settings. They form at shallow crustal depths, Minerals 2022, 12, 856. https://doi.org/10.3390/min12070856 https://www.mdpi.com/journal/minerals
-
Upload
khangminh22 -
Category
Documents
-
view
0 -
download
0
Transcript of Porphyry Copper: Revisiting Mineral Resource Assessment ...
Citation: Hammarstrom, J.M.
Porphyry Copper: Revisiting Mineral
Resource Assessment Predictions for
the Andes. Minerals 2022, 12, 856.
https://doi.org/10.3390/
min12070856
Academic Editors:
Panagiotis Voudouris, Anita
Parbhakar-Fox and Nathan Fox
Received: 2 June 2022
Accepted: 28 June 2022
Published: 4 July 2022
Publisher’s Note: MDPI stays neutral
with regard to jurisdictional claims in
published maps and institutional affil-
iations.
Copyright: © 2022 by the author.
Licensee MDPI, Basel, Switzerland.
This article is an open access article
distributed under the terms and
conditions of the Creative Commons
Attribution (CC BY) license (https://
creativecommons.org/licenses/by/
4.0/).
minerals
Article
Porphyry Copper: Revisiting Mineral Resource AssessmentPredictions for the AndesJane Marie Hammarstrom
U.S. Geological Survey, Reston, VA 20192, USA; [email protected]
Abstract: A mineral resource assessment of porphyry copper deposits in the Andes Mountains ofSouth America was done in 2005 in cooperation with geological surveys in South America. The studyidentified 590 million metric tons (Mt) of copper in identified resources. Continued exploration anddevelopment in the region over a 15-year period provide an opportunity to compare the predictedassessment results with new discoveries and resource growth in previously known deposits. The2005 assessment estimated that 145 undiscovered deposits could contain a mean of 750 Mt of copper.The actual number of deposits increased (2005 to 2020) from 69 to 120 and the amount of identifiedcopper resources increased from 590 Mt to 1600 Mt. Although most of the new deposits and copperresources are concentrated in Miocene-Pliocene and Eocene-Oligocene mineral belts, new depositshave been discovered in Jurassic and Cretaceous mineral belts. Resource growth in porphyry copperdeposits known in the Andes in 2005 (1100 Mt copper) exceeds copper resources in new discoveriessince 2005 (490 Mt copper) by a factor of 2.
Keywords: porphyry copper; Andes; mineral resource assessment
1. Introduction
Mineral resource assessments represent a synthesis of the state of knowledge aboutidentified and potential undiscovered resources for a given deposit type in a given placeat a given time. Ideally, mineral resource assessments are done on a recurring basisto incorporate new geologic data, improved digital map scales, and exploration results,evolving mineral system and mineral deposit concepts, and new assessment tools. The firstglobal mineral resource assessment of porphyry copper deposits was completed over aperiod of more than 10 years using the U.S. Geological Survey (USGS) form of quantitativemineral resource assessment [1].
In this geology-based form of assessment, conducted at a scale of 1:1,000,000, geo-graphic areas are delineated as permissive for the occurrence of porphyry copper depositsusing criteria in descriptive mineral deposit models. Grade and tonnage models of depositsthat have well-defined identified resources are used as analogs for the endowment of undis-covered deposits. Probabilistic estimates of numbers of undiscovered deposits assumed toshare descriptive and grade-tonnage characteristics with those in the models are combinedwith grade and tonnage models in a Monte Carlo simulation to provide a mean and adistribution of estimated amounts of undiscovered copper resources at different quantiles.The global assessment was done for different world regions by the USGS in cooperationwith many international institutions and individual collaborators. Regions were assessedin a series of studies published between 2008 and 2019. Results of the assessment of bothporphyry copper and sediment-hosted stratabound deposits were summarized in a factsheet [2], a GIS [3], and in a summary report and atlas [4].
Porphyry copper deposits represent the largest source of global copper supply, aswell as significant sources of molybdenum, gold, and silver. Porphyry copper depositsoccur in subduction-related magmatic arcs, in volcanic island arcs, and in belts of magmaticrocks that formed in postconvergent tectonic settings. They form at shallow crustal depths,
Minerals 2022, 12, 856. https://doi.org/10.3390/min12070856 https://www.mdpi.com/journal/minerals
Minerals 2022, 12, 856 2 of 16
typically less than 4 kilometers (km), associated with calc-alkalic igneous rocks. Mostknown deposits are Mesozoic or Cenozoic in age although a few deposits as old as Archeanhave been reported [5–7]. Precambrian deposits are rarely preserved, which probablyreflects the shallow emplacement of porphyry systems in tectonically active settings thatare prone to uplift and erosion [5].
A porphyry copper assessment of the Andes region of South America was the firstregion assessed in 2005 and published in 2008 as part of the USGS Global Mineral ResourceAssessment project [8,9]. The Andes host the largest known porphyry copper depositsin the world, and the region continues to be an area of active mineral exploration anddevelopment. Therefore, recent resource data for porphyry copper discoveries in the Andesprovide an opportunity to compare what was predicted as of 2005 using this methodologywith what has been discovered in the last 15 years. The 2005 Andes assessment wasincluded in a global assessment of undiscovered copper resources, with the addition ofan estimate of the amount of in-place undiscovered resources that might be economicallyrecoverable [4,10]. Those data are also available in on-line [8] viewer at https://mrdata.usgs.gov/sir20105090z/map-us.html (accessed on 1 May 2022).
Although this form of quantitative mineral resource assessment was developed inthe 1990s [11,12] and used in many USGS mineral resource assessments, this is the firstretrospective study comparing probabilistic estimates of in situ undiscovered resourceswith new discoveries and resource growth.
2. Background: Porphyry Copper Assessment of the Andes
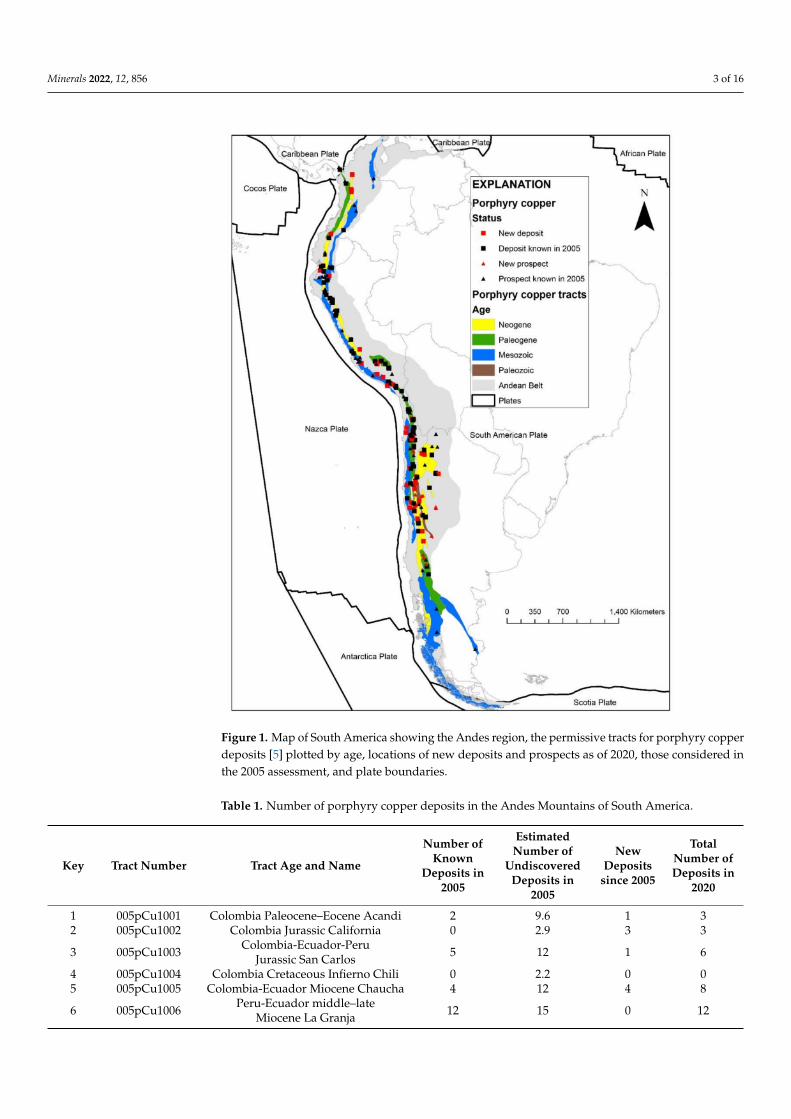
The 2005 porphyry copper assessment of the Andes identified 26 tracts of land thatwere deemed to be permissive for the occurrence Phanerozoic porphyry copper deposits [8].Tracts were delineated on the basis of permissive geology at a scale of 1:1,000,000 assuminga depth cutoff to the top of a porphyry system of 1 km below the Earth’s surface. Initially,tracts were constructed by considering island- and continental volcanic-arc subduction-boundary zones as the geologic environment permissive for porphyry copper formationand plotting locations of all known Andean porphyry copper deposits and prospects thatwere included in a global porphyry copper compilation [13]. Geologic map distributions ofintermediate composition volcanic and (or) plutonic rocks that formed during periods ofapproximately coeval arc magmatism, as well as structural and tectonic controls, availablegeophysics and geochemistry, and regional expertise were used to refine tract boundariesand extend boundaries under shallow cover. Age ranges of host rocks and dated depositswere used to assign tracts to a geologic age (Figure 1). Tracts excluded areas that wereconsidered too deeply eroded to host porphyry copper deposits. In some cases, coevaltracts were separated based on differences in level of erosion or extent of exploration.Permissive tracts ranged in size from about 2000 to 220,000 km2 [8]. The original permissivetract designations used in the 2005 assessment (SA01PC–SA20PC) were renumbered inthe global assessment using the permissive tract code adopted for that study (005 for UNregion for South America, pCu for porphyry copper, and a 4-digit number starting with1001). For example, tract SA01PC is the same as tract 005pCu1001, and so on (Table 1).
There were 69 discovered porphyry copper deposits identified in the study area atthe time of the assessment in 2005 (Figure 1). The term “discovered”, or “known” depositwas restricted to deposits reported in the literature to be well-explored in three dimensionsand have publicly available ore tonnages and grades. Identified resources include pastproduction, reserves, and measured, indicated, and inferred resources at the lowest cutoffgrade reported. Other examples of porphyry-style mineralization that were not well-characterized were considered as prospects, albeit some of which would likely becomedeposits with further exploration. In addition to the 69 identified porphyry copper deposits,68 prospects were identified. The numbers of known deposits in the tracts ranged fromnone (8 tracts) to 12 (Table 1).
Minerals 2022, 12, 856 3 of 16
Figure 1. Map of South America showing the Andes region, the permissive tracts for porphyry copperdeposits [5] plotted by age, locations of new deposits and prospects as of 2020, those considered inthe 2005 assessment, and plate boundaries.
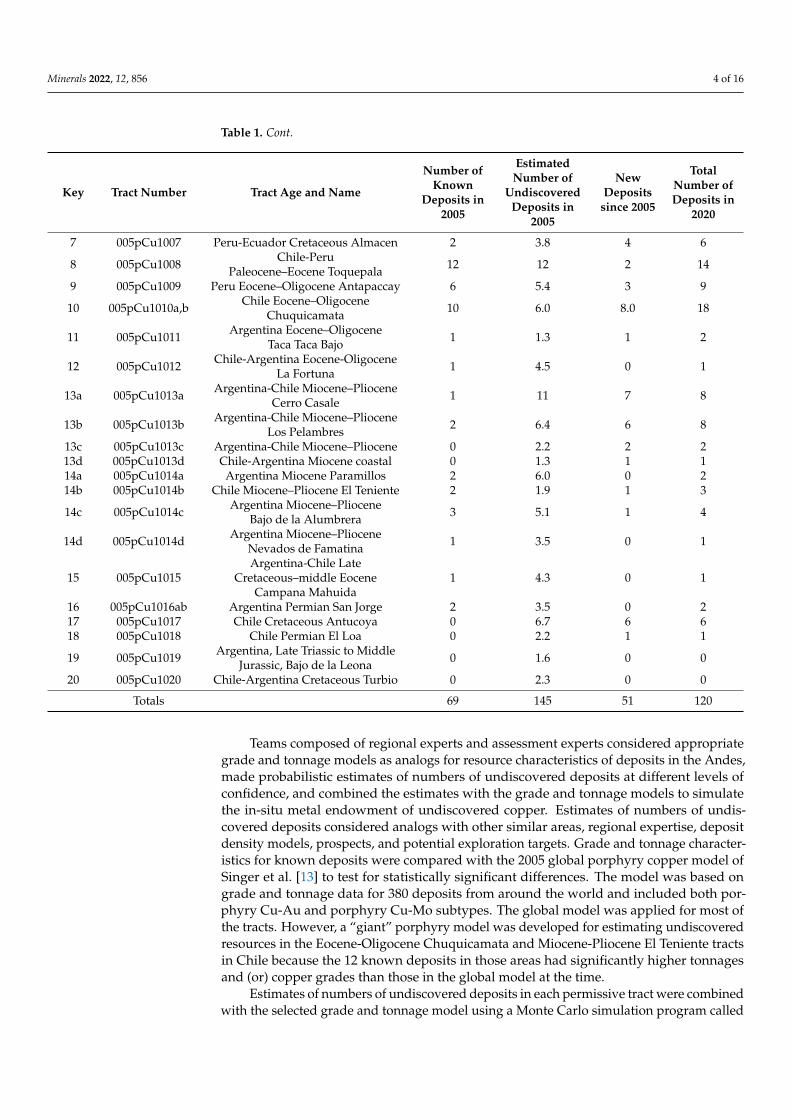
Table 1. Number of porphyry copper deposits in the Andes Mountains of South America.
Key Tract Number Tract Age and Name
Number ofKnown
Deposits in2005
EstimatedNumber of
UndiscoveredDeposits in
2005
NewDeposits
since 2005
TotalNumber ofDeposits in
2020
1 005pCu1001 Colombia Paleocene–Eocene Acandi 2 9.6 1 32 005pCu1002 Colombia Jurassic California 0 2.9 3 3
3 005pCu1003 Colombia-Ecuador-PeruJurassic San Carlos 5 12 1 6
4 005pCu1004 Colombia Cretaceous Infierno Chili 0 2.2 0 05 005pCu1005 Colombia-Ecuador Miocene Chaucha 4 12 4 8
6 005pCu1006 Peru-Ecuador middle–lateMiocene La Granja 12 15 0 12
Minerals 2022, 12, 856 4 of 16
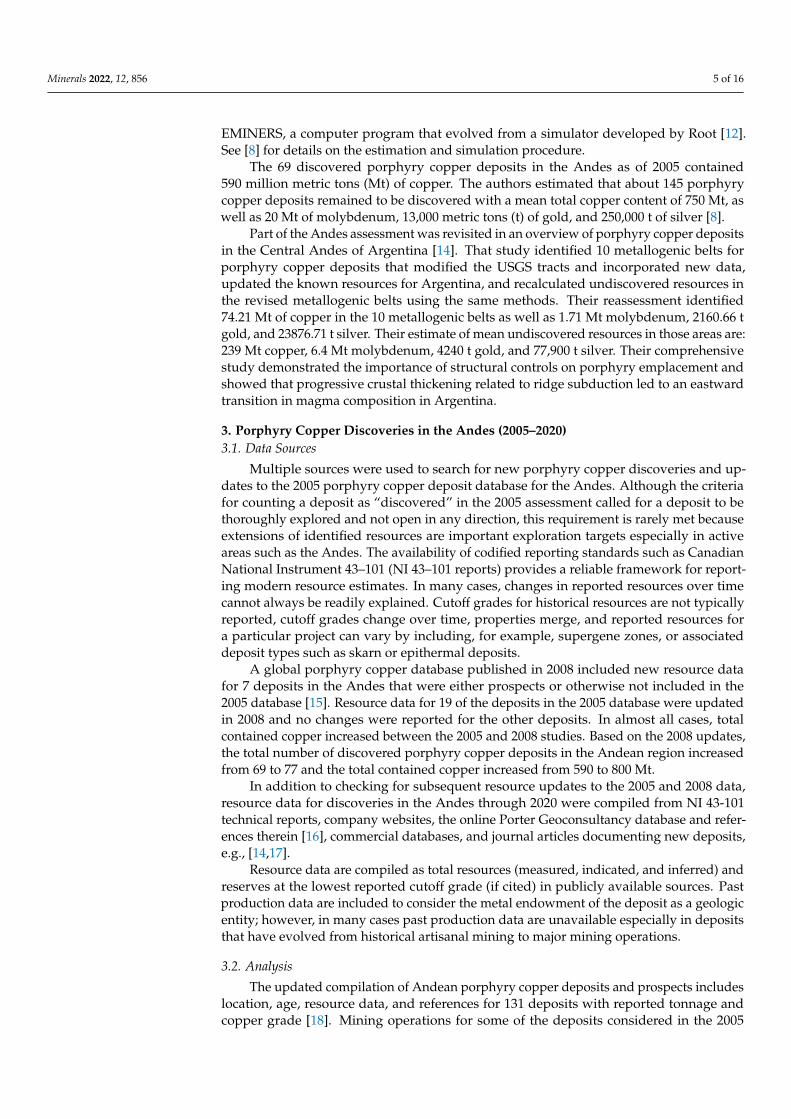
Table 1. Cont.
Key Tract Number Tract Age and Name
Number ofKnown
Deposits in2005
EstimatedNumber of
UndiscoveredDeposits in
2005
NewDeposits
since 2005
TotalNumber ofDeposits in
2020
7 005pCu1007 Peru-Ecuador Cretaceous Almacen 2 3.8 4 6
8 005pCu1008 Chile-PeruPaleocene–Eocene Toquepala 12 12 2 14
9 005pCu1009 Peru Eocene–Oligocene Antapaccay 6 5.4 3 9
10 005pCu1010a,b Chile Eocene–OligoceneChuquicamata 10 6.0 8.0 18
11 005pCu1011 Argentina Eocene–OligoceneTaca Taca Bajo 1 1.3 1 2
12 005pCu1012 Chile-Argentina Eocene-OligoceneLa Fortuna 1 4.5 0 1
13a 005pCu1013a Argentina-Chile Miocene–PlioceneCerro Casale 1 11 7 8
13b 005pCu1013b Argentina-Chile Miocene–PlioceneLos Pelambres 2 6.4 6 8
13c 005pCu1013c Argentina-Chile Miocene–Pliocene 0 2.2 2 213d 005pCu1013d Chile-Argentina Miocene coastal 0 1.3 1 114a 005pCu1014a Argentina Miocene Paramillos 2 6.0 0 214b 005pCu1014b Chile Miocene–Pliocene El Teniente 2 1.9 1 3
14c 005pCu1014c Argentina Miocene–PlioceneBajo de la Alumbrera 3 5.1 1 4
14d 005pCu1014d Argentina Miocene–PlioceneNevados de Famatina 1 3.5 0 1
15 005pCu1015Argentina-Chile Late
Cretaceous–middle EoceneCampana Mahuida
1 4.3 0 1
16 005pCu1016ab Argentina Permian San Jorge 2 3.5 0 217 005pCu1017 Chile Cretaceous Antucoya 0 6.7 6 618 005pCu1018 Chile Permian El Loa 0 2.2 1 1
19 005pCu1019 Argentina, Late Triassic to MiddleJurassic, Bajo de la Leona 0 1.6 0 0
20 005pCu1020 Chile-Argentina Cretaceous Turbio 0 2.3 0 0
Totals 69 145 51 120
Teams composed of regional experts and assessment experts considered appropriategrade and tonnage models as analogs for resource characteristics of deposits in the Andes,made probabilistic estimates of numbers of undiscovered deposits at different levels ofconfidence, and combined the estimates with the grade and tonnage models to simulatethe in-situ metal endowment of undiscovered copper. Estimates of numbers of undis-covered deposits considered analogs with other similar areas, regional expertise, depositdensity models, prospects, and potential exploration targets. Grade and tonnage character-istics for known deposits were compared with the 2005 global porphyry copper model ofSinger et al. [13] to test for statistically significant differences. The model was based ongrade and tonnage data for 380 deposits from around the world and included both por-phyry Cu-Au and porphyry Cu-Mo subtypes. The global model was applied for most ofthe tracts. However, a “giant” porphyry model was developed for estimating undiscoveredresources in the Eocene-Oligocene Chuquicamata and Miocene-Pliocene El Teniente tractsin Chile because the 12 known deposits in those areas had significantly higher tonnagesand (or) copper grades than those in the global model at the time.
Estimates of numbers of undiscovered deposits in each permissive tract were combinedwith the selected grade and tonnage model using a Monte Carlo simulation program called
Minerals 2022, 12, 856 5 of 16
EMINERS, a computer program that evolved from a simulator developed by Root [12].See [8] for details on the estimation and simulation procedure.
The 69 discovered porphyry copper deposits in the Andes as of 2005 contained590 million metric tons (Mt) of copper. The authors estimated that about 145 porphyrycopper deposits remained to be discovered with a mean total copper content of 750 Mt, aswell as 20 Mt of molybdenum, 13,000 metric tons (t) of gold, and 250,000 t of silver [8].
Part of the Andes assessment was revisited in an overview of porphyry copper depositsin the Central Andes of Argentina [14]. That study identified 10 metallogenic belts forporphyry copper deposits that modified the USGS tracts and incorporated new data,updated the known resources for Argentina, and recalculated undiscovered resources inthe revised metallogenic belts using the same methods. Their reassessment identified74.21 Mt of copper in the 10 metallogenic belts as well as 1.71 Mt molybdenum, 2160.66 tgold, and 23876.71 t silver. Their estimate of mean undiscovered resources in those areas are:239 Mt copper, 6.4 Mt molybdenum, 4240 t gold, and 77,900 t silver. Their comprehensivestudy demonstrated the importance of structural controls on porphyry emplacement andshowed that progressive crustal thickening related to ridge subduction led to an eastwardtransition in magma composition in Argentina.
3. Porphyry Copper Discoveries in the Andes (2005–2020)3.1. Data Sources
Multiple sources were used to search for new porphyry copper discoveries and up-dates to the 2005 porphyry copper deposit database for the Andes. Although the criteriafor counting a deposit as “discovered” in the 2005 assessment called for a deposit to bethoroughly explored and not open in any direction, this requirement is rarely met becauseextensions of identified resources are important exploration targets especially in activeareas such as the Andes. The availability of codified reporting standards such as CanadianNational Instrument 43–101 (NI 43–101 reports) provides a reliable framework for report-ing modern resource estimates. In many cases, changes in reported resources over timecannot always be readily explained. Cutoff grades for historical resources are not typicallyreported, cutoff grades change over time, properties merge, and reported resources fora particular project can vary by including, for example, supergene zones, or associateddeposit types such as skarn or epithermal deposits.
A global porphyry copper database published in 2008 included new resource datafor 7 deposits in the Andes that were either prospects or otherwise not included in the2005 database [15]. Resource data for 19 of the deposits in the 2005 database were updatedin 2008 and no changes were reported for the other deposits. In almost all cases, totalcontained copper increased between the 2005 and 2008 studies. Based on the 2008 updates,the total number of discovered porphyry copper deposits in the Andean region increasedfrom 69 to 77 and the total contained copper increased from 590 to 800 Mt.
In addition to checking for subsequent resource updates to the 2005 and 2008 data,resource data for discoveries in the Andes through 2020 were compiled from NI 43-101technical reports, company websites, the online Porter Geoconsultancy database and refer-ences therein [16], commercial databases, and journal articles documenting new deposits,e.g., [14,17].
Resource data are compiled as total resources (measured, indicated, and inferred) andreserves at the lowest reported cutoff grade (if cited) in publicly available sources. Pastproduction data are included to consider the metal endowment of the deposit as a geologicentity; however, in many cases past production data are unavailable especially in depositsthat have evolved from historical artisanal mining to major mining operations.
3.2. Analysis
The updated compilation of Andean porphyry copper deposits and prospects includeslocation, age, resource data, and references for 131 deposits with reported tonnage andcopper grade [18]. Mining operations for some of the deposits considered in the 2005
Minerals 2022, 12, 856 6 of 16
assessment merged with other deposits. For example, the Ujina and Rosario deposits inChile are now part of the Collahuasi deposit. Some sites that were considered as prospectsin 2005, such as Los Azules in Argentina and El Hito in Ecuador now have CIM-compliantresources reported [19]. Updated grade and tonnage, locations, or new references areavailable for 59 of the original deposits in addition to the 51 new deposits. There areundoubtedly additional deposits and prospects in the pipeline given the exploration activityin the Andes region.
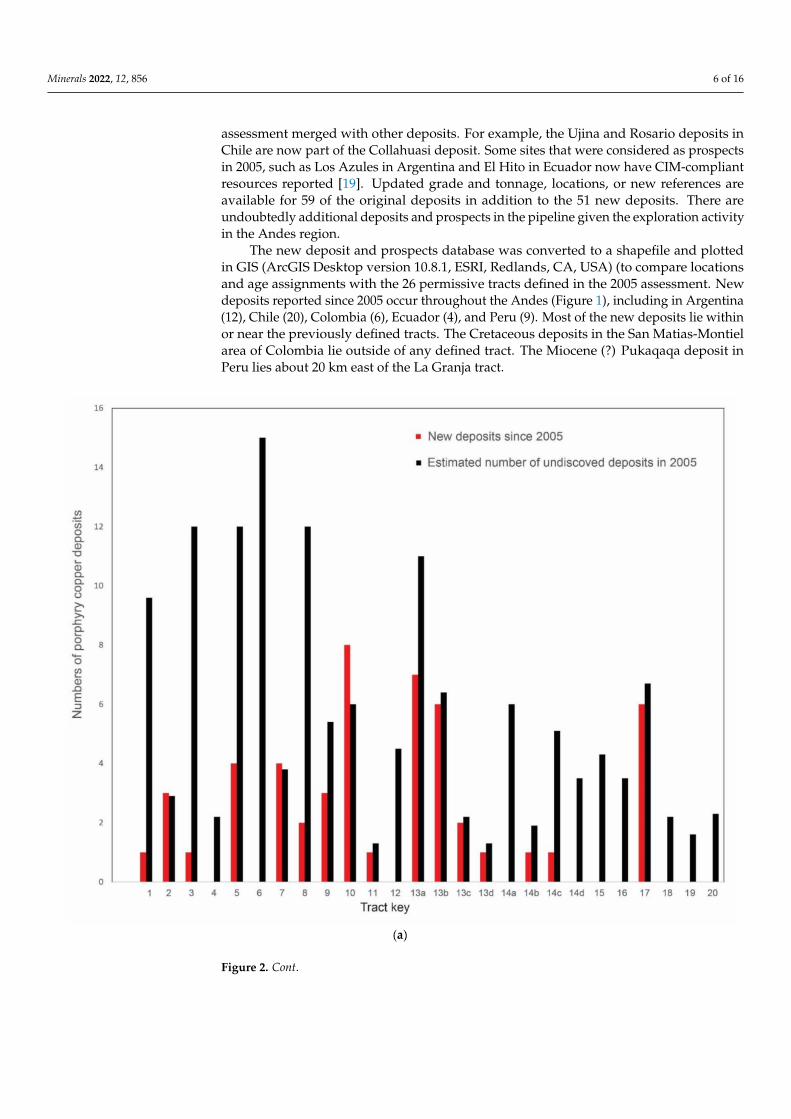
The new deposit and prospects database was converted to a shapefile and plottedin GIS (ArcGIS Desktop version 10.8.1, ESRI, Redlands, CA, USA) (to compare locationsand age assignments with the 26 permissive tracts defined in the 2005 assessment. Newdeposits reported since 2005 occur throughout the Andes (Figure 1), including in Argentina(12), Chile (20), Colombia (6), Ecuador (4), and Peru (9). Most of the new deposits lie withinor near the previously defined tracts. The Cretaceous deposits in the San Matias-Montielarea of Colombia lie outside of any defined tract. The Miocene (?) Pukaqaqa deposit inPeru lies about 20 km east of the La Granja tract.
Figure 2. Cont.
Minerals 2022, 12, 856 7 of 16
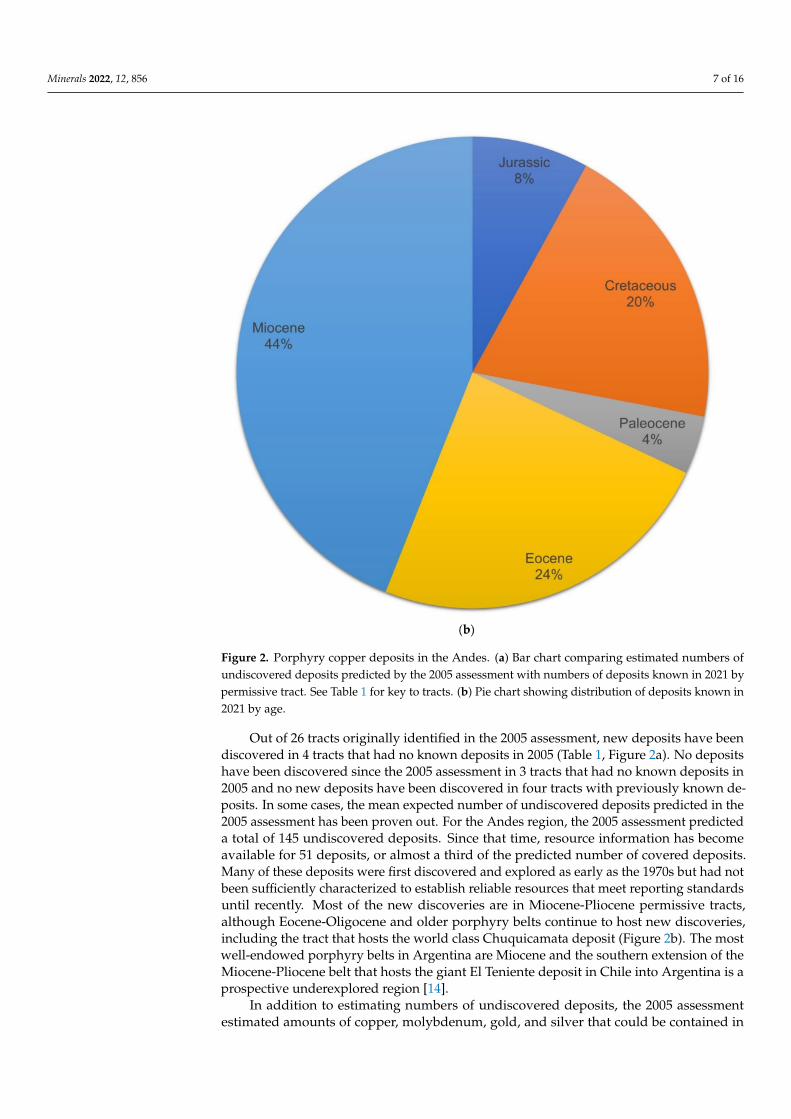
Figure 2. Porphyry copper deposits in the Andes. (a) Bar chart comparing estimated numbers ofundiscovered deposits predicted by the 2005 assessment with numbers of deposits known in 2021 bypermissive tract. See Table 1 for key to tracts. (b) Pie chart showing distribution of deposits known in2021 by age.
Out of 26 tracts originally identified in the 2005 assessment, new deposits have beendiscovered in 4 tracts that had no known deposits in 2005 (Table 1, Figure 2a). No depositshave been discovered since the 2005 assessment in 3 tracts that had no known deposits in2005 and no new deposits have been discovered in four tracts with previously known de-posits. In some cases, the mean expected number of undiscovered deposits predicted in the2005 assessment has been proven out. For the Andes region, the 2005 assessment predicteda total of 145 undiscovered deposits. Since that time, resource information has becomeavailable for 51 deposits, or almost a third of the predicted number of covered deposits.Many of these deposits were first discovered and explored as early as the 1970s but had notbeen sufficiently characterized to establish reliable resources that meet reporting standardsuntil recently. Most of the new discoveries are in Miocene-Pliocene permissive tracts,although Eocene-Oligocene and older porphyry belts continue to host new discoveries,including the tract that hosts the world class Chuquicamata deposit (Figure 2b). The mostwell-endowed porphyry belts in Argentina are Miocene and the southern extension of theMiocene-Pliocene belt that hosts the giant El Teniente deposit in Chile into Argentina is aprospective underexplored region [14].
In addition to estimating numbers of undiscovered deposits, the 2005 assessmentestimated amounts of copper, molybdenum, gold, and silver that could be contained in
Minerals 2022, 12, 856 8 of 16
undiscovered deposits. The results of the resource simulations are probability distributionsof amounts of in situ contained metal. Selected quantiles from the assessment, along withthe mean expected amount of undiscovered and the amount of mean copper that could beeconomic based on a simple economic filter are listed along with the amount of copper innew deposits in each tract (Table 2). For example, the Miocene Chauca tract in Colombia andEcuador (key 5) had 4.1 million metric tons (Mt) of copper reported in 2005 with 95 percentchance of hosting 3.2 Mt or more of undiscovered copper, a 90 percent chance of 7.4 Mt, andso forth with a mean 39 Mt of which 21 Mt are likely to be economic. The economic filterdata [6,7] incorporate assumptions about depth distribution (to 1 km from the surface) andinfrastructure availability [10]. Comparison of the amounts of copper in new discoverieswith the estimates from the assessment shows that copper has been discovered in fourtracts that had no reported resources in 2005. Amounts of discovered copper in the 15 yearssince the assessment generally lie in the most certain quantile range (95, 90) of undiscoveredcopper estimated to be present. New deposits in the Eocene–Oligocene Chuquicamatatract in Chile increased the copper associated by 372.1 Mt of copper added since 2005,exceeding the mean value of 210 Mt predicted by the assessment and approaching theamount predicted at the 10 percent confidence level. Given the presence of the supergiantdeposits in that tract and an exploration focus in the area, the results are not surprising.Chile leads the world in copper mine production averaging about 5.6 Mt annually in recentyears with most of the production coming from the Chuquicamata-Radomiro Tomic and ElTeniente mines [20]. The 490 Mt of new identified copper resources represent about 80% ofthe 590 Mt known in 2005. This is comparable to the 480 Mt of mean undiscovered copperthat was considered to be economic. Much of the data is for inferred resources, not reserves,and resources are likely to change over time as projects move to feasibility and reservesbecome established.
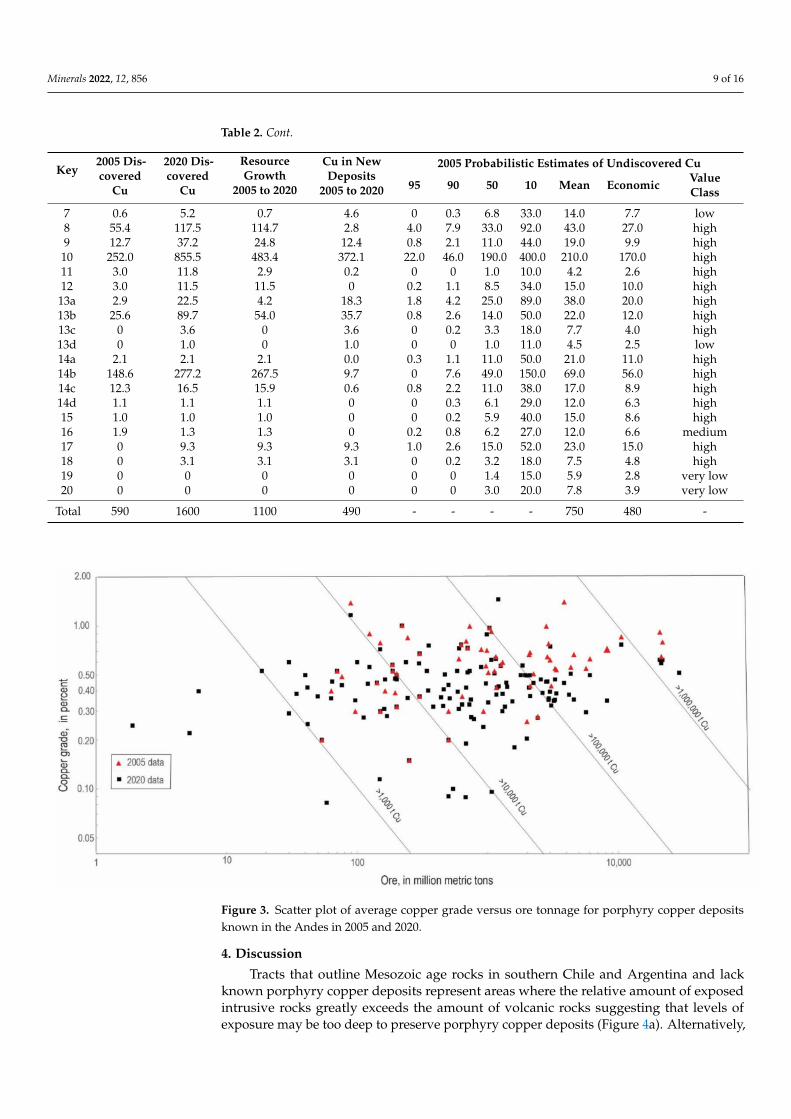
Changes in amounts of discovered copper in porphyry deposits in the Andes ona tract basis show that copper resources in 11 of the 26 tracts have more than doubledin the 15-year period (Table 2). The assessment only dealt with copper in undiscovereddeposits. An equally important consideration is resource growth over time for depositsthat had identified resources reported in in 2005. Some tracts have no new discoveriesbut significantly increased resources from growth of deposits. For example, reportedcopper resources in the Eocene-Oligocene Antapaccay tract in Peru increased from 12.7 to37.2 Mt between 2005 and 2021. As others have noted (e.g., [17]), tonnages have increased,and copper grades decreased slightly with time on a global scale (Figure 3). Depositswith grades approaching 1% Cu typically include higher grade skarn zones or enrichedsupergene ores.
The total copper contained in known deposits in the Andes increased from 590 Mt in2005 to 800 Mt in 2008 to 1600 Mt as of 2021. The latest value exceeds the 10% chance of atleast 1000 Mt of copper estimated for the aggregated results for South America compiledin 2015. The economic filter applied to the mean estimated in situ resources predictedthat about 60 percent of those resources would be economic given the assumption applied.Resource growth in deposits that were known in 2005 (1100 Mt copper) exceeds copperresources in new discoveries (490 Mt copper) by a factor of 2 (Table 2).
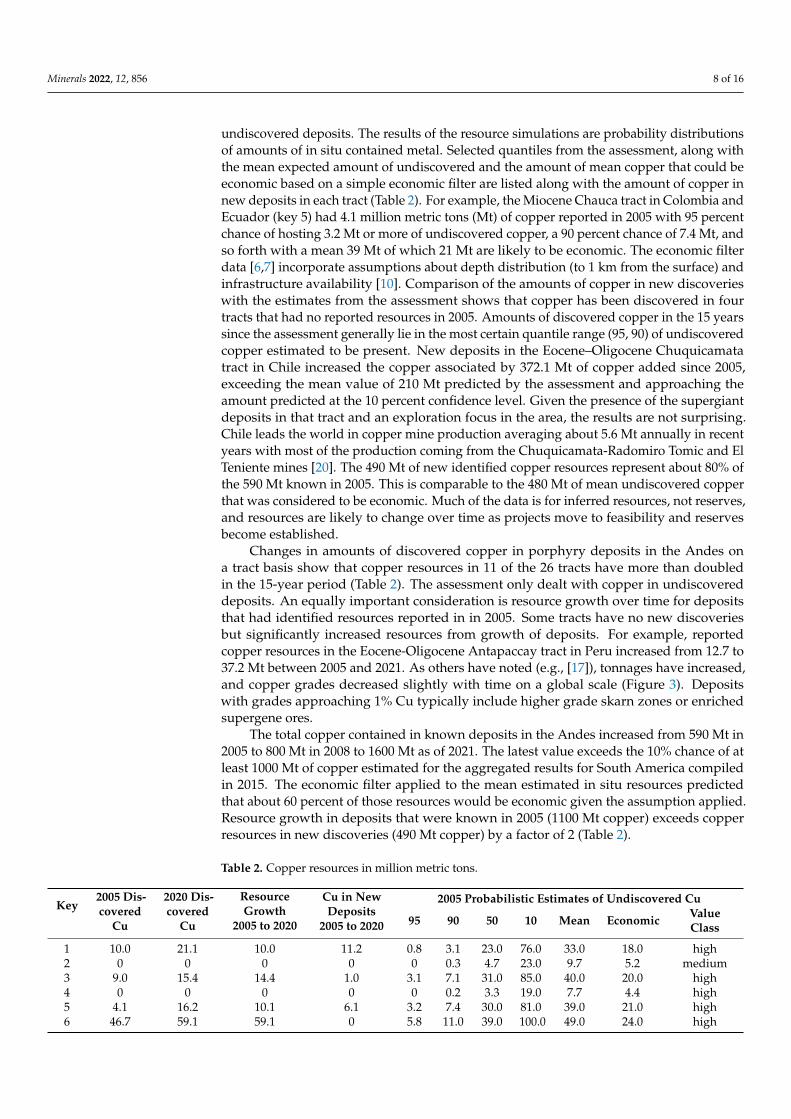
Table 2. Copper resources in million metric tons.
Key2005 Dis-covered
Cu
2020 Dis-covered
Cu
ResourceGrowth
2005 to 2020
Cu in NewDeposits
2005 to 2020
2005 Probabilistic Estimates of Undiscovered Cu
95 90 50 10 Mean Economic ValueClass
1 10.0 21.1 10.0 11.2 0.8 3.1 23.0 76.0 33.0 18.0 high2 0 0 0 0 0 0.3 4.7 23.0 9.7 5.2 medium3 9.0 15.4 14.4 1.0 3.1 7.1 31.0 85.0 40.0 20.0 high4 0 0 0 0 0 0.2 3.3 19.0 7.7 4.4 high5 4.1 16.2 10.1 6.1 3.2 7.4 30.0 81.0 39.0 21.0 high6 46.7 59.1 59.1 0 5.8 11.0 39.0 100.0 49.0 24.0 high
Minerals 2022, 12, 856 9 of 16
Table 2. Cont.
Key2005 Dis-covered
Cu
2020 Dis-covered
Cu
ResourceGrowth
2005 to 2020
Cu in NewDeposits
2005 to 2020
2005 Probabilistic Estimates of Undiscovered Cu
95 90 50 10 Mean Economic ValueClass
7 0.6 5.2 0.7 4.6 0 0.3 6.8 33.0 14.0 7.7 low8 55.4 117.5 114.7 2.8 4.0 7.9 33.0 92.0 43.0 27.0 high9 12.7 37.2 24.8 12.4 0.8 2.1 11.0 44.0 19.0 9.9 high
10 252.0 855.5 483.4 372.1 22.0 46.0 190.0 400.0 210.0 170.0 high11 3.0 11.8 2.9 0.2 0 0 1.0 10.0 4.2 2.6 high12 3.0 11.5 11.5 0 0.2 1.1 8.5 34.0 15.0 10.0 high13a 2.9 22.5 4.2 18.3 1.8 4.2 25.0 89.0 38.0 20.0 high13b 25.6 89.7 54.0 35.7 0.8 2.6 14.0 50.0 22.0 12.0 high13c 0 3.6 0 3.6 0 0.2 3.3 18.0 7.7 4.0 high13d 0 1.0 0 1.0 0 0 1.0 11.0 4.5 2.5 low14a 2.1 2.1 2.1 0.0 0.3 1.1 11.0 50.0 21.0 11.0 high14b 148.6 277.2 267.5 9.7 0 7.6 49.0 150.0 69.0 56.0 high14c 12.3 16.5 15.9 0.6 0.8 2.2 11.0 38.0 17.0 8.9 high14d 1.1 1.1 1.1 0 0 0.3 6.1 29.0 12.0 6.3 high15 1.0 1.0 1.0 0 0 0.2 5.9 40.0 15.0 8.6 high16 1.9 1.3 1.3 0 0.2 0.8 6.2 27.0 12.0 6.6 medium17 0 9.3 9.3 9.3 1.0 2.6 15.0 52.0 23.0 15.0 high18 0 3.1 3.1 3.1 0 0.2 3.2 18.0 7.5 4.8 high19 0 0 0 0 0 0 1.4 15.0 5.9 2.8 very low20 0 0 0 0 0 0 3.0 20.0 7.8 3.9 very low
Total 590 1600 1100 490 - - - - 750 480 -
Figure 3. Scatter plot of average copper grade versus ore tonnage for porphyry copper depositsknown in the Andes in 2005 and 2020.
4. Discussion
Tracts that outline Mesozoic age rocks in southern Chile and Argentina and lackknown porphyry copper deposits represent areas where the relative amount of exposedintrusive rocks greatly exceeds the amount of volcanic rocks suggesting that levels ofexposure may be too deep to preserve porphyry copper deposits (Figure 4a). Alternatively,
Minerals 2022, 12, 856 10 of 16
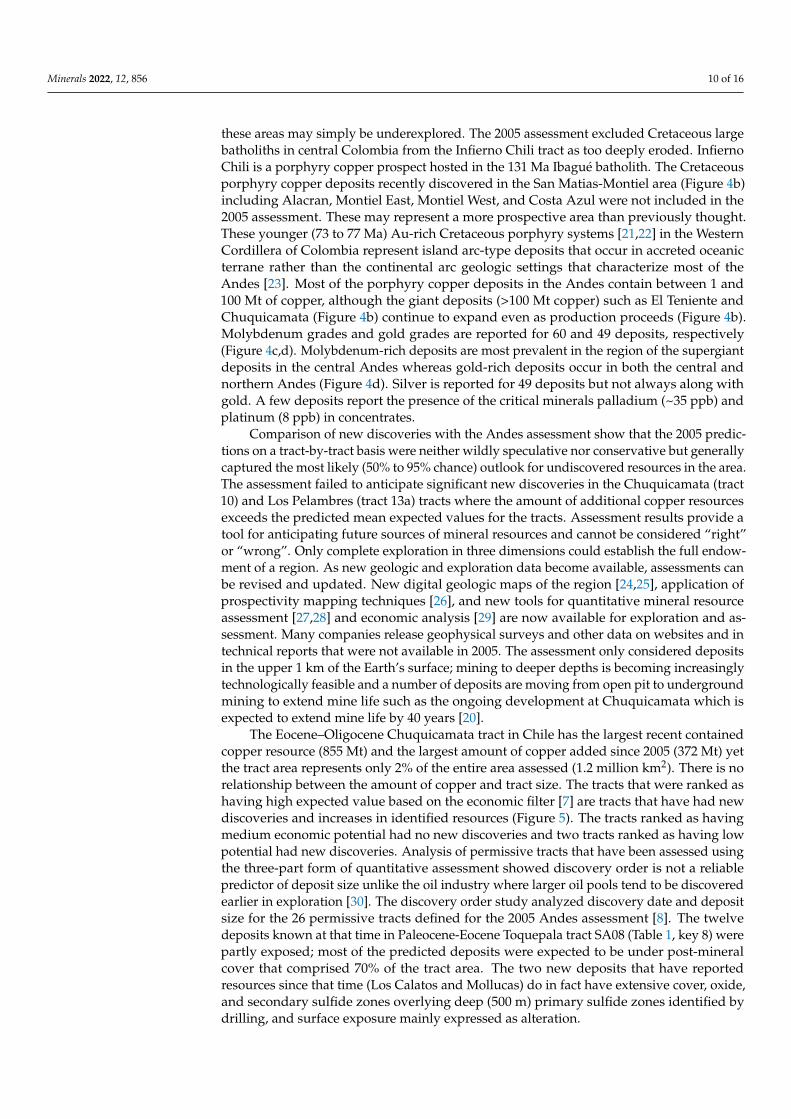
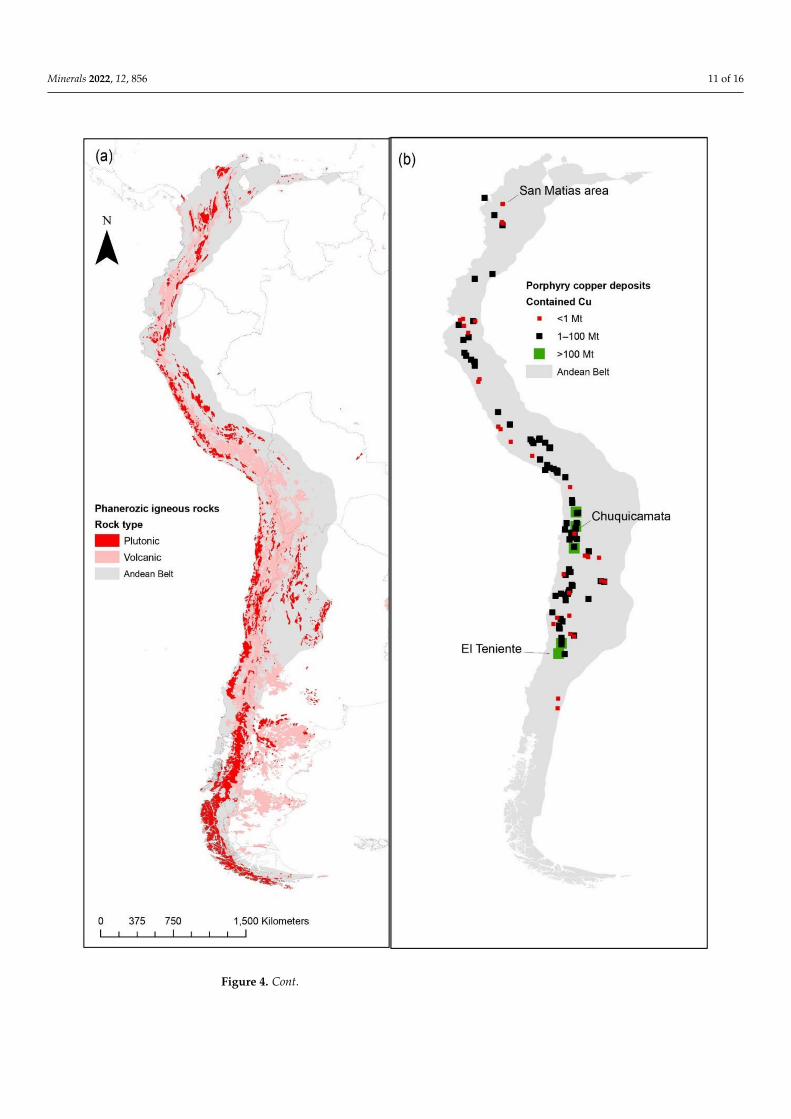
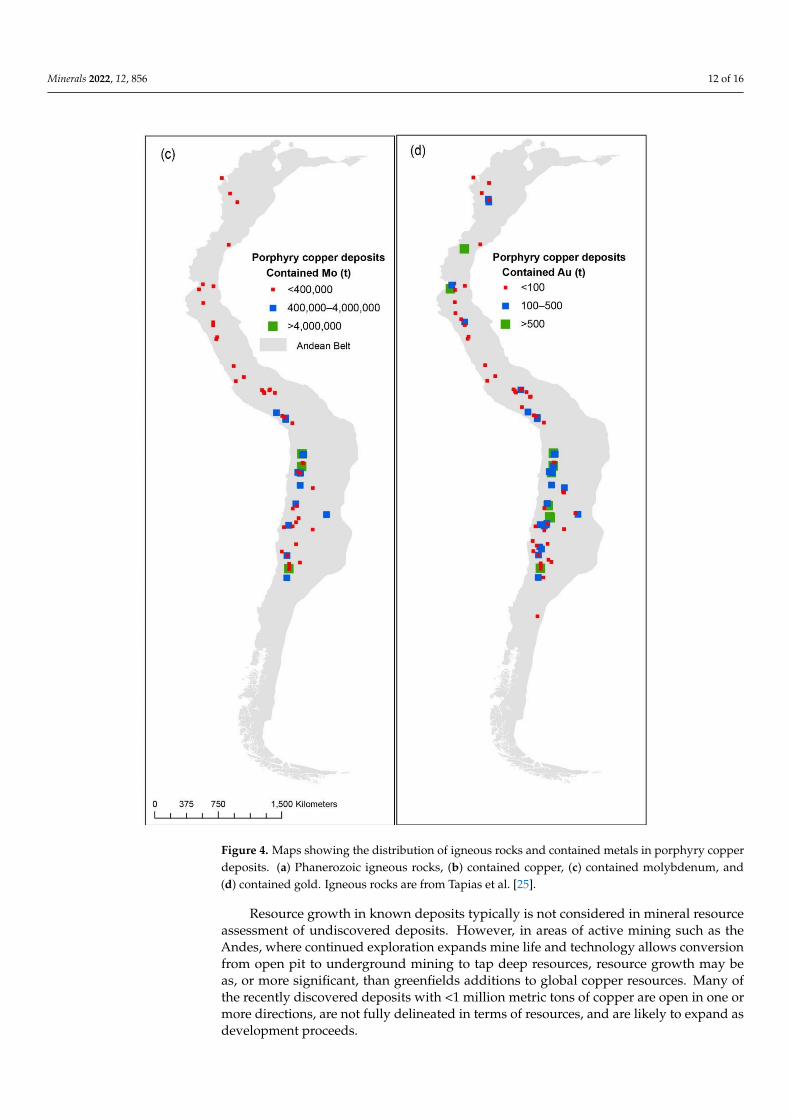
these areas may simply be underexplored. The 2005 assessment excluded Cretaceous largebatholiths in central Colombia from the Infierno Chili tract as too deeply eroded. InfiernoChili is a porphyry copper prospect hosted in the 131 Ma Ibagué batholith. The Cretaceousporphyry copper deposits recently discovered in the San Matias-Montiel area (Figure 4b)including Alacran, Montiel East, Montiel West, and Costa Azul were not included in the2005 assessment. These may represent a more prospective area than previously thought.These younger (73 to 77 Ma) Au-rich Cretaceous porphyry systems [21,22] in the WesternCordillera of Colombia represent island arc-type deposits that occur in accreted oceanicterrane rather than the continental arc geologic settings that characterize most of theAndes [23]. Most of the porphyry copper deposits in the Andes contain between 1 and100 Mt of copper, although the giant deposits (>100 Mt copper) such as El Teniente andChuquicamata (Figure 4b) continue to expand even as production proceeds (Figure 4b).Molybdenum grades and gold grades are reported for 60 and 49 deposits, respectively(Figure 4c,d). Molybdenum-rich deposits are most prevalent in the region of the supergiantdeposits in the central Andes whereas gold-rich deposits occur in both the central andnorthern Andes (Figure 4d). Silver is reported for 49 deposits but not always along withgold. A few deposits report the presence of the critical minerals palladium (~35 ppb) andplatinum (8 ppb) in concentrates.
Comparison of new discoveries with the Andes assessment show that the 2005 predic-tions on a tract-by-tract basis were neither wildly speculative nor conservative but generallycaptured the most likely (50% to 95% chance) outlook for undiscovered resources in the area.The assessment failed to anticipate significant new discoveries in the Chuquicamata (tract10) and Los Pelambres (tract 13a) tracts where the amount of additional copper resourcesexceeds the predicted mean expected values for the tracts. Assessment results provide atool for anticipating future sources of mineral resources and cannot be considered “right”or “wrong”. Only complete exploration in three dimensions could establish the full endow-ment of a region. As new geologic and exploration data become available, assessments canbe revised and updated. New digital geologic maps of the region [24,25], application ofprospectivity mapping techniques [26], and new tools for quantitative mineral resourceassessment [27,28] and economic analysis [29] are now available for exploration and as-sessment. Many companies release geophysical surveys and other data on websites and intechnical reports that were not available in 2005. The assessment only considered depositsin the upper 1 km of the Earth’s surface; mining to deeper depths is becoming increasinglytechnologically feasible and a number of deposits are moving from open pit to undergroundmining to extend mine life such as the ongoing development at Chuquicamata which isexpected to extend mine life by 40 years [20].
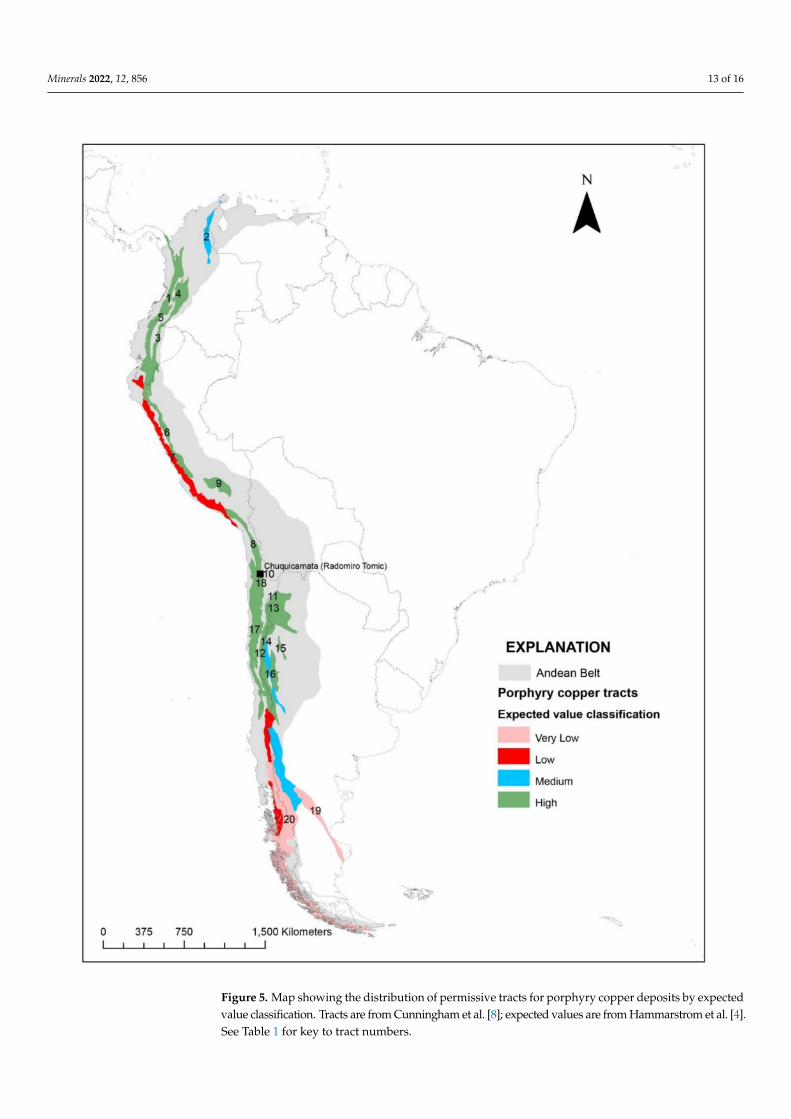
The Eocene–Oligocene Chuquicamata tract in Chile has the largest recent containedcopper resource (855 Mt) and the largest amount of copper added since 2005 (372 Mt) yetthe tract area represents only 2% of the entire area assessed (1.2 million km2). There is norelationship between the amount of copper and tract size. The tracts that were ranked ashaving high expected value based on the economic filter [7] are tracts that have had newdiscoveries and increases in identified resources (Figure 5). The tracts ranked as havingmedium economic potential had no new discoveries and two tracts ranked as having lowpotential had new discoveries. Analysis of permissive tracts that have been assessed usingthe three-part form of quantitative assessment showed discovery order is not a reliablepredictor of deposit size unlike the oil industry where larger oil pools tend to be discoveredearlier in exploration [30]. The discovery order study analyzed discovery date and depositsize for the 26 permissive tracts defined for the 2005 Andes assessment [8]. The twelvedeposits known at that time in Paleocene-Eocene Toquepala tract SA08 (Table 1, key 8) werepartly exposed; most of the predicted deposits were expected to be under post-mineralcover that comprised 70% of the tract area. The two new deposits that have reportedresources since that time (Los Calatos and Mollucas) do in fact have extensive cover, oxide,and secondary sulfide zones overlying deep (500 m) primary sulfide zones identified bydrilling, and surface exposure mainly expressed as alteration.
Minerals 2022, 12, 856 11 of 16
Figure 4. Cont.
Minerals 2022, 12, 856 12 of 16
Figure 4. Maps showing the distribution of igneous rocks and contained metals in porphyry copperdeposits. (a) Phanerozoic igneous rocks, (b) contained copper, (c) contained molybdenum, and(d) contained gold. Igneous rocks are from Tapias et al. [25].
Resource growth in known deposits typically is not considered in mineral resourceassessment of undiscovered deposits. However, in areas of active mining such as theAndes, where continued exploration expands mine life and technology allows conversionfrom open pit to underground mining to tap deep resources, resource growth may beas, or more significant, than greenfields additions to global copper resources. Many ofthe recently discovered deposits with <1 million metric tons of copper are open in one ormore directions, are not fully delineated in terms of resources, and are likely to expand asdevelopment proceeds.
Minerals 2022, 12, 856 13 of 16
Figure 5. Map showing the distribution of permissive tracts for porphyry copper deposits by expectedvalue classification. Tracts are from Cunningham et al. [8]; expected values are from Hammarstrom et al. [4].See Table 1 for key to tract numbers.
Minerals 2022, 12, 856 14 of 16
Exploration is episodic and subject to many political, societal, and economic con-straints. Much of the recent exploration, especially in the northern Andes, is focused ongold in epithermal systems, some of which contain low-grade copper and probably overliedeeper porphyry systems that remain to be drilled out. However, many areas remain incom-pletely explored and even well-explored areas continue to host new discoveries. In additionto ore, the vast amounts of mine tailings in the Andes could contain additional unrecoveredresources including critical minerals such as palladium, platinum, and rhenium that couldbe recovered as part of reclamation efforts if technically and economically viable to doso. Companies rarely report the complete chemistry of ores and concentrates. Ongoingefforts to provide complete geochemical characterization of ore samples and tailings fromdifferent deposit types, including porphyry copper deposits, will help close that data gapand could lead to more efficient and widespread recovery of critical minerals [31–34].
Funding: This research was funded by the Mineral Resources Program of the U.S. Geological Survey.
Supplementary Materials: The following are available online at https://www.mdpi.com/article/10.3390/min12070856/s1, Table S1: Porphyry copper deposits in the Andes—Analysis of resource dataincluding age, location, comments, and references.
Data Availability Statement: The data presented in this study and included in the SupplementaryTable S1 are openly available [18].
Acknowledgments: Floyd Gray, USGS, provided helpful comments in a review of a draft of thismanuscript. E.G. Boyce, USGS, facilitated data compilation by providing a collection of NI43-101reports for South American deposits. Three anonymous reviewers provided useful comments forimproving the manuscript.
Conflicts of Interest: The author declares no conflict of interest.
References1. Singer, D.A.; Menzie, W.D. Quantitative Mineral Resource Assessments—An Integrated Approach; Oxford University Press: New York,
NY, USA, 2010; p. 219.2. Johnson, K.M.; Hammarstrom, J.M.; Zientek, M.L.; Dicken, C.L. Estimate of undiscovered copper resources of the world, 2013.
U.S. Geol. Surv. Fact Sheet 2014, 3004, 2014. [CrossRef]3. Dicken, C.L.; Dunlap Pamela Parks, H.L.; Hammarstrom, J.M.; Zientek, M.L. Spatial Database for A Global Assessment of Undiscovered
Copper Resources; Scientific Investigations Report 2010–5090–Z; U.S. Geological Survey: Reston, VA, USA, 2016; p. 29. [CrossRef]4. Hammarstrom, J.M.; Zientek, M.L.; Parks, H.L.; Dicken, C.L.; The, U.S. Geological Survey Global Copper Mineral Resource Assessment
Team. Assessment of Undiscovered Copper Resources of the World, 2015 (ver.1.1, 24 May 2019); Scientific Investigations Report2018–5160; U.S. Geological Survey: Reston, VA, USA, 2019; 619p. [CrossRef]
5. John, D.A.; Ayuso, R.A.; Barton, M.D.; Blakely, R.J.; Bodnar, R.J.; Dilles, J.H.; Gray Floyd Graybeal, F.T.; Mars, J.C.; McPhee,D.K.; Seal, R.R.; et al. Porphyry Copper Deposit Model, Chap. B of Mineral Deposit Models for Resource Assessment: U.S. GeologicalSurvey Scientific Investigations Report 2010–5070–B; U.S. Geological Survey: Denver, CO, USA, 2010; 169p. Available online:https://pubs.usgs.gov/sir/2010/5070/b (accessed on 15 March 2022).
6. Sikka, D.G.; Nehru, C.E. Review of Precambrian porphyry Cu ± Mo ± Au deposits with special reference to Malanjkhandporphyry copper deposit, Madhya Pradesh, India. J. Geol. Soc. India 1997, 49, 239–288.
7. Roth, E.; Groves, D.E.; Anderson, G.; Daley, L.; Staley, R. Primary mineralization at the Boddington mine, Western Australia: AnArchean porphyry Cu-Au-Mo deposit. In Brazil Gold 91, The Economic Geology, Geochemistry and Genesis of Gold Deposits; Ladeira,E.A., Ed.; A.A. Balkema: Rotterdam, The Netherlands, 1991; pp. 481–488.
8. Cunningham, C.G.; Zappettini, E.O.; Vivallo, S.; Waldo Celada, C.M.; Quispe Jorge Singer, D.A.; Briskey, J.A.; Sutphin, D.M.;Gajardo, M.M.; Diaz, A.; Portigliati, C.; et al. Quantitative Mineral Resource Assessment of Copper, Molybdenum, Gold, and Silver inUndiscovered Porphyry Copper Deposits in the Andes Mountains of South America; U.S. Geological Survey Open-File Report 2008–1253;U.S. Geological Survey: Reston, VA, USA, 2008; 282p. Available online: https://pubs.usgs.gov/of/2008/1253/ (accessed on 15March 2022).
9. Schulz, K.J.; Briskey, J.A. The Global Mineral Resource Assessment Project: U.S. Geological Survey Fact Sheet 53-03,U.S. Geological Survey: Reston, VA, USA 2003, p. 4. Available online: https://pubs.usgs.gov/fs/fs053-03/ (accessed on1 March 2022).
Minerals 2022, 12, 856 15 of 16
10. Robinson, G.R., Jr.; Menzie, W.D. Economic Filters for Evaluating Porphyry Copper Deposit Resource Assessments Using Grade-TonnageDeposit Models, with Examples from the U.S. Geological Survey Global Mineral Resource Assessment (ver. 1.2, March 2014): U.S. GeologicalSurvey Scientific Investigations Report 2010–5090–H, U.S.; Geological Survey: Reston, VA, USA, 2012; p. 21. Available online:https://pubs.usgs.gov/sir/2010/5090/h/ (accessed on 15 March 2022).
11. Singer, D.A. Basic concepts in three-part quantitative assessments of undiscovered mineral resources. Nonrenew. Resour. 1993, 2,69–81. [CrossRef]
12. Root, H.D.; Menzie, D.W.; Scott, A.W. Computer Monte Carlo simulation in quantitative resource estimation. Nonrenew. Resour.1992, 1, 125–138. [CrossRef]
13. Singer, D.A.; Berger, V.I.; Moring, B.C. Porphyry Copper Deposits of the World—Database, Map, and Grade and Tonnage Models:U.S. Geological Survey Open-File Report 2005-1060, U.S.; Geological Survey: Menlo Park, CA, USA, 2005. Available online:https://pubs.usgs.gov/of/2005/1060 (accessed on 15 March 2022).
14. Rubenstein, N.A.; Zappettini, E.O.; Gómez, A.L.R. Porphyry Cu deposits in the Central Andes of Argentina—An overview.J. South Am. Earth Sci. 2021, 12, 103543. [CrossRef]
15. Singer, D.A.; Berger, V.I.; Moring, B.C. Porphyry Copper Deposits of the World—Database, Map, and Grade and Tonnage Models, 2008:U.S. Geological Survey Open-File Report 2008–1155, p. 45 U.S.; Geological Survey: Menlo Park, CA, USA, 2008. Available online:https://pubs.usgs.gov/of/2008/1155/ (accessed on 15 March 2022).
16. Porter GeoConsultancy (PORTERGEO)—Database. Available online: http://portergeo.com.au/database/index.asp (accessed on3 May 2022).
17. Mudd, G.M.; Jowitt, S.M. Growing global copper resources, reserves and production: Discovery is not the only control on supply.Econ. Geol. 2018, 113, 1235–1267. [CrossRef]
18. Hammarstrom, J.M. Porphyry Copper Deposits and Prospects of the Andes Mountains of South America; U.S. Geological Survey datarelease; U.S. Geological Survey: Reston, VA, USA, 2022. [CrossRef]
19. Canadian Institute of Mining, Metallurgy, and Petroleum. CIM Definition Standards for Mineral Resources & Mineral Reserves:CIM Standing Committee on Reserve Definitions, 10. p. 2014. Available online: https://mrmr.cim.org/media/1128/cim-definition-standards_2014.pdf (accessed on 1 March 2022).
20. Soto-Vireut, Y. The Mineral Industry of Chile, in Area Reports—International—Latin America and Canada. U.S. GeologicalSurvey Minerals Yearbook 2017–2018, v. III, 7.1–7.18. 2022. Available online: https://pubs.usgs.gov/myb/vol3/2017-18/myb3-2017-18-chile.pdf (accessed on 18 April 2022).
21. Kuntz, G.; Krawcyzk, A.; Boyko, K.; Muir, W. NI [Canadian National Instrument] 43–101 Technical Report and PreliminaryEconomic Assessment, San Matías Copper-Silver-Gold Project, Colombia, Prepared for Cordoba Minerals Corp. 2019, p. 422.Available online: https://www.cordobaminerals.com/assets/docs/2019-07-29-san-matias-pea.pdf (accessed on 15 September2021).
22. Manco, J.D.; Leal-Mejía, H.; Hart, C.J.R.; Foster, C.; Boyd, G.; Creaser, R. Re-Os, U-Pb Geochronology in Cu-Au Mineralization atthe San Matías Copper-Gold-Silver Project (SMP), Northern Colombia. In Proceedings of the Poster Presentation SEG Conference,Keystone, CO, USA, 22–25 September 2018.
23. Restrepo, J.J.; Toussaint, J.F. Terranes and continental accretion in the Colombian Andes. Episodes 1988, 11, 189–193. [CrossRef]24. Gómez, J.; Montes, N.E. Geological Map of Colombia 2020. Scale Scale 1:1 000 000. Servicio Geológico Colombiano, 2 sheets.
Bogotá. 2020. Available online: https://www2.sgc.gov.co/MGC/Paginas/gmc_1M2020.aspx# (accessed on 15 March 2022).25. Tapias, J.G.; Monter Ramírea, N.E.; Schobbenhaus, C. Geological Map of South America at A Scale of 1.5 M. 2019. Available
online: https://www2.sgc.gov.co/MGC/Paginas/gmsa5M2019.aspx (accessed on 22 April 2022).26. Carranza, E.J.M. From predictive mapping of mineral prospectivity to quantitative estimation of number of undiscovered
prospects. Resour. Geol. 2010, 61, 30–51. [CrossRef]27. Ellefsen, K.J. Probability Calculations for Three-Part Mineral Resource Assessments; U.S. Geological Survey Techniques and Methods;
U.S. Geological Survey: Denver, CO, USA, 2017; p. 14. [CrossRef]28. Ellefsen, K.J. User’s Guide for MapMark4—An R Package for the Probability Calculations in Three-Part Mineral Resource Assessments;
U.S. Geological Survey Techniques and Methods; U.S. Geological Survey: Denver, CO, USA, 2017; p. 23. [CrossRef]29. Shapiro, J.L.; Robinson, G.R., Jr. Resource Assessment Economic Filter (RAEF)—A Graphical User Interface Supporting Implementation
of Simple Engineering Mine Cost Analyses of Quantitative Mineral Resource Assessment Simulations; U.S. Geological Survey Techniquesand Methods; U.S. Geological Survey: Reston, VA, USA, 2019; p. 18. [CrossRef]
30. Singer, D.A.; Zientek, M. Mineral Deposit Discovery Order and Three-Part Quantitative Assessments. Ore Geol. Rev. 2021, 139,104566. Available online: https://www.sciencedirect.com/science/article/pii/S0169136821005928?via%3Dihub (accessed on 20April 2022). [CrossRef]
31. Granitto, M.; Emsbo, P.; Hofstra, A.H.; Orkild-Norton, A.R.; Bennett, M.M.; Azain, J.S.; Koenig, A.E.; Karl, N.A. Global GeochemicalDatabase for Critical Minerals in Archived Mine Samples; U.S. Geological Survey data release; U.S. Geological Survey: Denver, CO,USA, 2020. [CrossRef]
32. Granitto, M.; Schmidt, D.E.; Karl, N.A.; Khoury, R.M. National Geochemical Database on Ore Deposits: Legacy Data; U.S. GeologicalSurvey data release; U.S. Geological Survey: Denver, CO, USA, 2021. [CrossRef]

Minerals 2022, 12, 856 16 of 16
33. Huston, D.L. Critical Commodities in Australia—An Assessment of Extraction Potential from Ores. Record 2017/014. GeoscienceAustralia, Canberra. 2017. Available online: https://ecat.ga.gov.au/geonetwork/srv/eng/catalog.search#/metadata/108007(accessed on 20 April 2022).
34. Seal, R.R., II; Piatak, N.M. Environmental Attributes and Resource Potential of Mill Tailings from Diverse Mineral deposit types.In Proceedings of the International Mine Waste Association Conference, Lappeenranta, Finland, 25–30 June 2017; p. 7.