Poroelastic longitudinal wave equation for soft living tissues
9
J Biorheol (2014) 28:29–37 DOI 10.1007/?????????? ORIGINAL ARTICLE Poroelastic longitudinal wave equation for soft living tissues Piero Chiarelli 1,2, * , Bruna Vinci 1 , Antonio Lanatà 2 , Clara Lagomarsini 2 , Simone Chiarelli 3 1 National Council of Research of Italy, Moruzzi, 1-56100 Pisa-Italy 2 Interdepartmental Research Center “E. Piaggio”, Faculty of Engineering, University of Pisa, via Diotisalvi, 2-56126 Pisa, Italy 3 School of Engineering, University of Milan, via Bramante, 65 I-26013 Crema (CR,) Italy Received: XX XXXXXX 2013 / Accepted: XX XXXXXX 2013 / Published online: XX XXXXXX 2014 © Japanese Society of Biorheology 2014 Abstract Making use of the poroelastic theory for hydrated polymeric matrices, the ultrasound (US) propaga- tion in a gel medium filled by spherical cells is studied. The model describes the connection between the poroelastic structure of living tissues and the propagation behavior of the acoustic waves. The equation of fast compressional wave, its phase velocity and its attenuation as a function of the elasticity, porosity and concentration of the cells into the gel external matrix are investigated. The outcomes of the theory agree with the measurements done on Alginic acid gel scaffolds inseminated by porcine liver cells at various concentrations. The model is promising in the quantitative non-invasive estimation of parameters that could assess the change in the tissue structure, composition and architecture. Keywords ultrasound, non-invasive assessment of bio- logical tissue, poroelastic model of living tissues, high fre- quency poroelastic waves in soft tissues 1. Introduction Biological tissues can be considered homogeneous gels just as a first approximation [1]. Different modes of propagation of elastic waves in such media are primarily determined by their bulk and shear elastic moduli. The bulk properties are determined by the molecular composition of the tissue, while shear properties are determined by the tissue organization [1]. Strictly speaking, a biological tissue is inelastic [2] and it exhibits viscoelastic properties such as hysteresis, stress relaxation, and creep [2]. Moreover, it is anisotropic and the stress- strain relationship is non-linear. When all these factors are coupled each others, it becomes evident that the problem how describing the mechanical properties of a tissue requires a significant degree of simplification. Tissue models which include series and parallel elastic and viscous components have been described [2] assuming the tissue isotropic [3, 4]. If we neglect the shear forces, the tissue can be equivalent to a polymeric solution [5] where the US propagation is usu- ally modeled by means of the wave equation of liquids [6]. Taking into account the chemical interactions within the “polymeric solution” a better fit of the absorbance spectrum of acoustic waves at higher frequencies is obtained [5]. Nevertheless, the role played by the structure and organi- zation of gel matrix is still ignored. The poroelastic theories have well shown that the structural arrangement of the gel network has important consequences on the of acoustic wave propagation [7-13]. The overall picture that comes out is that both the chemical and the rheological aspects are very important for the propagation of elastic waves. There- fore, the integration of the liquid-like approach with the poroelastic one can bring important advances in refining the description of the tissue acoustic behavior. So far, the integration of the two models has been hin- dered by the fact that the poroelastic models are not satisfy- ing the description of US propagation in hydrogels showing important discrepancies with experiments. This can be understood by observing that such poroelastic models are build up in the geological and engineering fields where find their applications to porous rock and others porous solids impregnated by fluids. As far as it concerns hydrogels, recently the authors [14] have shown that they cannot be described as systems owing a porous solid matrix whose interconnected voids are filled by water where the fluid-solid interaction is just a shear vis- cous one. *E-mail: [email protected]
Transcript of Poroelastic longitudinal wave equation for soft living tissues
J Biorheol (2014) 28:29–37DOI 10.1007/??????????
ORIGINAL ARTICLE
Poroelastic longitudinal wave equation for soft living tissues
Piero Chiarelli1,2,*, Bruna Vinci1, Antonio Lanatà2, Clara Lagomarsini2, Simone Chiarelli3
1National Council of Research of Italy, Moruzzi, 1-56100 Pisa-Italy2Interdepartmental Research Center “E. Piaggio”, Faculty of Engineering, University of Pisa, via Diotisalvi, 2-56126 Pisa, Italy3School of Engineering, University of Milan, via Bramante, 65 I-26013 Crema (CR,) Italy
Received: XX XXXXXX 2013 / Accepted: XX XXXXXX 2013 / Published online: XX XXXXXX 2014© Japanese Society of Biorheology 2014
Abstract Making use of the poroelastic theory for hydrated polymeric matrices, the ultrasound (US) propaga-tion in a gel medium filled by spherical cells is studied. The model describes the connection between the poroelastic structure of living tissues and the propagation behavior of the acoustic waves. The equation of fast compressional wave, its phase velocity and its attenuation as a function of the elasticity, porosity and concentration of the cells into the gel external matrix are investigated. The outcomes of the theory agree with the measurements done on Alginic acid gel scaffolds inseminated by porcine liver cells at various concentrations. The model is promising in the quantitative non-invasive estimation of parameters that could assess the change in the tissue structure, composition and architecture.
Keywords ultrasound, non-invasive assessment of bio-logical tissue, poroelastic model of living tissues, high fre-quency poroelastic waves in soft tissues
1. Introduction
Biological tissues can be considered homogeneous gels just as a first approximation [1].
Different modes of propagation of elastic waves in such media are primarily determined by their bulk and shear elastic moduli. The bulk properties are determined by the molecular composition of the tissue, while shear properties are determined by the tissue organization [1]. Strictly speaking, a biological tissue is inelastic [2] and it exhibits viscoelastic properties such as hysteresis, stress relaxation, and creep [2]. Moreover, it is anisotropic and the stress-strain relationship is non-linear.
When all these factors are coupled each others, it becomes evident that the problem how describing the mechanical properties of a tissue requires a significant degree of simplification. Tissue models which include series and parallel elastic and viscous components have been described [2] assuming the tissue isotropic [3, 4].
If we neglect the shear forces, the tissue can be equivalent to a polymeric solution [5] where the US propagation is usu-ally modeled by means of the wave equation of liquids [6]. Taking into account the chemical interactions within the “polymeric solution” a better fit of the absorbance spectrum of acoustic waves at higher frequencies is obtained [5].
Nevertheless, the role played by the structure and organi-zation of gel matrix is still ignored. The poroelastic theories have well shown that the structural arrangement of the gel network has important consequences on the of acoustic wave propagation [7-13]. The overall picture that comes out is that both the chemical and the rheological aspects are very important for the propagation of elastic waves. There-fore, the integration of the liquid-like approach with the poroelastic one can bring important advances in refining the description of the tissue acoustic behavior.
So far, the integration of the two models has been hin-dered by the fact that the poroelastic models are not satisfy-ing the description of US propagation in hydrogels showing important discrepancies with experiments. This can be understood by observing that such poroelastic models are build up in the geological and engineering fields where find their applications to porous rock and others porous solids impregnated by fluids.
As far as it concerns hydrogels, recently the authors [14] have shown that they cannot be described as systems owing a porous solid matrix whose interconnected voids are filled by water where the fluid-solid interaction is just a shear vis-cous one. *E-mail: [email protected]
30 J Biorheol (2014) 28:29–37
The proposed and validated model for US in hydrogels [14] shows that the physico-chemical interaction between the polymer network and the water molecules becomes important in them. The presence of water molecules bounded to the polymer chains leads to relevant modifica-tion of the acoustic waves propagation in hydrogels. One of the most noticeable results of the model is that the fre-quency dependence of the acoustic attenuation in hydrogels can have a fractional exponential behavior, in contrast with the geological models that strictly have a linear frequency dependence.
In the present work the authors develop the poroelastic model for hydrogels with spherical cells dispersed into the matrix. The biological cells are designed as poro-elastic spheres enclosed into a membrane, endowed by internal and superficial elasticity and permeability. In a first simplifying assumption cells are assumed to be isotropically dispersed in the extra-cellular hydrogel. The model is developed in the continuum limit approach for US wavelength much bigger than the cells dimension (typically up to about 10 MHz).
This paper shows that by using US it is possible to moni-tor the permeability of the cells and of the ECM. One of the short term application of this work can be the detection of the liver cirrhosis [15], while the long term ones can be the development of non-invasive US methods [16–19] and the functional modulation of biological functions in tissues and organs.
2. Poro-elastic US wave in soft living tissues
2.1. US wave in highly hydrated gels
The poroelastic wave equations for hydrogels is obtained by introducing the appropriate fluid network interaction that takes into account for the bounded water presence around the polymer chains [14]. Under the assumption that the bounded water volume fraction is very small and that the “polymer-bounded water aggregate” constitutes the solid matrix of the poroelastic mean, it is possible to end with the following motion equations [14]
2 2 2 2 2 211( ) ( ) / ( ) / e e f eRe e t e t
(1.a)
(1.a)
2 2 ( * ) / ( / ) ( ) / e ff e e t Q R e t
(1.b)
(1.b)
( )( * ) / ( * ) / ( * ) e f e e t e t K e
(1.c)
(1.c)
βe = β – ϕ (2)
where eij is the solid strain tensor, eαα is the trace of the liquid strain tensor, e*αα is the trace of the bounded water strain tensor; Q, and R are the poroelastic constants of the medium that can be measured by means of jacketed and unjacketed experiments [20]; β is the water volume fraction of the
hydrogel, ϕ is the volume fraction of bounded water, βe is the effective free water volume fraction, f is the inverse of the hydraulic permeability of the matrix [20], and r11, r12 and r22, are the mass densities parameters defined as: r11+ 2r12 + r22= r, r11+ r 12= (1- βe)rs, r12 + r22= βe rf; where rs and rf represent the solid and the liquid mass densities respectively, while r is the total mass density of the medium. Moreover, K and h are the elastic constant and the friction coefficient describing the polymer-bounded water interaction, respectively.
The above equations are derived with the assumption that [14] the inertial effect of bounded water can be disregarded and that the trace of the strain tensor of the polymer εαα approximates that one of the solid aggregate.
Under this assumptions, considering the fast plane wave eαα ∝ e–αx ei(kx – ωt) equation (1.c) reads
( )( * ) / ( ) / e f e e t F e t
(3)
(3)
where the complex friction coefficient F(ω) of the gel reads
1 1 1( ) ( ) ( )[( ) ( ( / )) ]eF f K
(4)
(4)
leading through (1.a) to the characteristic equation
2 2 311 ( )( ) ( / R)(1 (1 ) / )f e ek i i F
(5)
(5)
that split in the real and imaginary part leads to
2 2 2 2 2 10 11 ( )(1 / ) /(1 (1 ) Im{ })e ec c k F
(6)
(6)
2 10 11 ( )2 / ( / ) (1 ) Re{ })ek c c F
(7)
(7)
where
3/ 20 /( )fc c
(8)
(8)
is the pure elastic longitudinal US wave velocity, cf = (R/rf)½ its velocity in the intermolecular fluid (free water) and
1 2 2 2 2Re{ } [ (1 / ) ( / )] /( ( / ) )e eF f K f K
(9)
(9)
1 2 2Im{ } ( / )] /( ( / ) )F K K .
(10)
(10)
By solving equation (6,7) in a (i.e., the US attenuation coefficient) we obtain
2 2 111 ( )
2 111 ( )
(2 / ) /(1 / ) (1 ) Re{ }/
(1 (1 ) Im{ })e
e e
k k F
F
(11)
(11)
that for (a/k)2 very small (of order of 10–3 in hydrogels) reads
111 ( )
2 111 ( )
(2 / ) (1 ) Re{ }/
(1 (1 ) Im{ })e
e e
k F
F
.
(12)
(12)
J Biorheol (2014) 28:29–37 31
Assuming that the polymer-bounded water viscosity η(w) follows the frequency behavior [14]
h (w) = η0 (wg/w)d (13)
where 0 < d ≤ ½ and where wg = 2p η0/rf , it follows that
limw/wg>>1Re {F –1} @ 1/h(w) (14)
lim w/wg>>1Im {F –1} @ 0 (15)
Thence, equations (6-7) in the high frequency limit read
2 2 2 2 20 0(1 / )c c k c
(16)
(16)
and
2 102 / ( / ) ( / ) (1 )g e pfk c c
(17)
(17)
where
spf = 2pr11/rf . (18)
Finally, when the polymer network is not very diluted, but has an appreciable polymer concentration, the series expansion as a function of the fraction of polymer volume (1 - β) can be introduced into equation (8) as follows [14]
2 2 3 20 1 2/[( ) (1 ) (1 ) ]fc c
(19)
(19)
2.2. US wave equation in a hydrogel with dispersed cells
When we describe a tissue as a hydrogel poroelastic mean containing cells, we have to refer to the overall tissue con-stants βt, Rt, rf t, Ft and so on. By introducing (1.b) into (1.a) at lowest order for the tissue we obtain
2 2 2 2t et et
1 3 3et et t 11
( ) ( ) /
(1 ) / fR e e t
F e t
(20)
(20)
where
2 3 2 2t et( / ) / fR e e t
(21)
(21)
represents the zero order elastic wave equation. Moreover, we name the total water volume fraction, the bounded water volume fraction and the free water volume fraction for the cells, for the ECM and for the tissue by adding the suffixes c, g and t, respectively, as in the following
βeg = βg - fg (22)
βec = βc - fc (23)
βet = βt - ft (24)
By defining g as the fractional volume of cells inside the tissue as g = total volume of cells / total volume of tissue, the mean fractional water content of the tissue βt reads
βt = (1- g) βg + g βc = βg{1 – g (1–βc/βg)} (25)
2.3. US speed in natural tissue
In order to investigate the US phase velocity in the hydrogel-cells syncytium we need to determine the poroe-lastic parameters concerning the inertial and elastic terms in the motion equations.
As far as it concerns the compressibility modulus Rt and the mass density of the fluid (free water) rf of the syncytium they are influenced by the chemical (e.g., ionic strength) and mass composition of the cells that, generally speaking, may differ from that ones of the ECM. As a consequence of this, in principle, ct0 = (Rt/rf)½ and the elastic phase velocity c0t are function of cell concentration g.
Assuming that the variation of the ratio Rt/rf is small compared to that one of the external matrix R/rf , the series expansion
ctf = (Rt / rf)½ @ cf2 {1 + A1γ + A2γ2} (26)
can be assumed for the tissue. Moreover, since for a biological tissue at / k << 1, analo-
gously to equations (16,19) we write
2 1/ 20 0(1 ( / ) )t t t tc c k c
(27)
(27)
and hence given that
2 2 3 21 20 /[( ) (1 ) (1 ) ]tf t t ttc c
(28)
(28)
we obtain
2 2 2 3 21 2 1 2
2 21 2
{1 }/[( ) (1 ) (1 ) ]
{1 }t f t t t t
g
c c A A
c A A
(29)
(29)
where cg is given by the identities (16, 19).
2.4. US attenuation in natural tissue
In this section we derive the complex friction coefficient (the inverse of hydraulic conductance of the syncytium) that is responsible for the US attenuation.
We assume in the following the complex hydraulic con-ductance:
i. Fg (w)–1 @ ηg
–1 for the extra-cellular hydrogel
ii. Fc (w)–1 @ ηc
–1 for the internal jelly cell body
iii. Fm (w)–1 for the cells membrane.
32 J Biorheol (2014) 28:29–37
For sinusoidal inputs of frequency w/2p we also assume that
Fm (w)–1 = Km + iw b Em
–1 (30)
where the real part Km is the hydraulic permeability of the cell membrane and the imaginary one is its superficial com-pliance proportional to the inverse of Young’s elastic modu-lus Em. In the case where the cell membrane thickness is much smaller than the cell diameter a, b–1 coincides with the membrane thickness.
For sinusoidal pressure inputs the overall conductance of the tissue[21] reads
Ft–1 = Fg
–1 [2 (1 – g) Fg–1 + (1 + 2g) Fc
–1] / (31) [(2 + g) Fg
–1 + (1 – g) Fcm–1]
Where Fcm–1 is the combined membrane permeability that
reads
Fcm–1 = Fc
–1 a Fm–1 / (Fc
–1 + a Fm–1) (32)
In order to apply the above model to a biological tissue we need to single out the relative magnitude of the hydrau-lic constants. Since the superficial membrane of the cells has a very low hydraulic permeability (it separates the inner cell body from the external hydrogel matrix), we expect that the frequency wm / 2p = Km b–1Em / 2p is not very high.
Therefore, at high frequencies w >> wm, the compliance of the cell membrane prevails on its permeability and it follows that
Fm–1 = Km + iw b Em
–1 @ iw b Em–1, (33)
and that
Fcm–1 = Fc
–1 a i w b Em–1 / (Fc
–1 + a iw b Em–1)
(34) = Fc
–1 / (1 + Fc–1 / a i w b Em
–1)
If we assume Fc to have the typical form of equations (13, 15) as for gels
Fc = ηc = η0c (wgc / w)d, (d < ½) (35)
it follows that
Fcm = ηc (1 + ηc–1 / a i w b Em
–1)
= η0c (wgc / w)d (1 + i (wc / wgcd ) wd–1) (36)
= η0c ((wgc / w)d + i (wc / w))
where
wc = Em / a b η0c
(37)wgc = 2p η0c /rfc ,
and that the hydraulic admittance of the tissue reads
Ft–1 = ηg
–1 [2(1 – g) ηg–1 + (1 + 2g) ηc
–1] / (38) {(2 + g) ηg
–1 + (1 – g) ηc–1
(1 + i (wc /wgcd) wd–1)–1}
Since d < ½, at very high frequencies, w >> (wc / wgcd) (1/(1–d),
the imaginary part of Fcm tends to vanish, so that
Fcm @ ηc (39)
and hence
Ft–1 @ ηg
–1 {[2 (1 – g) ηg
–1 + (1 + 2g) ηc–1] /
(40) [(2 + g) ηg
–1 + (1 – g) ηc–1]}
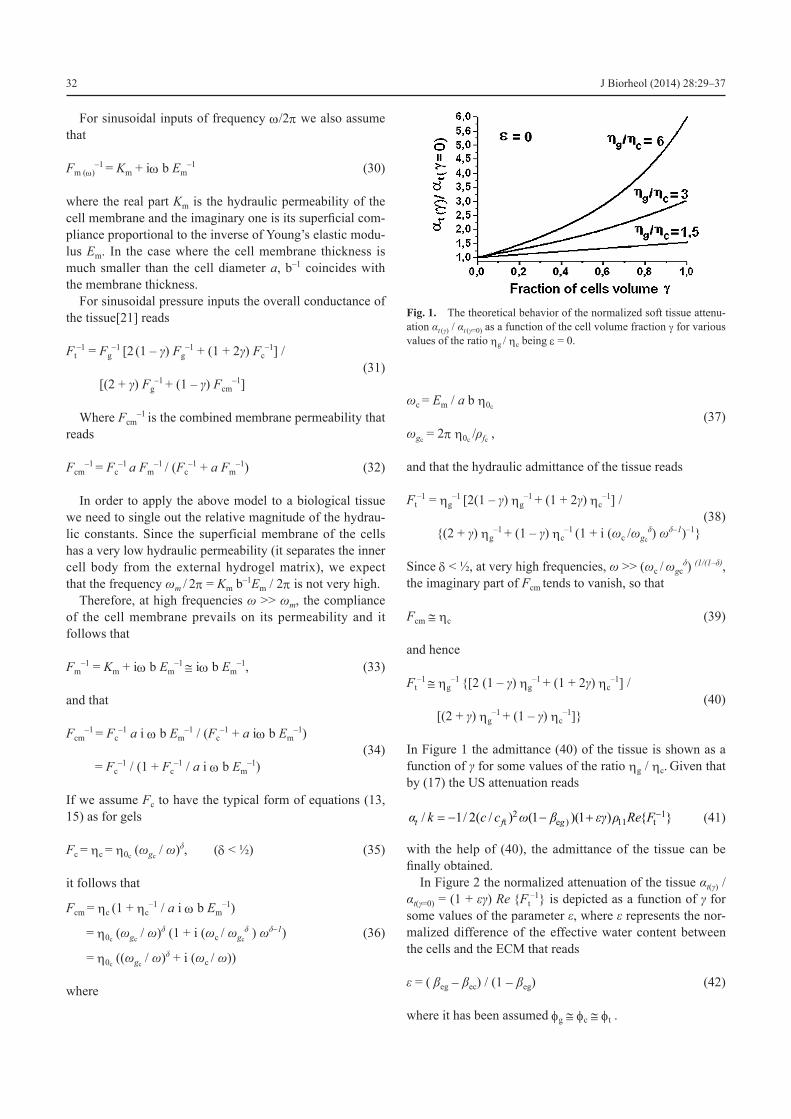
In Figure 1 the admittance (40) of the tissue is shown as a function of g for some values of the ratio ηg / ηc. Given that by (17) the US attenuation reads
2 1t e ) 11 t/ 1/ 2( / ) (1 )(1 ) { }t f gk c c Re F
(41)
(41)
with the help of (40), the admittance of the tissue can be finally obtained.
In Figure 2 the normalized attenuation of the tissue αt(γ) / αt(γ=0) = (1 + εγ) Re {Ft
–1} is depicted as a function of g for some values of the parameter e, where e represents the nor-malized difference of the effective water content between the cells and the ECM that reads
e = ( βeg - βec) / (1 - βeg) (42)
where it has been assumed fg @ fc @ ft .
Fig. 1. The theoretical behavior of the normalized soft tissue attenu-ation αt (γ) / αt (γ=0) as a function of the cell volume fraction g for various values of the ratio ηg / ηc being e = 0.
J Biorheol (2014) 28:29–37 33
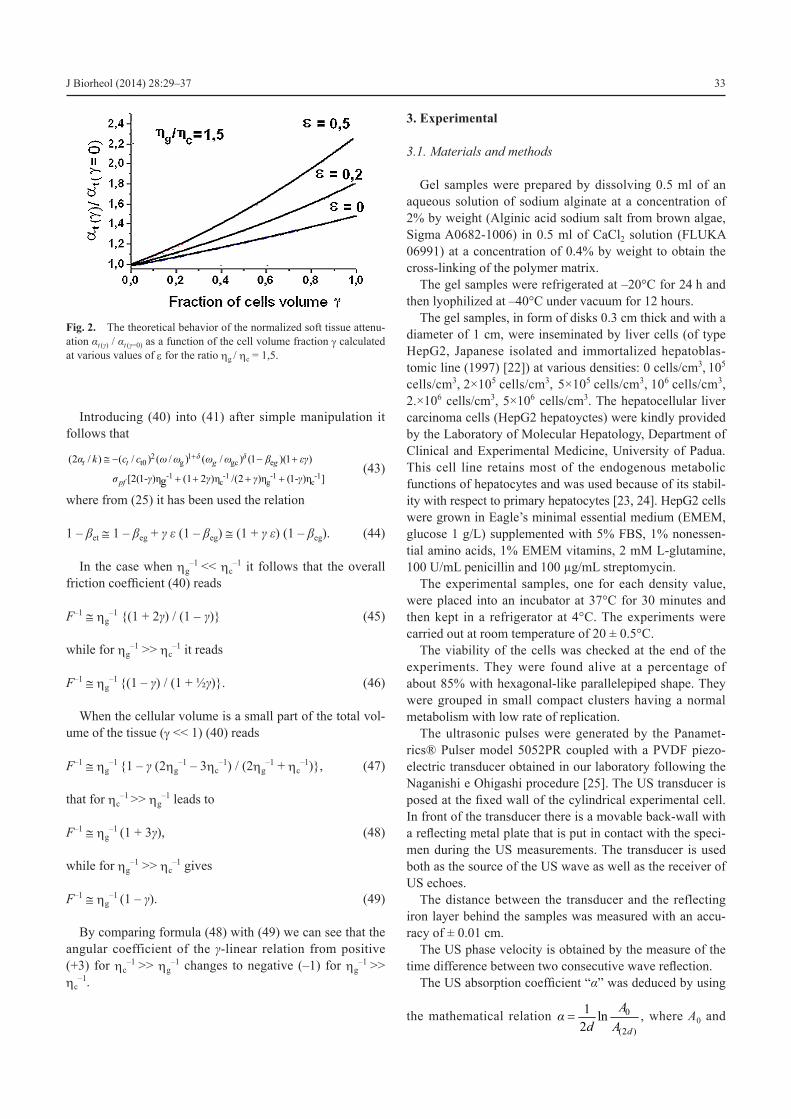
Introducing (40) into (41) after simple manipulation it follows that
2 1t0 g gc e
-1 -1 -1 -1c g c
(2 / ) ( / ) ( / ) ( / ) (1 )(1 )
[2(1- )η (1 2 )η /(2 )η (1- )η ] gt t g g
pf
k c c
γ γ γ γ
(43)
(43)
where from (25) it has been used the relation
1 – βet @ 1 – βeg + g e (1 – βeg) @ (1 + g e) (1 – βeg). (44)
In the case when ηg–1
<< ηc–1 it follows that the overall
friction coefficient (40) reads
F–1 @ ηg–1 {(1 + 2g) / (1 - g)} (45)
while for ηg–1 >> ηc
–1 it reads
F–1 @ ηg–1
{(1 – g) / (1 + ½g)}. (46)
When the cellular volume is a small part of the total vol-ume of the tissue (g << 1) (40) reads
F–1 @ ηg–1
{1 – g (2ηg–1 – 3ηc
–1) / (2ηg–1 + ηc
–1)}, (47)
that for ηc–1
>> ηg–1 leads to
F–1 @ ηg–1
(1 + 3g), (48)
while for ηg–1 >> ηc
–1 gives
F–1 @ ηg–1
(1 – g). (49)
By comparing formula (48) with (49) we can see that the angular coefficient of the g-linear relation from positive (+3) for ηc
–1 >> ηg
–1 changes to negative (–1) for ηg–1
>> ηc
–1.
3. Experimental
3.1. Materials and methods
Gel samples were prepared by dissolving 0.5 ml of an aqueous solution of sodium alginate at a concentration of 2% by weight (Alginic acid sodium salt from brown algae, Sigma A0682-1006) in 0.5 ml of CaCl2 solution (FLUKA 06991) at a concentration of 0.4% by weight to obtain the cross-linking of the polymer matrix.
The gel samples were refrigerated at –20°C for 24 h and then lyophilized at –40°C under vacuum for 12 hours.
The gel samples, in form of disks 0.3 cm thick and with a diameter of 1 cm, were inseminated by liver cells (of type HepG2, Japanese isolated and immortalized hepatoblas-tomic line (1997) [22]) at various densities: 0 cells/cm3, 105
cells/cm3, 2×10⁵ cells/cm3, 5×10⁵ cells/cm3, 106 cells/cm3, 2.×106 cells/cm3, 5×10⁶ cells/cm3. The hepatocellular liver carcinoma cells (HepG2 hepatoyctes) were kindly provided by the Laboratory of Molecular Hepatology, Department of Clinical and Experimental Medicine, University of Padua. This cell line retains most of the endogenous metabolic functions of hepatocytes and was used because of its stabil-ity with respect to primary hepatocytes [23, 24]. HepG2 cells were grown in Eagle’s minimal essential medium (EMEM, glucose 1 g/L) supplemented with 5% FBS, 1% nonessen-tial amino acids, 1% EMEM vitamins, 2 mM L-glutamine, 100 U/mL penicillin and 100 µg/mL streptomycin.
The experimental samples, one for each density value, were placed into an incubator at 37°C for 30 minutes and then kept in a refrigerator at 4°C. The experiments were carried out at room temperature of 20 ± 0.5°C.
The viability of the cells was checked at the end of the experiments. They were found alive at a percentage of about 85% with hexagonal-like parallelepiped shape. They were grouped in small compact clusters having a normal metabolism with low rate of replication.
The ultrasonic pulses were generated by the Panamet-rics® Pulser model 5052PR coupled with a PVDF piezo-electric transducer obtained in our laboratory following the Naganishi e Ohigashi procedure [25]. The US transducer is posed at the fixed wall of the cylindrical experimental cell. In front of the transducer there is a movable back-wall with a reflecting metal plate that is put in contact with the speci-men during the US measurements. The transducer is used both as the source of the US wave as well as the receiver of US echoes.
The distance between the transducer and the reflecting iron layer behind the samples was measured with an accu-racy of ± 0.01 cm.
The US phase velocity is obtained by the measure of the time difference between two consecutive wave reflection.
The US absorption coefficient “a” was deduced by using
the mathematical relation 0
(2 )
1 ln2 d
Ad A
, where A0 and
Fig. 2. The theoretical behavior of the normalized soft tissue attenu-ation αt (γ) / αt (γ=0) as a function of the cell volume fraction g calculated at various values of e for the ratio ηg / ηc = 1,5.
34 J Biorheol (2014) 28:29–37
A(2d) represent both the initial and final wave amplitude, respectively, and where d is the sample thickness.
The frequency of the ultrasonic wave generated by the Panametrics® Pulser model 5052PR used in the experimen-tal tests were of 1 MHz.
By using electronic modules made in our laboratory, the US frequency of the pulser output was increased up to 1.4 MHZ for a second set of measurements.
Echo Signal registration and conditioning data were col-lected with a routine and carried out with the LabView™ software on a computer through a National Instruments® DAQ device.
The water volume fraction of the hydrogel samples β = Vw / (Vw + Vp), where Vw and Vp are the volume of water and polymer respectively, was obtained by means of the respective weight fractions Pw and Pp such as β ≈ Pw / (Pw + Pp) since the water and Alginic acid (AA) specific densities are very close each other.
The fittings of the experimental results were carried out by means of a multiple parameter best fit utilizing the tool “cus-tom equation” of the “curve fitting” section in MATLAB® 7.0. Both the experimental US phase velocity and attenuation measurements where fitted by a parabolic custom equation.
3.2. Measurements of ultrasound velocity and attenuation
Before the US measurements on the HepG2 liver cells AA-scaffolds, the system was tested by measuring the US speed in distilled water at a temperature of 20°C. The results showed a precision of 0.2% with respect to the data in literature.
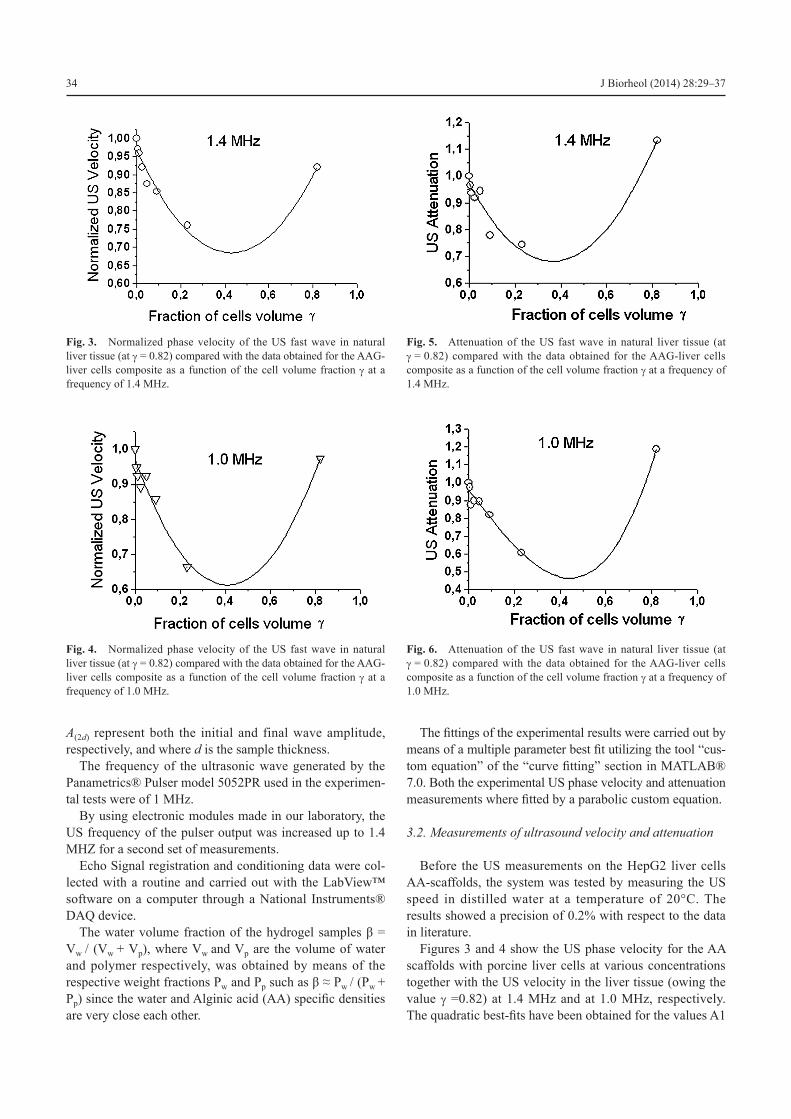
Figures 3 and 4 show the US phase velocity for the AA scaffolds with porcine liver cells at various concentrations together with the US velocity in the liver tissue (owing the value g =0.82) at 1.4 MHz and at 1.0 MHz, respectively. The quadratic best-fits have been obtained for the values A1
Fig. 3. Normalized phase velocity of the US fast wave in natural liver tissue (at g = 0.82) compared with the data obtained for the AAG-liver cells composite as a function of the cell volume fraction g at a frequency of 1.4 MHz.
Fig. 4. Normalized phase velocity of the US fast wave in natural liver tissue (at g = 0.82) compared with the data obtained for the AAG-liver cells composite as a function of the cell volume fraction g at a frequency of 1.0 MHz.
Fig. 5. Attenuation of the US fast wave in natural liver tissue (at g = 0.82) compared with the data obtained for the AAG-liver cells composite as a function of the cell volume fraction g at a frequency of 1.4 MHz.
Fig. 6. Attenuation of the US fast wave in natural liver tissue (at g = 0.82) compared with the data obtained for the AAG-liver cells composite as a function of the cell volume fraction g at a frequency of 1.0 MHz.
J Biorheol (2014) 28:29–37 35
= –1.4, A2 = 1.7 and A1 = –1.8, A2 = 2.3 at 1.4 MHz and at 1.0 MHz, respectively.
The US attenuation obtained for the AA scaffolds insemi-nated by porcine cells together with the attenuation of por-cine liver are shown in Figure 5 and Figure 6. at 1.4 MHz and 1.0 MHz as a function of the cells volume fraction g, respectively. The results show that exists a correlation between the conduct of the US velocity and attenuation. The similarity is due to the speed factor (ct/ct0)2 in the US attenuation formula (41).
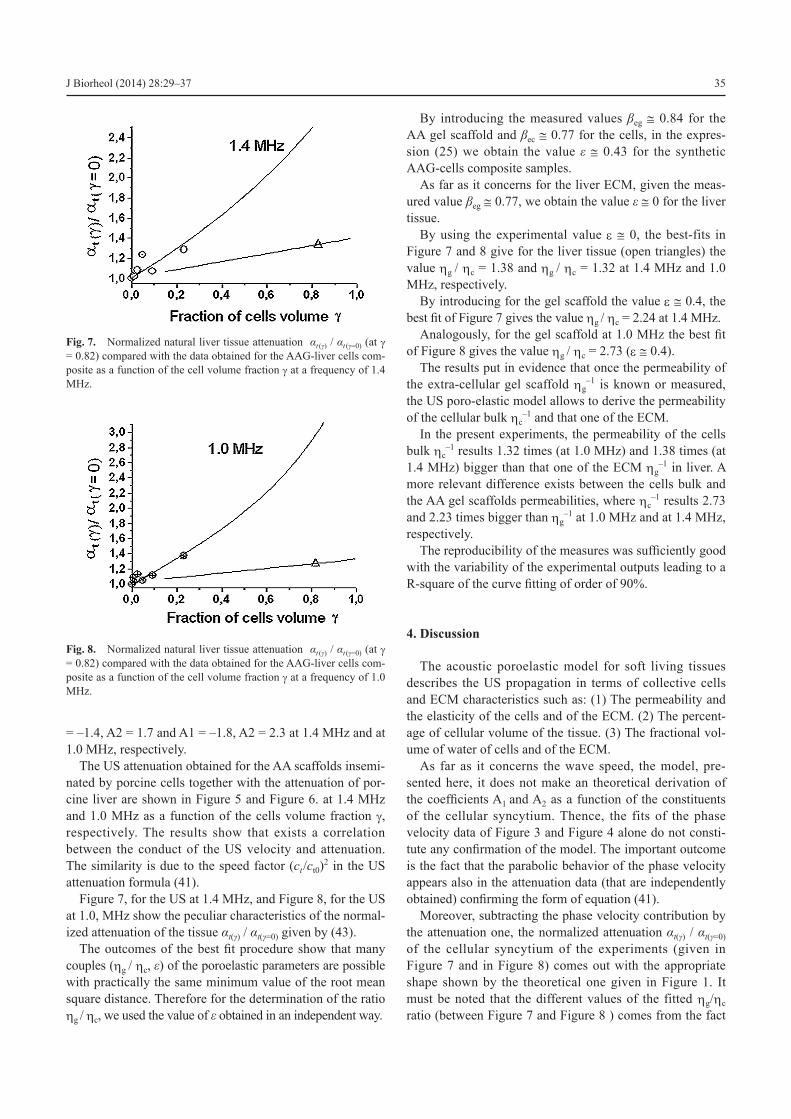
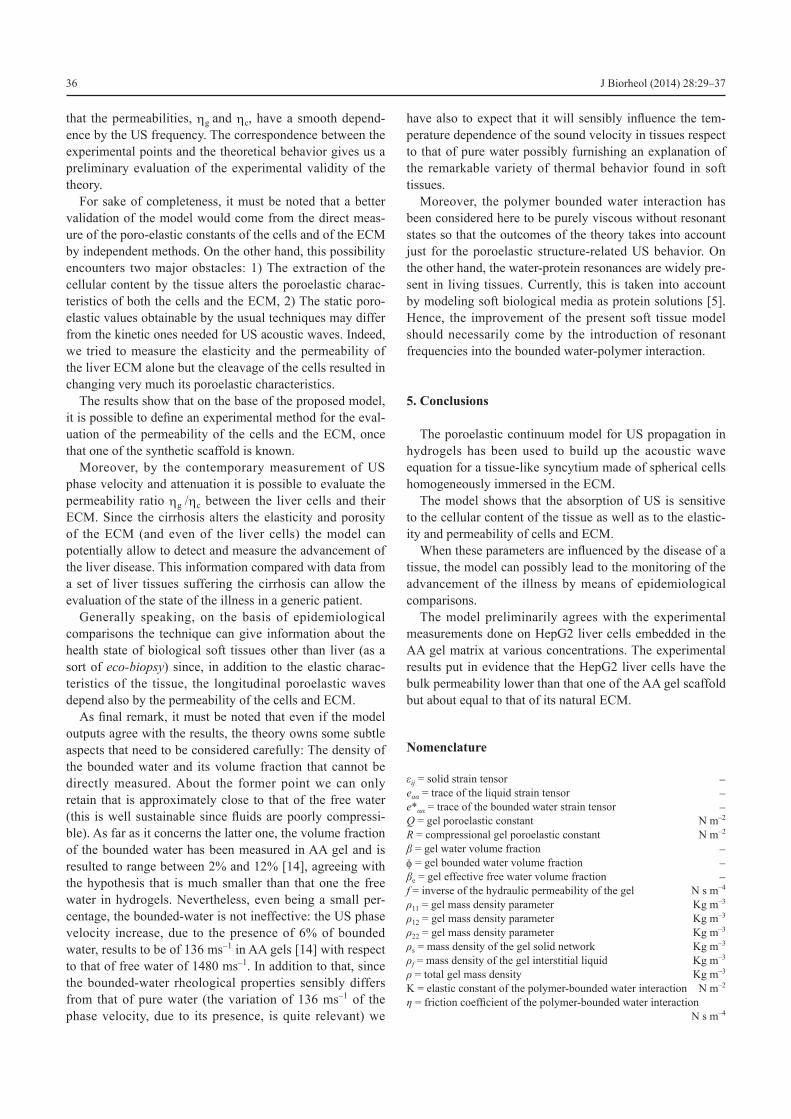
Figure 7, for the US at 1.4 MHz, and Figure 8, for the US at 1.0, MHz show the peculiar characteristics of the normal-ized attenuation of the tissue αt(γ) / αt(γ=0) given by (43).
The outcomes of the best fit procedure show that many couples (ηg / ηc, e) of the poroelastic parameters are possible with practically the same minimum value of the root mean square distance. Therefore for the determination of the ratio ηg / ηc, we used the value of e obtained in an independent way.
By introducing the measured values βeg @ 0.84 for the AA gel scaffold and βec @ 0.77 for the cells, in the expres-sion (25) we obtain the value e @ 0.43 for the synthetic AAG-cells composite samples.
As far as it concerns for the liver ECM, given the meas-ured value βeg @ 0.77, we obtain the value e @ 0 for the liver tissue.
By using the experimental value e @ 0, the best-fits in Figure 7 and 8 give for the liver tissue (open triangles) the value ηg / ηc = 1.38 and ηg / ηc = 1.32 at 1.4 MHz and 1.0 MHz, respectively.
By introducing for the gel scaffold the value e @ 0.4, the best fit of Figure 7 gives the value ηg / ηc = 2.24 at 1.4 MHz.
Analogously, for the gel scaffold at 1.0 MHz the best fit of Figure 8 gives the value ηg / ηc = 2.73 (e @ 0.4).
The results put in evidence that once the permeability of the extra-cellular gel scaffold ηg
–1 is known or measured, the US poro-elastic model allows to derive the permeability of the cellular bulk ηc
–1 and that one of the ECM. In the present experiments, the permeability of the cells
bulk ηc–1 results 1.32 times (at 1.0 MHz) and 1.38 times (at
1.4 MHz) bigger than that one of the ECM ηg–1 in liver. A
more relevant difference exists between the cells bulk and the AA gel scaffolds permeabilities, where ηc
–1 results 2.73 and 2.23 times bigger than ηg
–1 at 1.0 MHz and at 1.4 MHz, respectively.
The reproducibility of the measures was sufficiently good with the variability of the experimental outputs leading to a R-square of the curve fitting of order of 90%.
4. Discussion
The acoustic poroelastic model for soft living tissues describes the US propagation in terms of collective cells and ECM characteristics such as: (1) The permeability and the elasticity of the cells and of the ECM. (2) The percent-age of cellular volume of the tissue. (3) The fractional vol-ume of water of cells and of the ECM.
As far as it concerns the wave speed, the model, pre-sented here, it does not make an theoretical derivation of the coefficients A1 and A2 as a function of the constituents of the cellular syncytium. Thence, the fits of the phase velocity data of Figure 3 and Figure 4 alone do not consti-tute any confirmation of the model. The important outcome is the fact that the parabolic behavior of the phase velocity appears also in the attenuation data (that are independently obtained) confirming the form of equation (41).
Moreover, subtracting the phase velocity contribution by the attenuation one, the normalized attenuation αt(γ) / αt(γ=0) of the cellular syncytium of the experiments (given in Figure 7 and in Figure 8) comes out with the appropriate shape shown by the theoretical one given in Figure 1. It must be noted that the different values of the fitted ηg/ηc ratio (between Figure 7 and Figure 8 ) comes from the fact
Fig. 7. Normalized natural liver tissue attenuation αt (γ) / αt (γ=0) (at g = 0.82) compared with the data obtained for the AAG-liver cells com-posite as a function of the cell volume fraction g at a frequency of 1.4 MHz.
Fig. 8. Normalized natural liver tissue attenuation αt (γ) / αt (γ=0) (at g = 0.82) compared with the data obtained for the AAG-liver cells com-posite as a function of the cell volume fraction g at a frequency of 1.0 MHz.
36 J Biorheol (2014) 28:29–37
that the permeabilities, ηg and ηc, have a smooth depend-ence by the US frequency. The correspondence between the experimental points and the theoretical behavior gives us a preliminary evaluation of the experimental validity of the theory.
For sake of completeness, it must be noted that a better validation of the model would come from the direct meas-ure of the poro-elastic constants of the cells and of the ECM by independent methods. On the other hand, this possibility encounters two major obstacles: 1) The extraction of the cellular content by the tissue alters the poroelastic charac-teristics of both the cells and the ECM, 2) The static poro-elastic values obtainable by the usual techniques may differ from the kinetic ones needed for US acoustic waves. Indeed, we tried to measure the elasticity and the permeability of the liver ECM alone but the cleavage of the cells resulted in changing very much its poroelastic characteristics.
The results show that on the base of the proposed model, it is possible to define an experimental method for the eval-uation of the permeability of the cells and the ECM, once that one of the synthetic scaffold is known.
Moreover, by the contemporary measurement of US phase velocity and attenuation it is possible to evaluate the permeability ratio ηg
/ηc between the liver cells and their ECM. Since the cirrhosis alters the elasticity and porosity of the ECM (and even of the liver cells) the model can potentially allow to detect and measure the advancement of the liver disease. This information compared with data from a set of liver tissues suffering the cirrhosis can allow the evaluation of the state of the illness in a generic patient.
Generally speaking, on the basis of epidemiological comparisons the technique can give information about the health state of biological soft tissues other than liver (as a sort of eco-biopsy) since, in addition to the elastic charac-teristics of the tissue, the longitudinal poroelastic waves depend also by the permeability of the cells and ECM.
As final remark, it must be noted that even if the model outputs agree with the results, the theory owns some subtle aspects that need to be considered carefully: The density of the bounded water and its volume fraction that cannot be directly measured. About the former point we can only retain that is approximately close to that of the free water (this is well sustainable since fluids are poorly compressi-ble). As far as it concerns the latter one, the volume fraction of the bounded water has been measured in AA gel and is resulted to range between 2% and 12% [14], agreeing with the hypothesis that is much smaller than that one the free water in hydrogels. Nevertheless, even being a small per-centage, the bounded-water is not ineffective: the US phase velocity increase, due to the presence of 6% of bounded water, results to be of 136 ms-1 in AA gels [14] with respect to that of free water of 1480 ms-1. In addition to that, since the bounded-water rheological properties sensibly differs from that of pure water (the variation of 136 ms-1 of the phase velocity, due to its presence, is quite relevant) we
have also to expect that it will sensibly influence the tem-perature dependence of the sound velocity in tissues respect to that of pure water possibly furnishing an explanation of the remarkable variety of thermal behavior found in soft tissues.
Moreover, the polymer bounded water interaction has been considered here to be purely viscous without resonant states so that the outcomes of the theory takes into account just for the poroelastic structure-related US behavior. On the other hand, the water-protein resonances are widely pre-sent in living tissues. Currently, this is taken into account by modeling soft biological media as protein solutions [5]. Hence, the improvement of the present soft tissue model should necessarily come by the introduction of resonant frequencies into the bounded water-polymer interaction.
5. Conclusions
The poroelastic continuum model for US propagation in hydrogels has been used to build up the acoustic wave equation for a tissue-like syncytium made of spherical cells homogeneously immersed in the ECM.
The model shows that the absorption of US is sensitive to the cellular content of the tissue as well as to the elastic-ity and permeability of cells and ECM.
When these parameters are influenced by the disease of a tissue, the model can possibly lead to the monitoring of the advancement of the illness by means of epidemiological comparisons.
The model preliminarily agrees with the experimental measurements done on HepG2 liver cells embedded in the AA gel matrix at various concentrations. The experimental results put in evidence that the HepG2 liver cells have the bulk permeability lower than that one of the AA gel scaffold but about equal to that of its natural ECM.
Nomenclature
eij = solid strain tensor -eαα = trace of the liquid strain tensor -e*αα = trace of the bounded water strain tensor -Q = gel poroelastic constant N m–2
R = compressional gel poroelastic constant N m–2
β = gel water volume fraction -f = gel bounded water volume fraction -βe = gel effective free water volume fraction -f = inverse of the hydraulic permeability of the gel N s m–4
r11 = gel mass density parameter Kg m–3
r12 = gel mass density parameter Kg m–3
r22 = gel mass density parameter Kg m–3
rs = mass density of the gel solid network Kg m–3
rf = mass density of the gel interstitial liquid Kg m–3
r = total gel mass density Kg m–3
K = elastic constant of the polymer-bounded water interaction N m–2
h = friction coefficient of the polymer-bounded water interaction N s m–4
J Biorheol (2014) 28:29–37 37
F = complex friction coefficient of the gel N s m–4
c0 = pure elastic longitudinal US wave phase velocity of the gel m s–1
cf = phase velocity of the gel intermolecular fluid (free water) m s–1
ctf = phase velocity of the intermolecular fluid of the tissue m s–1
c0t = pure elastic longitudinal US wave phase velocity of the tissue m s–1
ct = longitudinal US wave phase velocity of the tissue m s–1
a = US attenuation coefficient m–1
η0 = bounded water viscosity constant N s m–4
η0c = bounded water viscosity constant of the cell body N s m–4
Rt = compressional poroelastic constant of tissue N m–2
Ft = complex friction coefficient of the tissue N s m–4
βt = water volume fraction of the tissue -Rg = compressional poroelastic constant of the ECM N m–2
Fg = complex friction coefficient of the ECM N s m–4
βg = water volume fraction of the ECM -Rc = compressional poroelastic constant of the cell body N m–2
Fc = complex friction coefficient of the cell body N s m–4
βc = water volume fraction of the cell body -fg = bounded-water volume fraction of the ECM -fc = bounded-water volume fraction of the cell body -ft = bounded-water volume fraction of the tissue -g = cells volume fraction of the tissue -Fm = complex friction coefficient of the cell membrane N s m–4
Km = hydraulic permeability of the cell membrane N–1s–1 m4
Em = Young’s elastic modulus of the cell membrane N m–2
b–1 = cell membrane thickness ma = cell diameter me = normalized difference of the effective water content between the cells and the ECM -
References
1. Fung YC. Biomechanical properties of living tissues. New York: Springer Vedag; 1981. p. 242-59.
2. Fung YC. Biomechanical properties of living tissues. New York: Springer Vedag; 1981. p. 260-311.
3. Krouskop TA, Dougherty DR, Levinson SF. A pulsed Doppler ultrasonic system for making noninvasive measurements of the mechanical properties of soft tissue. J Rehabil Res Dcv. 1987; 24: 1-8.
4. Parker KJ, Huang SR, Musulin RA, Lerner RM. Tissue response to mechanical vibrations for ‘Sonoelasticity Imaging’. J Ultra-sound Med Biol. 1990; 16: 241-6.
5. Duck FA. Acoustic Properties of tissue at ultrasonic frequencies. London, New York: Academic Press; 1990. p. 75-99, and refer-ences therein; Kremkau FW, Barnes RW, McGraw CP. Ultrasonic attenuation and propagation speed in normal human brain. J Acoust Soc Am. 1981; 70: 29-38.; Wladimiroff JW, Craft IL, Talbert DG. In vitro measurements of sound velocity in human fetal brain tissue. Ultrasound in Med. & Biol. 1975; 1: 377-82.
6. Mather ML, Baldock C. Ultrasound tomography imaging of radia-tion dose distributions in polymer gel dosimeters: Preliminary study. Med Phys. 2003; 30: 2140–8.
7. Biot MA. General theory of three-dimensional consolidation. J Appl Phys. 1941; 12: 155-64.
8. Biot MA. Theory of propagation of elastic waves in a fluid-satu-rated porous solid, II high frequency range. J Acoust Soc Am. 1956; 28-2: 179-91.
9. Biot MA. Theory of propagation of elastic waves in a fluid-satu-rated porous solid, I low-frequency range. J Acoust Soc Am. 1956; 28-2: 168-78.
10. Biot MA. The elastic coefficients of the theory of consolidation. J Appl Mech. 1957; 24: 594-601.
11. Johnson DL. Elastodynamics of gels. Journal of Chemical Phys-ics. 1982; 77: 1531-9.
12. Chandler RN. Transient streaming potential measurements on fluid-saturated porous structures: an experimental verification of Biot’s slow wave in the quasi-static limit. Journal of Acoustical Society of America. 1981; 70: 116.
13. Peters A, Candau SJ. Kinetics of swelling of spherical and cylin-drical gels. Macromolecules. 1988; 21: 2278-82.
14. Chiarelli P, et al. High frequency poroelastic waves in hydrogels. J Acoust Soc Am. 2010; 127, 3: 1197-1207.
15. Ziol M, et al. Noninvasive assessment of liver fibrosis by meas-urement of stiffness in patient with chronic hepatitis C. Hepatol-ogy. 2005; 41, 1: 48-54.
16. Lochhead S, Bradwell D, Chopra R, Bronskill MJ. A gel phantom for the calibration of MR-guided ultrasound thermal therapy. IEEE Ultrasonics Symposium, Montreal, Canada, Vol. 2; 2004. p. 1481-3.
17. Divkovic G, Liebler M, Braun K, Dreyer T, Huber P, Jenne J. Thermal properties and changes of acoustic parameters in an egg white phantom during heating and coagulation by high intensity focused ultrasound. Ultrasound Med Biol. 2007; 33: 981–6.
18. Berry GP, Bamber JC, Armstrong CG, Miller NR, Barbonne PE. Toward an acoustic model-based poroelasticity imaging method: I. Theoretical foundation. Ultrasound Med Biol. 2006; 32: 547–67.
19. Bercoff J, Tanter M, Fink M. Supersonic shear imaging: A new technique for soft tissue elasticity mapping. IEEE Trans Ultrason Ferroelectr Freq Control. 51: 396–409.
20. Berryman JG. Confirmation of Biot’s theory. Appl Phys Lett. 1980; 37: 382–4.
21. Roth, BJ. The electrical conductivity of tissues. The Biomedical Engineering Handbook: Second Edition. Ed. Joseph D. Bronzino. Boca Raton: CRC Press LLC; 2000.
22. Bouma ME, Rogier E, Verthier N, Labarre C, et al. Further cellu-lar investigation of the human hepatoblastomaderived cell line HepG2: Morphology and immunocytochemical studies of hepatic-secreted proteins. In vitro Cell Dev Biol. 1989; 25: 267-75.
23. Wilkening S, Stahl F, Bader A. Comparison of primary human hepatocytes and heptoma cell line Hepg2 with regard to their bio-transformation properties. Drug Metab Dispos. 2003; 31: 1035–42.
24. Kelly JH, Darlington GJ. Modulation of the liver specific pheno-type in the human hepat blastoma line HepG2. In Vitro Celll Dev Biol Feb. 1989; 25(2): 217-22.
25. Naganishi e Ohigashi, Ultrasonic transducers, United States Pat-ent, October 20th, 1981.