
Pores Formation on Cell Membranes by Hederacolchiside A1 Leads to a Rapid Release of Proteins for...
10
Pores Formation on Cell Membranes by Hederacolchiside A1 Leads to a Rapid Release of Proteins for Cytosolic Subproteome Analysis Gabriel D. Mazzucchelli, | Nicolas A. Cellier, †,| Vakhtang Mshviladzade, ‡ Riad Elias, § Yong-Ho Shim, †,# David Touboul, ⊥,O Loïc Quinton, | Alain Brunelle, ⊥ Olivier Laprévote, ⊥ Edwin A. De Pauw, | and Marie-Claire A. De Pauw-Gillet* ,†,| Laboratory of Histology - Cytology (GIGA-CRCE) Institute of Chemistry (B6c), University of Liège, B-4000 Liège 1 (Sart -Tilman), Belgium; Institute of Pharmacochemistry, Academy of Sciences of Georgia, 36, st P. Sarajishvili, 380059 Tbilisi, Georgia, Laboratory of Pharmacognosy, Université de la Méditerranée, 27 Bd. Jean Moulin, F-13385 Marseille cedex 5, France, Laboratory of mass spectrometry (GIGA, CART), University of Liège, B-4000 Liège 1 (Sart -Tilman), Belgium, Mass Spectrometry Laboratory, Institut de Chimie des Substances Naturelles (ICSN-CNRS), Avenue de la Terrasse, 91198, Gif-sur-Yvette, France, and Department of Chemistry and Applied Biosciences, ETH Zürich, CH-8093 Zürich, Switzerland Received October 30, 2007 Hederacolchiside A1 was used to progressively permeabilize the membrane of human melanoma MEL-5 cells. Holes formation was followed by Scanning Electron Microscopy and interaction of the saponin with cholesterol and phospholipids by TOF-SIMS. 2D-LC-MS/MS and 2D-SDS-PAGE show that the release of soluble proteins into serum-free culture media increases with time. This can lead to a new rapid and efficient strategy to analyze the cytosolic subproteome and it opens the door to get information from the cytosolic compartment for clinical proteomic studies. Keywords: Fractionation • saponin • CMC • pores • Mel-5 • 2D gels • 2D-LC-MS/MS • TOF-SIMS, Soluble Biomarkers Introduction A major step in the field of protein biomarkers discovery has been the introduction of the proteomics concepts and tools. In the experimental procedure, the sample preparation and the recovery of proteins are critical steps. Cell disruption is the first step in sample preparation, and many protocols have been described: osmotic lysis, detergent lysis, sonication, high pres- sure, rotating homogenizer, and so forth. 1 The methods can be used individually or in combination (i.e., differential deter- gent fractionation, 2 ProteoExtract Subcellular Proteome Extrac- tion Kit 3 ). However, the analysis of proteins from whole cell or tissue extracts faces the high dynamic range of protein abun- dance. 1 A one-step procedure for compartment specific protein release would be highly desirable with regard to simplicity, rapidity, and reproducibility. Numerous saponins are highly cytotoxic. In vitro, monodes- mosides are cytotoxic, 4,5 while bidesmosides are not or less cytotoxic, depending on the sugar residue present in the chain. 6 Hemolytic activity has been related to the interaction of saponins with the erythrocyte membrane sterols. 7 This interac- tion induces an increase of the membrane permeability and ions movement resulting in the release of hemoglobin. Saponins are known to solubilize cell membranes and are used in proteomics protocols as lysis agents. Armah et al. 8 have proposed a model for the pores formation using avenacin A-1, a triterpenoid monodesmosidic saponin. This model requires the presence of sterol in membrane to induce pores formation. In this study, we used the hederacolchiside A1 (Hcol-A1) capacity to destabilize and permeabilize the cell membranes in order to induce the controlled release of cytosolic proteins in solution. Hcol-A1 was isolated from Hedera colchica K. Koch, an ivy species endemic in Georgia (Figure 1). It was reported to present potential cytotoxic activity against cancer cells, espe- * Corresponding author. Phone, +32 43 66 3403; fax, +32 43 66 4387; e-mail, [email protected]. | Laboratory of mass spectrometry (GIGA, CART), University of Liège. † Laboratory of Histology - Cytology (GIGA-CRCE), University of Liège. ‡ Academy of Sciences of Georgia. § Université de la Méditerranée. # Present address: Laboratory of Polymeric & Composite Materials (LPCM), University of Mons-Hainaut, Place du Parc, 20 B-7000 Mons, Belgium. ⊥ Institut de Chimie des Substances Naturelles (ICSN-CNRS). O ETH Zürich. Figure 1. Structure of Hcol-A1. 10.1021/pr7006973 CCC: $40.75 2008 American Chemical Society Journal of Proteome Research 2008, 7, 1683–1692 1683 Published on Web 03/14/2008
Transcript of Pores Formation on Cell Membranes by Hederacolchiside A1 Leads to a Rapid Release of Proteins for...
Pores Formation on Cell Membranes by Hederacolchiside A1 Leads
to a Rapid Release of Proteins for Cytosolic Subproteome Analysis
Gabriel D. Mazzucchelli,| Nicolas A. Cellier,†,| Vakhtang Mshviladzade,‡ Riad Elias,§
Yong-Ho Shim,†,# David Touboul,⊥,O Loïc Quinton,| Alain Brunelle,⊥ Olivier Laprévote,⊥
Edwin A. De Pauw,| and Marie-Claire A. De Pauw-Gillet*,†,|
Laboratory of Histology - Cytology (GIGA-CRCE) Institute of Chemistry (B6c), University of Liège,B-4000 Liège 1 (Sart -Tilman), Belgium; Institute of Pharmacochemistry, Academy of Sciences of Georgia, 36,
st P. Sarajishvili, 380059 Tbilisi, Georgia, Laboratory of Pharmacognosy, Université de la Méditerranée, 27 Bd.Jean Moulin, F-13385 Marseille cedex 5, France, Laboratory of mass spectrometry (GIGA, CART), University of
Liège, B-4000 Liège 1 (Sart -Tilman), Belgium, Mass Spectrometry Laboratory, Institut de Chimie desSubstances Naturelles (ICSN-CNRS), Avenue de la Terrasse, 91198, Gif-sur-Yvette, France, and Department of
Chemistry and Applied Biosciences, ETH Zürich, CH-8093 Zürich, Switzerland
Received October 30, 2007
Hederacolchiside A1 was used to progressively permeabilize the membrane of human melanoma MEL-5cells. Holes formation was followed by Scanning Electron Microscopy and interaction of the saponinwith cholesterol and phospholipids by TOF-SIMS. 2D-LC-MS/MS and 2D-SDS-PAGE show that therelease of soluble proteins into serum-free culture media increases with time. This can lead to a newrapid and efficient strategy to analyze the cytosolic subproteome and it opens the door to get informationfrom the cytosolic compartment for clinical proteomic studies.
Keywords: Fractionation • saponin • CMC • pores • Mel-5 • 2D gels • 2D-LC-MS/MS • TOF-SIMS, SolubleBiomarkers
Introduction
A major step in the field of protein biomarkers discovery hasbeen the introduction of the proteomics concepts and tools.In the experimental procedure, the sample preparation and therecovery of proteins are critical steps. Cell disruption is the firststep in sample preparation, and many protocols have beendescribed: osmotic lysis, detergent lysis, sonication, high pres-sure, rotating homogenizer, and so forth.1 The methods canbe used individually or in combination (i.e., differential deter-gent fractionation,2 ProteoExtract Subcellular Proteome Extrac-tion Kit3). However, the analysis of proteins from whole cell ortissue extracts faces the high dynamic range of protein abun-dance.1 A one-step procedure for compartment specific proteinrelease would be highly desirable with regard to simplicity,rapidity, and reproducibility.
Numerous saponins are highly cytotoxic. In vitro, monodes-mosides are cytotoxic,4,5 while bidesmosides are not or lesscytotoxic, depending on the sugar residue present in the chain.6
Hemolytic activity has been related to the interaction ofsaponins with the erythrocyte membrane sterols.7 This interac-
tion induces an increase of the membrane permeability andions movement resulting in the release of hemoglobin.
Saponins are known to solubilize cell membranes and areused in proteomics protocols as lysis agents. Armah et al.8 haveproposed a model for the pores formation using avenacin A-1,a triterpenoid monodesmosidic saponin. This model requiresthe presence of sterol in membrane to induce pores formation.In this study, we used the hederacolchiside A1 (Hcol-A1)capacity to destabilize and permeabilize the cell membranesin order to induce the controlled release of cytosolic proteinsin solution.
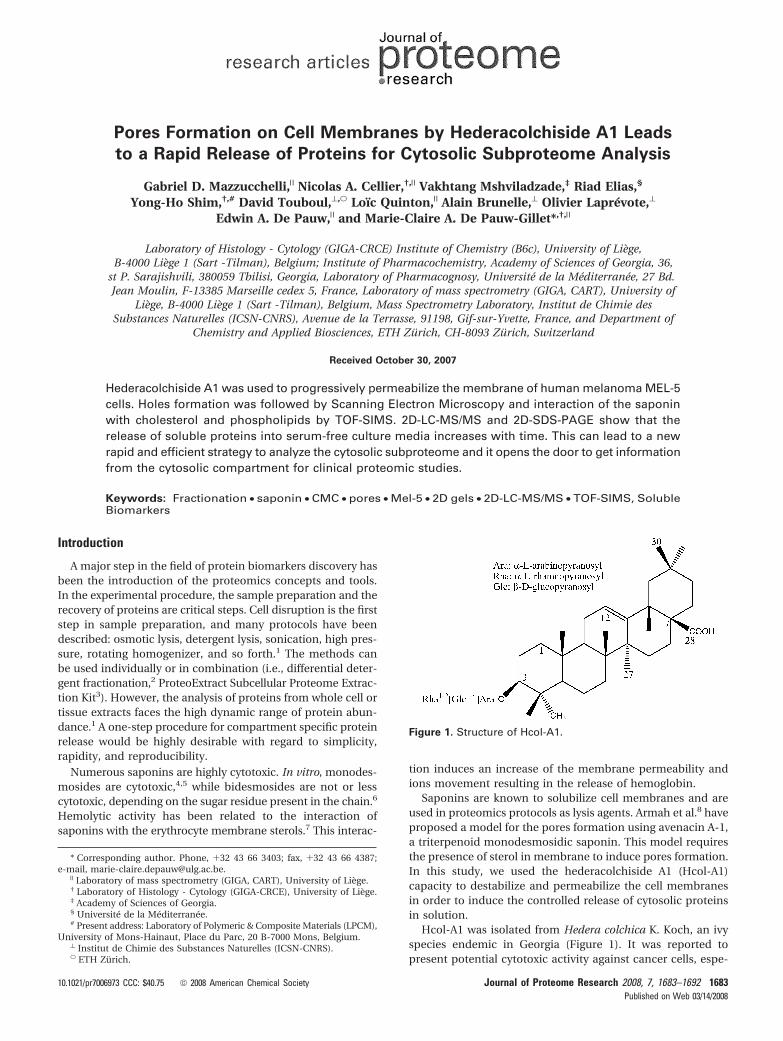
Hcol-A1 was isolated from Hedera colchica K. Koch, an ivyspecies endemic in Georgia (Figure 1). It was reported topresent potential cytotoxic activity against cancer cells, espe-
* Corresponding author. Phone, +32 43 66 3403; fax, +32 43 66 4387;e-mail, [email protected].| Laboratory of mass spectrometry (GIGA, CART), University of Liège.† Laboratory of Histology - Cytology (GIGA-CRCE), University of Liège.‡ Academy of Sciences of Georgia.§ Université de la Méditerranée.# Present address: Laboratory of Polymeric & Composite Materials (LPCM),
University of Mons-Hainaut, Place du Parc, 20 B-7000 Mons, Belgium.⊥ Institut de Chimie des Substances Naturelles (ICSN-CNRS).O ETH Zürich.
Figure 1. Structure of Hcol-A1.
10.1021/pr7006973 CCC: $40.75 2008 American Chemical Society Journal of Proteome Research 2008, 7, 1683–1692 1683Published on Web 03/14/2008
cially on malignant melanoma,9,10 as well as strong antifungaland antileishmanial activities.11,12 Moreover, it has been shownthat saponins extracts from H. colchica are also potent inhibi-tors of acute and chronic inflammation.13 These biologicalproperties are due to the saponins’ ability to interact with cellmembrane.
We chose as example of application a culture of melanomacell line (Mel-5) because melanoma is a very aggressive tumor,important to detect in its early stage. Interestingly, previousworks in our laboratory showed high cytotoxicity of Hcol-A1for this cell line related to a permeabilization effect leading tocytolysis.14 No reliable markers are 100% sensitive and 100%specific for melanoma. The discovery of new specific andsensitive markers is important.
Morphological analyses, molecular imaging by Time ofFlight-Secondary Ion Mass Spectrometry (TOF-SIMS), and therelease of cytoplasmic Lactate Dehydrogenase (LDH) are usedfor the evaluation of chemically induced cell membranepermeability. Potential biomarkers have been identified after2, 5, and 30 min by 2D-LC- MS/MS and 2D gels. This methodof fast and controlled release of cytosolic proteins can lead toa new rapid strategy to identify soluble biomarkers.
Experimental Section
Plant Material. Hcol-A1 was isolated from the leaves of ivyaccording to the procedures previously described in detail.9,15,16
Drug solution was carried out by dissolving Hcol-A1 in DMSO.A 1.5 mM sterile stock solution was realized, and freshlyprepared solutions were then diluted in DMEM-F12 mediumat various concentrations and immediately used. In all experi-ments, the final concentration of DMSO in the culture mediumwas always lower than 0.5%.
Fluorescence Spectroscopy. To determine the critical micelleconcentration (CMC) value of Hcol-A1, the measurements offluorescence spectra of pyrene in micelle was used.17 A stocksolution of pyrene (Aldrich) in acetone was prepared at aconcentration of 6.0 × 10⁻⁶ M. For the measurement of steady-state fluorescence spectra, a volume of 10 µL of the pyrenesolution was placed in an Eppendorf tube, then heated in awater bath at 50 °C to allow a complete evaporation of acetone.Hcol-A1 serial solutions (0.05–1000 g/mL with 0.5% DMSO inphosphate buffered saline solution) prepared separately wereadded directly to acetone-free pyrene Eppendorf tubes. Thefinal concentration of pyrene in each solution was 6.0 × 10⁻⁷
M (its solubility limit in water at 22 °C). Samples were thenallowed to equilibrate in the dark to room temperatureovernight (16 h). The fluorescence intensity of solubilizedpyrene was recorded from 360 to 500 nm at an excitationwavelength of 339 nm with water circulating at 24 °C throughthe sample cell holder. The emission at 375 nm was monitoredusing a Perkin-Elmer Luminescence LS50B Spectrometer. Fromthe plot of the fluorescence intensity at 375 nm of pyrene versusthe logarithm of the concentration of Hcol-A1, the CMC wasestimated by the usual procedure of linear extrapolation of databelow and above the CMC. The intersection of these twoextrapolated lines was taken as the CMC.
Cell Culture. Human melanoma MEL-5 cells18 (non pig-mented clone 32, gift of Dr. G. Degiovanni, University of Liège)were derived from an axillary lymph node from a patient whodeveloped a primary melanoma lesion on his arm. Several yearsafter the tumor excision, metastasis appeared in lymph nodes;these neoplasic cells were removed, and tumor mutated celllines were established in vitro.
Cells were cultured in Dulbecco’s Modified Eagle Medium(DMEM, Gibco) supplemented with 5% fetal bovine serum(FBS,Gibco),heat-inactivated(1hat57°C),andpenicillin-strepto-mycin (100 U/mL-100 µg/mL). Cells detachment was realizedwith Ca2+ free PBS-EDTA 0.2%. DMEM-F12 (Gibco) serum-freemedium was used for experiments with Hcol-A1, and allexperiments were carried out on living cells in a CO2 incubatorat 37 °C.
LDH Activity (Cytotoxicity Detection Kit, LDH, Roche). Atotal of 10 000 MEL-5 cells were seeded with 200 µL of 5%DMEM-FBS in NUNC 96-well plates. After 48 h, the mediumwas removed and cells were treated with 10 µM Hcol-A1 inDMEM-F12 medium (serum contains natural LDH activity)during 2, 5, 10, 15, 30, and 60 min. After these incubations at37 °C, 100 µL of supernatant was collected. A total of 100 µL ofmixture of diaphorase/NAD+ and iodotetrazolium chloride wasadded in each well. After 30 min at room temperature in thedark, absorbances were read at 492 and 620 nm. Controls ofbackground level (Bc ) LDH activity of the medium withoutcell), of low level (natural release by cell ) Lc), of high level(maximum release by disrupting cells with Triton X-100 ) Hc),and of the substance (in the medium without cell ) Sc) were
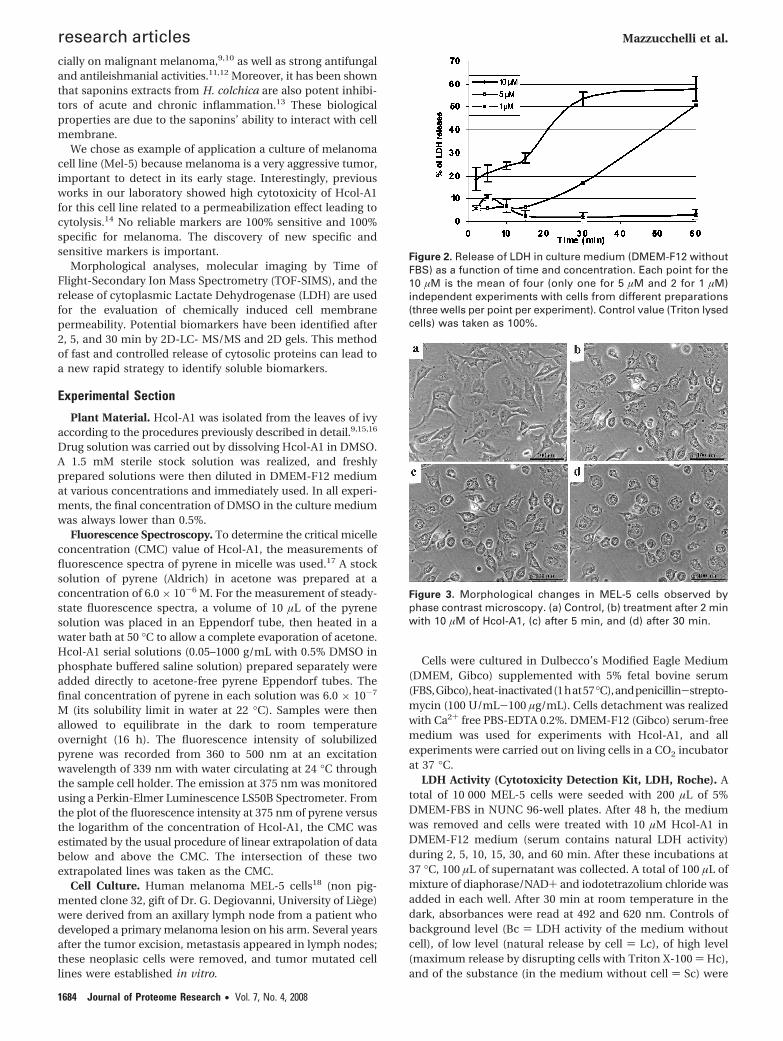
Figure 2. Release of LDH in culture medium (DMEM-F12 withoutFBS) as a function of time and concentration. Each point for the10 µM is the mean of four (only one for 5 µM and 2 for 1 µM)independent experiments with cells from different preparations(three wells per point per experiment). Control value (Triton lysedcells) was taken as 100%.
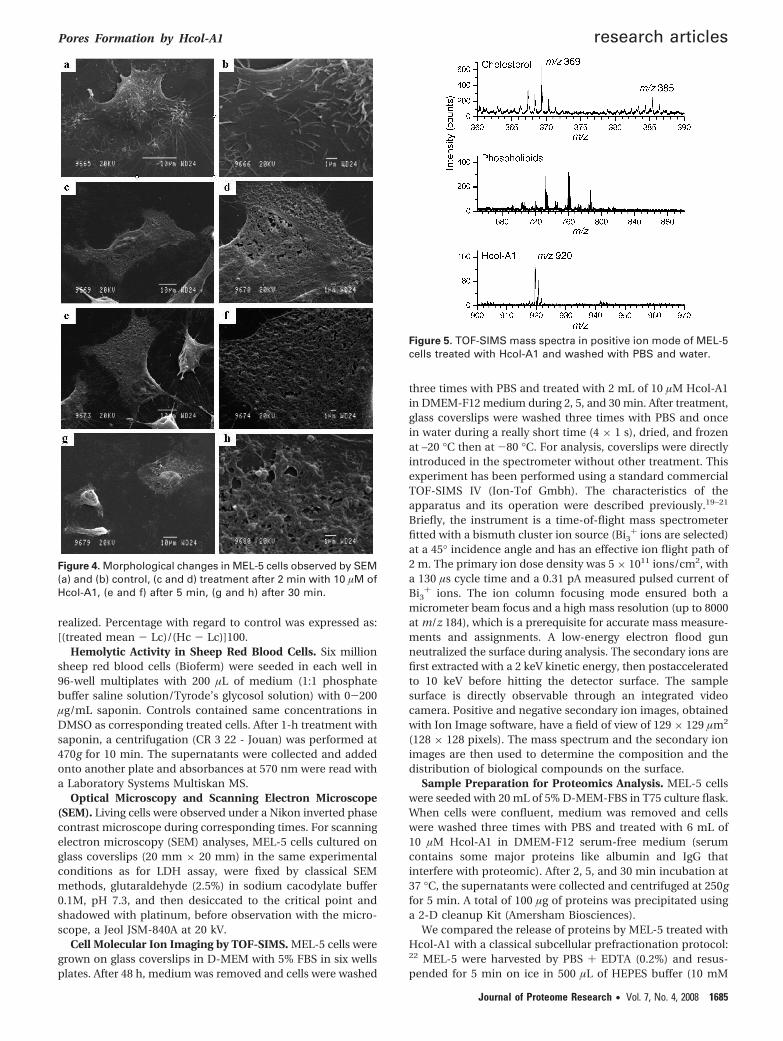
Figure 3. Morphological changes in MEL-5 cells observed byphase contrast microscopy. (a) Control, (b) treatment after 2 minwith 10 µM of Hcol-A1, (c) after 5 min, and (d) after 30 min.
research articles Mazzucchelli et al.
1684 Journal of Proteome Research • Vol. 7, No. 4, 2008
realized. Percentage with regard to control was expressed as:[(treated mean - Lc)/(Hc - Lc)]100.
Hemolytic Activity in Sheep Red Blood Cells. Six millionsheep red blood cells (Bioferm) were seeded in each well in96-well multiplates with 200 µL of medium (1:1 phosphatebuffer saline solution/Tyrode’s glycosol solution) with 0-200µg/mL saponin. Controls contained same concentrations inDMSO as corresponding treated cells. After 1-h treatment withsaponin, a centrifugation (CR 3 22 - Jouan) was performed at470g for 10 min. The supernatants were collected and addedonto another plate and absorbances at 570 nm were read witha Laboratory Systems Multiskan MS.
Optical Microscopy and Scanning Electron Microscope(SEM). Living cells were observed under a Nikon inverted phasecontrast microscope during corresponding times. For scanningelectron microscopy (SEM) analyses, MEL-5 cells cultured onglass coverslips (20 mm × 20 mm) in the same experimentalconditions as for LDH assay, were fixed by classical SEMmethods, glutaraldehyde (2.5%) in sodium cacodylate buffer0.1M, pH 7.3, and then desiccated to the critical point andshadowed with platinum, before observation with the micro-scope, a Jeol JSM-840A at 20 kV.
Cell Molecular Ion Imaging by TOF-SIMS. MEL-5 cells weregrown on glass coverslips in D-MEM with 5% FBS in six wellsplates. After 48 h, medium was removed and cells were washed
three times with PBS and treated with 2 mL of 10 µM Hcol-A1in DMEM-F12 medium during 2, 5, and 30 min. After treatment,glass coverslips were washed three times with PBS and oncein water during a really short time (4 × 1 s), dried, and frozenat –20 °C then at -80 °C. For analysis, coverslips were directlyintroduced in the spectrometer without other treatment. Thisexperiment has been performed using a standard commercialTOF-SIMS IV (Ion-Tof Gmbh). The characteristics of theapparatus and its operation were described previously.19–21
Briefly, the instrument is a time-of-flight mass spectrometerfitted with a bismuth cluster ion source (Bi3
+ ions are selected)at a 45° incidence angle and has an effective ion flight path of2 m. The primary ion dose density was 5 × 10¹¹ ions/cm2, witha 130 µs cycle time and a 0.31 pA measured pulsed current ofBi3
+ ions. The ion column focusing mode ensured both amicrometer beam focus and a high mass resolution (up to 8000at m/z 184), which is a prerequisite for accurate mass measure-ments and assignments. A low-energy electron flood gunneutralized the surface during analysis. The secondary ions arefirst extracted with a 2 keV kinetic energy, then postacceleratedto 10 keV before hitting the detector surface. The samplesurface is directly observable through an integrated videocamera. Positive and negative secondary ion images, obtainedwith Ion Image software, have a field of view of 129 × 129 µm2
(128 × 128 pixels). The mass spectrum and the secondary ionimages are then used to determine the composition and thedistribution of biological compounds on the surface.
Sample Preparation for Proteomics Analysis. MEL-5 cellswere seeded with 20 mL of 5% D-MEM-FBS in T75 culture flask.When cells were confluent, medium was removed and cellswere washed three times with PBS and treated with 6 mL of10 µM Hcol-A1 in DMEM-F12 serum-free medium (serumcontains some major proteins like albumin and IgG thatinterfere with proteomic). After 2, 5, and 30 min incubation at37 °C, the supernatants were collected and centrifuged at 250gfor 5 min. A total of 100 µg of proteins was precipitated usinga 2-D cleanup Kit (Amersham Biosciences).
We compared the release of proteins by MEL-5 treated withHcol-A1 with a classical subcellular prefractionation protocol:22 MEL-5 were harvested by PBS + EDTA (0.2%) and resus-pended for 5 min on ice in 500 µL of HEPES buffer (10 mM
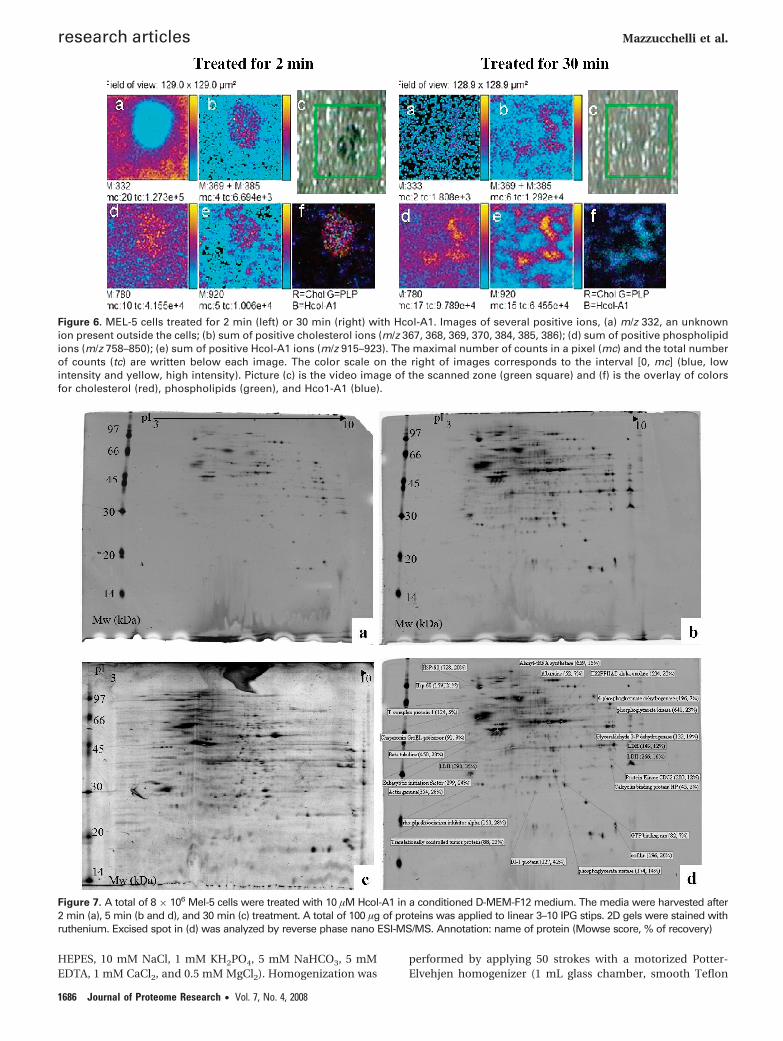
Figure 4. Morphological changes in MEL-5 cells observed by SEM(a) and (b) control, (c and d) treatment after 2 min with 10 µM ofHcol-A1, (e and f) after 5 min, (g and h) after 30 min.
Figure 5. TOF-SIMS mass spectra in positive ion mode of MEL-5cells treated with Hcol-A1 and washed with PBS and water.
Pores Formation by Hcol-A1 research articles
Journal of Proteome Research • Vol. 7, No. 4, 2008 1685
HEPES, 10 mM NaCl, 1 mM KH2PO4, 5 mM NaHCO3, 5 mMEDTA, 1 mM CaCl2, and 0.5 mM MgCl2). Homogenization was
performed by applying 50 strokes with a motorized Potter-Elvehjen homogenizer (1 mL glass chamber, smooth Teflon
Figure 6. MEL-5 cells treated for 2 min (left) or 30 min (right) with Hcol-A1. Images of several positive ions, (a) m/z 332, an unknownion present outside the cells; (b) sum of positive cholesterol ions (m/z 367, 368, 369, 370, 384, 385, 386); (d) sum of positive phospholipidions (m/z 758–850); (e) sum of positive Hcol-A1 ions (m/z 915–923). The maximal number of counts in a pixel (mc) and the total numberof counts (tc) are written below each image. The color scale on the right of images corresponds to the interval [0, mc] (blue, lowintensity and yellow, high intensity). Picture (c) is the video image of the scanned zone (green square) and (f) is the overlay of colorsfor cholesterol (red), phospholipids (green), and Hco1-A1 (blue).
Figure 7. A total of 8 × 10⁶ Mel-5 cells were treated with 10 µM Hcol-A1 in a conditioned D-MEM-F12 medium. The media were harvested after2 min (a), 5 min (b and d), and 30 min (c) treatment. A total of 100 µg of proteins was applied to linear 3–10 IPG stips. 2D gels were stained withruthenium. Excised spot in (d) was analyzed by reverse phase nano ESI-MS/MS. Annotation: name of protein (Mowse score, % of recovery)
research articles Mazzucchelli et al.
1686 Journal of Proteome Research • Vol. 7, No. 4, 2008
pestle, 0.05–0.1 clearance, Thomas Scientific) at 250 rpm.Thereafter, 50 µL of 2.5 M sucrose was added to restore isotonicconditions. Suspension was subjected to differential centrifuga-tion at 4 °C. The first was performed at 6300g for 5 min in atabletop centrifuge. The supernatant was then centrifuged at107 000g for 30 min in a Beckman L7–65 ultracentrifuge. Thesupernatant represented the purified cytosolic fraction and wasused without further treatments.
2D-PAGE Proteomic Analysis. The proteins (100 µg) wereused to rehydrate 18 cm IPG strips (pH 3–10) for 12 h at 20 °Cand constant voltage of 50 V. Isoelectric focusing (IEF) wascarried out at 200 V for 200 Vh, 500 V for 500 Vh, 1000 V for
1000 Vh, and 1000 V until a total of 60 000 Vh at 20 °C and amaximum current setting of 50 µA/strip in an IEF cell isoelectricfocusing unit (Bio-Rad). Following IEF, the IPG strips wereequilibrated for 15 min in 375 mM Tris (pH 8.8) containing 6M urea, 20% (v/v) glycerol, 2% (w/v) SDS, and 130 mM DTTand then for a further 15 min in the same buffer except thatDTT was replaced with 135 mM iodoacetamide. The IPG stripswere then sealed with 0.5% agarose in SDS running buffer atthe top of slab gels (280 × 210 × 1 mm) polymerized from 30%/0.8% (w/v) acrylamide/N,N′-methylenebisacrylamide in 7 Murea, 2 M thiourea, 20 mM DTT, 0.5% ampholyte, pH 3–10,2% CHAPS, and 2% ASB-14. The second-dimensional electro-
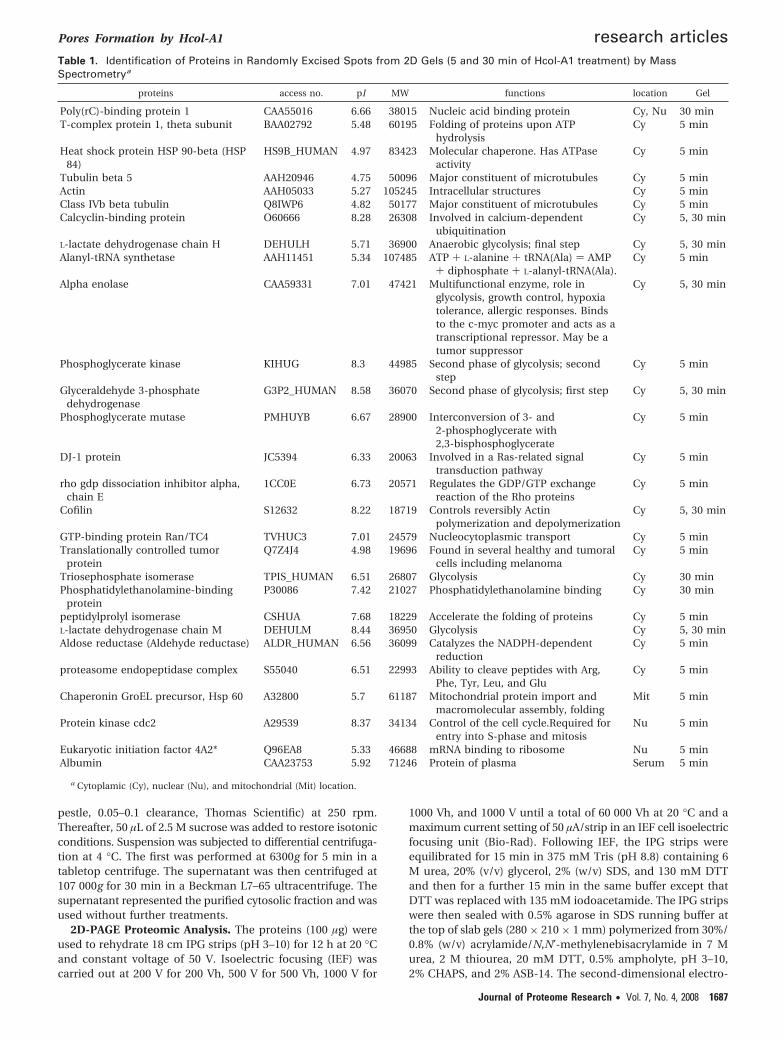
Table 1. Identification of Proteins in Randomly Excised Spots from 2D Gels (5 and 30 min of Hcol-A1 treatment) by MassSpectrometrya
proteins access no. pI MW functions location Gel
Poly(rC)-binding protein 1 CAA55016 6.66 38015 Nucleic acid binding protein Cy, Nu 30 minT-complex protein 1, theta subunit BAA02792 5.48 60195 Folding of proteins upon ATP
hydrolysisCy 5 min
Heat shock protein HSP 90-beta (HSP84)
HS9B_HUMAN 4.97 83423 Molecular chaperone. Has ATPaseactivity
Cy 5 min
Tubulin beta 5 AAH20946 4.75 50096 Major constituent of microtubules Cy 5 minActin AAH05033 5.27 105245 Intracellular structures Cy 5 minClass IVb beta tubulin Q8IWP6 4.82 50177 Major constituent of microtubules Cy 5 minCalcyclin-binding protein O60666 8.28 26308 Involved in calcium-dependent
ubiquitinationCy 5, 30 min
L-lactate dehydrogenase chain H DEHULH 5.71 36900 Anaerobic glycolysis; final step Cy 5, 30 minAlanyl-tRNA synthetase AAH11451 5.34 107485 ATP + L-alanine + tRNA(Ala) ) AMP
+ diphosphate + L-alanyl-tRNA(Ala).Cy 5 min
Alpha enolase CAA59331 7.01 47421 Multifunctional enzyme, role inglycolysis, growth control, hypoxiatolerance, allergic responses. Bindsto the c-myc promoter and acts as atranscriptional repressor. May be atumor suppressor
Cy 5, 30 min
Phosphoglycerate kinase KIHUG 8.3 44985 Second phase of glycolysis; secondstep
Cy 5 min
Glyceraldehyde 3-phosphatedehydrogenase
G3P2_HUMAN 8.58 36070 Second phase of glycolysis; first step Cy 5, 30 min
Phosphoglycerate mutase PMHUYB 6.67 28900 Interconversion of 3- and2-phosphoglycerate with2,3-bisphosphoglycerate
Cy 5 min
DJ-1 protein JC5394 6.33 20063 Involved in a Ras-related signaltransduction pathway
Cy 5 min
rho gdp dissociation inhibitor alpha,chain E
1CC0E 6.73 20571 Regulates the GDP/GTP exchangereaction of the Rho proteins
Cy 5 min
Cofilin S12632 8.22 18719 Controls reversibly Actinpolymerization and depolymerization
Cy 5, 30 min
GTP-binding protein Ran/TC4 TVHUC3 7.01 24579 Nucleocytoplasmic transport Cy 5 minTranslationally controlled tumor
proteinQ7Z4J4 4.98 19696 Found in several healthy and tumoral
cells including melanomaCy 5 min
Triosephosphate isomerase TPIS_HUMAN 6.51 26807 Glycolysis Cy 30 minPhosphatidylethanolamine-binding
proteinP30086 7.42 21027 Phosphatidylethanolamine binding Cy 30 min
peptidylprolyl isomerase CSHUA 7.68 18229 Accelerate the folding of proteins Cy 5 minL-lactate dehydrogenase chain M DEHULM 8.44 36950 Glycolysis Cy 5, 30 minAldose reductase (Aldehyde reductase) ALDR_HUMAN 6.56 36099 Catalyzes the NADPH-dependent
reductionCy 5 min
proteasome endopeptidase complex S55040 6.51 22993 Ability to cleave peptides with Arg,Phe, Tyr, Leu, and Glu
Cy 5 min
Chaperonin GroEL precursor, Hsp 60 A32800 5.7 61187 Mitochondrial protein import andmacromolecular assembly, folding
Mit 5 min
Protein kinase cdc2 A29539 8.37 34134 Control of the cell cycle.Required forentry into S-phase and mitosis
Nu 5 min
Eukaryotic initiation factor 4A2* Q96EA8 5.33 46688 mRNA binding to ribosome Nu 5 minAlbumin CAA23753 5.92 71246 Protein of plasma Serum 5 min
a Cytoplamic (Cy), nuclear (Nu), and mitochondrial (Mit) location.
Pores Formation by Hcol-A1 research articles
Journal of Proteome Research • Vol. 7, No. 4, 2008 1687
phoresis was performed at 20 °C in Ettan Dalt Six tanks(Amersham Biosciences) at 100 W/gel for 3 h. The gel wasstained with a silver-stain-compatible MS protocol23 andscanned with Molecular imager (Bio-Rad) at 200 µm. Proteinspots were manually excised from the gel. Excised gel plugswere first destained with a 30 mM potassium ferricyanide, 100mM sodium thiosulfate solution. Then gel fragments werewashed three times with water, and cysteines were reducedwith a 10 mM DTT solution for 30 min at 56 °C followed byalkylation with 55 mM iodoacetamide at room temperature andin the dark. Digestion was performed overnight with 12.5 ng/µL of modified trypsin (Roche) in 50 mM ammonium carbonatebuffer, pH 8.0. The resulting peptides were extracted with 0.1%formic acid in acetonitrile, dried in a vacuum centrifuge, andresuspended in 30 µL 0.1% formic acid in water. Peptidesseparation by reversed-phase liquid chromatography wasperformed on an Ultimate LC system (LC Packings) completedwith Famos autosampler and Switchos II microcolumn switch-ing device for sample cleanup and preconcentration. Sample(30 µL) was loaded at a flow rate of 200 nL/min on a microprecolumn cartridge (300 µm i.d. × 5 mm, packed with 5 µmC18 100 Å PepMap). After 5 min, the precolumn was connectedwith the separating nanocolumn (75 µm i.d. × 15 cm, packedwith 3 µm C18 100 Å PepMap100) and the gradient started.Elution gradient varied from 0 to 30% buffer B over 30 min;buffer A was 0.1% formic acid in acetonitrile/water 2:98 (v/v),and buffer B was 0.1% formic acid in acetonitrile/water 20:80(v/v). The outlet of the LC system was directly connected tothe nano electrospray source of an Esquire HCT ion trap massspectrometer (Bruker Daltonics, Germany). Mass data acquisi-tion was performed in the mass range of m/z 50-1700 usingthe Standard-Enhanced mode (8100 m/z per s). For each massscan, a data-dependent scheme picked the 4 most intensedoubly or triply charged ions to be selectively isolated andfragmented in the trap and the resulting fragments were massanalyzed using the Ultra Scan mode (m/z 50–3000 at 26 000m/z per s). Raw data were analyzed and formatted (DataAnalysis software, Bruker) for subsequent protein identificationagainst the NCBI nonredundant protein database through MS/MS ions search algorithm on the Mascot search engine. Themass tolerance of precursor and sequence ions were set at 0.5and 0.3 Da, respectively, and carbamidomethylation of cys-teines and oxidation of methionines were set as fixed andvariable modifications, respectively. A protein identified witha Mascot p-value <0.05 was accepted as positive identification.
2D-HPLC Proteomic Analysis. The proteins were digestedin solution following In-Solution Digestion Protocol24 with
some modifications. A total of 100 µg of proteins was dissolvedin 100 µL of 50 mM NH4HCO3. Then, the sample was reducedby adding 5 µL of 200 mM DTT in 100 mM NH4HCO3 andboiled for 10 min. The sample was alkylated for 90 min in thedark by adding 4 µL of 100 mM iodoacetamide in 100 mMNH4HCO3. The remaining iodoacetamide was then neutralizedby adding 20 µL of the 200 mM DTT in 100 mM NH4HCO3 for45 min. Digestion was performed overnight at 37 °C by adding2 µg of modified trypsin (Roche) in the sample (trypsin-sampleratio 1:50). Digestion was stopped by addition of 5 µL of 500mM HCl during 45 min at 37 °C (pH 2). Sample was centrifugedat 16 000g for 15 min and aliquoted (30 µL).
These 30 µL, containing peptides mixture, were injected intothe 2D-HPLC system. This system is the same as for the onedimension but with a first SCX column (LC Packings, µ-Pre-column, Bio-X-SCX (µm, 500 µm i.d., 15 mm)). Ten steps ofsalt concentration (ammonium acetate) were used to elute thepeptides from this column: 20, 30, 40, 60, 80, 100, 200, 300,400, and 800 mM. Eluted peptides were then fixed on a pre-column (µ-precolumn cartridge 300 µm i.d. × 5 mm, packedwith 5 µm C18 100 Å PepMap) and then on the analytical nano-column (75 µm i.d. × 15 cm, packed with C18 PepMap100, 3µm, 100 Å) using the same elution gradient as the onedimensional experiment.
Results
Micelle Formation. The detergent properties of the Hcol-A1 (structure in Figure 1) was estimated by measuring thecritical micelle formation from the plot of the fluorescenceintensity at 375 nm of pyrene versus the logarithm of theconcentration of Hcol-A1. The CMC determined was 30 µg/mL (33 µM).
Lactate Dehydrogenase (LDH) Release. First, we used thistest to monitor the membrane injury. Hcol-A1 permeabilizesthe plasma membrane, and diffusible species can escapeoutside the cell. LDH is a stable cytoplasmic enzyme presentin all cells. The LDH was used like a cytosolic marker who wasreleased in the medium with an increase in the plasmamembrane damage. MEL-5 cells were exposed to variousconcentrations of Hcol-A1 (1, 5, and 10 µM) for 2, 5, 10, 15, 30,and 60 min in the incubator at 37 °C or on ice. Figure 2 showsthat the release of LDH with Hcol-A1 treatment is time- anddose-dependent. In 2 min with 10 µM of Hcol-A1, almost 20%of LDH is released in the medium. With 5 µM, the release isslower, and is nonexistent for 1 µM. However, the maximumpercentage was 58% after 60 min with 10 µM; a considerablequantity of proteins were captive inside the cell. No release ofLDH could be detected on ice. At higher concentrations up tothe CMC concentration, all cells were destroyed instanta-neously. For the speed of the method, we chose the concentra-tion of 10 µM for the next handling.
Phase Contrast Microscopy. We investigated a morphologi-cal alteration with the phase contrast microscopic observations(Figure 3).
Control MEL-5 cells in medium have a size of 30 µm andshow many cytoplasmic expansions and a big nucleus with aquite visible nucleolus. Many cells in mitosis show the prolif-erative capacity of the cell line. Treatment shows significantmorphological changes; within 2 to 30 min with 10 µM of Hcol-A1, cell sizes are reduced, a granulation appears first, followedby a retraction and a vacuolization. These changes occurredrapidly and cells lost their original shape to become round astime passed. After 30 min, many cells started detaching.
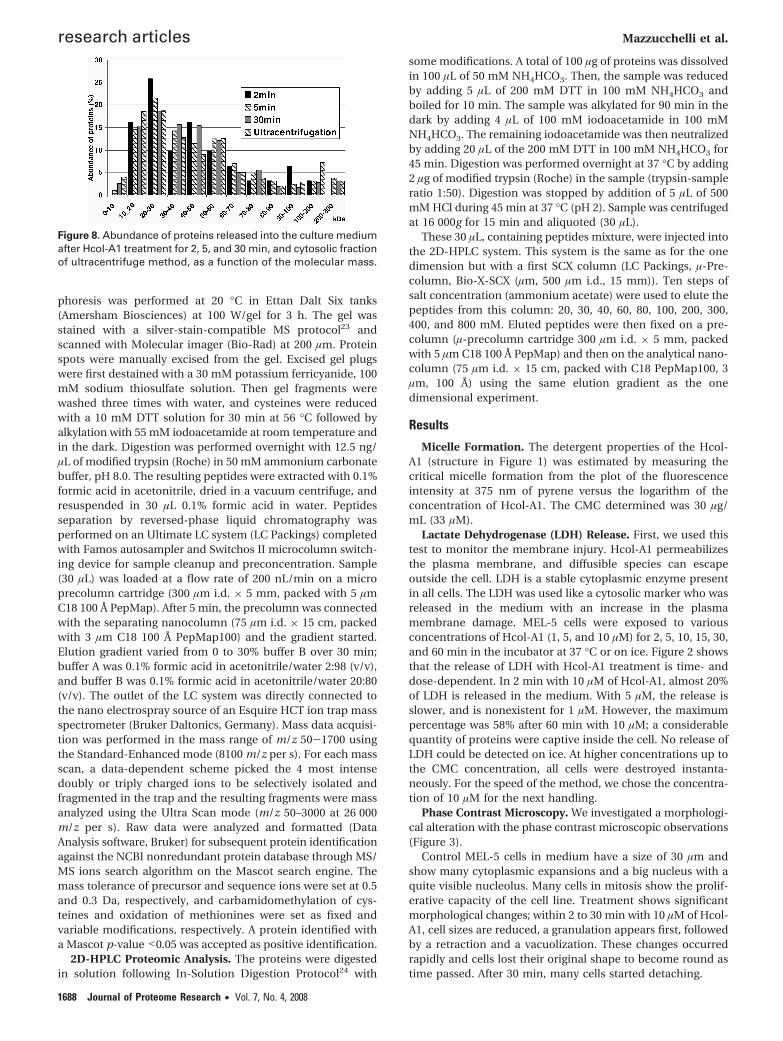
Figure 8. Abundance of proteins released into the culture mediumafter Hcol-A1 treatment for 2, 5, and 30 min, and cytosolic fractionof ultracentrifuge method, as a function of the molecular mass.
research articles Mazzucchelli et al.
1688 Journal of Proteome Research • Vol. 7, No. 4, 2008
Scanning Electron Microscope (SEM). The SEM analysisusing high magnification allowed the study of the cell surface(Figure 4). Control cell shows many pseudopods; some of themallow the adhesion of the cell on the support. With thetreatment, we clearly found an important change of the cellmembrane. The pores formation on cell membrane treatedwith 10 µM of Hcol-A1 is extremely fast; within 2 min, all thecell surface is perforated with numerous irregular holes. Someparts of the membrane seem to be completely torn and we cansee holes larger than a micron. As time passed, cytoplasmicexpansions disappeared, and the cells were retracted and losttheir adhesion.
Membrane damages do not seem to be time-dependent;there is no big differences between the size and the numberof holes of the cells treated for 2 and 30 min. On the otherhand, after 30 min, the cell was emptied of its contents andappears sagging.
Molecular Imaging TOF-SIMS. MEL-5 cells have beendirectly analyzed on the glass coverslips after defrosting. Thespectra corresponding to the mass range of the cholesterol,phospholipids, and Hcol-A1 are shown in Figure 5.
These spectra correspond to the sum of the individualspectra of each pixel and are then the spectra of the wholescanned surface. TOF-SIMS ion images (Figure 6) show thespatial intensity distribution of the ions of interest (Figure 5).One unknown ion at m/z 332 (Figure 6) is present each timeoutside the cells, and serves as a negative control.
Figure 6 shows the molecular images of MEL-5 cells treatedfor 2 min (left) or 30 min (right) with Hcol-A1 and washedbriefly with PBS and water. The image of positive ions at m/z
332 (ions present outside the cells) is a negative picture ofscanning cells. We can see that it corresponds to the greensquare of the figure showing the microscopic view of thescanning zone. After 2 min of treatment (Figure 6, left), we cansee that ions characterizing the cholesterol (Figure 6b) arepresent on the cells and more precisely on the middle cellwhere the signal is particularly intense. Hcol-A1 ions are alsomainly present on the cell (Figure 6e) but not associated withcholesterol ions, they are more present near the phospholipidions (light blue on Figure 6f). However, we find a few Hcol-A1ions on/or near the cholesterol ions (see fuchsia point corre-sponding of the red (cholesterol) and blue (Hcol-A1) mix onFigure 6f. MEL-5 cells treated for 30 min were also scanned(Figure 6, right). After this time of treatment and the PBS/waterwashes, the cells are really destroyed. We scanned (Figure 6,right) for a zone without cell (nothing is visible on Figure 6a,c).Cholesterol (Figure 6b), phospholipids (Figure 6d), and Hcol-A1 ions (Figure 6e) are present and seem to be localized at thesame places. This observation is well-confirmed by the coloroverlay (Figure 6f) where zones of clear gray correspond to themix of the three selected ions.
Gels 2D-PAGE. We present here three gels from proteinsreleased after 2, 5, and 30 min of Hcol-A1 treatment (Figure7). It is interesting to note that the number of visible spotsincreases with the time of treatment. About 220 protein spotswere detected with ImageMaster 2D Platinium 5.0 (Amersham)in the gel of 2 min, 465 in the gel of 5 min, and 680 for the 30min gel. Around 30 spots were randomly excised from 5 and30 min gels, processed by in-gel digestion, and identified byLC-MS/MS. Information on the subcellular localization and
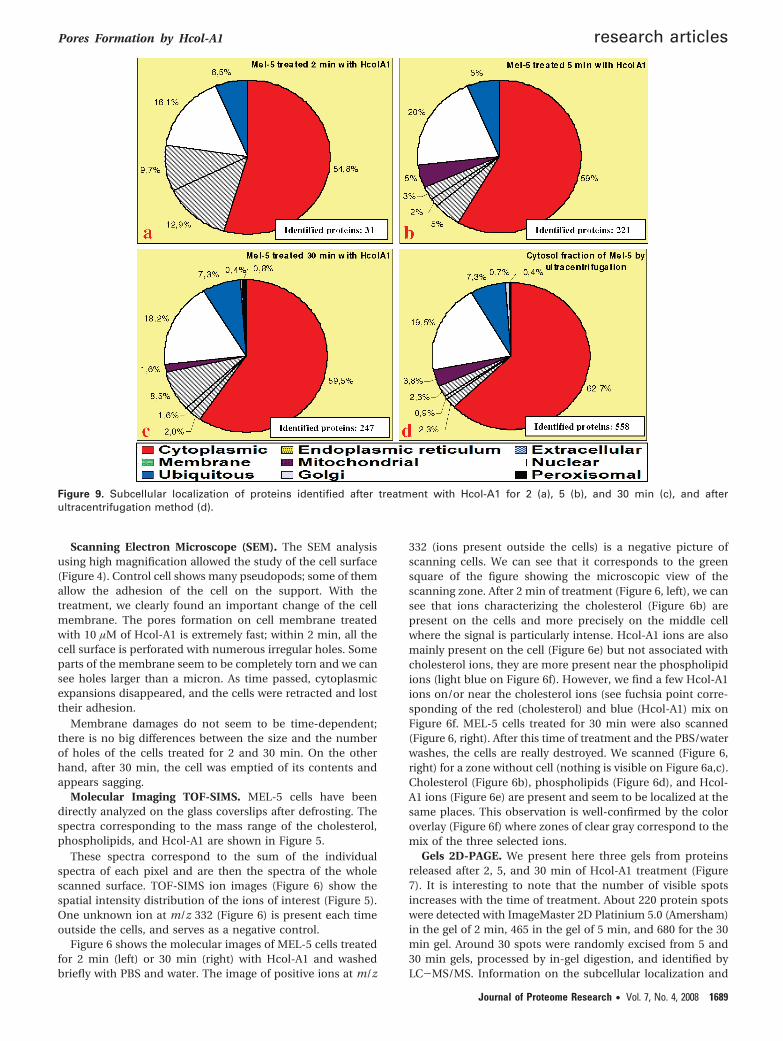
Figure 9. Subcellular localization of proteins identified after treatment with Hcol-A1 for 2 (a), 5 (b), and 30 min (c), and afterultracentrifugation method (d).
Pores Formation by Hcol-A1 research articles
Journal of Proteome Research • Vol. 7, No. 4, 2008 1689
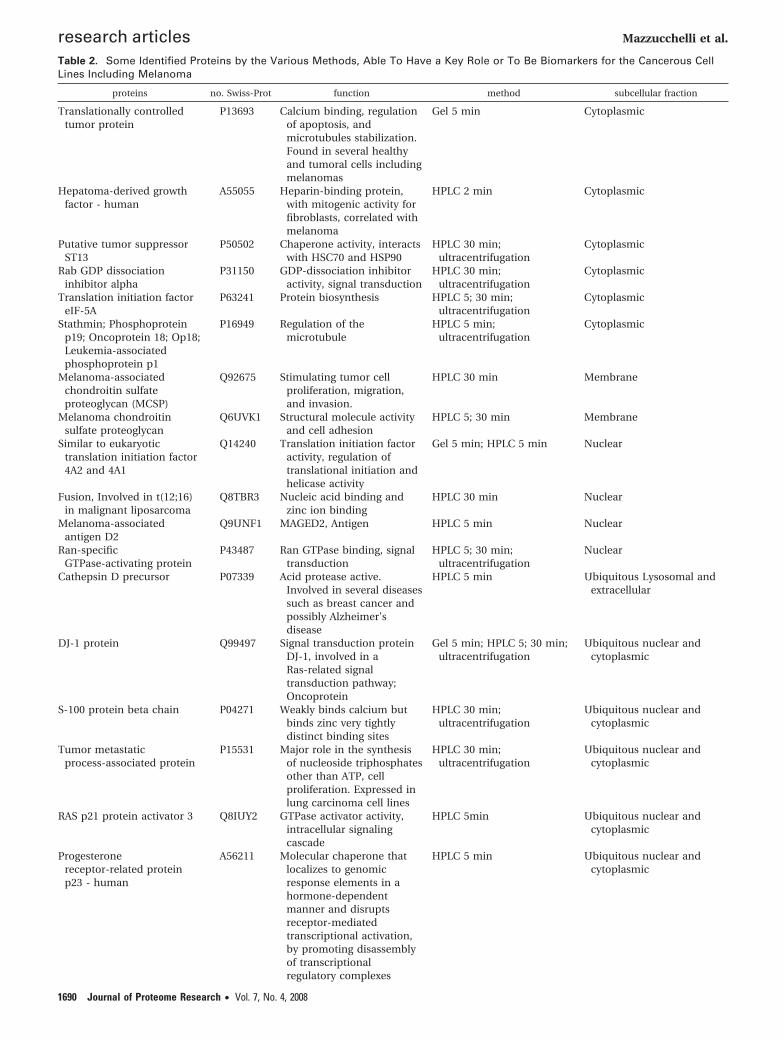
Table 2. Some Identified Proteins by the Various Methods, Able To Have a Key Role or To Be Biomarkers for the Cancerous CellLines Including Melanoma
proteins no. Swiss-Prot function method subcellular fraction
Translationally controlledtumor protein
P13693 Calcium binding, regulationof apoptosis, andmicrotubules stabilization.Found in several healthyand tumoral cells includingmelanomas
Gel 5 min Cytoplasmic
Hepatoma-derived growthfactor - human
A55055 Heparin-binding protein,with mitogenic activity forfibroblasts, correlated withmelanoma
HPLC 2 min Cytoplasmic
Putative tumor suppressorST13
P50502 Chaperone activity, interactswith HSC70 and HSP90
HPLC 30 min;ultracentrifugation
Cytoplasmic
Rab GDP dissociationinhibitor alpha
P31150 GDP-dissociation inhibitoractivity, signal transduction
HPLC 30 min;ultracentrifugation
Cytoplasmic
Translation initiation factoreIF-5A
P63241 Protein biosynthesis HPLC 5; 30 min;ultracentrifugation
Cytoplasmic
Stathmin; Phosphoproteinp19; Oncoprotein 18; Op18;Leukemia-associatedphosphoprotein p1
P16949 Regulation of themicrotubule
HPLC 5 min;ultracentrifugation
Cytoplasmic
Melanoma-associatedchondroitin sulfateproteoglycan (MCSP)
Q92675 Stimulating tumor cellproliferation, migration,and invasion.
HPLC 30 min Membrane
Melanoma chondroitinsulfate proteoglycan
Q6UVK1 Structural molecule activityand cell adhesion
HPLC 5; 30 min Membrane
Similar to eukaryotictranslation initiation factor4A2 and 4A1
Q14240 Translation initiation factoractivity, regulation oftranslational initiation andhelicase activity
Gel 5 min; HPLC 5 min Nuclear
Fusion, Involved in t(12;16)in malignant liposarcoma
Q8TBR3 Nucleic acid binding andzinc ion binding
HPLC 30 min Nuclear
Melanoma-associatedantigen D2
Q9UNF1 MAGED2, Antigen HPLC 5 min Nuclear
Ran-specificGTPase-activating protein
P43487 Ran GTPase binding, signaltransduction
HPLC 5; 30 min;ultracentrifugation
Nuclear
Cathepsin D precursor P07339 Acid protease active.Involved in several diseasessuch as breast cancer andpossibly Alzheimer’sdisease
HPLC 5 min Ubiquitous Lysosomal andextracellular
DJ-1 protein Q99497 Signal transduction proteinDJ-1, involved in aRas-related signaltransduction pathway;Oncoprotein
Gel 5 min; HPLC 5; 30 min;ultracentrifugation
Ubiquitous nuclear andcytoplasmic
S-100 protein beta chain P04271 Weakly binds calcium butbinds zinc very tightlydistinct binding sites
HPLC 30 min;ultracentrifugation
Ubiquitous nuclear andcytoplasmic
Tumor metastaticprocess-associated protein
P15531 Major role in the synthesisof nucleoside triphosphatesother than ATP, cellproliferation. Expressed inlung carcinoma cell lines
HPLC 30 min;ultracentrifugation
Ubiquitous nuclear andcytoplasmic
RAS p21 protein activator 3 Q8IUY2 GTPase activator activity,intracellular signalingcascade
HPLC 5min Ubiquitous nuclear andcytoplasmic
Progesteronereceptor-related proteinp23 - human
A56211 Molecular chaperone thatlocalizes to genomicresponse elements in ahormone-dependentmanner and disruptsreceptor-mediatedtranscriptional activation,by promoting disassemblyof transcriptionalregulatory complexes
HPLC 5 min Ubiquitous nuclear andcytoplasmic
research articles Mazzucchelli et al.
1690 Journal of Proteome Research • Vol. 7, No. 4, 2008
function of identified proteins were subsequently derived fromdata bank entries or previous studies (Table 1). The majorityof identified proteins are cytoplasmic, but we detected alsoproteins from nuclei and mitochondria. As expected, we foundnot only the L-lactate dehydrogenase (chain H and M), but alsoenzymes involved in the glycolysis and in protein biosynthesis,some repair and housekeeping enzymes, and proteins of thecytoskeleton. We also found an oncoprotein, DJ-1 protein, aprotein overexpressed in melanoma cells, and the translation-ally controlled tumor protein (TCTP).
2D-HPLC. This approach is an alternative to 2D-gel elec-trophoresis in proteomic tools. Here, the sample was directlydigested in solution and then analyzed by 2D-LC-MS/MS.Mel-5 cells (8 × 10⁶) are treated with 10 µM Hcol-A1 in aconditioned DMEM-F12 medium. The media are harvestedafter 2, 5, and 30 min of treatment. A classical method22 basedon differential centrifugation to isolate cytosolic proteins iscompared. For each sample, 100 µg of proteins is digested insolution by trypsin and separated by 2D liquid chromatography(cationic and C18 column). Then peptides are analyzed bynanoESI-MS/MS directly coupled with the HPLC system. Here,the separation is realized on peptides and not on entire proteinslike for 2D gel. This approach has the advantage of beingcompletely automated, and allows an identification of a greatnumber of proteins in only one step.
This more direct method has allowed the identification of31 proteins for the treatment of 2 min, 221 for the 5 min, 247for the 30 min, and 558 for the ultracentrifuged cytosolicfraction. For each time of Hcol-A1 treatment, we compared theabundance of proteins released in function of their molecularmass of the proteins (Figure 8).
This graph shows that proteins of small and high mass arereleased at the various times. The proteins are not released intoculture medium in function of their mass. Hcol-A1 inducedreleasing of proteins of more than 100 kDa already after 2 minof treatment, confirming the SEM analysis showing large holes.It is interesting to see that all the conditions follow the samerepartition in Figure 8.
We compared the subcellular location for the identifiedproteins in all the conditions (Figure 9). Proteins were classifiedinto 9 fractions (cytoplasmic, endoplasmic reticulum, extra-cellular, membrane, mitochondrial, nuclear, ubiquitous golgi,and peroxysomal) with the Swiss-Prot/TrEMBL database25 andthe subcellular localization predictor software LOCSVMpsi.26,27
The four graphs (Figure 9) show the percentages of identifiedproteins and their distribution in the subcellular compartments.The number of identified proteins is optimal at 5 min treatmentwith saponin. After 30 min, the increase of the proteinsidentified is very little, but the percentage of membraneproteins is really higher suggesting a larger degree of membranedisintegration. We can also notice a progressive protein enrich-ment from new subcellular compartments after 5 and 30 mincompared with 2 min.
Surprisingly, analogous distribution between compartmentsis observed with the ultracentrifugation method normallyproposed for purification of the cytosolic compartment.22
Among all identified proteins, we have found as expectedthe LDH (for all times), many structural and metabolic proteins(especially glycolysis proteins), biosynthesis proteins (ribosomalproteins, elongation factor proteins), repair and housekeepingenzymes (chaperonin, heat shock, ubiquitin), and some stressproteins (glutathione, superoxide dismutase, oxygen-regulatedprotein).
Some of the identified proteins can call our attention andcould be new potential biomarkers (see Table 2). Some proteinslike elongation factor are present in all cells and are notmelanoma-specific, but a perturbation of the expression canplay a capital role in the cancer transformation and evolution.The concentration above a definite threshold could perhapspredict the disease. Furthermore, an overexpression of eIF-4A1seems to be an important feature of melanoma cells andmight contribute to their malignant transformation.28 Wealready mentioned the TCTP identified in 2D-gel (5 min) andnot seen in 2D-HPLC. Results in the literature mention thatthis protein is overexpressed in chemoresistant melanoma celllines.29 TCTP is not only specific to the melanoma but is alsoexpressed in erythrocytes, hepatocytes, macrophages, platelets,keratinocytes, and in some tumor cell lines.29 This protein wassuggested by Tuynder et al.30 as a new target for chemotherapy.Another protein named hepatoma-derived growth factor (HDGF),released already after 2 min of treatment with saponin, isinteresting and seems to correlate with melanoma.31 Themelanoma-associated chondroitin sulfate proteoglycan (MCSP)plays a role in stabilizing cell-substratum interactions duringearly events of melanoma cell spreading on endothelial base-ment membranes.32 The oncoprotein DJ-1 protein is involvedin Ras-related signal transduction pathway and is known tobe up-regulated in tumor cells. Melanoma-associated antigenD2 (found in HPLC 5min) is a protein encoded by the MAGEgenes, which is expressed in many tumor types but is silent innormal tissues except testis.33
We will not describe all proteins of the Table 2, but we willquote in the Discussion the S100 protein which is used in theimmunohistochemistry test for routine diagnostic of all mela-nomas and melanocytic nevi.34
Discussion
We confirmed here that the hederacolchiside A1 inducedmembrane injury in the MEL-5 cell line, leading to irregularholes formation observed by SEM analyses and LDH releaseused like a cytosolic marker. The mechanism by which saponininteracts with the membrane is not clear and depends on thestructure of the molecule. Some authors have suggested modelsof these interactions, and some interpretations of our TOF-SIMS analyses are in agreement with the models. Indeed, weobserved that the saponin could not bind directly to themembrane cholesterol molecules but could bind preferentiallyto phospholipids during the first minutes. As time passed,saponin seemed to be located more closely to the cholesteroland phospholipids.
The aim of this study was to use the Hcol-A1 capacity toperforate the cell membrane to facilitate the identification ofnew proteinic biomarkers. Robust and simple sample prepara-tion methods including fractionation are urgently needed. Inprevious papers, authors show that it is possible to study thecytosolic content of oligonucleotides in cells with a methodbased on the permeabilization of the plasmic membrane bythe digitonin (other saponins or detergents could be used).35
We used Hcol-A1 because of previous results from our labora-tory showing its high activity on cell membrane, in MEL-5 cellline. Observed membrane injury and cytoplasmic vacuolizationwere similar to those observed previously in other humanmelanoma cells treated with Hcol-A1 in the presence orabsence of serum.10 A protection by the serum was reportedin the presence of Hcol-A1 (log10 between the two IC50).Further studies on pharmacokinetics and bioavailability are
Pores Formation by Hcol-A1 research articles
Journal of Proteome Research • Vol. 7, No. 4, 2008 1691
needed to evaluate in details their activity in vivo. Concerningnormal cells, Hcol-A1 induced cell death in THP1 humanmonocytes by altering the cellular membrane,11 with an IC50
of 0.45 µM. We found that the hemolysis was observed onnormal sheep red blood cells with an IC50 of 14 µM after 1-htreatment with Hcol-A1 (data not shown). Differences in theinteraction of Soybean saponins with normal and cancer cellshave been reported. The lipid content of cancer cell membraneshas been extensively studied and it seems that more saponinsare bound to tumor cells than to normal cells.36
Two separative approaches for the proteomic analyses wereused. On the one hand, the electrophoresis 2D gives a “proteinmap” and a “half quantification” relating to the intensity ofthe spots colored with ruthenium. On the other hand, the 2D-HPLC rather gives qualitative informations on the proteinsidentified. The two approaches allowed the identification of agreat number of proteins at different treatment times with thesaponin. Some of them call our attention by their implicationin cancer, in melanoma, in cell cycle disruption, in stress, andcould be perhaps new potential biomarkers (see Table 2). Abiomarker (S100 protein) used for the immunohistochemistryanalysis and LDH were also identified. We observed that themajority of proteins released by Hcol-A1 treatment and identi-fied were cytoplasmic but not exclusively. Surprisingly, analo-gous repartition between compartments is observed withultracentrifugation generally proposed for isolation of proteinsfrom the cytosolic compartment.18
Conclusion
Our method for proteins release based on the permeabili-zation of the cell membrane by Hcol-A1 is very fast and canlead to an original rapid strategy to identify new biomarkersfrom cell culture. Furthermore, the search for compounds thatcould induce the formation of size-specific pores could helpto increase the selectivity of fractionation.
Acknowledgment. This work was supported by theINTAS program (project no. 97-491), and by the Centred’Analyse de Résidus en Traces (CART, University of Liègecofinanced by the Région Wallonne and Fonds SocialEuropéen). D.T. is indebted to the ICSN for a Ph.D. researchfellowship.
References(1) Gorg, A.; Weiss, W.; Dunn, M. J. Proteomics 2005, 5, 826–827.(2) McCarthy, F. M.; Burgess, S. C.; van den Berg, B. H. J.; Koter, M. D.;
Pharr, G. T. J. Proteome Res. 2005, 4, 316–324.(3) Abdolzade-Bavil, A.; Hayes, S.; Goretski, L.; Kroeger, M.; Anders,
J.; Hendriks, R. Proteomics 2004, 4, 1397–1405.(4) Quetin-Leclercq, J.; Elias, R.; Balansard, G.; Bassleer, R.; Angenot,
L. Planta Med. 1992, 58, 279–81.(5) Lee, K. T.; Sohn, I. C.; Park, H. J.; Kim, D. W.; Jung, G. O.; Park,
K. Y. Planta Med. 2000, 66, 329–32.(6) Bader, G.; Plohmann, B.; Hiller, K.; Franz, G. Pharmazie, 1996, 51,
414–417.
(7) Shany, S.; Amoros, M.; Girre, L.; Bernheimer, A. W.; Grushoff, P. S.;Kim, K. S. Mol. Cell. Biochem. 1974, 3, 179–186.
(8) Armah, C.; Mackie, A.; Roy, C.; Price, K.; Osbourn, A.; Bowyer, P.;Ladha, S. Biophys. J. 1999, 76, 281–290.
(9) Barthomeuf, C.; Debiton, E.; Mshvildadze, V.; Kemertelidze, E.;Balansard, G. Planta Med. 2002, 68, 672–675.
(10) Debiton, E.; Borel, M.; Communal, Y.; Mshvildadze, V.; Barthomeuf,C. Melanoma Res. 2004, 14, 97–105.
(11) Delmas, F.; Di Giorgio, C.; Elias, R.; Gasquet, M.; Azas, N.;Mshvildadze, V.; Dekanosidze, G.; Kemertelidze, E.; Timon-David,P. Planta Med. 2000, 66, 343–347.
(12) Ridoux, O.; Di, G. C.; Delmas, F.; Elias, R.; Mshvildadze, V.;Dekanosidze, G.; Kemertelidze, E.; Balansard, G.; Timon-David,P. Phytother. Res. 2001, 15, 298–301.
(13) Gepdiremen, A.; Mshvildadze, V.; Suleyman, H.; Elias, R. J. Eth-nopharmacol. 2004, 94, 191–195.
(14) Gerkens, P.; Dobson, R.; Tabatadze, N.; Vakhtang Mshviladzade,V.; Elias, R.; Peulen, O.; Jolois, O.; De Pauw-Gillet, M. C. AnticancerRes. 2007, 27, 2529–2534.
(15) Mshvildadze, V.; Elias, R.; Faure, R.; Debrauwer, L.; Dekanosidze,G.; Kemertelidze, E.; Balansard, G. Chem. Pharm. Bull. 2001, 49,752–754.
(16) Mshvildadze, V.; Dekanosidze, G.; Shashkof, A.; Kemertelidze, E.Bioorg. Chim. 1993, 19, 1001–1007.
(17) Zhao, C.; Winnik, M. Langmuir 1990, 6, 514–516.(18) Degiovanni, G.; Lahaye, T.; Herin, M.; Hainaut, P.; Boon, T. Eur.
J. Immunol. 1988, 18, 671–676.(19) Touboul, D.; Halgand, F.; Brunelle, A.; Kersting, R.; Tallarek, E.;
Hagenhoff, B.; Laprévote, O. Anal. Chem. 2004, 76, 1550–1559.(20) Touboul, D.; Kollmer, F.; Niehuis, E.; Brunelle, A.; Laprévote, O.
J. Am. Soc. Mass Spectrom. 2005, 16, 1608–1618.(21) Brunelle, A.; Touboul, D.; Laprévote, O. J. Mass Spectrom. 2005,
40, 985–999.(22) Guillemin, I.; Becker, M.; Ociepka, K.; Friauf, E.; Nothwang, H. G.
Proteomics 2005, 5, 35–45.(23) Shevchenko, A.; Wilm, M.; Vorm, O.; Mann, M. Anal. Chem. 1996,
68, 850–858.(24) In-Solution Digestion Protocol, http://www.biochem.uwo.ca/wits/
bmsl/in-solution_digestion.html, 2005.(25) Swiss-Prot/TrEMBL data base, www.expasy.org, 2005.(26) Subcellular Localization Predictor Software LOCSVMpsi, http://
bioinformatics.ustc.edu.cn/LOCSVMPSI/LOCSVMPSI.php2005.(27) Xie, D.; Li, A.; Wang, M. H.; Fan, Z. W.; Feng, H. Q. Nucleic Acids
Res. 2005, 33, W105–W110.(28) Eberle, J.; Krasagakis, K.; Orfanos, C. E. Int. J. Cancer 1997, 71,
396–401.(29) Sinha, P.; Kohl, S.; Fischer, J.; Hütter, G.; Kern, M.; Köttgen, E.;
Dietel, M.; Lage, H.; Schnölzer, M.; Schadendorf, D. Electrophoresis2000, 21, 3048–3057.
(30) Tuynder, M.; Fiucci, G.; Prieur, S.; Lespagnol, A.; Geant, A.;Beaucourt, S.; Duflaut, D.; Besse, S.; Susini, L.; Cavarelli, J.; et al.Proc. Natl. Acad. Sci. U.S.A. 2004, 101, 15364–15369.
(31) Bernard, K.; Litman, E.; Fitzpatrick, L.; Shellman, Y.; Argast, G.;Polvinen, K.; Everett, A.; Fukasawa, K.; Norris, D.; Ahn, N.; Resing,K. Cancer Res. 2003, 63, 6716–6725.
(32) Pluschke, G.; Vanek, M.; Evans, A.; Dittmar, T.; Schmid, P.; Itin,P.; Filardo, E.; Reisfeld, R. Proc. Natl. Acad. Sci. U.S.A. 1996, 93,9710–9715.
(33) Morel, S.; Ooms, A.; Van Pel, A.; Wolfel, T.; Brichard, V.; Van derbruggen, P.; Van den Eynde, B.; Degiovanni, G,. Int. J. Cancer 1999,83, 755–759.
(34) Carlson, J. A.; Ross, J.; Slominski, A.; Linette, G.; Mysliborski, J.;Hill, J.; Mihn Martin, J. M. J. Am. Acad. Dermatol. 2005, 52, 743–775.
(35) Tenu, J. P.; Etore, F.; Le Doan, T. C. R. Acad. Sci., Ser. III 1997,320, 477–486.
(36) Sung, M. K.; Kendall, C. W.; Rao, A. V. Food Chem. Toxicol. 1995,33, 357–366.
PR7006973
research articles Mazzucchelli et al.
1692 Journal of Proteome Research • Vol. 7, No. 4, 2008