
Pore Structure−Chemical Composition Interactions of New High Surface Area Manganese Based...
10
Pore Structure-Chemical Composition Interactions of New High Surface Area Manganese Based Mesoporous Materials. Materials Preparation, Characterization, and Catalytic Activity Constantinos E. Salmas, ² Vassilis N. Stathopoulos, ‡ Philippos J. Pomonis, ‡ and George P. Androutsopoulos* ,² Department of Chemical Engineering, Section II, Chemical Process Engineering Laboratory, National Technical University of Athens, 9 Heroon Polytechniou Street, GR 157 80 Athens, Greece, and Department of Chemistry, Section of Industrial and Food Chemistry, Laboratory of Industrial Chemistry, University of Ioannina, GR 451 10 Ioannina, Greece Received March 6, 2001. In Final Form: September 25, 2001 The present article deals with pore structure-chemical composition interactions of new high surface area manganese based porous mixed oxides (MANPOs). These mixed oxidic materials were prepared by the dropwise addition of a solution containing metal nitrate into an acetonic solution containing the trinuclear complex of manganese [Mn3O(CH3COO)6(pyr)3]ClO4, which is water sensitive. The CPSM model (corrugated pore structure model) was employed in pore structure investigations of the MANPO materials containing Al, Fe, La, La + Ce, and La + Sr. Successful CPSM simulations of nitrogen sorption hysteresis loops for the MANPO solids enabled the evaluation of intrinsic pore size distributions (PSDs) and tortuosity factors. The latter vary over the approximate range τCPSM ) 3.0-5.7 (i.e. τCPSM ≈ 3 for materials containing Al or Fe and τCPSM ) 4.7-5.7 for those containing La, La + Ce, or La + Sr). These values are typical of porous catalysts and are higher than those reported for MCM-41 materials (ca. τCPSM ) 1.00-2.35) and anodic aluminum oxide films (e.g. τCPSM ) 2.60). The BET surface areas of the MANPO materials vary over the approximate range 180-900 m 2 /g, being higher than those reported for manganese oxide mesopore solids (MOMS), for example 59-170 m 2 /g. Intrinsic PSD predictions for the MANPO solids are of bimodal type with mean pore sizes systematically higher than the respective mean hydraulic diameters. The addition of Fe and La + Ce caused a PSD shift toward the micropore region. Such MANPO materials are amorphous after heating to 500 °C (except for the ones containing Fe) and extremely efficient catalysts for redox reactions such as lean de-NOx applications and NO-CO conversion, probably because of the extremely high dispersion of separate nanophases into the solid. 1. Introduction 1.1. General. A number of significant applications stress the importance of synthesizing high surface area mesoporous manganese based solids. The latter materials are employed in the catalysis of oxidation reactions taking place at milder temperature conditions than those for reactions catalyzed by noble metals. 1,2 Manganese solids can also be used for the production of aqueous and nonaqueous batteries (either regenerable or nonregen- erable type). 1,2 A comprehensive review of various prepa- ration procedures for Manganese catalysts is provided in ref 1 with special reference to the preparation of high surface area mesoporous manganese solids. 1.2. Catalytic Applications of Manganese Oxides. Methane and butane oxidation on oceanic manganese nodules showed a better catalytic activity than that of a commercial Pt-Al 2 O 3 catalyst and demonstrated that manganese oxides possess satisfactory oxidation proper- ties and offer the possibility of using these and similar materials in catalytic processes for the removal of volatile organic compounds (VOCs) as well as gaseous pollutants from combustion gases. 3,4 The combination of manganese oxide with other transition metals results in the formation of active catalytic materials suitable for the oxidation of a spectrum of VOC compounds. Moreover, the required process temperatures are lower than those for the cor- responding catalytic materials containing noble metals. 5 Additional applications of manganese based catalysts are (i) benzene oxidation, 6 (ii) photocatalytic conversion of 2-propanol to acetone and the decomposition of haloge- nated hydrocarbons, 7-9 (iii) selective catalytic reduction of NO in NH 3 or hydrocarbons for the development of pollution abatement technologies against NO x , 10 and (iv) oxidation of cyclohexane into cyclohexanone and hexane into hexanol isomers (i.e. 1-, 2-, 3-). 11 In most of the abovementioned examples the oxidative manganese materials are nonporous with a low specific surface area (i.e. <10 m 2 /g). It is, thus, important for the catalytic behavior and hence the development of the ² National Technical University of Athens. ‡ University of Ioannina. (1) Stathopoulos, V. N.; Petrakis, D. E.; Hudson, M.; Falaras, P.; Neophytides, S. G.; Pomonis, P. J. Characterization of Porous Solids-V; Unger, K. K., Kreysa, G., Baselt, J. P., Eds.; Elsevier: Amsterdam, 1999, p 593. (2) Stathopoulos, V. N.; Belessi, V. C.; Costa, C. N.; Neophytides, S.; Falaras, P.; Efstathiou, A. M.; Pomonis, P. J. Studies of Surface Catalysis; Corma, A., Melo, F. V., Mentioroz, S., Fierro, J. L. G., Eds.; Elsevier: Amsterdam, 2000; Vol. 130, p 1529. (3) Weisz, P. B. J. Catal. 1968, 10, 407. (4) Orthmer, K. Encyclopedia of Chemical Technology, 4th ed.; Plenum Press: New York, 1991; Vol. 15, pp 1044-1045. (5) Luo, T.; Suib, S. J. Phys. Chem. B 1997, 101, 10403. (6) Luo, T.; Zhang, Q.; Huang, A.; Suib, S. L. Microporous Mesoporous Mater. 2000, 35-36, 209. (7) Cao, H.; Suib, S. L. J. Am. Chem. Soc. 1994, 116, 5334. (8) Chen, J.; Lin, J.-C.; Purohit, V.; Cutlip, M. B.; Suib, S. L. Catal. Today 1997, 33, 205. (9) Lin, J.-C.; Chen, J.; Suib, S. L.; Cutlip, M. B.; Freihaut, J. D. J. Catal. 1996, 161, 659. (10) Kapteijn, F.; Langeveld, D-v. A.; Moulijn, J. A.; Andreini, A.; Vuurman, M. A.; Turek, A. M.; Jehng, J-M.; Wachs, I. E. J. Catal. 1994, 150, 94. (11) Tian, Z. R.; Tong, W.; Wang, J. Y.; Duan, N. G.; Krishnam, V. V.; Suib, S. L. Science 1997, 267, 926. 423 Langmuir 2002, 18, 423-432 10.1021/la010340d CCC: $22.00 © 2002 American Chemical Society Published on Web 12/20/2001
Transcript of Pore Structure−Chemical Composition Interactions of New High Surface Area Manganese Based...

Pore Structure-Chemical Composition Interactions ofNew High Surface Area Manganese Based Mesoporous
Materials. Materials Preparation, Characterization, andCatalytic Activity
Constantinos E. Salmas,† Vassilis N. Stathopoulos,‡ Philippos J. Pomonis,‡ andGeorge P. Androutsopoulos*,†
Department of Chemical Engineering, Section II, Chemical Process Engineering Laboratory,National Technical University of Athens, 9 Heroon Polytechniou Street, GR 157 80 Athens,
Greece, and Department of Chemistry, Section of Industrial and Food Chemistry, Laboratoryof Industrial Chemistry, University of Ioannina, GR 451 10 Ioannina, Greece
Received March 6, 2001. In Final Form: September 25, 2001
The present article deals with pore structure-chemical composition interactions of new high surfacearea manganese based porous mixed oxides (MANPOs). These mixed oxidic materials were prepared bythe dropwise addition of a solution containing metal nitrate into an acetonic solution containing the trinuclearcomplex of manganese [Mn3O(CH3COO)6(pyr)3]ClO4, which is water sensitive. The CPSM model (corrugatedpore structure model) was employed in pore structure investigations of the MANPO materials containingAl, Fe, La, La + Ce, and La + Sr. Successful CPSM simulations of nitrogen sorption hysteresis loops forthe MANPO solids enabled the evaluation of intrinsic pore size distributions (PSDs) and tortuosity factors.The latter vary over the approximate range τCPSM ) 3.0-5.7 (i.e. τCPSM ≈ 3 for materials containing Al orFe and τCPSM ) 4.7-5.7 for those containing La, La + Ce, or La + Sr). These values are typical of porouscatalysts and are higher than those reported for MCM-41 materials (ca. τCPSM ) 1.00-2.35) and anodicaluminum oxide films (e.g. τCPSM ) 2.60). The BET surface areas of the MANPO materials vary over theapproximate range 180-900 m2/g, being higher than those reported for manganese oxide mesopore solids(MOMS), for example 59-170 m2/g. Intrinsic PSD predictions for the MANPO solids are of bimodal typewith mean pore sizes systematically higher than the respective mean hydraulic diameters. The additionof Fe and La + Ce caused a PSD shift toward the micropore region. Such MANPO materials are amorphousafter heating to 500 °C (except for the ones containing Fe) and extremely efficient catalysts for redoxreactions such as lean de-NOx applications and NO-CO conversion, probably because of the extremelyhigh dispersion of separate nanophases into the solid.
1. Introduction
1.1. General. A number of significant applicationsstress the importance of synthesizing high surface areamesoporous manganese based solids. The latter materialsare employed in the catalysis of oxidation reactions takingplace at milder temperature conditions than those forreactions catalyzed by noble metals.1,2 Manganese solidscan also be used for the production of aqueous andnonaqueous batteries (either regenerable or nonregen-erable type).1,2 A comprehensive review of various prepa-ration procedures for Manganese catalysts is provided inref 1 with special reference to the preparation of highsurface area mesoporous manganese solids.
1.2. Catalytic Applications of Manganese Oxides.Methane and butane oxidation on oceanic manganesenodules showed a better catalytic activity than that of acommercial Pt-Al2O3 catalyst and demonstrated thatmanganese oxides possess satisfactory oxidation proper-ties and offer the possibility of using these and similarmaterials in catalytic processes for the removal of volatileorganic compounds (VOCs) as well as gaseous pollutants
from combustion gases.3,4 The combination of manganeseoxide with other transition metals results in the formationof active catalytic materials suitable for the oxidation ofa spectrum of VOC compounds. Moreover, the requiredprocess temperatures are lower than those for the cor-responding catalytic materials containing noble metals.5Additional applications of manganese based catalysts are(i) benzene oxidation,6 (ii) photocatalytic conversion of2-propanol to acetone and the decomposition of haloge-nated hydrocarbons,7-9 (iii) selective catalytic reductionof NO in NH3 or hydrocarbons for the development ofpollution abatement technologies against NOx,10 and (iv)oxidation of cyclohexane into cyclohexanone and hexaneinto hexanol isomers (i.e. 1-, 2-, 3-).11
In most of the abovementioned examples the oxidativemanganese materials are nonporous with a low specificsurface area (i.e. <10 m2/g). It is, thus, important for thecatalytic behavior and hence the development of the
† National Technical University of Athens.‡ University of Ioannina.(1) Stathopoulos, V. N.; Petrakis, D. E.; Hudson, M.; Falaras, P.;
Neophytides, S. G.; Pomonis, P. J. Characterization of Porous Solids-V;Unger, K. K., Kreysa, G., Baselt, J. P., Eds.; Elsevier: Amsterdam,1999, p 593.
(2) Stathopoulos, V. N.; Belessi, V. C.; Costa, C. N.; Neophytides, S.;Falaras, P.; Efstathiou, A. M.; Pomonis, P. J.Studies of Surface Catalysis;Corma, A., Melo, F. V., Mentioroz, S., Fierro, J. L. G., Eds.; Elsevier:Amsterdam, 2000; Vol. 130, p 1529.
(3) Weisz, P. B. J. Catal. 1968, 10, 407.(4) Orthmer,K.EncyclopediaofChemicalTechnology, 4thed.;Plenum
Press: New York, 1991; Vol. 15, pp 1044-1045.(5) Luo, T.; Suib, S. J. Phys. Chem. B 1997, 101, 10403.(6) Luo, T.; Zhang, Q.; Huang, A.; Suib, S. L. Microporous Mesoporous
Mater. 2000, 35-36, 209.(7) Cao, H.; Suib, S. L. J. Am. Chem. Soc. 1994, 116, 5334.(8) Chen, J.; Lin, J.-C.; Purohit, V.; Cutlip, M. B.; Suib, S. L. Catal.
Today 1997, 33, 205.(9) Lin, J.-C.; Chen, J.; Suib, S. L.; Cutlip, M. B.; Freihaut, J. D. J.
Catal. 1996, 161, 659.(10) Kapteijn, F.; Langeveld, D-v. A.; Moulijn, J. A.; Andreini, A.;
Vuurman, M. A.; Turek, A. M.; Jehng, J-M.; Wachs, I. E. J. Catal. 1994,150, 94.
(11) Tian, Z. R.; Tong, W.; Wang, J. Y.; Duan, N. G.; Krishnam, V.V.; Suib, S. L. Science 1997, 267, 926.
423Langmuir 2002, 18, 423-432
10.1021/la010340d CCC: $22.00 © 2002 American Chemical SocietyPublished on Web 12/20/2001
corresponding application to synthesize manganese con-taining materials with high surface area.
1.3. Pore Structure Evaluation. The addition ofcations modifies the catalytic activity of manganese basedcatalysts and causes a pore structure change. Therefore,the study of cation addition-mesopore structure interac-tions is a worthwhile research target. Prior to thepresentation of the experimental results and pore struc-ture evaluation, a brief recapitulation and a criticaldiscussion of both newly reported (i.e. CPSM, corrugatedpore structure model) and conventional methods of surfacearea (SSA) and pore size distribution (PSD) determinationwill be presented.
1.3.1. Critical Discussion of Methods for PoreStructure Analysis. Surface Area and Pore Size Dis-tribution. BET theory provided over several decades thedominant method12,13 for pore surface area determination,despite the simplified assumptions that are involved andthe ambiguity accruing from the choice of the linear partof the BET plot. Two BET variants have been proposedin the original publication of Brunauer et al.5 The relevantformula for multilayer adsorption reads
where (na) is the amount (µmols/g) of gas adsorbed atrelative pressure (P/P0), (nm) is the monolayer capacity(i.e. µmols/g), and C is the BET constant. The BET formulafor monolayer adsorption14 (Langmuir form), applicablein cases of narrow mesopores (i.e. approaching the upperlimit of the micropore region, ca. 2 nm) or wider micropores(i.e. 1.5-2 nm),15 is given by
It should be mentioned that for pure physical adsorptionthe acceptable range of the C constant variation isapproximately 20 < C < 200, since C is related to theenthalpy of adsorption and provides information for themagnitude of the adsorbent-adsorbate energy of interac-tion.12-14,16
The application of the traditional methods for PSDevaluation from gas sorption data encounters the dilemmaof selecting either one or the other branch of the hysteresisloop, because markedly different results are obtained whenusing data of one or the other branch. For instance,cumulative specific surface areas (CSSAs) computed fromthese methods, by using either adsorption or desorptiondata, are rarely in agreement between themselves or withthe pertinent BET surface area estimates.
Moreover, the methods under consideration do notprovide any information on pore structure complexity (e.g.pore tortuosity), since they are based on the simplifiedmodel of “bundle of parallel, independent, cylindrical, openended pores”. The CPSM,17,18 proposed recently, is in-tended to overcome the abovementioned problems andprovides for intrinsic PSD and tortuosity factor predictionsvia the simulation of gas sorption hysteresis loops. Asregards the conventional methods for PSD evaluation from
gas sorption data, a number of similar, in structure andperformance, methods are applied over several decades.The most frequently applied method is that of Barrett,Joyner, and Halenda (BJH).19 However, as discussed inref 17, the Roberts method20 is equally applicable and isgenerally considered as a reliable representative of theclassical procedures of PSD evaluation.
Diffusion and Pore Structure Tortuosity. The physicalcharacterization of mesoporous manganese solids apartfrom the specific surface area and intrinsic pore sizedistribution data requires the knowledge of the totalporosity (ε) (i.e. ratio of total pore volume and overallvolume of particle, v/v) and the tortuosity factor (τ). Thesepore structure properties correlate, via eq 3, the binarydiffusivity DAB(Dmean) of two counterdiffusing species Aand B, through a straight cylindrical pore of mean poresize Dmean, with the effective diffusivity De of the samespecies based on the cross-sectional area of a homogeneousporous particle. Thus,
Porosity can be routinely measured by carrying outparticle density determinations, that is, bulk density viamercury displacement and true (skeletal) density via porefilling with He. Tortuosity factor evaluation can beaccomplished through eq 3 if DAB(Dmean), ε, and De, areknown.
For a binary gas mixture diffusing in a porous solid atconstant pressure, the combined diffusivity DAB is given21
by
where DK is the Knudsen diffusivity, Dm is the moleculardiffusivity for gaseous systems, JA and JB are the fluxesof components A and B, and YA is the mole fraction ofcomponent A.
Obviously, for equimolar counterdiffusion JA ) -JB.Thus,
Equations 4 and 5 are valid under the condition that thesurface diffusivity (i.e. the flux from transport throughthe physically adsorbed gas layer) on the pore surface isnegligible.
The Knudsen diffusivity may be computed from theexpression21
where Dmean is the mean pore diameter in centimeters, [T]is in kelvin, and M is the molecular weight of the diffusingspecies. DK for each species does not depend on eithercomposition or total gas concentration because in theKnudsen regime each species diffuses independently. Incases where the Knudsen diffusion is not important, DAB) Dm and eq 3 assumes the form
(12) Davis, B. H. Appl. Catal. 1984, 10, 185.(13) Gregg, S. J.; Sing, K. S. W. Adsorption Surface Area and Porosity,
2nd ed.; Academic Press: New York, 1982.(14) Brunauer, S.; Emmett, P. H.; Teller, E. J. Am. Chem. Soc. 1938,
60, 309.(15) Rouquerol, F.; Rouquerol, J.; Sing, K. Adsorption by Powders
and Porous Solids; Academic Press: New York, 1999.(16) Serwicka, E. M. Catal. Today 2000, 56, 335.(17) Androutsopoulos, G. P.; Salmas, C. E. Ind. Eng. Chem. Res. 2000,
39, 3747.(18) Androutsopoulos, G. P.; Salmas, C. E. Ind. Eng. Chem. Res. 2000,
39, 3764.
(19) Barrett, L. P.; Joyner, L. G.; Halenda, P. P. J. Am. Chem. Soc.1951, 73, 373.
(20) Roberts, B. F. J. Colloid Interface Sci. 1967, 23, 266.(21) Ruthven, D. M. Principles of Adsorption and Adsorption
Processes; J. Wiley & Sons: New York, 1984; pp 127.
De ) εDAB(Dmean)/τ (3)
1DAB
) 1DK
+ 1Dm
[1 - (1 +JB
JA)YA] (4)
1DAB
) 1DK
+ 1Dm
(5)
DK (cm2/s) ) 9700(Dmean
2 )(TM)1/2
(6)
P/(na(P0 - P)) ) (1/nmC) + ((C - 1)/nmC)(P/P0) (1)
((P/P0)/na) ) (1/nmC) + (1/nm)(P/P0) (2)
424 Langmuir, Vol. 18, No. 2, 2002 Salmas et al.
Binary diffusion coefficients Dm for gaseous systemscan be calculated from the Chapman-Enskog equation.21
For a binary gas mixture
where M1 and M2 are the molecular weights, P is the totalpressure in atmospheres, σ12 ) 0.5(σ1 + σ2) is the collisiondiameter from the Lennard-Jones potential, expressed inangstroms, and Ω is a function of ε/kT, where ε ) (ε1ε2)0.5
is the Lennard-Jones force constant and k is the Boltzmannconstant.
The determination of De presents the chief difficultydue to the complexity of experimental procedures and theuncertainties inherently involved in the theoretical modelsused in the analysis of experimental results. A numberof experimental techniques can be applied for the evalu-ation of De. Some of them are the Wicke and Kallenbachexperiment,21 reaction kinetic studies,22 and gas chro-matography techniques.23
To avoid the execution of diffusion measurements andthus make the evaluation of De convenient, a new method(i.e. CPSM-tortuosity15) was recently proposed.24 Thismethod employs an empirical correlation (eq I-6) whoseformulation is based on the CPSM-nitrogen17,18 predic-tions for both intrinsic PSD and nominal pore lengthparameter (Ns) values.
1.3.2. Corrugated Pore Structure Model. The corrugatedpore structure model (CPSM) is a unified theory enablingthe simulation of nitrogen sorption17,18 and mercuryporosimetry hysteresis25,26 phenomena as well as theprediction of pore structure tortuosity factors. Due to theextensive use of the CPSM that will be made in the presentwork, a brief outline of the various CPSM variants ispresented.
CPSM-Nitrogen Model. The CPSM-nitrogen model17
is a statistical model simulating the gas sorption hysteresisphenomena, predicts a single PSD by curve fitting theentire sorption hysteresis loop, and is based on a cor-rugated pore structure configuration. The latter is envis-aged to be composed of a sequence of Ns cylindrical poresegments of constant length and distributed diameter.The symbol Ns stands for a statistical nominal pore length.The development of the CPSM-nitrogen model is basedon a number of assumptions: the physical multilayeradsorption on the surface of the corrugated pore asdescribed by a modified Halsey equation (eq I-1) and thecapillary condensation according to the Kelvin equation(eq I-2).
The condensation is assumed to originally occur prefer-ably on a cylindrical interface at the narrowest segmentand then proceeds through a hemispherical one, whereasevaporation proceeds preferably through a hemisphericalinterface geometry. Following a statistical analysis of theenvisaged physical steps taking place within the cor-rugated pore, the pertinent formulas have been devel-oped.17 The analytical expressions of the CPSM are
presented in eqs (I-3)-(I-5). Various applications coveringthe entire spectrum of hysteresis loop types according tothe IUPAC classification have been worked out.18,27
CPSM-Tortuosity Model. This model consists of anempirical correlation (eq I-6) that is based on CPSM-nitrogen predictions of intrinsic pore size distribution andnominal pore length (i.e. Ns) data. The CPSM-tortuositymodel enables realistic predictions of pore structuretortuosity factors in satisfactory agreement with relevantliterature data.28
CPSM-Mercury Model. The corrugated pore configu-ration has also been used to formulate mathematicalrelationships (eqs (II-1)-(II-6)) simulating mercury po-rosimetry (MP) hysteresis observations (e.g. CPSM-mercury24). Similar correlations have been developedsimulating MP hysteresis loop scanning data and enablingthe definition of pore structure tomography concepts.26,29
Intrinsic Pore Size Distribution. A family of bell shapeddistribution functions (BSDs) was chosen as the intrinsicpore number distribution fr(br,D) (eq III-2), to facilitatethe application of the CPSM both for simulating experi-mental gas sorption and mercury porosimetry hysteresisdata and evaluating tortuosity factors. The respectiveintrinsic pore number distribution F(D) (eq III-1) ap-pearing in the CPSM equations can be derived bycombining a set of (n) fr-type PSDs. The mathematicalform of the BSD enables the analytical integration of theintegrals appearing in the CPSM-nitrogen and CPSM-mercury models.
1.4. Scope. The scope of the present communication isto investigate the effect of metal (e.g. Al, Fe, La, La + Ce,and La + Sr) addition during synthesis of the manganesesolids on pore structure using the CPSM for pore structureanalysis and tortuosity factor evaluation. The CPSM-nitrogen variant will be employed in the analysis ofnitrogen sorption hysteresis data while a performancecomparison of the CPSM with the pertinent conventionalmethods, that is, BET for surface area determination andRoberts for PSD evaluation, will be carried out. Moreover,the intrinsic PSD and Ns data, as explained above, willbe employed for the prediction of tortuosity factors of thematerials under examination. Supplementary informationon materials preparation, surface and texture character-ization, and catalytic activity effectiveness is also pre-sented.
2. Experimental Section
2.1. Manganese Based Porous Oxides (MANPOs) Prepa-ration. Synthesis of the manganese based porous mixed oxideswas based on the hydrolysis of trinuclear manganese complex[Mn3O(CH3COO)6(pyr)3]ClO4 in the presence of metals such asLa (VL-51), Al (VAL-21), Fe (VFE-21), La + Ce (VLCMN-1),and La + Sr (VLSMN-1). The Mn/metal(s) ratio during hydrolysiscan be seen in Table 1. All samples were thermally treated at300 °C for 4 h in ambient air. Details of the synthesis procedure
(22) Furimsky, E.; Massoth, F. E. Catal. Today 1999, 52, 381.(23) Santos, A.; Bahamonde, A.; Avila, P.; Garæia-Ochoa, F. Appl.
Catal. 1996, 10, 299.(24) Salmas, C. E.; Androutsopoulos, G. P. Ind. Eng. Chem. Res. 2001,
40, 721.(25) Androutsopoulos, G. P.; Salmas, C. E. Chem. Eng. Commun.
1999, 176, 1.(26) Androutsopoulos, G. P.; Salmas, C. E. Chem. Eng. Commun.
2000, 181, 137.
(27) Salmas, C. E.; Androutsopoulos, G. P. Appl. Catal., A 2000, 5412.(28) Satterfield, C. N. Mass Transfer in Heterogeneous Catalysis;
M.I.T. Press: London, 1970; pp 37, Figure 1.5.(29) Androutsopoulos, G. P.; Salmas, C. E. Chem. Eng. Commun.
2000, 181, 179.
De ) εDm/τ (7)
Dm (cm2/s) ) [0.00158T3/2(1/M1 + 1/M2)1/2]/
[Pσ1/2Ω(ε/kT)] (8)
Table 1. Sample Notation and Metal Ratios at Synthesisof Manganese Based Oxides
material cation ratio
VAL-21 Mn/Al 0.85VFE-21 Mn/Fe 0.85VL-51 Mn/La 1.70VLCMN-1 Mn/La/Ce 0.85:0.5:0.5VLSMN-1 Mn/La/Sr 0.85:0.5:0.5
New High Surface Area Mn Based Mesoporous Materials Langmuir, Vol. 18, No. 2, 2002 425

can be found elsewhere1,30,31 and are as follows: The trinuclearmanganese complex [Mn3O(CH3COO)6(pyr)3]ClO4 was prepared1
according to the original report of its synthesis.30
Briefly, 2 g of Mn(CH3COO)2‚4H2O (6.15 mmol) was dissolvedin a mixture of 20 mL of ethyl alcohol, 3 mL of pyridine, and 12mL of glacial acetic acid. In this mixture 1.14 g (3.15 mmol) ofN-nBu4MnO4 was added under vigorous stirring, where N-nBu4-MnO4 is tetrabutyl permanganate prepared by mixing aqueoussolutions of KMnO4 and N-nBu4Br. Addition of 0.69 g (5.65 mmol)of NaClO4 resulted in the precipitation of a brown mass of thecomplex that was subsequently filtered and washed with acetone.
The trinuclear complex, henceforth referred to as Mn3, isreadily soluble in warm acetone but instantly hydrolyzed in water.A weighted amount of Mn3 was dissolved in acetone and put ina three-neck spherical flask, equipped with a reflux system usedto avoid the escaping of acetone vapor. Then, an aquatic solutionof the metallic ions in its nitrate form was added dropwise intothe acetonic solution kept at 50 °C. In a typical example, in 250mL of Mn3/acetonic solution containing 0.01 mol of Mn3, 250 mLofAl(NO3)3/H2Osolution (0.141M)wasaddeddropwiseandslowlyduring 2 h. Then the obtained precipitate was filtered, dried atroom temperature, and fired at 300 and 500 °C under atmosphericconditions. Samples prepared in this way are in Table 2 withsome of their characteristic properties. Be aware that not all theamountofheterocations in thesolution isnecessarily incorporatedinto the solids, as shown below.
2.2. Surface and Textural Characterization of the Solids.The surface composition of the materials obtained was checkedusing X-ray photoelectron spectroscopy (XPS). The powders werepressed firmly into carved stainless steel holders so that theycould be introduced into the ultrahigh vaccum (UHV) chamber(base pressure 8 × 10⁻¹⁰). The analysis chamber was equippedwith a hemispherical analyzer (SPECS LH-10) and a twin-anodeX-ray gun. The unmonochromatized Mg KR line at 1253.6 anda constant pass energy mode (97 eV) for the analyzer were usedfor the analysis measurements. The calculations of the variouscomponent compositions of such solids shown in Table 2 werebased on the spectra of the Mn 2p, Al 2p, Fe 3p, La 4d, and O1s photoelectrons.
The texture and morphology of the materials were investigatedby atomic force microscopy (AFM Nanoscope III, Digital Instru-ments) in the tapping mode. Observations were performed onthin films of these materials deposited on microscope glass slidesby solvent evaporation of aqueous dispersions (2 g L-1), homog-enized by ultrasounds (30 min). Typical three-dimensional imagesare shown in Figure 1. The Mn-Al-O and Mn-La-O films arecomposed of large domains of features of different heights,probably resulting from a rather random particle deposition. Onthe contrary, for the Mn-Fe-O films, we observed the presenceof a more robust and organized structure, which consists of well-defined rocks of different sizes on the top of a continuousbackground. The grain size analysis revealed that the graindiameter of the lanthanum containing Mn oxide is significantlylower than those of the corresponding aluminum and iron ones(Table 2). Furthermore, the roughness analysis indicated thatthe standard deviation of the difference between the highest andlowest points (rms), which directly reflects the height of surfacefeatures, is significantly higher in the case of the Mn-Fe oxide.Finally, the geometric complexity of the material surfaces wasevaluated by a more detailed fractal analysis and the results areindicated in Table 2.1
X-ray diffraction analysis showed that such MANPO solidsare predominantly amorphous up to 500 °C and only the materials
(30) Vincent, J. B.; Chang, H. R.; Folting, K.; Huffman, J. C.; Christou,G.; Hedrikson, D. N. J. Am. Chem. Soc. 1987, 109, 5703.
(31) Stathopoulos, V. N. Ph.D. Thesis, University of Ioannina, Greece,2001 (in Greek).
Table 2. Physicochemical Characteristics of Mn Based Mixed Oxide Materials
property calcination T (°C) Mn-Al-O Mn-La-O Mn-La-Ce-O
BET (m2/g) 300 711 247 170500 310 166 122
crystal structure/XRD 500 amorphous amorphous amorphousMn/A in hydrolysis 1.70:1 0.85:1 0.85:0.5:0.5surface composition/XPS 500 0.28:0.11:0.61 0.33:0.05:0.62 0.18:0.11:0.28:0.53roughness/AFM (nm) 300 9.76 13.35 -particle size/AFM (nm) 300 20 10-15 -fractal dimension/AFM 300 2.22 2.29 -
Figure 1. AFM images of (a) Mn-Al-O, (b) Mn-La-O, and(c) Mn-Fe-O solid.
426 Langmuir, Vol. 18, No. 2, 2002 Salmas et al.

containing iron show crystallites of Fe2O3 and Mn2O3,1,31 asindicated for typical samples in Table 2.
2.3. Nitrogen Sorption Measurements. The specific surfaceareas and the pore size distributions of the samples weredetermined by a Fisons SORPTOMATIC 1900 volumetricadsorption-desorption apparatus, using nitrogen as adsorbateat 77.4 K. Prior to the determination of adsorption-desorptionisotherms, the samples were degassed at 200 °C under a 5 × 10⁻²
mbar vacuum for 12 h. The specific surface area determinationof the samples was accomplished by applying the BET theory forboth multilayer (BET(mu)) and monolayer (BET(mo)) adsorptionand using the respective linear part over the P/P0 intervalsindicated in Table 4. A close-packed BET monolayer, with am-(N2) ) 0.162 nm2 at 77.4 K, was assumed.
3. Results and Discussion3.1. Nitrogen Sorption Hysteresis. Nitrogen adsorp-
tion-desorption runs were carried out at 77.4 K using theMANPO samples of Table 1. The sorption hysteresisexperimental data (points) and their CPSM simulation(solid line through the points) are provided in Figure 2.The configuration of these loops is more or less that ofH2-type of the IUPAC classification with VAL-21 and VL-51 being the most typical examples. As seen from Figure2, CPSM fitting has been quite successful. The relevantparameters for all MANPO samples are presented in Table3.
In four out of five cases a bimodal intrinsic pore sizedistribution (i.e. two b values were considered, Table 3)was required to obtain a satisfactory fit. The nominal porelength parameter (NS) assumed values ranging ap-proximately from 3 to 20, indicating the presence ofenhanced pore structure tortuosity in the MANPOsamples. The fitting of VAL-21 was obtained for a cos θvalue less than cos θc ) cos θh < 0.5, indicating the presenceof limited microporosity that will be assessed from thelocation of the intrinsic PSD. For the rest of the MANPOmaterials, cos θ varies over the approximate range cos θ) 0.5-0.8, indicating the presence of a pseudo-hemi-spherical (becoming cylindrical in the limit) liquid nitrogeninterface geometry during both the capillary condensationand evaporation processes.
A visual comparison of the hysteresis loops for VAL-21and VFE-21 (Figure 2) shows that the addition of Feresulted in about three times lower specific pore volumethan that in the case of Al addition and a severe distortion
of the hysteresis loop. Such large pore volume and loopshape differences should also be reflected in surface areaand PSD variations. The addition of La, though lower by30% compared to Al and Fe additions, caused a pore volumereduction to an extent intermediate to those observed inthe Al and Fe cases. The size (i.e. width) of the hysteresisloop is quite large, a fact reflected in the relatively highNS value, NS ) ∼20 (Table 3).
The combined addition of La + Sr in a percentageequivalent to that for the exclusive addition of La has notaffected the specific pore volume but caused a quitesubstantial change of the loop shape by lowering theadsorption isotherm and yielding an obviously differentoverall loop configuration. Such differences will be as-sessed via the relevant comparisons of key pore structureparameters.
The combined addition of La + Ce caused a significantpore volume reduction and loop shape distortion. Bothchanges compare well to those observed in the case of Feaddition despite the fact that the cumulative La + Ceaddition was 30% lower than the Fe addition.
3.2. Modified Halsey and Kelvin Correlations. Thesuccessful CPSM simulation of nitrogen sorption hyster-esis loops for MANPO materials portrayed in Figure 2was obtained for the m and n values (i.e. parameters ofthe modified Halsey correlation (i.e. eq I-1) and Kelvinparameters cos θc and cos θh provided in Table 3. For thesake of visual comparison of the modified Halsey cor-relation used in this work to the original Halsey,32
Lippens,33 and Wheeler34 correlations, the curves of Figure3a were constructed. It is readily seen from the latterfigure that the modified Halsey correlation (dashed curvesin Figure 3a) compares satisfactorily with those reportedin the literature.
By combining the modified Halsey and Kelvin correla-tions, the CPSM predicted P/P0 versus D lines (dashedcurves of Figure 3b) were drawn. The comparison of theCPSM lines with those reported by Broekhoff et al.35 andSonwane et al.36 shows that the former predict lower poresizes for a specified P/P0 value. This observation can be
(32) Halsey, G. D. J. Chem. Phys. 1948, 16, 931.(33) Lippens, B. C.; Linsen, B. G.; De Boer, J. H. J. Catal. 1964, 3,
32.(34) Wheeler, A. Catalysis; Reinhold: New York, 1955; Vol. II, p 116.
Table 3. CPSM Fitting Parameters of Nitrogen Sorption Hysteresis Loops for Manganese Based Mesoporous Materials
parameters of the intrinsic poresegment number distribution F(D)
Kelvinb
parametersparameters of t
(nm), eq I-1specimen
Vg(max)(cm3(STP)/g) Ns
a b1 b2 w1 w2 Pce/P0 (P/P0)(max) cos θc cos θh m n
VAL-21; Mn/Al ) 0.85 357.21 10 -100 -30 7 1 0.370 0.945 0.45 0.45 0.17 0.38VFE-21; Mn/Fe ) 0.85 104.94 3.2 -90 -16 4 1 0.27 0.954 0.70 0.70 0.20 0.43VL-51; Mn/La ) 1.70 187.26 20 -60 - 1 - 0.46 0.971 0.60 0.60 0.16 0.45VLCMN-1; Mn/La/Ce )
0.85:0.5:0.578.68 3.4 -200 -14 6 1 0.25 0.981 0.50 0.50 0.18 0.45
VLSMN-1; Mn/La/Sr )0.85:0.5:0.5
204.23 6 -70 -16 6 1 0.35 0.98 0.80 0.80 0.06 0.38
a CPSM nominal pore length. b As defined by eq 11.1
Table 4. Manganese Based Mesoporous Materials. Specific Surface Areas Obtained by Using BET, CPSM-nitrogen andRoberts Methods
specimenSBET(mu)(m2/g)
P/P0(mu)range CBET(mu)
SBET(mo)(m2/g)
P/P0(mo)range CBET(mo)
SCPSM(m2/g)
SRo(co)(m2/g)
SRo(ev)(m2/g)
VAL-21; Mn/Al ) 0.85 741 0.1-0.25 75 902 0.04-0.11 41 902 343 (-62%) 428 (-53%)VFE-21; Mn/Fe ) 0.85 201 0.2-0.44 20 202 0.03-0.08 51 201 139 (-31%) 159 (-21%)VL-51; Mn/La ) 1.70 251 0.02-0.09 90 314 0.05-0.09 43 251 148 (-41%) 235 (-6%)VLCMN-1; Mn/La/Ce ) 0.85:0.5:0.5 170 0.06-0.18 60 183 0.02-0.08 65 181 88 (-51%) 106 (-41%)VLSMN-1; Mn/La/SR ) 0.85:0.5:0.5 212 0.00-0.09 305 232 0.01-0.07 181 211 172 (-18%) 254 (+20%)
a Percent deviation from SBET (values printed in bold).
New High Surface Area Mn Based Mesoporous Materials Langmuir, Vol. 18, No. 2, 2002 427
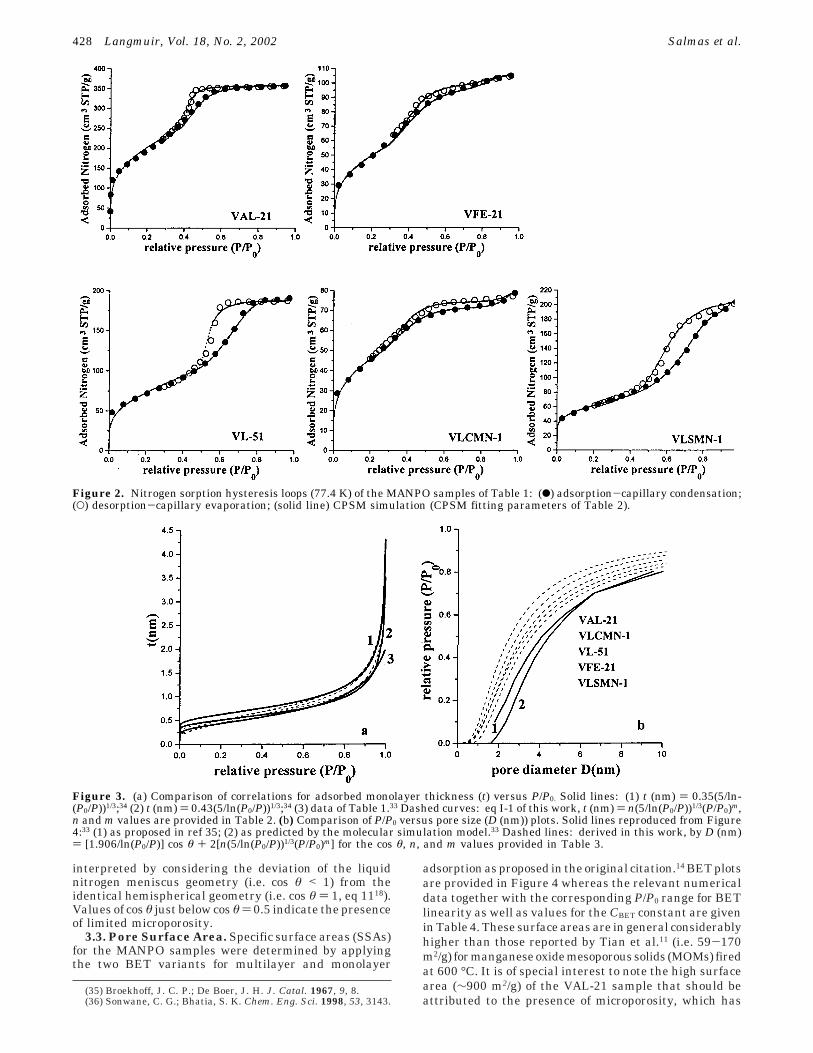
interpreted by considering the deviation of the liquidnitrogen meniscus geometry (i.e. cos θ < 1) from theidentical hemispherical geometry (i.e. cos θ ) 1, eq 1118).Values of cos θ just below cos θ ) 0.5 indicate the presenceof limited microporosity.
3.3. Pore Surface Area. Specific surface areas (SSAs)for the MANPO samples were determined by applyingthe two BET variants for multilayer and monolayer
adsorption as proposed in the original citation.14 BET plotsare provided in Figure 4 whereas the relevant numericaldata together with the corresponding P/P0 range for BETlinearity as well as values for the CBET constant are givenin Table 4. These surface areas are in general considerablyhigher than those reported by Tian et al.11 (i.e. 59-170m2/g) for manganese oxide mesoporous solids (MOMs) firedat 600 °C. It is of special interest to note the high surfacearea (∼900 m2/g) of the VAL-21 sample that should beattributed to the presence of microporosity, which has
(35) Broekhoff, J. C. P.; De Boer, J. H. J. Catal. 1967, 9, 8.(36) Sonwane, C. G.; Bhatia, S. K. Chem. Eng. Sci. 1998, 53, 3143.
Figure 2. Nitrogen sorption hysteresis loops (77.4 K) of the MANPO samples of Table 1: (b) adsorption-capillary condensation;(O) desorption-capillary evaporation; (solid line) CPSM simulation (CPSM fitting parameters of Table 2).
Figure 3. (a) Comparison of correlations for adsorbed monolayer thickness (t) versus P/P0. Solid lines: (1) t (nm) ) 0.35(5/ln-(P0/P))1/3;34 (2) t (nm) ) 0.43(5/ln(P0/P))1/3;34 (3) data of Table 1.33 Dashed curves: eq I-1 of this work, t (nm) ) n(5/ln(P0/P))1/3(P/P0)m,n and m values are provided in Table 2. (b) Comparison of P/P0 versus pore size (D (nm)) plots. Solid lines reproduced from Figure4:33 (1) as proposed in ref 35; (2) as predicted by the molecular simulation model.33 Dashed lines: derived in this work, by D (nm)) [1.906/ln(P0/P)] cos θ + 2[n(5/ln(P0/P))1/3(P/P0)m] for the cos θ, n, and m values provided in Table 3.
428 Langmuir, Vol. 18, No. 2, 2002 Salmas et al.

been detected from the CPSM simulation. The rest of thesurface areas, depending on the BET variant applied, varybetween 170 and 314 m2/g, well above the range 50-170m2/g reported for the MOMs materials. In all cases thevalues of the CBET constants for both BET procedures fallwithin acceptable limits, that is, CBET ) ∼20-200. In thecase of VFE-21, both BET variants predicted practicallyequivalent specific surface areas of about 200 m2/g.
Moreover, the BET SSA values are compared with therelevantCSSAobtainedbytheCPSMandtheconventionalRoberts method (Table 4). CPSM predictions are in perfectagreement with BET values (printed in bold in Table 4)while the respective Roberts values deduced for both thenitrogen capillary condensation and evaporation data are,in general, considerably lower (see percentages in pa-rentheses of Table 4) than the BET predictions (i.e. printedin bold in Table 4). Furthermore, the CPSM predictionsof CSSA for VAL-21 and VLCMN-1 samples agree withthe BET-monolayer SSA values, a fact that is attributedto the presence of wider micropores (i.e. VAL-21) ormesopores of size approaching the upper limit (i.e. 2 nm)of the micropore region. This observation will becomeobvious via an inspection of the intrinsic PSDs.
3.4. Pore Volume and Surface Area Distribution.Pore volume and surface area PSDs in cumulative anddifferential form for all materials studied in this work areavailable inelectronic form(SupportingInformation).Boththe CPSM and the Roberts method predict bimodalintrinsic pore size distributions for the MANPO materialsstudied in this work. However, the Roberts methodpredicts PSDs located over a higher pore size range thanthose of the CPSM and the pertinent CSSAs are consid-erably lower than the corresponding BET pore surfaceareas, while CPSM CSSA predictions are in perfectagreement with the relevant BET values.
CPSM intrinsic PSD parameters are provided in Table3. CPSM derived intrinsic differential PSDs for theMANPO materials are presented in Figure 5. It is obvious
from Figure 5a1 and b1 that the addition of La createda PSD located over the approximate range 3-20 nm whilethe addition of Al and Fe gave rise to an intrinsic PSDpractically extending over the range 2-12 nm. A com-parison of the intrinsic PSD for MANPO solids containingLa (Figure 5a2 and b2) reveals that the combined additionof La + Ce results in a shift of the intrinsic PSD towardthe micropore region (i.e. 1.8-6 nm), while the La + Sraddition does not cause any PSD shift compared to thePSD valid for the sample possessing exclusively La (i.e.3-9 nm).
3.5. Mean Hydraulic Pore Diameters. Mean hy-draulic pore diameters, Dmh ) 4Vp/SBET, were computedfor all MANPO samples by considering both BET surfacearea estimates for each particular sample. The relevantresults are reported in Table 5. Generally, Dmh values arelower (i.e. by 0-40%) than the respective CPSM predic-tions and more or less equal to the mean pore diameterof ∼3 nm reported by Tian et al.11 for the MOMs materials.
3.6. Tortuosity Factor Predictions. Tortuosity fac-tors for the materials under examination were computedfrom the empirical correlation of eq I-6 in the Appendix(i.e. CPSM-tortuosity24), and the relevant values areshown in Table 5. The latter values vary over theapproximate range τCPSM ) 2.96-5.70 and are typical ofporous catalysts that usually show tortuosity factorsbetween 3 and 10.37 The CPSM predicted tortuosity factorsfor the MANPO materials are higher than those (i.e. τCPSM) 1-2.35) obtained by the same model for MCM-41materials.37 The latter observations indicate that unlikethe highly ordered mesoporous MCM-41 materials theMANPO samples possess a relatively more complex porestructure.
3.7.MaterialCatalyticPerformanceObservations.We emphasize the fact that such MANPO materials are
(37) Salmas, C. E.; Stathopoulos, V. N.; Pomonis, P. J.; Rahiala, H.;Rosenholm, J. B.; Androutsopoulos, G. P. Appl. Catal., A 2001, 216, 23.
Figure 4. BET plots for the manganese based materials of Table 1: (O) BET multilayer adsorption model;19 (4) BET monolayeradsorption model.19
New High Surface Area Mn Based Mesoporous Materials Langmuir, Vol. 18, No. 2, 2002 429

very effective catalysts for redox reactions, such ase leanNOx reduction in a NO/CH4/O2 reaction mixture.31,39 Table6 compares the results obtained for the best catalystsreported for the NO/CH4/O2 lean NOx reaction in the low-temperature range 200-350 °C and a MANPO solid. Eventhough the comparison is not based on exactly the samereaction conditions, useful conclusions can be drawn. ThePt/SiO2 catalyst shows a maximum reaction rate at 270°C with a value about five times higher than that observedon the present MANPO solid. However, the former catalyst
was reported to lose its activity drastically by increasingthe oxygen concentration beyond 0.1 mol %, while itsactivity versus temperature profile appears as a sharppeak. The latter behavior is just opposite to that obtainedon the present MANPO solid.
4. ConclusionsThe preparation of manganese based mesoporous
materials (MANPOs) having high surface areas (i.e. 180-900 m2/g) was accomplished. The latter values are higherthan those reported for manganese oxide mesoporoussolids (i.e.59-170 m2/g).
The corrugated pore structure model (CPSM-nitrogen)is a quite flexible analytical tool for successful simulations
(38) Washburn, E. W. Proc. Natl. Acad. Sci. 1921, 7, 115.(39) Stathopoulos, V. N.; Costa, C.N.; Pomonis, P. J.; Efstathiou, A.
M. Top. Catal. 2001, 16/17, 231.(40) Burch, R.; Ramli, A. Appl. Catal., B 1998, 15, 63.
Figure 5. Comparison of CPSM predicted intrinsic pore size frequency distributions (PSDs).
Table 5. Tortuosity Factor Data for Manganese Based Mesoporous Materials As Predicted by the CPSM-TortuosityModel24
mean hydraulic pore diameter, Dp (nm)specimen Ns
Dmin,eff(nm)
Dmax,eff(nm)
Dmean(nm) τCPSM
Vp, pore volume(cm3/g) 4VP/SBET(mu) 4VP/SBET(mo)
VAL-21; Mn/Al ) 0.85 10 2.02 4.45 2.55 3.19 0.55 2.97 2.44VFE-21; Mn/Fe ) 0.85 3.2 2.19 12.52 4.04 2.96 0.16 3.18 3.17VL)51; Mn/La ) 1.70 20 3.2 8.10 4.90 4.66 0.29 4.62 3.69VLCMN-1; Mn/La/Ce ) 0.85:0.5:0.5 3.4 1.86 21.10 4.20 4.80 0.12 2.82 2.62VLSMN-1; Mn/La/Sr ) 0.85:0.5:0.5 6 3.2 27.40 7.98 5.70 0.32 6.04 5.52
Table 6. Catalytic Performance of Various Catalysts toward the CH4/NO/O2 Lean-NOx Reaction in the Range 200-350 °C
catalyst (mmol‚gcat‚s-1) experimental conditions (%) T (°C) rate N2 (× 102) SN2 ref
1 wt % Pt/SiO2 500 ppm NO/1000 ppm CH41000 ppm O2/He, GHSV ) 60 000 h-1 270 9.70 n.a. 40
1 wt % Rh/Al2O3 2000 ppm NO/6700 ppm CH4/ 200 0.08 80 315% O2, GHSV ) 20 000 h-1 350 0.60 86
Mn-La-Sr-Ce-O 2000 ppm NO/6700 ppm CH4/ 200 1.70 98 31, 395% O2, GHSV ) 12 000 h-1 300 2.00 80
430 Langmuir, Vol. 18, No. 2, 2002 Salmas et al.
of nitrogen sorption hysteresis loops obtained for MANPOmaterials. The CPSM through the best fit of the sorptionhysteresis data enabled the evaluation of intrinsic poresize distributions, the prediction of working Halsey andKelvin correlations, the detection of microporosity, andthe evaluation of cumulative pore surface areas in perfectagreement with BET theory estimates. The CPSM-tortuosity variant was applied in realistic evaluations ofpore structure tortuosity factors.
The Roberts method, taken as the most appropriaterepresentative of the conventional procedures for PSDcomputation, predicted cumulative specific pore surfaceareas substantially lower than the pertinent BET values,irrespective of the chosen sorption hysteresis branch. TheRoberts method and similar methods provide neither forthe detection of microporosity nor for the evaluation oftortuosity factors.
The tortuosity factors for the MANPO materials, in theapproximate range τCPSM ) 3-5.7, were predicted by theCPSM-tortuosity model. These values are typical ofconventional porous catalysts and indicate that theMANPO materials possess a complex pore structure incontrast to the highly ordered pore structure of MCM-41solids (i.e. τCPSM ) 1-2.35).
Mean CPSM predicted pore diameters are clearly andsystematically greater than the respective mean hydraulicpore diameters of the MANPO materials as well thosereported in the literature for the manganese oxidemesoporous solids (MOMs).
MANPO materials are very effective catalysts for redoxreactions, such as the lean NOx reduction in NO/CH4/O2reaction mixtures.
Nomenclature
D ) pore diameter (nm)DAB ) binary diffusivity of two counterdiffusing species
A and B, through a straight cylindrical pore of meandiameter Dmean
Dm ) molecular diffusivity of gaseous systemsDC, Dh ) diameter of pore filled up with condensate
through a cylindrical or a hemispherical l/v interface shape,(nm)
De ) effective diffusion coefficient based on the cross-sectional area of a homogeneous porous particle
DK ) Kelvin core diameter (nm) (i.e. eq. I-2) or Knudsendiffusivity (eq 6)
Dmin, Dmax ) minimum and maximum pore diameterdetected by nitrogen condensation (nm)
Dmin,eff, Dmax,eff: as defined by eq I-7Dmean ) mean pore diameter as predicted by the intrinsic
pore size distributionDmh ) mean hydraulic pore diameter, Dmh ) 4Vp/SBET.fr(br;D) ) component pore number distribution function
(eq III-2) of BSD type used in the synthesis of F(D)F(D) ) intrinsic pore number distribution density func-
tion, as defined by eq III-1FV(D) ) D2F(D)Ji ) diffusion flux of species i (mol/(m2 s))m ) exponent in eq I-1Mi ) molecular weight of species in ) multiplication factor in eq I-1 (monolayer thickness)na ) amount of gas adsorbed at relative pressure P/P0
(µmol/g)nm ) monolayer capacity (µmol/g)NS ) number of pore segments forming a corrugated pore
(also nominal pore length)P/P0 ) relative gas pressurePj ) probability for at least one l/v hemispherical interface
to be adjacent to the general jth segment of a corrugatedpore17
q ) probability for a pore segment of size Dj to be withinthe range Dh-Dmax
17
t ) thickness of physically adsorbed nitrogen multilayer(nm)
T ) temperature (K)Vads ) relative saturation during capillary condensationVder ) relative pore volume evacuated by desorbed-
evaporated nitrogen (eq I-5)Vp ) specific pore volume (cm3/g)Vsr ) relative saturation during capillary evaporation (1
- Vder)Yi ) mole fraction of component i
AcronymsBSD ) bell shaped distribution function: (D - Dmin)(D
- Dmax) exp(bD)CPSM ) corrugated pore structure modelCSSA ) cumulative specific surface areaPSD ) pore size distributionSSA ) specific surface area
Greek Lettersε ) porosity (Vpore/Vparticle)θC, θh ) liquid nitrogen contact angles for cylindrical and
hemispherical liquid nitrogen meniscuses, respectivelyτ ) tortuosity factor ) εDAB(Dmean)/De eq 3 (dimensionless)τCPSM ) tortuosity factor as defined by eq I-6
Acknowledgment. The authors are grateful to theState Scholarships Foundation of Greece for the financialsupport provided to one of them (CS).
Appendix IAdsorbed Nitrogen Statistical Multilayer Thick-
ness. A modified Halsey equation17,18 that has been testedby carrying out various applications, concerning the curvefitting of adsorption data of various materials, is also usedin the present work,
where n ) 3.5-4.3 and m ) 0-0.1 (for [t] in angstroms).Kelvin Equation. The version of the Kelvin equa-
tion17,18 to be used in the hysteresis loop simulations usingthe CPSM is shown in eq I-2,
where DK is the Kelvin diameter (nm) and θ is the nitrogenliquid-vapor interface contact angle (cos θ ) 0.5 for acylindrical interface geometry, cos θ ) 1.0 for a hemi-spherical interface geometry). Any cos θ value between0.5 and 1.0 stands for the intermediate liquid nitrogenmeniscus geometry whereas values of cos θ lower than0.5 indicate an arbitrary interface geometry and thepresence of microporosity.
CPSM-NitrogenModel.Adsorption-CapillaryEvapo-ration Isotherm. The relative volume Vads of gas adsorbedat a specified relative pressure can be computed via eqI-3.
t ) n[5/ln(P0/P)]1/3(P/P0)m (I-1)
DK ) [1.906/ln(P0/P)] cos θ (I-2)
Vads ) [1/∫Dmin
DmaxD2F(D) dD][4t∫Dh
Dmax(D - t)F(D) dD +
∫Dmin
DC D2F(D) dD + ∫DC
DhD2F(D) dD( 1
NS∑j)1
j)NS
(Pj)) +
4t∫DC
Dh(D - t)F(D) dD( 1
NS∑j)1
j)NS
(1 - Pj))] (I-3)
New High Surface Area Mn Based Mesoporous Materials Langmuir, Vol. 18, No. 2, 2002 431
Desorption-Capillary Evaporation Isotherm. The rela-tive amount of nitrogen evaporated and/or desorbed, Vder,as a function of the relative gas pressure can be evaluatedvia eq I-5 while the fraction of the pore volume, Vsr,saturated with nitrogen is given by eq I-4.
Proof of eqs I-3 and I-5 is presented elsewhere.17
CPSM-Tortuosity Model. The CPSM-nitrogentheory has been utilized in the formulation of an empiricalcorrelation that predicts tortuosity factors; thus,
where Dmax,eff and Dmin, eff are calculated from
or
Details of the CPSM-tortuosity theory are given in ref24.
Appendix IICPSM-MercuryModel.TheWahburnequationreads
where P is the applied pressure, D is the pore diameter,γ is the surface tension, and θ is the contact angle ofmercury.38
Mercury Penetration. The CPSM prediction of theintruded mercury volume as a function of the appliedpressure reads
where
or
and
Mercury Retraction. The CPSM prediction of thevolume of mercury withdrawn (i.e. VW), under decreasingpressure conditions, can be computed from the followingequations:
where
or
The CPSM predicted mercury retraction line is deducedfrom the following equation:
Proof of eqs (II-2)-(II-5) is presented elsewhere.25
Appendix III: Intrinsic Pore Segment NumberDistribution Function
The normalized F(D) in its general form (i.e. composedof n unimodal PSDs) reads
where wr is the weight of a unimodal PSD,
where Φr is the normalization factor of fr(br;D) and
is the normalization factor of each one of the pore volumedistributions composing the overall pore volume distribu-tion.
Supporting Information Available: The followingcategories of graphs concerning the entire set of materials studiedin this work: (i) cumulative and differential PSDs with respectto pore volume and (ii) cumulative and differential PSDs withrespect to pore surface area. This material is available free ofcharge via the Internet at http://pubs.acs.org.
LA010340D
Case i: for Dmin < D < (Dmin/λ)
VW(P(D)) ) ( B2k2
/∫Dmin
DmaxD2F(D) dD)∫Dmin
DD2F(D) dD
(II-3)
Case ii: for (Dmin/λ < D < Dmax
VW(P(D)) ) ( B2k2
/∫Dmin
DmaxD2F(D) dD)[∫Dmin/λ
D
(D2F(D)∫D
DmaxF(D) dD) dD + ∫Dmin
Dmin/λD2F(D) dD] (II-4)
B ) (2k/(1 - PC)) - ((1 - PCk)(PC + PC
k))/(1 - PC2)
for PC < 1
B ) 2k2 for PC ) 1 and PC ) 1 - PS
VR ) (1 - VW) (II-5)
F(D) ) ∑r)1
r)n(wr
Rr)fr(br;D)
Φr
/∑r)1
r)n(wr
Rr) (III-1)
∑r)1
r)n
wr ) 1
fr(br;D) ) (D - Dmin)(D - Dmax) exp(bD) (III-2)
Φr ) ∫Dmin
Dmax(D - Dmin)(D - Dmax) exp(bD) dD (III-3)
Rr ) ∫Dmin
DmaxD2( fr
Φr) dD
Vsr ) 1 - Vder (I-4)
Vder ) ∫Dh
Dmax(D - 2t)2F(D) dD( 2NS
1 - qNS
1 - q-
qNS-1)/∫Dmin
DmaxD2F(D) dD (I-5)
τCPSM ) 1 + 0.69(Dmax,eff - Dmin,eff
Dmean)(NS - 2)0.58 (I-6)
∫Dmax,eff
Dmax Fv(D) dD ) ∫Dmin
Dmin,effFv(D) dD ) 0.025 (I-7)
∫Dmax,eff
Dmax D2F(b;D) dD ) ∫Dmin
Dmin,effD2F(b;D) dD ) 0.025(I-8)
P ) -4γ cos θ/D (II-1)
VP(P(D)) ) Ak
(∫D
DmaxD2F(D) dD/∫Dmin
DmaxD2F(D) dD)(II-2)
A ) (1 - PS2k)/(1 - PS) - kPS
2k-1 for PS< 1
A ) k for PS ) 1
PS ) ∫D
DmaxF(D) dD
432 Langmuir, Vol. 18, No. 2, 2002 Salmas et al.