Population structure and the impact of regional and local habitat isolation upon levels of genetic...
13
Population structure and the impact of regional and local habitat isolation upon levels of genetic diversity of the endangered damselfly Coenagrion mercuriale (Odonata: Zygoptera) PHILLIP C. WATTS, ILIK J. SACCHERI, STEPHEN J. KEMP AND DAVID J. THOMPSON School of Biological Sciences, Liverpool University, Crown Street, Liverpool, L69 7ZB, U.K. SUMMARY 1. Coenagrion mercuriale is one of Europe’s most threatened damselflies. There is concern for the long-term persistence of many of its U.K. colonies because adult lifetime movement is limited, making isolated populations susceptible to extinction. 2. Using 14 microsatellite loci we characterised levels of genetic diversity, evidence for a recent decline and the spatial genetic structure for C. mercuriale population in Wales, U.K. 3. Spatial isolation is not an absolute predictor of low genetic diversity at either local or regional scales. 4. One population inhabiting a remote, edge of range site is genetically impoverished with levels of variability (at microsatellite loci) among the lowest reported for any insect species. 5. Agricultural land and high ground are physical barriers to dispersal by adults. 6. Consistent with work from elsewhere, movement by mature C. mercuriale in Pembrokeshire is sufficient to prevent significant genetic differentiation throughout a habitat matrix of some 3–4 km if the suitable habitat sites are <2 km apart and lack barriers to movement. Even within a good habitat matrix, however, genetic isolation by distance develops within 10 km. Keywords: biodiversity, bottleneck, conservation, dispersal, population structure Introduction Destruction and fragmentation of habitat are major causes of biodiversity loss [World Conservation Monitoring Centre (WCMC), 1992]. Organisms sensi- tive to the effects of habitat fragmentation are likely to have some combination of low natural abundance/ high area requirement, large population fluctuations, low intrinsic growth rate, specialised habitat require- ments and/or poor dispersal capability (Henle et al., 2004). Particularly by impacting upon the capability of individuals to disperse, habitat fragmentation can lead to a reduction in population size that will heighten extinction risk by increasing vulnerability to stochastic demographic changes or reducing gen- etic diversity (Frankham, 1995; Frankham, Ballou & Briscoe, 2002). Maintaining genetic diversity is im- portant as it is associated with population viability (Saccheri et al., 1998; Madsen et al., 1999; Spielman et al., 2004a; Spielman, Brook & Frankham, 2004b) and the evolutionary potential of a species to respond to environmental change (Frankham et al., 2002; Reed & Frankham, 2003; Schmitt & Hewitt, 2004). European wetlands, which are inherently discontinuous, are becoming increasingly patchy, largely because of pollution, eutrophication or changes in land use. A decline in movement among habitat patches may be expected for many freshwater species, with the expected consequences of genetic erosion and popula- tion decline. Correspondence: Phill Watts, Marine and Freshwater Biology Research Group, The Biosciences Building, School of Biological Sciences, Liverpool University, Crown Street, Liverpool, L69 7ZB, U.K. E-mail: [email protected] Freshwater Biology (2006) 51, 193–205 doi:10.1111/j.1365-2427.2005.01478.x Ó 2005 The Authors, Journal compilation Ó 2005 Blackwell Publishing Ltd 193
Transcript of Population structure and the impact of regional and local habitat isolation upon levels of genetic...

Population structure and the impact of regional and localhabitat isolation upon levels of genetic diversity of theendangered damselfly Coenagrion mercuriale (Odonata:Zygoptera)
PHILLIP C. WATTS, ILIK J . SACCHERI, STEPHEN J. KEMP AND DAVID J. THOMPSONSchool of Biological Sciences, Liverpool University, Crown Street, Liverpool, L69 7ZB, U.K.
SUMMARY
1. Coenagrion mercuriale is one of Europe’s most threatened damselflies. There is concern forthe long-term persistence of many of its U.K. colonies because adult lifetime movement islimited, making isolated populations susceptible to extinction.2. Using 14 microsatellite loci we characterised levels of genetic diversity, evidence for arecent decline and the spatial genetic structure for C. mercuriale population in Wales, U.K.3. Spatial isolation is not an absolute predictor of low genetic diversity at either local orregional scales.4. One population inhabiting a remote, edge of range site is genetically impoverished withlevels of variability (at microsatellite loci) among the lowest reported for any insect species.5. Agricultural land and high ground are physical barriers to dispersal by adults.6. Consistent with work from elsewhere, movement by mature C. mercuriale inPembrokeshire is sufficient to prevent significant genetic differentiation throughout ahabitat matrix of some 3–4 km if the suitable habitat sites are <2 km apart and lack barriersto movement. Even within a good habitat matrix, however, genetic isolation by distancedevelops within 10 km.
Keywords: biodiversity, bottleneck, conservation, dispersal, population structure
Introduction
Destruction and fragmentation of habitat are major
causes of biodiversity loss [World Conservation
Monitoring Centre (WCMC), 1992]. Organisms sensi-
tive to the effects of habitat fragmentation are likely to
have some combination of low natural abundance/
high area requirement, large population fluctuations,
low intrinsic growth rate, specialised habitat require-
ments and/or poor dispersal capability (Henle et al.,
2004). Particularly by impacting upon the capability of
individuals to disperse, habitat fragmentation can
lead to a reduction in population size that will
heighten extinction risk by increasing vulnerability
to stochastic demographic changes or reducing gen-
etic diversity (Frankham, 1995; Frankham, Ballou &
Briscoe, 2002). Maintaining genetic diversity is im-
portant as it is associated with population viability
(Saccheri et al., 1998; Madsen et al., 1999; Spielman
et al., 2004a; Spielman, Brook & Frankham, 2004b) and
the evolutionary potential of a species to respond to
environmental change (Frankham et al., 2002; Reed &
Frankham, 2003; Schmitt & Hewitt, 2004). European
wetlands, which are inherently discontinuous, are
becoming increasingly patchy, largely because of
pollution, eutrophication or changes in land use. A
decline in movement among habitat patches may be
expected for many freshwater species, with the
expected consequences of genetic erosion and popula-
tion decline.
Correspondence: Phill Watts, Marine and Freshwater Biology
Research Group, The Biosciences Building, School of Biological
Sciences, Liverpool University, Crown Street, Liverpool,
L69 7ZB, U.K.
E-mail: [email protected]
Freshwater Biology (2006) 51, 193–205 doi:10.1111/j.1365-2427.2005.01478.x
! 2005 The Authors, Journal compilation ! 2005 Blackwell Publishing Ltd 193

As successful conservation of insect taxa is largely
achieved by maintaining areas of suitable habitat it is
imperative that species’ dispersal capabilities are
characterised so that an appropriate level of connec-
tivity within a habitat network can be established in
order to ameliorate the detrimental effects of frag-
mentation. Characterising dispersal can be problem-
atic for freshwater insects as many can disperse as
aquatic larvae and/or terrestrial adults. Nevertheless,
a number of studies have directly tracked dispersal of
aquatic insects (e.g. Miller, Blinn & Keim, 2002; Elliott,
2003; Petersen et al., 2004; Watts et al., 2004a). Such
direct observations, however, are likely to overlook
rare, long-distance movement events and, import-
antly, fail to inform on the successful transfer of
gametes that affect levels of diversity within popula-
tions (Slatkin, 1985). Many studies, therefore, have
used the spatial distribution of neutral genetic mark-
ers to make indirect appraisals of the dispersal
characteristics of a variety of freshwater insect taxa
(e.g. Geenen et al., 2000; Smith & Collier, 2001; Kelly,
Rundle & Bilton, 2002; Miller et al., 2002; Hughes,
Hillyer & Bunn, 2003a; Hughes et al., 2003b; Wilcock,
Nichols & Hildrew, 2003; Wishart & Hughes, 2003;
Watts et al., 2004a).
Odonates (damselflies and dragonflies) are a key
component of many freshwater ecosystems that are
generally perceived to be good fliers, potentially
capable of wide dispersal and possibly less sensitive
to habitat fragmentation than other freshwater taxa.
Numerous odonate species are declining, however,
with nearly 40% of indigenous European odonates
classified as endangered, vulnerable or rare under
IUCN red book categories (Van Tol & Verdonk, 1988).
The axiom of wide dispersal may hold for many
anisopterans (Corbet, 1999; Freeland et al., 2003) but
zygopterans are weaker fliers, with many species not
dispersing beyond several kilometres (Conrad et al.,
1999; Geenen et al., 2000; Purse et al., 2003; Watts et al.,
2004a). Thus, it is somewhat surprising that genetic
differentiation has been reported among zygopteran
populations separated by up to 100 km (Andres,
Sanchez-Guill _en & Cordero Rivera, 2000, 2002) but
not shorter distances (Geenen et al., 2000; Wong,
Smith & Forbes, 2003; but cf. Watts et al., 2004a).
This paper presents an analysis of genetic variab-
ility and population structure of an endangered
damselfly, Coenagrion mercuriale (Charpentier, 1840)
(Odonata: Zygoptera). Coenagrion mercuriale, restricted
to the south and west of Europe, is considered extinct
or on the edge of extinction in seven European
countries (Grand, 1996) and is listed in Appendix II
of the Berne Convention of 1979 (Grand, 1996), in
Appendix II of the European Community Habitat and
Species Directive of 1992 (Jackson & McLeod, 2000)
and as rare in the British Red Data Book. This species
is protected by the Wildlife and Countryside Act
(TSO, 1981) within the U.K. where, largely because of
decline/fragmentation of suitable habitat, it has suf-
fered a 30% reduction in distribution during the last
100 years (Thompson, Rouquette & Purse, 2003).
Coenagrion mercuriale is now limited to a few popula-
tions in southern England and Wales, with core sites
in the New Forest and along the River Itchen (both in
England) and in Pembrokeshire (Wales). There is
concern for the long-term persistence of C. mercuriale
because adult lifetime movement rarely exceeds 2 km
and is typically <100 m (Hunger & Roske, 2001; Purse
et al., 2003; Watts et al., 2004a), restricting (re-) colo-
nisation of suitable habitat to localities in close
proximity to extant sites. A previous study in the
Itchen Valley demonstrated that limited movement by
C. mercuriale leads to significant, local spatial genetic
structuring (Watts et al., 2004a). Here, we extend our
investigation into the population structure of C.
mercuriale to include all remaining population centres
in Wales (U.K.) that contrast with sites along the
Itchen Valley by exhibiting a greater level of spatial
isolation. In addition to exploring the pattern of
spatial genetic structure, we ask:
(i) What is the effect of habitat isolation upon
genetic diversity at local and regional scales? and
(ii) Do populations of C. mercuriale show a genetic
signature of demographic decline?
These questions are discussed with respect to the
general conservation of this species.
Methods
Description of study sites
We studied the remaining regions in Wales (Pem-
brokeshire, Gower and Anglesey) that host popula-
tions of C. mercuriale. This species does not inhabit
areas above 300 m in the U.K. (Purse, 2001) but the
Pembrokeshire populations (situated >150 m above
sea level) are at higher altitudes than other sites in
Wales (60–70 m; S. Coker, personal communication).
194 P.C. Watts et al.
! 2005 The Authors, Journal compilation ! 2005 Blackwell Publishing Ltd, Freshwater Biology, 51, 193–205

In Pembrokeshire, populations distributed in springs
on the Preseli Hills (Fig. 1) are undergoing a reduction
in size and distribution but still thought to be large
and extensive enough to be self-sustaining. Within
this area we collected samples from nine sites (Fig. 1)
that represent four of the five population centres that
have some separation by improved agricultural land;
northern [Brynberian (BRY), Clun Maen (CLM)],
eastern (not sampled), southern [Cors Tewgyll
(COT), Dolau Isaf (DOI), Gors Fawr (GOF), Pantithel
(PAN), Waun Isaf North (WAN)] and two colonies at
Waun Maes (WAM) and Waun Fawr (WAF). The
latter two sites are separated from the core areas by
relatively large distances (approximately 3 and 6 km,
respectively) and high (>300 m) ground. At 290 m in
altitude, WAM is 80–90 m higher than the other
Pembrokeshire sites and at the environmental limit of
this species (Purse, 2001). Although presently vigor-
ous, the WAF population is believed to be susceptible
to even subtle environmental changes because it is too
remote to receive migrants (Coker, 2001). All colonies
(except DOI and PAN which are on private land) in
Pembrokeshire are on common grazing land. Coenag-
rion mercuriale was presumably more widespread on
Gower but is now found at only two sites (Cefn Bryn
and Rhossili) that are separated by 7.5 km of farm-
land. At the extreme north of C. mercuriale’s U.K. (and
European) distribution and 150 km from the nearest
populations in Pembrokeshire, Nant Isaf on the island
of Anglesey represents an extremely remote site
(Fig. 1). There is concern for the small C. mercuriale
population at Anglesey because changes in the
grazing regime on this privately owned farmland
might have reduced habitat quality.
DNA extraction and polymerase chain reaction
Genomic DNA was extracted using a high salt
protocol (Sunnucks & Hales, 1996) from a tibia (stored
in a 1.5 mL tube containing 100% ethanol) for about
50 damselflies per site (Appendix). Loss of a leg does
not measurably affect fitness in damselflies (Fincke &
Hadrys, 2001) and we observed no significant effect of
sampling upon recapture rate elsewhere (D.J. Thomp-
son, unpublished data). We examined allelic variation
in 14 microsatellite loci (Appendix) characterised by
Watts, Thompson & Kemp (2004b) and Watts et al.
(2004c). Approximately 5 ng of DNA was used for a
10 lL polymerase chain reaction (PCR) containing
75 mMM Tris-HCl pH 8.9, 20 mMM (NH4)2SO4, 0.01% v/
v Tween-20, 0.2 mMM each dNTP, 3.0 mMM MgCl2,
20 pmol forward primer, 30 pmol reverse primer
and 0.25 U TAQTAQ polymerase (ABgene, Epsom, U.K.).
Thermal cycling conditions are described by Watts
et al. (2004b,c). PCR products were pooled into one of
two genotyping pools, determined by allelic size
range and the 5¢ fluorescent dye, along with a GENE-GENE-
SCANSCAN-500 LIZLIZ size standard (Applied Biosystems,
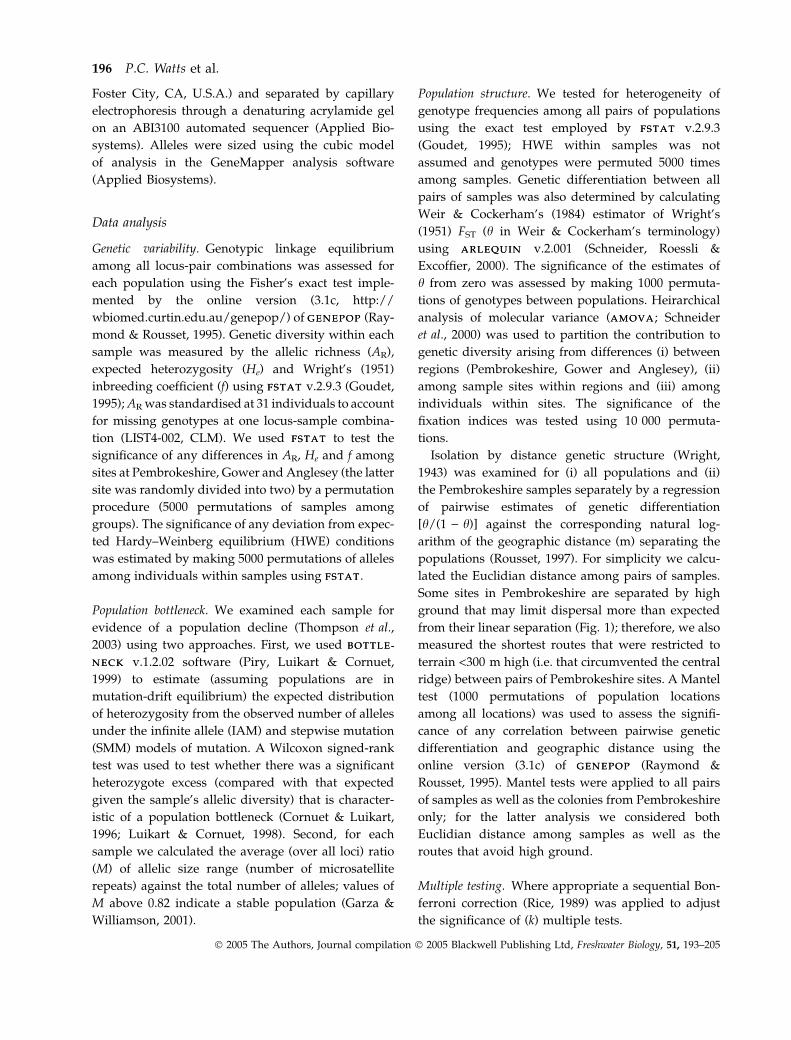
Fig. 1 Map of the location of three remaining population centres of C. mercuriale in Wales, U.K. Expanded section highlights geo-graphic location of sampled (filled circles) and unsampled (open circles) sites occupied by C. mercuriale in Pembrokeshire: northern[Brynberian (BRY), Clun Maen (CLM)], eastern (not sampled), southern [Cors Tewgyll (COT), Dolau Isaf (DOI), Gors Fawr (GOF),Pantithel (PAN), Waun Isaf North (WAN)], Waun Maes (WAM) and Waun Fawr (WAF); light grey shading indicates land >300 mhigh.
Genetic variation in an endangered damselfly 195
! 2005 The Authors, Journal compilation ! 2005 Blackwell Publishing Ltd, Freshwater Biology, 51, 193–205
Foster City, CA, U.S.A.) and separated by capillary
electrophoresis through a denaturing acrylamide gel
on an ABI3100 automated sequencer (Applied Bio-
systems). Alleles were sized using the cubic model
of analysis in the GeneMapper analysis software
(Applied Biosystems).
Data analysis
Genetic variability. Genotypic linkage equilibrium
among all locus-pair combinations was assessed for
each population using the Fisher’s exact test imple-
mented by the online version (3.1c, http://
wbiomed.curtin.edu.au/genepop/) of GENEPOPGENEPOP (Ray-
mond & Rousset, 1995). Genetic diversity within each
sample was measured by the allelic richness (AR),
expected heterozygosity (He) and Wright’s (1951)
inbreeding coefficient (f) using FSTATFSTAT v.2.9.3 (Goudet,
1995);ARwas standardised at 31 individuals to account
for missing genotypes at one locus-sample combina-
tion (LIST4-002, CLM). We used FSTATFSTAT to test the
significance of any differences in AR, He and f among
sites at Pembrokeshire, Gower and Anglesey (the latter
site was randomly divided into two) by a permutation
procedure (5000 permutations of samples among
groups). The significance of any deviation from expec-
ted Hardy–Weinberg equilibrium (HWE) conditions
was estimated by making 5000 permutations of alleles
among individuals within samples using FSTATFSTAT.
Population bottleneck. We examined each sample for
evidence of a population decline (Thompson et al.,
2003) using two approaches. First, we used BOTTLE-BOTTLE-
NECKNECK v.1.2.02 software (Piry, Luikart & Cornuet,
1999) to estimate (assuming populations are in
mutation-drift equilibrium) the expected distribution
of heterozygosity from the observed number of alleles
under the infinite allele (IAM) and stepwise mutation
(SMM) models of mutation. A Wilcoxon signed-rank
test was used to test whether there was a significant
heterozygote excess (compared with that expected
given the sample’s allelic diversity) that is character-
istic of a population bottleneck (Cornuet & Luikart,
1996; Luikart & Cornuet, 1998). Second, for each
sample we calculated the average (over all loci) ratio
(M) of allelic size range (number of microsatellite
repeats) against the total number of alleles; values of
M above 0.82 indicate a stable population (Garza &
Williamson, 2001).
Population structure. We tested for heterogeneity of
genotype frequencies among all pairs of populations
using the exact test employed by FSTATFSTAT v.2.9.3
(Goudet, 1995); HWE within samples was not
assumed and genotypes were permuted 5000 times
among samples. Genetic differentiation between all
pairs of samples was also determined by calculating
Weir & Cockerham’s (1984) estimator of Wright’s
(1951) FST (h in Weir & Cockerham’s terminology)
using ARLEQUINARLEQUIN v.2.001 (Schneider, Roessli &
Excoffier, 2000). The significance of the estimates of
h from zero was assessed by making 1000 permuta-
tions of genotypes between populations. Heirarchical
analysis of molecular variance (AMOVAAMOVA; Schneider
et al., 2000) was used to partition the contribution to
genetic diversity arising from differences (i) between
regions (Pembrokeshire, Gower and Anglesey), (ii)
among sample sites within regions and (iii) among
individuals within sites. The significance of the
fixation indices was tested using 10 000 permuta-
tions.
Isolation by distance genetic structure (Wright,
1943) was examined for (i) all populations and (ii)
the Pembrokeshire samples separately by a regression
of pairwise estimates of genetic differentiation
[h/(1 ) h)] against the corresponding natural log-
arithm of the geographic distance (m) separating the
populations (Rousset, 1997). For simplicity we calcu-
lated the Euclidian distance among pairs of samples.
Some sites in Pembrokeshire are separated by high
ground that may limit dispersal more than expected
from their linear separation (Fig. 1); therefore, we also
measured the shortest routes that were restricted to
terrain <300 m high (i.e. that circumvented the central
ridge) between pairs of Pembrokeshire sites. A Mantel
test (1000 permutations of population locations
among all locations) was used to assess the signifi-
cance of any correlation between pairwise genetic
differentiation and geographic distance using the
online version (3.1c) of GENEPOPGENEPOP (Raymond &
Rousset, 1995). Mantel tests were applied to all pairs
of samples as well as the colonies from Pembrokeshire
only; for the latter analysis we considered both
Euclidian distance among samples as well as the
routes that avoid high ground.
Multiple testing. Where appropriate a sequential Bon-
ferroni correction (Rice, 1989) was applied to adjust
the significance of (k) multiple tests.
196 P.C. Watts et al.
! 2005 The Authors, Journal compilation ! 2005 Blackwell Publishing Ltd, Freshwater Biology, 51, 193–205
Results
Genetic diversity
Because only two loci demonstrated significant link-
age disequilibrium within any sample (LIST4-035-
LIST4-066 in GOF, P < 0.05, k ! 91) all loci were
retained for subsequent genetic analyses. Individual
sample-locus results for measures of genetic diversity
are presented in Appendix. Almost all samples met
expected HWE conditions with four and one sample-
locus combination(s) having a significant (P < 0.05,
k ! 14) heterozygote deficit or excess respectively
(Appendix).
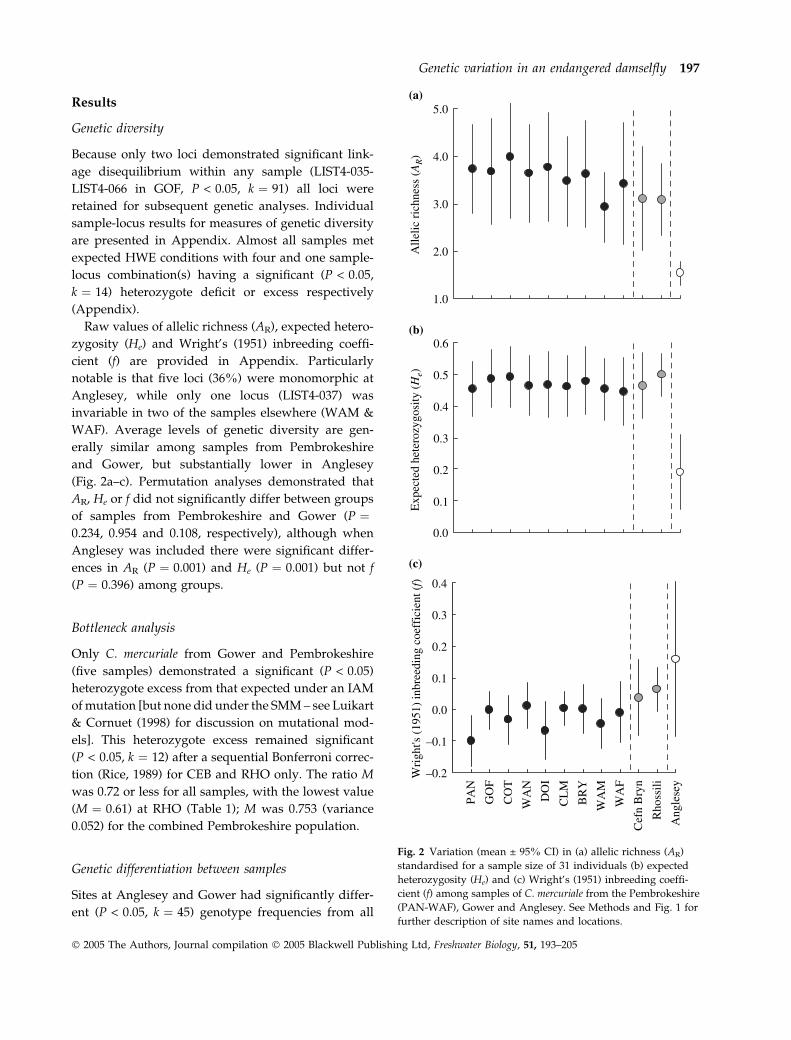
Raw values of allelic richness (AR), expected hetero-
zygosity (He) and Wright’s (1951) inbreeding coeffi-
cient (f) are provided in Appendix. Particularly
notable is that five loci (36%) were monomorphic at
Anglesey, while only one locus (LIST4-037) was
invariable in two of the samples elsewhere (WAM &
WAF). Average levels of genetic diversity are gen-
erally similar among samples from Pembrokeshire
and Gower, but substantially lower in Anglesey
(Fig. 2a–c). Permutation analyses demonstrated that
AR, He or f did not significantly differ between groups
of samples from Pembrokeshire and Gower (P !0.234, 0.954 and 0.108, respectively), although when
Anglesey was included there were significant differ-
ences in AR (P ! 0.001) and He (P ! 0.001) but not f
(P ! 0.396) among groups.
Bottleneck analysis
Only C. mercuriale from Gower and Pembrokeshire
(five samples) demonstrated a significant (P < 0.05)
heterozygote excess from that expected under an IAM
ofmutation [but none did under the SMM– see Luikart
& Cornuet (1998) for discussion on mutational mod-
els]. This heterozygote excess remained significant
(P < 0.05, k ! 12) after a sequential Bonferroni correc-
tion (Rice, 1989) for CEB and RHO only. The ratio M
was 0.72 or less for all samples, with the lowest value
(M ! 0.61) at RHO (Table 1); M was 0.753 (variance
0.052) for the combined Pembrokeshire population.
Genetic differentiation between samples
Sites at Anglesey and Gower had significantly differ-
ent (P < 0.05, k ! 45) genotype frequencies from all
1.0
2.0
3.0
4.0
5.0(a)
Alle
lic ri
chne
ss (A
R)
0.0
0.1
0.2
0.3
0.4
0.5
0.6(b)
Exp
ecte
d he
tero
zygo
sity
(He)
–0.2
–0.1
0.0
0.1
0.2
0.3
0.4
PAN
GO
F
CO
T
WA
N
DO
I
CL
M
BR
Y
WA
M
WA
F
Cef
n B
ryn
Rho
ssili
Ang
lese
y
(c)
Wri
ght's
(195
1) in
bree
ding
coe
ffic
ient
(f)
Fig. 2 Variation (mean ± 95% CI) in (a) allelic richness (AR)standardised for a sample size of 31 individuals (b) expectedheterozygosity (He) and (c) Wright’s (1951) inbreeding coeffi-cient (f) among samples of C. mercuriale from the Pembrokeshire(PAN-WAF), Gower and Anglesey. See Methods and Fig. 1 forfurther description of site names and locations.
Genetic variation in an endangered damselfly 197
! 2005 The Authors, Journal compilation ! 2005 Blackwell Publishing Ltd, Freshwater Biology, 51, 193–205

other samples (Table 1). Among populations from
Pembrokeshire, there was significant (P < 0.05, k !66) heterogeneity in genotype frequency between
samples separated by the central hill ridge (except
between GOF and CLM) and also among all four
northern sites. The southern Pembrokeshire samples
were mostly similar, with significant (P < 0.05, k !66) genotype differences between PAN and GOF, and
PAN and WAN only (Table 1).
All pairwise estimates of genetic differentiation (h)between either Anglesey and the Gower sites and all
other samples were significantly (P < 0.05, k ! 66)
different from zero, with comparisons involving
Anglesey notably high (h ! 0.35–0.44). Genetic differ-
entiation among the southern Pembrokeshire samples
was either low (h ! 0.016 and 0.018, PAN-COT and
PAN-WAN, respectively, P < 0.05, k ! 66) or non-
significant (P > 0.05, k ! 66). With the exception of
two comparisons involving CLM, all northern Pem-
brokeshire samples were significantly dissimilar to all
other samples from Pembrokeshire irrespective of
their geographic location. Estimates of h between
WAM and other samples from Pembrokeshire are
relatively large compared with h between other pairs
of samples from this area. Likewise, h between the
Gower colonies is also greater than that generally
observed between similarly spaced sites in Pembroke-
shire (Table 2). Hierarchical AMOVAAMOVA revealed signifi-
cant (P > 0.05) genetic structure at all levels but with
almost all variance (>97%) attributed to differences
within samples and among regions (Table 3).
There is a significant pattern of genetic isolation by
distance at a broad scale between all of the samples
(y ! 0.120x ) 0.974, P ! 0.0002, r2 ! 0.63) and also
locally among the Pembrokeshire samples (Fig. 3). For
the latter samples, although there is a positive and
significant regression between genetic differentiation
[h/(1 ) h)] and Euclidian distance (ln m) between
samples (y ! 0.013x ) 0.077, P ! 0.016, r2 ! 0.24) the
fit of this relationship (y ! 0.014x ) 0.087, P ! 0.003,
Table 1 Results of bottleneck analysis for samples of C. mercu-riale from Pembrokeshire, Gower and Anglesey (see Methodsand Fig. 1 for full sample site names and their location)
Region Population
Bottleneck M
IAM SMM Mean Variance
Pembrokeshire PAN 0.2508 0.9406 0.6549 0.0733GOF 0.0209 0.8794 0.6760 0.0630COT 0.0338 0.4758 0.6694 0.0758WAN 0.0595 0.8917 0.6542 0.0653DOI 0.0863 0.9031 0.6404 0.0545CLM 0.0101 0.5961 0.6695 0.0578BRY 0.0209 0.7869 0.6328 0.0564WAM 0.0090 0.2367 0.6182 0.0837WAF 0.1082 0.4197 0.6378 0.0733
Gower Cefn Bryn 0.0003* 0.1955 0.7245 0.0820Rhossili 0.0017* 0.3129 0.6120 0.0862
Anglesey 0.0645 0.1250 0.7000 0.0620
Bottleneck: *indicates a significant (P < 0.05, k ! 12) heterozy-gote excess for microsatellite loci under infinite allele (IAM) andstepwise (SMM) models of mutation.M: ratio of allelic size range (number of microsatellite repeats)against the total number of alleles.
Table 2 Genetic differentiation among samples of C. mercuriale from Pembrokeshire, Gower and Anglesey; see Methods and Fig. 1 forfull sample site names and their location. Exact probability of genotypic differentiation between samples (below diagonal) andpairwise estimates of genetic differentiation (h) (above diagonal).
Pembrokeshire Gower
AngleseyPAN GOF COT WAN DOI CLM BRY WAM WAF Cefn Bryn Rhossili
PAN 0.0112 0.0158* 0.0178* 0.0144 0.0302* 0.0410* 0.0764* 0.0349* 0.1521* 0.1531* 0.4014*GOF 0.00076* 0.0031 0.0022 0.0070 0.0146 0.0229* 0.0678* 0.0212* 0.1137* 0.1293* 0.4055*COT 0.00379 0.18485 0.0076 0.0096 0.0140 0.0293* 0.0657* 0.0282* 0.1511* 0.1564* 0.4149*WAN 0.00076* 0.02121 0.02348 0.0059 0.0165* 0.0250* 0.0653* 0.0339* 0.1383* 0.1514* 0.4262*DOI 0.00152 0.01136 0.02500 0.02803 0.0155* 0.0191* 0.0456* 0.0224* 0.1270* 0.1462* 0.4037*CLM 0.00076* 0.00152 0.00076* 0.00076* 0.00076* 0.0180* 0.0604* 0.0105 0.1523* 0.1662* 0.4244*BRY 0.00076* 0.00076* 0.00076* 0.00076* 0.00076* 0.00076* 0.0336* 0.0187* 0.1489* 0.1491* 0.4076*WAM 0.00076* 0.00076* 0.00076* 0.00076* 0.00076* 0.00076* 0.00076* 0.0558* 0.1834* 0.1913* 0.3482*WAF 0.00076* 0.00076* 0.00076* 0.00076* 0.00076* 0.00076* 0.00076* 0.00076* 0.1383* 0.1521* 0.4123*Cefn Bryn 0.00076* 0.00076* 0.00076* 0.00076* 0.00076* 0.00076* 0.00076* 0.00076* 0.00076* 0.0844* 0.4844*Rhossili 0.00076* 0.00076* 0.00076* 0.00076* 0.00076* 0.00076* 0.00076* 0.00076* 0.00076* 0.00076* 0.4425*Anglesey 0.00076* 0.00076* 0.00076* 0.00076* 0.00076* 0.00076* 0.00076* 0.00076* 0.00076* 0.00076* 0.00076*
*Indicates a significant (P < 0.05, k ! 45) genetic difference between populations.
198 P.C. Watts et al.
! 2005 The Authors, Journal compilation ! 2005 Blackwell Publishing Ltd, Freshwater Biology, 51, 193–205

r2 ! 0.36) is improved if the distance measured
between sites is restricted to a route below 300 m
altitude.
Discussion
Molecular genetic studies have provided detailed
insights into factors affecting the spatial genetic
structure of aquatic insects (e.g. Geenen et al., 2000;
Smith & Collier, 2001; Kelly et al., 2002; Miller et al.,
2002; Hughes et al., 2003a,b; Wilcock et al., 2003;
Wishart & Hughes, 2003; Watts et al., 2004a). How-
ever, most studies focus on dispersal rather than
processes affecting levels of genetic variability, de-
spite an increasing recognition that conservation
strategies should prevent or minimise genetic erosion
and if possible restore background levels of variability
(Couvet, 2002; Frankham et al., 2002). In this study the
large Pembrokeshire populations are the most gen-
etically diverse, although somewhat surprisingly the
smaller, separate Gower colonies have resisted sub-
stantial genetic erosion. The contrast in levels of
diversity at these sites with that observed at Anglesey
(Fig. 2a,b) may be attributed to one or a combination
of several causes.
Impact of habitat isolation and population decline
Anglesey, some 150 km north from Pembrokeshire
(Fig. 1) and probably a remnant from when C.
mercuriale extended along the lowland coastal areas
of Wales, meets several (not mutually exclusive)
criteria associated with genetically depauperate insect
populations: isolated (Keller & Largiader, 2003; Wil-
liams, Brawn & Paige, 2003; Krauss et al., 2004), small
size (Schmitt & Seitz, 2002; Harper, MacLean &
Goulson, 2003; Joyce & Pullin, 2003) and/or at the
edge of a species’ range (Schmitt & Hewitt, 2004). The
contrast in diversity at the isolated sites of Anglesey
and Gower underlines the point that genetic impov-
erishment is not simply an unavoidable consequence
of habitat fragmentation but rather reflects the effect
of population size upon the rate of genetic drift (see
Frankham, 1996; Frankham et al., 2002). For example,
using the relationship:
Ht ! Ho"1# 1=2Ne$t
0.0
0.2
0.4
0.6
0.8
1.0
6 7 8 9 10 11 12 13Geographic distance (m)
Gen
etic
dif
fere
ntia
tion
[q/(
1–q)
]
Pembrokeshire samples only
Fig. 3 Relationship between geographicdistance (ln m) separating samples of C.mercuriale from Pembrokeshire, Gowerand Anglesey and the correspondingestimate of pairwise genetic differenti-ation as defined by [h/(1 ) h)]. Expandedplot of the Pembrokeshire samples in thedashed frame highlights the isolation bydistance relationship at this site.
Table 3 Hierarchical analysis of molecular variance (AMOVAAMOVA)of microsatellite loci among samples of C. mercuriale from threeregions in Wales, U.K.: Pembrokeshire, Gower and Anglesey
Source ofvariation
Fixationindex P-value
Percentagevariation
Among regions 0.2343 0.0012 20.96Among sampleswithin regions
0.0312 0.0000 2.47
Within samples 0.2097 0.0000 76.57
P ! probability of a more extreme variance component than thatobserved.
Genetic variation in an endangered damselfly 199
! 2005 The Authors, Journal compilation ! 2005 Blackwell Publishing Ltd, Freshwater Biology, 51, 193–205

where Ht ! expected heterozygosity after t genera-
tions, Ho ! initial expected heterozygosity and Ne !effective population size (Crow & Kimura, 1970), the
present level of expected heterozygosity at Anglesey
(from an initial Ht ! 0.5) is equivalent to Ne ! 10 or
1000 for about 20 or 1900 generations, respectively. It
may seem remarkable that there is no evidence for a
bottleneck at Anglesey but this is consistent with the
poor statistical power of (i) the ratio test when the
starting population size is small and (ii) both tests
with increasing time following the bottleneck (Luikart
& Cornuet, 1998; Garza & Williamson, 2001). A useful
feature of the ratio test, however, is that allelic
diversity remains low in permanently reduced popu-
lations, although the value of M partially recovers
(Garza & Williamson, 2001). The Anglesey colony
evidently suffered a severe reduction in size. While
the colony at Anglesey may have been founded by
one/few gravid females (see e.g. Joyce & Pullin, 2003
for genetic diversity in an introduced, isolated
population of Euphydryas aurinia Rott.) this is unlikely
given this species’ poor dispersal capability (Hunger
& Roske, 2001; Purse et al., 2003; Watts et al., 2004a).
Adaptation to an extreme, edge of range environment
may further contribute to the low genetic diversity at
Anglesey, but the consistency across loci suggests that
genome-wide drift is the principal cause.
Also in contrast to expectations were the similar
levels of genetic diversity at Pembrokeshire and
Gower. Similarly, Monaghan et al. (2002) found no
effect of fragmentation on the genetic diversity of
stream insects because population sizes were large
enough to minimise the rate of genetic drift and/or
there is gene flowamong populations. TheGower sites,
50 kmsouth of thePembrokeshire colonies, are likely to
have been isolated for a shorter duration thanAnglesey
and may have experienced more recent immigration
(contemporary gene flow to the Gower is unlikely, see
below) and/or historically maintained larger effective
population sizes. The genetic signature of recent
population decline correspondswith qualitative obser-
vations of a reduction in distribution of C. mercuriale at
Gower (D.J. Thompson, personal observations) that
will accelerate a reduction in gene diversity.
Within Pembrokeshire, localised differences in gen-
etic variability are indicative of fine-scale variation in
demography that is typical of many insect populations
(e.g. Schmitt & Seitz, 2002; Wynne et al., 2003). Of note
is the likely recent decline in size at WAM (cf. Table 1)
and concurrent reduction in AR (it is possible that low
diversity reflects a selective response to altitude); any
loss of variability at WAM will be sustained by
restricted immigration (see below). By contrast, the
level of variability at WAF further highlights the point
that the rate of genetic drift in large populations is
generally low, such that substantial levels of diversity
may be retained even when a population is isolated
(see also Keller, Nentwig & Largiader, 2004). Else-
where in Pembrokeshire, connectivity between the
southern, eastern and northern populations may
buffer individual colonies against genetic erosion
associated with demographic fluctuations.
Population genetic structure and movement among sites
The substantial level of genetic differentiation that may
be attributed to differences among regions (Table 3;
Fig. 3) undoubtedly corresponds to breaks in distribu-
tion that far outreachC.mercuriale’s dispersal capability
(Hunger & Roske, 2001; Purse et al., 2003; Watts et al.,
2004a). The pattern of genetic differentiation among
populations with distance, however, provides more
insight into processes affecting population structure
(Miller et al., 2002). Weak and/or variable regional
genetic differences and absence of isolation by distance
that have been reported for some aquatic insects are
indicative of, for example, wide dispersal, genetic
disequilibrium, balancing selection or poor marker
resolution (e.g. Smith &Collier, 2001;Miller et al., 2002;
Monaghan et al., 2002;Hughes et al., 2003b). In contrast,
an apparent pattern of isolation by distance (Fig. 3) is a
feature of restricted dispersal and relatively small
populations that facilitates rapid population-differen-
tiation through genetic drift (see also Miller et al., 2002;
Wilcock et al., 2003).
At a local scale, genetic differentiation between
the Gower sites is greater than that observed
between similarly spaced sites in continuously
distributed C. mercuriale populations (Table 2; Watts
et al., 2004a) indicating that dispersal is disrupted by
agricultural improvement. Indeed, restricted gene
flow has been associated with anthropogenic chan-
ges to habitat for several terrestrial (Keller &
Largiader, 2003; Williams et al., 2003; Keller et al.,
2004) and aquatic insects (Smith & Collier, 2001;
Watts et al., 2004a). Similarly, the improved fit of the
regression based on movement among sites within
Pembrokeshire that avoids high ground corresponds
200 P.C. Watts et al.
! 2005 The Authors, Journal compilation ! 2005 Blackwell Publishing Ltd, Freshwater Biology, 51, 193–205

with observations that, like many freshwater insects
(e.g. Petersen et al., 2004), adult C. mercuriale move
exclusively between areas of suitable habitat (Purse
et al., 2003); the hill ridge is a natural barrier to
dispersal (see also Wishart & Hughes, 2003). Low or
non-significant genetic differences among adjacent
areas in Pembrokeshire (Table 2) indicate dispersal
by C. mercuriale over 1–2 km, although this does not
prevent genetic isolation by distance (see Fig. 3,
insert). Increased genetic differentiation at WAM
(Table 2) is a likely consequence of isolation by high
ground, but directional selection or drift during the
recent demographic reduction may also accentuate
genetic differences between this site and elsewhere
(see Hedrick, Gutierrez-Espeleta & Lee, 2001).
Variable but often low genetic differences between
the central sites and WAF do not indicate con-
nectivity, but reflect a historical genetic signature
with the large WAF population not yet achieving
migration-drift equilibrium since its isolation.
Neither Geenen et al. (2000) or Wong et al. (2003)
identified fine-scale genetic structure in other spe-
cies of zygopteran but the pattern and magnitude of
local genetic differences in Pembrokeshire parallels
that observed for this species in the Itchen Valley
(Watts et al., 2004a).
Implications for conservation
Population size is an important correlate of extinction
risk (O’Grady et al., 2004) and, accordingly, the
current U.K. strategy for C. mercuriale conservation is
based upon habitat protection to maintain large
populations. However, even apparently healthy pop-
ulations can be at long-term risk if they lack genetic
diversity (Saccheri et al., 1998; Frankham et al., 2002;
Keller & Waller, 2002; Reed & Frankham, 2003;
Schmitt & Hewitt, 2004; Spielman et al., 2004a,b).
Improving connectivity among fragmented popula-
tions will help maintain/restore genetic diversity and
preserve evolutionary patterns and processes (Moritz,
1999): such a strategy is not possible between regions
but is generally appropriate within each area, especi-
ally the Gower sites. Somewhat ironically, the histor-
ical lack of management (agricultural improvement)
imposed by its common land status has helped limit
genetic erosion in the Pembrokeshire, although a
recent decline in sheep grazing has unfortunately
reduced habitat quality. It is relevant, therefore, that
M < 0.68, characteristic of each Pembrokeshire sam-
ple, is symptomatic of a recent reduction in popula-
tion size (Garza & Williamson, 2001); even when
genotype data for all Pembrokeshire sites are com-
bined to constitute a single population the calculated
value of M ! 0.75 is still below that observed in
demographically stable populations (M ! 0.82, Garza
& Williamson, 2001). Data on levels of genetic
variability in C. mercuriale populations towards the
centre of its range would provide further context to
the variation observed in Pembrokeshire and Gower.
Some combination of habitat isolation, small popula-
tion size and/or directional selection has lead to
localised reduction in genetic variability at WAM and
a striking level of genetic impoverishment at Anglesey
that is more typical of threatened mammal (e.g.
Hedrick et al., 2001; Whitehouse & Harley, 2001; Jones
et al., 2004) than fragmented insect (e.g. Keller &
Largiader, 2003; Williams et al., 2003; Keller et al.,
2004) populations. There is particular concern for
C. mercuriale at Anglesey which may be (i) locally
adapted and/or (ii) likely to suffer as a result of no
immigration (see Couvet, 2002; Keller & Waller, 2002),
for example, from inbreeding depression (Saccheri
et al., 1998) or increased susceptibility to disease
(Spielman et al., 2004b). The former implies that there
should be focus on habitatmanagementwhile the latter
suggests that the population may benefit from aug-
mentation (e.g. Madsen et al., 1999). Because we have
not yet addressed either scenario it would be unwise to
suggest augmentation (see Moritz, 1999; Stockwell,
Hendry & Kinnison, 2003). It is interesting to note that,
if the decision was taken for management plans to
prioritise the conservation of genetic diversity per se, for
example to allow future evolutionary processes, rather
than current adaptive novelties (seeMoritz, 1999), then
any effort directed towardsmanaging theAnglesey site
should perhaps be diminished and efforts focused on
the larger populations in Pembrokeshire and
Hampshire.
To conclude, populations of C. mercuriale exhibit
local and regional variation in levels of genetic
diversity that is associated with their population
demographics. Rather than directly eliciting a loss of
variation, habitat fragmentation reinforces genetic
impoverishment in small populations by preventing
augmentation via gene flow. Consistent with the
pattern of spatial genetic structure from elsewhere in
the U.K., dispersal by mature C. mercuriale in Pem-
Genetic variation in an endangered damselfly 201
! 2005 The Authors, Journal compilation ! 2005 Blackwell Publishing Ltd, Freshwater Biology, 51, 193–205

brokeshire is sufficient to prevent significant genetic
differentiation throughout a habitat matrix of about
3–4 km if the sites are <2 km apart and lack
intervening barriers. Nevertheless, dispersal by
C. mercuriale is sufficiently restricted so that isolation
by distance genetic structure develops within 10 km.
Acknowledgments
Coenagrion mercuriale is a protected species under
Schedule 5 of the Wildlife and Countryside Act (1981).
All work was carried out under licence from the
Countryside Council for Wales. We are grateful to the
NERC (grant no. NER/A/S/2000/01322) for provi-
sion of funds and the landowners for allowing us
access to their land. Stephen Coker and Adrian
Fowles provided helpful comments on the manu-
script. Jac Pearson, Sarah Perry, Carri Westgarth and
Kerry Woodbine were excellent field assistants.
References
Andres R.A., Sanchez-Guill _en R.A. & Cordero Rivera A.(2000) Molecular evidence for selection on female colorpolymorphism in the damselfly Ischnura graellsii.Evolution, 54, 2156–2161.
Andres R.A., Sanchez-Guill _en R.A. & Cordero Rivera A.(2002) Evolution of female color polymorphism indamselflies: testing the hypotheses. Animal Behaviour,63, 677–685.
Coker S. (2001) A Long-Term Plan for Coenagrion mercurialein North-East Pembrokeshire. Report published privatelyby author, 8 pp.
Conrad K.F., Willson K.H., Harvey I.F., Thomas C.J. &Sherratt T.N. (1999) Dispersal characteristics of sevenodonate species in an agricultural landscape. Ecogra-phy, 22, 524–531.
Corbet P.S. (1999) Dragonflies: Behaviour and Ecology ofOdonata. Harley Books, Colchester.
Cornuet J.M. & Luikart G. (1996) Description and poweranalysis of two tests for detecting recent populationbottlenecks from allele frequency data. Genetics, 144,2001–2014.
Couvet D. (2002) Deleterious effects of restricted geneflow in fragmented populations. Conservation Biology,16, 369–376.
Crow J.F. & Kimura M. (1970) An Introduction toPopulation Genetics Theory. Harper & Row, New York.
Elliott J.M. (2003) A comparative study of the dispersal of10 species of stream invertebrates. Freshwater Biology,48, 1652–1668.
Fincke O.M. & Hadrys H. (2001) Unpredictable offspringsurvivorship in the damselfly, Megaloprepus coerulatus,shapes parental behavior, constrains sexual selection,and challenges traditional fitness estimates. Evolution,55, 762–772.
Frankham R. (1995) Conservation genetics. Annual Re-views in Genetics, 29, 305–327.
Frankham R. (1996) Relationship of genetic variation topopulation size in wildlife. Conservation Biology, 10,1500–1508.
Frankham R., Ballou J.D. & Briscoe D.A. (2002) Introduc-tion to Conservation Genetics. Cambridge UniversityPress, Cambridge.
Freeland J.R., May M., Lodge R.L. & Conrad K.F. (2003)Genetic diversity and widespread haplotypes in amigratory dragonfly, the common green darner Anaxjunius. Ecological Entomology, 28, 413–421.
Garza J.C. & Williamson E.G. (2001) Detection ofreduction in population size using data from micro-satellite loci. Molecular Ecology, 10, 305–318.
Geenen S., Jordaens K., de Block M., Stoks R. & de BruynL. (2000) Genetic differentiation and dispersal amongpopulations of the damselfly Lestes viridis (Odonata).Journal of the North American Benthological Society, 19,321–328.
Goudet J. (1995) FSTATFSTAT (vers. 1.2): a computer program tocalculate F-statistics. Journal of Heredity, 86, 485–486.
Grand D. (1996) Coenagrion mercuriale (Charpentier,1840). In: Background Information on Invertebrates of theHabitats Directive and the Bern Convention – Part II:Mantodea, Odonata, Orthoptera, and Arachnida, Vol. 80(Eds P.J. van Helsdingen, L. Willemse & M.C.D.Speight ), Council of Europe Publishing, Strasbourg.
Harper G.L., MacLean N. & Goulson D. (2003) Micro-satellite markers to assess the influence of populationsize, isolation and demographic change on the geneticstructure of the UK butterfly Polyommatus bellargus.Molecular Ecology, 12, 3349–3357.
Hedrick P.W., Gutierrez-Espeleta G.A. & Lee R.N. (2001)Founder effect in an island population of bighornsheep. Molecular Ecology, 10, 851–857.
Henle K., Davies K.F., Kleyer M., Margules C. & Settele J.(2004) Predictors of species sensitivity to fragmenta-tion. Biodiversity and Conservation, 1, 207–251.
Hughes J.M., Hillyer M. & Bunn S.E. (2003a) Small-scalepatterns of genetic variation in the mayfly Bungonanarilla (Ephemeroptera: Baetidae) in rainforest streams,south-east Queensland. Freshwater Biology, 48, 709–717.
Hughes J.M., Mather P.B., Hillyer M.J., Cleary C. &Peckarsky B. (2003b) Genetic structure in a montanemayfly Baetis bicaudatus (Ephemeroptera: Baetidae),from the Rocky Mountains, Colorado. FreshwaterBiology, 48, 2149–2162.
202 P.C. Watts et al.
! 2005 The Authors, Journal compilation ! 2005 Blackwell Publishing Ltd, Freshwater Biology, 51, 193–205

Hunger H. & Roske W. (2001) Short-range dispersal ofthe southern damselfly (Coenagrion mercuriale: Odo-nata) defined experimentally using UV fluorescent ink.Zeitschrift fur Okologie und Naturshutz, 9, 181–187.
Jackson D.L. & McLeod C.R. (2000) Handbook on the UKstatus of EC Habitats Directive interest features:provisional data on the UK distribution and extent ofAnnex I habitats and the UK distribution and popula-tion size of Annex II species. JNCC Report 312, 180 pp.,Peterborough, U.K.
Jones M.E., Paetkau D., Geffen E. & Moritz C. (2004)Genetic diversity and population structure of Tasma-nian devils, the largest marsupial carnivore. MolecularEcology, 13, 2197–2209.
Joyce D.A. & Pullin A.S. (2003) Conservation implica-tions of the distribution of genetic diversity at differentscales: a case study using the marsh fritillary butterfly(Euphydryas aurinia). Biological Conservation, 114, 453–461.
Keller I. & Largiader C.R. (2003) Recent habitat fragmen-tation due to major roads leads to reduction of geneflow and loss of genetic variability in ground beetles.Proceedings of the Royal Society of London, Series B, 270,417–423.
Keller L.F & Waller D.M. (2002) Inbreeding effects inwild populations. Trends in Ecology and Evolution, 17,230–241.
Keller I., Nentwig W. & Largiader C.R. (2004) Recenthabitat fragmentation due to roads can lead to signi-ficant genetic differentiation in an abundant flightlessground beetle. Molecular Ecology, 13, 2983–2994.
Kelly L.C., Rundle S.D. & Bilton D.T. (2002) Geneticpopulation structure and dispersal in Atlantic Islandcaddisflies. Freshwater Biology, 47, 1642–1650.
Krauss J., Schmitt T., Seitz A., Steffan-Dewenter I. &Tscharntke T. (2004) Effects of habitat fragmentationon the genetic structure of the monophagous butterflyPolyommatus coridon along its northern range margin.Molecular Ecology, 13, 311–320.
Luikart G. & Cornuet J.-M. (1998) Empirical evaluation ofa test for identifying recently bottlenecked populationsfrom allele frequency data. Conservation Biology, 12,228–237.
Madsen T., Shine R., Olsson M. & Wittzell H. (1999)Conservation biology – restoration of an inbred adderpopulation. Nature, 402, 34–35.
Miller M.P., Blinn D.W. & Keim P. (2002) Correlationsbetween observed dispersal capabilities and patternsof genetic differentiation in populations of four aquaticinsect species from the Arizona Mountains, U.S.A.Freshwater Biology, 47, 1660–1673.
Monaghan M.T., Spaak P., Robinson C.T. & Ward J.(2002) Population genetic structure of 3 alpine stream
insects: influences of gene flow, demographics, andhabitat fragmentation. Journal of the North AmericanBenthological Society, 21, 114–131.
Moritz C. (1999) Conservation units and translocations:strategies for conserving evolutionary processes. He-reditas, 130, 217–228.
O’Grady J.J., Reed D.H., Brook B.W. & Frankham R.(2004) What are the best correlates of predictedextinction risk? Biological Conservation, 118, 513–520.
Petersen I., Masters Z., Hildrew A.G. & Ormerod S.J.(2004) Dispersal of aquatic insects in catchments ofdiffering landuse. Journal of Applied Ecology, 41, 934–950.
Piry S., Luikart G. & Cornuet J.-M. (1999) BOTTLENECKBOTTLENECK.A Program for Detecting Recent Effective PopulationSize Reductions from Allele Frequency Data. http://www.ensam.inra.fr/URLB.
Purse B.V. (2001) The Ecology and Conservation of theSouthern Damselfly (Coenagrion mercuriale). PhDthesis, University of Liverpool, Liverpool.
Purse B.V., Hopkins G.W., Day K.J. & Thompson D.J.(2003) Dispersal characteristics and management of arare damselfly. Journal of Applied Ecology, 40, 716–728.
Raymond M. & Rousset F. (1995) GENEPOP, Version 1.2.Population genetics software for exact tests andecumenicisms. Journal of Heredity, 86, 248–249.
Reed D.H. & Frankham R. (2003) Fitness is correlatedwith genetic diversity. Conservation Biology, 17, 1–9.
Rice W.R. (1989) Analyzing tables of statistical tests.Evolution, 43, 223–225.
Rousset F. (1997) Genetic differentiation and estimationof gene flow from F-statistics under isolation bydistance. Genetics, 145, 1219–1228.
Saccheri I.J., Kuussaari M., Kankare M., Vikman P.,Fortelius W. & Hanski I. (1998) Inbreeding andextinction in a butterfly metapopulation. Nature, 392,491–494.
Schmitt T. & Hewitt G.M. (2004) The genetic pattern ofpopulation threat and loss: a case study of butterflies.Molecular Ecology, 13, 21–31.
Schmitt T. & Seitz A. (2002) Influence of habitatfragmentation on the genetic structure of Polyommatuscoridon (Lepidoptera: Lycaenidae): implications forconservation. Biological Conservation, 107, 291–297.
Schneider S., Roessli D. & Excoffier C. (2000) ArlequinVersion 2000, Genetics and Biometry. University ofGeneva, Switzerland.
Slatkin M. (1985) Gene flow in natural populations.Annual Review of Ecology and Systematics, 16, 393–430.
Smith P.J. & Collier K.J. (2001) Allozyme diversity andpopulation genetic structure of the caddisfly Orthop-syche fimbriata and the mayfly Acanthophlebia cruentatain New Zealand streams. Freshwater Biology, 46, 795–805.
Genetic variation in an endangered damselfly 203
! 2005 The Authors, Journal compilation ! 2005 Blackwell Publishing Ltd, Freshwater Biology, 51, 193–205

Spielman D., Brook B.W. & Frankham R. (2004b) Mostspecies are not driven to extinction before geneticfactors impact them. Proceedings of the National Academyof Sciences, USA, 101, 15261–25264.
Spielman D., Brook B.W., Briscoe B.W. & Frankham R.(2004a) Does inbreeding and a loss of genetic diversitydecrease disease resistance? Conservation Genetics, 5,439–448.
Stockwell C.A., Hendry A.P. & Kinnison M.T. (2003)Contemporary evolution meets conservation biology.Trends in Ecology and Evolution, 18, 94–101.
Sunnucks P. & Hales D.F. (1996) Numerous transposedsequences of mitochondrial cytochrome oxidase I-II inaphids of the genus Sitobion (Hemiptera: Aphididae).Molecular Biology and Evolution, 13, 510–524.
Thompson D.J., Rouquette J.R. & Purse B.V. (2003)Ecology of the Southern Damselfly, Coenagrion mercuriale.Conserving Natura 2000 Rivers Ecology Series No.8.English Nature, Peterborough.
TSO (1981) Wildlife and Countryside Act. The StationaryOffice (TSO), House of Commons, 128 pp., London,U.K.
Van Tol J. & Verdonk M.J. (1988) Protection of Dragonfliesand Their Biotopes. Nature and Environment Series.Council of Europe, Strasburg.
Watts P.C., Thompson D.J. & Kemp S.J. (2004b) Cross-species amplification of microsatellite loci in someEuropean zygopteran species (Odonata: Coenagrioni-dae). International Journal of Odonatology, 7, 87–96.
Watts P.C., Rouquette J.R., Saccheri I.J., Kemp S.J. &Thompson D.J. (2004a) Molecular and ecologicalevidence for small-scale isolation by distance in anendangered damselfly, Coenagrion mercuriale. MolecularEcology, 13, 2931–2945.
Watts P.C., Wu J.H., Westgarth C., Thompson D.J. &Kemp S.J. (2004c) A panel of microsatellite loci for theSouthern Damselfly, Coenagrion mercuriale (Odonata:Coenagrionidae). Conservation Genetics, 5, 117–119.
Weir B.S. & Cockerham C.C. (1984) Estimating F-statistics for the analysis of population structure.Evolution, 38, 1358–1370.
Whitehouse A.M. & Harley E.H. (2001) Post-bottleneckgenetic diversity of elephant populations in SouthAfrica, revealed using microsatellite analysis. Molecu-lar Ecology, 10, 2139–2149.
Wilcock H.R., Nichols R.A. & Hildrew A.G. (2003)Genetic population structure and neighbourhoodpopulation size estimates of the caddisfly Plectrocnemiaconspersa. Freshwater Biology, 48, 1813–1824.
Williams B.L., Brawn J.D. & Paige K.N. (2003) Landscapescale genetic effects of habitat fragmentation on a highgene flow species: Speyeria idalia (Nymphalidae).Molecular Ecology, 12, 11–20.
Wishart M.J. & Hughes J.M. (2003) Genetic populationstructure of the net-winged midge, Elporia barnardi(Diptera: Blephariceridae) in streams of the south-western Cape, South Africa: implications for dispersal.Freshwater Biology, 48, 28–38.
Wong A., Smith M.L. & Forbes M.R. (2003) Differentia-tion between subpopulations of a polychromaticdamselfly with respect to morph frequencies, but notneutral genetic markers. Molecular Ecology, 12, 3505–3513.
World Conservation Monitoring Centre (WCMC) (1992)Global Biodiversity: Status of the Earth’s Living Resources.Chapman and Hall, London.
Wright S. (1943) Isolationbydistance.Genetics, 28, 114–138.Wright S. (1951) The genetical structure of populations.Annals of Eugenics, 15, 323–354.
Wynne I.R., Loxdale H.D., Brookes C.P. & Woiwod I.P.(2003) Genetic structure of fragmented November moth(Lepidoptera: Geometridae) populations in farmland.Biological Journal of the Linnean Society, 78, 467–477.
(Manuscript accepted 29 September 2005)
Appendix Genetic diversity at 14 microsatellite loci for samples of C. mercuriale from the Pembrokeshire (PAN–WAF), Gower andAnglesey (see Methods and Fig. 1 for full sample site names and their location
Pembrokeshire Gower
Anglesey(n ! 52)
PAN(n ! 48)
GOF(n ! 48)
COT(n ! 48)
WAN(n ! 48)
DOI(n ! 48)
CLM(n ! 48)
BRY(n ! 47)
WAM(n ! 48)
WAF(n ! 48)
Cefn Bryn(n ! 48)
Rhossili(n ! 48)
4–002AR 2.000 2.000 2.000 2.000 2.000 2.000 2.000 2.000 2.000 2.000 2.000 1.000He 0.479 0.491 0.443 0.505 0.506 0.508 0.437 0.389 0.502 0.506 0.505 0.000f )0.001 )0.018 0.295 0.052 0.126 0.224 0.054 )0.017 0.103 0.012 )0.053 –
4–023AR 4.272 3.494 2.997 2.992 3.955 3.649 3.401 2.438 2.880 3.437 3.000 1.656He 0.555 0.573 0.584 0.573 0.615 0.573 0.546 0.514 0.540 0.564 0.627 0.039f 0.078 0.128 )0.263 0.009 0.081 )0.113 0.061 )0.136 0.074 )0.035 )0.097 1.000
204 P.C. Watts et al.
! 2005 The Authors, Journal compilation ! 2005 Blackwell Publishing Ltd, Freshwater Biology, 51, 193–205

Appendix (Continued)
Pembrokeshire Gower
Anglesey(n ! 52)
PAN(n ! 48)
GOF(n ! 48)
COT(n ! 48)
WAN(n ! 48)
DOI(n ! 48)
CLM(n ! 48)
BRY(n ! 47)
WAM(n ! 48)
WAF(n ! 48)
Cefn Bryn(n ! 48)
Rhossili(n ! 48)
4–024AR 3.989 2.447 2.994 2.972 2.994 2.987 2.730 2.992 2.000 2.553 3.000 1.000He 0.287 0.419 0.341 0.283 0.393 0.455 0.434 0.368 0.446 0.423 0.648 0.000f 0.149 )0.271 0.083 )0.127 )0.091 )0.098 0.057 )0.076 )0.259 )0.245 0.049 –
4–030AR 2.000 2.000 2.871 2.000 2.000 2.000 2.000 2.000 2.000 2.000 2.000 1.000He 0.501 0.504 0.527 0.490 0.499 0.391 0.494 0.498 0.463 0.368 0.426 0.000f )0.462 )0.112 )0.103 )0.065 )0.570† 0.011 )0.235 )0.266 )0.338 0.039 )0.027 –
4–031AR 3.753 3.500 3.871 3.447 3.707 3.707 3.512 3.000 3.512 3.437 3.000 1.000He 0.643 0.661 0.684 0.672 0.680 0.684 0.646 0.646 0.630 0.680 0.618 0.000f )0.185 0.244 0.048 0.304* )0.215 0.014 0.169 )0.135 0.187 0.142 0.090 –
4–034AR 1.993 2.000 2.000 1.999 2.000 2.000 1.994 2.000 2.000 2.000 2.000 1.420He 0.157 0.241 0.307 0.221 0.216 0.241 0.160 0.369 0.327 0.234 0.271 0.020f )0.082 0.029 )0.221 0.058 )0.125 0.029 )0.084 0.153 )0.073 0.118 )0.020 0.000
4–035AR 7.241 8.611 9.138 7.668 8.306 7.108 8.503 6.642 8.523 6.482 4.385 2.000He 0.735 0.798 0.809 0.765 0.771 0.779 0.781 0.561 0.772 0.768 0.398 0.499f )0.162 0.046 )0.158 )0.023 )0.091 )0.113 )0.086 )0.077 0.059 )0.069 0.092 0.121
4–037AR 2.826 2.864 2.693 2.853 1.871 2.000 1.457 1.000 1.000 2.000 3.000 2.000He 0.304 0.179 0.213 0.177 0.068 0.276 0.022 0.000 0.000 0.451 0.565 0.389f )0.029 )0.067 )0.100 0.292 )0.024 0.135 0.000 – – 0.211 0.097 )0.125
4–042AR 2.000 2.000 2.000 2.000 2.477 1.999 2.000 1.992 1.996 2.000 2.000 2.000He 0.367 0.410 0.345 0.438 0.361 0.205 0.369 0.155 0.167 0.401 0.507 0.465f )0.306 )0.061 )0.026 )0.165 0.118 )0.119 0.174 0.192 )0.089 )0.246 0.343 )0.119
4–060AR 2.877 2.500 3.357 2.835 2.456 2.000 2.953 2.985 2.500 2.000 2.477 2.000He 0.237 0.331 0.271 0.323 0.279 0.261 0.355 0.461 0.420 0.479 0.454 0.470f )0.105 )0.006 0.141 )0.054 )0.012 0.000 0.015 0.186 0.036 0.701* )0.051 0.044
4–062AR 2.992 2.844 2.985 2.997 2.961 2.948 3.000 3.000 2.753 2.686 2.000 2.000He 0.499 0.446 0.518 0.482 0.552 0.530 0.614 0.670 0.482 0.438 0.439 0.498f )0.085 )0.024 )0.086 )0.014 )0.006 0.096 0.292 )0.039 0.210 0.001 0.032 )0.045
4–063AR 3.853 3.731 2.972 3.648 3.951 3.590 3.688 2.438 2.999 1.888 2.447 1.447He 0.546 0.463 0.499 0.333 0.466 0.488 0.537 0.515 0.580 0.071 0.303 0.021f )0.059 0.009 0.040 )0.023 )0.001 0.042 )0.133 )0.092 0.224 )0.026 )0.053 0.000
4–066AR 5.240 6.598 6.898 6.086 6.160 6.538 6.776 3.993 4.678 2.000 4.757 2.000He 0.421 0.551 0.559 0.501 0.421 0.357 0.613 0.610 0.254 0.320 0.535 0.278f )0.187 0.050 0.002 0.045 )0.158 0.004 )0.074 )0.069 )0.082 )0.105 0.204 0.559*
4–067AR 7.243 6.961 8.951 7.551 8.009 6.084 6.729 4.590 9.154 9.026 7.186 1.000He 0.617 0.738 0.769 0.727 0.721 0.719 0.691 0.592 0.665 0.810 0.692 0.000f 0.020 0.019 )0.098 )0.107 0.029 )0.061 )0.184 )0.222 )0.165 0.021 0.278* –
Sample size (n), allelic richness (AR), expected heterozygosity (He) and Wright’s (1951) inbreeding coefficient (f ).* and † indicate a significant (P < 0.05, k ! 9–14) heterozygote deficit or excess, respectively – indicates monomorphic locus, so test notcarried out.
Genetic variation in an endangered damselfly 205
! 2005 The Authors, Journal compilation ! 2005 Blackwell Publishing Ltd, Freshwater Biology, 51, 193–205