Variation in the shape of the wings and taxonomy of Eurasian populations of the Calopteryx splendens...
9
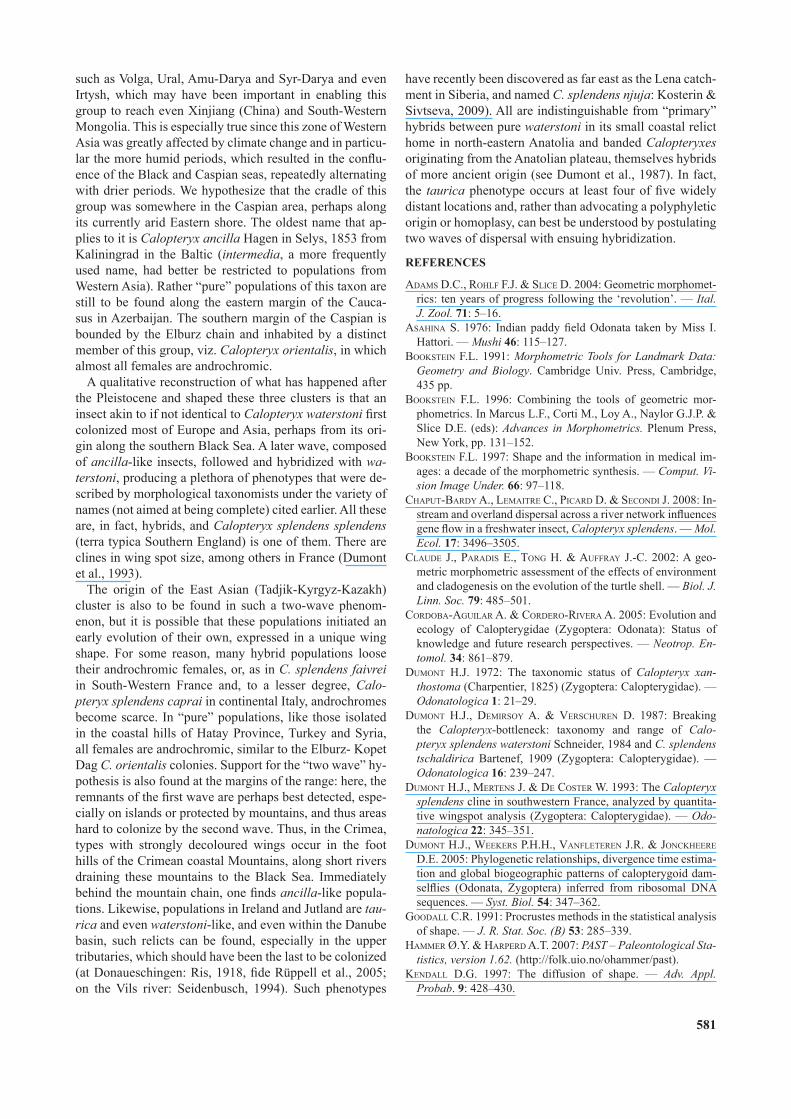
575 INTRODUCTION A variety of biological processes affect the shape of indi- viduals or their parts, such as adaptation to local environ- ments, ontogenetic development or evolutionary diversifi- cation. Shape is defined as “all the geometric information that remains when location, scale and rotational effects are filtered out” (Kendall, 1977) and is important in many kinds of biological studies (Zelditch et al., 2004). Morpho- metric data have traditionally consisted of linear distances, angles or ratios. These variables extract only part of the in- formation present in the relative positions of the landmarks on which these measurements are based (Rohlf, 2002). The field of geometric morphometrics remedies this: it is a quantitative way of studying and analyzing variation in shape (Bookstein, 1991). Calopteryx splendens Harris (Insecta: Odonata) is re- corded over a vast area in Eurasia (Fig. 1, Appendix 1) but is remarkably uniform in the habitat it occupies and its morphology across its enormous range (Dumont et al., 2005). About twenty specific and infra-specific categories have been created (for a recent overview with distribution map, see Rüppel et al., 2005), based on the position and size of the spot on their wings but not their structural mor- phology (Asahina, 1976). Many of these categories (spe- cies and/or subspecies) are definable by their geographic range, which lends credibility to their (sub) specific status. Comparison of the positions of the wing-spots and bioge- ography has revealed a number of clines and that hybrid zones are extensive (Dumont et al., 1993). Wing spots, often though not invariably, are sex-linked (Siva-Jothy, 1999) and variation in their size is sometimes expressed as a cascade at different geographical scales (Dumont et al., 1993). Wing pigmentation has a genetic basis, but its extent is affected by temperature, parasites (Rantalaet al., 2000; Siva-Jothy, 2000; Koskimaki et al., 2004), charac- ter displacement (Tynkkynen et al., 2004), pesticides and other chemical factors, and reflects male quality (Córdoba- Aguilar & Cordero-Rivera, 2005). Molecular phylogenetic work suggests a recent (Pleistocene) origin of many of the wing spot forms (Misof et al., 2000; Weekers et al., 2001; Dumont et al., 2005), but no single marker has yet fully resolved the mosaic of shapes (Misof et al., 2000; Week- ers et al., 2001; Dumont et al., 2005; Sadeghi et al., 2010). Identical wing spot shapes may occur in several widely disjunct parts of the range, either suggesting homoplasy or an eventful late-Pleistocene history. In this study we extend previous work (Sadeghi et al., 2009) that quantified the shapes of the spots on the wings of individuals in 20 European and Asian populations of Calopteryx splendens, using geometric morphometrics as Eur. J. Entomol. 111(4): 575–583, 2014 doi: 10.14411/eje.2014.073 ISSN 1210-5759 (print), 1802-8829 (online) Variation in the shape of the wings and taxonomy of Eurasian populations of the Calopteryx splendens complex (Odonata: Calopterygidae) SABER SADEGHI 1 and HENRI J. DUMONT 2 1 Department of Biology, Faculty of Sciences, Shiraz University, Shiraz, Iran; e-mails: [email protected]; [email protected] 2 Department of Biology, Gent University, Ledeganckstraat 35, 9000-Gent, Belgium; e-mail: [email protected] Key words. Odonata, Calopterygidae, Calopteryx splendens, Eurasia, wing shape, taxonomy Abstract. We used geometric morphometrics to determine variation in the morphology of the forewings of individuals in 20 popula- tions of Calopteryx splendens s.l. in Eurasia and related these to the circum-specific taxonomy of this taxon. We found differences in shape, with the largest and smallest centroid size of the wings in adjacent northern (orientalis) and western (intermedia) populations in Iran, respectively, so isolation and relationship are not necessarily determined by distance, but often associated with the stream basin inhabited. The variation in wing shape, however, was much greater. with Populations at the eastern edge of the range (Tajikistan, Kyr- gyzstan and East Kazakhstan) uniquely different. Oddly, no taxonomic name is associated with them, although they may be among the oldest representatives of the splendens complex. The European and Asian populations are in two separate clades. One of these includes insects with no to a medium-sized wing spot, which does not reach the tip of the wing (waterstoni-group), while the other includes insects with very broad wing spots, or, when short, it extends to the very tip of the wings and most females are androchrome (ancilla or intermedia group). Turkmenistan and northern Iranian population form a separate line inside this clade, which we equate with Calo- pteryx orientalis. South Albanian and Greek populations are in a separate branch corresponding to ssp. balcanica; two populations from Ireland and Italy form a branch that has no equivalent in traditional taxonomy, while Calopteryx xanthostoma was not identified by its wing shape. Understanding this multitude of phenotypes and the enormous amount of variation within certain populations but not in others becomes easy if one assumes there were two probable late Pleistocene waves of migration, the first of insects lacking spots that migrated east and westwards from the South Black Sea basin, the second, perhaps from the west Caspian, composed of heavily spotted insects with androchromic females. The hybridization between these two waves resulted in the current plethora of colour forms and accounts for why similar phenotypes may turn up independently in widely distant locations.
Transcript of Variation in the shape of the wings and taxonomy of Eurasian populations of the Calopteryx splendens...
575
INTRODUCTION
A variety of biological processes affect the shape of indi-viduals or their parts, such as adaptation to local environ-ments, ontogenetic development or evolutionary diversifi-cation. Shape is defined as “all the geometric information that remains when location, scale and rotational effects are filtered out” (Kendall, 1977) and is important in many kinds of biological studies (Zelditch et al., 2004). Morpho-metric data have traditionally consisted of linear distances, angles or ratios. These variables extract only part of the in-formation present in the relative positions of the landmarks on which these measurements are based (Rohlf, 2002). The field of geometric morphometrics remedies this: it is a quantitative way of studying and analyzing variation in shape (Bookstein, 1991).
Calopteryx splendens Harris (Insecta: Odonata) is re-corded over a vast area in Eurasia (Fig. 1, Appendix 1) but is remarkably uniform in the habitat it occupies and its morphology across its enormous range (Dumont et al., 2005). About twenty specific and infra-specific categories have been created (for a recent overview with distribution map, see Rüppel et al., 2005), based on the position and size of the spot on their wings but not their structural mor-phology (Asahina, 1976). Many of these categories (spe-cies and/or subspecies) are definable by their geographic
range, which lends credibility to their (sub) specific status. Comparison of the positions of the wing-spots and bioge-ography has revealed a number of clines and that hybrid zones are extensive (Dumont et al., 1993). Wing spots, often though not invariably, are sex-linked (Siva-Jothy, 1999) and variation in their size is sometimes expressed as a cascade at different geographical scales (Dumont et al., 1993). Wing pigmentation has a genetic basis, but its extent is affected by temperature, parasites (Rantalaet al., 2000; Siva-Jothy, 2000; Koskimaki et al., 2004), charac-ter displacement (Tynkkynen et al., 2004), pesticides and other chemical factors, and reflects male quality (Córdoba-Aguilar & Cordero-Rivera, 2005). Molecular phylogenetic work suggests a recent (Pleistocene) origin of many of the wing spot forms (Misof et al., 2000; Weekers et al., 2001; Dumont et al., 2005), but no single marker has yet fully resolved the mosaic of shapes (Misof et al., 2000; Week-ers et al., 2001; Dumont et al., 2005; Sadeghi et al., 2010). Identical wing spot shapes may occur in several widely disjunct parts of the range, either suggesting homoplasy or an eventful late-Pleistocene history.
In this study we extend previous work (Sadeghi et al., 2009) that quantified the shapes of the spots on the wings of individuals in 20 European and Asian populations of Calopteryx splendens, using geometric morphometrics as
Eur. J. Entomol. 111(4): 575–583, 2014doi: 10.14411/eje.2014.073
ISSN 1210-5759 (print), 1802-8829 (online)
Variation in the shape of the wings and taxonomy of Eurasian populations of the Calopteryx splendens complex (Odonata: Calopterygidae)
Saber SADEGHI 1 and Henri J. DUMONT 2
1 Department of Biology, Faculty of Sciences, Shiraz University, Shiraz, Iran; e-mails: [email protected]; [email protected]
2 Department of Biology, Gent University, Ledeganckstraat 35, 9000-Gent, Belgium; e-mail: [email protected]
Key words. Odonata, Calopterygidae, Calopteryx splendens, Eurasia, wing shape, taxonomy
Abstract. We used geometric morphometrics to determine variation in the morphology of the forewings of individuals in 20 popula-tions of Calopteryx splendens s.l. in Eurasia and related these to the circum-specific taxonomy of this taxon. We found differences in shape, with the largest and smallest centroid size of the wings in adjacent northern (orientalis) and western (intermedia) populations in Iran, respectively, so isolation and relationship are not necessarily determined by distance, but often associated with the stream basin inhabited. The variation in wing shape, however, was much greater. with Populations at the eastern edge of the range (Tajikistan, Kyr-gyzstan and East Kazakhstan) uniquely different. Oddly, no taxonomic name is associated with them, although they may be among the oldest representatives of the splendens complex. The European and Asian populations are in two separate clades. One of these includes insects with no to a medium-sized wing spot, which does not reach the tip of the wing (waterstoni-group), while the other includes insects with very broad wing spots, or, when short, it extends to the very tip of the wings and most females are androchrome (ancilla or intermedia group). Turkmenistan and northern Iranian population form a separate line inside this clade, which we equate with Calopteryx orientalis. South Albanian and Greek populations are in a separate branch corresponding to ssp. balcanica; two populations from Ireland and Italy form a branch that has no equivalent in traditional taxonomy, while Calopteryx xanthostoma was not identified by its wing shape. Understanding this multitude of phenotypes and the enormous amount of variation within certain populations but not in others becomes easy if one assumes there were two probable late Pleistocene waves of migration, the first of insects lacking spots that migrated east and westwards from the South Black Sea basin, the second, perhaps from the west Caspian, composed of heavily spotted insects with androchromic females. The hybridization between these two waves resulted in the current plethora of colour forms and accounts for why similar phenotypes may turn up independently in widely distant locations.
576
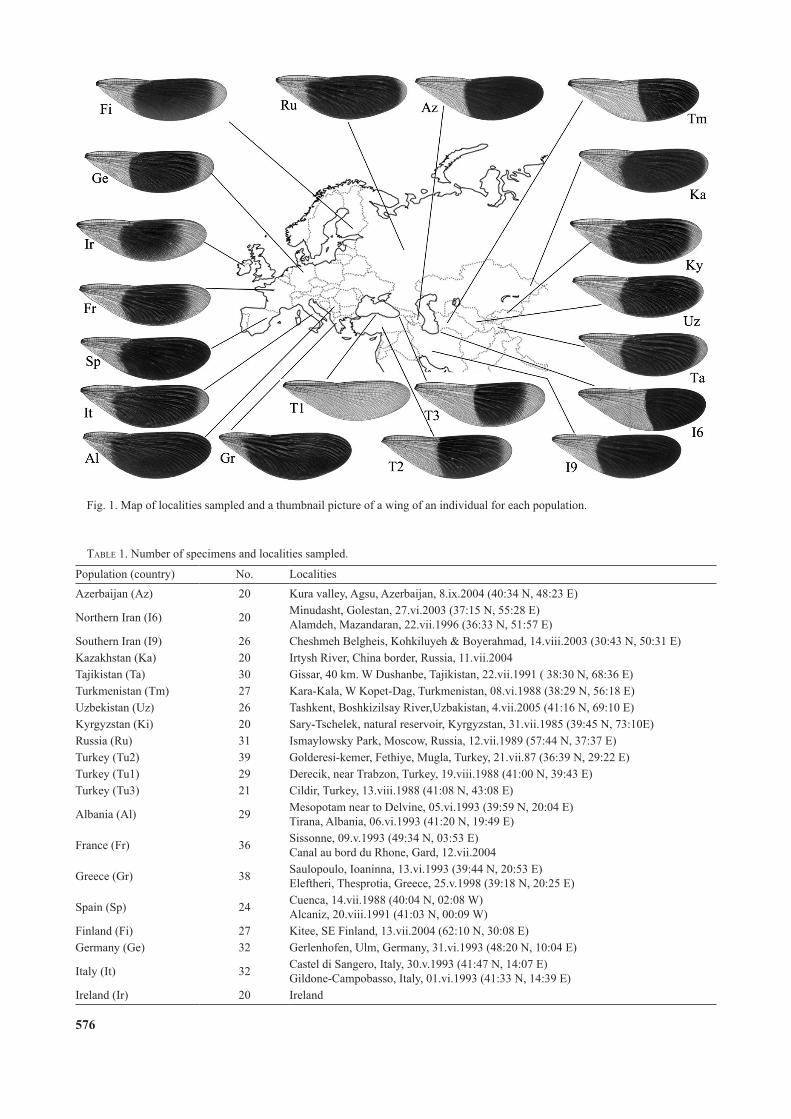
Fig. 1. Map of localities sampled and a thumbnail picture of a wing of an individual for each population.
Table 1. Number of specimens and localities sampled.
Population (country) No. LocalitiesAzerbaijan (Az) 20 Kura valley, Agsu, Azerbaijan, 8.ix.2004 (40:34 N, 48:23 E)
Northern Iran (I6) 20 Minudasht, Golestan, 27.vi.2003 (37:15 N, 55:28 E)Alamdeh, Mazandaran, 22.vii.1996 (36:33 N, 51:57 E)
Southern Iran (I9) 26 Cheshmeh Belgheis, Kohkiluyeh & Boyerahmad, 14.viii.2003 (30:43 N, 50:31 E)Kazakhstan (Ka) 20 Irtysh River, China border, Russia, 11.vii.2004Tajikistan (Ta) 30 Gissar, 40 km. W Dushanbe, Tajikistan, 22.vii.1991 ( 38:30 N, 68:36 E)Turkmenistan (Tm) 27 Kara-Kala, W Kopet-Dag, Turkmenistan, 08.vi.1988 (38:29 N, 56:18 E)Uzbekistan (Uz) 26 Tashkent, Boshkizilsay River,Uzbakistan, 4.vii.2005 (41:16 N, 69:10 E)Kyrgyzstan (Ki) 20 Sary-Tschelek, natural reservoir, Kyrgyzstan, 31.vii.1985 (39:45 N, 73:10E)Russia (Ru) 31 Ismaylowsky Park, Moscow, Russia, 12.vii.1989 (57:44 N, 37:37 E)Turkey (Tu2) 39 Golderesi-kemer, Fethiye, Mugla, Turkey, 21.vii.87 (36:39 N, 29:22 E)Turkey (Tu1) 29 Derecik, near Trabzon, Turkey, 19.viii.1988 (41:00 N, 39:43 E)Turkey (Tu3) 21 Cildir, Turkey, 13.viii.1988 (41:08 N, 43:08 E)
Albania (Al) 29 Mesopotam near to Delvine, 05.vi.1993 (39:59 N, 20:04 E)Tirana, Albania, 06.vi.1993 (41:20 N, 19:49 E)
France (Fr) 36 Sissonne, 09.v.1993 (49:34 N, 03:53 E)Canal au bord du Rhone, Gard, 12.vii.2004
Greece (Gr) 38 Saulopoulo, Ioaninna, 13.vi.1993 (39:44 N, 20:53 E)Eleftheri, Thesprotia, Greece, 25.v.1998 (39:18 N, 20:25 E)
Spain (Sp) 24 Cuenca, 14.vii.1988 (40:04 N, 02:08 W)Alcaniz, 20.viii.1991 (41:03 N, 00:09 W)
Finland (Fi) 27 Kitee, SE Finland, 13.vii.2004 (62:10 N, 30:08 E)Germany (Ge) 32 Gerlenhofen, Ulm, Germany, 31.vi.1993 (48:20 N, 10:04 E)
Italy (It) 32 Castel di Sangero, Italy, 30.v.1993 (41:47 N, 14:07 E)Gildone-Campobasso, Italy, 01.vi.1993 (41:33 N, 14:39 E)
Ireland (Ir) 20 Ireland
577
an independent way of looking for geographic patterns and comparing the outcome with traditional taxonomy.
MATERIAl AND METhODs
We compared Eurasian C. splendens, which complemented our previous study on European populations (Sadeghi et al., 2009). We studied the left fore-wings of males collected in Western Eu-rope to Central Asia, a total of 580 males from twenty localities. Twelve Asian populations, from Iran (two populations), Turkey (three populations), Azerbaijan, Russia, Kazakhstan, Kyrgyzstan, Tajikistan, Turkmenistan and Uzbekistan, and eight European populations from Albania, Greece, Spain, France, Finland, Ger-many, Italy and Ireland (Table 1) were included in this study. The collection areas are geographically widely separated (Fig. 1) and cover most of the range of Calopteryx splendens. For simplicity we named the populations after their country of origin.
Data acquisition and shape analysisWings were prepared for scanning after soaking in 70% ethyl
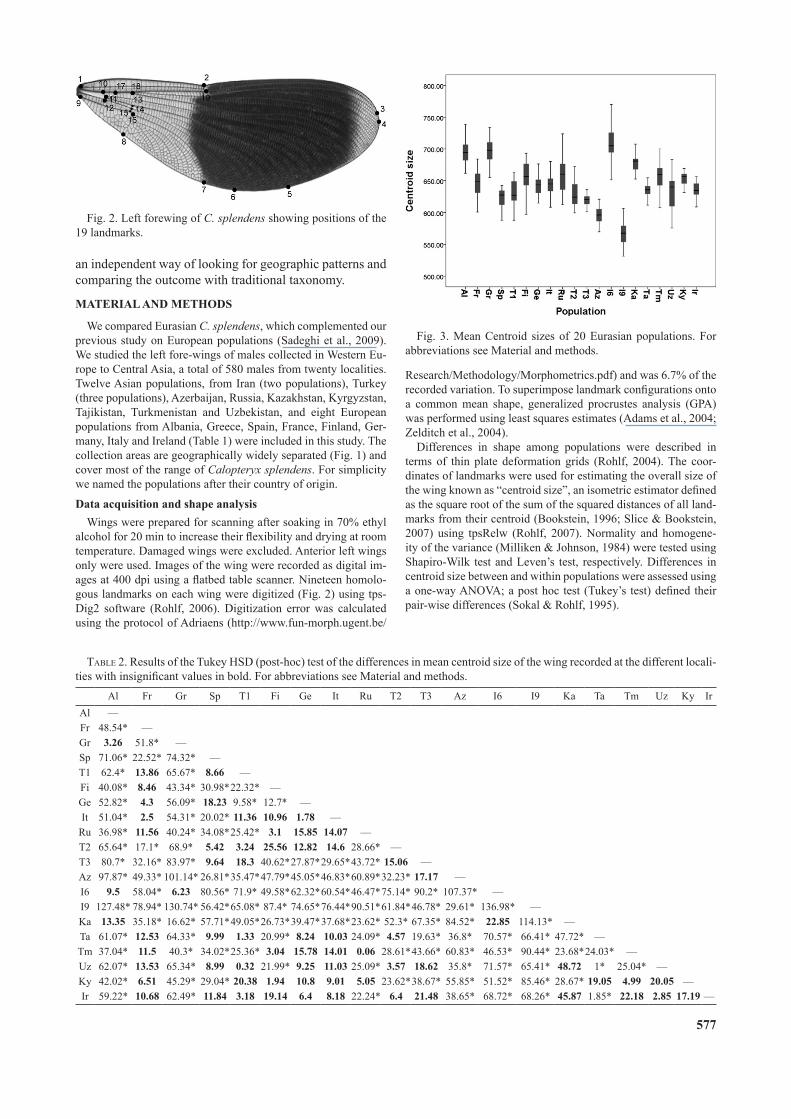
alcohol for 20 min to increase their flexibility and drying at room temperature. Damaged wings were excluded. Anterior left wings only were used. Images of the wing were recorded as digital im-ages at 400 dpi using a flatbed table scanner. Nineteen homolo-gous landmarks on each wing were digitized (Fig. 2) using tps-Dig2 software (Rohlf, 2006). Digitization error was calculated using the protocol of Adriaens (http://www.fun-morph.ugent.be/
Research/Methodology/Morphometrics.pdf) and was 6.7% of the recorded variation. To superimpose landmark configurations onto a common mean shape, generalized procrustes analysis (GPA) was performed using least squares estimates (Adams et al., 2004; Zelditch et al., 2004).
Differences in shape among populations were described in terms of thin plate deformation grids (Rohlf, 2004). The coor-dinates of landmarks were used for estimating the overall size of the wing known as “centroid size”, an isometric estimator defined as the square root of the sum of the squared distances of all land-marks from their centroid (Bookstein, 1996; Slice & Bookstein, 2007) using tpsRelw (Rohlf, 2007). Normality and homogene-ity of the variance (Milliken & Johnson, 1984) were tested using Shapiro-Wilk test and Leven’s test, respectively. Differences in centroid size between and within populations were assessed using a one-way ANOVA; a post hoc test (Tukey’s test) defined their pair-wise differences (Sokal & Rohlf, 1995).
Fig. 2. Left forewing of C. splendens showing positions of the 19 landmarks.
Fig. 3. Mean Centroid sizes of 20 Eurasian populations. For abbreviations see Material and methods.
Table 2. Results of the Tukey HSD (post-hoc) test of the differences in mean centroid size of the wing recorded at the different locali-ties with insignificant values in bold. For abbreviations see Material and methods.
Al Fr Gr Sp T1 Fi Ge It Ru T2 T3 Az I6 I9 Ka Ta Tm Uz Ky IrAl —Fr 48.54* —Gr 3.26 51.8* —Sp 71.06* 22.52* 74.32* —T1 62.4* 13.86 65.67* 8.66 —Fi 40.08* 8.46 43.34* 30.98*22.32* —Ge 52.82* 4.3 56.09* 18.23 9.58* 12.7* —It 51.04* 2.5 54.31* 20.02* 11.36 10.96 1.78 —
Ru 36.98* 11.56 40.24* 34.08*25.42* 3.1 15.85 14.07 —T2 65.64* 17.1* 68.9* 5.42 3.24 25.56 12.82 14.6 28.66* —T3 80.7* 32.16* 83.97* 9.64 18.3 40.62*27.87*29.65*43.72* 15.06 —Az 97.87* 49.33* 101.14* 26.81*35.47*47.79*45.05*46.83*60.89*32.23* 17.17 —I6 9.5 58.04* 6.23 80.56* 71.9* 49.58*62.32*60.54*46.47*75.14* 90.2* 107.37* —I9 127.48* 78.94* 130.74* 56.42*65.08* 87.4* 74.65*76.44*90.51*61.84*46.78* 29.61* 136.98* —Ka 13.35 35.18* 16.62* 57.71*49.05*26.73*39.47*37.68*23.62* 52.3* 67.35* 84.52* 22.85 114.13* —Ta 61.07* 12.53 64.33* 9.99 1.33 20.99* 8.24 10.03 24.09* 4.57 19.63* 36.8* 70.57* 66.41* 47.72* —Tm 37.04* 11.5 40.3* 34.02*25.36* 3.04 15.78 14.01 0.06 28.61*43.66* 60.83* 46.53* 90.44* 23.68*24.03* —Uz 62.07* 13.53 65.34* 8.99 0.32 21.99* 9.25 11.03 25.09* 3.57 18.62 35.8* 71.57* 65.41* 48.72 1* 25.04* —Ky 42.02* 6.51 45.29* 29.04* 20.38 1.94 10.8 9.01 5.05 23.62*38.67* 55.85* 51.52* 85.46* 28.67* 19.05 4.99 20.05 —Ir 59.22* 10.68 62.49* 11.84 3.18 19.14 6.4 8.18 22.24* 6.4 21.48 38.65* 68.72* 68.26* 45.87 1.85* 22.18 2.85 17.19 —
578
We calculated the correlation between the procrustes and the Kendall tangent space distances using tpsSmall (Rohlf, 1998) to ensure that the variation in shape in a data set was small enough to permit statistical analyses to be conducted in linear tangent space, approximating the Kendall shape space, which is non-linear (Claude et al., 2002). Landmark coordinates obtained from tpsDig (Rohlf, 2010) were used in PAST (Hammer & Harper, 2007) and IMP (Sheets, 2000) software for running a PCA (Prin-cipal component analysis) and CVA (canonical variates analysis) to identify new differences in shape that maximize the separation between groups relative to variation within groups. The PCA was performed on the variance-covariance matrix of individual coor-dinates. We also compared differences in wing shape among pop-ulations by executing a MANOVA (Wilk’s lambda as a criterion and pair-wise Hotelling’s test as post hoc) using PAST. Goodall’s F test (Goodall, 1991; Bookstein, 1997) was performed to deter-mine intergroup differences in shape using IMP as an alternative.
To better visualize the variation in shape, a consensus (mean of configurations) was computed from the superimposed replicas of the shapes for individuals from each population. The consensus shape for each of the populations was used as a reference for all figures using tpsRelw (Rohlf, 2003, 2007). Differences in wing shape were depicted by generating thin-plate spline deformation grids along the first CV axis using tpsSplin (Rohlf, 2004). A clus-ter analysis using the procrustes distance matrix between pair-wise population consensus configurations was used to investigate phenetic relationships between populations. UPGMA (Unweight-ed Pair-Group Method with Arithmetic means) was chosen to construct the phenogram with the largest cophenetic correlations to the original procrustes distance matrix (Rohlf, 2002) using NT-SYSpc (Ver. 2.1, Rohlf, 2000). The UPGMA phenogram formed by SAHN clustering was obtained from the consensus landmarks data. The program calculated a consensus phenogram, based on correlation, distance and variance-covariance matrices.
AbbreviationsAz – Azerbaijan; Al – Albania; AMOVA – Analysis of Molecu-
lar Variance; ANOVA – Analysis of Variance; Az – Azerbaijan; CS – Centroid Size; CVA – Canonical Variates Analysis; Fr – France; Fi – Finland; Ge – Germany; Gr – Greece; I6 – Iran, north; I9 – Iran, south; Ir – Ireland; It – Italy; Ka – Kazakhstan; Ky – Kyrgyzstan; LM – landmark; MANOVA – Multivariate Analysis of Variance; Uz – Uzbakistan; PC1 – First Principal Component; PC2 – Second Principal Component; PCA – Princi-pal Component Analysis; Ru – Russia; Sp – Spain; SPSS – Sta-tistical Product and Service Solutions; T1 – Turkey, north (Tra-bzon); T2 – Turkey, south west (Golderesi); T3 – Turkey, north east (Cildir); Ta – Tadjikistan; Tm – Turkmenistan; UPGMA – Unweighted Pair Group Method using Arithmetic Averages; Uz – Uzbakistan.
REsUlTs
Variation in wing size A Shapiro-Wilk test suggested a normal distribution for
each population (p > 0.05) and Levene’s test revealed that the variation (p > 0.05) of the means was homogenous. A post hoc Tukey (HSD) test on centroid size revealed vari-able pair-wise differences between populations (Table 2). They revealed three groups with significantly different centroid sizes (Fig. 3): the first group with the largest cen-troid size included the Northern Iranian (I6), Albanian (Al) and Greek (Gr) populations. A second group of southern Iranian (I9) and Azerbaijan populations had the smallest wings and the third group was made up of populations with a wing size intermediate between these two. Statistical t and F test for pairwise comparison of the centroid sizes of the populations showed that only that of the southern Iranian population (I9) differed significantly in size from other populations. The non-significant differences in cen-troid size recorded for some of the populations (Table 2) were not associated with any geographic features. Variation in wing shape
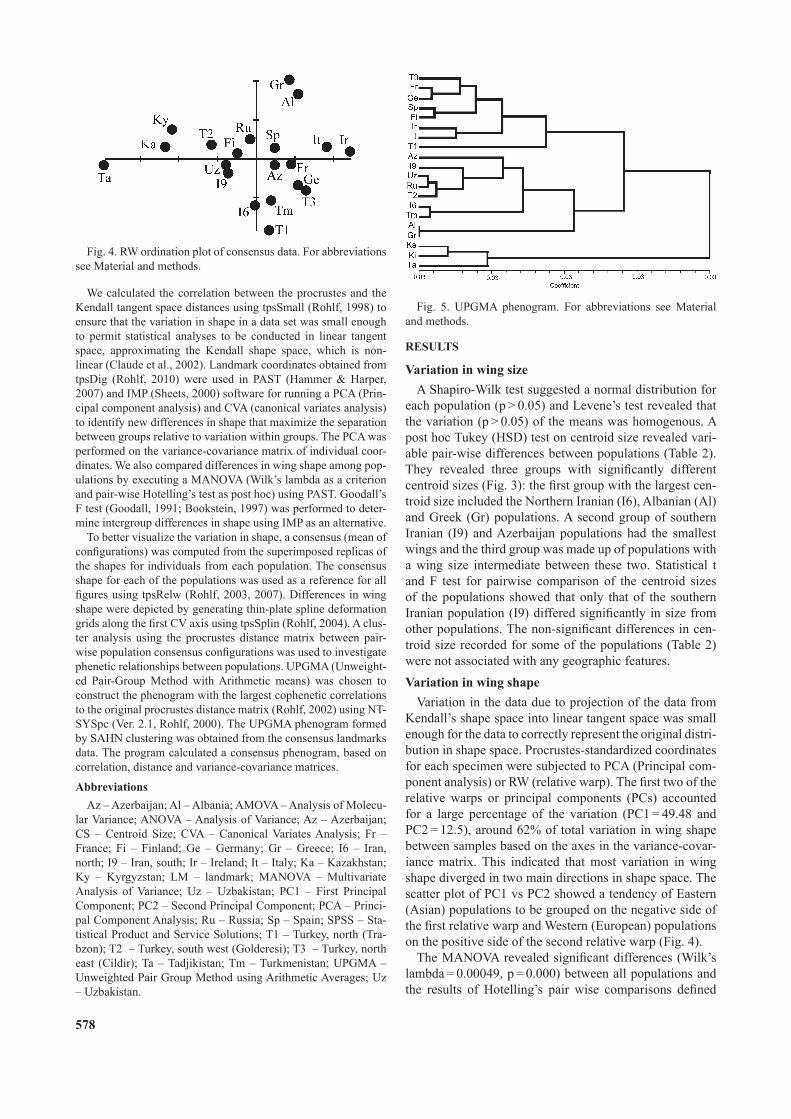
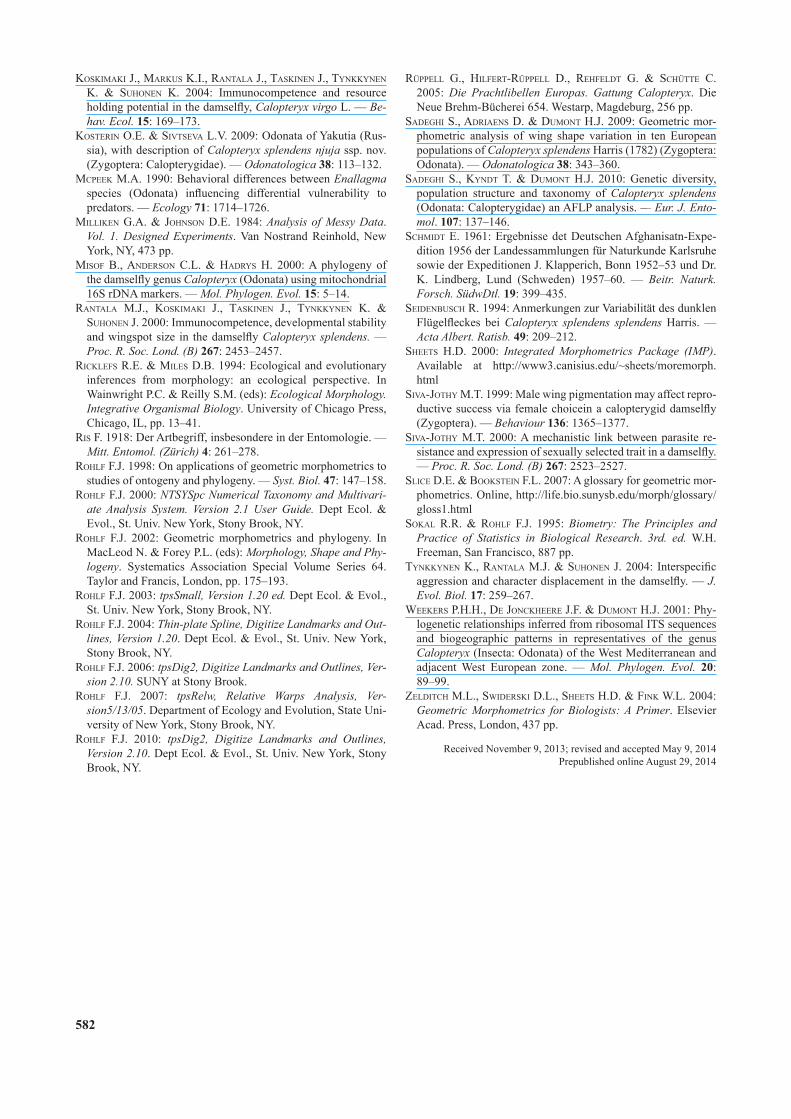
Variation in the data due to projection of the data from Kendall’s shape space into linear tangent space was small enough for the data to correctly represent the original distri-bution in shape space. Procrustes-standardized coordinates for each specimen were subjected to PCA (Principal com-ponent analysis) or RW (relative warp). The first two of the relative warps or principal components (PCs) accounted for a large percentage of the variation (PC1 = 49.48 and PC2 = 12.5), around 62% of total variation in wing shape between samples based on the axes in the variance-covar-iance matrix. This indicated that most variation in wing shape diverged in two main directions in shape space. The scatter plot of PC1 vs PC2 showed a tendency of Eastern (Asian) populations to be grouped on the negative side of the first relative warp and Western (European) populations on the positive side of the second relative warp (Fig. 4).
The MANOVA revealed significant differences (Wilk’s lambda = 0.00049, p = 0.000) between all populations and the results of Hotelling’s pair wise comparisons defined
Fig. 4. RW ordination plot of consensus data. For abbreviations see Material and methods.
Fig. 5. UPGMA phenogram. For abbreviations see Material and methods.
579
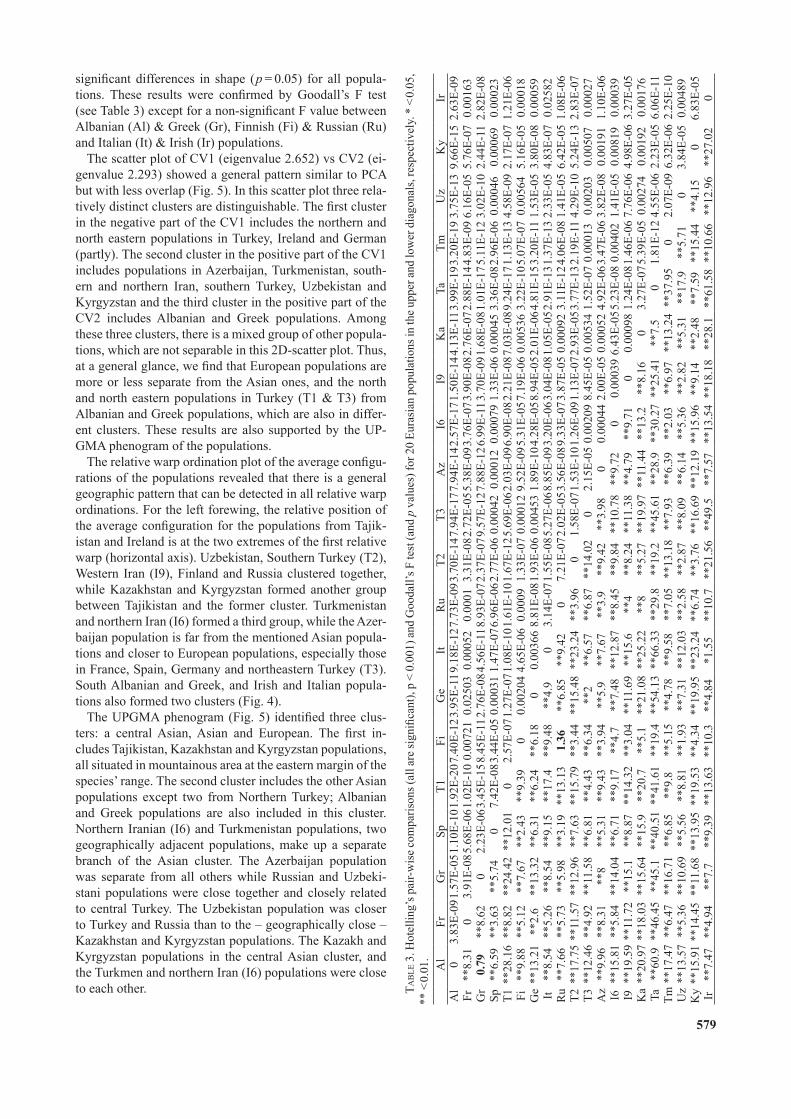
significant differences in shape ( p = 0.05) for all popula-tions. These results were confirmed by Goodall’s F test (see Table 3) except for a non-significant F value between Albanian (Al) & Greek (Gr), Finnish (Fi) & Russian (Ru) and Italian (It) & Irish (Ir) populations.
The scatter plot of CV1 (eigenvalue 2.652) vs CV2 (ei-genvalue 2.293) showed a general pattern similar to PCA but with less overlap (Fig. 5). In this scatter plot three rela-tively distinct clusters are distinguishable. The first cluster in the negative part of the CV1 includes the northern and north eastern populations in Turkey, Ireland and German (partly). The second cluster in the positive part of the CV1 includes populations in Azerbaijan, Turkmenistan, south-ern and northern Iran, southern Turkey, Uzbekistan and Kyrgyzstan and the third cluster in the positive part of the CV2 includes Albanian and Greek populations. Among these three clusters, there is a mixed group of other popula-tions, which are not separable in this 2D-scatter plot. Thus, at a general glance, we find that European populations are more or less separate from the Asian ones, and the north and north eastern populations in Turkey (T1 & T3) from Albanian and Greek populations, which are also in differ-ent clusters. These results are also supported by the UP-GMA phenogram of the populations.
The relative warp ordination plot of the average configu-rations of the populations revealed that there is a general geographic pattern that can be detected in all relative warp ordinations. For the left forewing, the relative position of the average configuration for the populations from Tajik-istan and Ireland is at the two extremes of the first relative warp (horizontal axis). Uzbekistan, Southern Turkey (T2), Western Iran (I9), Finland and Russia clustered together, while Kazakhstan and Kyrgyzstan formed another group between Tajikistan and the former cluster. Turkmenistan and northern Iran (I6) formed a third group, while the Azer-baijan population is far from the mentioned Asian popula-tions and closer to European populations, especially those in France, Spain, Germany and northeastern Turkey (T3). South Albanian and Greek, and Irish and Italian popula-tions also formed two clusters (Fig. 4).
The UPGMA phenogram (Fig. 5) identified three clus-ters: a central Asian, Asian and European. The first in-cludes Tajikistan, Kazakhstan and Kyrgyzstan populations, all situated in mountainous area at the eastern margin of the species’ range. The second cluster includes the other Asian populations except two from Northern Turkey; Albanian and Greek populations are also included in this cluster. Northern Iranian (I6) and Turkmenistan populations, two geographically adjacent populations, make up a separate branch of the Asian cluster. The Azerbaijan population was separate from all others while Russian and Uzbeki-stani populations were close together and closely related to central Turkey. The Uzbekistan population was closer to Turkey and Russia than to the – geographically close – Kazakhstan and Kyrgyzstan populations. The Kazakh and Kyrgyzstan populations in the central Asian cluster, and the Turkmen and northern Iran (I6) populations were close to each other. Ta
ble
3. H
otel
ling’
s pai
r-wis
e co
mpa
rison
s (al
l are
sign
ifica
nt),
p <
0.00
1) a
nd G
ooda
ll’s F
test
(and
p v
alue
s) fo
r 20
Eura
sian
pop
ulat
ions
in th
e up
per a
nd lo
wer
dia
gona
ls, r
espe
ctiv
ely.
* <
0.05
, **
< 0.
01.
Al
FrG
rSp
T1Fi
Ge
ItR
uT2
T3A
zI6
I9K
aTa
TmU
zK
yIr
Al
03.
83E-
091.
57E-
051.
10E-
101.
92E-
207.
40E-
123.
95E-
119.
18E-
127.
73E-
093.
70E-
147.
94E-
177.
94E-
142.
57E-
171.
50E-
144.
13E-
113.
99E-
193.
20E-
193.
75E-
139.
66E-
152.
63E-
09Fr
**8.
310
3.91
E-08
5.68
E-06
1.02
E-10
0.00
721
0.02
503
0.00
052
0.00
013.
31E-
082.
72E-
055.
38E-
093.
76E-
073.
90E-
082.
76E-
072.
88E-
144.
83E-
096.
16E-
055.
76E-
070.
0016
3G
r0.
79**
8.62
02.
23E-
063.
45E-
158.
45E-
112.
76E-
084.
56E-
118.
93E-
072.
37E-
079.
57E-
127.
88E-
126.
99E-
113.
70E-
091.
68E-
081.
01E-
175.
11E-
123.
02E-
102.
44E-
112.
82E-
08Sp
**6.
59**
3.63
**5.
740
7.42
E-08
3.44
E-05
0.00
031
1.47
E-07
6.96
E-06
2.77
E-06
0.00
042
0.00
012
0.00
079
1.33
E-06
0.00
045
3.36
E-08
2.96
E-06
0.00
046
0.00
069
0.00
023
T1**
28.1
6**
8.82
**24
.42
**12
.01
02.
57E-
071.
27E-
071.
08E-
101.
61E-
101.
67E-
125.
69E-
062.
03E-
096.
90E-
082.
21E-
087.
03E-
089.
24E-
171.
13E-
134.
58E-
092.
17E-
071.
21E-
06Fi
**9.
88**
5.12
**7.
67**
2.43
**9.
390
0.00
204
4.65
E-06
0.00
091.
33E-
070.
0001
29.
52E-
095.
31E-
057.
19E-
060.
0053
63.
22E-
105.
07E-
070.
0056
45.
16E-
050.
0001
8G
e**
13.2
1**
2.6
**13
.32
**6.
31**
6.24
**6.
180
0.00
366
8.81
E-08
1.93
E-06
0.00
453
1.89
E-10
4.28
E-05
8.94
E-05
2.01
E-06
4.81
E-15
3.20
E-11
1.53
E-05
3.80
E-08
0.00
059
It**
8.54
**5.
26**
8.54
**9.
15**
17.4
**9.
48**
4.9
03.
14E-
071.
55E-
085.
27E-
068.
85E-
093.
20E-
063.
04E-
081.
05E-
052.
91E-
131.
37E-
132.
33E-
054.
83E-
070.
0258
2R
u**
7.66
**5.
73**
5.98
**3.
19**
13.1
31.
36**
6.85
**9.
420
7.21
E-07
2.02
E-05
3.56
E-08
9.33
E-07
3.87
E-05
0.00
092
3.11
E-12
4.06
E-08
1.41
E-05
6.42
E-05
1.08
E-06
T2**
17.7
5**
11.5
7**
12.9
6**
7.63
**15
.79
**3.
44**
15.4
8**
23.2
4**
3.96
01.
58E-
071.
53E-
101.
26E-
091.
13E-
072.
93E-
053.
77E-
132.
19E-
114.
29E-
105.
24E-
132.
83E-
07T3
**12
.46
**4.
92**
11.5
8**
6.81
**4.
43**
6.34
**2
**6.
57**
6.87
**14
.02
02.
15E-
050.
0020
98.
45E-
050.
0053
41.
52E-
070.
0001
30.
0020
30.
0050
70.
0002
7A
z**
9.96
**8.
31**
8**
5.31
**9.
43**
3.94
**5.
9**
7.67
**3.
9**
9.42
**3.
980
0.00
044
2.00
E-05
0.00
052
4.92
E-06
3.47
E-06
3.82
E-08
0.00
191
1.10
E-06
I6**
15.8
1**
5.84
**14
.04
**6.
71**
9.17
**4.
7**
7.48
**12
.87
**8.
45**
9.84
**10
.78
**9.
720
0.00
039
6.43
E-05
5.23
E-08
0.00
402
1.41
E-05
0.00
819
0.00
039
I9**
19.5
9**
11.7
2**
15.1
**8.
87**
14.3
2**
3.04
**11
.69
**15
.6**
4**
8.24
**11
.38
**4.
79**
9.71
00.
0009
81.
24E-
081.
46E-
067.
76E-
064.
98E-
063.
27E-
05K
a**
20.9
7**
18.0
3**
15.6
4**
15.9
**20
.7**
5.1
**21
.08
**25
.22
**8
**5.
27**
19.9
7**
11.4
4**
13.2
**8.
160
3.27
E-07
5.39
E-05
0.00
274
0.00
192
0.00
176
Ta**
60.9
**46
.45
**45
.1**
40.5
1**
41.6
1**
19.4
**54
.13
**66
.33
**29
.8**
19.2
**45
.61
**28
.9**
30.2
7**
25.4
1**
7.5
01.
81E-
124.
55E-
062.
23E-
056.
06E-
11Tm
**17
.47
**6.
47**
16.7
1**
6.85
**9.
8**
5.15
**4.
78**
9.58
**7.
05**
13.1
8**
7.93
**6.
39**
2.03
**6.
97**
13.2
4**
37.9
50
2.07
E-09
6.32
E-06
2.25
E-10
Uz
**13
.57
**5.
36**
10.6
9**
5.56
**8.
81**
1.93
**7.
31**
12.0
3**
2.58
**2.
87**
8.09
**6.
14**
5.36
**2.
82**
5.31
**17
.9**
5.71
03.
84E-
050.
0048
9K
y**
15.9
1**
14.4
5**
11.6
8**
13.9
5**
19.5
3**
4.34
**19
.95
**23
.24
**6.
74**
3.76
**16
.69
**12
.19
**15
.96
**9.
14**
2.48
**7.
59**
15.4
4**
4.15
06.
83E-
05Ir
**7.
47**
4.94
**7.
7**
9.39
**13
.63
**10
.3**
4.84
*1.5
5**
10.7
**21
.56
**49
.5**
7.57
**13
.54
**18
.18
**28
.1**
61.5
8**
10.6
6**
12.9
6**
27.0
20
580
The European or third cluster includes all remaining plus two northern Turkish populations. In this cluster, T1 forms a separate branch while T3 is more related to French and German populations in spite of the geographic distance be-tween them. T1 and T3 are on the southeastern coast of the Black Sea and in north-east Turkey, respectively. Spanish and Finnish populations and also Irish and Italian popula-tions define separate branches in the European cluster.
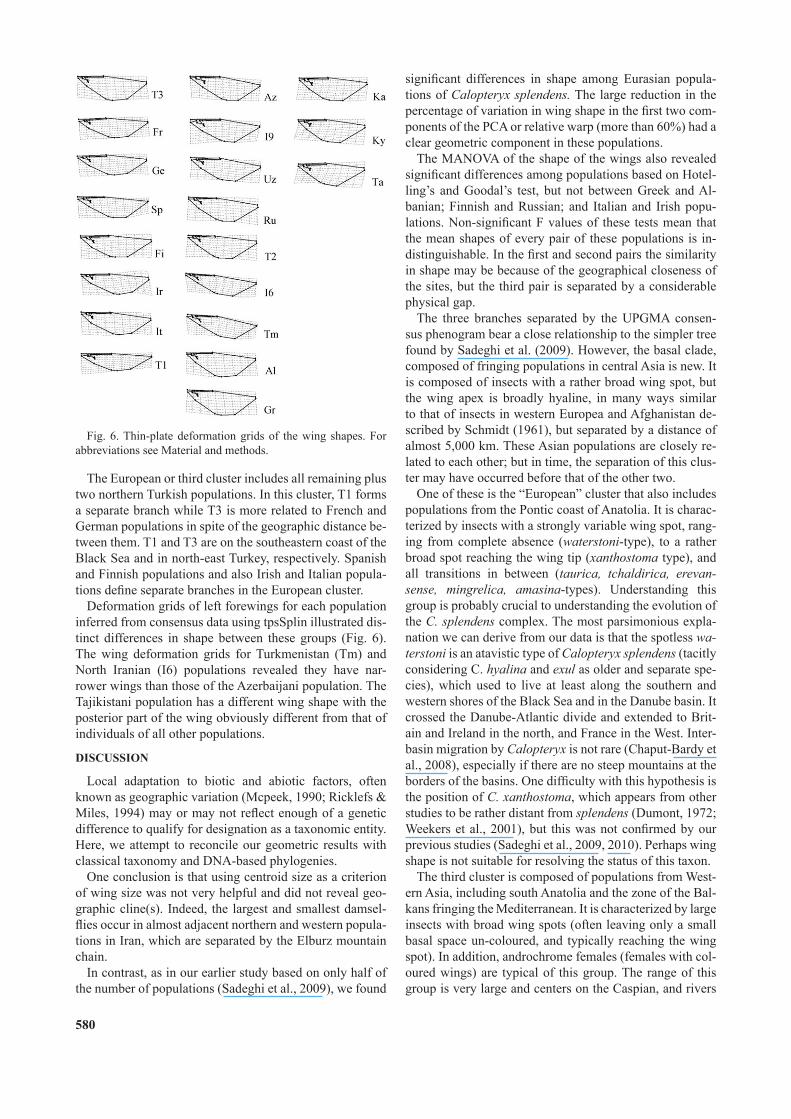
Deformation grids of left forewings for each population inferred from consensus data using tpsSplin illustrated dis-tinct differences in shape between these groups (Fig. 6). The wing deformation grids for Turkmenistan (Tm) and North Iranian (I6) populations revealed they have nar-rower wings than those of the Azerbaijani population. The Tajikistani population has a different wing shape with the posterior part of the wing obviously different from that of individuals of all other populations.
DIsCUssION
Local adaptation to biotic and abiotic factors, often known as geographic variation (Mcpeek, 1990; Ricklefs & Miles, 1994) may or may not reflect enough of a genetic difference to qualify for designation as a taxonomic entity. Here, we attempt to reconcile our geometric results with classical taxonomy and DNA-based phylogenies.
One conclusion is that using centroid size as a criterion of wing size was not very helpful and did not reveal geo-graphic cline(s). Indeed, the largest and smallest damsel-flies occur in almost adjacent northern and western popula-tions in Iran, which are separated by the Elburz mountain chain.
In contrast, as in our earlier study based on only half of the number of populations (Sadeghi et al., 2009), we found
significant differences in shape among Eurasian popula-tions of Calopteryx splendens. The large reduction in the percentage of variation in wing shape in the first two com-ponents of the PCA or relative warp (more than 60%) had a clear geometric component in these populations.
The MANOVA of the shape of the wings also revealed significant differences among populations based on Hotel-ling’s and Goodal’s test, but not between Greek and Al-banian; Finnish and Russian; and Italian and Irish popu-lations. Non-significant F values of these tests mean that the mean shapes of every pair of these populations is in-distinguishable. In the first and second pairs the similarity in shape may be because of the geographical closeness of the sites, but the third pair is separated by a considerable physical gap.
The three branches separated by the UPGMA consen-sus phenogram bear a close relationship to the simpler tree found by Sadeghi et al. (2009). However, the basal clade, composed of fringing populations in central Asia is new. It is composed of insects with a rather broad wing spot, but the wing apex is broadly hyaline, in many ways similar to that of insects in western Europea and Afghanistan de-scribed by Schmidt (1961), but separated by a distance of almost 5,000 km. These Asian populations are closely re-lated to each other; but in time, the separation of this clus-ter may have occurred before that of the other two.
One of these is the “European” cluster that also includes populations from the Pontic coast of Anatolia. It is charac-terized by insects with a strongly variable wing spot, rang-ing from complete absence (waterstoni-type), to a rather broad spot reaching the wing tip (xanthostoma type), and all transitions in between (taurica, tchaldirica, erevansense, mingrelica, amasina-types). Understanding this group is probably crucial to understanding the evolution of the C. splendens complex. The most parsimonious expla-nation we can derive from our data is that the spotless waterstoni is an atavistic type of Calopteryx splendens (tacitly considering C. hyalina and exul as older and separate spe-cies), which used to live at least along the southern and western shores of the Black Sea and in the Danube basin. It crossed the Danube-Atlantic divide and extended to Brit-ain and Ireland in the north, and France in the West. Inter-basin migration by Calopteryx is not rare (Chaput-Bardy et al., 2008), especially if there are no steep mountains at the borders of the basins. One difficulty with this hypothesis is the position of C. xanthostoma, which appears from other studies to be rather distant from splendens (Dumont, 1972; Weekers et al., 2001), but this was not confirmed by our previous studies (Sadeghi et al., 2009, 2010). Perhaps wing shape is not suitable for resolving the status of this taxon.
The third cluster is composed of populations from West-ern Asia, including south Anatolia and the zone of the Bal-kans fringing the Mediterranean. It is characterized by large insects with broad wing spots (often leaving only a small basal space un-coloured, and typically reaching the wing spot). In addition, androchrome females (females with col-oured wings) are typical of this group. The range of this group is very large and centers on the Caspian, and rivers
Fig. 6. Thin-plate deformation grids of the wing shapes. For abbreviations see Material and methods.
581
such as Volga, Ural, Amu-Darya and Syr-Darya and even Irtysh, which may have been important in enabling this group to reach even Xinjiang (China) and South-Western Mongolia. This is especially true since this zone of Western Asia was greatly affected by climate change and in particu-lar the more humid periods, which resulted in the conflu-ence of the Black and Caspian seas, repeatedly alternating with drier periods. We hypothesize that the cradle of this group was somewhere in the Caspian area, perhaps along its currently arid Eastern shore. The oldest name that ap-plies to it is Calopteryx ancilla Hagen in Selys, 1853 from Kaliningrad in the Baltic (intermedia, a more frequently used name, had better be restricted to populations from Western Asia). Rather “pure” populations of this taxon are still to be found along the eastern margin of the Cauca-sus in Azerbaijan. The southern margin of the Caspian is bounded by the Elburz chain and inhabited by a distinct member of this group, viz. Calopteryx orientalis, in which almost all females are androchromic.
A qualitative reconstruction of what has happened after the Pleistocene and shaped these three clusters is that an insect akin to if not identical to Calopteryx waterstoni first colonized most of Europe and Asia, perhaps from its ori-gin along the southern Black Sea. A later wave, composed of ancilla-like insects, followed and hybridized with waterstoni, producing a plethora of phenotypes that were de-scribed by morphological taxonomists under the variety of names (not aimed at being complete) cited earlier. All these are, in fact, hybrids, and Calopteryx splendens splendens (terra typica Southern England) is one of them. There are clines in wing spot size, among others in France (Dumont et al., 1993).
The origin of the East Asian (Tadjik-Kyrgyz-Kazakh) cluster is also to be found in such a two-wave phenom-enon, but it is possible that these populations initiated an early evolution of their own, expressed in a unique wing shape. For some reason, many hybrid populations loose their androchromic females, or, as in C. splendens faivrei in South-Western France and, to a lesser degree, Calopteryx splendens caprai in continental Italy, androchromes become scarce. In “pure” populations, like those isolated in the coastal hills of Hatay Province, Turkey and Syria, all females are androchromic, similar to the Elburz- Kopet Dag C. orientalis colonies. Support for the “two wave” hy-pothesis is also found at the margins of the range: here, the remnants of the first wave are perhaps best detected, espe-cially on islands or protected by mountains, and thus areas hard to colonize by the second wave. Thus, in the Crimea, types with strongly decoloured wings occur in the foot hills of the Crimean coastal Mountains, along short rivers draining these mountains to the Black Sea. Immediately behind the mountain chain, one finds ancilla-like popula-tions. Likewise, populations in Ireland and Jutland are taurica and even waterstoni-like, and even within the Danube basin, such relicts can be found, especially in the upper tributaries, which should have been the last to be colonized (at Donaueschingen: Ris, 1918, fide Rüppell et al., 2005; on the Vils river: Seidenbusch, 1994). Such phenotypes
have recently been discovered as far east as the Lena catch-ment in Siberia, and named C. splendens njuja: Kosterin & Sivtseva, 2009). All are indistinguishable from “primary” hybrids between pure waterstoni in its small coastal relict home in north-eastern Anatolia and banded Calopteryxes originating from the Anatolian plateau, themselves hybrids of more ancient origin (see Dumont et al., 1987). In fact, the taurica phenotype occurs at least four of five widely distant locations and, rather than advocating a polyphyletic origin or homoplasy, can best be understood by postulating two waves of dispersal with ensuing hybridization.
REfERENCEs
adamS d.C., roHlf f.J. & SliCe d. 2004: Geometric morphomet-rics: ten years of progress following the ‘revolution’. — Ital. J. Zool. 71: 5–16.
aSaHina S. 1976: Indian paddy field Odonata taken by Miss I. Hattori. — Mushi 46: 115–127.
bookSTein F.L. 1991: Morphometric Tools for Landmark Data: Geometry and Biology. Cambridge Univ. Press, Cambridge, 435 pp.
bookSTein F.L. 1996: Combining the tools of geometric mor-phometrics. In Marcus L.F., Corti M., Loy A., Naylor G.J.P. & Slice D.E. (eds): Advances in Morphometrics. Plenum Press, New York, pp. 131–152.
bookSTein F.L. 1997: Shape and the information in medical im-ages: a decade of the morphometric synthesis. — Comput. Vision Image Under. 66: 97–118.
CHapuT-bardy a., lemaiTre C., piCard d. & SeCondi J. 2008: In-stream and overland dispersal across a river network influences gene flow in a freshwater insect, Calopteryx splendens. — Mol. Ecol. 17: 3496–3505.
Claude J., paradiS e., Tong H. & auffray J.-C. 2002: A geo-metric morphometric assessment of the effects of environment and cladogenesis on the evolution of the turtle shell. — Biol. J. Linn. Soc. 79: 485–501.
Cordoba-aguilar a. & Cordero-rivera A. 2005: Evolution and ecology of Calopterygidae (Zygoptera: Odonata): Status of knowledge and future research perspectives. — Neotrop. Entomol. 34: 861–879.
dumonT H.J. 1972: The taxonomic status of Calopteryx xanthostoma (Charpentier, 1825) (Zygoptera: Calopterygidae). — Odo natologica 1: 21–29.
dumonT H.J., demirSoy a. & verSCHuren D. 1987: Breaking the Calopteryx-bottleneck: taxonomy and range of Calopteryx splendens waterstoni Schneider, 1984 and C. splendens tschaldirica Bartenef, 1909 (Zygoptera: Calopterygidae). —Odonatologica 16: 239–247.
dumonT H.J., merTenS J. & de CoSTer W. 1993: The Calopteryx splendens cline in southwestern France, analyzed by quantita-tive wingspot analysis (Zygoptera: Calopterygidae). — Odonatologica 22: 345–351.
dumonT H.J., WeekerS p.H.H., vanfleTeren J.r. & JonCkHeere d.e. 2005: Phylogenetic relationships, divergence time estima-tion and global biogeographic patterns of calopterygoid dam-selflies (Odonata, Zygoptera) inferred from ribosomal DNA sequences. — Syst. Biol. 54: 347–362.
goodall C.R. 1991: Procrustes methods in the statistical analysis of shape. — J. R. Stat. Soc. (B) 53: 285–339.
Hammer Ø.y. & Harperd A.T. 2007: PAST – Paleontological Statistics, version 1.62. (http://folk.uio.no/ohammer/past).
kendall D.G. 1997: The diffusion of shape. — Adv. Appl. Probab. 9: 428–430.
582
koSkimaki J., markuS k.i., ranTala J., TaSkinen J., Tynkkynen k. & SuHonen K. 2004: Immunocompetence and resource holding potential in the damselfly, Calopteryx virgo L. — Behav. Ecol. 15: 169–173.
koSTerin o.e. & SivTSeva L.V. 2009: Odonata of Yakutia (Rus-sia), with description of Calopteryx splendens njuja ssp. nov. (Zygoptera: Calopterygidae). — Odonatologica 38: 113–132.
mCpeek M.A. 1990: Behavioral differences between Enallagma species (Odonata) influencing differential vulnerability to predators. — Ecology 71: 1714–1726.
milliken g.a. & JoHnSon D.E. 1984: Analysis of Messy Data. Vol. 1. Designed Experiments. Van Nostrand Reinhold, New York, NY, 473 pp.
miSof b., anderSon C.l. & HadryS H. 2000: A phylogeny of the damselfly genus Calopteryx (Odonata) using mitochondrial 16S rDNA markers. — Mol. Phylogen. Evol. 15: 5–14.
ranTala m.J., koSkimaki J., TaSkinen J., Tynkkynen k. & SuHonen J. 2000: Immunocompetence, developmental stability and wingspot size in the damselfly Calopteryx splendens. — Proc. R. Soc. Lond. (B) 267: 2453–2457.
riCklefS r.e. & mileS D.B. 1994: Ecological and evolutionary inferences from morphology: an ecological perspective. In Wainwright P.C. & Reilly S.M. (eds): Ecological Morphology. Integrative Organismal Biology. University of Chicago Press, Chicago, IL, pp. 13–41.
riS f. 1918: Der Artbegriff, insbesondere in der Entomologie. — Mitt. Entomol. (Zürich) 4: 261–278.
roHlf F.J. 1998: On applications of geometric morphometrics to studies of ontogeny and phylogeny. — Syst. Biol. 47: 147–158.
roHlf F.J. 2000: NTSYSpc Numerical Taxonomy and Multivariate Analysis System. Version 2.1 User Guide. Dept Ecol. & Evol., St. Univ. New York, Stony Brook, NY.
roHlf F.J. 2002: Geometric morphometrics and phylogeny. In MacLeod N. & Forey P.L. (eds): Morphology, Shape and Phylogeny. Systematics Association Special Volume Series 64. Taylor and Francis, London, pp. 175–193.
roHlf F.J. 2003: tpsSmall, Version 1.20 ed. Dept Ecol. & Evol., St. Univ. New York, Stony Brook, NY.
roHlf F.J. 2004: Thinplate Spline, Digitize Landmarks and Outlines, Version 1.20. Dept Ecol. & Evol., St. Univ. New York, Stony Brook, NY.
roHlf F.J. 2006: tpsDig2, Digitize Landmarks and Outlines, Version 2.10. SUNY at Stony Brook.
roHlf F.J. 2007: tpsRelw, Relative Warps Analysis, Version5/13/05. Department of Ecology and Evolution, State Uni-versity of New York, Stony Brook, NY.
roHlf F.J. 2010: tpsDig2, Digitize Landmarks and Outlines, Version 2.10. Dept Ecol. & Evol., St. Univ. New York, Stony Brook, NY.
rüppell g., HilferT-rüppell d., reHfeldT g. & SCHüTTe C. 2005: Die Prachtlibellen Europas. Gattung Calopteryx. Die Neue Brehm-Bücherei 654. Westarp, Magdeburg, 256 pp.
SadegHi S., adriaenS D. & dumonT H.J. 2009: Geometric mor-phometric analysis of wing shape variation in ten European populations of Calopteryx splendens Harris (1782) (Zygoptera: Odonata). — Odonatologica 38: 343–360.
SadegHi S., kyndT T. & dumonT H.J. 2010: Genetic diversity, population structure and taxonomy of Calopteryx splendens (Odonata: Calopterygidae) an AFLP analysis. — Eur. J. Entomol. 107: 137–146.
SCHmidT E. 1961: Ergebnisse det Deutschen Afghanisatn-Expe-dition 1956 der Landessammlungen für Naturkunde Karlsruhe sowie der Expeditionen J. Klapperich, Bonn 1952–53 und Dr. K. Lindberg, Lund (Schweden) 1957–60. — Beitr. Naturk. Forsch. SüdwDtl. 19: 399–435.
SeidenbuSCH R. 1994: Anmerkungen zur Variabilität des dunklen Flügelfleckes bei Calopteryx splendens splendens Harris. — Acta Albert. Ratisb. 49: 209–212.
SHeeTS H.D. 2000: Integrated Morphometrics Package (IMP). Available at http://www3.canisius.edu/~sheets/moremorph.html
Siva-JoTHy M.T. 1999: Male wing pigmentation may affect repro-ductive success via female choicein a calopterygid damselfly (Zygoptera). — Behaviour 136: 1365–1377.
Siva-JoTHy M.T. 2000: A mechanistic link between parasite re-sistance and expression of sexually selected trait in a damselfly. — Proc. R. Soc. Lond. (B) 267: 2523–2527.
SliCe d.e. & bookSTein F.L. 2007: A glossary for geometric mor-phometrics. Online, http://life.bio.sunysb.edu/morph/glossary/gloss1.html
Sokal R.R. & roHlf F.J. 1995: Biometry: The Principles and Practice of Statistics in Biological Research. 3rd. ed. W.H. Freeman, San Francisco, 887 pp.
Tynkkynen k., ranTala m.J. & SuHonen J. 2004: Interspecific aggression and character displacement in the damselfly. — J. Evol. Biol. 17: 259–267.
WeekerS p.H.H., de JonCkHeere J.f. & dumonT H.J. 2001: Phy-logenetic relationships inferred from ribosomal ITS sequences and biogeographic patterns in representatives of the genus Calopteryx (Insecta: Odonata) of the West Mediterranean and adjacent West European zone. — Mol. Phylogen. Evol. 20: 89–99.
ZeldiTCH m.l., SWiderSki d.l., SHeeTS H.d. & fink W.L. 2004: Geometric Morphometrics for Biologists: A Primer. Elsevier Acad. Press, London, 437 pp.
Received November 9, 2013; revised and accepted May 9, 2014Prepublished online August 29, 2014
583
appendix 2. PCA Scatter diagram (Min. span tree) of 20 Eura-sian populations. For abbreviations see Material and methods.
appendix 1. Map showing the distribution of subspecies of Calopteryx splendens.