POPULATION-LEVEL RIGHT-PAW PREFERENCE IN RATS ASSESSED BY A NEW COMPUTERIZED FOOD-REACHING TEST
15
1675 Intern. J. Neuroscience, 113:1675–1689, 2003 Copyright Taylor & Francis Inc. ISSN: 0020-7454 / 1543-5245 online DOI: 10.1080/00207450390249258 POPULATION-LEVEL RIGHT-PAW PREFERENCE IN RATS ASSESSED BY A NEW COMPUTERIZED FOOD-REACHING TEST MUSTAFA GÜVEN Department of Biophysics Medical School, Çukurova University Adana, Turkey DERYA DENIZ ELALMIS ¸ SEÇIL BINOKAY ÜNER TAN Neurophysiology Unit, Department of Physiology Medical School, Çukurova University Adana, Turkey We re-studied the distribution of paw preference in rats using a new computerized food-reaching test, which recorded the times and time intervals between the single right- and left-paw entries. Using the tradi- tional food-reaching test, we found that of 144 rats, 72.7% were right- handed, 19.7% left-handed, and 7.6% mixed-handed. This population- level J-shaped right-hand preference did not fit a binomial chance dis- tribution (25:25:50). Of right-handers, 99.5% first used their right paw and 0.5% left paw; of left-handers, 98.6% first used their left paw and 1.4% right paw. Of mixed-handers, 59% first used the right paw and 41% left paw for food reaching. The time interval between putting the rat into the test cage and the first right-paw entry was significantly shorter than the first left-paw entry in total sample. Males were faster than females (shorter time intervals between right- or left-paw entries). The distribution of the time intervals between right- or left-paw entries Received 30 May 2003. Address correspondence to Prof. Dr. Üner Tan, Head of the Neurophysiology Unit, Department of Physiology, Medical School, Cukurova University, Adana, Turkey. E-mail: [email protected].
-
Upload
independent -
Category
Documents
-
view
0 -
download
0
Transcript of POPULATION-LEVEL RIGHT-PAW PREFERENCE IN RATS ASSESSED BY A NEW COMPUTERIZED FOOD-REACHING TEST

1675
Intern. J. Neuroscience, 113:1675–1689, 2003Copyright Taylor & Francis Inc.ISSN: 0020-7454 / 1543-5245 onlineDOI: 10.1080/00207450390249258
POPULATION-LEVEL RIGHT-PAWPREFERENCE IN RATS ASSESSED
BY A NEW COMPUTERIZEDFOOD-REACHING TEST
MUSTAFA GÜVENDepartment of BiophysicsMedical School, Çukurova UniversityAdana, Turkey
DERYA DENIZ ELALMISSEÇIL BINOKAYÜNER TANNeurophysiology Unit, Department of PhysiologyMedical School, Çukurova UniversityAdana, Turkey
We re-studied the distribution of paw preference in rats using a newcomputerized food-reaching test, which recorded the times and timeintervals between the single right- and left-paw entries. Using the tradi-tional food-reaching test, we found that of 144 rats, 72.7% were right-handed, 19.7% left-handed, and 7.6% mixed-handed. This population-level J-shaped right-hand preference did not fit a binomial chance dis-tribution (25:25:50). Of right-handers, 99.5% first used their right pawand 0.5% left paw; of left-handers, 98.6% first used their left paw and1.4% right paw. Of mixed-handers, 59% first used the right paw and41% left paw for food reaching. The time interval between putting therat into the test cage and the first right-paw entry was significantlyshorter than the first left-paw entry in total sample. Males were fasterthan females (shorter time intervals between right- or left-paw entries).The distribution of the time intervals between right- or left-paw entries
Received 30 May 2003.Address correspondence to Prof. Dr. Üner Tan, Head of the Neurophysiology Unit, Department
of Physiology, Medical School, Cukurova University, Adana, Turkey. E-mail: [email protected].

1676 M. Güven et al.
was inverse J-shaped, which exhibited a normal distribution after tak-ing the logarithms of the time intervals. There was no significant differ-ence between time intervals for the left-paw entries; time intervals forthe right-paw entries were significantly shorter in males than females,accentuating the role of the left brain for sex differences in motor con-trol. The results suggested that humans are not unique in population-level right-hand preference; our new method would be suitable for newdevelopments in handedness research.
Keywords food reaching, handedness, laterality, paw preference, paw skill
Is the human being unique in population-level right-handedness?There is a considerable debate about this subject in the scientificliterature. Until recently, there was a general tendency towards theuniqueness of man in handedness (see for a review, Elalmis, Ozgunen,Binokay, Tan, Ozgunen, & Tan, 2003). This consensus was, how-ever, challenged in 1987 by MacNeilage, Studdert-Kennedy, andLindblom; there is now accumulating evidence for population-levelasymmetries in animals, suggesting that this is not exclusively dueto humans (see Bisazza, Rogers, & Vallortigara, 1998). There areindeed numerous studies with evidence for the presence of popula-tion-level right-handedness in animals (see for a review, Elalmis etal., 2003).
In rats, a population-level right-handedness was reported since1930 (see Elalmis et al., 2003; Glick & Ross, 1981; Pence, 2002;Tang & Verstynen, 2002; Tsai & Maurer, 1930; Waters & Denenberg,1994; Whishaw, Pellis, & Gomy, 1992). “There are structural andfunctional asymmetries at the population level in fish, amphibians,and reptiles” (Bisazza, Rogers, & Vallortigara, 1998). Similar tohumans, the hand preference in rats is controlled by the contralat-eral primary motor cortex, since handedness is reversed after abla-tion of this region (Castro-Alamancos & Borrell, 1993). Recently,Elalmis et al. (2003) have reported a population-level right-pawpreference in rats, providing further strong support for the argumentthat humans are not unique in hand preference and that a homologyexists between human and rat reaching movement (see Whishaw etal., 1992). There are, however, some other reports indicating nopopulation-level right-handedness in rats (Collins, 1985; Otmakhava,1989; Whishaw et al., 1992). According to Tang and Verstynen

Paw Preference in Rats 1677
(2002), “these seemingly inconsistent results in the literature can beexplained in terms of the differences among testing methods.”
Elalmis et al. (2003) have recently used a different method forassessing hand preference in rats. They evaluated the frequency ofpaw reaching, the number of the paw entries within 10 min, insteadof simple counting of paw entries without considering the time, andfound that the distribution of paw preference in rats is J-shaped, andthere is a right-sided population bias in handedness as in humans. Inthe present work, the time intervals between the consequent pawreaches were measured using a new computerized method insteadof a global paw frequency (numbers of paw reaches in a limitedtime period).
The estrus cycle was determined after testing for hand prefer-ence, since the estrus cycle was shown to influence the asymmetriccerebral functions in rats (see for instance, Robinson, Camp, Jacknow,& Becker, 1982); the inconsistent results concerning the paw pref-erence of rats may also be accounted for by fluctuations in sexhormone levels during the estrus cycle. In accord, it was recentlyshown that the estrus cycle was a significant factor influencing theright- and left-paw entry scores in female rats (see Elamis et al.,2003). Therefore, we have also determined the phase of the estruscycle by examining the vaginal smears, which were taken after test-ing for paw preference, to avoid any effect of a stressor on handpreference (see Fitzgerald, Glick, & Carlson, 1990).
MATERIALS AND METHODS
Animals
The experiments were performed on male and female Wistar ratsadapted to the animal room for at least two weeks. The animalswere housed in groups of 3–4 and maintained on a 12-h light–darkcycle. Before testing for paw preference, the rats were deprived offood for two days and then individually placed in a metal housingcage for testing. On the test day, the rats were first weighed; it wasrequired that they 1ose 15% of their initial weight after being fooddeprived for two days.

1678 M. Güven et al.
Assessment of Estrus Cycle in Female Rats
Stress is reported to be primarily responsible for the marked right-sided population bias in male rats during T-maze learning (Fitzgerald,Glick, & Carlson, 1990). To avoid such a bias in our rats, vaginalsmears were taken from the vulva for the evaluation of the estruscycle, immediately after food-reaching test. The vagina was washedwith saline and a small smear was taken into the tip of an Eppendorftube. The smear was then put on the surface of a microscope glass,stained with methylene blue, and examined under microscope. Thevaginal cytology can be used as an endocrine assay, especially forestrogen. There is a marked increase in blood estrogen levels duringproestrus. During diestrus, the blood estrogen concentration is lowbut gradually increases; during proestrus, the blood estrogen con-centration markedly increases, decreasing during estrus, which isassociated with high progesterone levels. These estrous stages canbe recognized from vaginal smears.
Paw Preference
The paw preference of rats was essentially assessed by the methodused by Tang and Verstynen (2002): there were two opening in thefront of the testing cage, separated by 1 cm. These openings weresmall enough to allow access to food rewards by the forepaws, notby the snout. Rats were classified as right-, left-, and mixed-handersbased on the binomial probability distribution test (see Betaneur,Neveu, & Moal, 1991): rats were considered right-pawed if the right-paw entry (RPE) score was equal to or greater than 29, left-pawed ifthe left-paw entry (LPE) score was equal to or smaller than 21, andambidextrous when the RPE score was between 22 and 28. The pawpreference was followed for successive 6 days; only the results forthe 5th day were analyzed in the present work, since the paw pref-erence stabilized during this time (see Elalmis et al., 2003). Theanimals were weighed every day to control the daily loss of theweight, which should not exceed 15% of the original body weight.
A computer was used for recording the fast and accurate times ofreaching movements, using computer-software, which was referredby us as “Activity Logger.” This software was written in C++ pro-gramming language and was run under Windows98 operating system.
Paw Preference in Rats 1679
The software included a time counter in 1 ms precision, loggingwindows, buttons, and menus. When the experiment was startedafter putting the rat into the test cage, the time counter was startedby pressing the “start button.” At each paw entry, the appropriatebuttons for the right- and left-paw entries were pressed on the key-board of the computer. During this procedure, the time counter con-tinuously recorded the times between paw entries. In doing this, wecould record the time intervals for the right- and left-paw entries. Atthe end of the experiment, the data were saved as a text file, whichincluded four different columns: RPE (the times for the consequentRPEs), LPE (the times for the consequent LPEs). The saved datawere then analyzed using a statistical package, SPSS for Windows,V 10.0.1
Statistical Analysis
SPSS for Windows (V. 10) was used for the statistical analysis ofdata. Eta squared, the proportion of the total variability in the de-pendent variable that is accounted for by variation in the indepen-dent variable, was calculated for each significant ANOVA result.After recording the times for each paw entry, the instantaneous fre-quency was calculated by taking the reversal of the time intervalbetween paw entries (sec–1). A low value of the instantaneous fre-quency indicated slow paw reaching, and high value correspondedto fast paw reaching following a previous paw entry.
RESULTS
Distribution of Global Paw Preference
Table 1 presents the numbers and percentages of the male and fe-male right-, left-, and mixed-pawed rats. There was no significantsex difference between the relative numbers of the right-, left-, andmixed-handers (χ2 = 4.6, df = 2, p > .05).
1. For detailed information concerning the software, Dr. Mustafa Güven can be contacted([email protected]).

1680 M. Güven et al.
In the total sample, all categories (right-handers, left-handers, andmixed-handers) were not equally distributed (χ2 = 142.7, df = 2, p <.001). The binomial test rejected the 0.50 test proportion betweenright- (N = 144, 79.0%) and left-handers (N = 39, 21.0%), afterexcluding the mixed-handers (p < .001, based on Z approximation).The frequencies of the right-, left-, and mixed-handed rats did alsonot fit to 25:25:50, expected from a binomial distribution (χ2 =253.9, df = 2, p < .001).
Considering strongly right-handed rats (RPE > 45), strongly left-handed rats (RPE < 5), and mixed-handers (RPE = 5 to 45), of 197rats, 70 (35.5%) were strongly right-handed, 9 (4.6%) were stronglyleft-handed, and 118 (59.9%) were mixed-handed. There was nosignificant sex difference in the numbers of these subgroups (χ2 =5.1, df = 2, p > .05), although the numbers of the strongly right-handed (N = 52/133, 39.1%) and strongly left-handed (N = 8/133,6.0%) females exceeded the number of the strongly right-handed(N = 18/64, 28.1%) and strongly left-handed (N = 1/64, 1.6%) males;there were more mixed-handed males (N = 45/64, 70.3%) than fe-males (N = 73/133, 54.9%).
Figure 1 illustrates the distribution of the RPE scores per 50trials in the male (B) and female (A) rats. The distribution of pawpreference in rats seemed to be J-shaped, neither U-shaped nor nor-mal. The preponderance and accumulation of the right- and left-handed female rats and mixed-handedness in male rats are visible inFigure 1A and 1B, respectively.
Although the weight of the rats was kept constant for each test-ing day, any correlation between weight and RPE scores was exam-ined to be certain about the effects of weight on food reaching. The
TABLE 1. Numbers and percentages of right-, left-, and mixed-handed male andfemale rats
Right-handers Left-handers Mixed-handers
Rats N % N % N %
Total 144 72.7 39 19.7 15 7.6Females 96 72.2 30 22.6 7 5.3Males 48 73.8 9 13.8 8 12.3

Paw Preference in Rats 1681
statistical analysis indicated that there was no significant correlationbetween these parameters (r = –.14, N = 196, p > .10).
First Paw Used for Food Reaching
In right-handed rats, of 2032 trials the number of the RPE was 2022(99.5%) first used to reach the food, there were only 10 (0.5%)LPE first used for food reaching. The left-handed rats exhibited an
FIGURE 1. Distribution of right-paw entry scores (right + left = 50) in the female (A)and male (B) rats. Abscissa: RPE score; ordinate: percentage of rats.
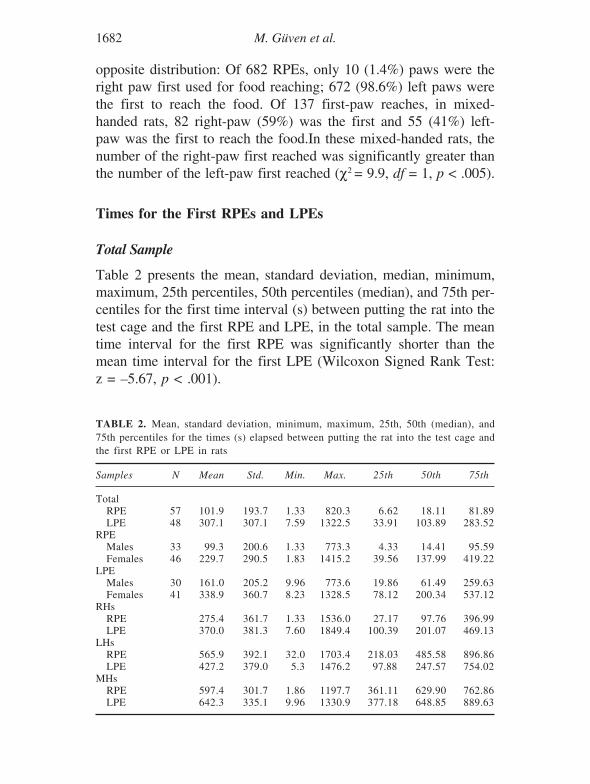
1682 M. Güven et al.
opposite distribution: Of 682 RPEs, only 10 (1.4%) paws were theright paw first used for food reaching; 672 (98.6%) left paws werethe first to reach the food. Of 137 first-paw reaches, in mixed-handed rats, 82 right-paw (59%) was the first and 55 (41%) left-paw was the first to reach the food.In these mixed-handed rats, thenumber of the right-paw first reached was significantly greater thanthe number of the left-paw first reached (χ2 = 9.9, df = 1, p < .005).
Times for the First RPEs and LPEs
Total Sample
Table 2 presents the mean, standard deviation, median, minimum,maximum, 25th percentiles, 50th percentiles (median), and 75th per-centiles for the first time interval (s) between putting the rat into thetest cage and the first RPE and LPE, in the total sample. The meantime interval for the first RPE was significantly shorter than themean time interval for the first LPE (Wilcoxon Signed Rank Test:z = –5.67, p < .001).
TABLE 2. Mean, standard deviation, minimum, maximum, 25th, 50th (median), and75th percentiles for the times (s) elapsed between putting the rat into the test cage andthe first RPE or LPE in rats
Samples N Mean Std. Min. Max. 25th 50th 75th
TotalRPE 57 101.9 193.7 1.33 820.3 6.62 18.11 81.89LPE 48 307.1 307.1 7.59 1322.5 33.91 103.89 283.52
RPEMales 33 99.3 200.6 1.33 773.3 4.33 14.41 95.59Females 46 229.7 290.5 1.83 1415.2 39.56 137.99 419.22
LPEMales 30 161.0 205.2 9.96 773.6 19.86 61.49 259.63Females 41 338.9 360.7 8.23 1328.5 78.12 200.34 537.12
RHsRPE 275.4 361.7 1.33 1536.0 27.17 97.76 396.99LPE 370.0 381.3 7.60 1849.4 100.39 201.07 469.13
LHsRPE 565.9 392.1 32.0 1703.4 218.03 485.58 896.86LPE 427.2 379.0 5.3 1476.2 97.88 247.57 754.02
MHsRPE 597.4 301.7 1.86 1197.7 361.11 629.90 762.86LPE 642.3 335.1 9.96 1330.9 377.18 648.85 889.63

Paw Preference in Rats 1683
Sex Differences
The mean time for the first RPE was significantly shorter in malesthan females (Mann-Whitney Test: z = –17.7, p < .001). The 25th,50th, and 75th percentiles for the first RPE in males were also lessthan females (see Table 2).
The mean time for the first LPE was significantly shorter in malesthan females (z = –12.56, p < .001). The 25th, 50th, and 75th per-centiles in males were also less than those in females (see Table 2).
Right-, Left-, and Mixed-Handers
As expected, the time for the first RPE was significantly shorterthan the time for the first LPE in right-handed (RPE > 28) rats(Wilcoxon Signed Rank Test: z = –17.06, p < .001). Accordingly,the percentile values were also shorter in males than females (seeTable 2).
In left-handed rats, the mean time interval for the first LPE wassignificantly shorter than that for the first RPE (Wilcoxon SignedRanks Test: z = –8.82, p < .001). The percentile values for the firstLPE were also less than the first RPE (see Table 2).
In mixed-handed rats (RPE, there was no significant differencebetween the time intervals for the first RPE and the first LPE (seeTable 2; Wilcoxon Signed Rank Test: z = –0.42, p > .65).
Distribution of Time Intervals BetweenConsequent Paw Reaches
Figure 2 illustrates the distribution of time intervals between conse-quent paw entries for the right (A) and left (B) paws. One-sampleKolmogorov Smirnov Test indicated that the time intervals betweenthe consequent right- and left-paw reaches did not fit normal distri-butions (A: right paw, z = 989, p < .001; B: left paw, z = 7.43, p <.001). They seemed to be inverse J-shaped distributions. However,the distributions were normal after taking the logarithms of the timeintervals (C: RPE, z = 1.27, p > .05; D: left paw, z = 1.02, p > .20).
Table 3 presents the means and median values of the time inter-vals (s) between the consequent paw entries in the total sample,males, and females. As seen in Table 3, the mean and median values

1684 M. Güven et al.
for the time intervals were significantly greater for the left-pawentries than the right-paw entries (Wilcoxon Signed Rank Test: z =4.77, p < .001): the times between the single paw reaches weresignificantly shorter between the right-paw reaches than the left-paw reaches in the total sample. After taking the logarithms of thetime intervals, to obtain a normal distribution and use parametricstatistics instead of nonparametric statistics, the mean time intervalbetween the right-paw entries was found to be significantly longerthan the mean time interval between the left-paw entries, for thetotal sample (t = 9.91, df = 3186, p < .00l).
1684 M. Güven et al.
FIGURE 2. Distribution of time intervals between consequent paw entries for RPE (A)and LPE (B) in total sample. Abscissa: time interval (s); ordinate: number of RPE in Aand number of LPE in B. RPE (C) and LPE (D) above histograms after logarithmic trans-formations of the time intervals (C: RPE, D: LPE).

Paw Preference in Rats 1685
The mean time interval between the consequent right-paw reacheswere found to be significantly shorter in males than in females (Mann-Whitney U Test: z = 6.83, p < .001). The mean log
10 RPE-time
interval was also significantly shorter in males than females (F1, 2385
= 56.95, p < .001). With regard to the sex difference in the meanLPE-time intervals, the mean LPE-time intervals was shorter in fe-males than males (see Table 3) but the difference was statisticallynonsignificant (Mann-Whitney U Test: z = 1.39, p > .15). The loga-rithmic scale for the LPE-time intervals did also not reveal anysignificant sex difference (F
1, 1063 = 2.36, p > .10).
Concerning the handedness for the RPE-time intervals, the right-handers (RPE > 25) exhibited significantly shorter RPE-time inter-vals than the left-handers (see Table 3; Mann-Whitney U Test: z =6.49, p < .001); logarithmic transformation of the RPE-time inter-vals also yielded the same results (F
1, 2385 = 60.66, p < .001). How-
ever, the mean LPE-time interval was significantly shorter in left-handers than right-handers, for the raw data (z = 2.97, p < .005) andfor the log data (F
1, 1063 = 11.22, p = .001).
Time Intervals in Males and Females for RPE and LPE
Mann-Whitney Test indicated that there was a sex difference onlyfor the RPEs in right-handed rats: the time intervals for the conse-quent RPEs were significantly shorter in males than females (z =
TABLE 3. Mean and median values of time differences between consequent RPEs intotal samples, male and female rats
INTERVAL Log INTERVALNumber INTERVAL LogINTER
Rats of paws Mean SD median Mean SD median
RPE (TOT) 2387 6.5 7.3 3.85 0.605 0.42 0.586LPE (TOT) 1065 11.3 14.6 5.62 0.779 0.49 0.752RPE (M) 1148 5.1 4.8 3.38 0.538 0.38 0.532RPE (F) 1239 7.7 8.8 4.50 0.666 0.44 0.653LPE (M) 223 14.3 18.2 6.29 0.824 0.57 0.798LPE (F) 842 10.5 13.4 5.49 0.768 0.47 0.736RPE (RH) 2247 6.0 6.6 3.72 0.588 0.41 0.572RPE (LH) 140 13.1 12.5 8.93 0.870 0.51 0.951LPE (RH) 373 15.2 19.4 6.63 0.848 0.57 0.822LPE (LH) 692 9.2 10.6 5.14 0.743 0.44 0.711

1686 M. Güven et al.
–5.67, p < .001); the time intervals for the consequent LPEs werenot significantly different in males and females (z = –0.34, p > .70).In left-handed rats, there was also no significant sex difference forthe consequent time intervals for the LPEs (z = –0.12, p > .90);however, the male rats had significantly shorter time intervals thanfemales for the RPEs (z = –2.30, p < .05). The total sample yieldedsimilar results: the consequent time intervals between the RPEs weresignificantly shorter in males than females (z = –6.83, p < .001);there was, however, no significant sex difference between the con-sequent time intervals for the LPEs (z = –1.39, p > .15).
DISCUSSION
Global Hand Preference
In accord with the traditional assessment of hand preference, thenumbers of the right- and left-paw entries were counted till the sumof the paw reaches reached 50. The results of the present work wereconsistent with those from the same laboratory (see Elalmis et al.,2003): there was a population-level right-hand preference in rats(RHs: 80%, LHs: 13.3%, MHs: 6.7%). In accordance, Pence (2002)has recently found similar percentages for his 114 Sprague-Dawleyrats: 70.2% RHs, 19.3% LHs, and 11.9% MHs. These results suggestthat the distribution of hand preference in rats is similar to humanhand preference, and reject the uniqueness of men in a population-level right-handedness (see Elamis et al., 2003 for a review of hand-edness in animals). The results are also in agreement with previousstudies in rodents (Glick & Ross, 1981; Tang & Verstyenen, 2002;Tsai & Maurer, 1930; Waters & Denenberg, 1994), and providefurther support for the notion that a homology exists between handpreference in humans and rats. There are of course other studiesindicating a chance distribution of animal handedness (see for areview Elalmis et al., 2003).
Considering the strong right-handers, strong left-handers, and in-between (mixed) handers, the percentages were found to be 35.5%,4.6%, and 59.9% for the strongly right-handed, strongly left-handed,and mixed-handed rats, respectively. These proportions are close to

Paw Preference in Rats 1687
humans: Tan (1988) has reported that the consistent right-handerscomprised 32.4% (35.5% in rats) and mixed-handers comprised 49.5%(59.9% in rats) in the Turkish university students. Considering thegrasp-reflex asymmetries, the percentages of the strongly right-handed(35.5%), strongly left-handed (4.6%), and mixed-handed (59.9%)rats were close to the percentages of the right-hand dominance (25.7%),left-hand dominance (8.3%), and mixed-handedness (66.0%) in graspreflex of human neonates (see Tan & Tan, 1999).
The distribution of the hand preference (RPE scores) in our ratswas not U-shaped opposite to a generally accepted belief (see Bulman-Fleming, Bryden, & Rogers, 1997). It was, however, J-shaped likethe distribution of hand preference in humans (see Tan, 1988). Thepercentages of the right-, left-, and mixed-handedness did not fit a25:25:50 distribution expected from a binomial chance distribution.
Supporting the above results (i.e., overwhelmingly right-paw pref-erence in the male and female rats) 99.5% of the right-handed rats,first used their right paw to reach the food, only 0.5% of these usedthe left paw to reach the food. So, the right-handers were reallyright-handed in paw preference. Contrary to right-handers, 98.6% ofthe left-handed rats first used their left paw to reach the food pallet,only 1.4% first used their right paw in food reaching. As expectedfrom a mixed-handed population, nearly half of the mixed-handedrats (59.0%) first used their right paw, and 41% first used their leftpaw in food reaching test. These results indicate that not only thenumber of the RPE significantly exceeded the number of LPE inright-handed rats, the right-handed rats preferred their right handand the left-handed rats preferred their left hand for the first food-reaching task. These results also indicate that a behavioral (psy-chological) trait (preference) reflects the cerebral motor asymmetry.
The time interval between putting the rats into the test cage andthe first paw reach was different in right-, left-, and mixed-handedrats: the time for the first RPE was significantly shorter than thefirst LPE in right-handed rats, vice versa in left-handed rats; therewas no significant difference between the first RPE and first LPE inmixed-handed rats. So, the right-handed rats first used their rightpaw to reach the food in a shorter time than the left paw; the left-handed rats first used their left paw in a shorter time than the rightpaw; the mixed-handed rats randomly used both paws to reach the

1688 M. Güven et al.
food without any significant difference between times for the firstRPE and LPE for food reaching.
The male rats were faster than the female rats in the first RPE aswell as the first LPE. The male rats were also faster than females ingeneral food reaching (see RESULTS); the time intervals betweenthe consequent paw reaches were significantly shorter in males thanfemales, but the sex difference in the consequent time intervals wassignificant only for the RPEs, not for the LPEs in right-handers andleft-handers. This interesting result suggests that the left brain isimportant for the speedy timing of the right-paw reaches in right-and left-handed rats.
Conclusions
The present study introduced a new method to assess handedness inrats. This was a computerized method to analyze the time intervalsbetween the consequent paw entries. Contrary to the general belief,the distributions of the global RPEs (right + left = 50) was J-shapednot U-shaped. The distribution of the time intervals between theconsequent RPEs was also J-shaped as in human hand preference.Only after logarithmic transformation of the raw data, did the timesbetween RPEs and LPEs exhibit a Gaussian (normal) distribution.The male rats were faster than females; there was a sex differencein the time intervals for the RPEs, but not for the LPEs, accentuat-ing the role of the left brain for sex differences in motor control.
REFERENCES
Betaneur, C., Neveu, P. J., & Le Moal, M. (1991). Strain and sex differences in the degreeof paw preference in mice. Behavioral Brain Research, 45, 97–101.
Bisazza, A., Rogers, L. J., & Vallortigara, G. (1998). The origins of cerebral asymmetry:A review of evidence of behavioural and brain lateralization in fishes, reptiles, andamphibians. Neuroscience and Behavioural Reviews, 22, 411–426.
Bulman-Fleming, M. B., Bryden, M. P., & Rogers, T. T. (1997). Mouse paw preference:Effects of variations in testing protocol. Behavioral Brain Research, 86, 79–87.
Castro-Alamancos, M. A., & Borrell, J. (1993). Reversal of paw preference after ablationof the preferred forelimb primary motor cortex representation of the rat depends on thesize of the forelimb representation. Neuroscience, 52, 637–644.
Collins, R. L. (1985). On the inheritance of direction and degree of asymmetry. In S. D.Glick (Ed.), Cerebral lateralization in nonhuman species (pp. 41–71). New York: AcademicPress.

Paw Preference in Rats 1689
Elalmis, D. D., Ozgunen, K. T., Binokay, S., Tan, M., Ozgunen, T., & Tan, U. (2003).Differential contributions of right and left brains to paw skill in right- and left-handedfemale rats. International Journal of Neuroscience, 113, 1023–1042.
Fitzgerald, L. W., Glick, S. D., & Carlson, J. N. (1990). Right-sided population bias inmale rats: Role of stress. Physiology & Behavior, 48, 475–477.
Glick, S. D., & Ross, D. A. (1981). Right-sided population bias and lateralization of activ-ity in normal rats. Brain Research, 205, 222–225.
MacNeilage, P. F., Studdert–Kennedy, M. G., & Lindbiom, B. (1987). Primate handednessreconsidered. Behavioral and Brain Sciences, 10, 247–303.
Otmakhava, N. A. (1989). Sexual differences in certain forms of motor asymmetry in rats.Zhurnal Evoliutsionnoi Biokhimii i Fiziologii, 25, 623–627.
Pence, S. (2002). Paw preference in rats. Basic Clinical Physiology and Pharmacology,13, 41–49.
Robinson, T. E., Camp, D. M., Jacknow, D. S., & Becker, J. B. (1982). Behavioral BrainResearch, 6, 273–287.
Tan, U. (1988). The distribution of hand preference in normal men and women. Interna-tional Journal of Neuroscience, 41, 35–55.
Tan, U., & Tan, M. (1999). Incidencies of asymmetries for the palmar grasp reflex inNeonates and hand preference in adults. NeuroReport, 10, 3253–3256.
Tang, A. C., & Verstynen, T. (2002). Early life environment modulates ‘handedness inrats. Behavioral Brain Research, 131, 1–7.
Tsai, L. S., & Maurer, S. (1930). Right-handedness in white rats. Science, 72, 436–438.Waters, N. S., & Denenberg, V. H. (1994). Analysis of two measures of paw preference in
a large population of inbred mice. Behavioral Brain Research, 63, 195–204.Whishaw, I. Q., Pellis, S. M., & Gorny, B. P. (1992). Medial frontal cortex lesions impair
the aiming component of rat reaching. Behavioral Brain Science, 50, 93–104.