Population genetic structure of male black grouse (Tetrao tetrix L.) in fragmented vs. continuous...
10
Molecular Ecology (2003) 12, 2297–2305 doi: 10.1046/j.1365-294X.2003.01903.x © 2003 Blackwell Publishing Ltd 2Blackwell Publishing Ltd. Population genetic structure of male black grouse (Tetrao tetrix L.) in fragmented vs. continuous landscapes ALAIN CAIZERGUES,*¶†† OSMO RÄTTI,† PEKKA HELLE,‡ LUCA ROTELLI,§ LAURENCE ELLISON, ¶ and JEAN-YVES RASPLUS ** * CEFE-CNRS, 1919 Route de Mende, 34293 Montpellier Cedex 5, France, † Arctic Centre, University of Lapland, P.O.Box 122, FIN- 96101 Rovaniemi, Finland, ‡ Finnish Game and Fisheries Institute, Oulu Game and Fisheries Research, Tutkijantie 2 A FIN-90570 Oulu, Finland, § Zoological Institute, Conservation Biology, University of Bern, Baltzerstrasse 6, CH-3012 Bern, Switzerland, ¶ ONCFS, 8 impasse Champ Fila, 38320 Eybens, France, ** CBGP-INRA, Campus International de Baillarguet, CS 30016, 34988 Montferrier-sur-Lez Cedex, France Abstract We investigated the association of habitat fragmentation with genetic structure of male black grouse Tetrao tetrix. Using 14 microsatellites, we compared the genetic differenti- ation of males among nine localities in continuous lowland habitats in Finland to the genetic differentiation among 14 localities in fragmented habitats in the Alps (France, Swit- zerland and Italy). In both areas, we found significant genetic differentiation. However, the average differentiation, measured as θ, was more than three times higher in the Alps than in Finland. The greater differentiation found in the Alps is probably due to the presence of mountain ridges rising above natural habitats of the species, which form barriers to gene flow, and to a higher influence of genetic drift resulting from lower effective sizes in highly fragmented habitats. The detection of isolation by distance in the Alps suggests that gene flow among populations does occur. The genetic variability measured as gene diversity H E and allelic richness A was lower in the Alps than in Finland. This could result from the higher fragmentation and/or from the fact that populations in the Alps are isolated from the main species range and have a lower effective size than in Finland. This study suggests that habitat fragmentation can affect genetic structure of avian species with relatively high dis- persal propensities. Keywords: Bayesian clustering, black grouse, dispersal, genetic diversity, habitat fragmentation, isolation by distance, microsatellites, Tetrao tetrix Received 14 February 2003; revision received 21 May 2003; accepted 21 May 2003 Introduction Habitat fragmentation is an ongoing anthropogenic process, the effects of which need to be fully understood if we are to effectively manage landscapes, populations and species. Habitat fragmentation can affect genetic structure both directly and indirectly, through its effects on gene flow by restricting dispersal and/or reducing neighbourhood effective population size and by increasing the effects of genetic drift in small habitat patches (review in Frankham et al . 2002). However, it is unclear to what extent habitat fragmentation represents population fragmentation. More- over, the degree and the type of habitat fragmentation can have different effects on connectivity depending both on the species and the context. The effect of habitat fragmentation might be greater if it occurs in contexts where other habitat components restrict dispersal or if the populations/spe- cies concerned have limited dispersal ability. Therefore examining genetic structure across a range of habitat fragmentation in different contexts would be informative. Habitat fragmentation evidently restricts movements less in birds than in terrestrial vertebrates. This may explain why much lower levels of genetic differentiation are usually observed in birds than in mammals, reptiles or amphibians (Avise 1996; Busch et al . 2000; Crochet 2000; Ehrich & Stenseth 2001; Ehrich et al . 2001; Goossens et al . 2001; Lee et al . 2001; Wang & Schreiber 2001). Strong genetic dif- ferentiation between bird populations is ascribed either to Correspondence: Alain Caizergues. ††Present address: ONCFS, 53 Rue Russeil, 44000 Nantes, France. Fax: 33 (0) 2 40 48 14 01, E-mail: [email protected]
-
Upload
independent -
Category
Documents
-
view
0 -
download
0
Transcript of Population genetic structure of male black grouse (Tetrao tetrix L.) in fragmented vs. continuous...

Molecular Ecology (2003)
12
, 2297–2305 doi: 10.1046/j.1365-294X.2003.01903.x
© 2003 Blackwell Publishing Ltd
2Blackwell Publishing Ltd.
Population genetic structure of male black grouse (
Tetrao tetrix
L.) in fragmented vs. continuous landscapes
ALAIN CAIZERGUES,
*¶††
OSMO RÄTTI ,
†
PEKKA HELLE,
‡
LUCA ROTELLI ,
§
LAURENCE ELLISON,
¶
and JEAN-YVES RASPLUS
**
*
CEFE-CNRS, 1919 Route de Mende, 34293 Montpellier Cedex 5, France,
†
Arctic Centre, University of Lapland, P.O.Box 122, FIN-96101 Rovaniemi, Finland,
‡
Finnish Game and Fisheries Institute, Oulu Game and Fisheries Research, Tutkijantie 2 A FIN-90570 Oulu, Finland,
§
Zoological Institute, Conservation Biology, University of Bern, Baltzerstrasse 6, CH-3012 Bern, Switzerland,
¶
ONCFS, 8 impasse Champ Fila, 38320 Eybens, France,
**
CBGP-INRA, Campus International de Baillarguet, CS 30016, 34988 Montferrier-sur-Lez Cedex, France
Abstract
We investigated the association of habitat fragmentation with genetic structure of maleblack grouse
Tetrao tetrix
. Using 14 microsatellites, we compared the genetic differenti-ation of males among nine localities in continuous lowland habitats in Finland to thegenetic differentiation among 14 localities in fragmented habitats in the Alps (France, Swit-zerland and Italy). In both areas, we found significant genetic differentiation. However, theaverage differentiation, measured as θθθθ
, was more than three times higher in the Alps thanin Finland. The greater differentiation found in the Alps is probably due to the presence ofmountain ridges rising above natural habitats of the species, which form barriers to geneflow, and to a higher influence of genetic drift resulting from lower effective sizes in highlyfragmented habitats. The detection of isolation by distance in the Alps suggests that geneflow among populations does occur. The genetic variability measured as gene diversity
H
E
and allelic richness
A
was lower in the Alps than in Finland. This could result from thehigher fragmentation and/or from the fact that populations in the Alps are isolated from themain species range and have a lower effective size than in Finland. This study suggests thathabitat fragmentation can affect genetic structure of avian species with relatively high dis-persal propensities.
Keywords
: Bayesian clustering, black grouse, dispersal, genetic diversity, habitat fragmentation,isolation by distance, microsatellites,
Tetrao tetrix
Received 14 February 2003; revision received 21 May 2003; accepted 21 May 2003
Introduction
Habitat fragmentation is an ongoing anthropogenic process,the effects of which need to be fully understood if we areto effectively manage landscapes, populations and species.Habitat fragmentation can affect genetic structure bothdirectly and indirectly, through its effects on gene flowby restricting dispersal and/or reducing neighbourhoodeffective population size and by increasing the effects ofgenetic drift in small habitat patches (review in Frankham
et al
. 2002). However, it is unclear to what extent habitatfragmentation represents population fragmentation. More-
over, the degree and the type of habitat fragmentation canhave different effects on connectivity depending both onthe species and the context. The effect of habitat fragmentationmight be greater if it occurs in contexts where other habitatcomponents restrict dispersal or if the populations/spe-cies concerned have limited dispersal ability. Thereforeexamining genetic structure across a range of habitatfragmentation in different contexts would be informative.
Habitat fragmentation evidently restricts movementsless in birds than in terrestrial vertebrates. This mayexplain why much lower levels of genetic differentiationare usually observed in birds than in mammals, reptiles oramphibians (Avise 1996; Busch
et al
. 2000; Crochet 2000;Ehrich & Stenseth 2001; Ehrich
et al
. 2001; Goossens
et al
. 2001;Lee
et al
. 2001; Wang & Schreiber 2001). Strong genetic dif-ferentiation between bird populations is ascribed either to
Correspondence: Alain Caizergues. ††Present address: ONCFS,53 Rue Russeil, 44000 Nantes, France. Fax: 33 (0) 2 40 48 14 01,E-mail: [email protected]

2298
A . C A I Z E R G U E S
E T A L .
© 2003 Blackwell Publishing Ltd,
Molecular Ecology
, 12, 2297–2305
philopatry (Avise 1996) or to habitats gap of hundredskilometres separating populations (Yang & Patton 1981;Bouzat
et al
. 1998a). However, landscape features includinghabitat fragmentation can potentially affect gene flow insome ground dwelling birds with restricted flight capacityor narrow habitat requirements (e.g. Boone & Rhodes 1996).Even birds that fly well can suffer from the detrimentaleffects of habitat fragmentation. For example, in NorthernAlps, capercaillie (
Tetrao urogallus
) populations occurring inhighly fragmented landscapes on the fringe of their rangedisplay stronger genetic differentiation and lower variabilitythan core populations (Segelbacher & Storch 2002).
The black grouse (
Tetrao tetrix
) is a ground dwellingtetraonid closely related to the capercaillie. The male ofboth species display in groups on leks, which promotes ahigh variance in male mating success (Höglung & Alatalo1995). This high variance in male mating success togetherwith male philopatry (Caizergues & Ellison 2002; Warren& Baines 2002) has the potential for promoting the forma-tion of groups of kin males. This implies that a strongergenetic structure in males than in females would be detect-able at the intrapopulation scale (Höglund
et al
. 1999). Incontrast to male black grouse, females disperse up to 30 kmfrom their natal area whatever the habitat type and thedegree of fragmentation (Marjakangas
et al
. 1991; Caizergues& Ellison 2002; Warren & Baines 2002). Although mostblack grouse males are philopatric, some settle up to 8.5 kmfrom their natal area (Caizergues & Ellison 2002; Rätti —unpublished data).
In the Alps, black grouse mainly occur in open for-ests, treeline habitats and alpine meadows at an altitudeof 1000–2300 m above sea level Due to extensive habitatloss and fragmentation in western and central Europe(Storch & Segelbacher 2000; Storch 2000), black grousepopulations in the Alps are declining and are becomingincreasingly isolated from the main range of the species(Bernard-Laurent 1994; Storch 2000). Suitable habitats formpatches of 1 to > 100 km
2
separated by valleys, towns, skistations, agricultural land, watercourses and mountain ridgesrising above the upper limit of natural habitats of the species.In the Alps, suitable habitats comprise only one third ofthe area within the boundaries of the distribution range ofthe species (French Observatory of Mountain Galliforms,unpublished data). In favourable patches, breedingdensities range from less than 1 individual/km
2
−
57individuals/km
2
(mean breeding density = 7.3 individuals/km
2
, based on 42 patches of 0.5–20 km
2
sampled in 2001)(French Observatory of Mountain Galliforms 2001). Radio-tracking has shown that black grouse of either sex can copewith habitat fragmentation in most circumstances. They oftenmigrate between separate wintering and breeding groundsup to 14 km apart, even when these ranges are separatedby wide expenses of unfavourable habitat (Ellison
et al
.1989; Caizergues & Ellison 2002). On the other hand,
black grouse never cross mountain ridges rising above theupper limit of their natural habitat (Caizergues & Ellison2002).
About 78% of the total area of Finland is forested (Peltola2001). Most of the forested area is suitable habitat for blackgrouse at some time of the year, with breeding densitiesranging from 5.6 to 15.6 individuals/km
2
(mean breedingdensity = 7.8 individuals/km
2
). The connectivity of habitatssuitable for black grouse has not been studied in Finland.However, forests are continuously distributed, being onlyoccasionally interrupted by towns, agricultural land, lakesand watercourses. Moreover, the proportion of suitable forestsis so high that the isolation of patches should have onlyminor effect on population connectivity. The thresholdbelow which the populations are effectively disconnectedbecause of isolation of habitat patches would be around30% of suitable habitat left (Andrén 1994; With
et al
. 1997).To evaluate the effect of habitat fragmentation on
genetic structure and variability of black grouse popula-tions, we compared the patterns found in continuous low-land populations in Finland with the patterns in highlyfragmented landscapes in the Alps. We predicted both alower variability and a higher genetic divergence amonglocalities in the Alps than in Finland because in the Alpsmountain ridges may impede gene flow and becauseneighbourhood effective population sizes and densitiesare lower than in Finland.
Materials and methods
Sampling design
Wings, liver, muscle, feathers and toes were collectedfrom male black grouse shot during the hunting seasons(September–November) of 1997–2000. In the Alps, a totalof 349 samples were collected in 14 localities along a north–south transect of approximately 300 km. In Finland, samplesof 140 males were collected in nine localities along an east–west transect of approximately 500 km (Fig. 1, Table 1).The average Euclidean distances between localities were132 km (min = 14 km, max = 285 km) in the Alps and 185 km(min = 29 km, max = 492 km) in Finland.
Hunting practices, which are comparable in both areas,are mainly to shoot grouse flushed eventually with the helpof barking or pointing dogs. The size of sampling areas wassimilar in the Alps and Finland and was approximately400–900 km
2
. In the Alps, the size and shape of each sam-pling areas was chosen to correspond to the definition of asubpopulation based on prior knowledge of populationspatial structure of black grouse gathered using radio-tracking (Caizergues & Ellison 2002). Home-range size variesfrom 1 to 20 km
2
depending on the sex and season. Someblack grouse use disjoint summer and winter ranges separ-ated by up to 15 km. While most males settle in their natal

P O P U L A T I O N G E N E T I C S T R U C T U R E O F
T E T R A O T E T R I X
L .
2299
© 2003 Blackwell Publishing Ltd,
Molecular Ecology
, 12, 2297–2305
forest patch, 90% of females leave it, usually settling in a forestpatch in the same large valley/watershed of 400–1000 km
2
.In Finland, where black grouse habitats are almost contin-uously distributed, our sampling design correspondsmore to a random sample of individuals within an area ofarbitrary size and shape. Performed at this spatial scale,sample collection minimized including kin males, therebyreducing the probability of catching a possible geneticsubsubstructure recently evidenced in black grouse males(but not in females) at a local scale (50
×
50 km, see Höglund
et al
. 1999). Furthermore, because in most sites sampleswere collected over 2–4 years, many of the males producedeach year in a given area would be offspring of femaleimmigrants thereby diluting the effects of male philopatry.
Dna extraction and genotyping
DNA was extracted using DNeasy Tissue Kit (Qiagen Inc.,standard protocol). Thirteen microsatellites initially devel-oped for black grouse (TTD2, TTD3, TTD5, TTD6, TTT1,TTT2, Caizergues
et al
. 2001; BG5 Höglund personalcommunication), the grouse
Lagopus l. scoticus
(LLSD4 Piertney
& Dallas 1997) and capercaillie
Tetrao urogallus
(TUT1,TUT3, TUT4, TUD4, TUD6, Segelbacher
et al
. 2000) wereused for genotyping. In addition, a CATC microsatellite(TTT3) was specifically developed for this study, Forwardprimer: 5
′
-ATTAGCAAACGAACCAGCCA-3
′
, Reverseprimer: 5
′
-GCTCTGAATCTGCCCATCTCT-3
′
(annealing tem-perature = 58
°
C). Therefore, 14 microsatellites are used tocharacterize our samples.
Amplifications were performed in volumes of 10
µ
Lcontaining 1
µ
L of genomic DNA, 1.25 m
m
of MgCl
2
, 1
µ
Lof 10
×
buffer (10 m
m
Tris-HCl, 50 m
m
KCl and 0.1% TritonX-100), 0.4 units of
Taq
polymerase (Promega), 0.4
µ
m
ofeach primer, 1
µ
Ci of
α
33
P-dATP (ICN), 75
µ
m
of dBTP,and 6
µ
m
of dATP. Amplifications were carried out in aPTC 100 thermocycler (MJ Research inc.) using a ‘touchdown’ procedure (Don
et al
. 1991). After an initial denatur-ing step of 94
°
C for 3 min, 10 cycles were performed eachconsisting of 92
°
C for 20 s, 30 s of annealing starting 5
°
Cabove the optimal annealing temperature and dropping by1
°
C per cycle, and an extension step of 72
°
C for 30 s. Wealso included a further 20 cycles consisting of 92
°
C for 30 s,30 s of annealing at 55
°
C, 52
°
C or 50
°
C and 72
°
C for 30 s,
Fig. 1 Location of the sampling sites (seeTable 1 for sample sizes, years of samplecollection and the name of localities). Shaded-grey areas show the current distribution ofblack grouse in the region.

2300
A . C A I Z E R G U E S
E T A L .
© 2003 Blackwell Publishing Ltd,
Molecular Ecology
, 12, 2297–2305
and a 10-min extension step at 72
°
C following the lastannealing step. Amplification products were run for threeto six hours on 6% polyacrylamide denaturating gels. Gelswere dried and visualised by autoradiography. Informa-tion for each locus, including annealing temperatures aresummarized in related papers.
Statistical analyses
Allele frequencies, observed heterozygosities (
H
O
), genediversity (
H
E
) (Nei 1978), allelic richness (
A
) and allelicrichness corrected for a common sample size of eight indi-viduals (
A
n
) were computed for each locality using
fstat
(2.9.3version, Goudet 1999). Departures from Hardy–Weinbergexpectations, linkage disequilibrium and genotypic differ-entiation were assessed for each locality or locality pair usingexact tests implemented in
genepop
(3.3 version, Raymond& Rousset 1995; Rousset 2000).
θ
was used as an estimatorof population divergence (Weir & Cockerham 1984).
Both
A
n
and
H
E
were compared between the Alps andFinland by performing global tests using linear generalmodelling procedures with GLIM (Generalized InteractiveModelling) software (NAG 1986). The nonindependenceamong loci was accounted for by including a locus effect inthe model. The independent variable tested was the area(Alps coded 1 vs. Finland coded 2). Within an area each
locality was considered as a random sample. Data were
Ln
transformed to ensure homogeneity of variance. We testedfor differences in the levels of genetic differentiationbetween the Alps and Finland by comparing per locus
θ
-values using the Wilcoxon paired-sample test (Zar 1999).
We also investigated spatial genetic structure using theBayesian method of Pritchard
et al
. (2000), implementedin the program
structure
. This method is used to assignindividuals to a user-defined number of clusters (
K
).The most likely value of
K
is assessed by comparing thelikelihood of the data for different values of
K
. The pro-gramme was run with a burning period of 100 000 and500 000 repetitions (‘identity of population of origin’ optionset off).
Finally, using the Mantel procedure we tested for an iso-lation by distance effect for both Finland and the Alps by cor-relating
θ
/(1
−
θ
) with the logarithm of the Euclidean distance(in kilometres) between pairs of localities (Rousset 1997).
Results
Genetic polymorphism, hardy–weinberg expectations and linkage disequilibrium
Most loci presented substantial polymorphism with meanobserved heterozygosities at each locus in each study site
Locality name
Latitude-Longitude
Sample size
Years of sample collection
Alps1 Haute-Roya 44.05° N−7.36° E 45 1997−19982 Haute-Tinée 44.11° N−7.03° E 23 1997−19993 Haut-Var 44.08° N−6.46° E 16 1997−20004 Queyras 44.47° N−6.52° E 44 1997−19985 Maurienne (upstream) 45.12° N−6.40° E 11 1999−20006 Maurienne (downstream) 45.18° N−6.14° E 50 1997−20007 Vanoise 45.25° N– 6.38° E 22 1997−20008 Beaufortain 45.43° N−6.35° E 15 1997−19989 Aravis 45.52° N−6.30° E 25 1997−199910 Mont-Blanc 45.55° N−6.52° E 9 1998−200011 Valais (downstream) 46.09° N−7.11° E 23 1996−200012 Valais (upstream) 46.27° N−8.15° E 17 200013 Devero 46.18° N−8.16° E 38 1999−200014 Vigezzo 46.08° N−8.28° E 11 1999
Finland1 Köyliö/Harjavalta/Kokemäki 61.17° N−22.21° E 18 1997−19992 Siikainen 61.53° N−21.54° E 10 1997−20003 Parkano/Kihniö 62.12° N−23.11° E 24 1997−20004 Korpilahti 62.01° N−25.33° E 9 1998−20005 Petäjävesi 62.15° N−25.12° E 12 1997−20006 Toivakka 62.10° N−26.08° E 21 1997−20007 Pylkönmäki/Saarijärvi 62.43° N−25.16° E 20 1997−20008 Kinnula/Viitasaari 63.13° N−25.56° E 17 1997−20009 Sotkamo/Suomussalmi 64.41° N−28.25° E 9 1997−2000
Table 1 Origin and number of blackgrouse samples and years of collection. Thenumbers in the first column refer to thelabelling of localities used in Fig. 1
P O P U L A T I O N G E N E T I C S T R U C T U R E O F T E T R A O T E T R I X L . 2301
© 2003 Blackwell Publishing Ltd, Molecular Ecology, 12, 2297–2305
ranging from 0.25 to 0.88 and mean number of allelesranging from 3.6 to 8.5. A total of 196 distinct alleles wasresolved at the 14 loci, and the total number of alleles ateach locus ranged from 7 for TUD6–23 for TTD5.
In no locality in the Alps or Finland did we detect anydepartures from Hardy–Weinberg expectations or anylinkage disequilibrium using sequential Bonferroni. Thefact that neither departure from Hardy–Weinberg nor link-age disequilibrium was detected in any localities suggeststhat our sampling scheme was effective in excludingrelated individuals. Therefore the birds for each localityapparently corresponded to a random sample with little orno genetic substructure.
Pattern of genetic differentiation
Significant genotypic differentiation between localitieswas found both in the Alps and in Finland. However, thelevel of differentiation was on average more than threetimes higher in the Alps (Alps: mean = 0.056, range 0.017–0.105; Finland: mean θ = 0.017, range 0.004–0.039, Wilcoxontest for paired samples P < 0.0001, Table 2). In the Alps, allpairwise exact tests for genotypic differentiation weresignificant at the level α = 0.05, and only three θ-values hada 95% confidence interval overlapping with zero. In Finland,31 of 36 pairwise exact tests were significant at the level α= 0.05, but more than one third of θ estimates had a 95%confidence interval overlapping with zero. All loci presenteda higher θ-value in the Alps than in Finland (Table 2).
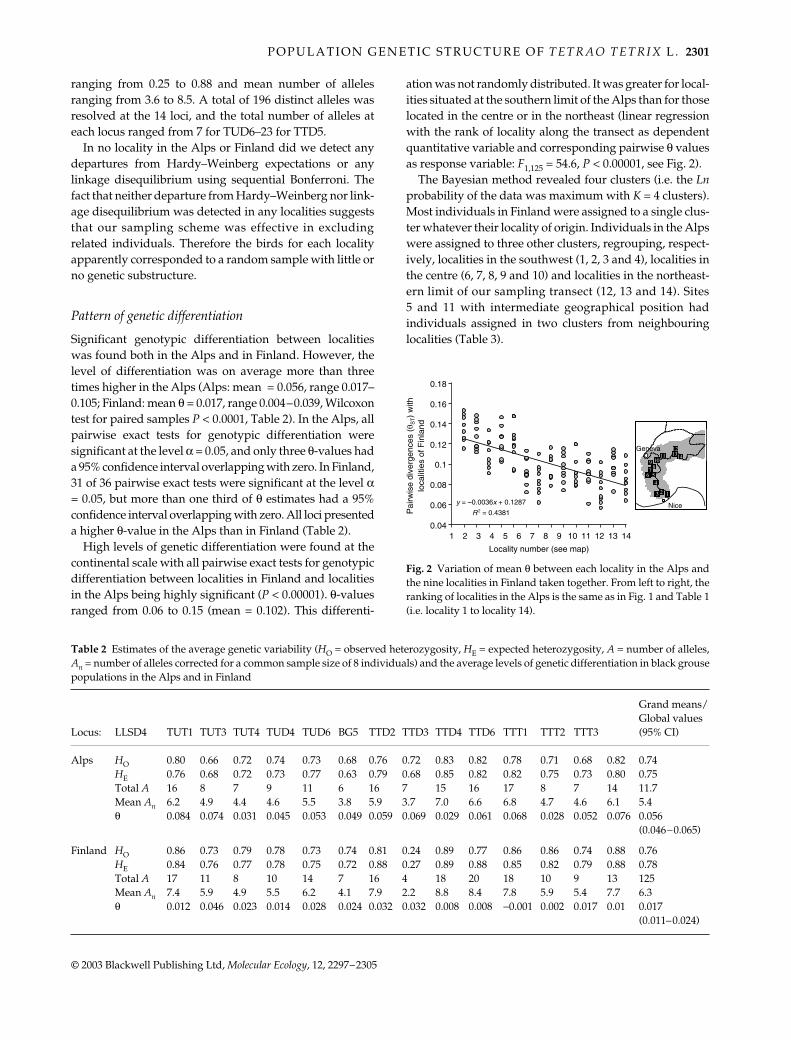
High levels of genetic differentiation were found at thecontinental scale with all pairwise exact tests for genotypicdifferentiation between localities in Finland and localitiesin the Alps being highly significant (P < 0.00001). θ-valuesranged from 0.06 to 0.15 (mean = 0.102). This differenti-
ation was not randomly distributed. It was greater for local-ities situated at the southern limit of the Alps than for thoselocated in the centre or in the northeast (linear regressionwith the rank of locality along the transect as dependentquantitative variable and corresponding pairwise θ valuesas response variable: F1,125 = 54.6, P < 0.00001, see Fig. 2).
The Bayesian method revealed four clusters (i.e. the Lnprobability of the data was maximum with K = 4 clusters).Most individuals in Finland were assigned to a single clus-ter whatever their locality of origin. Individuals in the Alpswere assigned to three other clusters, regrouping, respect-ively, localities in the southwest (1, 2, 3 and 4), localities inthe centre (6, 7, 8, 9 and 10) and localities in the northeast-ern limit of our sampling transect (12, 13 and 14). Sites5 and 11 with intermediate geographical position hadindividuals assigned in two clusters from neighbouringlocalities (Table 3).
Table 2 Estimates of the average genetic variability (HO = observed heterozygosity, HE = expected heterozygosity, A = number of alleles,An = number of alleles corrected for a common sample size of 8 individuals) and the average levels of genetic differentiation in black grousepopulations in the Alps and in Finland
Locus: LLSD4 TUT1 TUT3 TUT4 TUD4 TUD6 BG5 TTD2 TTD3 TTD4 TTD6 TTT1 TTT2 TTT3
Grand means/Global values (95% CI)
Alps HO 0.80 0.66 0.72 0.74 0.73 0.68 0.76 0.72 0.83 0.82 0.78 0.71 0.68 0.82 0.74HE 0.76 0.68 0.72 0.73 0.77 0.63 0.79 0.68 0.85 0.82 0.82 0.75 0.73 0.80 0.75Total A 16 8 7 9 11 6 16 7 15 16 17 8 7 14 11.7Mean An 6.2 4.9 4.4 4.6 5.5 3.8 5.9 3.7 7.0 6.6 6.8 4.7 4.6 6.1 5.4θ 0.084 0.074 0.031 0.045 0.053 0.049 0.059 0.069 0.029 0.061 0.068 0.028 0.052 0.076 0.056
(0.046–0.065)
Finland HO 0.86 0.73 0.79 0.78 0.73 0.74 0.81 0.24 0.89 0.77 0.86 0.86 0.74 0.88 0.76HE 0.84 0.76 0.77 0.78 0.75 0.72 0.88 0.27 0.89 0.88 0.85 0.82 0.79 0.88 0.78Total A 17 11 8 10 14 7 16 4 18 20 18 10 9 13 125Mean An 7.4 5.9 4.9 5.5 6.2 4.1 7.9 2.2 8.8 8.4 7.8 5.9 5.4 7.7 6.3θ 0.012 0.046 0.023 0.014 0.028 0.024 0.032 0.032 0.008 0.008 −0.001 0.002 0.017 0.01 0.017
(0.011–0.024)
Fig. 2 Variation of mean θ between each locality in the Alps andthe nine localities in Finland taken together. From left to right, theranking of localities in the Alps is the same as in Fig. 1 and Table 1(i.e. locality 1 to locality 14).

2302 A . C A I Z E R G U E S E T A L .
© 2003 Blackwell Publishing Ltd, Molecular Ecology, 12, 2297–2305
Finally, a significant isolation-by-distance effect wasdetected both in the Alps (P = 0.00011) and in Finland(P = 0.0065) as shown in Fig. 3.
Distribution of genetic variability
Gene diversity (HE) was lower in the Alps (overall = 0.75) thanin Finland (overall = 0.78) but the difference was not signi-ficant (F1,308 = 2.8, P = 0.09, Table 2). In contrast, both allelicrichness An and total number of alleles per locus A were signi-ficantly lower in the Alps than in Finland (An: F1,308 = 54.75,P < 0.00001; A: Wilcoxon paired-sample test P = 0.022). Therewas on average one allele per locus less in the Alps than inFinland (Table 2). In the Alps, localities from the northeastdisplayed lower allelic richness (An) than localities fromthe southwest (Table 4) but gene diversity (HE) did notvary according to locality. No variations in HE or An weredetected in Finland (all P-values > 0.05) (Table 4).
Discussion
Fragmentation and spatial genetic structure
This study suggests that habitat fragmentation can havesubstantial effects on the population genetic structure ofa bird species with a relatively high capacity of dispersal(Caizergues & Ellison 2002; see also Segelbacher & Storch
2002). The higher level of differentiation in the Alps wasconsistent across loci suggesting a higher influence ofgenetic drift and/or limited gene flow following habitatfragmentation than natural selection.
Cluster 1 Cluster 2 Cluster 3 Cluster 4
Alps1 Haute-Roya 0.96 0.01 0.02 0.012 Haute-Tinée 0.92 0.01 0.06 0.013 Haut-Var 0.86 0.02 0.11 0.014 Queyras 0.83 0.04 0.13 0.015 Maurienne (upstream) 0.34 0.03 0.62 0.016 Maurienne (downstream) 0.09 0.02 0.90 0.017 Vanoise 0.06 0.04 0.90 0.028 Beaufortain 0.04 0.04 0.90 0.029 Aravis 0.05 0.13 0.82 0.0110 Mont-Blanc 0.04 0.03 0.92 0.0111 Valais (downstream) 0.05 0.20 0.70 0.0312 Valais (upstream) 0.05 0.89 0.04 0.0213 Devero 0.01 0.95 0.02 0.0214 Vigezzo 0.04 0.80 0.15 0.01
Finland1 Köyliö/Harjavalta/Kokemäki 0.02 0.01 0.01 0.962 Siikainen 0.01 0.01 0.01 0.973 Parkano/Kihniö 0.02 0.02 0.02 0.944 Korpilahti 0.01 0.02 0.03 0.945 Petäjävesi 0.01 0.02 0.01 0.966 Toivakka 0.01 0.01 0.01 0.977 Pylkönmäki/Saarijärvi 0.01 0.02 0.03 0.948 Kinnula/Viitasaari 0.01 0.01 0.01 0.979 Sotkamo/Suomussalmi 0.02 0.02 0.03 0.92
Table 3 Proportion of membership of eachpredefined population/locality in each clus-ter inferred from the Bayesian method ofPritchard et al. (2000)
Fig. 3 Pairwise genetic differentiation between sampling sitesplotted against the Neperian logarithm of Euclidean distance (inkilometres) computed for fragmented (Alps: open circles) vs.continuous (Finland: dark circles) black grouse populations.

P O P U L A T I O N G E N E T I C S T R U C T U R E O F T E T R A O T E T R I X L . 2303
© 2003 Blackwell Publishing Ltd, Molecular Ecology, 12, 2297–2305
Differences in dispersal propensities between the Alpsand Finland may also explain the differences of geneticdivergence. However, available data suggests patterns ofdispersal are very consistent across a wide range of habitattypes in black grouse (Marjakangas et al. 1991; Caizergues& Ellison 2002; Warren & Baines 2002). Patterns of nataldispersal are analogous in the Alps (males = 1.5 km,females = 8.0 km, Caizergues & Ellison 2002) and inScotland (males < 1 km, females = 9.3 km, Warren & Baines2002). Moreover, the distances moved during the springphase of natal dispersal are of the same order of magnitudein Finland (males = 1.7 km, females = 8.6 km) (Rätti unpub-lished data), Scotland (males = 1 km, females = 5.8 km)and in the Alps (males = 2.7 km, females = 4.8 km). There-fore, differences in dispersal distances do not seem to be aplausible explanation for the higher levels of genetic differ-entiation found in the Alps than in Finland.
In the Alps, radio-tracking has shown that black grouseof both sexes frequently move among forest patches separ-ated by 2–3 km and fly similar distances over valleys ofnonhabitat. But birds are reluctant to cross ridges rising abovetheir natural habitats (Caizergues & Ellison 2002; see alsoSegelbacher & Storch 2002). Therefore, the limiting effectof mountain ridges on dispersal could explain part of the
greater genetic divergence among localities found in theAlps compared to Finland. Much weaker levels of geneticdifferentiation (average θ = 0.01) were detected betweenrock ptarmigan Lagopus mutus populations of the Alps eventhough, generation time, effective population size/densities,dispersal propensities, and the patchiness of habitats of thisspecies are similar to that of the black grouse (Caizergueset al. 2003). The difference is that rock ptarmigans are morelikely than black grouse to fly over mountain ridges, whichare often a component of their natural habitat.
Genotypic differentiation significantly increased withgeographical distance in both the fragmented and the con-tinuous context. This isolation-by-distance effect impliesthat populations are connected by gene flow or were con-nected in the recent past. If this isolation by distance effectindeed reflects contemporary gene flow, rocky ridges and/or habitat fragmentation are not totally preventing dis-persal in the Alps. Gene flow is probably occurring becausebirds move along forested drainages over long distance(more than 30 km) and occasionally cross from one valleyto the next by traversing low mountain passes (Caizergues& Ellison 2002).
Inter-regional differentiation
Highly significant levels of differentiation were detectedbetween localities in the Alps and in Finland. This geno-typic differentiation was not randomly distributed. Onaverage, differentiation between the southern Alps andFinland was greater than differentiation between thenortheastern Alps and Finland. Because the northeasternAlps were historically connected to the main range of thespecies, which includes Finland, this signifies either thatgene flow between the Alps and the main range still occurson a regular basis, or that the isolation of the Alps from themain range is so recent that its effects are not yet detectable.
Sex-biased dispersal and genetic structure
Sex biased dispersal has been shown to affect genetic struc-ture of the sexes both empirically (Piertney et al. 1998; Surridgeet al. 1999) and on theoretical grounds (see Chesser 1991;Mossman & Waser 1999). When sampling is performedafter natal dispersal has occurred but before reproduction,a stronger genetic differentiation is expected for the philo-patric sex. Because only the philopatric sex (males) wassampled in the present study, and that some individualsmight have dispersed before the end of the samplingseason (Caizergues & Ellison 2002), population differ-entiation might be underestimated. However, in Finland,where 60 females could be sampled over the same areaas males, the average θ estimated at 12 of the 14 lociused in the present study was 0.0193, a value similar to thatobtained in males (0.0157). This therefore suggests that if our
Table 4 Mean gene diversities HE and allelic richnesses An in eachlocality in the Alps and in Finland
HE An
Alps1 Haute-Roya 0.73 4.82 Haute-Tinée 0.71 4.93 Haut-Var 0.74 5.14 Queyras 0.74 5.15 Maurienne (upstream) 0.72 4.86 Maurienne (downstream) 0.75 5.37 Vanoise 0.76 5.58 Beaufortain 0.76 5.59 Aravis 0.76 5.610 Mont-Blanc 0.75 5.611 Valais (downstream) 0.76 6.012 Valais (upstream) 0.78 5.813 Devero 0.76 5.614 Vigezzo 0.77 5.5Overal Alps 0.75 5.9Finland1 Köyliö/Harjavalta/Kokemäki 0.76 6.32 Siikainen 0.76 6.23 Parkano/Kihniö 0.78 6.44 Korpilahti 0.79 6.35 Petäjävesi 0.75 6.06 Toivakka 0.76 6.27 Pylkönmäki/Saarijärvi 0.77 6.58 Kinnula/Viitasaari 0.79 6.39 Sotkamo/Suomussalmi 0.80 6.4Overal Finland 0.78 6.5

2304 A . C A I Z E R G U E S E T A L .
© 2003 Blackwell Publishing Ltd, Molecular Ecology, 12, 2297–2305
estimates of differentiation are biased, this bias is probablysmall.
The distribution of genetic variability
Simulations and empirical studies have shown that habitatfragmentation can reduce genetic variability by decreas-ing local effective population size and by restrictinggene flow (e.g. Harrison & Hastings 1996). Reduced geneticvariability resulting from habitat fragmentation has beenreported in other tetraonid species, including the sagegrouse Centrocercus urophasianus (Oyler-McCance et al.1999) and the greater prairie chicken Tympanuchus cupido(Bouzat et al. 1998a; Bouzat et al. 1998b). However, both ofthese studies dealt with extreme situations in which thegenetically impoverished populations were isolated andhad suffered extreme reduction in size.
Consistent with the idea that fragmentation affectsgenetic variability, we found that variability was globallylower in the Alps than in Finland. However, this differ-ence may be due to both greater habitat fragmentation andto smaller effective population sizes in the Alps. Further-more, the population of Finland, which is estimated to bemore than 8 times larger than the 100 000 birds in the Alps(Storch 2000) is still connected with large populations inSweden and Russia.
In the Alps localities in the southwestern limit of the dis-tribution range (that is, populations being the most distantfrom the main species’ range) displayed lower variabilitythan populations of the centre or the northeast. This reduc-tion of variability is probably due to the joint effects oflimited gene flow and a greater influence of genetic driftowing to lower effective population sizes relative to thosefound in Finland and further north in the Alps.
Conclusion
This study is one of the first highlighting the potentialeffect of habitat fragmentation on the genetic structure ofa bird species with good dispersion ability. The patternsof genetic structure observed in the Alps somewhatresemble that of the capercaillie, in which metapopulationconnectivity is considered as a key issue for conservation(Segelbacher & Storch 2002). Therefore, like in the caper-caillie, the persistence of black grouse populations in theAlps lay in the preservation of a dense network of highlyproductive habitat patches and stepping-stones. However,managers should consider that direct movements of indi-viduals between adjacent valleys/watershed might be veryrare when high rocky ridges separate them.
In Finland, the pattern is somehow different and the lowgenetic divergence observed suggests that movementsbetween favourable forest patches are frequent. However,the detection of an isolation-by-distance effect means that
the Finnish population cannot be considered panmicticand that more subtle differences in habitat features mayaffect gene flow. Owing to these extensive dispersal move-ments the potential for a source-sink dynamics is high.This means that possible detrimental effects to local popu-lation dynamics can affect much larger areas. Conversely,under such conditions, depleted populations can easilyrecover through emigration from populations in whichbirths exceed deaths.
Acknowledgements
We are very grateful to numerous people who helped with the collec-tion of tissue samples, including A. Bernard-Laurent, Y. Crettenant,P. Leonard, Y. Leonard, Y. Magnani, S. Marin and others. Weare grateful to the staff of Finnish and French Game Manage-ment Associations (including the OGM) and those numeroushunters involved in collecting samples. Many thanks, to A. Estoupand R. Leblois for statistical advice. Thanks also to John Dallas andto four anonymous reviewers whose criticisms greatly helpedimproving the manuscript. Alain Caizergues received financialsupport from the Office National de la Chasse et de la Faune Sauvage.This research was also financed by the Bureau des RessourcesGénétiques (BRG).
ReferencesAndrén H (1994) Effects of habitat fragmentation on birds and
mammals in landscapes with different proportions of suitablehabitat: a review. Oikos, 71, 355–366.
Avise JC (1996) Three fundamental contributions of moleculargenetics to avian ecology and evolution. Ibis, 138, 16–25.
Bernard-Laurent A (1994) Status, trends and limiting factors ofblack grouse (Tetrao tetrix) populations in France: a literaturesurvey. Gibier Faune Sauvage, 11, 205–239.
Boone MD, Rhodes OEJ (1996) Genetic structure among sub-populations of the Eastern Wild Turkey (Meleagris gallopavosilvestris). American Midland Naturalist, 135, 168–171.
Bouzat JL, Cheng HH, Lewin HA, Westmeier RL, Brawn JD,Paige KN (1998a) Genetic evaluation of a demographic bottleneckin the greater prairie chicken. Conservation Biology, 12, 836–843.
Bouzat JL, Lewin HA, Paige KN (1998b) The ghost of geneticdiversity past: historical DNA analysis of the greater prairiechicken. American Naturalist, 152, 1–6.
Busch JD, Miller MP, Paxton EH, Sogge MK, Keim P (2000) Geneticvariation in the endangered southwestern willow flycatcher.Auk, 117, 586–595.
Caizergues A, Bernard-Laurent A, Brenot J-F, Ellison L, Rasplus J-Y (2003) Population genetic structure of rock ptarmigan Lagopusmutus in Northern and Western Europe. Molecular Ecology, 12,2267–2274.
Caizergues A, Dubois S, Mondor G, Rasplus J-Y (2001) Isolationand characterisation of microsatellites loci in black grouse(Tetrao tetrix). Molecular Ecology Notes, 1, 36–38.
Caizergues A, Ellison LN (2002) Natal dispersal and its con-sequences in black grouse. Ibis, 144, 478–487.
Chesser RK (1991) Influence of gene flow and breeding tatics ongene diversity within populations. Genetics, 129, 573–583.
Crochet P-A (2000) Genetic structure of avian populations —allozymes revisited. Molecular Ecology, 9, 1463–1469.

P O P U L A T I O N G E N E T I C S T R U C T U R E O F T E T R A O T E T R I X L . 2305
© 2003 Blackwell Publishing Ltd, Molecular Ecology, 12, 2297–2305
Don RH, Cox PT, Wainwright BJ, Baker K, Mattick JS (1991)Touchdown PCR to circumvent spurious priming during geneamplification. Nucleid Acid Research, 19, 4008.
Ehrich D, Krebs CJ, Kenney AJ, Stenseth NC (2001) Comparing thegenetic population structure of two arctic lemmings: more localdifferentiation in Lemnus trimucronatus than in Dicrostonyxgroenlandicus. Oikos, 94, 143–150.
Ehrich D, Stenseth NC (2001) Genetic structure of Siberian lem-mings (Lemmus sibiricus) in a continuous habitat: large patchesrather than isolation by distance. Heredity, 86, 716–730.
Ellison LN, Ménoni E, Léonard P (1989) Déplacement d’adultes detétras-lyre (Tetrao tetrix) en automne et en hiver. Gibier FauneSauvage, 6, 245–260.
Frankham R, Ballou JD, Briscoe DA (2002) Introduction to Conserva-tion Genetics. Cambridge Universtity Press, Cambridge.
French Observatory of Mountain Galliforms (2001) Annual report2001. O.N.C.F.S., Paris.
Goossens B, Chikhi L, Taberlet P, Waits LP, Allainé D (2001)Microsatellite analysis of genetic variation among and withinAlpine marmot populations in the French Alps. Molecular Eco-logy, 10, 41–52.
Goudet J (1999) FSTAT, a Program for IBM PC Compatibles to CalculateWeir and Cockerham’s (1984) Estimators of F-Statistics. Version1.2. Institut de Zoologie et d’Ecologie Animale, Université deLausanne, Lausanne.
Harrison S, Hastings A (1996) Genetic and evolutionary con-sequences of metapopulation structure. Trends in Ecology andEvolution, 11, 180–183.
Höglund J, Alatalo RV, Lundberg A, Rintamäki PT, Lindell J (1999)Microsatellite markers reveal the potential for kin selection onblack grouse leks. Proceedings of the Royal Society London B, 266,813–816.
Höglung J, Alatalo RV (1995) Leks. Princeton University Press,Princeton.
Lee PL, Bradbury RB, Wilson JD et al. (2001) Microsatellite variationin the yellowhammer Emberiza citrinella: population structure ofa declining farmland bird. Molecular Ecology, 10, 1633–1644.
Marjakangas A, Aspegren H, Kyllönen M (1991) Spring dispersaland subsequent movements of yearling female black grouseTetrao tetrix in Eastern Central Finland. XXth Congress of theInternational Union of Game Biologists. Gödöllö, Hungary.pp. 297–301.
Mossman CA, Waser PM (1999) Genetic detection of sex-biaseddispersal. Molecular Ecology, 8, 1063–1067.
NAG (1986) The Generalised Linear Interactive Modelling System.Release 3.77. The Royal Statistical Society, London.
Nei M (1978) Estimation of average heterozygosity and geneticdistance from a small number of individuals. Genetics, 89, 583–590.
Oyler-McCance SJ, Kahn NW, Burnham KP, Braun CE, Quinn TW(1999) A population genetic comparison of large- and small-bodied sage grouse in Colorado using microsatellite and mito-chrondrial DNA markers. Molecular Ecology, 8, 1457–1465.
Peltola A (2001) Finnish Statistical Yearbook of Forestry 2001. FinnishForest Research Institute, Helsinki.
Piertney SB, Dallas JF (1997) Isolation and characterization ofhypervariable microsatellites in the red grouse. Lagopus LagopusScoticus. Molecular Ecology, 6, 93–95.
Piertney SB, MacColl AC, Bacon PJ, Dallas JF (1998) Local geneticstructure in red grouse (Lagopus lagopus scoticus): evidence frommicrosatellite DNA markers. Molecular Ecology, 7, 1645–1654.
Pritchard JK, Stephens M, Donnelly P (2000) Inference of popula-tion structure using multilocus genotype data. Genetics, 155,945–959.
Raymond M, Rousset F (1995) genepop (version 1.2): populationgenetics software for exact tests and ecumenism. Journal ofHeredity, 86, 248–249.
Rousset F (1997) Genetic differentiation and estimation of geneflow from F-statistics under isolation by distance. Genetics, 145,1219–1228.
Rousset F (2000) Genetic differentiation between individuals. Jour-nal of Evolutionary Biology, 13, 58–62.
Segelbacher G, Paxton RJ, Steinbrück G, Trontelj P, Storch I (2000)Characterization of microsatellites in capercaillie Tetrao urogallus(AVES). Molecular Ecology, 9, 1919–1952.
Segelbacher G, Storch I (2002) Capercaillie in the Alps: the geneticevidence of metapopulation structure and population decline.Molecular Ecology, 11, 1669–1677.
Storch I (2000) Grouse Status Survey and Conservation Action Plan2000–04. IUCN, Gland, Switzerland and Cambridge, UK andthe World Pheasant Association, Reading UK.
Storch I, Segelbacher G (2000) Genetic correlates of spatial popu-lation structure in central European capercaillie Tetrao urogallusand black grouse T. tetrix: a projet in progress. Wildlife Biology,6, 239–243.
Surridge AK, Ibrahim KM, Bell DJ, Webb NJ, Rico C, Hewitt GM(1999) Fine-scale genetic structuring in a natural population ofEuropean wild rabbits (Oryctolagus cuniculus). Molecular Eco-logy, 8, 299–307.
Wang M, Schreiber A (2001) The impact of habitat fragmentationand social structure on the population genetics of roe deer(Capreolus capreolus L.) in Central Europe. Heredity, 86, 703–715.
Warren PK, Baines D (2002) Dispersal, survival and causes of mor-tality in black grouse Tetrao tetrix in northern England. WildlifeBiology, 8, 129–135.
Weir BS, Cockerham CC (1984) Estimating F-statistics for the ana-lysis of population structure. Evolution, 38, 1358–1370.
With KA, Gardner RH, Turner MG (1997) Landscape connectivityand population distributions in heterogenous environments.Oikos, 78, 151–169.
Yang SY, Patton JL (1981) Genetic variability and differentiation inthe Galapagos finches. Auk, 98, 230–242.
Zar JH (1999) Biostatistical Analysis. Prentice Hall, Upper SaddleRiver, NJ.
These results represent one aspect of A. Caizergues postdoctoralresearches on population genetics of grouse. Osmo Rätti is inter-ested in different aspects of population dynamics in grouse. PekkaHelle is responsible for running the nation-wide monitoring offorest wildlife in Finland. Luca Rotelli is a Ph.D. candidatestudying black grouse population dynamics. Laurence Ellison’sresearch interests concern management and conservation ofmountain galliformes. J.-Y. Rasplus is a senior scientist workingon systematic, evolution and conservation genetics of insects.