Immigration Rates in Fragmented Landscapes – Empirical Evidence for the Importance of Habitat...
10
Immigration Rates in Fragmented Landscapes – Empirical Evidence for the Importance of Habitat Amount for Species Persistence Thomas Pu ¨ ttker 1,3 * ¤ , Adriana A. Bueno 1 , Camila dos Santos de Barros 2 , Simone Sommer 3 , Renata Pardini 1 1 Departamento de Zoologia, Instituto de Biocie ˆncias, Universidade de Sa ˜o Paulo, Sa ˜ o Paulo, Brazil, 2 Departamento de Ecologia, Instituto de Biocie ˆ ncias, Universidade de Sa ˜o Paulo, Sa ˜o Paulo, Brazil, 3 Department of Evolutionary Genetics, Leibniz Institute for Zoo and Wildlife Research, Berlin, Germany Abstract Background: The total amount of native vegetation is an important property of fragmented landscapes and is known to exert a strong influence on population and metapopulation dynamics. As the relationship between habitat loss and local patch and gap characteristics is strongly non-linear, theoretical models predict that immigration rates should decrease dramatically at low levels of remaining native vegetation cover, leading to patch-area effects and the existence of species extinction thresholds across fragmented landscapes with different proportions of remaining native vegetation. Although empirical patterns of species distribution and richness give support to these models, direct measurements of immigration rates across fragmented landscapes are still lacking. Methodology/Principal Findings: Using the Brazilian Atlantic forest marsupial Gray Slender Mouse Opossum (Marmosops incanus) as a model species and estimating demographic parameters of populations in patches situated in three landscapes differing in the total amount of remaining forest, we tested the hypotheses that patch-area effects on population density are apparent only at intermediate levels of forest cover, and that immigration rates into forest patches are defined primarily by landscape context surrounding patches. As expected, we observed a positive patch-area effect on M. incanus density only within the landscape with intermediate forest cover. Density was independent of patch size in the most forested landscape and the species was absent from the most deforested landscape. Specifically, the mean estimated numbers of immigrants into small patches were lower in the landscape with intermediate forest cover compared to the most forested landscape. Conclusions/Significance: Our results reveal the crucial importance of the total amount of remaining native vegetation for species persistence in fragmented landscapes, and specifically as to the role of variable immigration rates in providing the underlying mechanism that drives both patch-area effects and species extinction thresholds. Citation: Pu ¨ ttker T, Bueno AA, dos Santos de Barros C, Sommer S, Pardini R (2011) Immigration Rates in Fragmented Landscapes – Empirical Evidence for the Importance of Habitat Amount for Species Persistence. PLoS ONE 6(11): e27963. doi:10.1371/journal.pone.0027963 Editor: Sharon Gursky-Doyen, Texas A&M University, United States of America Received April 12, 2011; Accepted October 28, 2011; Published November 18, 2011 Copyright: ß 2011 Pu ¨ ttker et al. This is an open-access article distributed under the terms of the Creative Commons Attribution License, which permits unrestricted use, distribution, and reproduction in any medium, provided the original author and source are credited. Funding: This work was funded by the German Federal Ministry of Education and Research (BMBF Germany; http://www.bmbf.de/) (01 LB 0202); Conselho Nacional de Desenvolvimento Cientı ´fico e Tecnolo ´ gico (CNPq; http://www.cnpq.br/) (690144/01-6); and Fundac ¸a ˜o de Amparo a ` Pesquisa do Estado de Sa ˜o Paulo (FAPESP; http://www.fapesp.br/) (05/56555-4). This study is part of the BIOCASP project (Biodiversity Conservation in Fragmented Landscapes on the Atlantic Plateau of Sa ˜o Paulo, Brazil). The funders had no role in study design, data collection and analysis, decision to publish, or preparation of the manuscript. Competing Interests: The authors have declared that no competing interests exist. * E-mail: [email protected] ¤ Current address: Departamento de Zoologia, Instituto de Biocie ˆ ncias, Universidade de Sa ˜o Paulo, Sa ˜o Paulo, Brazil Introduction The effects of patch size and isolation on populations have been intensively investigated, providing empirical evidence of their influence on demographic parameters, such as population size [1,2], survival rates [3–5], and extinction probabilities [2,6]. However, studies are usually conducted in single landscapes, despite the growing recognition that population dynamics in patches cannot be considered in isolation of the wider landscape context [7,8]. Among whole-landscape properties, the total amount of remaining native vegetation (i.e. the amount of original, naturally occurring vegetation type) is expected to be of particular importance to populations in patches due to its non-linear relationships to patch- as well as gap-characteristics [9–12]. Simulation models suggest that the number of patches as well as the total amount of edge habitat is highest in landscapes with intermediate native vegetation cover, while the size of the largest patch decreases dramatically at around 60% habitat cover [9,11]. By contrast, gap characteristics such as the average distances among neighboring patches increase exponentially below ,10– 20% habitat cover [9,11] and therefore should have a strong influence on patterns of dispersal [13–15], increasing population isolation and decreasing the probability of rescue effects [16]. Small population sizes coupled with limited dispersal can increase vulnerability to local extinctions [17] and ultimately increase PLoS ONE | www.plosone.org 1 November 2011 | Volume 6 | Issue 11 | e27963
-
Upload
independent -
Category
Documents
-
view
1 -
download
0
Transcript of Immigration Rates in Fragmented Landscapes – Empirical Evidence for the Importance of Habitat...

Immigration Rates in Fragmented Landscapes –Empirical Evidence for the Importance of HabitatAmount for Species PersistenceThomas Puttker1,3*¤, Adriana A. Bueno1, Camila dos Santos de Barros2, Simone Sommer3, Renata
Pardini1
1 Departamento de Zoologia, Instituto de Biociencias, Universidade de Sao Paulo, Sao Paulo, Brazil, 2 Departamento de Ecologia, Instituto de Biociencias, Universidade de
Sao Paulo, Sao Paulo, Brazil, 3 Department of Evolutionary Genetics, Leibniz Institute for Zoo and Wildlife Research, Berlin, Germany
Abstract
Background: The total amount of native vegetation is an important property of fragmented landscapes and is known toexert a strong influence on population and metapopulation dynamics. As the relationship between habitat loss and localpatch and gap characteristics is strongly non-linear, theoretical models predict that immigration rates should decreasedramatically at low levels of remaining native vegetation cover, leading to patch-area effects and the existence of speciesextinction thresholds across fragmented landscapes with different proportions of remaining native vegetation. Althoughempirical patterns of species distribution and richness give support to these models, direct measurements of immigrationrates across fragmented landscapes are still lacking.
Methodology/Principal Findings: Using the Brazilian Atlantic forest marsupial Gray Slender Mouse Opossum (Marmosopsincanus) as a model species and estimating demographic parameters of populations in patches situated in three landscapesdiffering in the total amount of remaining forest, we tested the hypotheses that patch-area effects on population densityare apparent only at intermediate levels of forest cover, and that immigration rates into forest patches are defined primarilyby landscape context surrounding patches. As expected, we observed a positive patch-area effect on M. incanus densityonly within the landscape with intermediate forest cover. Density was independent of patch size in the most forestedlandscape and the species was absent from the most deforested landscape. Specifically, the mean estimated numbers ofimmigrants into small patches were lower in the landscape with intermediate forest cover compared to the most forestedlandscape.
Conclusions/Significance: Our results reveal the crucial importance of the total amount of remaining native vegetation forspecies persistence in fragmented landscapes, and specifically as to the role of variable immigration rates in providing theunderlying mechanism that drives both patch-area effects and species extinction thresholds.
Citation: Puttker T, Bueno AA, dos Santos de Barros C, Sommer S, Pardini R (2011) Immigration Rates in Fragmented Landscapes – Empirical Evidence for theImportance of Habitat Amount for Species Persistence. PLoS ONE 6(11): e27963. doi:10.1371/journal.pone.0027963
Editor: Sharon Gursky-Doyen, Texas A&M University, United States of America
Received April 12, 2011; Accepted October 28, 2011; Published November 18, 2011
Copyright: � 2011 Puttker et al. This is an open-access article distributed under the terms of the Creative Commons Attribution License, which permitsunrestricted use, distribution, and reproduction in any medium, provided the original author and source are credited.
Funding: This work was funded by the German Federal Ministry of Education and Research (BMBF Germany; http://www.bmbf.de/) (01 LB 0202); ConselhoNacional de Desenvolvimento Cientıfico e Tecnologico (CNPq; http://www.cnpq.br/) (690144/01-6); and Fundacao de Amparo a Pesquisa do Estado de Sao Paulo(FAPESP; http://www.fapesp.br/) (05/56555-4). This study is part of the BIOCASP project (Biodiversity Conservation in Fragmented Landscapes on the AtlanticPlateau of Sao Paulo, Brazil). The funders had no role in study design, data collection and analysis, decision to publish, or preparation of the manuscript.
Competing Interests: The authors have declared that no competing interests exist.
* E-mail: [email protected]
¤ Current address: Departamento de Zoologia, Instituto de Biociencias, Universidade de Sao Paulo, Sao Paulo, Brazil
Introduction
The effects of patch size and isolation on populations have been
intensively investigated, providing empirical evidence of their
influence on demographic parameters, such as population size
[1,2], survival rates [3–5], and extinction probabilities [2,6].
However, studies are usually conducted in single landscapes,
despite the growing recognition that population dynamics in
patches cannot be considered in isolation of the wider landscape
context [7,8].
Among whole-landscape properties, the total amount of
remaining native vegetation (i.e. the amount of original, naturally
occurring vegetation type) is expected to be of particular
importance to populations in patches due to its non-linear
relationships to patch- as well as gap-characteristics [9–12].
Simulation models suggest that the number of patches as well as
the total amount of edge habitat is highest in landscapes with
intermediate native vegetation cover, while the size of the largest
patch decreases dramatically at around 60% habitat cover [9,11].
By contrast, gap characteristics such as the average distances
among neighboring patches increase exponentially below ,10–
20% habitat cover [9,11] and therefore should have a strong
influence on patterns of dispersal [13–15], increasing population
isolation and decreasing the probability of rescue effects [16].
Small population sizes coupled with limited dispersal can increase
vulnerability to local extinctions [17] and ultimately increase
PLoS ONE | www.plosone.org 1 November 2011 | Volume 6 | Issue 11 | e27963

extinction probabilities at the landscape scale (i.e. species
extinction thresholds; [13,18–20]).
In linking the interaction between landscape context with patch-
area effects, Andren [9] and more recently Pardini et al. [20]
proposed theoretical models that include a threshold in the total
amount of remaining native vegetation, below which a positive
patch-area effect on population density becomes apparent due to
the increased isolation of patches. In this model the isolation of
patches and consequent changes in immigration rates are defined
by the total amount of native vegetation at the landscape scale
[20]. According to the model, a moderate reduction in habitat
cover should only affect populations in small patches, which due to
their small size are more dependent on immigration to ensure
population persistence, leading to a patch-area effect [9,20]. By
contrast a high level of vegetation clearance drives an exponential
increase in distances among patches [10], leading to a drastic
reduction in immigration rates and an increase in extinction risk
within even the largest remaining patches [20].
Following a detailed review of available literature, Andren [9]
found evidence for patch-area effects only in studies carried out in
landscapes with # 30% of remaining native vegetation. In the first
targeted empirical test of this theoretical model, Pardini et al. [20]
found evidence for patch-area effects on the richness and total
abundance of the assemblage of habitat specialist small mammals
only in a landscape characterized by intermediate levels of native
vegetation cover (30%). Where vegetation clearance was high (10%
native vegetation cover), an abrupt drop in landscape-wide richness
and no evidence for patch-area effects on this assemblage was
observed. However, despite this empirical support, direct evidence
of reduced immigration into patches in landscapes with decreasing
amounts of native vegetation – the principal mechanism driving
patch-effects in the Andren-Pardini model – is lacking [20].
In this study, we combine pattern and process orientated
research approaches to investigate the demographic processes
behind patterns of species abundance and persistence in patches in
different landscape contexts [8,21,22]. We investigated patterns of
population density and estimated demographic parameters of the
endemic Gray Slender Mouse Opossum Marmosops incanus (Lund
1840, Didelphidae) in patches located in three 10000-ha Brazilian
Atlantic forest landscapes which are characterized by different
amounts of remaining forest (50, 30, and 10%). M. incanus is a
small marsupial species (adult weight: 22 to 60 g in the study area;
Barros, unpublished data) with a seasonal reproduction pattern
(reproduction in the rainy season [23,24]), peaks in abundances
between December and June, and without strong inter-annual
variation in abundance in the study area (Barros, unpublished data).
It is a forest specialist species showing high habitat [25] as well as
micro-habitat specificity [26], while also being relatively common
and therefore amenable to population parameter estimation.
Using two different data sets, we tested the hypotheses that: (1)
patch-area effects on population density are apparent only at an
intermediate level of forest cover, below which the species become
extinct at the landscape scale (i.e. changes in population density of
the model species are consistent with patterns of diversity observed
for the assemblage of habitat specialist small mammals in the same
landscapes [20]), and (2) immigration rates into patches are
defined by landscape context, being higher in patches of the most
forested landscape.
Materials and Methods
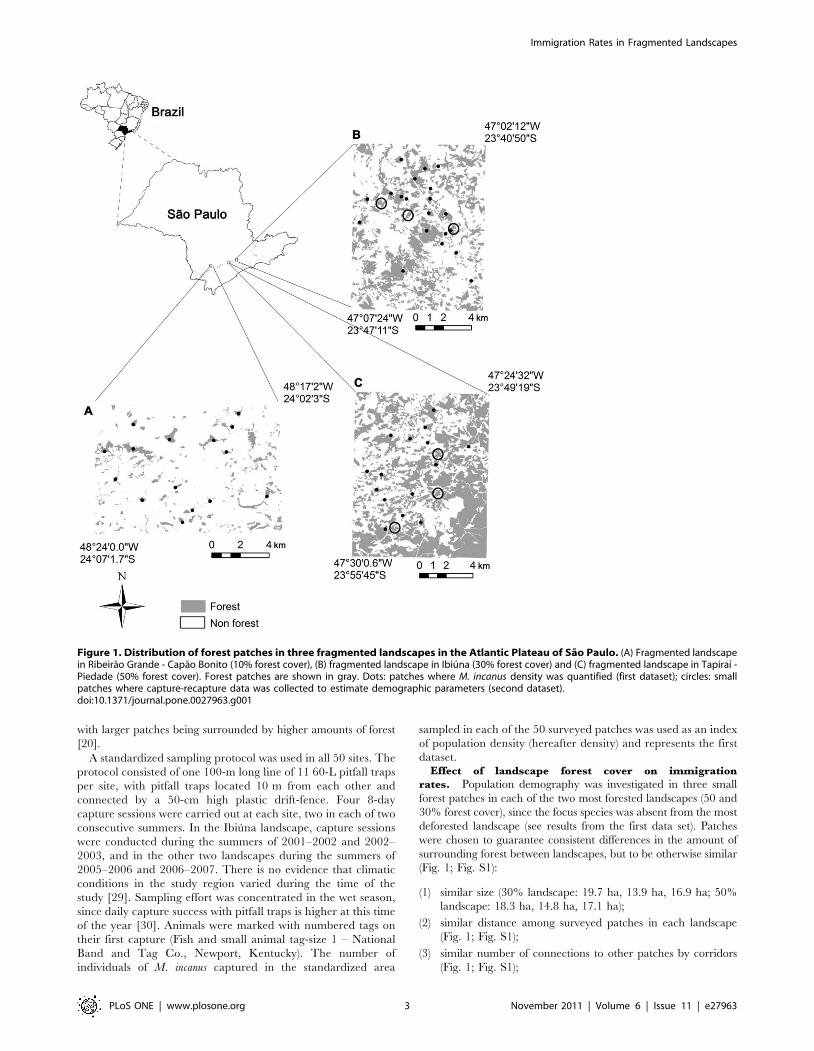
Study areaSmall mammals were sampled in three 10000-ha fragmented
landscapes located in the Atlantic Plateau of Sao Paulo, Brazil, in
the municipalities of Tapiraı - Piedade, Ibiuna, and Ribeirao
Grande - Capao Bonito (Fig. 1). The entire region was originally
covered with Atlantic Forest classified as ‘‘Lower Montane
Atlantic Rain Forest’’ [27], which is currently reduced to patches
of different sizes. In all three landscapes, patches consist of
secondary forest and are surrounded mainly by pasture (48%, 44%
and 50% of non-forest areas for Tapiraı - Piedade, Ibiuna, and
Ribeirao Grande - Capao Bonito, respectively) and agriculture
(26%, 20% and 35% of non-forest areas for Tapiraı - Piedade,
Ibiuna e Ribeirao Grande - Capao Bonito, respectively). Altitudes
are between 800 and 1000 m above sea level [28]. Annual rainfall
is between 1222 and 1810 mm and mean minimum and
maximum temperatures are 17.3uC and 28.4uC for the warm-
wet season (October to March) and 12.1uC and 24.9uC for the
cool-dry season (April to September). The three landscapes are
similar in terms of topography, relief, climate, and type of human
occupation, but vary in the proportion of remaining forest cover
from 49% in Tapiraı – Piedade (hereafter referred to as 50%), to
31% in Ibiuna (hereafter 30%) and 11% in Ribeirao Grande -
Capao Bonito (hereafter 10%, Fig. 1) and thus in patch and gap
characteristics. The landscape with 50% forest cover has the
highest percentage of the landscape covered by the largest patch,
highest mean patch size, and lowest mean distance to the nearest
patch, whereas the landscape with 10% forest cover presents the
lowest values for these variables [20].
Sampling design and Data CollectionEthics Statement. Trapping and handling were approved by
IBAMA – Instituto Brasileiro do Meio Ambiente e dos Recursos
Naturais Renovaveis (permissions 57/02 - IBAMA/SP, 11/04 -
IBAMA/SP, 168/2004 - CGFAU/LIC, 237/2005 - CGFAU/
LIC, 262/2006 – COFAN, 11577-2 - IBAMA/SP, and 11577-4 -
IBAMA/SP) and conformed to guidelines sanctioned by the
American Society of Mammalogists Animal Care and Use
Committee. Because our study involved only the capture,
handling for marking and the immediate release of a small
marsupial in the field, it did not receive an approval from the
Ethics Committee of the Institute of Biosciences - University of
Sao Paulo (Comissao de Etica em Uso de Animais Vertebrados em
Experimentacao– CEA - http://ib.usp.br/etica_animais.htm),
which only requires approval for studies on vertebrates that
include experimentation (e.g. maintenance in captivity, injection of
drugs, or surgery).
Patch-area effect on population density. We sampled 50
forest patches, 15 of which (3 to 145 ha) were located in the
landscape with 50% forest cover, 20 in the landscape with 30% (2
to 374 ha) and 15 in the landscape with 10% (6 to 106 ha, Fig. 1).
Surveyed forest patches were selected in order to ensure: similar
vegetation structure and age (all patches consisted of secondary
vegetation in intermediate stages of regeneration and were not
subjected to disturbances such as fire, selective logging or cattle),
extensive overlap in patch size among landscapes, guarantee a
minimum distance among patches, avoid spatial segregation
among similar-sized patches, and guarantee a minimum distance
of the sampling site from the forest edge (30 m in small fragments
but usually more than 50 m). Distances of sites to patch-edge,
average distance to the nearest surveyed patch, as well as size and
shape of surveyed patches did not differ significantly among
landscapes [20]. The percentage of forest cover in an 800 m
circumference around sampling sites within surveyed forest
patches varied among landscapes (from 22 to 64% in the
landscape with 50% of forest cover, 11 to 77% in the landscape
with 30%, and 5 to 41% in the landscape with 10%), but was
highly correlated with patch size in all three landscapes,
Immigration Rates in Fragmented Landscapes
PLoS ONE | www.plosone.org 2 November 2011 | Volume 6 | Issue 11 | e27963
with larger patches being surrounded by higher amounts of forest
[20].
A standardized sampling protocol was used in all 50 sites. The
protocol consisted of one 100-m long line of 11 60-L pitfall traps
per site, with pitfall traps located 10 m from each other and
connected by a 50-cm high plastic drift-fence. Four 8-day
capture sessions were carried out at each site, two in each of two
consecutive summers. In the Ibiuna landscape, capture sessions
were conducted during the summers of 2001–2002 and 2002–
2003, and in the other two landscapes during the summers of
2005–2006 and 2006–2007. There is no evidence that climatic
conditions in the study region varied during the time of the
study [29]. Sampling effort was concentrated in the wet season,
since daily capture success with pitfall traps is higher at this time
of the year [30]. Animals were marked with numbered tags on
their first capture (Fish and small animal tag-size 1 – National
Band and Tag Co., Newport, Kentucky). The number of
individuals of M. incanus captured in the standardized area
sampled in each of the 50 surveyed patches was used as an index
of population density (hereafter density) and represents the first
dataset.Effect of landscape forest cover on immigration
rates. Population demography was investigated in three small
forest patches in each of the two most forested landscapes (50 and
30% forest cover), since the focus species was absent from the most
deforested landscape (see results from the first data set). Patches
were chosen to guarantee consistent differences in the amount of
surrounding forest between landscapes, but to be otherwise similar
(Fig. 1; Fig. S1):
(1) similar size (30% landscape: 19.7 ha, 13.9 ha, 16.9 ha; 50%
landscape: 18.3 ha, 14.8 ha, 17.1 ha);
(2) similar distance among surveyed patches in each landscape
(Fig. 1; Fig. S1);
(3) similar number of connections to other patches by corridors
(Fig. 1; Fig. S1);
Figure 1. Distribution of forest patches in three fragmented landscapes in the Atlantic Plateau of Sao Paulo. (A) Fragmented landscapein Ribeirao Grande - Capao Bonito (10% forest cover), (B) fragmented landscape in Ibiuna (30% forest cover) and (C) fragmented landscape in Tapiraı -Piedade (50% forest cover). Forest patches are shown in gray. Dots: patches where M. incanus density was quantified (first dataset); circles: smallpatches where capture-recapture data was collected to estimate demographic parameters (second dataset).doi:10.1371/journal.pone.0027963.g001
Immigration Rates in Fragmented Landscapes
PLoS ONE | www.plosone.org 3 November 2011 | Volume 6 | Issue 11 | e27963
(4) similar forest structure (all patches are comprised of secondary
forest in intermediate stage of regeneration);
(5) different percentage of surrounding forest cover in order to
maintain the overall percentage in the respective landscape
(calculated in three radii around the center of each patch;
30% landscape 1 km: 28.7%60.03; 1.5 km: 30.4%60.03;
2 km: 30.6%60.03; 50% landscape 1 km: 52.4%60.07,
1.5 km: 51.0%60.01, 2 km: 48.1%60.03; all values mean
among patches 6 SD; Fig. S1).
A trapping grid of 2 ha was placed in each of the six patches
(Fig. S2). Given the irregular shape of patches, one side of the grid
was near to a forest edge in each of the six surveyed patches. Each
grid consisted of 11 parallel 100-m long lines, 20 m from each
other, with 11 trapping stations spaced every 10 m. In each
trapping station one Sherman trap (size: 37.5 x 10.0 x 12.0 cm or
23.0 x 7.5 x 8.5 cm) was placed on the ground. In addition, five
lines were also equipped with one 60-L pitfall trap per station,
connected to each other by a 50-cm high plastic fence (similar to
the trapping lines used for the investigation of patch-area effect on
density). Two different trap types were used to maximize both
capture and recapture rates, since pitfall traps result in higher
capture rate and higher proportion of young individuals, while
recapture rates are higher in Sherman traps [30]. All traps were
baited with a mixture of sardines, peanut butter, banana, and
manioc flour. Precautions were taken to minimize mortality in
pitfall traps (bucket lids were used as a roof protecting from rain,
small holes in the bottom facilitated drainage, and a styrofoam disc
provided a dry surface in the event of accumulation of water).
Trapping design followed Pollock’s robust design [31,32], with
short primary capture sessions assuming population closure,
separated by relatively longer time periods, thereby allowing for
open population processes. Animals were captured during five 5-
day primary capture sessions with a 20-day interval between them,
resulting in 26400 trap nights in total. This protocol was carefully
established from our field experience with Atlantic forest small
mammals, for which between-primary session recaptures tend to
be very low due to short life-cycles. It represents a trade-off
between guaranteeing open population processes between primary
sessions on the one hand, and maximizing between-primary
session recapture probabilities, which are a crucial requirement for
the precise estimation of population parameters [33], on the other.
Trapping within each primary session was carried out simulta-
neously in the three grids of each landscape, and consecutively
(with no interval) between landscapes, to minimize the influence of
weather and season on results and guarantee comparable estimates
between landscapes. All five primary capture sessions were carried
out between February and June of 2008. Captured animals were
weighed, sexed, and marked with a numbered ear tag (small
animal tags OLT – A. Hartenstein GmbH, Wurzburg/Versbach,
Germany) and released in the respective trapping location. The
capture histories of M. incanus represent the second dataset used in
the analyses.
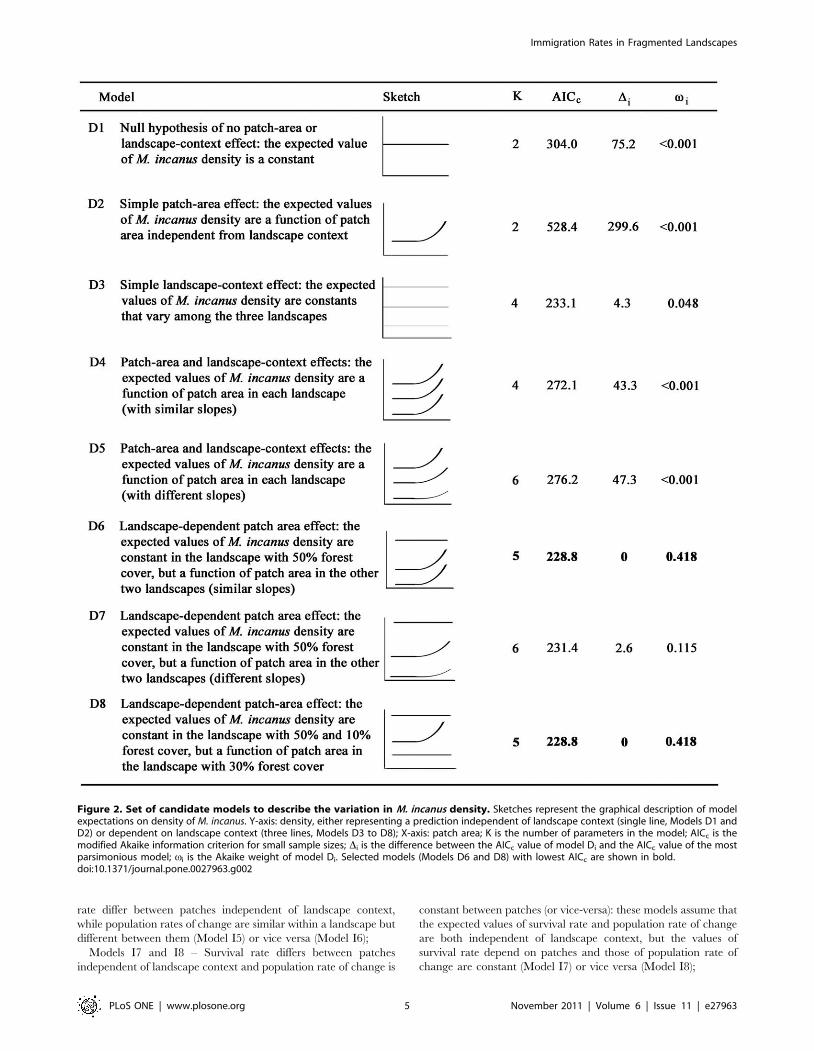
Data analysesPatch-area effect on population density. The data on the
density of M. incanus in the 50 patches of the three fragmented
landscapes was confronted with eight alternative models (Fig. 2),
which were compared using an information-theoretic model
selection approach [34]. Each candidate model is a combination
of linear and/or constant functions, and corresponds to either (1)
the lack of relationship between density and patch area or
landscape context, (2) a positive relationship with patch area
independent of landscape context, (3) a relationship with landscape
context independent of patch area, or (4) a positive relationship
with patch area in one, two, or three landscapes depending on
landscape context (Fig. 2).
The log-likelihood of each model was calculated as the sum of
the log-likelihoods of their component functions, with the
maximum likelihood estimates for coefficients being the set of
values that minimized the whole model negative log-likelihood (i.e.
the sum of the negative log-likelihood of the component functions).
As usual for count data, all models were fitted using log as the link
function. Density was modeled as a Poisson variable in models
with patch-area effect, and as a negative binomial variable in
constant functions (i.e. without patch-area effects) due to high
variance in these cases. Patch areas were converted by their
logarithms (base 10). The Akaike Information Criterion corrected
for small samples (AICc) was calculated for each model and the
plausibility of alternative models was estimated by the differences
in their AICc values in relation to the AICc of the most plausible
model (Di), where a value of Di # 2 indicates equally plausible
models. All analyses were conducted in the R environment,
version 2.13.0 [35].
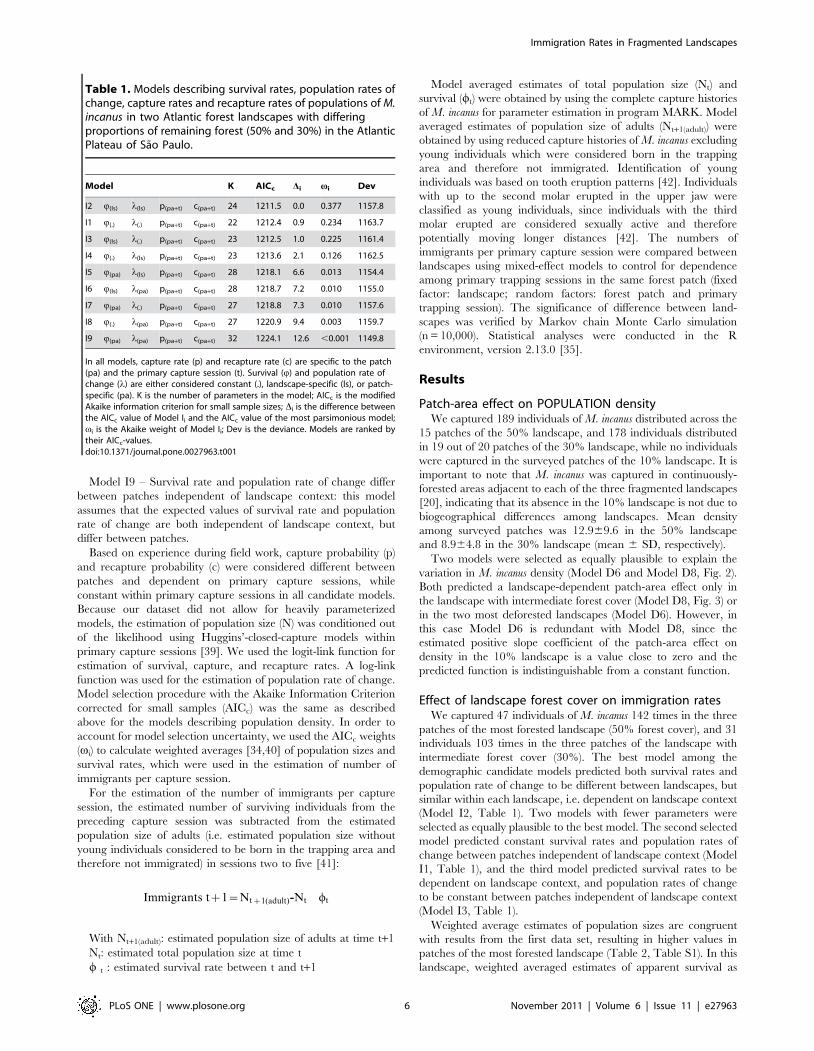
Effect of landscape forest cover on immigration
rates. To estimate the number of immigrants in each forest
patch in each primary capture session, we first used capture-
recapture histories of M. incanus to estimate abundance, apparent
survival rates (including survival and emigration rates; hereafter
survival rate) and population rates of change in program MARK
version 6.0 [36]. Testing for population closure within primary
capture sessions was performed with the program CloseTest
(Stanley and Richards, Fort Collins Science Center, http://www.
mesc.usgs.gov/Products/Software/clostest/) using Stanley and
Burnham test for closure [37] when possible (in 24 of 30
primary capture sessions). Because only in five out of 24 primary
capture sessions tests indicated violation of closure (x2.5.15;
p,0.05), and the number of trapping days per primary capture
session was small (5 days), we assumed population closure within
primary capture sessions.
Modeling of survival rates and population rates of change was
based on Pollock’s robust design models [31,32] and Pradel
Lambda models [38]. To assess whether survival rates (Q) and
population rates of change (l) of populations of M. incanus differ
between landscape contexts or forest patches, we considered a set
of nine candidate models, among which survival rate and
population rate of change were either (1) constant between all
patches independent of landscape context, (2) dependent on
landscape context, or (3) different between patches independent of
landscape context (Table 1):
Model I1 – Survival rate and population rate of change are
constant between all patches independent of landscape context:
this model represents a null hypothesis of no effects on M. incanus
demographic parameters;
Model I2 – Survival rate and population rate of change depend
on landscape context: the expected values of survival rate and
population rate of change are similar within landscapes, but
different between them;
Models I3 and I4 – Survival rate depends on landscape context
and population rate of change is constant between all patches
independent of landscape context (or vice versa): these models
assume that the expected values of survival rate are similar within
a landscape but different between them, while population rate of
change is constant between patches independent of landscape
context (Model I3) or vice versa (Model I4);
Models I5 and I6 – Survival rate differs between patches, and
population rate of change depends on landscape context (or vice
versa): these models assume that the expected values of survival
Immigration Rates in Fragmented Landscapes
PLoS ONE | www.plosone.org 4 November 2011 | Volume 6 | Issue 11 | e27963
rate differ between patches independent of landscape context,
while population rates of change are similar within a landscape but
different between them (Model I5) or vice versa (Model I6);
Models I7 and I8 – Survival rate differs between patches
independent of landscape context and population rate of change is
constant between patches (or vice-versa): these models assume that
the expected values of survival rate and population rate of change
are both independent of landscape context, but the values of
survival rate depend on patches and those of population rate of
change are constant (Model I7) or vice versa (Model I8);
Figure 2. Set of candidate models to describe the variation in M. incanus density. Sketches represent the graphical description of modelexpectations on density of M. incanus. Y-axis: density, either representing a prediction independent of landscape context (single line, Models D1 andD2) or dependent on landscape context (three lines, Models D3 to D8); X-axis: patch area; K is the number of parameters in the model; AICc is themodified Akaike information criterion for small sample sizes; Di is the difference between the AICc value of model Di and the AICc value of the mostparsimonious model; vi is the Akaike weight of model Di. Selected models (Models D6 and D8) with lowest AICc are shown in bold.doi:10.1371/journal.pone.0027963.g002
Immigration Rates in Fragmented Landscapes
PLoS ONE | www.plosone.org 5 November 2011 | Volume 6 | Issue 11 | e27963
Model I9 – Survival rate and population rate of change differ
between patches independent of landscape context: this model
assumes that the expected values of survival rate and population
rate of change are both independent of landscape context, but
differ between patches.
Based on experience during field work, capture probability (p)
and recapture probability (c) were considered different between
patches and dependent on primary capture sessions, while
constant within primary capture sessions in all candidate models.
Because our dataset did not allow for heavily parameterized
models, the estimation of population size (N) was conditioned out
of the likelihood using Huggins’-closed-capture models within
primary capture sessions [39]. We used the logit-link function for
estimation of survival, capture, and recapture rates. A log-link
function was used for the estimation of population rate of change.
Model selection procedure with the Akaike Information Criterion
corrected for small samples (AICc) was the same as described
above for the models describing population density. In order to
account for model selection uncertainty, we used the AICc weights
(vi) to calculate weighted averages [34,40] of population sizes and
survival rates, which were used in the estimation of number of
immigrants per capture session.
For the estimation of the number of immigrants per capture
session, the estimated number of surviving individuals from the
preceding capture session was subtracted from the estimated
population size of adults (i.e. estimated population size without
young individuals considered to be born in the trapping area and
therefore not immigrated) in sessions two to five [41]:
Immigrants tz1~Ntz1(adult)-Nt � wt
With Nt+1(adult): estimated population size of adults at time t+1
Nt: estimated total population size at time t
w t : estimated survival rate between t and t+1
Model averaged estimates of total population size (Nt) and
survival (wt) were obtained by using the complete capture histories
of M. incanus for parameter estimation in program MARK. Model
averaged estimates of population size of adults (Nt+1(adult)) were
obtained by using reduced capture histories of M. incanus excluding
young individuals which were considered born in the trapping
area and therefore not immigrated. Identification of young
individuals was based on tooth eruption patterns [42]. Individuals
with up to the second molar erupted in the upper jaw were
classified as young individuals, since individuals with the third
molar erupted are considered sexually active and therefore
potentially moving longer distances [42]. The numbers of
immigrants per primary capture session were compared between
landscapes using mixed-effect models to control for dependence
among primary trapping sessions in the same forest patch (fixed
factor: landscape; random factors: forest patch and primary
trapping session). The significance of difference between land-
scapes was verified by Markov chain Monte Carlo simulation
(n = 10,000). Statistical analyses were conducted in the R
environment, version 2.13.0 [35].
Results
Patch-area effect on POPULATION densityWe captured 189 individuals of M. incanus distributed across the
15 patches of the 50% landscape, and 178 individuals distributed
in 19 out of 20 patches of the 30% landscape, while no individuals
were captured in the surveyed patches of the 10% landscape. It is
important to note that M. incanus was captured in continuously-
forested areas adjacent to each of the three fragmented landscapes
[20], indicating that its absence in the 10% landscape is not due to
biogeographical differences among landscapes. Mean density
among surveyed patches was 12.969.6 in the 50% landscape
and 8.964.8 in the 30% landscape (mean 6 SD, respectively).
Two models were selected as equally plausible to explain the
variation in M. incanus density (Model D6 and Model D8, Fig. 2).
Both predicted a landscape-dependent patch-area effect only in
the landscape with intermediate forest cover (Model D8, Fig. 3) or
in the two most deforested landscapes (Model D6). However, in
this case Model D6 is redundant with Model D8, since the
estimated positive slope coefficient of the patch-area effect on
density in the 10% landscape is a value close to zero and the
predicted function is indistinguishable from a constant function.
Effect of landscape forest cover on immigration ratesWe captured 47 individuals of M. incanus 142 times in the three
patches of the most forested landscape (50% forest cover), and 31
individuals 103 times in the three patches of the landscape with
intermediate forest cover (30%). The best model among the
demographic candidate models predicted both survival rates and
population rate of change to be different between landscapes, but
similar within each landscape, i.e. dependent on landscape context
(Model I2, Table 1). Two models with fewer parameters were
selected as equally plausible to the best model. The second selected
model predicted constant survival rates and population rates of
change between patches independent of landscape context (Model
I1, Table 1), and the third model predicted survival rates to be
dependent on landscape context, and population rates of change
to be constant between patches independent of landscape context
(Model I3, Table 1).
Weighted average estimates of population sizes are congruent
with results from the first data set, resulting in higher values in
patches of the most forested landscape (Table 2, Table S1). In this
landscape, weighted averaged estimates of apparent survival as
Table 1. Models describing survival rates, population rates ofchange, capture rates and recapture rates of populations of M.incanus in two Atlantic forest landscapes with differingproportions of remaining forest (50% and 30%) in the AtlanticPlateau of Sao Paulo.
Model K AICc Di vi Dev
I2 Q(ls) l(ls) p(pa+t) c(pa+t) 24 1211.5 0.0 0.377 1157.8
I1 Q(.) l(.) p(pa+t) c(pa+t) 22 1212.4 0.9 0.234 1163.7
I3 Q(ls) l(.) p(pa+t) c(pa+t) 23 1212.5 1.0 0.225 1161.4
I4 Q(.) l(ls) p(pa+t) c(pa+t) 23 1213.6 2.1 0.126 1162.5
I5 Q(pa) l(ls) p(pa+t) c(pa+t) 28 1218.1 6.6 0.013 1154.4
I6 Q(ls) l(pa) p(pa+t) c(pa+t) 28 1218.7 7.2 0.010 1155.0
I7 Q(pa) l(.) p(pa+t) c(pa+t) 27 1218.8 7.3 0.010 1157.6
I8 Q(.) l(pa) p(pa+t) c(pa+t) 27 1220.9 9.4 0.003 1159.7
I9 Q(pa) l(pa) p(pa+t) c(pa+t) 32 1224.1 12.6 ,0.001 1149.8
In all models, capture rate (p) and recapture rate (c) are specific to the patch(pa) and the primary capture session (t). Survival (Q) and population rate ofchange (l) are either considered constant (.), landscape-specific (ls), or patch-specific (pa). K is the number of parameters in the model; AICc is the modifiedAkaike information criterion for small sample sizes; Di is the difference betweenthe AICc value of Model Ii and the AICc value of the most parsimonious model;vi is the Akaike weight of Model Ii; Dev is the deviance. Models are ranked bytheir AICc-values.doi:10.1371/journal.pone.0027963.t001
Immigration Rates in Fragmented Landscapes
PLoS ONE | www.plosone.org 6 November 2011 | Volume 6 | Issue 11 | e27963

well as estimates of population rate of change were also slightly
higher (Table 3). Further, numbers of immigrated individuals per
capture session were significantly higher in patches of the most
forested landscape (Fig. 4, p = 0.043).
Discussion
Landscape-level study designs (i.e. not only considering several
patches in each landscape but also replicated landscapes) are
challenging given the logistical difficulties of obtaining robust field
data in a large number of sites. Our patch-level study, although
limited by the small number of surveyed landscapes, provides
evidence that population dynamics in patches depend on
landscape context. Lower population sizes and lower number of
immigrants of M. incanus into small patches in the landscape with
30% forest cover compared to patches in the most forested
landscape are congruent with predictions from simulation models
on the effects of landscape-wide habitat cover [10,14,15]. In
combination with patch-area effects on M. incanus density being
observed only in the landscape with 30% forest cover and the
absence of the species in the most deforested landscape, these
results are in accordance with the idea that variations in
immigration rates represent the mechanism behind patch-area
effects [9,20] and species extinction thresholds [13,18,19,43]
across landscapes with differing proportions of remaining native
vegetation. Thus, the results on the demography of a forest
specialist species reported here are congruent with the patterns of
diversity observed for the whole assemblage of forest specialist
small mammals across the same landscapes [20].
Figure 3. Observed (diamonds) and estimated (lines, ModelD8) densities of M. incanus. Percentages (50%, 30%, 10%) representthe proportion of forest cover in three Atlantic forest landscapes in theAtlantic Plateau of Sao Paulo. Model equations and parameter estimates+/- SE are given in the upper left corners.doi:10.1371/journal.pone.0027963.g003
Table 2. Model-averaged estimates of population sizes (N) ofM. incanus in small patches of the landscape with 50% ofremaining forest cover (patches 1 to 3) and of the landscapewith 30% of remaining forest cover (patches 4 to 6), in primarycapture sessions 1 to 5 between February and June 2008.
Amountof forest
Patchnumber
Primarycapturesession N
Lower95% CI
Upper95% CI
50% 1 1 3.29 3.02 7.60
1 2 4.47 2.41 16.73
1 3 5.09 3.35 15.42
1 4 5.13 5.01 7.69
1 5 6.31 6.02 10.10
2 1 3.08 3.00 5.21
2 2 8.04 5.64 19.51
2 3 5.25 4.19 12.33
2 4 7.04 7.00 8.38
2 5 8.10 8.00 10.31
3 1 8.44 8.03 14.08
3 2 13.23 8.70 29.79
3 3 8.90 6.63 19.33
3 4 8.10 8.00 10.26
3 5 7.19 7.01 10.22
30% 4 1 2.01 2.00 2.55
4 2 4.80 4.09 10.94
4 3 3.26 3.02 6.71
4 4 2.00 2.00 2.16
4 5 1.00 1.00 1.20
5 1 4.04 4.00 5.57
5 2 1.37 1.03 5.71
5 3 4.71 4.08 10.46
5 4 4.01 4.00 4.55
5 5 4.02 4.00 4.96
6 1 5.00 5.00 5.05
6 2 7.08 7.00 9.02
6 3 6.02 6.00 6.89
6 4 2.00 2.00 2.00
6 5 1.00 1.00 1.01
doi:10.1371/journal.pone.0027963.t002
Immigration Rates in Fragmented Landscapes
PLoS ONE | www.plosone.org 7 November 2011 | Volume 6 | Issue 11 | e27963

Although previous studies as far as we are aware did not
investigate the effects of landscape context on immigration rates,
immigration has consistently been shown to increase population
size in patches both in field studies and simulation models [44–47].
Differences in population size among patches could also be caused
by varying in situ recruitment rates, which we were not able to
estimate due to low capture probabilities of young individuals.
However, the observed number of young individuals in patches
was similar among landscapes, suggesting that differences in
population size were primarily driven by variation in immigration
rates. In landscapes with a high proportion of remaining habitat
and small distances among patches, high dispersal increases
population size in patches, thereby rescuing small populations in
small patches from the risk of local extinction [16,20]. As a
consequence, population densities should be similar among
patches irrespective of patch size, as we observed in this study.
Given high dispersal between patches in the most forested
landscape, the population of M. incanus can be classified as a
patchy population (i.e. high dispersal rates between sub-popula-
tions effectively forming one population [48]). Indeed the
confidence interval of the estimated population rate of change in
small patches in this landscape encompasses the value of one,
indicating that the higher immigration rate supports a constantly
high population size.
On the other hand, not only was there a clear patch-area effect on
the density of M. incanus in the landscape with intermediate forest
cover (30%), but also the number of immigrants decreased
significantly in small patches of this landscape in comparison to
patches of the more forested landscape, despite the relatively small
sample size and thus statistical power. Supposedly, the decrease in
immigrants led to the comparatively lower population sizes in these
patches. Further, the confidence intervals of the population rate of
change only marginally encompass the value of one, indicating a
slight decline in population size during the study. Although the time
frame of the study is too short to infer general population trends, low
population rate of change is considered a typical indicator of
extinction risk [17,49], and this short-term population decline in
these already small populations may indeed indicate an increased
extinction risk from stochastic events. The lower immigration rates
into small patches of this landscape with intermediate forest cover is
presumed to be caused by increased inter-patch distances, which
should increase the time spent in the matrix during dispersal events
and thereby increase mortality and reduce dispersal success [50–
53]. In the Atlantic forest, predation of forest marsupials by snakes
and birds of prey has been shown to be higher in the open matrix
than in forest patches [54,55]. The time an individual spends in the
matrix might be additionally increased in landscapes with decreased
native vegetation cover through reduced perception probability of
neighboring suitable habitat patches [56,57]. Reduced or hindered
neighborhood perception might result in non-optimal movements
and hence longer times in the matrix and higher predation risk [58].
With a lower number of immigrants, but no complete isolation of
local populations in patches, within-patch processes (births and
deaths) should become relatively more important than between-
patch processes, and the population can be described as a meta-
population [59,60].
Increased isolation due to the reduction in the number of
immigrants might also affect genetic diversity [61,62]. In an
Table 3. Model-averaged estimates of apparent survival rates and population rates of change of populations of M. incanus in smallpatches of the landscape with 50% of remaining forest cover (patches 1 to 3) and of the landscape with 30% of remaining forestcover (patches 4 to 6) between February and June 2008.
Parameter Patch number Estimate Lower 95% CI Upper 95% CI
Apparent survival rate 50% landscape 1 0.61 0.48 0.74
2 0.62 0.48 0.74
3 0.62 0.48 0.73
Apparent survival rate 30% landscape 4 0.50 0.35 0.66
5 0.51 0.35 0.66
6 0.50 0.34 0.66
Population rate of change 50% landscape 1 1.04 0.87 1.22
2 1.04 0.87 1.21
3 1.04 0.87 1.20
Population rate of change 30% landscape 4 0.93 0.37 1.00
5 0.93 0.37 1.00
6 0.93 0.38 1.00
doi:10.1371/journal.pone.0027963.t003
Figure 4. Mean number of immigrated individuals of M. incanusper capture session (+/- SE). Immigration into small patches wasestimated at two Atlantic forest landscapes with different proportionsof remaining forest (50% and 30%) in the Atlantic Plateau of Sao Paulo.doi:10.1371/journal.pone.0027963.g004
Immigration Rates in Fragmented Landscapes
PLoS ONE | www.plosone.org 8 November 2011 | Volume 6 | Issue 11 | e27963

investigation of genetic diversity in functional markers (Major
Histocompatibility Complex, MHC) in the 30% forest cover
landscape, Meyer-Lucht et al. [63,64] found surprisingly low
numbers of alleles and associated higher parasite loads in
populations of M. incanus compared to a sympatric didelphid
marsupial, Gracilinanus microtarsus, which also occupies savanna-like
habitats [65,66], and is considered less dependent on forest.
Furthermore, a study on genetic variation based on non-functional
markers (microsatellites) of populations of M. incanus in the same
two landscapes found lower genetic diversity in populations of the
less forested landscape (30%) as expected when dispersal between
populations is reduced (Balkenhol, N., unpublished data).
Our results are also congruent with a fragmentation threshold
sensu Andren [9,12,20], namely a threshold in habitat amount
below which patch-area effects become apparent, with a similar
value to that proposed in a review of independent studies on birds
and mammals (#30% [9]). Furthermore, our results are in
accordance with the notion that this threshold might be a first step
leading to a drastic decrease in the probability of species
persistence at the landscape scale (extinction threshold
[18,19,43,67]), as recently proposed by Pardini et al. [20]. Given
the similarity between M. incanus and several forest specialist small
mammals in ecological requirements [25,26] and body size, the
reduction in immigration rates, the variation in the strength of
patch-area effects on population density, and the increased
extinction probability across landscapes with decreasing propor-
tion of forest cover are likely valid for other Atlantic forest species.
The simultaneous extinction of forest specialist species in highly
deforested landscapes would lead to an abrupt drop in gamma
diversity [20,68].
Our study points out the value of single-species, process-
oriented studies in understanding multi-species, larger-scale
patterns [22]. While investigations of the effects of habitat
fragmentation on population demography have focused almost
exclusively on patches in single landscapes, our study provides
empirical evidence for the dependence of population dynamics in
patches on landscape context. By revealing immigration rates as a
plausible candidate for the underlying mechanism causing both
patch-area effects and species extinction thresholds, this study is in
accordance with theoretical models proposing landscape-wide
habitat cover as the main determinant of species persistence in
fragmented landscapes [13,18,19]. This highlights the relevance of
policies that promote landscape-wide preservation of native
vegetation [68], such as the mandatory legislation to maintain
native vegetation at a fixed percentage of private properties in
Brazil (Forest Act [69,70]). Such policies are especially important
in highly endangered biomes like the Atlantic forest, where more
than 80% of all forest patches, representing more than 20% of the
remaining forest area, are smaller than 50 ha [71].
Future research should investigate the influence of landscape-
wide habitat amount on population demography in species varying
in ecological traits, such as the degree of habitat specialization and
dispersal ability, and in other ecosystems, as well as focus on the
consequences of reduced immigration on genetic diversity, fitness
and mating, and social systems.
Supporting Information
Figure S1 Detail of distribution of forest patchesinvestigated for estimation of demographic parametersof M. incanus. (A) Fragmented landscape in Tapiraı - Piedade
(50% forest cover) and (B) fragmented landscape in Ibiuna (30%
forest cover). Forest patches are shown in gray. Dots: small forest
patches where capture-recapture data was collected to estimate
demographic parameters of populations of M. incanus (second
dataset); circles: buffers around forest patches of a = 1 km,
b = 1.5 km, and c = 2 km in which percentage of forest cover
matches forest cover of the entire landscape.
(TIF)
Figure S2 Scheme of the 2-ha trapping grids used tocapture M. incanus. Identical grids were installed at six forest
patches located in two Atlantic forest landscapes with different
proportions of remaining forest (50% and 30%) in the Atlantic
Plateau of Sao Paulo (second dataset). White rectangles: Sherman
traps; black circles: pitfall traps; black lines: plastic fence
connecting pitfall traps of one line.
(TIF)
Table S1 Model-averaged estimates of population sizesof adults (N(adult)) of M. incanus in small patches of thelandscape with 50% of remaining forest cover (patches 1to 3) and of the landscape with 30% of remaining forestcover (patches 4 to 6), in primary capture sessions 2 to 5between February and June 2008.
(DOC)
Acknowledgments
We are grateful to Thais Kubik Martins and all field helpers, to Goncalo
Ferraz, Toby A. Gardner, Niko Balkenhol, Jan Axtner, Rahel Sollmann
and two anonymous reviewers for critical comments on former versions of
the manuscript.
Author Contributions
Conceived and designed the experiments: TP RP. Performed the
experiments: TP AAB CdSdB RP. Analyzed the data: TP AAB CdSdB
RP. Contributed reagents/materials/analysis tools: SS RP. Wrote the
paper: TP AAB CdSdB SS RP.
References
1. Chiarello AG (2000) Density and population size of mammals in remnants of
Brazilian Atlantic forest. Conserv Biol 14: 1649–1657.
2. Stoll P, Oggier P, Baur B (2009) Population dynamics of six land snail species in
experimentally fragmented grassland. J Anim Ecol 78: 236–246.
3. Johannesen E, Andreassen HP, Ims RA (2000) Spatial explicit demography: The
effects habitat patch isolation have on vole matrilines. Ecol Lett 3: 48–57.
4. Coffman CJ, Nichols JD, Pollock KH (2001) Population dynamics of Microtus
pennsylvanicus in corridor-linked patches. Oikos 93: 3–21.
5. Ruiz-Gutierrez V, Gavin TA, Dhondt AA (2008) Habitat fragmentation lowers
survival of a tropical forest bird. Ecol Appl 18: 838–846.
6. Gardner JL, Heinsohn RG (2007) Probable consequences of high female
mortality for speckled warblers living in habitat remnants. Biol Conserv 135:
473–483.
7. Cushman SA (2006) Effects of habitat loss and fragmentation on amphibians: a
review and prospectus. Biol Conserv 128: 231–240.
8. Fischer J, Lindenmayer DB (2007) Landscape modification and habitat
fragmentation: a synthesis. Global Ecol Biogeogr 16: 265–280.
9. Andren H (1994) Effects of habitat fragmentation on birds and mammals in
landscapes with different proportions of suitable habitat: a review. Oikos 71:
355–366.
10. With KA, King AW (1999) Dispersal success in fractal landscapes: a
consequence of lacunarity thresholds. Landscape Ecol 14: 78–83.
11. Fahrig L (2003) Effects of habitat fragmentation on biodiversity. Annu Rev Ecol
Evol Syst 34: 487–515.
12. Swift TL, Hannon SJ (2010) Critical thresholds associated with habitat loss: a
review of the concepts, evidence, and applications. Biol Rev 85: 35–53.
13. With KA, King AW (1999) Extinction thresholds for species in fractal
landscapes. Conserv Biol 13: 314–326.
14. Bender DJ, Tischendorf L, Fahrig L (2003) Using patch isolation metrics to
predict animal movement in binary landscapes. Landscape Ecol 18: 17–39.
Immigration Rates in Fragmented Landscapes
PLoS ONE | www.plosone.org 9 November 2011 | Volume 6 | Issue 11 | e27963
15. Tischendorf L, Bender DJ, Fahrig L (2003) Evaluation of patch isolation metrics
in mosaic landscapes for specialist vs. generalist dispersers. Landscape Ecol 18:41–50.
16. Brown JH, Kodric-Brown A (1977) Turnover rates in insular biogeography:
effect of immigration on extinction. Ecology 58: 445–449.17. Gaggiotti OE, Hanski I (2004) Mechanisms of population extinction. In:
Hanski I, Gaggiotti OE, eds. Metapopulation dynamics: perspectives fromlandscape ecology. Burlington San Diego, London: Elsevier Academic Press. pp
337–366.
18. Fahrig L (2001) How much habitat is enough? Biol Conserv 100: 65–74.19. Fahrig L (2002) Effect of habitat fragmentation on the extinction threshold: a
synthesis. Ecol Appl 12: 346–353.20. Pardini R, Bueno AA, Gardner TA, Prado PI, Metzger JP (2010) Beyond the
fragmentation threshold hypothesis: regime shifts in biodiversity acrossfragmented landscapes. Plos One 5: e13666. doi:10.1371/journal.-
pone.0013666.
21. Bennett AF, Radford JQ, Haslem A (2006) Properties of land mosaics:Implications for nature conservation in agricultural environments. Biol Conserv
133: 250–264.22. Lindenmayer DB, Fischer J, Felton A, Montague-Drake R, Manning A, et al.
(2007) The complementarity of single-species and ecosystem-oriented research in
conservation research. Oikos 116: 1220–1226.23. Fernandes FR, Cruz LD, Martins EG, dos Reis SF (2010) Growth and home
range size of the gracile mouse opossum Gracilinanus microtarsus (Marsupialia:Didelphidae) in Brazilian cerrado. Growth and home range size of the gracile
mouse opossum Gracilinanus microtarsus (Marsupialia: Didelphidae) in Braziliancerrado 26: 185–192.
24. Gentile R, Finotti R, Rademaker V, Cerqueira R (2004) Population dynamics of
four marsupials and its relation to resource production in the Atlantic forest insoutheastern Brazil. Mammalia 68: 109–119.
25. Umetsu F, Pardini R (2007) Small mammals in a mosaic of forest remnants andanthropogenic habitats - evaluating matrix quality in an Atlantic forest
landscape. Landscape Ecol 22: 517–530.
26. Puttker T, Pardini R, Meyer-Lucht Y, Sommer S (2008) Responses of five smallmammal species to micro-scale variations in vegetation structure in secondary
Atlantic Forest remnants, Brazil. BMC Ecol 8: doi:10.1186/1472-6785-1188-1189.
27. Oliveira-Filho AT, Fontes MAL (2000) Patterns of floristic differentiation amongAtlantic Forests in Southeastern Brazil and the influence of climate. Biotropica
32: 793–810.
28. Ross JLS, Moroz IC (1997) Mapa Geomorfologico do Estado de Sao Paulo:escala 1:500.000. FFLCH-USP. Sao Paulo: IPT and Fapesp.
29. Agritempo Sistema de Monitoramento Agrometorologico. Agritempo Website.Available: http://www.agritempo.gov.br. Accessed 2011 Sep.
30. Umetsu F, Naxara L, Pardini R (2006) Evaluating the efficiency of Pitfall traps
for sampling small mammals in the Neotropics. J Mammal 87: 757–765.31. Pollock KH (1982) A capture-recapture design robust to unequal probability of
capture. J Wildl Manage 46: 752–757.32. Kendall WL, Nichols JD, Hines JE (1997) Estimating temporary emigration
using capture-recapture data with Pollocks robust design. Ecology 78: 563–578.33. Kendall WL, Pollock KH (1992) The Robust Design in capture-recapture
studies: a review and evaluation by Monte Carlo simulation. In:
McCullough DR, Barrett RH, eds. Wildlife 2001: Populations. London:Elsevier. pp 31–43.
34. Burnham KP, Anderson DR (2002) Model selection and multimodel inference -a practical information-theoretic approach. New York, USA: Springer Science +Business Media. 484 p.
35. R Development Core Team (2010) R: A Language and Environment forStatistical Computing. Vienna: R Foundation for Statistical Computing.
Available: http://www.R-project.org. Accessed 2011 Sep.36. White GC, Burnham KP (1999) Program MARK: survival estimation from
populations of marked animals. Bird Study 46: 120–139.
37. Stanley TR, Burnham KP (1999) A closure test for time-specific capture-recapture data. Environ Ecol Stat 6: 197–209.
38. Pradel R (1996) Utilization of capture-mark-recapture for the study ofrecruitment and population growth rate. Biometrics 52: 703–709.
39. Huggins RM (1991) Some practical aspects of a conditional likelihood approachto capture experiments. Biometrics 47: 725–732.
40. Johnson JB, Omland KS (2004) Model selection in ecology and evolution.
Trends Ecol Evol 19: 101–108.41. Beck H, Gaines MS, Hines JE, Nichols JD (2004) Comparative dynamics of
small mammal population in treefall gaps and surrounding understorey withinAmazonian rainforest. Oikos 106: 27–38.
42. Macedo J, Loretto D, Vieira MV, Cerqueira R (2006) Classes de desenvolvi-
mento em marsupiais: um metodo para animais vivos. Mastozool Neotrop 13:133–137.
43. Lande R (1987) Extinction thresholds in demographic models of territorial
populations. Am Nat 130: 624–635.
44. Fahrig L, Paloheimo J (1988) Determinants of local population size in patchy
habitats. Theor Popul Biol 34: 194–213.
45. Paradis E (1995) Survival, immigration and habitat quality in the Mediterranean
pine vole. J Anim Ecol 64: 579–591.
46. Debinski DM, Holt RD (2000) A survey and overview of habitat fragmentation
experiments. Conserv Biol 14: 342–355.
47. Bowman J, Cappuccino N, Fahrig L (2002) Patch size and population density:
the effect of immigration behavior. Conserv Ecol 6: http://www.consecol.org/
vol6/iss1/art9.
48. Harrison S (1991) Local extinction in a metapopulation context: an empirical
evaluation. Biol J Linn Soc 42: 73–88.
49. Sibly RM, Hone J (2002) Population growth rate and its determinants: an
overview. Philos T Roy Soc B 357: 1153–1170.
50. Andreassen HP, Ims RA (1998) The effects of experimental habitat destruction
and patch isolation on space use and fitness parameters in female root vole
Microtus oeconomus. J Anim Ecol 67: 941–952.
51. Aars J, Johannesen E, Ims RA (1999) Demographic consequences of movements
in subdivided root vole populations. Oikos 85: 204–216.
52. Smith JE, Batzli GO (2006) Dispersal and mortality of prairie voles (Microtus
ochrogaster) in fragmented landscapes: a field experiment. Oikos 112: 209–217.
53. Gruber B, Henle K (2008) Analysing the effect of movement on local survival: a
new method with an application to a spatially structured population of the
arboreal gecko Gehyra variegata. Oecologia 154: 679–690.
54. Lira PK, Fernandez FAD, Carlos HSA, Curzio PD (2007) Use of a fragmented
landscape by three species of opossum in south-eastern Brazil. J Trop Ecol 23:
427–435.
55. Bernardo LRR (2010) Comportamento de procura de habitats de Philander
frenatus (Olfers, 1818) em remanescentes de Mata Atlantica do Rio de Janeiro.
MSc Dissertation, Federal University of Rio de Janeiro, Rio de. pp Janeiro.76.
56. Zollner PA, Lima SL (1999) Search strategies for landscape-level interpatch
movements. Ecology 80: 1019–1030.
57. Forero-Medina G, Vieira MV (2009) Perception of a fragmented landscape by
neotropical marsupials: effects of body mass and environmental variables. J Trop
Ecol 25: 53–62.
58. Fahrig L (2007) Non-optimal animal movement in human-altered landscapes.
Funct Ecol 21: 1003–1015.
59. Thomas CD, Kunin WE (1999) The spatial structure of populations. J Anim
Ecol 68: 647–657.
60. Hanski I, Gaggiotti OE (2004) Ecology, Genetics, and Evolution of
Metapopulations. BurlingtonSan Diego, , London: Elsevier Academic Press.
pp 696.
61. Frankham R, Ballou JD, Briscoe DA (2002) Introduction to Conservation
Genetics. Cambridge: Cambridge University Press. pp 617.
62. Banks SC, Lindenmayer DB, Ward SJ, Taylor AC (2005) The effects of habitat
fragmentation via forestry plantation establishment on spatial genotypic
structure in the small marsupial carnivore, Antechinus agilis. Mol Ecol 14:
1667–1680.
63. Meyer-Lucht Y, Otten C, Puttker T, Sommer S (2008) Selection, diversity and
evolutionary patterns of the MHC class II DAB in free-ranging Neotropical
marsupials. BMC Genet 9: doi:10.1186/1471-2156-1189-1139.
64. Meyer-Lucht Y, Otten C, Puttker T, Pardini R, Metzger JP, et al. (2010) Variety
matters: adaptive genetic diversity and parasite load in two mouse opossums
from the Brazilian Atlantic forest. Conserv Genet 11: 2001–2013.
65. Martins EG, Bonato V, Pinheiro A, Dos Reis SF (2006) Variation in the food-
niche width of Gracilinanus microtarsus (Didelphimorphia: Didelphidae) in a
cerrado remnant in south-eastern Brazil. Mamm Biol 71: 304–308.
66. Martins EG, Bonato V, Queiroz da-Silva C, Reis F (2006) Seasonality in
reproduction, age structure and density of the gracile mouse opossum Gracilinanus
microtarsus (Marsupialia: Didelphidae) in a Brazilian cerrado. J Trop Ecol 22:
461–468.
67. Andren H (1996) Population responses to habitat fragmentation: Statistical
power and the random sample hypothesis. Oikos 76: 235–242.
68. Hanski I (2011) Habitat loss, the dynamics of biodiversity, and a perspective on
conservation. AMBIO 40: 248–255.
69. Metzger JP (2010) O codigo florestal tem base cientıfica? Conservacao &
Natureza 8: 92–99.
70. Metzger JP, Lewinsohn TM, Joly CA, Verdade LM, Martinelli A, et al. (2010)
Brazilian law: full speed in reverse? Science 329: 276–277.
71. Ribeiro MC, Metzger JP, Martensen AC, Ponzoni FJ, Hirota MM (2009) The
Brazilian Atlantic Forest: How much is left, and how is the remaining forest
distributed? Implications for conservation. Biol Conserv 142: 1141–1153.
Immigration Rates in Fragmented Landscapes
PLoS ONE | www.plosone.org 10 November 2011 | Volume 6 | Issue 11 | e27963