Ponnle.Lawson-2015.pdf - NTU > IRep
308
PROGRESS TOWARDS ACHIEVING THE UNITED NATIONS’ FIRST MILLENNIUM DEVELOPMENT GOAL: AN ANALYSIS OF INCOME AND FOOD POVERTY IN NIGERIA’S STATES OF OSUN AND JIGAWA PONNLE SOLOMON LAWSON MPHIL THESIS 2015
-
Upload
khangminh22 -
Category
Documents
-
view
0 -
download
0
Transcript of Ponnle.Lawson-2015.pdf - NTU > IRep

PROGRESS TOWARDS ACHIEVING THE UNITED NATIONS’ FIRST
MILLENNIUM DEVELOPMENT GOAL: AN ANALYSIS OF INCOME
AND FOOD POVERTY IN NIGERIA’S STATES OF OSUN AND
JIGAWA
PONNLE SOLOMON LAWSON
MPHIL THESIS 2015

ii
PROGRESS TOWARDS ACHIEVING THE UNITED NATIONS’ FIRST
MILLENNIUM DEVELOPMENT GOAL: AN ANALYSIS OF INCOME
AND FOOD POVERTY IN NIGERIA’S STATES OF OSUN AND
JIGAWA
Ponnle Solomon Lawson
A Thesis in Fulfilment of the Requirements for the Degree of Master of
Philosophy
Nottingham Trent University
School of Arts and Humanities
2015

iii
ABSTRACT
This study investigates the levels and determinants of income and food poverty in Nigeria’s States of
Osun and Jigawa to assess the progress towards attaining the United Nations Millennium Development Goals’
(MDGs) targets on poverty reduction in these states in order to verify claims of previous studies and analyses
regarding these. The study uses both the individual and the family household in both Osun and Jigawa States of
Nigeria as its units of analysis and employs the mixed-method research, comprising both the quantitative and
qualitative methods. It collects its quantitative data relying on administration of questionnaires and collects its
qualitative data relying on organization of Focus Group Discussions. Six hypotheses are tested by the study to
investigate the likely association between the gender, age, educational attainment, and employment status of the
family household head, family household size and family household geographical location (independent
variables) and income and food poverty (dependent variables). The study analyzes its quantitative data using the
Foster, Greer and Thorbecke (FGT) Poverty Headcount Ratio and the Statistical Package for the Social Sciences
(SPSS) software and it analyzes its qualitative data using tape-based and note-based analyses.
Findings of the qualitative element of this research hugely reveal that in general, the levels of income and
food poverty in the study areas are high. These findings are confirmed by the findings of the quantitative
elements of the research which reveal that at the individual level, Osun and Jigawa States have income poverty
rates of 62.6% and 70% respectively based on the international market exchange rate; and that based on the PPP
exchange rate, Osun and Jigawa States have income poverty rates of 37.7% and 42% respectively. These
findings reveal that the levels of income and food poverty in the two states are both high and moderate based on
the exchange rates used as yardsticks for measurement of income and food poverty in the states, thereby
suggesting that the progress towards achieving the United Nations Millennium Development Goals’ (MDGs)
targets on poverty reduction is both positive and negative.

iv
CONTENTS
Title Page i
Abstract iii
Table of Contents iv
List of Abbreviations vii
List of Tables x
List of Figures xi
Declaration xii
Statement of Copyright xiii
Acknowledgement xiv
Dedication xvi
CHAPTER ONE: GENERAL INTRODUCTION 1
1.1 Introduction/Background to Research 1
1.2 Statement of Problem 3
1.3 Research Objectives 5
1.4 Research Questions and Research Hypotheses 6
1.4.1 Research Questions 6
1.4.2 Hypotheses 6
1.5 Focus, Coverage and Units of the Research 7
1.6 Brief Profiles of the Study Areas of the Research 8
1.6.1 Jigawa State 8
1.6.2 Osun State 9
1.7 Justification of the Research 11
1.8 Structure of the Thesis 11
CHAPTER TWO: LITERATURE REVIEW 13
2.1 Introduction 13
2.2 Poverty 13
2.2.1 Brief Description of Poverty and the Poor 13
2.2.2 Approaches to Poverty 15
2.2.2.1 Income Approach 15
2.2.2.2 Basic Needs Approach 20
2.2.2.3 Capability Approach 22
2.2.2.4 Participatory Approach to Poverty 29
2.3 Major Causes of Global Poverty 33
2.4 Theoretical Explanations of the Causes of Poverty 48

v
2.5 Major Consequences of Global Poverty 55
2.6 Poverty in Nigeria 66
2.6.1 A Brief Description of Poverty in Nigeria 66
2.6.2 Percentages of the Income Poor, Food Poor and Population Living
in Poverty in Nigeria 70
2.6.3 Major Determinants of Poverty in Nigeria 73
2.6.4 Poverty Reduction Strategies in Nigeria 89
2.7 Framework for the Research 96
2.8 Chapter Summary 98
CHAPTER THREE: DEVELOPMENT AND THE MILLENNIUM
DEVELOPMENT GOALS 99
3.1 Introduction 99
3.2 The Idea of Development 99
3.3 Perspectives of Development over Time 106
3.3.1 Perspective of Development in the 1950s 106
3.3.2 Perspective of Development in the 1960s 110
3.3.3 Perspectives of Development in the 1970s 115
3.3.4 Perspectives of Development in the 1980s 133
3.3.4 Perspectives of Development in the 1990s 123
3.4 The Millennium Development Goals (MDGs) 136
3.4.1 A Brief Description of the MDGs 136
3.5 The Links between Perspectives of Development and the MDGs 142
3.6 Progress of the MDGs’ Targets on Global Poverty Reduction 145
3.7 Progress of the MDGs’ Targets on Poverty Reduction in Nigeria 151
3.9 Summary of Chapter 159
CHAPTER FOUR: RESEARCH METHODOLOGY 161
4.1 Introduction 161
4.2 Paradigm, Ontology, Epistemology and Methods of the Study 161
4.3 Rationale for the Choice of Osun and Jigawa States of Nigeria 164
4.4 Data Collection 165
4.4.1 Primary Data Collection: Non-Survey Method - Focus Group Discussions 165
4.4.1.1 Focus Group Discussions’ Sampling Strategy and Recruitment 167
4.4.1.2 Focus Group Discussions’ Strategy 168
4.4.1.3 Brief Discussion on the Cultural Context with Respect to the FGDs 170

vi
4.4.2 Primary Data Collection: Survey Method - Household Questionnaire
Administration 172
4.4.3 Secondary Data Collection 182
4.5 Data Analysis Techniques 183
4.5.1 Analysis of the qualitative data - Focus Group Discussions 183
4.5.2 Analysis of the quantitative data – Household Questionnaires
Administration 184
4.6 Adoptions and Assumptions the for Purpose of the Research 187
4.7 Limitations to the Research 189
CHAPTER FIVE: DATA ANALYSIS AND DISCUSSION 190
5.1 Introduction 190
5. 2 Analysis of the Qualitative Element of the Research 190
5.2.1 Focus Group Discussions (FGDs) Analysis 190
5.2.1.1 Theme 1: The Meaning of Poverty 191
5.2.1.2 Theme 2: Levels of Income and Food Poverty 193
5.2.1.3 Theme 3: Factors Associated with Income and Food Poverty 194
5.2.1.4 Theme 4: Progress towards Attaining the MDGs’
Targets on Poverty Reduction 197
5. 3 Analysis of the Quantitative Elements of the Research Based on Administered
Questionnaires 199
5.3.1 Socio-Economic Characteristics of the Family Households in the
Research Study Areas 199
5.3.1.1 Gender of the Family Household Head 199
5.3.1.2 Age of the Family Household Head 200
5.3.1.3 Educational Attainment of the Family Household Head 201
5.3.1.4 Employment Status of the Family Household Head 202
5.3.1.5 Family Household Head Monthly Income 203
5.3.1.6 Family Household Size 204
5.3.2 Levels of Income and Food Poverty: Foster, Greer and Thorbecke (FGT)
Headcount Calculations Based on the International
Market Exchange Rate 205
5.3.2.1 Osun State: FGT Calculation of the Proportion of People
in Income Poverty 205
5.3.2.2 Jigawa State: FGT Calculation of the Proportion of
People in Income Poverty 206
5.3.3 Levels of Income and Food Poverty: Foster, Greer and Thorbecke (FGT)

vii
Headcount Calculations Based on the Purchasing-Power-Parity Exchange Rate 207
5.3.3.1 Osun State: FGT Calculation of the Proportion of People
in Income Poverty 207
5.3.3.2 Jigawa State: FGT Calculation of the Proportion of People
in Income Poverty 207
5.3.4 Test of Research Hypotheses Based on the International Market and
the Purchasing-Power- Parity Exchange Rates 208
5.4 Discussion of Research Findings 210
5.4.1 Levels of Income and Food Poverty in the Study Areas 210
5.4.2 Probable Determinants of Poverty in the Study Aras 211
5.4.3 Progress towards Attaining MDGs’ Targets on Poverty Reduction 215
CHAPTER SIX: CONCLUSION AND AGENDA FOR FURTHER RESEARCH 219
6.1 Introduction 219
6.2 Summary and Conclusion 219
6.3 Agenda for Further Research 224
Appendices 226
Bibliography 237
viii
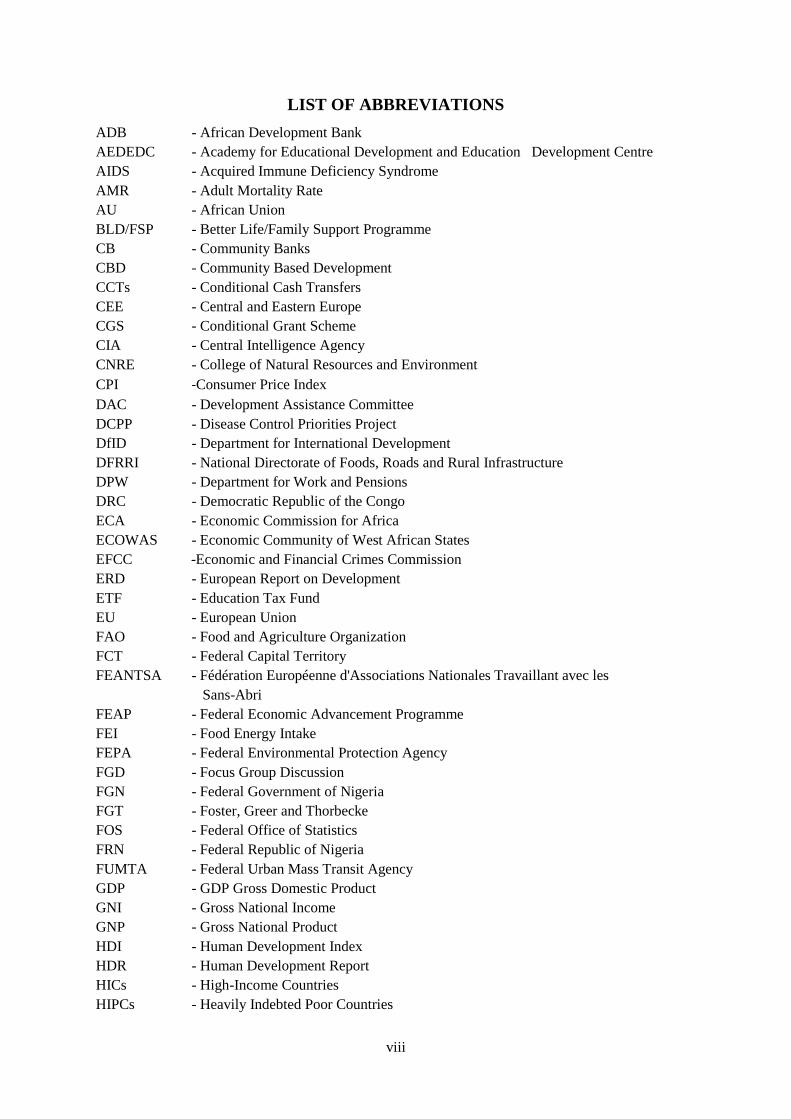
LIST OF ABBREVIATIONS
ADB - African Development Bank
AEDEDC - Academy for Educational Development and Education Development Centre
AIDS - Acquired Immune Deficiency Syndrome
AMR - Adult Mortality Rate
AU - African Union
BLD/FSP - Better Life/Family Support Programme
CB - Community Banks
CBD - Community Based Development
CCTs - Conditional Cash Transfers
CEE - Central and Eastern Europe
CGS - Conditional Grant Scheme
CIA - Central Intelligence Agency
CNRE - College of Natural Resources and Environment
CPI -Consumer Price Index
DAC - Development Assistance Committee
DCPP - Disease Control Priorities Project
DfID - Department for International Development
DFRRI - National Directorate of Foods, Roads and Rural Infrastructure
DPW - Department for Work and Pensions
DRC - Democratic Republic of the Congo
ECA - Economic Commission for Africa
ECOWAS - Economic Community of West African States
EFCC -Economic and Financial Crimes Commission
ERD - European Report on Development
ETF - Education Tax Fund
EU - European Union
FAO - Food and Agriculture Organization
FCT - Federal Capital Territory
FEANTSA - Fédération Européenne d'Associations Nationales Travaillant avec les
Sans-Abri
FEAP - Federal Economic Advancement Programme
FEI - Food Energy Intake
FEPA - Federal Environmental Protection Agency
FGD - Focus Group Discussion
FGN - Federal Government of Nigeria
FGT - Foster, Greer and Thorbecke
FOS - Federal Office of Statistics
FRN - Federal Republic of Nigeria
FUMTA - Federal Urban Mass Transit Agency
GDP - GDP Gross Domestic Product
GNI - Gross National Income
GNP - Gross National Product
HDI - Human Development Index
HDR - Human Development Report
HICs - High-Income Countries
HIPCs - Heavily Indebted Poor Countries

ix
HIV - Human Immunodeficiency Virus
HND - Higher National Diploma
HNLSS -Harmonized Nigerian Living Standard Survey
ICPC -Independent Corrupt Practices Commission
IES - International Energy Statistics
IHD - Ischemic Heart Disease
ILO - International Labour Organization
IMF - International Monetary Fund
IMR - Infant Mortality Rate
INAFI - International Network Alternative Financial Institution
IOM - International organization for Migration
LDCs - Least Developed Countries/Less Developed Countries
LEEDS - Local Government Economic Empowerment and Development Strategy
LFPR - Labour Force Participation Rate
LGAs - Local Government
LICs - Low/Lower Income Countries
MDAs - Ministries, Departments and Agencies
MDGs OSSAP-MDGs- Senior Special Adviser to the President on Millennium Development
Goals
MDGs - Millennium Development Goals
MDRI - Multilateral Debt Relief Initiative
MICs - Middle Income Countries
MTEF - Federal Government Medium Term Expenditure Framework
NALDA - National Agricultural Land Development Authority
NAML - National Agency for Mass Literacy
NAPEC - National Poverty Eradication Council
NAPEP - National Poverty Eradication Programme
NBER - National Bureau of Economic Research
NCDs - Non Communicable Diseases
ND - National Diploma
NDE - National Directorate of Employment
NEEDS - National Economic Empowerment and Development Strategy
NGOs - Non-Government Organizations
NLSS - Nigeria Living Standard Survey
NMR - Neonatal Mortality Rate
NNI - Net National Income
NPC - National Planning Commission
NPFS - National Programme for Food Security
NPHS - National Primary Health Scheme
NpoC - National Population Commission
NRC -National Research Council
NRDCS - Natural Resources Development and Conservative Scheme
ODA - Official Development Assistance
OECD - Organisation for Economic Co-operation and Development
OFN - Operation Feed the Nation
ONS - Office for National Statistics
PAP - Poverty Alleviation Programme
PBN - Peoples’ Bank of Nigeria

x
PPAs -Participatory Poverty Assessments
PPP - Purchasing–Power Parity
PRSP - Poverty Reduction Strategy Paper/ Poverty Reduction Strategy Process
PTF - Petroleum Trust Fund
RIDS - Rural Infrastructure and Development Scheme
SAP - Structural Adjustment Programme
SEEDS - State Economic Empowerment and Development Strategy
SMEDAN - Small and Medium Enterprises Development Agency of Nigeria
SOWESS - Social Welfare Service Scheme
SPSS - Statistical Package for the Social Sciences
SSA - Sub-Saharan Africa
UBE - Universal Basic Education Program
UDHR - Universal Declaration of Human Rights
UK - United Kingdom
UN DESA - United Nations Department of Economic and Social Affairs
UN - United Nations
UNDP - United Nations Development Programme
UNECA - United Nations Economic Commission for Africa
UNEP - United Nations Environmental Programme
UNESCO - United Nations Educational, Scientific and Cultural Organization
UNFPA - United Nations Population Fund
UN-HABITAT- United Nations Human Settlements Programme
UNHCR - United Nations High Commissioner for Refugees
UNICEF - United Nations Children’s Fund
UNISDR - United Nations International Strategy for Disaster Reduction
UNMP - United Nations Millennium Project
US - United States
USCB - United States Census Bureau
USEIA - United States Energy Information Administration
VON - Voice of Nigeria
VPF - Virtual Poverty Fund
WAI - West African Insight
WDI - World Development Indicators
WHO - World Health Organization
WRI - World Resources Institute
WTO - World Trade Organization
YES - Youth Empowerment Scheme

xi
LIST OF TABLES
Table 1.1: Hypotheses 7
Table 2.1: Nigeria’s Per Capital Income (1980 – 2011) 70
Table 2.2: Incidence of Poverty in Nigeria (1980 – 2010) 70
Table 2.3: Factors Associated with Poverty and Relevant Previous Studies 97
Table 4.1: Research Paradigm and Methods 164
Table 4.2: Osun State Poverty Profile 165
Table 4.3: Jigawa State Poverty Profile 165
Table 4.4: Periods, Venues, and Duration of FGDs in Study Areas 171
Table 4.5: Composition of Focus Groups in Study Area 171
Table 4.6: FGD Design and Mode of Recording in Study Areas 172
Table 4.7: Survey Data Collection Method and Mode of Questionnaire Administration 173
Table 4.8: Population, Sample Size and Percentage of Sample Size of the Research 175
Table 4.9: Sampling Method for the Household Questionnaire Administration 176
Table 4.11: Pilot Study 181
Table 4.12: Survey Summary 181
Table 4.13: Survey Summary 182
Table 4.14: FDGs Data Analysis 184
Table 4.15: Household Questionnaires Administration Analysis 187
Table 5.1: Osun and Jigawa States - Gender of Family Household Head 199
Table 5.2: Osun and Jigawa States - Age of Family Household Head 201
Table 5.3: Osun and Jigawa States - Educational Attainment of Family Household Head 208
Table 5.4: Osun and Jigawa States - Employment Status of Family Household Head 202
Table 5.5: Osun and Jigawa States - Family Household Head Monthly Income from
Employment/Self Employment 203
Table 5.6: Osun and Jigawa States - Family Household Size 204

xii
LIST OF FIGURES
Fig 1.1: Map of Jigawa State 8
Fig 1.2: Map of Osun State 10
Fig 5.1: Osun and Jigawa States - Gender of Family Household Head 199
Fig 5.2: Osun and Jigawa States - Age of the Family Household Head 200
Fig 5.3: Osun and Jigawa States - Educational Attainment of the Family Household Head 201
Fig 5.4: Osun and Jigawa States - Employment Status of the Family Household Head 202
Fig 5.5: Osun and Jigawa States - Family Household Head Monthly Income from
Employment/Self Employment 203
Fig 5.6: Osun and Jigawa States - Family Household Size 204
Fig 5.7: Osun and Jigawa States – Proportion of Income Poor People at
International Market Exchange Rate 206
Fig 5.8: Osun and Jigawa States – Proportion of Income Poor People at PPP Exchange Rate 208

xiii
DECLARATION
I declare that this thesis is my original research work and has not been submitted in any form
for another degree or diploma at any tertiary institution, including university. Materials from
published and unpublished works of others, which are quoted in this thesis are duly
referenced and credited to the authors.

xiv
STATEMENT OF COPYRIGHT
Copyright © 2015 Ponnle Solomon Lawson
Only the author has the copyright of this thesis. Any quotation, citation or reference to it,
without the written consent of the author should be properly acknowledged.

xv
ACKNOWLEDGEMENTS
I give glory, honour and adoration to God Almighty for sparing my life and giving me
the opportunity to complete this thesis. I quite appreciate His favour and mercy over me.
My profound gratitude goes to my immediate family comprising my wife, Mojisola
Lawson and my sons, Oluwaponmile (Jr) and Ogooluwakiitan Lawson for their
encouragement and support in all forms. I love you all.
I am indeed grateful to my supervisor, Dr. Roy Smith for his painstaking supervision,
mentorship, and care. His comments and advice were found most useful. Also, I appreciate
the support of my second supervisor, Dr. Sagarika Dutt which was of help to me all through.
My appreciation also goes to Dr. Chris Farrands and Dr. Amanda Smith for their useful
comments.
Many people have contributed to the successful completion of this thesis. My
profound gratitude goes to my relations for their emotional and moral support; they include
Chief John Bamidele (My Dad - Nigeria), Kola and Joke Ojo (Nigeria), George and Funke
Ogundimu (UK), Biola and Yemisi Lawson (Nigeria), Biodun and Yetunde Lawson
(Nigeria), Ibrahim and Bukky Ogunbiyi (Nigeria), Jibola Lawson (Nigeria), Tolu Lawson
(Nigeria), Bisola Lawson (Nigeria), Lolade Lawson (Nigeria), Bolu Lawson (Nigeria), Bola
Lawson (Nigeria), Doyin Ojo ((Nigeria), Dapo Ojo ((Nigeria), Damilola Ojo ((Nigeria),Wale
Okunola (Nigeria), Titi Akanbi (Nigeria), and Sola and Kemi Ogungbile (Nigeria).
Also, I appreciate the moral and academic support of my senior and contemporary
colleagues; they include Dr. Joseph Sunday Oke (Nigeria), Builder. Mosisiyenemo Patrick-
Hussein (Nigeria), Dr. (Mrs) Halirat Babalola (Nigeria), Dr. Kayode Adebile (Nigeria), Dr.
Ajah (Nigeria), Dr. (Mrs) Caroline Adewusi (Nigeria), Dr. Michael Tribe (UK), Dr. Mathew
Analogbei (UK), Dr. Jude Zion (UK), Dr. Omo Aregbeyen (Nigeria), Dr. Musibau
Arowomole (Nigeria), Alhaji Rasheed Bababunmi (Nigeria), Mr. Sam Babatope (Nigeria),

xvi
Mr. Alhassan Ogunleye (Nigeria), Mrs Eunice Siyanbola (Nigeria), and Mrs. Oyediran
(Nigeria). Others include Messrs Pak Alade Williams (Nigeria), Ademola Fabiyi (Nigeria),
Ibrahim Motajo (Nigeria), Kazeem Oyedeji (Nigeria), Lukman Adaranijo (Nigeria), Remi
Hameed (Nigeria), Olabode Ojo (Nigeria), Segun Babalola (Nigeria), Sam Oluga (Malaysia),
Abiodun Ulabor (Nigeria), Ganiyu Salaudeen (Nigeria), Sunday Fabiyi (Nigeria), Mike
Lasore (Nigeria), Lukman Olawoyin (China), Akeem Odegade (Nigeria), Oladayo Awoleye
(Nigeria), Abdullah Fatai (Nigeria) Olajide Olutobi (Nigeria), and Poju Adeyombo (Nigeria).
My appreciation also goes to my pastors and friends for their spiritual and emotional
support all the way; they include Pastor Ayo Okelana (Nigeria) Pastor Omoniyi Makun (UK),
Pastor Segun Ibigbemi (UK), Pastor William (Nigeria), Prophet Obisesan (Nigeria),
Deaconess Ope Kosoko, Olumide Ajibola (UK), Gbenga and Sola Olubobokun (UK), Dr.
Michael and Mrs Imo Kehinde (Canada), Yinka and Bukky Olalere (Nigeria), Lola and Sade
Ibitowa (Nigeria), Niyi and Bimbo Awolola (UK), Kehinde Lawal (Ireland), Vivian Bodunrin
(Canada), Taofeek and Aminat Adeyemi (UK), Jamiu and Taiwo Abdulsalam (UK), Liasu
and Shile Taiwo (UK), Adekunle Adeyinka (UK), Ayoade Jayeola (UK), Yemisi Owoeye
(UK), Felix Akinwande (UK), Yekeen Akinkunmi (Nigeria) and Seyi Olutola (Nigeria).
I specifically appreciate the moral and emotional support of a special friend, Mr.
Taiwo Adebayo whose support would ever remain immortal and imperishable. His support
has been first among equals and second to none. I shall forever be grateful to him.
Finally, I thank other persons who have been involved in the successful completion of
this thesis one way or the other, and whose names have not been mentioned.
I THANK AND APPRECIATE YOU ALL.

xvii
DEDICATION
This thesis is dedicated to my wonderful wife, MOJISOLA and promising sons,
OLUWAPONMILE (JUNIOR) and OGOOLUWAKIITAN, and to the memory of my late
mother, MRS. FELICIA ADEDUNNI ABEKE LAWSON.

1
CHAPTER ONE
INTRODUCTION
1.1 Background to the Research
At the Millennium Summit in September 2000, the Millennium Declaration was adopted
by 189 United Nations (UN) member-states; the declaration covers ―commitments to poverty
eradication, development, and protecting the environment‖ (World Bank, 2011a). According to
Bertucci and Rosenbaum (2007, p. 7), the declaration focuses on ―upholding human rights, and
fostering democracy and good governance; ensuring peace, security and disarmament;
promoting development and poverty eradication; fostering environmental protection; protecting
the vulnerable; and meeting the special needs of Africa.‖ One year later, from the declaration
emerged eight goals, supported by 18 quantified and time-bound targets and 48 indicators, which
became known as the Millennium Development Goals (MDGs)‖ (World Bank, 2011a). Through
the MDGs, the attempt of the world community was directed towards ―achieving significant,
measurable improvements in people's lives by the year 2015;‖ this informs the reason the
progress of the goals is measured ―not just for developing countries but for the rich countries that
help fund development programmes and for the multilateral institutions that help countries
implement them‖ (World Bank, 2011a).
The idea of MDGs was thus a response from world leaders to reduce poverty globally as
the goals have poverty reduction at their core and they have a commitment to halve global
poverty by 2015 (Willis, 2011; Greig, Hulme, and Turner, 2007). According to the UNMP
(2005, pp. 2; 12; 263), the MDGs are ―the most broadly supported comprehensive and specific
poverty reduction targets the world has ever established‖; ―the fulcrum on which development
policy is based‖; a ―linchpin to the quest for a more peaceful world‖ and a ―mid-point en route to
ending poverty within a generation.‖

2
Sub-Saharan Africa (SSA) of which Nigeria is part has a long history of poverty; the
number of people living below US$1 a day in the 1990s increased from 47.4 percent to 49
percent and as much as 77 percent of the people of the region within the same period survived on
less than US$2 a day (UNDESA, 2005). As at 2010, 48.5 percent (424.3 million people) of the
people of the region were living below US$1.25 while 69.9 percent (611.5 million people) were
living below US$2 (World Bank, 2011b). According to the FAO (2010), in 2010, 239 million
people in SSA were either hungry or undernourished; the same year, the region had 30 percent of
its population undernourished which does indicate that in that year, one in every three people of
the region was hungry. Recent findings support this by showing that SSA‘s progress towards
attaining the MDGs targets on poverty reduction by 2015 is slow; attainment of the MDGs thus
remains a distant goal (UN, 2008a; 2009a; Easterly, 2009; McGillivray, 2008; Rispel and
Nkibua, 2011). SSA ―will be the only region with a sizable number of people in extreme poverty
that fails to reach the target‖ (World Bank, 2010a, p. 4).
Nigeria, as its counterparts in SSA is at a major risk of not meeting the MDGs‘ targets,
particularly the ones on poverty reduction. This is despite the fact that the country is well-
endowed with natural resources as it is the sixth largest oil exporter and it has the eighth largest
deposit of natural gas in the world (Ogunmola and Badmus, 2010; Soludo, 2006). Nigeria was
among the world‘s 50 richest countries in the early 1970s but slumped to find itself among the 50
poorest countries in the world according to GDP per capita by 2012 (Igbuzor, 2006; UN, 2013;
IMF, 2013). The introduction of Structural Adjustment Programme (SAP) compounded the
country‘s poverty problems in the late 1980s through the early 1990s; this had devastating
consequences for social sectors such as education and health which served the public, as the
failure of SAP to deliver on all it promises left both the state and the people worse off (Oladele,

3
2009). It has been claimed by authors and reports that Nigeria‘s progress towards attaining the
MDGs‘ targets, particularly the ones on poverty reduction is slow and that it will be difficult for
that country to meet the targets (see 1.2 below and chapter two).
In a nutshell, the importance of these goals cannot be overemphasized because if achieved,
―these goals will profoundly change for the better the nature of life for half of the planet‘s
population‖ Bertucci and Rosenbaum (2007, p. 7).
1.2 Statement of Problem
Recent findings by experts/reports suggest that based on the level of Nigeria‘s progress,
the country has little realistic prospects of attaining the MDGs targets on poverty reduction;
attaining the targets is not feasible and it is a daunting task (Ogege, 2012; Bello and Rosland,
2010; Essien and Usenobong, 2009; Chite, 2009; Ogunmola and Badmus, 2010; Alabi and
Adams, 2011; OSSAP-MDGs, 2008; 2009; 2010a; NPC 2004a; 2007). According to the Nigeria
Bureau of Statistics, the incidence of poverty is still very high in Nigeria, the proportion of
people living in relative poverty in the country stood at around 42.7 percent in 1992; this rose to
54.4 percent in 2004 and to 69 percent in 2010 (NBS, 2005; 2012a). This figure was forecasted
to rise to 71.5 percent in 2011 (NBS, 2012a) and 67.4 percent by 2015 (Bello and Roslan 2010).
Also, the country had 54.7 percent of its population living in absolute poverty in 2004; this rose
to 60.9 percent in 2010 and the figure was forecasted to rise to 61.9 percent by 2011 (NBS,
2012a). The proportion of people who were living below US$1 per day in 2004 was 51.6
percent, this increased to 61.2 percent in 2010 (NBS 2012a). The figures captured by World
Bank (2011c) confirm that as at 2004, 64.41 percent of Nigerians lived below US$1.25 a day and
this rose to 67.98 percent in 2010. It is further reported that 33.6 percent of Nigerians were food
poor in 2004 and this increased to 41.0 percent in 2010 (NBS 2012a). If this trend of increase

4
continues, Nigeria or any part thereof is at a major risk of not attaining these MDGs‘ targets on
poverty reduction. Going by the above (NBS, 2012a) figures which are the country‘s most
complete poverty profile figures, Nigeria would need half the figures captured as its 2004
income and food poverty levels to meet the MDGs targets on halving of extreme poverty and
hunger.
Using 2010 as the reference year, NBS (2012a) reports that in Nigeria‘s State of Jigawa,
74.2 percent of the state population was living below a dollar per day while 25.8 percent of them
was living above a dollar per day; and with respect to hunger, 71.1 percent of the state
population was reported to be food poor while 28.9 percent was reported to be food secure.
Regarding absolute poverty, 74.1 percent of the state population was reported to be poor while
25.9 percent was reported to be non-poor and in relation to relative poverty, 79 percent of the
state population was reported to be poor while 21 percent was reported to be non-poor (NBS,
2012a). During the same period, NBS (2012a) reports that in Nigeria‘s State of Osun, 38.1
percent of the state population was living below a dollar per day while 61.9 percent was living
above a dollar per day and with respect to hunger, 19.5 percent of the state population was
reported to be food poor while 80.5 percent was reported to be food non-poor and regarding
absolute poverty, 37.9 percent of the state population was reported to be poor while 62.1 percent
was reported to be non-poor. In terms of relative poverty, 47.5 percent of its population was
reported to be poor while 52.5 percent was reported to be non-poor (NBS, 2012a).
It is indeed worrisome that the poverty figures captured by NBS (2012a) for Nigeria and
its states including Osun and Jigawa based on a dollar per day which is the bedrock of the
analysis of this research may not be accurate. The report claims to have adopted the World Bank
2002 Purchasing Power Parity (PPP) which placed US$1 to be equivalent to N46.2 with further

5
adjustment to N59.2 for 2003 by using the Consumer Price Index (CPI) but puts the annual
figures of a dollar per day poverty line it uses to arrive at the above figures for Nigeria and the
states at N54,750 based on N150 to US$1 at the international market exchange rate instead of
N21,608 at the PPP exchange rate it should have been. Therefore, the figures may not be reliable.
It is equally worrisome that the positions/claims of authors and reports on the progress of the
MDGs targets on poverty reduction are not attributed to findings from any rigorous research that
involves the collection of relevant primary data. Based on this two deficiencies, an academic
investigation is required to verily the levels of income and food poverty, the determinants of
extreme poverty and hunger and the chances of meeting the MDGs on reduction of extreme
poverty and hunger in the country using both the international market and PPP exchange rates as
yardsticks for measurement in specific study areas like Osun and Jigawa States (see chapter four
for the rationale for the choice of these states).
1.3 Research Objectives
This study is committed to ascertaining/verifying the above positions/claims of
authors/reports that the incidence of poverty is high in Nigeria and that the country‘s progress
towards attaining the MDGs‘ targets on extreme poverty reduction is slow by using both the
international market and PPP exchange rates as yardsticks for measurement. The research seeks
to verify this by investigating the levels of income and food poverty and the determinants of
extreme poverty and hunger in two study areas, to suggest whether or not the poverty reduction
targets of the MDGs are attainable in these areas of Nigeria. The investigation is to be carried out
in these study areas among family households and focus group discussants.
In summary, this research work aims to:
1. Explore the literature on the MDGs, concept of poverty, poverty in Nigeria, and the
6
progress of the MDGs in Nigeria with respect to poverty reduction.
2. Present the theories of development, theoretical explanations of the causes of poverty,
and the general causes and consequences of poverty across the globe.
3. Investigate and analyze the socio-economic characteristics of the family households in
the study areas.
4. Investigate and analyze the levels of income and food poverty in the study areas to assess
the progress of the MDGs‘ targets on extreme poverty reduction in the areas.
5. Test and analyze the relationships among variables in the study areas to suggest the
determinants of income and food poverty in the areas.
6. Suggest measures the study areas and Nigeria as a whole could take to further reduce the
level of poverty so as to make further progress towards the attainment of MDGs‘ targets
on extreme poverty reduction.
1.4 Research Questions and Research Hypotheses
1.4.1 Research Questions
The research seeks to answer the following research questions:
1. What are the levels of income and food poverty in the study areas?
2. Which factors have association with income and food poverty in the study areas?
3. Is it likely the MDGs‘ targets on the reduction of extreme poverty and hunger will be met
in the study areas?
1.4.2 Hypotheses
With reference to (5) under (1.3) above, this research tests six hypotheses which include
testing if there are some levels of association between the gender of the family household head,
age of the family household head, educational attainment of the family household head, and

7
employment status of the family household head, family household size and family household
geographical location (dependent variables); and income and food poverty (independent
variables). The Hypotheses tested by this research are listed in the table below in form of null
and alternative hypotheses:
Table 1.1 Hypotheses
H0 There is no significant relationship between the gender of
the family household head
and income and food poverty
H1 There is significant relationship between the gender of the
family household head
and income and food poverty
H0 There is no significant relationship between the age of the
family household head and income and food poverty
H1 There is significant relationship between the age of the
family household head and income and food poverty
H0 There is no significant relationship between educational
attainment of the family household head and income and
food poverty
H1 There is significant relationship between educational
attainment of the family household head and income and
food poverty
H0 There is no significant relationship between employment
status of the family household head and income and food
poverty
H1 There is significant relationship between employment status
of the family household head and income and food poverty
H0 There is no significant relationship between the family
household size and income and food poverty
H1 There is significant relationship between the family
household size and income and food poverty
H0 There is no significant relationship between the family
household geographical location and income and food
poverty
H1 There is significant relationship between the family
household geographical location and income and food
poverty
Source: Author
1.5 Focus, Coverage and Units of the Research
The focus of this research is on levels and determinants of income and food poverty in the
study areas to assess their levels of progress towards meeting the targets of the first MDG
(eradicate extreme poverty and hunger), based on two of its targets which are (a) halving the
proportion of people living on less than US$1.25 a day and (b) halving the proportion of people
who suffer from hunger. The research uses two indicators for its investigation. The indicators

8
used are (i) proportion of population below US$1.25 per day and (ii) proportion of population
below minimum level of dietary energy consumption. The study covers two states in Nigeria
namely Jigawa and Osun States and the units of analysis of the study are the individual and the
family household.
1.6 Brief Profiles of the Study Areas of the Research
1.6.1 Jigawa State
Fig 1.1 Map of Jigawa State
Source: jigawastate.gov.ng

9
Jigawa State is an inland state located in the north-western geographical zone of Nigeria.
The state has a total population of 4,361,002 (2,198,076 males and 2,162,926 females), ranking it
8th
of Nigeria‘s 36 states in terms of population size; its people are mainly farmers, others engage
in livestock production, trading, artisanship and some others work in both the public and civil
service. It covers a total of 23,154 km2, which is, 8,490 sq miles in land mass, ranking it 18
th of
Nigeria‘s 36 states in terms of land mass (NpoC, 2006); bordered in the north by the Zinder
Region located in a neighbouring country, Niger Republic; bordered in the northeast by both
Yobe State; bordered in the east by Bauchi State and bordered in the west by Kano and Katsina
States. The state was created by the military regime of General Ibrahim Babangida on the 27th
day of August, 1991, having carved it out from the old Kano State. In 2007, the state was
reported to have a total GDP (PPP) of US$2.99 billion and per capita of US$673 (C-GIDD,
2012). Jigawa State‘s capital is Dutse and it has a total of 27 Local Government Areas (LGAs)
namely: Auyo, Babura, Birni Kudu, Biriniwa, Buji (Gantsa), Dutse, Gagarawa, Garki, Gumel,
Guri, Gwaram, Gwiwa, Hadejia, Jahun, Kafin Hausa, Kaugama, Kazaure, Kiri Kasamma,
Kiyawa, Maigatari, Malam Madori, Miga, Ringim, Roni, Sule-Tankarkar, Taura, Yankwashi
(Lawson 2010; FRN 1999; Jigawa State Government, 2012).
1.6.2 Osun State
Osun State is an inland state located in the south-western geographical zone of Nigeria.
The State has a total population of 3,416,959 (1,734,149 males and 1,682,810 females), ranking
it 19th
of Nigeria‘s 36 states in terms population size NpoC (2006); its people are mainly traders,
artisans and farmers while some others are public and civil servants. It covers a total of
9,251 km2, which is, 3572 sq miles in land mass, ranking it 28
th of Nigeria‘s 36 states in terms of
land mass; bordered in the north by Kwara State; bordered in the east by both Ekiti and Ondo

10
States; bordered in the south by Ogun State and bordered in the west by Oyo State. The state was
created by the military regime of General Ibrahim Babangida on the 27th
day of August, 1991,
having carved it out from the old Oyo State (Osun State Government, 2012). In 2007, the state
was reported to have a total GDP (PPP) of US$7.28 billion and per capita of US$2,076 (C-
GIDD, 2012).
Fig 1.2 Map of Osun State
Source: onewsportal.com
Osun State‘s capital is Osogbo and it has a total of 30 LGAs namely:
Aiyedaade (Gbongan), Aiyedire (Ile Ogbo), Atakunmosa East (Iperindo), Atakunmosa
West (Osu), Boluwaduro (Otan-Ayegbaju), Boripe (Iragbiji), Ede North (Oja Timi), Ede
South (Ede), Egbedore (Awo), Ejigbo (Ejigbo), Ife Central (Ile-Ife), Ife East (Oke-Ogbo), Ife
North (Ipetumodu), Ife South (Ifetedo), Ifedayo (Oke-Ila Orangun), Ifelodun (Ikirun), Ila (Ila
Orangun), Ilesa East (Ilesa), Ilesa West (Ereja Square), Irepodun (Ilobu), Irewole (Ikire),
Isokan (Apomu), Iwo (Iwo), Obokun (Ibokun), Odo Otin (Okuku), Ola Oluwa (Bode Osi),

11
Olorunda (Igbonna, Osogbo), Oriade (Ijebu-Jesa), Orolu (Ifon-Osun), and Osogbo (Osogbo)
(Lawson, 2010; FRN, 1999; Osun State Government, 2012).
1.7 Justification for the Research
Since the commencement of the implementation of the MDGs‘ targets on extreme poverty
more than a decade ago, efforts are been made by Nigeria to meet these targets. In view of this,
this research is justified because there is need for a research to be conducted on the level of
poverty in Nigeria‘s specific areas to assess such areas‘ chances of meeting the MDGs targets on
poverty reduction based on their progress level. Such a research is necessary at this material time
because in recent times, there have not been much academic activities focused on the progress of
Nigeria‘s specific areas towards the attainment of the MDGs‘ targets on extreme poverty
reduction, and there have not been any academic activities that have researched this with specific
reference to ‗halving the proportion of people living on less than US$1.25 a day‘ and ‗halving
the proportion of people who suffer from hunger.‘ The aforementioned points justify this study
as it is set to provide new findings following the verification of the existing findings whose
claims are that the incidence of poverty in Nigeria is high and that the country will be unable to
meet the MDGs‘ targets, particularly, the ones on the reduction of extreme poverty.
1.8 Structure of the Thesis
The first chapter, Introduction presents the general introduction to the thesis. It introduces
the background to the research, states the problem statement, the objectives of the research, the
research hypotheses, the focus and coverage of the research, the profiles of the study areas, the
justification of the research, and the structure of the thesis. The second chapter, Literature
Review is concerned with the review of extant literature on poverty, the general causes and
consequences of poverty across the globe and poverty in Nigeria. The third chapter,

12
Development and Millennium Development Goals presents detailed accounts of theories of
development and the MDGs. The fourth chapter, Research Methodology describes the research
method employed by the research and the data analysis techniques used by the research. The fifth
chapter, Data Analysis and Discussion analyzes the collected data to identify determinants of
extreme poverty and hunger and the levels of income and food poverty in the study areas of the
research to assess such areas‘ progress towards attaining the MDGs‘ targets on extreme poverty
reduction; the chapter further explains the analyzed data. The chapter also discusses the
interpretation of the analyzed data by linking them to the positions/claims and findings of
authors/reports captured in both the chapters two and three of the thesis. The sixth chapter
Conclusion and Agenda for Further Research includes the summary of the entire research,
recommendations regarding measures the Study Areas and Nigeria could take to increase its
prospects of reducing poverty and meeting the MDGs targets on extreme poverty reduction; also,
the chapter includes the contribution of the research to knowledge ans agenda for further
research.

13
CHAPTER TWO
LITERATURE REVIEW
2.1 Introduction
The purpose of this chapter is to review the literature on the description of poverty and the
poor, different approaches to poverty; theoretical explanations of the causes of poverty; major
causes and consequences of poverty across the globe; poverty in Nigeria; percentages of the
income poor; the food poor and the population living in poverty in Nigeria; major determinants
of poverty in Nigeria; and the poverty reduction strategies in Nigeria.
2.2 Poverty
2.2.1 Brief Description of Poverty and the Poor
Across the globe, the prevailing intensity of the incidence of poverty is mainly the reason
the issue of poverty is a crucial one; it is a problem that is global in its various dimensions and it
is not peculiar to only the developing countries. According to Lewis (1961), poverty is an
adaptation to a set of objective conditions of the larger society, but as soon as it comes into
being, it seemingly eternalizes itself from one generation to the other owing to its effect on
children. The recognized or general comprehension of the poverty line is incomparably higher in
developed nations than in developing nations (Hagenaars and de Vos, 1988; Hagenaars and van
Praag, 1985). In other words, ―poverty is not confined to developing countries and societies in
transition, it is a global phenomenon experienced in varying degrees by all states‖ (UN, 2001a, p.
4). According to Duze, Mohammed and Kiyawa (2008, p. vii), ―poverty is the most serious
problem which adversely affects sustainable development in the developing world.‖ According
to Make Poverty History – Canada (2010), poverty kills more than 50,000 people every day and
up to18 million poor people die every year from extreme poverty; these account for 1/3 of all
human deaths and this clarifies that more people die as a result of extreme poverty than of any

14
other cause (WHO, 2004a). The nature of poverty makes it possible for comparisons to exist;
three decisions exist in poverty comparisons which include: ―choice of a welfare measure; choice
of a poverty line and choice of a poverty index for aggregation‖ (Appleton, 1998, p. 1; Appleton,
et al., 1999, p. 1). Poverty as an indicator follows on from the development-as-growth paradigm:
―the poor‖ are the targets of development because they lack economic resources (Pieterse, 2010).
Those who live in poverty are referred to as the poor; the poor are those without
fundamental freedom of action and choice, who are easily exposed to external and uncontrollable
events such as violence, bad weather, illness, economic shocks and natural disasters. They are
―the victims of corruption and arbitrariness created by the state‖ (World Bank, 2000a, p. 1).
Those who are in poverty ―experience physical pain that comes with too little food and long
hours of work; emotional pain stemming from the daily humiliations of dependency and lack of
power; and the moral pain of being forced to make choices‖ (Narayan, et al., 2000, p. 3). In most
developing countries, the poor ―are often rural people from low status backgrounds, they may
have little access to formal employment and hence lower returns to education;‖ in general terms,
―a number of common (`Victorian') attitudes to the poor view them as less intelligent and less
industrious, so that any assets they have — such as land — will tend to have lower returns‖
(Appleton, 1995, p. 5). The poor themselves are concerned about the heightening rate of poverty
particularly in Africa and generally in the Third World nations, so also are ―the policy makers,
scholars (local and international), state and non-state actors, including NGOs and social groups‖
(Duze, Mohammed and Kiyawa (2008, ix). According to the UNDP (2009a), there are more than
100 countries globally where several millions of people live under US$1.25 and US$2 a day.
More than 3 billion people who represent more than half of the population of the world live on
less than US$2.50 a day (Shah, 2010); as at 2005, 1.40 billion people live on less than US$1.25 a

15
day, and 2.60 billion live on less than US$2 a day. Moreover, 5.05 billion people (more than 80
percent of the world population) live on less than US$10 a day (World Bank, 2008a).
Poverty is multidimensional, that is, it has different aspects and as a result cannot be
captured by a single definition. In other words, a universally acceptable definition of poverty
remains elusive; this may not be unconnected with an incontrovertible fact that it is more easily
recognized than defined. As a result of this, an ideal way to define poverty may therefore rest in
looking at the concept from different approaches.
2.2.2 Approaches to Poverty
2.2.2.1 Income Approach
In the 1964 Joint Economic Committee Report on the Economic Report of the President
with Minority and Additional Views, it is stated that ―no objective definition of poverty exists‖
and that its ―definition varies from place to place and time to time‖ (US Congress, 1964, p. 46).
This suggests that poverty is multidimensional and may be defined in different ways from
different approaches. Poverty can be defined using the income-based approach. Going by this
approach, poverty can either be absolute or relative. The origin of the concept of absolute
poverty has commonly been linked to the work of Seebohm Rowntree in 1901. In the work, he
investigated the level of poverty in York by talking to working class and poor people in the area
to find out what their money were expended on, as he saw poverty in terms of ―families whose
total earnings are insufficient to obtain the minimum necessaries for the maintenance of merely
physical efficiency‖ (Rowntree, 1901, p. 86). Thus, his work revolves around shelter, clothing
and quality and amount of food needed for a healthy life. Absolute poverty according to UN
(1995, p. 41) is ―a condition characterized by severe deprivation of basic human needs, including
food, safe drinking water, sanitation facilities, health, shelter, education and information. It

16
depends not only on income but also on access to services.‖ Todaro and Smith (2008, p. 815)
defines absolute poverty as ―a situation where a population or section of the population is, at
most able to meet only its bare subsistence essentials of food, clothing and shelter in order to
maintain minimum standards of living.‖ It involves ―lack of sufficient income for people to play
the roles, participate in the relationships, and follow the customary behaviour which is expected
of them by virtue of their membership in society‖ (Townsend, 1979, p. 10). The definition of
absolute poverty is characterized by an acute division of the income status of the poor against the
non-poor, and centralization of the acceptance of income or consumption in the comprehension
of the poverty concept (Ghellini, Pannuzi and Stanghellini, 1995).
Absolute poverty has been criticized by Marx and Van Den Bosch (2007) on the basis that
its way of defining poverty has a colouration of relative poverty. This is in line with the position
of Townsend (1979, p. 38) which sees the definitions of absolute poverty as representing ―rather
narrow conceptions of relative deprivation in practice.‖ Absolute poverty has also been criticized
on another grounds by Walker (1990) who states that there exists no absolute criteria of
measuring poverty, therefore, an objective measurement of poverty is basically impossible; that
the absolute poverty approach is characterized by a high level of simplicity and inflexibility as
there is a question mark in its assumption that all people in all societies have basic needs, thereby
failing to recognize that there is variation in the needs of different societies; that defining what
adequate provision should be is problematic as it is continually being amended, thereby making
comparison impossible and an establishment of an agreed poverty line cumbersome when
cultural needs are included in the concept of absolute poverty; and that absolute definition of
poverty fails to recognize that the general determinant of diet and lifestyles is social convention
and not expert judgment, which seemingly lords over the poor by introducing to them a different

17
life from that of the rest of the society. These criticisms notwithstanding, Sen (1983) defends the
idea of absolute poverty on the basis of human capabilities from which angle he argues that
poverty has an absolute image which may though in terms of commodities or incomes be
relative. It follows that no matter the level of relativities, as long as there is starvation and
malnutrition, then, there is poverty.
Absolute poverty is measured by quantifying the number of people below a fixed real
poverty threshold or poverty line; poverty threshold itself is the ―minimum level of income
deemed necessary to achieve an adequate standard of living‖ in a given country (Monnier, 2009;
Ravallion, 1992). Absolute poverty is thus specified as the line below human existence being an
issue comprising hunger, intense deprivation, suffering, and even premature death
(Schwartzman, 1998). Normally, the poverty line is determined by finding the total cost of all the
essential resources that an average human adult consumes in one year (Ravallion, 2008).
Regarding poverty line, the World Bank opted for a method under which all individuals could be
equally assessed on the basis of one threshold of real consumption rather than treating poverty as
a relative concept through the acceptance of the national poverty lines (Ravallion, 2002). In
1990, international poverty line was set by the World Bank at US$1 a day per person at
1985 PPP, that is, at Purchasing-Power Parity based on 1985 prices. Purchasing power parity
(PPP) is defined by the World Bank as ―a method of measuring the relative purchasing power of
different countries‘ currencies over the same types of goods and services. Because goods and
services may cost more in one country than in another, PPP allows us to make more accurate
comparisons of standards of living across countries‖ (WHO, 2001; Teichman, 2012). According
to Ravallion (2002, p. 1), the US$1 international poverty line has been chosen by the World
Bank since the 1990 World Development Report to ―measure global poverty by the standards of

18
what poverty means in poor countries.‖ In 2000, the international poverty line was adjusted by
the World Bank to US$1.08 a day per person at 1993 PPP, and in 2008, it was revised to
US$1.25 a day per person at 2005 PPP (Chen and Ravallion 2000; Ravallion, Chen, and
Sangraula, 2009).
As for relative poverty, it is very important in finding out the rates of poverty in the richer
countries of the world because the problem of poverty in these countries is that of relative
poverty (Bradshaw, et al., 2012); international bodies such as the OECD, EU, United Nations
Development Programme (UNDP), and the United Nations Children‘s Fund (UNICEF) use the
relative poverty measure as it mirrors the price of social inclusion and egalitarianism of
opportunity in particular space and time (Dennis, 2009; Marx and Botch, n.d; Bradshaw, et al.,
2012). In the OECD and the EU, the major poverty line used is hinged on a level of income set at
60% of the median household income (Blastland, 2009). According to Giddens (2009), poverty
is relative when it is defined with reference to the overall standard of living in a given society.
With this description, it follows that ―poverty has to be seen in terms of the standard of living of
the society in question‖ (Callan and Nolan, 1991, p. 252). Relative poverty thus refers to a
standard of living or stratum of income that is amply high to meet essential needs such as food,
water, shelter, clothing, basic education, and basic health care but with a clause that the standard
of living is still greatly lower than that of most of the population under consideration. Relative
poverty can thus be measured by defining it as being below some relative poverty threshold.
In history, a number of arguments have aligned with the meaning of relative poverty; this
include Smith (1776) who sees poverty as an inability to afford necessaries which he understands
to refer to ―not only the commodities which are indispensably necessary for the support of life,
but whatever the custom of the country renders it indecent for creditable people, even of the

19
lowest order, to be without‖ (p. 519); Galbraith (1958) who states that ―people are poverty
stricken when their income, even if adequate for survival, falls markedly behind that of their
community‖ (p. 252); Friedman (1965) who supports the use of relative poverty on the basis that
general living standards determines how the definition of poverty changes as those who are
classified as poor in a particular year would have had a standard of living that was higher than
those classified as non-poor years earlier; Townsend (1979) who argues that "individuals,
families, and groups in a population can be said to be in poverty when they lack the resources to
obtain the types of diet, participate in the activities and have the living conditions and amenities
which are customary, or are at least widely encouraged or approved, in the societies to which
they belong‖ (p. 31); and Clan, Nolan Whelan (1993) that see poverty from the perspective of
standard of living of the society in question. It can be inferred from all these arguments that
poverty can only be conceptually understood as relative.
Criticisms of relative poverty are discussed by Marx and Van Den Bosch (2007). Relative
poverty is said to be problematic on the ground that its ―measure is in effect an (imperfect)
inequality index,‖ implying that sometimes, ―some level of relative income poverty is inevitable
if we accept that incomes are not perfectly equally distributed‖ (p. 3). They believe that relative
poverty defers from income inequality on the premise that ―a country with a high degree of
overall income inequality can theoretically have zero relative poverty if the redistributive
mechanisms are in place to truncate the income distribution below the relative poverty line‖ and
that ―the redistributive effort that would be required to truncate the distribution at a much used
relative threshold like 50 percent of median equivalent income is in fact a fraction of the actual
redistributive flows that take place in most countries‖ (p. 3). They further discuss that relative
poverty is problematic because ―it precludes the possible existence of absolute or primary

20
poverty as this is conventionally understood‖ and because ―it is not a good indicator of the extent
of deprivation and disadvantage in any given society‖ (pp. 1, 3). For relative poverty to be more
meaningful, they suggest that ―it should perhaps be reinterpreted as a measure of relative low
income, rather than as an indicator of poverty in any substantive sense‖ so as to be relevant in
showing ―the extent to which societies in general and welfare states in particular manage to
prevent persons from having a material standard of living that is far below the average one‖ (p.
10).
2.2.2.2 Basic Needs Approach
According to (Wong, 2012, p. 4), the basic needs approach to poverty ―has a relatively long
history and it became widely discussed and practised in late 1970s. It was specifically introduced
at the World Employment Conference of the ILO in 1976 where the satisfaction of basic human
needs was proposed as the paramount aim of development policy at both national and
international levels (Jolly, 1976). Along this line, Streeten and Burki (1978, p. 412) states that
―the purpose of development is to raise the sustainable level of living of the masses of poor
people as rapidly as is feasible and to provide all human beings with the opportunity to develop
their full potential.‖ The basic needs approach to poverty ―defines poverty as the deprivation of
requirements, mainly material for meeting basic human needs,‖ taking the income approach a
step further (Lok-Dessallien, 1999, p. 11). It thus refers not only to minimum level of
consumption of basic needs which traditionally include food, shelter, and clothing but also to
different available basic services such as water, sanitation, health care, education, public
transport, cultural facilities (Wiman, 2012). According to Wong (2012), this approach works by
assessing whether or not people have adequate access to this bundle of basic consumption and
thus follows that achievement of subsistence and living decent lives is attached to increasing
access of the poor to basic consumptions. Wong goes ahead to explain that it has been argued

21
that there exist no universally agreed-upon bundle of basic consumption and that going by the
fact that this bundle changes over time, there is need for it to be regularly reassessed at the
grassroot level. Lok-Dessallien (1999) explains that the indicators of the basic needs approach
such as food, shelter, clothing and so on are usually categorized as means but these indicators
are occasionally categorized as their indirect ends because they are a step nearer to outcomes
than income measures. Lok-Dessallien goes ahead to state that these indicators have advantage
over the income measures because ―they measure goods and services directly in terms of human
welfare;‖ and they are disadvantageous because ―there is no way of aggregating them
meaningfully for purposes of in-country analysis and they are usually expressed in terms that do
not trigger the same kind of familiarity as monetary ones‖ (p. 11). Indeed, there exists a
connection between deprivation and poverty. Corroborating this, Gordon, et al. (2003, p. 6)
states that ―deprivation covers the various conditions, independent of income, experienced by
people who are poor,‖ which can be material, social and psychological whereas ―poverty refers
to the lack of income and other resources which make those conditions inescapable or at least
highly likely.‖
The basic needs approach has been criticized on a number of grounds. Ghai (1978) states
that the basic needs approach has been criticized on the ground that it is deficient of scientific
rigour; it is basically consumption-oriented and thereby antagonistic to growth and it is a method
of bolstering economic backwardness creating an impression that eliminating poverty is indeed
very easy. Corroborating this, Wong (2012) agrees that the approach is defective because of its
consumption-based view arguing that too much emphasis is placed on material deprivation by
the approach thereby overstating the monetary aspects (as the poverty line is defined as the
amount of income required to meet the basic needs), and disconnecting poverty from aspirations
22
and values. Wong emphasizes that people‘s choice will be crippled which will result in a biased
measurement for poverty if the bundle of consumption is not at all time assessed at the individual
level. Wong (2012) further criticizes the basic needs approach to poverty on the ground that ―the
constituents of the consumption bundle are arbitrarily decided by a few professionals‖ and that
the approach ―assumes that each and every good in the predefined consumption bundle are
equally needed by everyone,‖ thereby disregarding an incontrovertible fact that there are
variations in values people attached to different needs and that by nature, needs are hierarchical.
Wong also criticizes this approach arguing that it ―falsely assumes that the consumption bundle
enjoys stable price or supply (given infrequent review of the bundle)‖ whereas the reality is that
people do ―experience fluctuating and unpredictable prices (or access) for basic consumptions‖
(pp. 5-6). This criticisms notwithstanding, the basic needs approach is advantageous because
operationalizing it is easy through the comparison of ―the accessibility of the basic need bundle
at different time and space‖ by which the patterns of poverty can be effectively acquired (Wong,
2012, p. 4).
2.2.2.3 Capability Approach
Capability approach came to light in the 1980s and it largely influenced the evolution of
the Human Development Report series of the UN. The approach recreated the concept of poverty
by linking it to the human development discourse in a broader sense. According to the pioneer of
this approach, Amartya Sen, whose proposition revolve around conceptualizing poverty in terms
of capabilities emphasizes that development should not be viewed as the maximisation of utility
or money income, which is its proxy but rather as the expansion of human capabilities (Sen,
1985; 1999). This approach defines poverty as the ―failure to achieve certain minimal or basic
capabilities‖ (Ruggeri, Laderchi, and Stewart, 2006, pp. 9-10). Over time, the term basic

23
capabilities has changed in the literature thereby causing some confusion. The first mention of
this term by Amartya Sen was in his 1980 Tanner Lecture on Human Value titled ―Equality of
what?‖ In this lecture, Sen explains basic capabilities to refer to ―a person being able to do
certain basic things. The ability to move about is the relevant one here, but one can consider
others, e.g., the ability to meet one‘s nutritional requirements, the wherewithal to be clothed and
sheltered, and the power to participate in the social life of the community.‖ This term is used
differently by Nussbaum (2000, p. 84) who sees it as ―the innate equipment of individuals that is
necessary for developing the more advanced capabilities‖ which in practical sense involves such
capability as that of speech and language which a newly born child has with him/her from birth
but which only needs to be nurtured. As a result of such confusion, Sen replaces the term basic
capabilities with capabilities in his subsequent works where basic capabilities is defined from an
angle of seeing it as a threshold level for the relevant capabilities. This new conceptualization of
the term is an indication that it is ―not so much in ranking living standards, but in deciding on a
cut-off point for the purpose of assessing poverty and deprivation‖ (Sen, 1987, p. 109). In a
subsequent work, Sen refers to basic capabilities as ―the ability to satisfy certain elementary and
crucially important functionings up to certain levels‖ (Sen, 1992, p. 45). In another, he refers to it
as ―the ability to satisfy certain crucially important functionings up to certain minimally adequate
levels‖ (Sen, 1993, p. 41). These basic capabilities are not static, they vary ―from such
elementary physical ones as being well nourished, being adequately clothed and sheltered,
avoiding preventable morbidity, and so forth, to more complex social achievements such as
taking part in the life of the community, being able to appear in public without shame, and so on‖
(Sen, 1995, p. 15).

24
Capability approach ―rejects monetary income as its measure of well-being, and instead
focuses on indicators of the freedom to live a valued life‖ (Ruggeri, Laderchi and Stewart, 2006,
pp. 9-10. While the monetary approach recognizes increased income as instrumental to the
attainment of valued functionings, the capability approach is about the ―actual opportunities a
person has,‖ that is, his/her capabilities (possibly achievable) and functionings (achieved values)
(Sen, 2009, p. 253; Oosterlaken, 2009; Robeyns, 2005 ). This does not mean that Sen does not
see a relationship between lack or lowness of income and a high level of poverty. According to
him, a ―lack of income can be a principal reason for a person‘s capability deprivation‖ and ―a
strong predisposing condition for an impoverished life‖ (Sen, 1999, p. 87). Also, Sen‘s capability
approach deviates from the basic needs approach because its philosophical foundation is based
on an assertion that ―people should have equal freedom to choose their valued ways of life rather
than achieving minimum subsistence; because it defines poverty as a ―deprivations of
opportunities‖ rather than that of consumptions; and because poverty can be reduced via ―equal
opportunity to make choices‖ rather than ensuring ―adequate access to consumptions‖ Wong
(2012, p. 10).
Basically, the capability approach has two fundamental elements which are functionings
and freedom. Sen (1999, p. 75) refers to functionings as ―the various things a person may value
doing or being,‖ meaning that human living can be said to involve a set of interrelated
functionings. Sen (1992) emphasizes that functionings are central to a proper comprehension of
the capability approach because capability ―represents the various combinations of functionings
(beings and doings) that the person can achieve‖ (p. 40); and as a result, capability is analyzed as
an idea that involves the liberty of achieving valuable functionings. According to Robeyns
(2011), examples of functionings that capture various things a person may value being include
25
―being well-nourished, being undernourished, being housed in a pleasantly warm but not
excessively hot house, being educated, being illiterate, being part of a supportive social network,
being part of a criminal network, and being depressed;‖ and examples of functionings that
capture various things a person may value doing include ―travelling, caring for a child, voting in
an election, taking part in a debate, taking drugs, killing animals, eating animals, consuming lots
of fuel in order to heat one's house, and donating money to charity.‖ Wells (2012) throws more
light on functionings by using Sen‘s example of a standard bicycle as a source of explanation. He
states that the bicycle ―has the characteristics of transportation but whether it will actually
provide transportation will depend on the characteristics of those who try to use it‖ and that it
―might be considered a generally useful tool for most people to extend their mobility, but it
obviously will not do that for a person without legs.‖ He states further that even if this person
without legs, by some delusion, sees the bicycle as charming, this person still lacks
transportation, and this person‘s mental reaction does not prove that if transportation by this
bicycle was available to him/her, it would not be appreciated. Therefore, functionings ―should be
distinguished from the commodities employed to achieve them (as bicycling is distinguishable
from possessing a bike),‖ Wells concludes. As for the freedom element of the capability
approach, Sen (1999, p. 92) discusses poverty with reference to ―the lives people can actually
lead and the freedoms they do actually have.‖ Freedom, according to him is ―a principle
determinant of individual initiative and social effectiveness; it is good primarily because it
enhances the ability of individuals to help themselves‖ (Sen, 1999, p. 19). In the analysis of Sen
(1999), the idea of freedom is exemplified by a rich man who chooses to fast against a man
whose hunger situation is as a result of lack of resources. Truly, these two men have been able to
achieve same functioning, but what makes the difference is that the former has not got the same

26
capabilities set as the latter, which indicates that in terms of realization of freedom, these two
men may not be seen to be at par. According to Sen (1999, p.76), ―fasting is not the same thing
as starving,‖ and having the option of eating makes fasting what it is, to wit, choosing not to eat
when one could have eaten.‖ Sen (1999) lists five fundamental freedoms that are instrumental to
leading the kind of life a person values and which by extension make positive freedom possible
to include political freedom which refers to ―the opportunities that people have to determine who
should govern and on what principles, and also includes the possibility to scrutinize and criticize
authorities, to have freedom of political expression and an uncensored press, to enjoy the
freedom to choose between different political parties, and so on‖ (p. 38); economic facilities
which refers to ―the opportunity to enjoy and utilize resources for consumption, production and
exchange (p. 39); social opportunities which refers to ―the right to enjoy healthier, more
educated, and more fulfilled lives‖ (p. 39); transparency guarantees which refers to ―the ability to
live under the assurance that disclosure and lucidity are normative elements of society‖ (p. 39);
and protective security which refers to ―the chance to exist in a society dedicated to preventing
its citizens from experiencing hopelessness‖ (p. 40).
Sen‘s capability approach does not develop any list of capabilities. (Sen, 1992; 1999)
emphasize that having a basic list of capabilities as a focal point is a value judgement that is to
be clearly made through a process of public debate in most cases. In support of this, Sen (1993,
p. 47; 1999, p. 283) emphasize that the use of the capability approach does not require taking a
single route as ―the deliberate incompleteness of the capability approach permits other routes to
be taken which also have some plausibility and also that ―there is no substitute for individual
responsibility.‖ Connected to this is an argument that ―the capability approach considers people
one by one, not as parts of an organic unit; it is very interested in seeing how a supposed organic
27
unit such as the family has constructed unequal capabilities for various types of functionings‖
(Nussbaum, 1999, p. 34). This suggests that from one country to another, the list of capabilities
needed by an individual to escape poverty is not the same. Alkire (2002) commends Sen‘s
deliberate incompleteness, arguing that a list of capabilities ―may be tremendously
overspecified;‖ and that theoretically, it is ―consistent and combinable with several different
substantive theories‖ which may on a balance of probabilities make it a subject of public debate
(p. 29). Sen‘s approach has been criticized for a number of reasons. According to Wells (2012),
Sen‘s approach has been criticized based on its focus which revolves around people‘s ability to
achieve the kind of lives they have reason to value, arguing that this appears as an imposition of
an external valuation of the good life, whatever people may actually value, which makes it
problematic. Wells further says that Sen‘s approach has been criticized based on the premise that
the approach‘s content and structure are under-theorised which does not make it suitable as a
theory of justice, and on the premise that Sen fails to make clarifications as to the level of
importance of capabilities and the manner by which they are to be distributed. Another criticism
is based on the ground that the individualism aspect of Sen‘s approach is too individualistic as it
shows no interest in communal values which people‘s ways of life are characterized by (Wells,
2012). The emphasis of Sen‘s approach on individual freedom looks so vague as it fails to put
into consideration the relationship between freedoms of individuals, and fails to point out
freedoms that are either good or bad, or that are either important or trivial (Nussbaum, 2003).
Another proponent of the capability approach, Martha Nussbaum is in agreement with Sen
on his propositions such as the role of freedom in development process and the measurement of
the successes of development programmes with the individual being the main unit but defers in
the aspect of the definition of capabilities threshold in form of a list to be met to attain a level of

28
human dignity to be secured by individuals. Nussbaum (2000) argues that the absence of a list of
capabilities in Sen‘s approach does not make it as relevant as it should be and not as useful for
interpersonal comparisons as it should be; and does not constitute an objective normative
framework. Corroborating Nussbaum‘s position, Qizilbash (1996, p. 1212) states that ―Sen fails
to give a list of capabilities, or functionings, associated with human flourishing, a complete
account of interpersonal comparison‖ which makes his approach incommensurable. In order to
define the capabilities threshold which Sen‘s approach fails to do, Nussbaum (2000) composes a
list of universal capabilities which is ―a basis for determining a decent social minimum in a
variety of areas‖ (p. 75). According to her, the list represents a ―freestanding moral core of a
political conception‖ and is not committed to accepting ―any particular metaphysical view of the
world, any particular comprehensive ethical or religious view, or even any particular view of the
person or of human nature‖ (p. 76). Nussbaum‘s list include life (not dying prematurely); bodily
health (having good health, including reproductive health, being adequately nourished, and
having shelter); bodily integrity (having freedom of movement, protection from assault, having
opportunities for sexual gratification, and choice in reproductive matters); senses, imagination,
and thought (having the ability to use the senses to think and reason, cultivated by an adequate
education which is protected by basic freedoms); emotions (having freedom to love, grieve,
experience longing, gratitude, and justified anger, and having freedom one's emotional
developing blighted by fear or anxiety); practical reason (having freedom to form a personal
conception of the good and to critically engage in planning of one's own life); affiliation (being
able to live for and in relation to others, engage in various personally determined social
interactions, and having freedom from humiliation and all forms of discrimination); other species
(being able to live with and interact freely with the world of nature); play (being able to laugh,

29
play, and enjoy recreational activities); and control over one‘s environment (having fundamental
political and economic rights which guarantees political participation, ownership of property,
and equal opportunity of employment) (Nussbaum, 1999, pp. 41-42). In a nutshell, Nussbaum is
particular about getting those who are in poverty out of it to a minimum threshold level. in
support of this, she asserts that ―we may reasonably defer questions about what we shall do when
all citizens are above the threshold, given that this already imposes a taxing and nowhere-
realized standard‖ (Nussbaum 2000, p. 12). Nussbaum‘s approach has not been free from
criticism just as Sen‘s. Okin (2003) criticizes her approach on the ground that there are basically
no changes in her list despite her long years of cross-cultural discourse which has made it remain
her same original list which is the Aristotelian one, this puts the epistemological basis of
Nussbaum‘s approach into question. one other criticism of her approach comes from Alkire
(2005) who argues that in her list, some vital capabilities are missed out which does not make it
useful in a number of aspects such as the quality of life measurement or development fieldwork,
this questions the legal-moral-philosophical orientation of her approach.
2.2.2.4 Participatory Approach to Poverty
Participatory approach to poverty is differentiated from the above three because it
practically involves poor people and groups themselves in the articulation of what poverty means
for them. In other words, ―there is an emphasis on paying attention to feeling and understanding
of poor people. Hence, this approach encourages the field studies including being among the
poor to get more information, to deeply understand poverty and also to respect their information
and knowledge‖ (Dini and Lippit, 2009, p. 11). The original intention of participatory
approaches was to deal with small community-based projects, but the approaches were later
scaled up by the World Bank and used as an approach to poverty and the part of other and wider

30
approaches (Riddell, 2004). This development was a response to the ubiquitous criticisms of the
1990s neoliberal policies of SAP which were altogether claimed to have left the poor poorer
during that period, and did lead to the Consultations with the Poor which was ―the first large
scale comparative research effort using participatory methods to focus on the voices of the poor‖
and also ―the first time that the World Development Report is drawing on participatory research
in a systematic fashion‖ (Walton and Kanbur, 1999, p. 1). The consultations resulted in the
publication of Can Anyone Hear Us? Voices from 47 Countries by Deepa Narayan and others in
1999; the design of the consultations was in form of a response to the challenge of how the
―voices of the poor, their experiences, priorities, reflections and recommendations could be
incorporated‖ in the 2000/01 World Development Report on poverty and development (Narayan,
1999, et al., p. 1). This indicates that ―like capability approaches, participatory approaches focus
on ways to empower poor people to enable them better to make and influence decisions which
affect their well-being‖ (Rendell, 2004, p. 6).
The main part of this approach is the Participatory Poverty Assessments (PPAs) which has
been referred to as ―a family of approaches and methods to enable local (rural and urban) people
to express, enhance, share and analyze their knowledge of life and conditions, to plan and to act‖
(Chambers, 1994, p. 1253) or as ―an instrument for including poor people‘s views in the analysis
of poverty and the formulation of strategies to reduce it through public policy‖ (Norton, et al.,
2001, p. 6). The term ‗Participatory Poverty Assessment‘ which was originally used to refer to ―a
field based research exercise designed to contribute to country poverty assessments‖ was framed
from within the World Bank in 1992 at a ―point staff in the World Bank were developing
approaches to meet the request from the Bank‘s Board that Country Poverty Assessments be
carried out in all borrower countries‖ (Norton, et al., 2001, p. 7). According to Sumner and Tribe

31
(2008, p. 110), ―PPAs typically involve purposeful sampling, open interviews, participant
observation or focus group discussions and yield non-numerical qualitative data which are not
subject to statistical analysis.‖ They ―are processes designed to influence policy, not merely data
collection exercises, and this feature of their purpose sets them apart from household survey
instruments‖ (Appleton and Booth, 2005, p. 126), because they ―attempt to understand poverty
dimensions within the social, cultural, economic and political environment of a locality‖ (Booth,
et al., 1998, p. 52), thereby providing a multidimensional view of poverty. According to Norton,
et al. (2001), the very first generation of PPAs ―were small-scale research exercises designed to
complement the survey data used to produce poverty assessments, ‖ and they did demonstrate
―the potential of the approach to produce different information about poverty and new insights
about its nature and dynamics‖ (p. 11). As for the second generation of PPAs, it ―built on this
information focus, but also showed how PPA processes could create new relationships between
actors involved in poverty reduction‖ (p. 11). Cited in Sumner and Tribe (2008, p. 111),
Carvalho and White (1997), Appleton and Booth (2001) and Chambers (2001) state that PPAs
provide richer definition of poverty as they give more insights into causal processes; they are
holistic, that is, they comprise a set of relationships which have no preselected attributes as a
whole; they represent a scope for attention to processes as well as snap shots of the situation;
they focus on context and people‘s experiences, and they form a feedback loop which assists data
interrogation. All these notwithstanding, PPAs are characterized by a number of weaknesses
which include ―lack of generalizability; difficulties in verifying information, limited systematic
disaggregation; possibly unrepresentative participation; agenda framing by facilitators; pitfalls in
attitudinal data‖; and changes of people‘s behaviour due to arrival of a PPA team (Carvalho and

32
White, 1997; Appleton and Booth, 2001; Chambers, 2001 cited in Sumner and Tribe (2008, p.
111).
In general, participatory approach to poverty has been criticized on a number of grounds.
In spite of the approach lying in the ―drawing out of the views of the poor and juxtaposing them
with the views and perspective of outsiders, it is not clear how the approach deals with the
differing views of different people – men and women, traditionalists versus modernisers – within
and across different poor communities (Rendell, 2004, p. 6). Also, what people say to outsiders
may not be the whole truth after all; for example, what an individual or a group says may not
accurately tally with what is in the individual or group‘s thoughts if such an individual or group
feels threatened (Poulter, 1998). One other problem with this approach is that even where people
convey the whole truth or convey accurate views, perspectives and needs, it still does not present
the whole picture; it is not out of place for people‘s assessments of their conditions to be partial
and narrow following the risks of not seeing, and lacking ability to see the whole picture (Sen,
1999). In a nutshell, participatory approach to poverty can ―be objectively biased as a result of
limited information and social conditioning‖ (Rendell, 2004, p. 7). Despite these shortcomings of
the approach, it has a number of merits. According to Scott and Reyes (n.d), participatory
approaches with reference to poverty elicit ―people's own analysis of their poverty and wellbeing
which provides a deeper understanding of dimensions of poverty other than income and
consumption indicators;‖ they allow for the comprehension of ―the complexity and diversity of
livelihood strategies, including the impact of structural economic and political factors over time
on people's impoverishment and ability to become less poor;‖ they establish causality by
―identifying barriers to participation, factors of social exclusion and assessing social capital of
different groups according to gender, age, caste, ethnicity;‖ and they influence policy and
33
practice as they have a kind of nature that ―provide insights for policy and practical actions with
high benefits for poor people in their own terms‖ (p. 19).
2.3 Major Causes of Global Poverty
Poverty may be caused by a number of factors. First and foremost, poverty may be caused
by a number of acute factors such as corruption, warfare, agricultural cycle, and natural disasters
including drought, flooding, earthquake and hurricane. Regarding corruption, Chetwynd,
Chetwynd and Spector (2003, p. 5) state that it is widely believed that ―corruption and poverty
are closely related in developing countries‖ as it is often opinionated or judged to heighten the
―conditions of poverty in countries already struggling with the strains of economic growth and
democratic transition;‖ also, nations that suffer extreme poverty are viewed as ―natural breeding
grounds for systemic corruption due to social and income inequalities and perverse economic
incentives.‖ In line with the account of Gupta, Davoodi, and Alonso-Terme (2002) which
stresses that not many studies confirm the correlation between poverty and corruption,
Chetwynd, Chetwynd and Spector (2003, p. 6) emphasize that poverty per se does not cause
poverty as its direct effects are on ―economic and governance factors as intermediaries that in
turn produce poverty;‖ thus, there exists an indirect correlation between poverty and corruption.
As regards warfare or armed conflict, it affects the economic status of individuals and
households via the magnitude and kinds of violence they set in motion (Kalyvas, 2007).
According to Justino (2008), economic standing of households is adversely affected by the stages
of violence via the direct and indirect transformations such violence is characterized by. She
enumerates such direct effects as ―changes in household composition due to killings, injuries and
recruitment of fighters, changes in the household economic status due to the destruction of assets
and livelihoods and effects caused by forced displacement and migration‖ (p. 5). She enumerates

34
the indirect effects as "changes in households‘ access to, and relationship with local exchange,
employment, credit and insurance markets, social relations and networks and political
institutions‖ (p. 5). All these cause and multiply poverty. As regards agricultural cycle, those
who engage in subsistence farming within a population and whose reliance is on fruits and
vegetables they grow for the consumption of their household go through different phases of
poverty during the period of scarcity. Agricultural cycle refers to the annual cycle of activities
regarding the growth and harvest of crops such as loosening the soil, seeding, special watering,
and moving plants when they grow bigger, and harvesting. For such households, this scarcity
occurs at a period immediately preceding harvest and it makes them lack sufficient resources to
meet their minimal needs thereby causing and multiplying poverty during that period. Regarding
natural disasters, there exist clear links between natural disasters and poverty through
infrastructure. The linkages are clear in that ―access to infrastructure is often a measure of
poverty; infrastructure is a key component of economic growth; and the loss of infrastructure
may have significant indirect and secondary costs that directly impact the poor‖ (Freeman, 2000,
p. 3). This culminates in ―destruction of crops and livestock, potential losses in income, drops in
consumption and reductions in human capital accumulation‖ (Baez and Santos, 2008, p. 1).
Accordingly, these force households ―to liquidate assets and take steps that may curtail current
and future human capital accumulation thereby causing and multiplying poverty‖ (Baez and
Santos, 2008, p. 12).
Prominent among other probable causes of poverty is overpopulation. Overpopulation
refers to the relationship between the environment (the earth or a country) and the human
population contained therein. It is ―generally defined as an inability of the environment to
support the existing population of humans or other living things‖ (Lucid Pages, 2011).

35
According to Linkola, (2009, p. 122), ―the worst enemy of life is too much life,‖ that is, the
excess of human life; and ―the chief cause for the impending collapse of the world - the cause
sufficient in and by itself is the enormous growth of the human population,‖ that is, the human
flood. From the Malthusian perspective which is that of population pessimism, overpopulation
relates to poverty in that it conforms to human suffering owing to the notion that human
population multiply geometrically while food production can only do same arithmetically;
resultant effect of which would be a society that experiences war, poverty and famine as the need
for food exceeds its availability (Malthus, 2005). Going by the current economic thought, the
postulations of Malthus on population growth do provide an answer to the obstacle of poverty
(George, 2006). According to this perspective, the process of population growth would need to
be curbed by a decrease in fertility or an increase in mortality (Brown, Gardner, and Halweil,
1999). Following this perspective is the Neo-Malthusianism perspective which essentially
applies to the Malthus‘ theories on current world systems so as to systematically examine the
trends and make predictions. The Neo-Malthusian perspective implies that earth ―can only
sustain the agricultural needs of a limited population and that as overpopulation occurs, there are
significant social and economic consequences‖ (CNRE, n.d). Further to this, the (CNRE, n.d)
states that the perspective captures beyond agricultural sustainability to describe the need and
depletion of all resources; this basically suggests that ―overpopulation may in fact be a direct
cause of poverty and starvation in societies around the world.‖ The discussion on the validity of
the Neo-Malthusian theories continues as it is not clear whether or not overpopulation is a
determinant of poverty. The fact that a conclusion is yet to be drawn with respect to how well
the Neo-Malthusian arguments describe the effects of overpopulation does not erase another fact

36
that the arguments are vital to when the correlation between population and poverty is being
investigated (Marsh and Alagona, 2008; Veer, 2005).
Malthus population pessimism perspective has an alternative viewpoint in the work of
Esther Boserup which is that of population optimism that suggests that through human
innovations and technological advances, food production will measure up with population
growth (Boserup, 2005). She further emphasizes that when enough low population density
allows, there is a tendency that the land will not be frequently used which gives it the opportunity
to recover by relying heavily on fire and fallowing with which the fields are cleared and the land
fertility is restored. According to her, when the use of fallowing is solely reduced by a rising
population density with an attendant use of fire, then the fields are getting ready for annual
cultivation; this culminates in the reduction of the fertility of the land and this has to be dealt
with through people‘s efforts that include irrigation, weed control, field preparation, and
fertilizing (Boserup, 2005). Population pessimism perspective is opposed to by population
optimism in that while the former is based on ―Malthusian concerns about the finiteness of
natural resources and concerns about the (per capita) capital endowment of the economy,‖ the
latter is ―based on the idea that population growth, by changing certain relative prices, will
produce economic and institutional responses chiefly in terms of property rights and technical
progress (Cuffaro, n.d, p. 2).‖ This clear opposition challenges ―Malthusian considerations over
diminishing returns‖ and ―the resource shallowing effect of population in the neoclassical growth
model.‖ (Cuffaro, n.d, p. 1). Going by the diverse positions of pessimists and optimists, Birdsall
(1988, p. 493) concluded that ―the arguments of the optimists, with the possible exception of the
advantages of greater population density in rural areas, though of intuitive appeal, are as poorly

37
supported empirically (and as intrinsically difficult to support) as are the arguments of the
pessimists.‖
Both population pessimism and population optimism are not aligned to by another
approach, population revisionism which became prominent in the population discourse in the
1980s. This approach deviates from an idea that per capita economic growth and development
are strongly deterred by that rapid population growth and from an assumption that ―rapid
population growth in nonindustrial societies is a significant problem‖ (Hodgson, 1988, p. 542).
According to this approach, no statistical association exists ―between national rates of population
growth and growth rates of income per capita‖ (NRC, 1986, p. 4). Population revisionism places
population growth along with some other factors of commensurate or greater importance thereby
relegating its significance as a source of economic growth; assesses the after-effect over a longer
period of time; and takes into account indirect feedbacks amidst political and economic systems
(NRC, 1986; Wattenberg, 1987; Hodgson, 1988). Also punctured by population revisionism is
the pre-revisionist notion that population explosion caused by rapid urbanization and food
deficiencies can be tackled by family planning. The approach challenges this notion by linking
family planning to other justifiable factors such as the ―desirability of reducing the large number
of unwanted births, the adverse impact of large families (and close child spacing) on child and
maternal health, the flexibility and greater administrative ease in managing a slower pace of
development, and the adverse consequences of population pressures on selected environmental
resources, the impact of population‖ (Kelly, 1995, p. 2).
Overpopulation can either be absolute or relative; it is absolute when the living things have
exceeded their ability to sustain their existence and this culminates in the population typically
destroying its environment and gets starved, it is relative when resources become scarce and as a

38
result of this, ―each individual has less living space, or fewer available resources, or reduced
quality of life‖ (Lucid Pages, 2011). There exists an argument that poverty fundamentally
contributes to population owing primarily to lack of adequate education and economic value that
children represent to poor families who rely on supplemental income that can be provided by the
children. Inasmuch as impoverished communities do not generally have access to quality
education which would have exposed them to birth control practices, their women often fail to
acquire a sense of independence, and the orbit of poverty is kept going via future generations
(Richie, 2011; Pritchett, 1994). This confirms that relationship between poverty and
overpopulation significantly depends on the status that women hold in society. It is then
arguable that women are empowered via the acquisition of education and social liberty and those
who are capable of generating their own income hardly contribute to population
growth like those with no such characteristics whose number is large and who are confined
to child bearing, child care, and domestic shores following a lower rank in their societies,
households, and families. Fertility thus falls following women's acquisition of education which
opens doors for them to seek better employment opportunities (Lappé and Schurman, 1990; Nag,
et al., 1978). Looking at it from another angle, overpopulation may cause poverty in societies
that undergo excessive population growth as limited jobs are available and resources are over-
exploited; this aligns with the Neo-Malthusian theory that argues the earth‘s available resources
become insufficient owing to absolute population increase, that food production does not
simultaneously increase as population, and that putting population under control is basic to
sustainability (Richie, 2011; Marsh and Alagona, 2008; Veer, 2005).
The world population reached 7 billion on October 31, 2011 (UNFPA, 2011). The U.S.
Census Bureau has an estimate for approximately further six months; according to the Bureau,

39
the world population will pass 7 billion on March 12, 2012 (USCB, 2011). The world population
currently grows approximately by 74 million people per year. Current forecasts estimate
that global population will hit 9 billion by 2050; this is however subject to a decline in
typical fertility rate from 2.5 to 2.0 (UN, 2011a). India, Pakistan, Nigeria, Democratic Republic
of the Congo (DRC), Bangladesh, Uganda, US, Ethiopia, and China, based on the sizes of their
contributions to population growth are expected to account for half of the global projected
population increase during 2005 to 2050 (UN, 2005a). By 2050, India will have 1.6 billion
people, China - 1.4 billion, US - 439 million, Pakistan - 309 million, Nigeria - 259 million,
Bangladesh - 258 million, DRC – 189 million, Ethiopia - 185 million, and Uganda - 93 million
(UN, 2007). Though, there is yet to be an agreement on the carrying capacity of the
earth which refers to the ―maximum population size of the species that the environment can
sustain indefinitely, given the food, habitat, water and other necessities available in the
environment‖ (Hui, 2006). According to UN (2001b, pp. 30-31), ―the estimates of earth‘s
carrying capacity range from under 1 billion to more than 1,000 billion persons;‖ and not
below ―two thirds of the estimates fall in the range of 4 billion to 16 billion persons, and the
median value is about 10 billion.‖ This median value of 10 billion persons is said to be what the
size of the population of the earth will be by 2022 (UN, 2000b). However, latter estimates are
lesser with the consideration of factors such as increased consumption and resource insufficiency
(Ryerson, 2010; Brown, 2011). Most of this estimates in the words of Cohen (1995, p. 233), "are
probably less dispassionate analyses than they are political instruments, intended to influence
actions one way or another.‖
Corroborating this, Jones (2008) says that human beings are 10,000 times more common
than we should be. A major effect of overpopulation is environmental degradation. According to

40
UNISDR (2004, p. 4), environmental degradation is ―the reduction of the capacity of the
environment to meet social and ecological objectives, and needs.‖ It refers to the deterioration of
the natural environment under which resources such as water, air, soil and forests are depleted
thereby resulting in the destruction of ecosystems and the extinction of wildlife. Environmental
degradation is defined as ―any change or disturbance to the environment perceived to be
deleterious or undesirable‖ (Johnson, et al., 1997). Environmental degradation leads to shortages
of food, clean water, materials for shelter, and other essential resources thereby breeding
poverty. Soil fertility is depleted by intensive farming and as such, decreasing crop yield.
Regional overgrazing results in destruction of grazing lands, forest and soil and air and water are
also degraded. As overpopulation breeds poverty and people become poorer, they tend to
overuse the resources because they do not have anything to eat or any means of getting money
except through natural resources. Thus, they destroy the environment faster (NISL-Ecological
Informatics, 2007).
Poverty may also be caused by the global unequal distribution of resources. The shadow of
this global inequality is lengthening and deepening and ―trails the career of modern development
policy as its dark shadow‖ (UNDP, 1992; 2005; Pieterse, 2004, p. 69). Countries of the world are
unequal (Sutcliffe, 2002); and they are divided into two, that is, the North and South. The
countries of the Global North are those that are rich, democratic, and technologically innovative,
with declining birth rates and aging populations. In contrast, the countries of the Global South
are home to 85 percent of the world‘s population, but the impoverished people living there
possess only 20 percent of the globe‘s wealth (World Bank, 2006). Sometimes, the Global South
is described as a zone of turmoil because most its people live amid poverty, war, tyranny and
anarchy as against the Global North where peace, wealth and democracy prevail (Singer and

41
Wildavsky, 1993). According to the UNDP (2005), as much as 80 percent of the population of
the world recorded an increase in wealth inequality while just 4 percent of the population of the
world, that is, nine (9) countries reduced the wealth gap between the rich and the poor. Further to
this, UNDP (2005) states that the combined income of the world 50 richest people is greater than
that of the world poorest 416 million people; and that as much as 54 percent of the global income
goes to the world‘s 10 percent richest people while 40 percent of the population of the world has
just 5 percent of global income. This wide gap is attributed to unjust global trade regime between
the Global North and Global South of the globe which heightens global inequality (UNDP,
2005). This global inequality is evident in opportunities for social and political participation and
in education, employment, health, and gender; and as a result causes poverty (UN, 2005b).
According to Rapley (2004, p. 88), ―the principal polarity is not between the rich and the
poor countries but between rich and poor people across the globe.‖ Going by this,
Champernowne and Cowell, (1998, P. 49), ―comparing communities in terms of inequality
should not be performed in a vacuum: the study of the income distribution and related issues
cannot ultimately be divorced from the historical development of the social and economic
system.‖ Therefore, it must be noted that over the years, inequalities among countries of the
world have not been static. In a discussion of the composition of global inequality in the early
19th
and 21st centuries, Milanovic (2011, p. 499) states that in the early 19
th century, inequality
between individuals in the world had Gini of around 50 with ―about 30% due to differences in
average country incomes (15 Gini points) and about 70% due to within-national income
differences (35 Gini points).‖ Milanovic (2011) states further that by the 21st century, inequality
between individuals in the world had Gini of around 65 with ―about 80% due to differences in
average country incomes (53 Gini points) and about 20% due to within-national income

42
differences (12 Gini points)‖ (p. 499). This suggests that 200 years ago, inequality between
individuals is much lower than today and ―its composition has totally reversed: from being
predominantly driven by within-national inequalities (that is, by what could be called class
inequality), it is today overwhelmingly determined by the differences in mean country incomes
(what could be called location or citizenship-based inequality)‖ which is worth 50 Gini points
against 15 Gini points it was worth in the 19th
century (Milanovic, 2011, p. 504). Specifically,
around 1870, two-thirds of global poverty was explainable by class but now, ―the proportions
have exactly flipped: more than two-thirds of total inequality is due to location,‖ which implies
that location or ―citizenship (i.e., being a member of a rich or poor country), for our lifetime
incomes can be also very well captured by another exercise‖ (Milanovic, 2012, p. 19).
It must be also noted that inequalities within countries have not been static over the years.
According to Jolly (2005), in the UK, ―the ratio of the incomes of the richest 5 per cent to the
poorest 10 per cent decreases from a peak of 40 in 1820 and 1850 to 30 in 1890 and 1910 to 16
in 1929 and to 10 in 1950 and 1992, dipping to 7 for 1970 and 1980‖ (p.12). Against this, in the
US and the Scandinavian countries, there were doubling and modest increases in the ratios over
the 19th
century with the US ―almost doubling from 13 in 1820 and 1850 to 25 in 1890 and 1910,
then decreasing to 20 in 1929 and down to 13 in 1950 slipping later to 12 and rising to 15 by
1992‖ and the Scandinavian countries having modest ―rising to 17 at peak from 1870 to 1910,
then falling to 12 in 1929 and to 9 and then to 8 from 1950 to 1992‖ (Jolly, 2005, pp. 12-13). If
the 1950 to 1992 data is somewhat more reliable, it may then be safe to conclude that ―the
highest ratios are in Latin America, for Brazil, Argentina and Chile and these ratios have been
rising over this period;‖ that ―the next highest ratios are those of Egypt and Cote D‘Ivoire,
Ghana and Kenya, which show little change over this period;‖ and that ―Japan and the UK and

43
the Scandinavian countries show the lowest ratios over 1950-1992, though with India and falling
to almost this level according to the data by 1992‖ (Jolly, 2005, pp. 13). Against this, Jolly
(2005) emphasizes that ―the ratios in the US were rising from 1950 to 1992, to reach ratios
comparable to ratios Egypt and Africa have – and for many of these countries, perhaps the best
we will ever have‖ (p. 13).
Poverty persists in much of the developing countries, particularly, SSA ―in the face of
increased globalization and rapid trade liberalization‖ which failed to prevent an estimated over
one billion to ―live in extreme poverty (based on the US$1 per day poverty line),‖ and up to half
of the population of the world to live below US$2 a day (Ackah Morrissey and Appleton 2007,
p. 1). By the end of the last millennium, the wealthiest 5 percent of the world population earned
114 times as much as the poorest 5 percent and the top 1 percent earned the equivalent of the
bottom 57 percent (UNDP, 2003). The claim of others is that the globe is already in-
between two-thirds society where the bottom third is denied meaningful participation in formal
economic activities (Lash and Urry, 1994). All these notwithstanding, it can be deduced from the
statistics that the global flow is en- route more backward allocation of income and wealth or
simply put that ―the rich have grown richer‖ while ―the poor have stagnated‖ (Easterly, 2002, p.
60). Over the past 200 years, the per-capital income gap between the richest and the poorest
countries has progressively increased from ratio 3:1 to between 30:1 or 50:1 (Kay, 2004; Landes
2002; UNDP, 2003). The fact that global per-capita income trebled between 1960 and the mid-
1990s did not stop over 100 countries whose per-capita income has declined since the 1980s
from declining (Robinson, 2004). In the poorest one-fifth of the Global South countries, their
―average calories intake‖ is one-third of the Global South countries one-fifth (Easterly, 2002, p.
11).

44
Relationship between poverty and unequal distribution of resources in the world economy
is evidenced by the continued dependence of the poorer countries on the richer countries; the
richer countries have the ability to get from the poorer countries in Asia, Africa, and Latin
America, inexpensive natural resources such as oil, ores, and minerals. The richer countries also
get from the poorer countries, cheap labour with which factories operated by multinational
corporations produced their goods. This practice is a direct contribution to the dependency of
poorer countries on the richer ones as their standards of living are not raised. Virtually all the
countries of the Global South remain frustrated by their inability to catch up and close gap with
the countries of the Global North (Norberg, 2006). This is a major twenty-first century
contentious issue in international politics because it reflects incommensurateness of power
between countries regarding spelling out the rules involved in global trade (Buckman, 2005).
The salience of inequalities across nation and classes has been raised by the globalization of
production and trade. This global inequality leaves the world with a condition under which the
people in richer countries have more wealth and resources thereby having generally higher
standards of living and costs of living than those in the poorer countries. This global unequal
distribution of resources has been attributed to the effect of colonialism which is ideologically
linked with mercantilism (Klein, 2004). The basis for colonialism is the presence of colonies,
which were administered differently from other domains such as protectorates or unofficial
stretch of influence; and as such, it cannot be defined independently from colony (Osterhammel
and Frisch, 2005). Sovereignty of the former colonies is yet to erase the colonial heritage and
vulnerabilities they faced; therefore, they are still somewhat dependent and this multiplies their
incidence of poverty. This is referred to as Neo-colonialism under which foreign capital is
utilized for profiteering in place of development of the Third World nations and under which

45
investment expands rather than closes the gap between the wealthy and the poor countries of the
world (Nkrumah, 1965). The contrast between the world wealthy and the conditions of the poor
in Africa is described by Commission for Africa (2005, p. 7) as the ―greatest scandal of our age.‖
Poverty may equally be caused by inadequate education and unemployment. When people
are uneducated or when they are inadequately educated, they find it extremely difficult to get
income-generating jobs thereby breeding poverty. This can be attributed to both the government
and people. More often than not, government of poorer countries cannot afford to provide good
public schools, particularly in the in the rural areas and this heightens the incidence of illiteracy
and poverty in these countries. In Africa, quantity of schools and teachers has been cited as a
major explanatory factor for the failure to achieve universal access to basic education (Gueye
and Gauci, 2003). On the side of the people, they often forego attending schools so as to
concentrate on making a minimal living partly because they see little reason to do so because
their countries have few employment opportunities. Some studies have shown that there are
wealth differences in school enrolment and attainment in most developing countries, but the gaps
vary widely across countries (UNFPA, 2002a). Education in particular, has been increasingly
recognized as a key element in the alleviation of poverty whether it is explained in terms of
potential provision of income earning, assets or production of public goods (Gueye and Gauci,
2003). In SSA, only about 60 percent of children attend elementary school. According to the
UNDP (2002), of the 21 countries of SSA for which data is available, none will achieve the
universal primary education goal, and only 7 countries (Benin, Mauritius, Namibia, Senegal,
Swaziland, South Africa and Togo) will be on track. What obtains in the richer countries is a
deviation from this as all their children have access to education.

46
Also, when people are unemployed, they make no money and this leads to high level of
poverty. According to ILO (1982, p. 4), ―unemployment occurs when people are without jobs
and they have actively sought work within the past four weeks.‖ In countries where populations
are high, unemployment levels of only a few percentage is an indication that millions of
working-age people cannot find job and earn a living wage and thereby breeding poverty. In
consonance with this, Hamilton (2011) reports that ―more than 200 million people globally are
out of work, a record high, as almost two-thirds of advanced economies and half of developing
countries are experiencing a slowdown in employment growth.‖ ILO (2011, p. 12) puts the
―number of unemployed at 205 million in 2010, essentially unchanged from the year earlier and
27.6 million higher than in 2007.‖ It is instructive to state that the fact that unemployment figures
indicate only the number of people qualified to work and has got no job but seeking employment
does not necessarily present a correct indicator of the proportion of people living in poverty. This
is because others who have got jobs but not gainfully employed, that is, those whose jobs earn
wages too low to support themselves are also in poverty. High rate of unemployment is not
peculiar to only poorer countries; richer countries may also experience high rate of
unemployment. As at 2005, about 20 percent of the world workers were in the richer countries
while up to 80 percent were in the poorer countries. The labour force of the former is expected to
remain at about 600 million if the overall Labour Force Participation Rate (LFPR) remains at 48
percent, largely because of the stable populations of industrial countries (Martin, 2009).
According to ILO (2008), the economically active share of populations in poorer countries will
converge to the 48 percent of richer countries, so the labour force of less poorer countries will
rise strictly with population after 2020. ILO (2008) states further that the labour force
of richer countries is projected to cease growing after 2020 because of the stable population,

47
while the labour force of poorer countries continues increasing at a slower rate and
growing further in the direction of four billion in 2050.
Poverty may also be caused by economic and demographic trends. This applies more to the
richer countries of the world. In this part of the world, periods of economic crisis likely affect
young and less-educated people, who may not get employment that can cater for their
needs thereby causing poverty. Further to this, changes in labour markets in these richer
countries are contributory to increased poverty level. For example, where the number of
relatively high-paying manufacturing jobs is in decline and the demand for service and
technology-related industries jobs are on the increase; workers in the manufacturing sector tend
to lose their jobs or get too less paid compared to those in the service and technology sector.
Economic recession therefore affects people‘s strategies to secure ―elements of basic livelihood,
including the opportunity to earn an income and meet basic human needs, maintain health, and
obtain a basic education; it also poses risks to the governments and their development projects
for water supply, food security, human health, and natural resource management which may
affect the income vulnerabilities of communities‖ (Anbumozhi and Bauer, 2010, p. 8).
Also, demographic shifts, that is, changes with respect to the makeup of populations may
be contributory to increases in overall poverty. This also applies more to the richer countries of
the world. For example, where typical family structures have significantly changed to an extent
where single-parent families have increased, there tends to be increases in poverty particularly,
among children. Single-parent families with kids have a much more difficult time escaping
poverty than two-parent families with kids where adults can divide and share childcare and work
duties. Across the globe, not less than 16 percent of children live in a single-parent household
(Rampell, 2010). According to USCB (2011), 27 percent of children in the United States (US)

48
live with one parent, consistent with the emerging trend noted in 2000. As at 2006, 12.9 million
families in the US were headed by a single parent, 80 percent of which were headed by females
(NBER, 2007). In the United Kingdom (UK), one out of every four families with
dependent offspring are single-parent families, and between 8 to 11 percent of these
families have a male single-parent; the UK poverty figures show that 52 percent of single parent
families are below the government-defined poverty line after housing costs (ONS, 2005; DWP,
2010).
2.4 Theoretical Explanations of the Causes of Poverty
There are a number of theoretical explanations for the causes of poverty. The assumption
of the first theory of poverty explaining the causes of poverty is that poverty is caused by
―individual deficiencies‖ under which individuals are argued to be responsible for their poverty
situation (Bradshaw, 2006, p. 6). According to (Jordan, 2004, p. 19), the discourse of scholars is
that people are in poverty hugely because of ―social and behavioural deficiencies in individuals
that ostensibly make them less economically viable within conventional society.‖ Corroborating
this, Loewen (2009) emphasizes that those who are poor are solely responsible for their
situations because they had not worked harder or made better choices through which they would
have been able to avoid being in such conditions and even redress their poverty situations. A
related discourse by Andy (2011, p. 2) states that the ―individualistic as well as the pathological
theory‖ offers an explanation to the reason people are in poverty; he stresses that poverty is well
connected to characteristics that are deep-rooted in individuals such as a person‘s habit and
abilities like intelligence, meaning that ―people are poor in life because of their inabilities to
compete with others for resources‖ which for example makes it exceptionally difficult for people
born with disabilities escaping the poverty trap and the accompanying consequences. He goes

49
ahead to emphasize that this theory assumes that the cause of poverty is linked to ―something
that the individual is born with and for that matter cannot do anything about the situation and as a
result, his or her life is being determined by his present condition;‖ but flops by not taking into
cognizance the fact that those born disabled strive to do things that can take them off their
poverty conditions because it is arguably right that their disabilities will beget poverty only
where they are not inclined to engaging in activities that make their conditions better but not
where their conditions are okay by them. According to him, the pathological aspect of this theory
assumes that poverty is attributable to ―acquired or developed personality traits such as the
character and actions of people‖ under which people born with the habit of being indolent are
explained to always depend on assistance from others rather than meaningfully participating in
life; this thus confirms that ―the decisions people make in life as well as their characters such as
indolence always results in causing poverty.‖ Further to this, he explains that both the
individualistic and the pathological aspects flop by apportioning blames to individuals for their
poverty conditions without recourse to the fact that ― these factors in themselves cannot lead to
poverty but serve to establish casual links that may in effect trigger and promote factors that can
push the individual into poverty;‖ the theory also flops by not being able to offer explanations to
people whose poverty conditions are generic but are not poor after all. For example, in the US,
the usual mindset is that an individual is in poverty because of his personal traits whose
consequences cause him or her to fail (Rank, Yoon, and Hirschl, 2003). It is taken that a person‘s
personal failure such as laziness and low educational attainment speaks volume about the reason
they are entrapped in poverty. This mindset is rooted in ‗meritocracy‘ which is defined by
Newman (1999, p. 16) as ―the view that those who are worthy are rewarded and those who fail to
reap rewards must also lack self-worth.‖

50
The assumption of the second theory of poverty explaining the causes of poverty is that
poverty is caused by ―cultural belief systems that support subcultures of poverty‖ under which
poverty is suggested to be ―created by the transmission over generations of a set of beliefs,
values, and skills that are socially generated but individually held‖ (Bradshaw, 2006, p. 8). This
discourse is rooted in what is known as the culture of poverty or poverty culture; it can be traced
to the study of Oscar Lewis and Oliver La Farge in 1959 which centred on offering explanations
to semblance between the poor lower class Latin American families of Mexico and Puerto Rico;
the study did find out that by and large, slum children between the ages of six and seven imbibed
the fundamental values and characters of their subculture under which they were not rationally
prepared or equipped to take full benefit of changing their situations or opting for heightened
opportunities which may in their life time occur (Lewis and La Farge, 1959). According to
Lewis (1964, p. 150), culture of poverty or poverty culture refers to a ―design for living which is
passed down from generation to generation;‖ from this, it is deducible that owing to doggedness
of poverty in definite areas, the behavioural context is fortified by the culture of poverty thesis,
with a suggestion that individuals form, maintain, and route to future generations a culture that
beefs up the various social and behavioural deficiencies (Rodgers, 2000). Basically, the culture
of poverty theories are premised on a discourse that the failing of being in poverty lies with the
individual; however, it has been clarified that these theories are distinguishable from the
individual theories in that under the culture of poverty theories, individuals are not necessarily to
be blamed because they are victims of their dysfunctional subculture or culture (Lewis 1966;
Shulman 1990; Bradshaw, 2006). Culture of poverty marginalizes individuals within the
mainstream society through which ―the poor develop a set of institutions, values, norms and
behaviours which perpetuates rather than counters poverty‖ through which their young are

51
socialized, that is, their young absorb these indelible norms and values (which include
psychological self-doubt, impulsive need for gratification, low aspirations, and a limited time
horizon); this "underclass," that is, the young, becomes unchanging and is "locked into its own
unique, but maladaptive culture," and the results are limitation and obstruction to these young
partaking in the established institution (Loewen, 2009, p. 7; Baca Zinn 1989, p. 67, Albrecht,
1999). The analysis this theory offers is very vital in development discourse as it highlights the
influence of culture on development. Accordingly, a country develops based on its national
mental make-up through which poverty decreases. Grodona (2000) holds that cultural factors can
represent indexes for measuring whether or not the cultural environment is positive to
development. Such factors are referred to as values of which a country‘s developmental
environment can be suggestive of (Harrison, 2000). Also, countries are either development-prone
or development-resistant based on mental models which carry weight on the decisions humans
make, just like values (Lindsay, 2000). There is a noted flaw in this theory; the assertion that the
developing world aptly represents where poverty is likely to be seen at the most is incorrect as
poverty is also present in the developed world thereby making poverty a universal phenomenon
(Andy, 2011).
The third theory assumes that poverty is caused by ―economic, political, and social
distortions or discrimination‖ which makes people have ―limited opportunities and resources
with which to achieve income and well being‖ (Bradshaw, 2006, p. 10). Economic inefficiency
may cause poverty under which certain individuals are unable to have passage to
economic basics and advantage such as land, technical knowledge, and job opportunities which
are essential requirements that make individuals economically productive and make them have
means to ensure their survival (National Anti-Poverty Commission, 2003). An

52
economic distortion refers to a condition that creates economic inefficiency, thus interfering
with economic agents maximizing social welfare when they maximize their own welfare
(Deardorff, 2010). For example, if government purchases were financed by a proportional wage
income tax rather than by a lump-sum tax, the outcome is distorted tax and in a competitive
equilibrium, a proportional wage income tax discourages work (Williamson, 2010). According to
National Anti-Poverty Commission (2003, p. 3), ―economic problems always reflect certain clear
and unmistakable manifestations of poverty. When the incidence of poverty becomes severe, it
imperils economic stability and further worsens social and political distortions.‖ Political
distortions occur where a polity is exogenously divided into cleavages and political actors have
incentive to manipulate their relative size to improve their electoral success (Acemoglu and
Robinson, 2001; Kundu, 2007; Glaeser and Shleifer, 2005); where political actors can
manipulate policies to improve their future electoral strength (Hodler, et al., 2010); where
political inefficiencies arise because there is an underlying interest in the society under which the
rich benefit from the policies of political actors or because of the Machiavellian considerations of
political actors (Acemoglu, et al., 2011; Prato, 2011); or where the presence of a dynamic
linkage in policies interacts with the political process to generate distortions (Battaglini and
Coate, 2008). This political dimension causes poverty in that the poor are prevented from
participating in decision- making and capacity-building processes (process of people
disempowerment) which ―results in unstable governance structures, a prostituted electoral
process, and graft and corruption becoming an accepted societal norm that affect direly the
stability of the macro-economy in the long-term;‖ the effect of this is that private investment will
be low, ―causing the national output and income to contract and unemployment to worsen‖
thereby causing and multiplying poverty (National Anti-Poverty Commission, 2003, pp. 4-5). As

53
for social distortions, National Anti-Poverty Commission (2003) emphasizes that they occur
where access to basic education that is necessary to enhance the competitiveness of individuals is
absent or inadequate or where access to health care which would have made people more
productive is absent or limited. Education is important so that people can ―effectively perform
their assigned tasks with skill and dexterity;‖ where skills are absent or lacking owing to poor
access to educational opportunities, people tend to be inefficient and uncompetitive, their ―ability
to assimilate and absorb new skills and technologies and their capability to perform articulated
tasks‖ tend to be impaired thereby causing and multiplying poverty (p. 4). Further to this, where
lack of access to basic human needs ―constrains individuals to take on jobs or undertakings that
are not financially, psychologically and emotionally rewarding,‖ their amour proper and courage
tend to diminish; consequences of which are ―persistent social problems such as prostitution,
drug addiction, increase in the incidence of petty and heinous crimes, unsanitary conditions,
irreparable damage to the environment, malnutrition, medical and health problems, and
illiteracy‖ (p. 4) Discrimination, whether it is economic, political, or social may also cause
poverty in that it excludes or restricts members of one group from opportunities that are available
to other groups.
The fourth theory assumes that poverty is caused by ―geographical disparities‖ (Bradshaw,
2006, p. 12); in that the poor tend to be clustered in specific places (Hennigner and Snel, 2002).
According to Mishra (2011, p. 228), ―the nature and distribution pattern of poverty includes
many facets of the geographical component and in a way explains the linkages between the
terrain of a region and the magnitude of poverty.‖ The link between geography and poverty is
seen to have strong impact on the living standards of people living in the community especially
in developing countries (Bigman and Fofack, 2000). This theory generally assumes that ―people,

54
institutions, and cultures in certain areas lack the objective resources needed to generate well
being and income, and that they lack the power to claim redistribution‖ (Bradshaw, 2006, p. 12).
Significantly, the reasons for geographic variation in the incidence rates of poverty in a society
include differences in agro-climatic conditions and geographic characteristics, particularly access
to main urban centres and markets, presence of natural resources such as water for irrigation, and
other non-physical conditions and facets of public policy (Bigman and Fofack, 2000; Ravallion
and Wodon, 1999). Accordingly, it would be improper to disregard geography, particularly the
physical environment, as a factor affecting poverty condition of places and of the people living in
disadvantaged regions. Two decades ago, 93 percent of the world poor lived in countries
officially classified as low income countries (LICs) but now, there is a new bottom billion, that
is, 960 million poor people or 72 percent of the world poor who live not in poor countries but in
middle income countries (MICs) mostly in stable, non-fragile MICs. Roughly a quarter of the
world poor, that is, about 370 million people live in the remaining 40 LICs, which are largely in
SSA (Kanbur and Sumner, 2012).
According to Bradshaw (2006, p. 14), the fifth theory assumes that poverty is caused by
―cumulative and cyclical interdependencies‖ He states further that while the previous four
theories demonstrate ―the complexity of the sources of poverty and the variety of strategies to
address it,‖ this particular theory to some degree ―builds on components of each of the other
theories‖ (p. 14). This theory is rooted in the writings of Myrdal (1957, p. 23) where he claims
that ―the principle of interlocking, circular, interdependence within a process of cumulative
causation has validity over the entire field of social relations.‖ From this, it can be inferred that a
social problem results in a number of other social problems and comes back to the state it was ab
initio which makes it a cycle. Bradshaw (2006) states that the cycle of poverty captures

55
unemployment within communities which results in ―outmigration, closing retail stores, and
declining local tax revenues‖ which further results in decay in educational system, not well
trained workers, inability of dominant firm to make use of the newest technology, and inability
to get new firms initiated in the community, which recycles to a greater unemployment situation
(p. 14). At the individual level, the cycle results in food and income poverty which prevents
people from being able ―to invest in businesses or to start their own businesses which leads to
lack of expansion, erosion of markets, and disinvestment, all of which contribute back to more
inadequate community opportunities‖ (p. 14). According to him, the poor fall further behind
owing to health problems which prevent them from being able to ―afford preventive medicine, a
good diet, and healthy living environments‖ (p. 14). Further to this, he emphasizes that the cycle
of poverty captures people who have meagre income and are unable to bankroll their children‘s
education of which resultant effect is lack of job and adequate medical care for such children; the
cycle finally captures ―individuals whose lack of jobs and income leads to deteriorating self-
confidence, weak motivation, and depression‖ (p. 15). The theory reveals the manner many
problems bunch up, and permits a ―speculation that if one of the linkages in the spiral was
broken, the cycle would not continue;‖ these linkages are difficult to break and this is based on
the premise that ―each is reinforced by other parts of the spiralling system‖ (p. 15).
2.5 Major Consequences of Global Poverty
According to Weebly (n.d)), the consequences of poverty carry a number of major
negative effects; these effects are listed to include high annual death rate of both minors and
adults, increased diet and hygiene related diseases, increased crime rate, homelessness, and mass
emigration of population.

56
Regarding high death rate, Banerjee and Duflo (2010) find a strong positive association
between poverty and mortality rates. Though, they do not establish unequivocally a causal
relationship of poverty to higher death rates but it might be the case that less healthy people
become poor, and are therefore more likely to die. Further to this, they assert that their analysis is
strongly suggestive that the causality runs from poverty to death, or as they put it, ―poverty
kills.‖ As for minors, this is classified under infant mortality rate, neonatal mortality rate, and
under-5 mortality rate. According to the World Bank (2010), Infant Mortality Rate (IMR) is the
number of infants dying before reaching one year of age, per 1,000 live births in a given year.
Put in another way, ―it measures how many children younger than 1 year of age will die for
every 1,000 that were born alive that year‖ (Skolnik, 2008, p. 20). Though, countries across the
globe seek to have as low IMRs as possible but what obtains in reality are variations in the rates
captured by different countries owing to respective income status. High IMRs are synonymous
with poorer countries of the world while low IMRs are synonymous with the richer ones because
in poorer countries, the basic necessities for infant survival such as increased nutritional
measures, and quick access to health care facilities, better sanitation, and clean water are either
unavailable or unevenly distributed where available (Miller and Goldman, 2011). According to
the World Bank (2012i), in 2010, poorer countries like Central African Republic and Democratic
Republic of Congo had infant mortality rate as high as 112 and 109 infant deaths for every 1,000
live births whereas richer countries like Sweden and Germany had only 2 and 3 infant deaths for
every 1,000 live births. UNICEF (2012) reports that as at 2010, the IMR per 1,000 live births in
SSA was 76; it was 31 in the Middle East and North Africa; 52 in South Asia; 19 in East Asia
and the Pacific; 18 in Latin America and the Caribbean; and 19 in Central and Eastern Europe
(CEE). In general, the IMR per 1,000 live births as at 2010 was 5 in industrialized countries; 44

57
in developing countries; 71 in the least developed countries (LDCs); and 40 in the world
(UNICEF, 2012). IMR is sharply related to neonatal mortality rate and under-5 mortality rate.
While the former measures the number of deaths of infants younger than 28 days of age in a
given year per 1,000 live births in that year, the latter which is also known as the child mortality
rate refers to the probability that a newborn will die before reaching age five, expressed as a
number per 1,000 live births (Norton, 2005; WHO, 2011a). As the IMR, both rates generally
vary directly with the level of income in different countries under which poorer countries have a
much higher neonatal mortality rate (NMRs) and under-5 mortality rate than the richer ones.
Higher NMRs are connected to the fact that the high-income countries (HICs) have got a major
focus of alleviating the mortality and morbidity of neonates while the lower-income countries
(LICs) have given relatively little attention to same (Oestergaard, et al., 2011). According to
Houweling, et al. (2005, p. 1257) ―country characteristics are known to influence under-5
mortality‖; such include the commitment of government to health care (Gupta , Verhoeven, and
Tiongson, 2002); political development (Shen and Williamson, 1997; Frey and Al-Roumi,
1999); national income (Preston, 1975; Pritchett, 1996); and female literacy (Cleland and Van
Ginneken, 1988). For example, the neonatal mortality rate per 1,000 live births in SSA was 35 as
at 2010; in the same year, it was 18 in the Middle East and North Africa; 33 in South Asia; 13 in
East Asia and the Pacific; 11 in Latin America and the Caribbean; and 11 in CEE. In general,
neonatal mortality rate per 1,000 live births as at 2010 was 3 in industrialized countries; 25 in
developing countries; 34 in the LDCs; and 23 in the world (UNICEF, 2012). Also, the under-5
mortality rate per 1,000 live births in SSA was 121 as at 2010; in the same year, it was 41 in the
Middle East and North Africa; 67 in South Asia; 24 in East Asia and the Pacific; 23 in Latin
America and the Caribbean; and 23 in the CEE. In general, under-5 mortality rate per 1,000 live

58
births was 6 in industrialized countries as at 2010; 63 in developing countries; 110 in the LDCs;
and 57 in the world (UNICEF, 2012).
High annual adult mortality rate is another negative effect of poverty. According to WHO
(2011b, p. 9), Adult Mortality Rate (AMR) refers to the ―probability of dying between 15 to 60
years per 1,000 population or the probability that a 15 year old person will die before reaching
his or her 60th birthday.‖ Poverty leads to high mortality and this in turn stifles the growth that
would help countries escape poverty. The causal relationship between mortality and poverty is
clearly bi-directional; people die young in poor countries that are not able to afford sanitation
and medical care. Hence, there exists a strong negative relationship between income levels and
adult mortality. Secondly, ―where people have a short time horizon because they expect to die
young, they have less reason to save and the economy fails to grow;‖ hence, countries with high
adult mortality also experience low rates of economic growth (Lorentzen, McMillan and
Wacziarg, 2005, p. 82). In the LDCs, the spread of health knowledge has occasioned
death rates accommodating more briskly than income levels (Deaton, 2004). Accordingly, per
capita income is significantly associated with the mortality rate, and mortality is significantly
associated with growth. World Bank (2008a) estimates that 1 percent decline in developing
country growth rates traps an additional 20 million people into poverty. According to (Lorentzen,
McMillan and Wacziarg, 2005, p. 83), of the 40 countries with the highest AMRs, all are in
Africa except three (Afghanistan, Laos, and Cambodia); of 98 countries, those in SSA ―grew
1.65 percentage points more slowly than the rest of the world, from 1960 to 2000,‖ indicating
that over a forty-year period, ―the gap in per capita incomes between Africa and the rest of the
world doubled. Thus, it is clear that mortality is a plausible candidate as a source of poverty
traps.‖

59
According to Rajaratnam, et al. (2010, p. 1), across the globe, adult mortality varied
substantially across countries and over time. As at 2010, the countries with the lowest risk of
mortality for men and women were Iceland and Cyprus respectively; ―in Iceland, male 45q15 is
65 (uncertainty interval 61—69) per 1000; and in Cyprus, female 45q15 is 38 (36—41) per
1000.‖ They go ahead to state that in the same year, the highest risk of mortality "is seen in
Swaziland for men (45q15 of 765 [692—845] per 1000) and Zambia for women (606 [518—
708] per 1000). Between 1970 and 2010, substantial increases in adult mortality occurred in SSA
because of the HIV epidemic and in countries in or related to the former Soviet Union.‖
Increased risk of war is also one of the major consequences of poverty. According to Bull
(1977: 185), war is ―an organized violence carried out by political units against each
other.‖ Many people across the globe consider war ‗as an irrational activity, representing a
rejection of politics for an entirely different domain of behaviour‘ (Holsti 1991, p. 12). Cross-
national empirical evidence showcases a strong relationship between low-per capita income and
the risk of armed internal conflict or war breaking out and persisting (Collier, Hoeffler and
Söderbom, 2004; Collier and Hoeffler; 1998; World Bank, 2005). Thus, higher levels of poverty,
weaker state institutions and lower growth rates are incontestable features of war-affected
regions (Collier, 1999; 2007; Collier, Hoeffler and Söderbom, 2004; Stewart, et al., 2001). The
commonest form of violent conflict in the world since the Cold War is civil wars; they ―impact
substantially on economic development and the living conditions of local populations at the time
of the conflict and for many years thereafter‖ (Justino, 2010, p. 3). Majority of civil wars occur
in Latin America, Asia, and Africa's poor countries (Collier, Hoeffler and Söderbom, 2004;
Fearon, 2004). Across different regions of the world, civil war is attended by high incidence of
poverty as people are either killed or injured; apart from this, their personal belongings are

60
damaged or destroyed, their means of livelihood are adversely affected, and communities and
networks are broken up (Verpoorten, 2009; Collier 2007; Gonzalez and Lopez, 2007). Sierra
Leone is a good example of a poor country that plunged into civil war. The country had a per
capita GNI of US$180 which made it one of the poorest countries in the world at the inception of
civil war in 1991; this resulted in the UN authorizing the deployment of a 17,500 strong
peacekeeping mission, at a cost of US$2.8 billion (Rice, Graff, and Lewis, 2006). Also Zaire
(now the DRC), plunged into two full-scale wars in the mid-1990s; during this period, in 1995 to
be precise, Zaire‘s GNI per capita stood at $130, making it the world second poorest country.
These wars resulted in the deaths of an estimated 4 million people and required the eventual
deployment of 17,000 UN peacekeepers. As at 2006, its GNI per capita remained
the world second lowest, having fallen to US$120 and this made the risk of renewed conflict
remain high, in part because economic conditions had not improved in any meaningful way
(Rice, Graff, and Lewis, 2006).
Other consequences of poverty are increased diet and hygiene related diseases. Regarding
diet related diseases, people on low incomes tend to have the lowest intakes of fruit and
vegetables; they are unable to obtain healthy affordable food and are far more likely to suffer
from diet-related diseases such as cancer, diabetes, obesity and coronary heart disease.
According to Food Access Network (2012) ―expenditure on food is the most flexible part of
household budgets as the amount spent on food is often whatever is left over when all the
essential bills have been paid. When sudden or unexpected costs happen, the amount available
to spend on food is reduced." Throughout the entire life course, diet and nutrition are
valuable factors in the advancement and sustenance of good health as their role as determinants
of chronic Non Communicable Diseases (NCDs) such as obesity, diabetes, cardiovascular/heart

61
diseases, cancer, stroke, osteoporosis and dental diseases, is deep-rooted and they therefore
occupy a conspicuous position in preventive actions (WHO, 2002). It is reported by WHO
(2002) and WHO/FAO (2003) that as at 2001, ―chronic diseases contributed approximately 60
percent of the 56.5 million total reported deaths in the world and approximately 46 percent of the
global burden of disease;‖ and ―the proportion of the burden of NCDs is expected to increase to
57 percent by 2020.‖ They reported further that ―almost half of the total chronic disease deaths
are attributable to cardiovascular diseases; obesity and diabetes are also showing worrying
trends, not only because they already affect a large proportion of the population, but also because
they have started to appear earlier in life.‖ The projection is that by 2020, approximately three-
quarters of all global deaths from acute diseases will occur in developing countries, and as much
as 71 percent of deaths will result from Ischemic Heart Disease (IHD), 75 percent of deaths will
result from stroke, and 70 percent of deaths will result from diabetes (WHO, 1998). By
2025, the proportion of people suffering from diabetes will rise by more than 2.5-fold, from 84
million in 1995 to 228 million in the Third World nations (Aboderin et al., 2001); and on a
global basis, 60 percent of the burden of chronic diseases will occur in the Third World
nations (WHO/FAO, 2003). This may not be unconnected with the current global trend of
chronic diseases which has experienced a shift in the pattern of disease taking place at an
accelerating rate in the poorer countries; the occurrence of the acute diseases in the Third World
nations is quite faster than what obtained in the developed nations fifty years ago (Popkin, 2002).
Hygiene related diseases are undisputed negative effects of poverty; that is, poor hygiene
and non-availability of safe drinking water are factors exacerbated by poverty (Stevens, 2004). In
other words, inadequate sanitation and contaminated water are significantly related to diseases of
poverty like malaria, parasitic diseases and such infections act as co-determinants that

62
heightens the risk of transmitting HIV (Stillwagon, 2008). There exists a dynamic relationship
between poverty and poor health as such diseases result directly from poverty, the diseases
further perpetuate and deepen impoverishment by sapping personal and national health and
financial resources. In the case of malaria, it decreases GDP growth by up to 1.3 percent in some
developing nations, and as a result kills tens of millions in SSA (Roll Back Malaria, 2012).
According to WHO (2004b), across the globe, Africa has above 90 percent of the 300 to 500
million malaria infections that occur yearly; and as much as one million malaria deaths happen
in children under the age of five annually. According to Whitworth, et al. (2000), malaria is
directly related to the spread of HIV in SSA; also, it heightens the viral capacity seven to ten
times, and thus heightens the chances of transmitting HIV via sexual intercourse from a patient
with malaria to an HIV uninfected partner (Hoffman, et al., 1999). As for AIDS, it threatens the
economies, social structures, and political stability of entire societies; HIV/AIDS thus destroys
lives and livelihoods alike, wiping out decades of progress in developing countries; even in
the developed nations, the poor suffers most HIV/AIDS infections (UNFPA, 2002b). None of
the global developed countries has an AIDS epidemic close to those of the Third World countries
of the world (Loewenson and Whiteside, 2001). The interaction between HIV and malaria is
cyclical as being infected with malaria heightens proneness to HIV infection, and HIV
heightens incidence of malaria. The simultaneous existence of both aids the spread both diseases,
particularly in SSA (Abu-Raddad, Patnaik and Kublin, 2006).
Increased crime rate is another negative effect of poverty. According to (Bourguignon
(1999, p. 63), ―available evidence, though limited suggests that poverty may indeed have a
significant positive effect on criminality." In other words, high crime rates can be linked to
poverty (Fajnzylber et al., 2000). Thus, there exists a direct correlation between poverty and

63
crime or criminality (Heineke and Block, 1975; Kelly, 2000). Corroborating this, sociological
positivism assumes that poverty is one of the major societal factors that can predispose people to
crime. In a data and statistical analysis used by Adolphe Quetelet to gain insight into relationship
between crime and sociological factors such as poverty, it was found that poverty is an important
factor related to crime (Beirne, 1997). It is assumed by Becker‘s ‗Economic Theory of Crime‘
(where economic analysis was used to determine the optimal control of crime) that people have
recourse to crime only if the costs of engaging in the crime are lower than the benefits gained
(Becker, 1968). Therefore, it thus follows that, crimes, especially property crimes are committed
by the people living in poverty (Chiu and Madden, 1998; Kelly, 2000). Supporting this position,
the then British Secretary of State for Justice, Ken Clarke, according to Fraser (2011) did
emphasize that the recent decline in the rate of crime was attributable to increased prosperity and
that for offending rates to be further reduced, there must be general improvement in the levels of
prosperity. According to Berk, Lenihan and Rossi (1980, p. 766), ―strong individual and
aggregate level correlations between poverty and official measures of crime are perhaps among
the most firmly established of social science empirical generalizations‖ but that ―official crime
rates are almost always higher among the poor, and poor people are more likely to be arrested
and convicted for a wide variety of offences.‖ This generalization between poverty and crime is
founded in a theory that assumes that people who have less will want to take from those who
have more, that is, increased rate of crime is attributable to a wide gap between the haves and the
haves-not (Harney, 2011). Africa exemplifies a place where poverty seemingly leads to high rate
of crime; in this region, the number of intentional homicide/murder was 169,105 in 2008
representing a rate of 17 intentional homicides per 100,000 inhabitants which is the highest in the
world. For example, the levels of poverty in the DRC and Burundi are high, and so are the rates
64
of intentional homicide/murder in these countries; going by the 2006 records, the DRC had 87.7
and 95.2 percent of its population living below US$1.25 and US$2 per day while Burundi had
81.3 and 93.5 percent of its population living below US$1.25 and US$2 per day; in the DRC, the
number of intentional homicide/murder was 13,588 in 2008 representing a rate of 22 intentional
homicides per 100,000 inhabitant while in Burundi, the number of intentional homicide/murder
was 1,726 in 2008 representing a rate of 22 intentional homicides per 100,000 inhabitants (World
Bank, 2012j; UNODC, n.d). According to Fleming (2011), the global highest crime rates per
capita exist in developing countries; these countries also have very high rates of poverty. For
example, as at 2009 in Cape Town, South Africa where there exists a total population of 3.35
million, the rate of murders was 62 per 100,000; in 2003, it was higher, it was 86 per 100,000. In
2009, the rate of common robbery (property) was 2,297 per 100,000; rate of sexual offences was
71,500, this was up 10 percent the previous year; and rate of robberies was 3,900, also, this was
up 4 percent the previous year (Safety Security-Crazy, 2012). In 2007, South Africa‘s deputy
president, Phumzile Mlambo-Ngcuka confirmed that South Africa, Africa's biggest economy had
one of the highest crime rates world over, which included armed robberies and
other violent crimes. She said the unacceptable number of South Africans that still lived in
poverty and deprivation was clearly responsible for the rate of crime in the country (IOL News,
2007). Thus, high rate of crime in a country cannot be divorced from the incidence of poverty in
that country.
High rate of homelessness is also an effect of poverty. According to UN (1997, p. 50)
―homeless households are those households without a shelter that would fall within the scope of
living quarters. They carry their few possessions with them, sleeping in the streets, in doorways
or on piers, or in another space, on a more or less random basis; ‖ generally, homeless people are

65
those living in the streets without a shelter that would fall within the scope of living quarters; this
is primary homelessness (UN, 2009b). More people face greater financial woes as poverty sets
in; those who already have roofs over their heads may experience difficulty paying rent to their
landlords, and those without homes cannot afford a home (Weebly, n.d). In recent years, there
has been a steady growth in the number of homeless people worldwide (Zarocostas, 2005;
Capdevila, 2005). Homelessness is a problem in developed as well as in developing countries;
the UK has one of the highest rates of homelessness in Europe with more than 4 people per 1,000
estimated to be homeless; in the US, the number of homeless people ranges from 600,000 to 2.5
million; and in Germany, an estimated 254,000 people are homeless (Homeless Pages, 2004,
FAS, 2009; and FEANTSA, 2012 cited in Homeless World Cup, n.d). In the US specifically; as
at 1996 when the federal poverty level was US$680 per month for an individual, an average
income of US$348 was reported by single homeless persons which represented 51 percent of that
year‘s federal poverty level (US Conference of Mayors, 2000). Current figures reveal that in the
US, above 3 million people including 1.3 million people experience homelessness every single
year of which many are either unemployed or basically living on minimum wage earnings
(NLCHP, 2012a; b). Homelessness is rampant in Third World countries such as Nigeria and
South Africa with millions of children living and working on the streets (Urban Poverty Group,
2004; UN-HABITAT, 2003). By 2015, there will be an estimated homeless population of 24.4
million people in Nigeria (UNHCR, 2007). In India, Indonesia, Philippines and Thailand,
homelessness is also a big problem despite their growing prosperity (UN-HABITAT, 2003). In
2003, there were 78 million homeless people in India; in Indonesia, there are as much as 3
million homeless people; and in the Philippines, an estimated 1.2 million children live on the
streets (Action Aid, 2003; ACHR, 2001; UN-HABITAT, n.d cited in Homeless World Cup, n.d).

66
2.6 Poverty in Nigeria
2.6.1 A Brief Description of Poverty in Nigeria
According to Chandy and Gertz (2011, p. 6), by 2015, ―Nigeria will have more poor
people than either of the big two,‖ that is, India and China as the global reduction in the global
poverty rate ―is down to the growth leaps of India and China.‖ Based on the 2003/2004 Nigeria
Living Standard Survey (NLSS), it is confirmed that ―it is true that absolute poverty is high –
covering nearly six out of ten Nigerians‖ (Appleton, Mckay and Alayande, 2008, p. 367).
OSSAP-MDGs (2008) puts the figure of those living in poverty at five out of every ten
Nigerians. The Population and Housing Census of the Federal Republic of Nigeria by NPoC
(2006) and the 2010 revised World Population Prospects by UNDESA (2010) put the total
population of Nigeria at 140,431,790 and 158,423,000 in 2006 and 2010 respectively.
In Nigeria, poverty has been a very serious problem since the 1980s. Deterioration in
welfare and an increase in poverty were very evident in Nigeria between 1980 and 1985. Poverty
elasticity is lower in Africa than elsewhere due to structural problems which may obstruct the
expansion of the benefits of economic growth and the possible exclusion of some parts of the
population from such economic growth process (Demery and Square, 1996). According to these
authors, Kenya, Nigeria and Tanzania were found to be countries which during the 1980s and
early 1990s enjoyed periods of economic growth, whose poverty-reducing effects were partially
undone by rising inequalities. There is no doubt that poverty in Nigeria is very real; in the last
decade, the quality of life of an average Nigerian citizen has considerably declined.
Between 1972 and 1980, the Nigerian per capita income shot up from ₦1,300 to ₦2,900
(that is, from US$280 to US$1,100 in the current US$ of the time); this was as a result of the oil
prices that escalated rapidly (Mundial, 1996). In 1980, the per capita income of Nigerian citizens

67
stood at US$1,280 but by 1990, it had plunged to as low as US$240 which was well below the
average of over US$500 for SSA. The figure captured for Nigeria in 1990 (US$240) was far
below the figures captured for Botswana, Cote d‘ Ivoire, Egypt, South Africa, and Mauritius
which were US$3210, US$6600, US$1,080, US$3,500, and US$3,710 respectively; Nigeria‘s
per capita income, consumption and expenditure subsequently dragged down to critical levels
owing to decline in global oil revenues; as at 1995, the per capita income and consumption
remained lower than what they were as at the beginning of the oil boom in the 1970s (Obadan
and Odusola, 2001; Kayode and Odusola, 2000; Mundial, 1996). The WDI (World Development
Indicators) reveals that between 1995 and 2005, Nigeria‘s GDP per capita (in current US$) rose
from US$256 to US$803; during this period, that of Gabon rose from US$4,561 to US$6,322,
that of South Africa rose from US$3,863 to US$5,235, and that of Libya rose from US$5,134 to
US$7,626. The WDI further reveals that between 2006 and 2011, Nigeria‘s GDP per capita (in
current US$) rose from US$1,025 to US$1,452; during this period, that of Gabon rose from
US$6,832 to US$11,114, that of South Africa rose from US$4,568 to US$8,070, and that of
Libya was US$9584 in 2006 but the country had no GDP per capita (in current US$) record for
2011 (World Bank, 2012a; b; c; d).
In the mid 1990s, the Vision 2010 Committee Report ascertained that 50 percent of
Nigerians lived below the poverty line; that only about 40 percent had access to safe drinking
water; that about 85 percent of the urban population lived in single houses with more than 7
occupants on the average; that only about 62 percent of Nigerians had access to primary health
care; and that most Nigerians took less than one-third of the minimum required protein and
vitamins (NigeriaWorld, 1999). This confirms that during this period in Nigeria, a larger
―percentage of population‖ earned ―less than one dollar per day;‖ it further confirms ―the

68
severity of poverty in Nigeria‖ at this particular period (Edoh, 2003, pp. 69; 71). The incidence
of poverty in Nigeria rose from 27.2 percent (which represented 17.1 million people of the
country‘s estimated population of 65 million people) in 1980 to 65.6 percent (which represented
67.1 million people of the country‘s estimated population of 102.3 million people) in 1996, and
this declined to 54.4 percent in 2004 (which represented 68.7 million people of the country‘s
estimated population of 126.3 million people); this implies that though there was an
improvement between 1996 and 2004 but by 2009, the proportion of Nigerians who were poor
had increased to twice the proportion in 1980 (NBS, 2005; Ashafa, 2009). By 2010, the Nigeria‘s
poverty incidence had risen to 69.0 percent; this represented 112.47 million people of the
country‘s estimated population of 163 million people (NBS, 2012a). The proportion of the non-
poor fell from 72.8 percent in 1980 to 34.4 percent in 1996, rose to 43.3 percent in 2004, and fell
to 31.0 percent in 2010; the proportion of those in the core poverty category increased from 6.2
percent in 1980 to 29.3 percent in 1996, fell to 22.0 percent in 2004, and rose to 38.7 percent in
2010. During the same period, the proportion of those moderately poor increased from 21.0
percent in 1980 to 36.33 percent in 1996, decreased to 32.4 percent in 2004, and increased to
38.7 percent in 2010 (NBS, 2012a). These figures confirm that the flow in poverty levels
increased between 1980 and 1996 and the population in poverty rose sharply between 1980 and
1996 under which the proportion of non-poor in the population became less while that of core
poor shot up throughout the period; the proportions in all these categories declined in 2004 and
increased again in 2010.
Between 1980 and 1996, the poverty incidence in urban areas of the country increased
from 17.2 percent to 59.3 percent; it fell to 43.2 percent in 2004, and increased again to 61.8
percent in 2010. In the rural Nigeria, poverty incidence rose from 28.3 percent to 71.7 percent

69
between 1980 and 1996; it crashed to 63.3 percent in 2004 and reached a high point of 73.2
percent in 2010 (FOS, 1999; NBS, 2012a). These figures show that in 1996, the incidence of
poverty in both the urban and rural Nigeria doubled their 1980 levels; during this period, the high
incidence of poverty was more glaring among the poorly educated rural and urban dwellers,
illiterates, the aged, and women, especially, widows and unmarried women (Ukpong, 1999). In a
nutshell, rural poverty incidence held sway over urban poverty incidence between 1980 and
2010, thereby clarifying that poverty in Nigeria is expansively a rural actuality (Anyanwu, 2012).
This confirms that in most cases, poverty has no geographical boundary within family or general
households in Nigeria; it is present with households in the north-west, north-east, north-central,
south-west, south-east and south-south geographical zones of the country. In Nigeria, poverty is
accumulated in households headed by informal sector workers, in small farm households, in the
elderly and women that have got no social safety nets (FOS, 1999). A larger proportion of
Nigerian households languish in poverty; the proportion of poor family households in the rural
areas exceeds those at the urban centres; however, the urban slum-dwellers form one of the more
deprived groups. In the words of Baker and Schuler (2004, p. 3), ―there is a subset of
characteristics that are more pronounced for the poor in urban areas and may require specific
analysis;‖ this is analyzed to include commoditization (reliance on the cash economy);
overcrowded living conditions (slums); environmental hazard (stemming from density and
hazardous location of settlements, and exposure to multiple pollutants); social fragmentation
(lack of community and inter-household mechanisms for social security, relative to those in rural
areas); crime and violence; and traffic accidents; and natural disasters. According to Cities
Alliance (2006), there are similarities in the conditions of the urban poor in most cities of the
globe but such conditions are worst in most African cities. In the developing and transitional

70
world, hundreds of millions of the urban poor have no option than to live in neglected parts of
cities (slums) where housing, mobility and general living conditions are terribly or seemingly
poor. In a household, poverty has connection with a household‘s resource bestowals,
organizational ability to manage and spread out resources, labour force position, available coping
apparatuses and external or familial emergencies (Rakodi, 2002).
Table 2.1 Nigeria‘s Per Capital Income (1980 – 2011)
Year Amount in US$
1980 1,280
1990 240
1995 803
2006 1,025
2011 1,452
Table 2.2 Incidence of Poverty in Nigeria (1980 – 2010)
Year Total Population in Million Total People in Poverty
In Million
Percentage of People in
Poverty
1980 65 17.1 27.2
1996 102.3 67.1 65.6
2004 126.3 54.4 68.7
2010 163 112.47 69.0
2.6.2 Percentages of the Income Poor, Food Poor and Population Living in Poverty in
Nigeria
Recent figures show that as at 2004 in Nigeria, 64.4 percent of the population lived under
US$1.25 a day while 83.9 percent of Nigerians lived under US$2 a day (World Bank, 2011c; d).
Using the 2007 estimates, CIA (2012) puts the population of people living below the poverty line
in Nigeria at 70 percent. Using the-dollar-per-day measure, NBS (2012b, p. 4) reveals that ―51.6
percent of Nigerians were living below US$1 per day in 2004, but this increased to 61.2 percent
in 2010;‖ that ―although the World Bank standard is now US$1.25, the old reference of US$1
was the standard used in Nigeria at the time the survey was conducted;‖ that ―the north-west geo-
political zone recorded the highest percentage of income poverty at 70.4 percent, while the
south-west geo-political zone had the least at 50.1 percent;‖ that ―Sokoto had the highest rate of
income poverty among states at 81.9 percent, while Niger had the least at 33.9 percent.‖ The
figures were arrived at by the NBS report using the dollar per day poverty line of ₦54,750; this

71
measure put into consideration all individuals whose expenditure per day was ―less than a dollar
per day using the exchange rate of Naira to Dollar in 2009/2010‖ which was ₦150 to US$1
(NBS, 2012b, p. 10). An analysis of the WRI (2004) clearly reveals that Nigerians were indeed
very poor no matter which yardstick indices were used to identify or measure the country‘s
incidence of poverty. The Institute analyzes that 70 percent of Nigeria‘s population were living
on less than US$1.00 a day while 91percent of the population were living on less than US$2.00 a
day. According to World Bank (2012e; f), in Nigeria, the poverty headcount ratio at US$1.25 a
day (PPP) (% of population) as at 2010 was 67.98 percent while the poverty headcount ratio at
US$2 a day (PPP) (% of population) as at the same year was 84.49 percent. Further to this, it is
stated that the poverty gap at US$1.25 a day (PPP) (%) as at 2010 was 33.74 percent while the
poverty gap at US$2 a day (PPP) (%) as at the same year was 50.17 percent (World Bank
(2012g; h). Poverty gap is explained to mean the shortfall from the poverty line (counting the
non-poor as having zero shortfall), expressed as a percentage of the poverty line whose measure
reflects the depth of poverty as well as its incidence (World Bank, 2012h) . The figure captured
by World Bank (2011e) as that of those living below US$1.25 a day as at 2004 was 64.41
percent.
Regarding the percentage of people who are food poor in Nigeria, WAI (2010) reports that
over 53 million, which was about 30 percent of the country‘s total population were food poor;
this is despite the fact that agriculture contributed 42 percent of the GDP and provided
employment and a means of livelihood for more than 60 percent of the productively engaged
population. This is attributed to the discovery of crude oil and rising revenue from the country‘s
petroleum sector which ―encouraged official neglect of the agricultural sector and turned Nigeria
into a net importer of food, and to underfunding of the agricultural sector which was central to

72
the crisis of food production, and food security in Nigeria‖ (p. 1) Corroborating this, World Bank
(2012a) reports that agriculture was the main source of revenue for two-thirds of the population
but the petroleum industry provided 95 percent of foreign trade earnings and about 80 percent of
budget revenues. NBS (2012a) reveals that 33.6 percent of Nigerians were food poor in 2004, but
this increased to 41.0 percent in 2010; that the north-west geo-political zone recorded the highest
percentage of food poverty at 51.8 percent, while the south-west geo-political zone had the least
at 25.4 percent; that Gombe had the highest rate of food poverty among the states at 71.5 percent,
while Lagos had the least at 14.6 percent. NBS (2012a) further confirms that these figures on
food poverty were arrived at using a food poverty line of ₦39,759.49 at an exchange rate of
Naira to Dollar in 2009/2010 which was ₦150 to US$1; this food poverty line is an aspect of
absolute poverty measure which put into consideration ―only food expenditure for the affected
households‖ (NBS, 2012a, p. 10).
Regarding the percentage of people living in poverty in Nigeria and with respect to
subjective poverty which is based on self-assessment and ―sentiments‖ from respondents, the
Nigeria‘s Poverty Profile Report reveals that ―75.5 percent of Nigerians considered themselves
to be poor in 2004, and in 2010 the number went up to 93.9%.;‖ and that the ―FCT recorded the
most number of people who considered themselves to be poor at 97.9 percent;‖ while ―Kaduna
recorded the least number of people who considered themselves poor at 90.5 percent; with
respect to relative poverty, the report reveals that ―in 2004, Nigeria‘s relative poverty
measurement stood at 54.4 percent, but increased to 69 percent (or 112,518,507 Nigerians) in
2010;‖ that ―the north-west and north-east geo-political zones recorded the highest poverty rates
in the country with 77.7 percent and 76.3 percent respectively in 2010, while the south-west geo-
political zone recorded the lowest at 59.1 percent;‖ and that ―among States, Sokoto had the

73
highest poverty rate at 86.4 percent while Niger had the lowest at 43.6 percent in the year under
review. (NBS, 2012a; b, p. 5).‖ With respect to absolute poverty in terms of the minimal
requirements necessary to afford minimal standards of food, clothing, healthcare and shelter, the
report reveals that ―54.7 percent of Nigerians were living in absolute poverty in 2004 but this
increased to 60.9 percent (or 99,284,512 Nigerians) in 2010;‖ that ―among the geo-political
zones, the north-west and north-east recorded the highest rates at 70 percent and 69 percent
respectively, while the south- west had the least at 49.8 percent;‖ and that ―at the state level,
Sokoto had the highest at 81.2 percent while Niger had the least at 33.8 percent during the
review period.‖ Further to all these, the NBS Report estimates that relative, absolute and dollar
per day poverty ―may have further risen slightly to about 71.5 percent, 61.9 percent and 62.8
percent respectively in 2011‖ (NBS, 2012a; b, p. 5).
2.6.3 Major Determinants of Poverty in Nigeria
In Nigeria, there are a number of the determinants of poverty or the factors that contribute
to poverty. According to Ucha (2010), such factors or causes include: unemployment, corruption,
non-diversification of the economy (oil over-dependency), inequality, laziness, and poor
educational system. In relation to unemployment, (Ucha, 2010, p. 51) states that it is ―a major
factor contributing to poverty in Nigeria;‖ there are lots of unemployed people in the country as
being well educated is no more guarantee to being employed.‖ The correlation between high
level of unemployment and widespread poverty is positively strong as ―in most cases, those
without regular employment or with only scattered part-time employment are among the very
poor‖ (Osinubi 2005, p. 259). This explains the reason employment is indispensable in any
development strategy that is poverty focused (Todaro, 1985). In other words, when people are
employed, the incidence of poverty is reduced. Unemployment is a very serious issue in Nigeria

74
and thus remains one of the major determinants of poverty in the country as there is a strong
relationship between unemployment and poverty (Englama 2001; Ucha, 2010). The country was
estimated to have 23.9 percent unemployment rate for 2011, which ranked it 169th
in the world
(CIA, 2012). The findings of a survey conducted by Nigeria‘s Bureau of Statistics confirmed that
Nigeria had an unemployment rate of 23.9 percent in 2011 compared to 21.1 percent and 19.7
percent in 2010 and 2009 respectively. Further to this, the findings confirmed that the
unemployment rate was ―higher in the rural areas (25.6 percent) than in the urban areas (17.1
percent)‖, and that ―persons aged 0 to14 years constituted 39.6 percent, those aged between 15
and 64 (the economically active population), constituted 56.3 percent, while those aged 65 years
and above constituted 4.2 percent‖ of those unemployed (NBS, 2012c, p. 10). According to
Sanusi (2011), the rate of youth unemployment in Nigeria was 41.6 percent in 2011 where in
gender-specific terms; he confirmed the rate to be 23.3 percent for males and 17 percent for
females within the age bracket of 15 and 24 years. In a study conducted by Osinubi (2005) using
secondary data ―sourced from World Bank Publications, IMF Publications, United Nations
Publications, Nigeria‘s Federal office of Statistics Publications and Central Bank of Nigeria
Publications,‖ and covering a period of 31 years (1976 – 2001), it was confirmed that
―unemployment is highly correlated with poverty‖ (pp. 262-263; 265). In a related study
conducted by Aiyedogbon and Ohwofasa (2012), it was revealed that between 1987 and 2011 in
Nigeria, unemployment had positive significant impact on incidence of poverty, implying that
the ―positive relationship means that a unit increase in unemployment, for example, led to 0.02
percent increase in poverty level within the period under review‖ (p. 277). This correlation is not
unconnected with the very fact that unemployment in Nigeria creates welfare loss with respect to
lower output, and from this emerges lower income and well-being, coupled with the fact that it

75
appears as a gigantic waste of the manpower resources of the country (Olajide, 1981). Nigeria‘s
past experience from empirical evidences shows that the higher the rate of unemployment, the
higher the rate of poverty. For example, in Nigeria, the steady increase in unemployment rate
between 2004 and 2011 was attended by increase in the rate of poverty; unemployment rate in
2004 was 13.4 percent with poverty rate of 54.4 percent; in 2010, unemployment rate rose to
21.1 percent with the poverty rate being 69 percent and in 2011, the unemployment rate rose to
23.9 percent with the poverty rate being estimated at 71.5 percent (NBS, 2012a; b; IMF, 2012).
The implication of unemployment-induced poverty in Nigeria is that it ―tends to increase the
crime rate and violence in the country;‖ this is so because ― most unemployed youths resort to
crimes such as armed robbery, kidnapping for ransom, internet fraud and other forms of
fraudulent activities‖ (Ucha, 2010, p. 51).
Related to unemployment is the form of employment which has also been argued to be a
determinant of poverty in Nigeria. This is reflected in Appleton, Mckay and Alayande (2008)
where a public sector premium is suggested in the analysis of the 2003/2004 Nigeria Living
Standards Survey (NLSS). Their analysis reveals that ―if all household members were employed
in public sector, welfare would be 22 percent higher, ceteris paribus,‖ which implies that ―public
sector employment has a significant effect in reducing the probability of being poor‖ (p. 353).
Also, in a study by Anyanwu (2012), it is revealed that while household heads ―in administrative
occupations had the highest incidence of poverty in 1980 (44.7 percent), in 1985, it was those in
production/transportation sector (46.5 percent) (p. 10).‖ Subsequently, ―in 1992
agriculture/forestry sector household heads had a modestly high poverty incidence (47.8
percent). In 1996, the production/transportation workers had the highest poverty incidence of
72.8 percent while in 2004 it was the agriculture/forestry sector workers with 67.0 percent‖

76
(Anyanwu, 2012, p. 10). These findings by Appleton, Mckay and Alayande (2008) and
Anyanwu (2012) are clear indication that form of employment may determine poverty.
Another determinant of poverty in Nigeria is corruption which has been defined to involve
―the violation of established rules for personal gain and profit‖ or ―the misuse of public power
for private gain‖ or ―efforts to secure wealth or power through illegal means‖ or making ―private
gain at public expense‖ (Sen, 2001, p. 275; Rose-Ackerman: 1999, p. 9; Lipset and Lenz, 2000,
p. 112). Corruption ―has almost become an accepted way of life in Nigeria;‖ government funds
are constantly stolen by the political leaders and government officials who solely put the interest
of their family and friends at heart at the expense of the masses, the effect of which ―has
increased poverty and inequality as well as contributed to high crime rates‖ (Ucha, 2010, p. 51).
Corollary to this are some other factors like the ―use of wrong policies, adaptation to wrong
policies and implementation of those wrong policies‖ which are involved in bad governance in
Nigeria (Ucha, 2010, pp. 51 – 52). Corrupt practices in Nigeria include: bribery, embezzlement,
fraud, extortion, nepotism, and favouritism (Bayart, Ellis and Hibou, 1997; Girling, 1997).
Nigeria ranked 139th
out of 176 countries, 143 out of 182 countries, and 134 out of 178 countries
in 2012, 2011, and 2010 respectively in the Transparency International Corruption Perceptions
Indexes (Transparency International, 2012a; b; c).
Corruption correlates with poverty in Nigeria in that it ―siphons off goods and money
intended to alleviate poverty,‖ and also ―reduces economic growth through negative influence on
investments in human capital, while on the other hand, it has strong negative effects on economic
growth by lowering the amount and quality of public infrastructure and services supplied to the
nation as a whole‖ (Transparency International, 2008, p. 2; Ogboru, 2007, p. 68). Reduction in
economic growth in turn heightens the level of poverty apart from surviving on less than a

77
certain income; those in poverty do not have access to adequate health, education, sanitation,
basic civil rights, empowerment and human development which are characteristics of poverty
(Sen, 2001). These anchors of development are easily impeded by corruption in countries where
government is not accountable for their actions, which often culminates in poverty (Moore,
2006). In Nigeria, cases of corruption are endless particularly in the confines of governance
under both the military and civilian governments. For example, in year 2000, family and friends
of former military head of state of Nigeria, General Sani Abacha who died in 1998 were reported
to have had access to accounts and depositing amounts as much as US$600 million to Swiss
banks which were believed to be products of corruption. During this same year, over US $1
billion were discovered in many European accounts (Pallister, 2000). The demise of this head of
state opened a lot more corrupt practices perpetrated by those in power like the one involving the
award of a gas plant construction whose investigation by the French led to a number of accounts
having in them almost US$100 million being frozen (Igbikiowubo, 2004). Also, following a
probe by the Nigerian Senate in 2008, the civilian regime of Chief Olusegun Obasanjo was
reported to have misappropriated as much as US$16 billion spent on the power sector as Nigeria
had no steady power for an average of eight (8) hours during his regime (Vanguard Newspaper,
March, 2008). According to the Human Rights Watch (2007), the civilian regime of President
Olusegun Obasanjo made an estimated US$223 billion between 1999 and 2003, a period of eight
years (8) years of which a minimum average of US$4 billion to US$8 billion (representing
between 4.25 percent and 9.5 percent of total GDP of Nigeria in 2006) was lost to corruption on
annual basis.
Regarding non-diversification of the economy, which refers to over-dependence on oil
with respect to Nigeria, there exists a link between this and poverty. According to Ross (2003, p.

78
4), those in poverty can be hurt by mineral wealth such as oil ―by causing economic volatility; by
crowding out the manufacturing and agriculture sectors; by heightening inequality; by inducing
violent conflict; and by undermining democracy;‖ all these exist in Nigeria. Ucha states that oil
over-dependency is a major contributing factor to poverty in Nigeria as the successive
governments ―have practically ignored other sources of income‖ depending hugely on oil export
(Dutch disease); between 1958 and 1984, the oil sector rose from 1 percent of the country‘s
export revenue to 97 percent and not below 90 percent thereafter, while the agricultural sector
that used to be the country‘s major source of income before oil was discovered has continuously
been relegated to the background and ―considered almost useless‖ (p. 52). In year 2000,
Nigeria‘s export income from oil was 99.6 percent which at that time made it the ―world‘s most
oil-dependent country‖ (Ross, 2003, p. 2).
The Dutch disease, which makes Nigeria less competitive among the community of
nations lowers its economic fortunes and thereby contributes to the incidence of poverty in the
country. According to Ross (2003), the oil industry in Nigeria generated approximately US$231
billion in rents between 1970 and 1999 which meant that there ought to be US$1,900 available to
every man, woman, and child but this was not the case because the rents were unable to raise
income and alleviate poverty as its per capita during this period fell from $264 to $250 a year.
Ross clarifies that if the yearly oil rents were invested in a fund that generated five percent real
interest, the fund would have appreciated to US$454 billion by the end of 1999 which would
have meant that approximately US$3,750 would have been available to every man, woman, and
child which equivalent to almost 15 years of wages. The World Bank Country Director, Ms
Marie Francoise Marie-Nelly was reported to have stated in an interview with Economic
Confidential that "as oil resources are not indefinite, it is important for Nigeria to plan now what

79
it wants to be after tomorrow‖ (Anaro, 2012) Therefore, for Nigeria to diversify its economy that
is oil dependent, it would need foreign investment coming in to improve its vast ―reserves of
bitumen, tin, bauxite, iron ore and gold, as well as the potential to develop a vibrant tourism
business‖ (BBC News, 2002, January 16) By so doing, more money will be generated to tackle
poverty provided there is political will to do so.
With respect to inequality, Olaniyan and Awoyemi (2005, p. 3) state that ―rising inequality
threatens growth and poverty reduction targets;‖ and that ―the higher the level of inequality, the
less impact economic growth has in reducing poverty – for any rate of economic growth.‖
According to Ucha (2010), inequality has tremendously heightened the incidence of poverty in
the country as income, consumption, and other welfare indicators or attributes are lopsidedly
distributed amongst its populace; the disparity between the income of the richest 10 and 20
percent and the poorest 10 and 20 percent is very high in the country, and the rural-urban income
inequality is colossally high ―as those who live in the rural areas base all their income on
agriculture which is today not a thriving sector‖ (p. 53). According to Olaniyan and Awoyemi
(2005, p. 3), ―poverty and income inequalities are two of the important disturbing factors on the
way to development in developing countries.‖ Framed in another way, they emphasize that
―structural inequalities especially in income and input distributions is a manifestation as well as a
strong cause of poverty.‖ NBS (2005; 2012a) confirm that 51.6% of Nigerians were income
poor in 2004; and this rose to 61.2% in 2010. These figures reflect a high level of income
inequality in the country. In a study conducted by Bakare (2012), it was revealed that ―there is
income inequality in Nigeria which allows the rich to be getting richer and the poor getting
poorer on daily basis;‖ that ―Nigeria is ―a country with highly unequal income distribution that
has a Gini coefficient that lies between 0.46 and 0.60;‖ that ―the illiteracy rate in Nigeria shows

80
high disparity in the income level of Nigeria;‖ and that ―the redistribution of income might be a
source of poverty since income in the hands of the of the minority will lead to increase in
illiteracy‖ (p. 52). The incidence of consumption inequality is equally high in Nigeria. NBS
(2005, 2012a) report that 33.1% of Nigerians were food poor in 2004 and this rose to 41.0% in
2010; thereby suggesting a high level of consumption inequality in the country.
In relation to laziness, Ucha writes that it is contributory to the poverty incidence in the
country as in a number of cases, ―the death of the bread winner means the death of the whole
family fortunes because everyone was depending on him or her to provide everything;‖ a number
of people particularly from affluent households depends on the family wealth to live
comfortable lives of which more often than not becomes unsustainable for them following the
demise of the family bread winner thereby throwing them into the poverty trap (p. 54). And
regarding poor educational system, he states that it is a contributing factor to poverty in Nigeria
as ―the population with no education accounts for most of the poor;‖ the educational system in
the country is seemingly a failure if compared to what obtains in some other countries in the
world as a number of people, most of whom are of the female gender are denied education
because they are either ―considered the inferior sex‖ or ―are expected to marry as early as
possible‖ (p. 54). Though, the idea of the relationship between poverty and laziness seems
unclear but it cannot be totally wished away when such works as those of Fiagin (1975); Reutter,
et al (2006); and Lepianka, Van Oorschot and Gelissen (2009) are considered. In his work which
is one of the first large studies of attributions for poverty in the US, Feagin (1975) finds out that
an idea that laziness is a cause of poverty was supported more strongly than structural causes and
fatalistic attributions such as discrimination and bad luck. In their work on public attributions for
poverty in Canada, Reutter, et al (2006) state that up to one quarter of participants in a survey

81
agreed that laziness is a reason for poverty. This may appear not to be significant but it is indeed
relevant to discourse on laziness and poverty. As for the work of Lepianka, Van Oorschot and
Gelissen (2009) on popular explanations of poverty, it is stated that a significant number of
people captured by their research mentioned laziness as a specific reason for poverty.
In Nigeria, geographical/location variable is also a cause/determinant of poverty.
Confirming this in their study, Appleton, Mckay and Alayande (2008) stated that in Nigeria,
―living in urban areas raised welfare around 28 percent in the simple regression‖ and that ―the
Federal Capital Territory (the default), the south west or the south south were the most
favourable areas to reside in ceteris paribus, and did not differ significantly from each other at
the 5 percent level‖ (p. 352). In his own study, Anyanwu (2012) showed that while ―the north
west had the highest level of poverty for the periods, 1980 and 1996 and ―the north east had the
highest in 1985, 1992, and 2004, the south east had the lowest level of poverty during the periods
1980, 1985, and 2003-2004 and interestingly, the north west had the lowest poverty level in
1996‖ (p. 11). Further to this, Anyanwu (2012) stated that ―on the basis of the overall general
trend over the years, many analysts have thus argued that Nigerian poverty is largely a northern
phenomenon.‖ (p. 11). These studies are clear indication that geographical/location variable may
be a determinant of poverty in Nigeria.
Household educational attainment is another determinant of poverty in Nigeria. In the
developing world, education is frequently ―identified as a key area where public investment can
lead to poverty reduction;‖ in the region of Africa, ―a strong correlation between poverty and
lack of education‖ is usually seen (Appleton, 2001, p. 1). According to Gardner (1998),
education represents an indicator for national socio-economic development; therefore, the
proportion of literate population in a country represents a positive indicator of development.

82
With respect to poverty, education is described as critical variable and lack of education as an
overwhelming characteristic among the extreme poor (Canagarajah, Ngwafon and Thomas,
1997). According to Appleton (2000), there exists an association between a year of education
and 3 to 14 percent increases in wages and productivity; education is thus ―a very important
factor enabling individuals get access to wage jobs which accords them the opportunity of
obtaining ―often substantially higher earnings within these jobs‖ (Appleton, Mckay and
Alayande, 2008, p. 366). Educational attainment centers on indicators such as years of schooling
completed, level of education completed or ability to read and write (Barro and Lee, 2010;
Thomas, Wang and Fan, 2001; Psacharopoulos and Arriagada, 1986). In Nigeria, the incidence
of poverty is highly related to educational attainment as household with heads that have got little
or no education experience the highest poverty incidence, depth and severity (OSSAP-MDGs,
2010a; b; Ojowu, Bulus and Omonona, 2007). According to Akerele and Adewuyi (2011, p. 6)
―educational attainment enhances human capital and participation in labour market and has been
widely accepted as a veritable tool for poverty reduction and improving peoples‘ welfare.‖ In
Nigeria, for those who got little education or none, the incidence of poverty is high; this implies
that education is a vital determinant of poverty. There exists a relationship between education
and poverty because education increases the stock of human capital under which the level of
educational attainment increases labour productivity and wages. This can be explained under the
premise that labour represents the most vital asset of those who are in poverty; a lot of people in
poverty do not find education attractive and attainable even when it is publicly provided because
they find themselves in a fix of opportunity cost, this often results them to choosing to work to
eke their living and shunning education. When the level of educational attainment of people is
increased; their level of poverty is reduced. Low level of educational attainment seemingly

83
culminates in a vicious cycle of poverty where low education results in poverty and poverty
results in low educational attainment (Bastos, et al., 2009). Education thus provides people with
pieces of information and technological advancements that have the capability of enhancing
economic activities (Ruel, et al., 1998; Oniang‘o and Makudi, 2002).
In their study, Canagarajah, Ngwafon and Thomas (1997) reported that the incidence of
poverty was 48 percent in households where the head had no education in 1985 in Nigeria while
it was 28 percent where the household head had secondary education. This declined in both
types of households to 39 percent and 23 percent respectively in 1992. Available statistical data
in Nigeria did confirm that household heads with no education had a higher proportion of
poverty than those with at least primary education. The computation of Anyanwu (2012) from
National Consumer Survey of 1980, 1985, 1992, 1996 and 2004 revealed that in 1996, 74.1
percent of household heads who had no education were poor while in 2003/2004, 68.7 percent of
household heads who had no education were poor; as for those who attained post-secondary
education, 47.8 percent and 26.3 percent of them were poor in 1996 and 2003/2004 respectively
(FOS, 1999, NBS, 2005). UNDP (2009b) in the Human Development of Nigeria (2008 – 2009),
reported the existence of ―educational dimension to poverty in Nigeria‖ stressing that the
superior the educational attainment, the reduced the poverty incidence. The report stated that
there was concentration of poverty among people that had got no education and those that
attained primary level of education and that the tendency of highest level of poverty was positive
where the household head had no formal education. The report further stated that in 2004, the
overall poverty incidence of households whose heads had no formal schooling was 48 percent
while that of households whose heads were educated up to the secondary level was 30 percent;

84
therefore, ―it follows that the more educated the household head, the less probability of the
household falling into poverty‖ (pp. 65; 72)
Analyzing the 2003/2004 Nigeria Living Standards Survey (NLSS) by using only adults
that have completed their education as their education measures, Appleton, Mckay and Alayande
(2008, pp. 345; 350) stated that their results implied that a household where all members
completed their schooling ―would have welfare about a quarter (24 percent)‖ higher than a
household of comparable measure whose members were all unschooled. This was based on
Nigerian education system which consisted of ―six years of primary and secondary education.‖
Further to this, they stated that ―if all adults had attended university, welfare would be 87 percent
higher ceteris paribus;‖ attending polytechnic and teacher training educational institutions ―had
somewhat smaller effects, at 48 percent and 20 percent respectively.‘ In a study conducted by
Akerele and Adewuyi (2011), it was revealed that in Nigeria, the educational level of household
heads had significant relationship with the incidence of poverty and that although it appeared that
incidence of poverty was higher among households whose head had secondary school education,
however, this did not downplay the importance of education in poverty reduction. Further to this,
they stated that an additional year gained by the household head to acquire formal education
would lead to rise in household income whose implication was enhanced welfare of household
members. This evidences the positive impact of education on poverty reduction and implies that
the level of poverty increases significantly when one has got little or no education in Nigeria and
that poverty decreases significantly when one attains post-secondary educational level. In other
words, when one has not got any formal education, the odds of being in poverty are increased but
when one attains the post-secondary educational level, the odds of being in poverty is decreased.
Using a set of household data, the P-alpha class measures of poverty, a linear regression analysis

85
and participatory poverty assessment method in seeking the perception of the people on the
influence of low education attainment on the incidence of poverty, Ijaiya and Nuhu (2011) in a
related study confirmed that in Nigeria, low educational attainment had a significant influence on
the level of poverty. In this study, the head count poverty index was (0.54) which represented 54
percent of the population of households under study.
Household size is also a determinant of poverty in Nigeria. According to Lanjouw and
Ravallion (1994, p. 17), ―one of the stylized facts about poverty in developing countries is that
large families tend to be poorer.‖ Large family household size in most developing countries of
the world is not unconnected to absence of ―well developed social security systems and low
savings‖ particularly in Africa where the fertility rate is very high among the poor who in
anticipation of not wanting to live in poverty or suffer hunger at their old ages increase the
number of their children so as to have a high probability of getting support from these children at
their old ages (Anyanwu, 2012, p. 16). It is not also unconnected with the high rate of infant and
child mortality in these countries, which often propels excess replacement of births to be insured
for the future (Schultz, 1981). Using the 2004 National Consumer Survey as the basis of
analysis, the computation of Anyanwu (2012) did confirm that in Nigeria, the incidence of
poverty was high in large households; correlation thus exists between the household size and
poverty levels. Available statistical data in Nigeria did confirm that households with a single
person exhibited the least incidence of poverty, while households with as much as 20 persons
and above exhibited the highest incidence of poverty. The incidence of national poverty with the
households with at least a single person was 12.6 percent while that of households with more
than 20 persons was 87.1 percent in 2003/2004.

86
UNDP (2009b) reported that poverty incidence was ―found to increase with household
size‖ in Nigeria; this is because ―the larger the size of the household, the larger the resources
required to meet basic needs of food and other necessities.‖ According to the report, in 2004, a
household that comprised of four or more individuals had poverty incidence that surpassed the
national average; households that consisted of nine or more individuals constituted more than 70
percent of poor households while households with 20 or more individuals constituted more than
90 percent of poor households. In the same year, households with 5 – 9 individuals contributed
59 percent to poverty while households with 10 – 19 individuals contributed 20 percent to
poverty; this thus confirms that ―the larger the household size, the higher the likelihood of falling
among the poor‖ (pp. 67; 72). Corroborating this, Anyanwu (2005, p. 435) confirmed that
household size was ―positively and significantly correlated with the probability of being poor;‖
thereby confirming household size as an important factor determining poverty in Nigeria as it
got national poverty increased in Nigeria. Using the fixed-effect regression model in a study,
Omonona (2010, p. 3) identified large family size as one of the factors that influenced poverty;
the study which investigated the nature of their influence on poverty in rural households for 1996
and 2004 confirmed that ―large family size reduces welfare in most regions of Nigeria‖ and that
‗the larger the household size, the poorer the family.‘ In their study, Akerele and Adewuyi
(2011) revealed that an increase in household size was significantly related to an increase
poverty situation among households in the study area; this was with high values of incidence,
depth and severity for household with 7 to 10 members. The study further revealed that the
situation might be worse still if the increase in household size translated into more dependants
who did not contribute to the household income. In a related study, (Etim and Ukoha 2010, pp.
50-51), confirmed that ―poverty incidence and severity increase with increase in size of

87
household members;‖ they further confirmed that ―72 percent of households with more than 10
members captured by their study were impoverished‖ while ―28 percent of households with less
than 5 members were poor;‖ and that ―the contribution of 1–5 members subgroup to the whole
group‘s poverty incidence was 4 percent, whereas it was 41 percent and 55 percent for the 6–10
and 11–15 members sub-groups, respectively.‖ In their study, Ijaiya and Nuhu (2011) estimated
poverty indices by measuring the well-being of the households it captured ―by their total
consumption-expenditure and by their household size using the adult equivalent scale;‖ the study
established households‘ consumption–expenditure as a cut-off point; this represented the poverty
line having used one dollar per day as consumption-expenditure of the households captured by
the study. The study revealed that 54 percent of the households captured by it were poor (p. 86).
Lastly, gender/sex and age compositions of family/households may determine poverty in
Nigeria. In relation to gender/sex composition of family/households and poverty, it was stated in
a study by Appleton (1996) that ―the linkages between gender and poverty have been a major
issue in discussions of the role and effectiveness of policy intervention in developing countries‖
(p. 1811). He went ahead to identify a number of ―observable factors that account for rough
economic parity of women and men-headed households‖ to include women and men headed
households‘ marital status and schooling, remittances, household size, dependency ratio, and
cultivatable land (pp. 1; 1819-1823). In a related study by Anyanwu (2010), it was stated that ―an
understanding of gendered poverty is a precondition for effective pro-poor development
strategies‖ and that ―the determinants of gendered poverty are not only complex but also
multidimensional, involving, among other things, age, location, education, and occupation (p.
40). With respect to Nigeria, Appleton, Mckay and Alayande (2008) in their study stated that
there were ―subtle relations between welfare and gender‖ under which the female headed

88
households were associated with lower welfare ceteris paribus – 9 percent lower in the
regression; they stated further that it seemingly appeared that women as heads of households did
encounter various disadvantages but that there was tendency for ―more prosperous households‖
to have in them ―a higher proportion of women‖ (p. 351). With respect to Nigeria, Anyanwu
(2010; 2012) in his studies revealed that in female-headed households, incidence of poverty was
higher and this applied to female-headed households in all the six geographical zones of the
country, it was 29.1 percent while that of male-headed households was 26.9 percent; this had
changed since 1985 as male headed households had since been characterized by a higher
incidence of poverty with the widest gap in 2003/2004, during this period, while the poverty
incidence for of male-headed households was 56.5 percent, that of female-headed households
was 36.5 percent. These studies are clear indication that sex composition of family/households
determines poverty in Nigeria.
With respect to age composition and incidence of poverty in Nigeria, Appleton, McKay
and Alayande (2008) did reveal that the higher the proportions of people aged 65, the strong the
negative effect on welfare, as did ―the proportion of children aged 5-15 years of age,‖ and also,
that there existed a relationship between ―increased proportion of children under five in the
household‖ and higher welfare (p. 351). Anyanwu (2012) revealed that between 1992 and 2004,
―poverty tended to decline marginally‖ following the age group 45 to 54 years, and that in
general terms, poverty heightened alongside the age group of household head which implied that
poverty rose ―at old age as the productivity‖ of an individual declined with an attendant ―few
savings to compensate for this loss of productivity and income‖ (pp. 10; 16). These studies are
clear indication that age composition of family/households determines poverty in Nigeria.

89
2.6.4 Poverty Reduction Strategies in Nigeria
Todaro (1982) gives a summary of the policy options for attacking poverty to include
policies affecting economic growth and demand for labour and policies affecting the
accumulation and sustainability of asset. The former includes policies designed to get price
incentives right and thereby correct biases against demand for unskilled labour and rural outputs
and policies such as labour market regulations which inhibit the growth of labour markets and
macro-economic policies which influence the distributional impact of fiscal spending in favour
of the poor. The latter includes policies designed to modify the size distribution of income and
human capital development, policies designed to enable the poor to take advantage of economic
opportunities, policies designed to confer access to basic life sustaining social services such as
education, health and family planning services, and policies designed to promote indigenous
technological research and development, assets redistribution policies designed to govern
finance/capital, land and the environment.
Nigeria has history in poverty reduction/alleviation efforts. According to Aigbokan
(2008), Nigeria has adopted different poverty reduction/alleviation strategies which include
economic growth strategy; basic needs approach, rural development approach, targeting
approach, and employment oriented approach. Years before the commencement of the
implementation of the MDGs, Nigeria‘s first three National Development Plans had economic
growth as its main focus and this indirectly dealt with the poverty reduction/alleviation issues.
Following this was another National Development Plan that consisted of policies targeted at
poverty reduction/alleviation. Nigeria evolved a catalogue of programmes targeted at reducing
the hardship Nigerians faced to arrest some of the decline in social service delivery, particularly
to the poor. Such programmes according to Famutimi and Omosulu (2008) include Operation
90
Feed the Nation (OFN), National Agricultural Land Development Authority (NALDA),
National Primary Health Scheme (NPHS), National Agency for Mass Literacy (NAML),
Structural Adjustment Programme (SAP), National Directorate of Foods, Roads and Rural
Infrastructure (DFRRI), National Directorate of Employment (NDE), and the Better Life/Family
Support Programmes (BLD/FSP). Specifically, beginning from mid 80s through to the 90s,
Nigeria embarked on several projects and programmes and the slogan of the government was
year 2000 (housing for all by year 2000; education for all by year 2000; health for all by year
2000 and so on) but all these were either abandoned or suspended at the end of the day
(Odewale, Aribaba and Adeyeye, 2008). Famutimi and Omosulu (2008) list measures and
institutions introduced to help reduce poverty particularly in the 90s to include Petroleum Trust
Fund (PTF), Peoples‘ Bank of Nigeria, (PBN), Community Banks (CB), Federal Urban Mass
Transit Agency (FUMTA), Federal Environmental Protection Agency (FEPA), Federal
Economic Advancement Programme (FEAP), and the Education Tax Fund (ETF). Virtually all
the pre MDGs implementation efforts of Nigeria‘s government to reduce/alleviate poverty have
failed to deliver the desired result because of a number of political, social and economical
reasons; whoever one is or wherever one comes from, the incidence of poverty is on the
individual (Oladunni, 1999). In one statement, the major problem with Nigeria in its efforts
towards poverty reduction/alleviation is the targeting problem (Lipton and Ravallion, 1995). The
observation of Bardhan and Mookherjee (2003) that decentralization of anti-poverty
programmes can result in reduction of targeting failures has not helped Nigeria out of poverty
because quite a number of the poverty reduction strategies that have been decentralized have not
yielded any positive results.

91
Some current efforts of the Nigerian government, specifically from year 2000 towards
poverty alleviation include Poverty Alleviation Programme (PAP), National Poverty Eradication
Programme (NAPEP), National Economic Empowerment Strategies (NEEDS) which is MDGs
based, National Programme for Food Security (NPFS), Microfinance Banking, Vision 20: 2020
and the Seven Point Agenda. PAP is an interim policy introduced early 2000 to address the
problems of rising unemployment and crime wave, particularly among youths. It has an ultimate
aim of increasing the welfare of Nigerians. Specifically, PAP has three primary objectives which
are to ―reduce the problem of unemployment and hence raise effective demand in the economy;‖
to ―increase the productiveness of the economy;‖ and to ―drastically reduce the embarrassing
crime wave in the society‖ (Obadan, 2002, p. 51). In order to achieve these objectives, the
Nigerian government put in place several measures which included ―increase in salary of public
sector workers,‖ and ―improving the supervisory capacity within the nation‘s institutions.‖ Also,
the measures included ―encouraging and rewarding all deserving Nigerians for industry and
enterprises and launching of the Universal Basic Education Programme‖ (Alehile, 2009, p. 45).
These measures notwithstanding, ―the programme appeared to be ad-hoc in orientation with little
attention paid to the policy framework.‖ PAP placed emphasis on ―massive construction and
other public work projects‖ and this ―made it look like a one-off affair rather than making it a
revolving one.‖ Also, it ―paid little attention to the framework of allocation of funds,
sustainability aspect of the PAP and the needed collaborative arrangements for its success;‖ its
political connotation ―served as an important threat to the success of the programme;‖ it ―lacked
appropriate framework for beneficiary targeting;‖ and ―the timing and phasing of the direct
labour (200,000 jobs) were not explicitly stated‖ despite the fact that ―this aspect was very
crucial to the success of the programme‖ (Obadan, 2002, p. 53).

92
As for NAPEP, it was introduced early 2001; and it focuses on the provision of ―strategies
for the eradication of absolute poverty in Nigeria‖ (FRN 2001, p. 3). NAPEP is under the
supervision of the National Poverty Eradication Council (NAPEC) which is charged with the
responsibility of ―coordinating all poverty eradication programmes of all government agencies
and parastatals and ministries with the aim of ensuring the central planning and coordination of
all poverty reduction programmes in the country.‖ Poverty eradication under NAPEP are
classified into four namely Youth Empowerment Scheme (YES), Rural Infrastructure and
Development Scheme (RIDS), Social Welfare Service Scheme (SOWESS), and the Natural
Resources Development and Conservative Scheme (NRDCS) (Alehile, 2009, p. 45). To ensure
that NAPEP overcomes the inadequacies of the previous programmes, Aliu (2001, pp. 12 - 13)
confirms that its blueprint is characterized by the following:
―it adopts the participatory bottom-up approach in programme implementation and
monitoring; it provides for rational framework which lays emphasis on appropriate and
sustainable institutional arrangement; it provides for pro-active and affirmative action
deliberately targeted at women, youths, farmers and the disabled; it provides for inter-
ministerial and inter-agency cooperation; it provides for the participation of all
registered political parties, traditional rulers, and the communities; it provides for
technology acquisition and development particularly for agriculture and industry; it
provides for capacity building for existing skills acquisition and training centres; it
provides for the provision of agricultural and industrial extension services to rural areas;
it provides for institutional development for marketing of agricultural and industrial
products; and it provides for integrated schemes for youth empowerment, development
of infrastructure, provision of social welfare services and exploitation of natural
resources.‖
Though laudable, this programme is not being properly implemented; an analysis in
support of this is that of Wohlmuth, Alabi and Burger (2008) that claims that the programme has
been able to train 130,000 youths and engaged 216,000 persons, but most of the beneficiaries
were non-poor. This programme is getting off its target by the day and this has been strongly
attributed to corruption. According to Ibekwe (2011), from the KEKE NAPEP project alone, up

93
to ₦600 million was stolen. If this trend continues, NAPEP programme would be a complete
failure in a couple of years, just as the ones that preceded it.
Regarding NEEDS, it is a comprehensive medium-term growth and development
programme based on some core principles (NPC, 2004a). It was a reform programme devised to
cover 2004 to 2007; it was ―aimed at re-engineering the growth process,‖ as its process of
formulation was ―largely participatory;‖ its focus was on ―strategy and policy directions rather
than programmes and projects;‖ and implementation of its aspects predated the official lunching
of the strategy paper (Akpobasah, 2004, p. 2). NEEDS did have equivalents at both the state and
local government levels, known as State Economic Empowerment and Development Strategy
(SEEDS) and Local Government Economic Empowerment and Development Strategy (LEEDS)
respectively (OSSAP-MDGs, 2010a). Approval and adoption of NEEDS by the regime of
President Olusegun Obasanjo was instrumental to the debt reprieve granted the country in 2005
by the Paris Club. Further to this, NPC (2004a) did state that the scope and contents of NEEDS
were divided into four parts which included employment generation, poverty reduction, wealth
creation and value reorientation which were not covered by 2007 which was the targeted year for
the its complete implementation. Corroborating this, the Nigerian government through the then
Minister/Deputy Chairman of NPC, the coordinating institution for NEEDS programmes,
Senator Abdullah Wali, in a report did admit the failure of NEEDS to achieve significant results
in the medium term. He stated that NEEDS had a lot of challenges and that the major challenges
were not only in the areas of infrastructural crisis but also high poverty level and high
dependence of the nation‘s economy on oil exports. Some other challenges highlighted were low
contribution of secondary activities to yearly GDP, low aggregate demand, high cost of
production, high rates as well as high import dependence of the economy, especially on capital

94
and intermediate goods import (Ogefere, 2007). Within the academic circle, the failure of
NEEDS was variously attributed to corruption, disregarding the poor as the core, discrepancies
in pro-poor programmes, reprehensible implementation of pro-poor programmes, and a visible
detachment between the poor and the government (Ugoh, and Ukpere, 2009; Ogwumike, 2002;
Adogamhe, 2010).
The 7-Point Agenda and the Vision 20: 2020 which were NEEDS-based and aimed at
ensuring steady progress of the MDGs were two key policies of Late President Umaru Musa
Yar‘adua who was President Olusegun Obasanjo‘s successor (OSSAP-MDGs, 2010a). The 7-
Point Agenda accommodated power and energy, food security and agriculture, wealth creation
and employment, mass transportation, land reform, security and qualitative and functional
education (Arizona-Ogwu 2008; NigeriaFirst, 2012). As for the Nigeria‘s Vision 20: 2020, the
key target was that ―Nigeria will become one of the first 20 economies in the world by 2020‖
(Onyenekenwa, 2011, p. 1); this was seemingly with the hope that the country would have the
ability to cement its leadership role within the African continent and constitute itself as a vital
player in the economic and political arena of the world. Nothing tangible has come out from
these policies owing to the demise of President Yar‘adua in May, 2010. The current
administration of President Goodluck Jonathan that took over after Yar‘adua does not seem to be
fully committed to implementing these policies. Thus, Nigeria‘s hope of attaining the MDGs and
alleviating poverty through government policies is at the moment very dim.
Commenting on obstacles of alleviating poverty in Nigeria, Canagarajah, Ngwafon and
Thomas (1997) argue that a considerable lack of understanding of the configuration of poverty
by economic sectors and socio-economic groups in Nigeria has blurred and will continue to
hinder the prospect of designing pragmatic, cost effective poverty reduction strategies in Nigeria.

95
Further to this, they confirm that after a nationwide study on poverty in Nigeria that lasted a
year, a key lesson learnt was that Nigeria with adequate capacity has a statistical system that is a
decade behind, compared to some of the poorer countries in SSA. They stress that a weak data
base on poverty in Nigeria is worsened by year-to-year changes in Nigeria, which are quite
drastic without any assurance of their non-occurrence in the future. This is also an obstacle to
poverty reduction/alleviation in Nigeria. According to Chenery (1974), the lowest income groups
do not sufficiently benefit from growth and trickle down effects and the additional re-
distributional programmes targeting the poor are often needed for improvement of living
standards of the poor. What can be inferred from this in relation to policy direction is that some
nuance rather than pan-territorial policies may be required for the poor to benefit from growth in
Nigeria. So, it is quite impossible that the right kinds of policies that will improve the living
standard of the poor in Nigeria are not yet in place. On the growth front, there is a possibility that
the poor in Nigeria did not participate in the growth process. According to Aigbokan (2000) and
Ajakaiye and Adeyeye (2001), for growth to truly reduce poverty, it must be inclusive of the
poor. In addition, Lipton (1996) states that in countries where growth induced policies and
growth did not factor in the attributes of the poor, poverty reduction are usually missed.
Corroborating this, Chen, Datt and Ravallion (1992) state that when the poverty line is held
constant overtime, poverty reduction effects of growth are overstated and the contribution of
improvements in income distribution are underestimated and vice versa. Thus, the proper
understanding of the concept of poverty may be critical to resolving this important debate of the
relative importance of economic growth and income distribution for poverty reduction.
There are a number of other studies carried out in Nigeria to examine the poverty
reduction phenomenon. Atoloye (1997) presents a growth-led poverty alleviation strategy. He

96
states that the partial barter arrangements and the production for consumption in rural areas
complicate the realistic assessment or evaluation of the level of poverty in Nigeria. He further
states that the deficiencies of various measures of poverty such as the poverty line, based on
minimum income required to acquire the minimum necessities of life and the relative poverty
index or the absolute income received by the poorest 40 percent of the population cannot be
ignored. Finally, he suggests the revolutionary measures to the production system in Nigeria to
emphasize labour - intensive and rural-based production activities for the purpose of achieving
the desired objectives of growth-led strategy for poverty alleviation. Okunmadewa (1997) in his
appraisal of the World Bank study on poverty alleviation in Nigeria identifies a number of
poverty reducing strategies including the promotion of high and broad-based growth as well as
employment generating growth, increase access to social services and infrastructure by the
generality of the people. Others include targeting expenditure programmes towards the primary
education, healthcare services and infrastructural improvement. He further states that the
removal of price distortions, liberalization of trade regimes and investment in technology and
physical capital are positive steps towards stimulation of broad-based and employment
generating growth.
2.7 Framework for the Research
This research has its foundation in the frameworks of some previous studies on the level of
poverty and factors associated with poverty which include the gender factor, the age factor,
employment/form of employment/unemployment factor, educational attainment factor, family
size factor, and the geographical location factor (see the table 3.3 for the previous studies). The
research has its foundation in the frameworks of these previous studies because those studies
involved the use of primary or secondary data generated from people. The factors from the

97
previous studies are in order for this research because it is committed to investigating the levels
of income and food poverty and the factors associated with them to assess progress towards
attaining the MDGs‘ targets on poverty reduction by using primary qualitative and quantitative
data involving the individual and the family household as units of research analysis. Income
poverty and food poverty are being investigated through the individual because individuals
personally experience poverty, and because if poverty is comprehended in terms of a right to a
minimum level of resources, the individual is basically the appropriate unit (Nussbaum, 2000;
Atkinson, 1989; Atkinson, et al., 2002). This research does not have its foundation in the
frameworks of some previous studies on the level of poverty and factors associated with poverty
which include corruption factor, inadequate education/poor educational system factor,
overpopulation factor, global inequality factor, individual deficiencies/laziness factor, and the
generational poverty/culture of poverty factor. The reason for this is that these factors are not
best investigated by a research like this which is committed to collecting primary data and using
the individual and the family household as its units of analysis.
Table 2.3 Factors Associated with Poverty and Relevant Previous Studies
Factors Associated with Poverty Previous Studies
1. Gender/Sex Factor Appleton (1996), Appleton, Mckay and Alayande (2008)
and Anyanwu (2010; 2012)
2. Age Factor Appleton, Mckay and Alayande (2008), and Anyanwu
(2010; 2012)
3. Household Educational Attainment Factor Canagarajah, Ngwafon and Thomas (1997), FOS, (1999),
Appleton (2000), Appleton (2001), Ojowu, et al. (2004),
NBS (2005), Appleton, Mckay and Alayande (2008),
Bastos, et al. (2009), OSSAP-MDGs (2010a), Akerele and
Adewuyi (2011), Ijaiya and Nuhu (2011) and Anyanwu
(2012)
4. Employment/Form of
Employment/Unemployment Factor
Englama (2001), Appleton, Mckay and Alayande (2008),
Osinubi (2005), NBS, (2012b), Aiyedogbon and Ohwofasa
(2012), and Anyanwu (2012)
5. Household Size Factor Anyanwu (2005), Omonona (2010), Etim and Ukoha
(2010), Akerele and Adewuyi (2011), Ijaiya and Nuhu
(2011) and Anyanwu (2012)
6. Location Factor Appleton, Mckay and Alayande (2008) and Anyanwu
(2012)
Author’s Compilation

98
2.8 Chapter Summary
The chapter gives a brief description of poverty and the poor and explores what poverty
means from four different approaches namely income, basic-needs, capability and participatory
approaches. Review of the different approaches to poverty indicates that there exists no objective
or unique way of defining poverty as the approaches seemingly lack considerable overlapping.
This suggests that poverty is understandable from multiple perspectives and that a choice of
using one of the approaches as a means of targeting is bound to generate a bunch of serious
targeting errors. The chapter gives theoretical explanations of the causes of poverty under which
poverty was assumed to be caused by individual deficiencies, cultural belief systems that support
subcultures of poverty, economic, political, and social distortions or discrimination, geographical
disparities, and cumulative and cyclical interdependencies. The chapter describes the major
causes and consequences of global poverty.
The chapter states that the incidence of poverty is high in Nigeria and that by 2015; the
country will have more poor people than either India or China; it confirms that in 1980, 1996,
2004 and 2010, 27.2 percent, 65.6 percent, 54.4 percent, and 69 percent of Nigerians were
officially poor, and that by 2011, 75.1 percent of Nigerians would be poor. The account claims
that the incidence of income and food poverty rose between 2004 and 2010; 51.6 percent of
Nigerians were income poor in 2004, but this increased to 61.2 percent in 2010; also, 33.6
percent of Nigerians were food poor in 2004, but this increased to 41.0 percent in 2010. The
chapter lists the determinants of poverty in Nigeria as identified by authors in different previous
studies to include unemployment, corruption, non-diversification of the economy (oil over-
dependency), inequality, laziness, poor educational system, geographical/location variable,
household educational attainment, household size, and sex and age compositions of
family/households. The chapter explores the Nigeria‘s poverty reduction strategies over time.

99
CHAPTER THREE
DEVELOPMENT AND THE MILLENNIUM DEVELOPMENT GOALS
3.1 Introduction
The purpose of this chapter is to present an analysis of development by looking at it from
its historical background and from what the concept has meant over the years from different
perspectives and their links to the MDGs. The chapter also discusses the Millennium
Development Goals (MDGs); the progress of the MDGs‘ targets on global poverty reduction;
and the progress of the MDGs‘ targets on poverty reduction in Nigeria.
3.2 The Idea of Development
Historically, the idea of development is traceable to some authors who went back to seek
the roots of the idea in Marx and Hegel and others who went back to the 17th
century political
economist, Adam Smith or further back to the European Age of Enlightenment with the novel
suggestion of transforming the world by scientific discovery and human intervention (de Rivero,
2001). From the beginning of the 19th
century, development thinking was couched as a reaction
to the crises of progress, such as social dislocations caused by industrialization (Pieterse, 2010).
Within this century, development had meanings from different perspectives including the
classical political economy, latecomers, colonial economics and development economics
perspectives. From the classical political economy perspective, similar problems of economic
development were addressed by classical political economists, from Ricardo to Marx. From the
classical political economists, development meant ―remedy for progress‖ and ―catching up‖
(Martin, 1991; Pieterse, 2010, p. 7). From the turn-of-the century latecomers‘ perspective,
development meant ―industrialization‖ and ―catching up;‖ from the colonial economics
perspective, development meant ―resource management‖ and ―trusteeship‖ under which the
administration of colonial economies was ―not merely with a view to their exploitation for

100
metropolitan benefit but also for the interests of the native population;‖ and from the
development economics perspective, development meant attaining economic growth through
industrialization (Pieterse, 2010, pp. 5-7).
Modern development thinking can be traced back to the post Second World War era. This
is not to claim that the concept of development was not in discussion until the post Second
World War era, it was indeed in discussion from different perspectives. Though, the term
development was not necessarily used before the post Second World War era, but ―earlier
practices have been viewed as antecedents of development policy (Pieterse, 2010, p. 5). The
second half of the 20th
century was specifically labelled as the era of development. The
beginning of this era is traceable to the 20th
day of January, 1949 when it was emphasized by US
President Harry Truman in his inaugural address that a new bold programme must be embarked
on to make the advantage of his country‘s ―scientific advances and industrial progress available
for the improvement and growth of the underdeveloped areas.‖ President Truman further
emphasized that neither the old imperialism nor exploitation for foreign profit had places in his
country‘s plans; and that the US envisaged ―a programme of development based on the concepts
of democratic fair dealing‖ (Truman, 1949). The idea of development was invented in the post
Second World War era to describe the process by which ―backward‖ countries would ―catch up‖
with the industrialized world following help from the latter (Black, 2007, p. 10). According to
Esteva (1992), the post Second World War idea of development established a new dimension
into development thinking which centred on development from the perspective of escaping from
underdevelopment. As at this time, undeveloped countries represented two-thirds of the globe
which necessitated a greater proportion of the nations of the globe to define themselves as having
fallen into the ―undignified condition called underdevelopment‖ (Esteva, 1992, p. 7). This era

101
therefore witnessed ―increasing international discussion about how development particularly in
the Global South was to take place‖ (Willis, 2011, p. 29). Development thus ―stood as the idea
which oriented emerging nations in their journey through post war history‖ (Sachs, 1992, p. 1).
Much of the post Second World War descriptions of development were in relation to ―a long-
term view with an emphasis on socio-economic structural transformation;‖ such as ―the shift
from an agrarian economy to an industrial economy.‖ The word development was widely
regarded as both self-evident and prophetic, informing a widespread assumption in the 1950s and
1960s that ―most underdeveloped countries would almost inevitably become developed‖
(Haynes, 2008, p. 8). But as from the 1990s, much definitions of development were in relation to
―a shorter horizon related to policy objectives and performance indicators such as growth of
income per capita and poverty reduction‖ (Sumner and Tribe, 2008, p. 25).
According to Cowen and Shenton (1996), development comes to be defined in a
multiplicity of ways because there is multiplicity of developers who are entrusted with the task
of development. Development is a concept which is ―contested both theoretically and politically
and is inherently both complex and ambiguous;‖ and it is a term which is used so loosely and
freely that it has little precise meaning (Thomas, 2004, p. 1; McCarthy, 1994). In other words, it
means different things to different people. According to Rodney (1972, pp. 3-4), ―development
in human society is a many–sided process. At the level of the individual, it implies increased
skill and capacity, greater freedom, creativity, self-discipline, responsibility and material well-
being;‖ at the level of social groups, ―development implies an increasing capacity to regulate
both internal and external relationships.‖ Rodney states further that the term development is used
in ―an exclusive economic sense, the justification being that the type of economy is itself an

102
index of other social features‖ (p. 4). In his final analysis, he states that development is universal
because the conditions leading to economic expansion are universal.
Chambers (1997) simply refers to development as good change. This simple description of
development indicates that ―it is a positive word that everyday parlance is virtually synonymous
with progress‖ (Thomas, 2000, p. 23). He goes ahead to state that the implication of progress is
―continual improvement reaching higher levels perhaps without limit, whereas development, as
an analogy from development of living organisms, implies moving towards the fulfilment of
potential‖ (Thomas, 2000, p. 25). Conceptually, development should be differentiated from
progress as progress had been thought to be an immanent process in the preceding centuries, in
that human society was understood as moving viciously to a higher stage of civilization (Cowen
and Shenton, 1996). As an immanent process, and ―with the intrinsic dynamism of capitalism,‖
development requires it being distinguished from ―development as an intentional activity,‖ often
designed to ameliorate the faults of capitalist growth (Thomas, 2000, p. 48). The two words good
change merged quite dissimilar ideas which can cause disorientation between various senses in
which the term development is used. The word good implies a vision of a desirable society, that
is, wellbeing for all; something to target, condition of being with certain affirmative traits which
can be evaluated so that more or less development can be talked of. As for change, it is a process
which may entail disruption and which may or may not be possible to direct (Thomas, 2000).
Further to this, Thomas clarifies that the idea of development is beyond simple good change and
thus makes it to be an inherently ambiguous concept. One of the points stated in support of this is
that development generally implies an all-encompassing change and not just an improvement in
one aspect. Secondly, development does not revolve around just ―a one-off process of change to
something better but implies a process which builds on itself, where change is continuous and
103
where improvements build on previous improvements.‖ Thirdly, development refers to ―a matter
of changes occurring at the level of social change and the individual human being at one and the
same time;‖ this simply indicates that ―changes in how people think, interact, make their livings
and perceive themselves form the basis for changes in society‖ (p. 23). As a process,
development implies a ―change for the better in the individual circumstances as in societies‖
(Black, 2007, p. 29). Fourthly, development is not seen positively at all times as ―what some see
as general improvement may have losers as well as winners;‖ and therefore, for social change to
be all-encompassing, ―previous ways of life may be swept away with the loss of positive as well
as negative features‖ (Thomas, 2000, p. 24).
Development is also described as ―the organized intervention in collective affairs
according to standard of improvement‖ (Pieterse, 2010, p. 3). He goes ahead to state that what
constitutes improvement and what is an appropriate intervention obviously varies in consonance
with ―class, culture, historical contexts and relations to power‖ (Pieterse, 2010, p. 4).
Development refers to the ―remedies for the shortcomings and maladies of progress‖ (Cowen
and Shenton 1996, p. 130). According to Ake (1995, p. 125), development is ―the process by
which people create and recreate themselves and their life circumstances to realize higher levels
of civilization in accordance with their own choice and value.‖ The Human Development
Reports (HDR) of United Nations Development Programme (UNDP) describes development as
―the enlargement of people‘s choices‖ (UNDP, 1990, p. 10). Development is referred to as
enlargement of people‘s choices and human capacitation (Sen, 1985). From all these, it can be
inferred that ―development includes an element of reflexivity that ranges from infrastructure
works such as roads, railways, dams, canals and ports to industrial policy, the welfare state, new
economic policy, colonial economics and Keynesian demand management‖ (Pieterse, 2010, pp.

104
7-8). Thus, in the modern sense, development ―implies intentional social change in accordance
with social objectives‖ (Hettne, 2008, p. 6). Also, it can be inferred that development is ―a kind
of social change in which new ideas are introduced into a social system in order to produce
higher per capita income and levels of living through modern production methods and improved
social organization‖ (Roger and and Svenning, 1969, p. 18). Further to these, it can be inferred
that the rate at which a given society is developed is determined by so many attributes such as
the whole people's educational level, leadership, and natural resources of a particular country.
Development has been taken to mean growth, economic development, industrialization,
economic growth, modernization and nation-building. It thus serves as ―a mirror of changing
economic and social capacities, priorities and choices‘ (Pieterse 2010, p. 8).
Three different propositions are set up about the meaning of development by Sumner and
Tribe (2008). The first proposition sees development as a process of structural societal
transmutation or change characterized by long duration. This aligns with the description of
development by Thomas (2004) as a process of historical change. The main characteristics of
this proposition are that ―it is focused on process of structural societal change‖ and ―it is
historical and it has a long term outlook.‖ Thus, development relates to a wide view of diverse
socio-economic changes in that the process does not relate to any specific ―set of objectives‖ and
as a result, ―not necessarily prescriptive.‖ The analysis of the proposition is not based on ―any
expectations that all societies will follow approximately the same development process.‖ This
indicates that development is not compulsorily connected to intentional or good change as in
some cases, it is characterized by ―decline, crisis, and other problematical situations‖ of which
can be ―accommodated within the wide perspective of socio-economic change‖ (Sumner and
Tribe, 2008, p. 12). Such structural and long term transformation or changes or goals were the
105
ones that ―dominated the 1950s and 1960s via vision‖ (Gore, 2000, p. 794). The second
proposition sees development as ―a short to medium term outcome of desirable targets;‖ in other
words, it centralizes its focus on ―the outcomes of change so that it has a relatively short-term
outlook‖ (Sumner and Tribe, 2008, p. 13). This is characterized by a vision or measure of
progressive change (Thomas, 2004). Gore (2000, p. 794) relates this to ―performance
assessment.‖ This perspective has a ―much more instrumental element which is likely to be
favoured by practitioners within development community notably in international development
agencies‖ because its concern is based on development that occurs ―in terms of a set of short to
medium-term performance indicators, goals or outcome which can be measured and compared
with targets‖ such as ―changes in poverty or outcome levels (Sumner and Tribe, 2008, p. 13).
The MDGs of the UN that have to do with meeting specific targets on poverty reduction by 2015
exemplifies this perspective. It is important to clarify that ―the two perspectives of development
are respectively based on visions and outcomes‖ (Sumner and Tribe, 2008, p. 14). The third
proposition sees development as a dominant discourse of Western modernity. This is referred to
as ―post modern, post development, post colonial or post structuralist position‖ and its argument
―is based on the view that development has consisted of bad change and bad outcomes through
the imposition of Western ethnocentric notions of development upon the Third World‖ (Sumner
and Tribe, 2008, p. 14). The view of this perspective ―suggests that those who construct the
concept or the discourse have in mind an inherent element of inferiority-superiority,‖ under
which ―values are placed on certain assets which the South does not have.‖ The South is thus
―viewed as inferior‖ to the North as an attribute such as ―non-modern or non Western approaches
to medicine, or other aspects of society are perceived as inferior‖ (Sumner and Tribe, 2008, p.
15).

106
Thomas (2000) distinguishes three main senses in which the term development is used.
First, it is ―used as a vision, description or measure of the state of being a desirable society;‖
second, it is ―used as historical process of social change in which societies are transformed over
long periods;‖ and lastly, it is ―used as consisting of deliberate efforts aimed at improvement on
the part of various agencies, including governments, all kinds of organizations and social
movements.‖ There exists a relationship in the three senses in which the term ‗development‘ is
used in that ―the state of being a desirable society is supposedly the result of the historical
process of development, and the vision of a desirable society may form an aim towards which to
direct efforts at improvement‖ (p. 29).
From the above analysis, it may be safely agreed that real development involves a
structural transformation of the economy, society, polity and culture of a country that allows the
self-creating and self-bolstering use and development of the people‘s potentials (Nkrumah,
1965). It may also be agreed that the overall multiplicity of definitional debates includes a
general agreement on the view that development encompasses continuous change in a variety of
aspects of human society (Sumner and Tribe, 2008).
3.3 Perspectives of Development over Time
3.3.1 Perspective of Development in the 1950s
The 1950s marked a period of significant advancement in the discourse of modern
development with the emergence of modernization theory, from which perspective development
meant ―growth‖ and ―political and social modernization‖ (Pieterse, 2010, p. 7). The theory
emerged in the US at this period following an exercise under which American social scientists
were encouraged ―often through direct government funding, to develop an interest in the new
countries‖ and to study these poorer nations, so as to guide against throwing off the new states to

107
the Soviet communist bloc (Chirot, 1981; So, 1990, Haynes 2008, p. 20). In other words, ―it
arose as the theoretical corollary of American globalism in the context of the Cold War and
decolonization‘ and then follows that ―What Victorian anthropology was to the British Empire is
what modernization theory is to American states hegemony‖ (Pieterse, 2010, p. 21). The theory
emphasizes that modernization of the poorer countries is ―a phased, irreversible, progressive,
lengthy process that moves in the direction of the American model‖ (So, 1990, p. 261). The
theory is the leading paradigm of development and it represents an effort to examine the
prospects for Third World Development (Pieterse, 2010). The theory is widely attractive because
it enables a society to move from being poor, to being rich; it encompasses industrialization, and
increases the use of technical knowledge and application of realistic thinking and scientific
principles to the understanding of progress of medical, legal and political systems (Inglehart,
1997; Willis, 2011). In a nutshell, modernization is the antidote to global poverty (Roxas and
Ungson, 2011). Modernization theory assumes that the attributes of modernity form a consistent
whole and as a result appearing in a cluster rather than in isolation (Hermassi, 1978). This
suggests that modernization is a systemic process and involves changes in almost all aspects of
social behaviour including industrialization, urbanization, mobilization, differentiation,
secularization, participation, and centralization (So, 1990).
The dominant explanations of the dilemmas and chances of development in the Third
World written from a modernization theory approach is The Stages of Economic Growth: A Non-
Communist Manifesto by Walt Rostow. According to Rostow (1960, pp. 12-13), the stages of
economic growth ―are not merely descriptive. They are merely a way of generalizing certain
factual observations about the sequence of development in modern societies. They have inner
logic and continuity. They have an analytic bone-structure, rooted in a dynamic theory of
108
production.‖ His main argument is that ―all developing societies must pass, in order to attain the
promise land of a stable, prosperous, liberal democratic polity along lines of those of the US or
Britain‖ (Haynes, 2008, p. 21). In his analysis, Rostow (1960) postulates five basic stages to
economic growth namely traditional society; preconditions for take-off; take-off; drive to
maturity; and age of high mass consumption. According to him, the Third World countries are at
first at the traditional stage characterized by a basically agricultural economy and strict ranked
social structure with little social change; at the second stage, economic growth of the Third
World countries has started to take place with the development of new industries, an increase in
the proportion of new entrepreneurs, and expansion of market. For the Third World countries to
be pushed beyond this second stage which is characterized by poverty trap as the first stage,
Rostow emphasizes that a stimulus, that is, a big push is required which can be in the form of
political transformation that revamps main institutions, a technological modification such as the
intervention of the steam machine in the Industrial Revolution or a positive international
environment characterized by export demands and prices. At the third stage, Rostow argues that
the Third World countries follow a pattern of take off to possess self-sustained economic growth
under which they marshal capital and resources to increase the rate of productive investment to
10%; at the fourth stage, the Third World countries attain a level at which they are driven to
maturity; and at the last stage, they are at the level of maturity under which there is a boost in
employment opportunities, rise in national income, expansion of consumers‘ demands, and
creation of powerful domestic markets.
Within development thinking, Rostow‘s take off approach has confirmed itself to be
enduring and widespread in that modernization consists of an acute break between the more
stable or static social relations of traditional society and the more fluid and ambiguous conditions

109
of modern society (Sachs, 2005). A vital characteristic of Rostow‘s development design is that
for the traditional societies of much of the developing world, the initial propellant to
modernization arrives through the example set by the industrialized countries; the basic dilemma
for them of ―taking off‖ is totally internal to the economies concerned (Randall and Theobald
1985, p. 21). Modernization thus travels through different phases within a country/society; thus,
countries/societies can be compared in terms of the extent to which they have moved down the
road from tradition to modernity (Rostow, 1964; Levy, 1967). This suggests that modernization
is transformative as for a country/society to move into modernity, its traditional structures and
values must be replaced by a set of modern values (So, 1990).
Modernization theory looks at the internal factors of a country/society, it assumes that if a
country/society does not attain development, this condition is caused by problems/obstacles
internal to the country/society; it emphasizes that development is an internal problem and that
poverty is caused by internal factors or factors contained in the relevant country/society (Bauer,
1981; Berger,1985; Harrison, 1988; So, 1990; Tiryakian, 1992; de Soto,1999; d‘Souza, 2002;
Rahman, 1993; Inglehart and Baker, 2000; Nielsen, 2007; Pieterse, 2010; Damerow, 2010).
Across disciplines, modernization theory attributes problem relating to attaining development
particularly in the Third World to factors internal to them and this provides an international
explanation; sociologists stress the persistence of traditional values and institutions,
psychologists highlight the low achievement motivation, demographers highlight population
explosion, political scientists emphasize inefficient and corrupt bureaucracies, and economists
point to the lack of productive investment (Yeh, 1989). For development to be attained in a
country/society, modernization theory emphasizes overcoming internal obstacles to development
or effecting changes to them (Kuhmen, 1987; Harrison, 1988; So, 1990); this implies that

110
internal situations in societies affects the processes of modernization immediately (Huskey and
Morehouse, 1992; Gavrov, 2004).
Internal/endogenous factors often referred to in modernization theory discourse as being
responsible for the inability of countries to achieve development include ―illiteracy, traditional
agrarian structure, the traditional attitude of the population, the low division of labour, and the
lack of communication and infrastructure,‖ a change in these endogenous factors is the strategy
for development (Kuhmen, 1987, p. 2). In the words of Fakhry (2003), potential internal barriers
that tend to block change and thus thwart attainment of development include an ineffective or
underdeveloped educational system, including both relatively low levels of general literacy and
an imbalance between allocations of financing to lower and higher education, the role of the
state, that is, the power and nature of the influence of government including the degree of
political freedom and the strength of democratic processes; the importance of political corruption
and patronage and impact of these on public policies and economic behaviour of those governed.
Inglehart and Baker (2000) simply list poverty and inadequate culture as internal factors
obstructing attainment of development in countries/societies.
3.3.2 Perspective of Development in the 1960s
In the 1960s, there emerged the dependency theory in the modern discourse of
development, from which perspective development meant ―economic growth or capital
accumulation‖ (Pieterse, 2010, p. 6). Dos Santos (1971, p. 226) describes dependency as a
situation in which the relationship between or among countries ―assumes the form of dependence
when some countries (the dominant ones) can expand and can be self-starting, while other
countries (the dependent ones) can do this only as a reflection of that expansion.‖ The theory
divides the countries of the world into the periphery and the core nations. The periphery nations

111
are basically located outside Europe and North America, including countries of in Latin America
and SSA. These countries are characterized by least economic diversification, relatively weak
governments, relatively weak institutions with little tax base to support infrastructure
development, single economic activity, least industrialization, openness to exploitation and
influence by the multinational corporations controlled by the core nations, small bourgeois and
large peasant classes, high rate of poverty and illiteracy, and high level of inequality (Barfield,
1997; Halsall, 1997). On the other hand, the core nations are the most powerful in the world
economic system and they consist of such nations as the ones in Europe, the United States,
Australia, and Japan (Andersen and Taylor, 2007). They are characterized by most economic
diversification, economic and military wealth and power, strong central governments, extensive
bureaucracies, sufficient tax base, high industrialization, high levels of technology and
specialization, strong bourgeois and working classes, significant means of influence over non-
core nations, and relatively independent of outside control ( Barfield, 1997; Halsall, 1997).
Dependency theory was developed in Latin America to respond to a programme of the
UN known as the Economic Commission for Latin America (ECLA) which became bankrupt.
The theory is therefore ―a representation of the voices from the periphery that challenge the
intellectual hegemony of the American modernization school‖ to critique ―modernization
theory‘s assumptions about development and how to achieve it;‖ and a part of the response to the
deficiencies of modernization in theory and practice (Bodenheimer 1970; Dos Santos 1973;
Blomstrom and Hettne, 1984; Staniland, 1985; So, 1990; Haynes, 2008, p. 24). Modernization
Theory is critiqued for a number of reasons. The first argument against the theory is that it is a
Europeanization or an Americanization of the development discourse; that is, it has an attitude
toward Western Europe and the US as they are viewed to have unmatched economic prosperity
112
and democratic stability (Tipps, 1976). This idea of Western superiority is ethnocentric and
makes the theory fall between social policy and science, keeping one eye on society ‗as it really
is‘ and another on society ‗as it should be‘ (Stretton, 1987). Another argument against the theory
is that its assumption that the path from tradition to modernity is a phased process is not as
straightforward as the theory suggests. This assumption fails to take cognizance of the fact that in
many cases, social conflict is endemic and pervasive and also that, inequalities between and
within countries are sharpening; it further underplays issues of power inequalities within and
between societies (Morawetz, 1977; Webster, 1984). The theory is again critiqued on the
grounds that its arguments are formulated at a high level of abstractions to the extent that it is
difficult to know what country and what historical period are being discussed; its arguments are
anchored at a high level of generalization to the extent that its propositions are beyond time and
space limitations (So, 1990).
Specifically critiquing Rostowian take off approach, Frank (1971), from his dependency
theory perspective known as the development of underdevelopment argues that Rostow‘s
approach does not tally with ancient or current facts of existence as it is beyond the bounds of
possibility to see anywhere across the globe today a society which displays the features of
Rostow‘s traditional stage. Franks goes on to argue that Rostow‘s kind of traditional societies
had long broken down as a result of their inclusion in the world global capitalist system which
gives rise to a clear-cut focus on the nature and attributes of the disproportional interdependent
metropolis-satellite relationship under which the developing countries are stagnated and
exploited by the developed countries. Frank claims that Rostow fails by not examining this
association. Further to this Frank argues that the way the developing countries can escape this
economic stagnation and exploitation is by detaching themselves from the world capitalist

113
system through self-sufficiency, socialism and expanded trade with the progressive states which
generally referred to the socialist countries of Eastern Europe, especially, the Soviet Union at
that time. Frank notices from the historical experiences of Latin America that the economies of
the periphery countries grew, their level of manufacturing expanded, their conditions of living
became better, and their exports were variegated when their ties with the core countries were
weakened; examples being period Europe had internal problems such as the Second World War,
the Napoleonic Wars, and the great depression (Frank, 1970). Had the periphery countries been
left on their own, they could have initiated actions towards taking the usual route to capitalist
development as previously done by the core countries (Frank, 1974). In sum, the bedrock of
Frank‘s argument is that the possibility of the economic and human development of the
developed/industrialized countries of the world was as a result of the outrageous
underdevelopment of the developing countries. This means that the development of the periphery
is impossible, unless the strength of their links to the core is reduced or totally matching.
Dependency theory emphasizes that lack of development which include poverty in the
periphery nations is basically attributable to the forces of external/exogenous factors that stem
down from the core nations that exploit them (Frank, 1970; Wallestein, 1974; Clarke; 2002;
Willis; 2011). The theory simply focuses on the external forces of capitalism and colonialism.
Regarding capitalism, it is claimed that the backwardness of the periphery nations which was
progressively capitalist from the 16th
century is attributable to economic condition under which
there exists flow of economic surplus from them to the core nations, the effect of which is a
sharp inter-societal precedence where the dominant core develops and is more complex at the
expense of the periphery which is subordinated via the shift of economic plethora to the core
regardless of any economic changes that may occur (Frank, 1971; 1984; 1994; Rodney, 1972;

114
Hechter, 1975; Blomstrom and Hettne, 1984; Amin, 1987; Haynes, 2008). Corroborating this,
Amin (1976, p. 200) states that ―extraversion does not result from inadequacy of the home
markets but from the superior productivity of the centre in all fields, which compels the
periphery to confine itself to the role of complementary supplier of products for the production
of which it possesses a natural advantage.‖ Regarding colonialism, Rodney (1972) claims that
the intervention of European powers in the peripheral (particularly Africa‘s) social economic and
political processes throughout the 19th
century created a situation of dependency and led to the
poor state of the latter. This historical experience ―reversed the development of many advanced
periphery nations and forced them to move along the path of economic backwardness‖ as many
of these countries like China and India were making steady progress before they bumped into
colonialism (So, 1990, p. 96; Frank 1969). In other words, the historical experience resulted in an
―interdependent but unequal relationship established between colonizer and colonized‖ (Spybey,
1992, p. 225). This theory is critiqued on the premise that it overstates the negative influence of
the external forces of the core nations on the periphery nations as if they are the only factors that
are capable of deciding their fate without regard to their local resistance. Corroborating this,
Trimberger (1979, p. 128) identifies that such an exaggeration ―sees dynamic of system as
flowing completely from the centre. The periphery, whether originally in Europe or today in the
Third World countries, becomes a passive victim of capitalism from without.‖ The theory is
further critiqued on the premise that it fails to recognize a positive side to the effect of the
external forces of the core nations on the periphery nations, which is that they serve as the
opportunities that can be used by the peripheral countries to change their technologies, ideas, and
institutions. After all, ―all historical evidence points to the existence of certain degrees of
freedom for national government and their ability to carry out, under certain circumstances,
115
fairly drastic policies of internal and external transformation‖ (Portes, 1976, p. 79). It is noted by
the critics of this theory that development and dependency can indeed co-exist and dependency
may not lead to underdevelopment at all times (Warren, 1973) This position is exemplified by
former colonies of Japan, Taiwan and South Korea that have since the Second World War
attained rapid economic development; and also Canada which displays a standard of living
higher than that of most Third World countries despite the fact that it is ‗dependent‘ based on its
economy being permeated by foreign subsidiaries (So, 1990). Again, the theory is critiqued for
being highly abstract as it treats all the periphery countries as if they were same in its bid to lay
out the general design of dependency in Third World countries which is erroneous (So, 1990).
Both modernization and dependency theories of development independently stress the vital
aspects of development in the developing countries with each looking at the world via myopic
lens. Modernization theory focuses on internal political and economic factors of the developing
countries whereas the focal point of dependency theory is the purported effects of the restructure
of the global economic system on the developing countries. This suggests that in the
modernization discourse, for developing countries to attain development, it is a necessity for
them to migrate from tradition to modernity through the exertion of modernizing state structures
or presumed agents of modernization that has got the capability of completely changing
economic, political and social realities; whereas in the dependency discourse, internal factors are
deemphasized, emphasis is on the sinister effects imperialism and the international economic
system. This reflects a clear division or fragmentation between the two theories of development.
3.3.3 Perspectives of Development in the 1970s
In the mid-1970s when the ideological battle between modernization and dependency
theories began to dissipate, there emerged a variant of dependency theory known as world-

116
system theory whose main proponent was Immanuel Wallerstein. This theory has a lot of
similarities with dependency theory; it basically covers the same ground with dependency theory
in practice, and is often cited together (Petras, 1982; Barrett and White, 1982; Koo, 1984; Gills,
1995). Both dependency and world system theories ―stress the importance of considering
national economic development within a global context, rather than just concentrating on
individual countries,‖ also, both ―have a strong historical basis‖ (Willis, 2011, p. 80). However,
the main demarcations are that while the unit of analysis of dependency theory is the nation-state
just like the modernization theory, that of the world-system theory is the world system; also,
while the theoretical structure of the former is bimodal (core-periphery), that of the latter is
trimodal (core-semiphery-periphery); while the direction of development of the former is
deterministic, indicating the dependency is harmful, that of the latter implies ―possible upward
and downward mobility in the world economy;‖ and finally, while the research of the former
focuses on the periphery, that of the latter focuses ―on the periphery as well as the core, the
semi-periphery and the world economy‖ (So, 1990, p. 195). Semi-periphery nations refer to
nations which are midway between the core and periphery and with tendency of approaching
industrialization and a more diversified economy; they emerge from either the developing
peripheries or the declining cores (Halsall, 1997). They possess peripheral-like relations to the
core, exert control over some peripheries and act as intermediaries between cores and peripheries
thereby playing ―a key role in the functioning of the system‖ (Chirot, 1977, Barfield, 1997;
Halsall, 1997; Lechner, 2001; Hettne, 1995, p. 139). Countries like China, India, Brazil and
South Africa came under semi-periphery as at 2000; as at 2007, they included countries like
Malaysia, Turkey, Mexico, Saudi Arabia, United Arab Emirate and Tunisia (Dunn, Kawana and
Brewer, 2000; Babones and Alvarez-Rivadulla , 2007; Sheppard, et al., 2009). According to

117
Willis (2011), the countries of the semi-periphery are not fixed; over time, they are able to move
in and out of categories depending on their economic situations.
In the world-system theory discourse, Wallerstein (1974, p. 347) states that the world
system is a social system in which ―life within it is largely self-contained‖ and in which ―the
dynamics of its development are largely internal.‖ This ―implies an internalization of the external
factor‖ thereby solving a dependency theory ―problem of external versus the internal‖ (Hettne,
1995, p. 140). Wallerstein, (1976) insists that the modern world-economy is, and only can be, a
capitalist world-economy which is external/exogenous to the attainment of development of the
periphery; he goes ahead to state that capitalism has been able to wave about precisely because
of the world-economy that comprises a heap of political systems. Accordingly, it is claimed by
the theory that ―it is a function of the social organization of work, one which magnifies and
legitimizes the ability of some groups within the system to exploit the labour of others, that is, to
receive a larger share of the surplus‖ Wallerstein, (1976, p. 349). Therefore, in the world-system
perspective, ―the process of underdevelopment started with the incorporation of a particular
external area into the world system; i.e the peripheralization‖ (Hettne, 1995, p. 140). The only
agent of change in the theory is the core countries while the periphery countries are viewed as a
―pliable material in the hands of the all powerful imperialist nations‖ (Kiely 1995, p. 51). In its
classical form, this concentrates far more on the inevitability of external/exogenous factors with
respect to foreign investment or capitalism on the periphery (Sanderson, 2005).
In the 1970s, there emerged another perspective in the modern discourse of development
known as alternative or another development. From this perspective, development meant social
and economic development and human flourishing (Friedman, 1992). According to Nerfin
(1977), alternative development refers to the domain of Third System or citizen politics, which is

118
significant following the failed development efforts of government and market forces.
Alternative development is therefore defined by Nerfin (1977, p. 10) as ―need oriented (being
geared to meeting human needs, both material and non material to be off the poverty trap; as
endogenous (stemming from the heart of each society, which defines in sovereignty its values
and the visions of its future)‖; as ―self-reliant (implying that each society relies primarily on its
strength and resources in terms of members‘ energies and its natural and cultural environment);
as ecologically sound (utilizing rationally the resources of the biosphere in full awareness of the
potential of local ecosystems as well as the global and local outer limits imposed on present and
future generations)‖; and as ―based on structural transformation (so as to realize the conditions of
self-management and participation in decision-making by all those affected by it, from the rural
or urban community to the world as a whole, without which the goals above could not be
achieved.‖
The idea of alternative development can be traced to the Cocoyoc Declaration and the Dag
Hammarskjold Foundation Report What now? Another Development of the mid-1970s. A
prominent subject of the meeting of the Cocoyoc Declaration held in Cocoyoc, Mexico in 1974
was resources while the participants‘ main belief was that ―mankind‘s predicament is rooted
primarily in economic and social structures and behaviour within and between countries;‖ the
Declaration states that ―a process of growth that did not lead to the fulfilment of basic human
needs was a travesty of development‖ (Hettne, 1995, p. 176). It is further noted by Hetttne that
development is not all about basic needs such as freedom of expression, self realization in work
but also ―a need for the rich to reconsider over-consumptive types of development, violating the
inner limits of man and outer limits of nature‖ p. 176). As for the Dag Hammarskjold Foundation
Report of 1975 which was prepared on the occasion of the 7th
session of the UN General

119
Assembly, discussion was structured around three main elements which were that another
development should be ―geared to the satisfaction of needs, beginning with the eradication of
poverty;‖ it should be ―endogenous and self-reliant, that is, relying on the strength of the
societies which undertake it;‖ and it should be ―in harmony with the environment.‖ This shows
that ―another development requires structural transformations‖ and that ―immediate action is
necessary and possible‖ (Dag Hammarskjold Foundation Report, 1975, p. 28). In a nutshell, the
argument of the Declaration and Report is that development should be adjusted to the satisfaction
of some normative concepts such as basic needs, participation, self-reliance, and eco-
development; and should be in conformity with the environment (Hetnne, 1995; Pieterse, 2010).
Pieterse (2010, p. 85) refers to alternative development as ―development from below;‖ and
that ―below refers to both community and to NGOs.‖ This indicates that alternative development
is identified with the development by the community and NGOs. As for the NGOs as agents of
development, they engage in playing major roles on the ground and in development cooperation.
This is not to claim that the state has no role in development process; the role of the state within
the orbit of the alternative development discourse is that it acts as one who helps like a facilitator
or an enabler. It is therefore implied that a state should be characterized by democratization for it
to discharge such a responsibility.
Community consists of ―group of people with shared interests in some senses; usually
based on shared residential location like a village or urban district, but can also refer to a
community based on social identity‖ (Willis, 2011, p. 27). According to Mansuri and Rao (2004,
p. 9), we have Community Based Development (CBD) where communities ―use their social
capital to organize themselves and participate in development processes‖. They state further that
―the cornerstone of CBD initiatives is the active involvement of members of a defined

120
community in at least some aspects of project design and implementation;‖ and as for
participation, it ―can occur at many levels, a key objective is the incorporation of local
knowledge into the project‘s decision making processes‖ (p. 9). As actors in development,
communities enhance sustainability; improve efficiency and effectiveness; allow poverty
reduction efforts to be taken to scale; empower poor people, build social capital, and strengthen
governance; and complement market and public sector activities. Communities thus make
development more inclusive (Dongier, et al., 2003). As regards the NGOs, they are organizations
that are legally constituted and are independent from any government; they are created by either
a natural or legal person. In 2001, the number of internationally recognized NGOs was estimated
at 40,000 (Anheier, Glasius and Kaldor, 2001), this is likely to have increased now. Other
estimates given ranged between 26,000 and hundreds of thousands; as much as 30,000 NGOs is
claimed to exist in the State of Israel alone (Gidron, Bar and Katz, 2004, Nye, 2004). The
estimate ambiguity notwithstanding, NGOs have been ―involved in sustainable systems
development involving facilitating development by other organizations, both public and private‖
(Korten, 1987, p. 149). They ―can be very small scale organizations, or very large global
organizations,‖ they are not profit-making companies and they ―help local communities set up
projects to provide services, create income-generating opportunities, or improve social relations‖
(Willis, 2011, p. 27). NGOs function to allow ―aid agencies to claim that at least, some of their
activities benefit the poor.‖ Good intentions are asserted through the transfer of ODA to the
NGOs as they ―are viewed as political, socially accountable, and integrated into the communities
which they serve‖ (Thomas and Allen, 2000, p. 213). The NGOs‘ impact is ―highly localized and
often transitory‖ their ―many small-scale successes‖ notwithstanding (Edwards and Hulme,
1992, p. 13).

121
NGOs exist at both international and national levels. At the international level, there exist
both the ―campaigning‖ and ―charitable or service‖ providing types. Most of the former are
based in the Global North while a few are based in the Global South; ―they are epitomized, by
Greenpeace‖ and they ―only become involved in the development policy issues from a distance;‖
Tiers-Monde is a notable example of this type. The latter are based in the North with branches in
the South where they work; ―they run their own projects, sometimes setting up their own
bureaucracies, effectively bypassing the state‖ and they ―fund and monitor local service-
providing NGOs or membership organizations;‖ Oxfam, Save the Children, Christian Aid and
World Vision are notable examples of this type. At the national level, there exists the ―public
interest research or campaigning‖, ―indigenous, national and provincial service-providing‖, and
―membership‖ types. The first type are ―relatively few in number; have limited support;
represent the concerns of a particular group; and some may reflect the aspirations and social
demands of specific professions.‖ The second type are ―mostly concerned with welfare and rural
development; some aim at particular constituencies or interests; some adopt participatory style
and attempt to build up local membership; they work in partnership with international NGOs;‖
and they are ―essentially based on trust, charity and private initiative aimed at social and
development goals.‖ The third type ―exists to further their members‘ interests; may combine into
regional or national federations; and may originally be based on some local campaign‖ (Thomas
and Allen, 2000, pp. 211-212). The different types of NGOs are a confirmation that they ―are
simultaneously viewed as market-based actors and placed in central position as component of
civil society (Edward and Hulme, 1995, p. 849).
As helpful as NGOs are to development, they are not free from criticisms. According to
Shivji (2007, p. 84), "objective effects of actions‖ of NGOs as they steadily rise has a colouration

122
of neoliberalism more than that of pure unselfish motivations, thereby continuing the imperial
relationship between the rich and the poor countries of the world. Hallward (2011) refers to their
operations as the ―humanitarian face of imperialism.‖ Pfeiffer (2003) criticizes NGOs on the
premise that local primary health care efforts are undermined through the existence of NGOs and
on another premise that the ability of the maintenance of an agency to oversee a country‘s health
sector is taken away. Pfeiffer says that NGOs can be uncoordinated to a level at which aligned
projects among different organizations are created, the effect of which is the pulling away of
health service workers from their normal duties to get the interests of the NGOs served. One
other criticism of NGOs is on the ground that their design and use extend the usual foreign-
policy instruments of some countries of the global North (O'Connor, 2012). Most large NGOs
based in the global North such as Action Aid, Red Cross and Oxfam still export ―the ideologies
of their backers‖ (Bond, p. 321).
What alternative development is basically concerned with is to offer other practices and
redefine the goals of development. It is about local development with alternative or other
practices on the ground. From the alternative development discourse, it can be inferred that its
approaches are not totally distinct from the approaches of the modernization and dependency
theories as they share some key elements. For example, the endogenous process emphasized by
the alternative development approach is similar to the discussion of the modernization theory.
Also, the position of the alternative development approach which supports different societies
following their respective paths to development in consonance with their respective histories,
cultures, and ecologies bears certain resemblance to the discussion of the dependency theory.
However, while both modernization and dependency theories emphasize structural large-scale
economic change, alternative development emphasizes the capability of people to effect social

123
change or what can be simply referred to as people-centred or participatory approach to
development. This indicates that similar goals shared with these earlier theories of development
are pursued using diverse means. This has unfortunately culminated in the failure of the
alternative development approaches to emerge with ―a clear perspective on micro-micro
relations, an alternative approach, and a coherent theoretical position‖ (Pieterse, 2010, p. 85).
This is disadvantageous as without a defined theoretical underpinning, alternative development is
akin to a ship without a rudder. The normative concepts such as basic need, participation and
eco-development which the alternative development approach is characterized by are good
because unlike the economic growth perspectives which exhibits primacy of the form of
development over the content of development and the dependency perspective which does not
emphasize the meaning and purpose of development, they lay their emphases on the content of
development rather than the form of development. However, these normative concepts of
alternative development could be problematic as ―they become worn-out when reality remains
the same;‖ some concepts got replaced with new ones ―without much change in the basic
orientation; for example, ―eco-development was replaced with sustainable development‖ and
―basic needs were translated to human development, which was defined as a widening of
individual choices (Hettne, 1995, p. 175).
3.3.4 Perspectives of Development in the 1980s
In the modern discourse of development in the 1980s, development meant ―capacitation‖
and ―enlargement of people‘s choices‖ from the perspective of human development (Pieterse,
2010, p. 7). According to Kegley (2006, p. 360), human development refers to ―the extent to
which human‘s ability to develop to their individual potential is protected, so that they are
provided with sufficient schooling, income and opportunity to live full life.‖ Specifically, UNDP

124
(1996, p. 5) describes human development as ―a complex concept of development based on
priority of human well-being aimed at ensuring and enlarging human choices leading to greater
equality of opportunities for all people in society and empowerment of people so that they
participate in and benefit from the development process.‖ The idea of human development got its
inspiration from 1985 Amartya Sen‘s capabilities approach to development. Capabilities are ―the
alternative combinations of functionings that are feasible for an agent to achieve;‖ they are ―the
substantive freedoms he or she enjoys to lead the kind of life he or she has reason to value‖ (Sen,
1999, p. 87). The human development paradigm has got four essential components which are
―equity‖ which refers to the idea of fairness among people, that is, making people have equal
access to available opportunities without any form of discrimination; ―sustainability‖ which
refers to continuity of available opportunities in a manner that future generations will not be left
with fewer opportunities owing to the misuse of earlier opportunities by the earlier generations;
―productivity‖ which refers to building capabilities in people in a manner that they are
participants in the full income generation process; and ―empowerment‖ which refers freedom of
the people to make choices in a manner that influences decisions and development affecting their
lives‖ (Ul Haq, 1995, pp. 16-20). These pillars of human development indicate that human
development does not cover the rise and fall of national incomes or economic growth but also
covers the expansion of people‘s choices leading them to kinds of lives valuable to them; it also
covers improvement of human condition in a manner that affords them the opportunity of leading
full lives (Streeten, 1994).
The ―productivity‖ element of the human development sets it apart from the alternative
development paradigm; this suggests that Ul Haq‘s ―human development paradigm is identical to
the alternative development paradigm except that characteristically; It includes production as a

125
core value‖ (Pieterse, 2010, p. 105). Also, Pieterse states that while ―the bottom-line of human
development paradigm is the state, that of alternative development is ―local and social movement
activism‖ (p. 107). One fact that cannot be disputed between the relationship between human
development and alternative development is the role of the state. Within the orbit of human
development approach, a permissive viewpoint of the developmental role of the state is made
provision for; also, within the orbit of alternative development, developmental yardsticks such as
healthcare, infrastructure and education need the state for them to be implemented as such cannot
be exclusively left in the hands of non-state agents. Both paradigms cannot possibly be delinked
from each other as they portray a mixture of state, local and grassroot perspectives; as alternative
development cannot be delinked from the state, so also human development cannot be delinked
from an active local and civil society for it to be functional at both domestic and international
levels.
The dimensions of human development are broad and are understandable from different
angles. According to Haynes (2008, p. 12), from the political and economic angles, human
development revolves around ―stability, security and citizens‘ relative prosperity;‖ from the
social angle, it is concerned with ―literacy, education, social relationships and more vaguely the
quality of life;‖ from the moral angle, it relates to ―development of conscience, moral awareness
and the will and associated capacity to act according to societal and cultural knowledge of what
is judged to be right;‖ and from the psychological angle, it is related to ―mental health, self-
esteem, success in significant relationships, and human happiness.‖ Human development has
some key aspects which include the followings: ―incomes are means not an end; humans are
ends not means; humans are a virtually important resource; major focus on basic needs-type
goods and services; freedom to choose is given priority‖ (Haynes, 2008, p. 12). This is a clear

126
indication that ―the wellbeing of humankind is the essence of development‖ (Nayyar, 2006, p.
827).
With respect to human development, development is measured using a measure known as
the Human Development Index (HDI). From inception by the UNDP in 1990, the HDI has been
a very prominent composite index. This index is esteemed as it extends ―the economic concept of
welfare, but for many purposes it is more useful to focus on the individual components of the
index than the index itself‖ (Appleton and Teal, 1998, p. 2). The HDI was devised and launched
by two prominent economists; Mahbub ul Haq, a Pakistani and Amartya Sen, an Indian in 1990
(UNDP, 2012). It is a representation of an attempt to put a ―human face‖ on development via
operationalizing other indicators such as wellbeing, governance and participation; and it sheds
more light on how different government ―prioritize‖ development aims (Green, 2002, pp. 58;
59). Ultimately, ―the core of the concept is that it puts human at the centre, not incomes‖ as ―it
seeks to measure three main elements (life expectancy; education/literacy; and adjusted
incomes); and ―it works on the premise that people are the real wealth of a nation‖ (Haynes
2008, p. 12). The inclusion of these variables is an indication that the index has the ability to
―throw systematic light on the actual lives people lead, especially by the relatively deprived‖
(Sen, 2001, p. 73). Thus, the HDI, according to 2006 HDR indicates that the basic objective of
development is to create an enabling environment for people to live long, healthy and creative
lives (UNDP, 2006). The UNDP utilizes the HDI scores to divide or classify the world‘s
countries into ―Very High; High; Medium and Low Human Development‖ (UNDP, 2011, p.
127-130). HDR has a couple of merits; it ―goes beyond basic as it encompasses all nations, both
developed and developing;‖ it ―takes us further than physical condition to include institutional
and political elements‖; it ―seeks to tally up and assess individual country progress and, as a

127
result, improves upon the capacity approach;‖ and finally, it ―is significantly a political as well as
development agenda‖ (Hayne, 2008, p. 13).
These merits notwithstanding, HDI has been criticized based on a number of points.
Firstly, it is a repetitious measure that does not count up much to the worth of individual measure
it is made up of; also, it is a recreation of the cycle gauging the visible features of development
which have been earlier meticulously studied (McGillivray, 1991; Srinivasan, 1994); secondly, it
serves as a mode of giving legality to erratic measurements of not too many visible features of
social development (Rao, 1991); thirdly, it concentrates on an assumption that provision of
material amenities alone would bring about human development leaving out both material and
moral development (Basu, 2005); fourthly, it pays little attention to development from a global
perspective and it is characterized by possible imprecise categorization of countries in the
classifications of being a low, medium, high or very high human development country on the
premises of the measurement errors of the UNDP‘s fundamental formula and statistics changes
(Wolff, Chong, and Auffhammer 2011); and finally, it has no appropriate treatment of income
and lacks year-to-year comparability and assesses development differently in different groups of
countries; the HDRs are off-track pursuing its genuine vision, and the index falls short of
grabbing the significance of the world it pursues to represent (McGillivray and White, 2006;
Sagara and Najam, 1998). Human development, according to Haynes (2008, p. 13) ―is never a
finished process but a work-in-progress, a continuing attempt to evaluate humanity‘s current
condition.‖ Haynes goes ahead to state that ―it is also a normative attempt to outline the
priorities while also serving as a rallying cry for all those seeking humane alternatives.‖ One may
rightly conclude that this assertion by Haynes on human development is responsible for the
reason the HDI is the most frequently used to measure development.

128
There exists a link between human development and the MDGs. The MDGs embodies the
idea of human development and the HDI by reckoning with a number of indicators which
include adult literacy rate and life expectancy (UNDP, 2006). Corroborating this, UNDP (2003,
p. 143) states that human development is emphasized by the MDGs with respect to the
―elimination of poverty, provision of employment, the reduction of inequality and the
progressive realization and guarantee of human rights.‖
Also in the 1980s but through the 1990s, development meant ―economic growth‖ through
―deregulation,‖ ―liberalization,‖ and ―privatization‖ from the perspective of neoliberalism in the
modern development discourse (Pieterse, 2010, p. 7). According to Kegley (2006, p. 331),
neoliberalism refers to ―a perspective that accounts for the way international institutions promote
global cooperation and prosperity through reforms such as the creation of free markets and
acceptance of free trade.‖ Neoliberalism emerged in the 1930s from liberal scholars in Europe in
their attempt to mark the middle way between classical liberalism and collectivist central
planning that were not in agreement; its approach was in support of the promotion of a market
economy under a strong state‘s rules and guidance otherwise known as the social market
economy (Mirowski and Plehwe, 2009). After a heavy decline to the usage of term ‗neoliberal‘
in the 1960s, and following arguments by some theorists in the 1970s that the extensive
involvement of the state in economic activities led to slower economic growth rates and
incompetence and that leaving the market to its own design would achieve higher economic
growth, it got reintroduced in the 1980s in association with Chilean military regime of Augusto
Pinochet which took over government in 1973 and which launched a profound programme of
liberalization, deregulation, privatization, and tariff cutting (Petras and Vieux, 1990; Boas and
Gans-Morse, 2009; Willis, 2011. Neoliberal approach to development re-emerged during this

129
period because of the collapse of the state-led policies on development, the downturn of the
Soviet Union, and the revival of market ideas which all invigorate the conviction that free-
market policies were able to convey greater levels of economic growth, poverty alleviation, and
freedom much more than any other system (Greig, Hulme and Turner, 2007).
The main principles underpinning neoliberalism places stronger emphasis on market–
oriented growth or ―market fundamentalism‖ and ―minimal state‖ (Kay, 2004, p. 308). The
former refers to a condition where ―development is synonymous with sending the right signals to
the market through the deregulation of national economies, and international trade‖ (Greig,
Hulme and Turner, 2007, p. 104); that is, getting the price right and allowing market forces to do
their work. This allows for openness under which there exists a better favourable chance for
economic growth, more adept use of resources, and swap of technical knowledge. The latter
refers to condition where ―the state‘s role would be significantly reduced, opening way to a much
greater economic and developmental role for private capital‖ (Haynes, 2008, p. 30). In other
words, government should withdraw from direct involvement in economic activities which is
anathema to development as such involvement distorts the operation of market forces. The
implications of these principles, policy-wise are the creation of ―freer trade and fewer
impediments to free movement of factors of production and of firm;‖ meaning that ―an open
free–enterprise economy is the sine qua non of development‖ (Olson, 1982, p. 141; Norberg,
2003, p. 103). Neoliberalism is recognized to be associated with a higher rate of economic
growth than any other economic system (Christian, 1992; Hobsbawn, 2000). It is important to
state that the principles of the social market economy of the 1930s deviates from the current day
minimal state. The social market economy is preoccupied with a coordinated market economy
that supports state intervention in public enterprise to establish a fair competition between the
130
market and the state (Koppstein, Lichbach and Irving, 2005). This suggests that the state actively
implements regulative measures. As for the minimal state, it goes a step further by capturing the
respect of fundamental individual rights in its intervention in public enterprise to establish a fair
competition between the market and the state (Nozick, 1974). This suggests that the state is not
at liberty to monopolize the use of force to interfere with free transactions between people to
guarantee the fundamental individual rights of the people involved in such free transactions.
In summary, Kegley (2006, 44 - 45) lists the key units of neoliberalism as individuals,
penetrated states and non-state transnational actors; its core concern as one that involves
fostering interstate cooperation on the globe‘s shared economic, social and ecological problems;
its major characteristic is an approach that involves transnational interdependence and regimes;
its outlook on global prospects to revolve around expectation of cooperation and creation of
global community; motives of its actors as that which capture global interests (absolute gains),
justice peace, prosperity, liberty and morality; its central concepts as those that include
transnational relations, law, free markets, interdependence, integration, liberal republican rule,
human rights, and gender, and its policy prescriptions as those which involve developing regimes
and promoting democracy and multilateral international institutions to coordinate collective
responses to global problems. From the account of neoliberalism so far, it can be inferred that it
has a relationship with modernization theory as it maintains one of the theory‘s traditional
meanings of development which is economic growth; the main demarcation however, is that
neoliberalism supports reduction in the role of the state in development and an improved role of
the market in development. In short, neoliberalism changes the agency of development from the
state to the market, and the process of development from state-oriented to market-oriented. It can
also be inferred that neoliberalism has a relationship with the human development as a market-

131
based economic system is greatly enhanced by human development which allows for more
competition under a common humane atmosphere.
The exhibition of the tenets of neoliberalism was clearly evident in various structural
adjustment programmes (SAPs) in the 1980s and 1990s. SAPs was strongly underpinned by an
idea enunciated by Barber Conable who was the president of the World Bank between 1986 and
1991 that the best approach to achieving a type of growth that could cure poverty was to allow
for market forces and economic efficiency (Thomas and Reader, 2001). The best examples of
SAPs‘ philosophy in action are the administrations of Thatcher (UK) and Reagan (USA) which
adopted the market ideologies of which implementation ―demonstrates the ways in which
policies developed in the North could be imposed on Southern nations‖ (Willis, 2011, p. 56).
Introduction, implementation and consolidation of SAPs in the developing world by these two
leading international donor countries (UK and USA), Japan, and the main international financial
institutions (IFIs), such as the World Bank and IMF in the 1980s followed an extreme hike in the
oil prices and an attendant high rate of indebtedness for the developing world in the 1970s
(Haynes, 2008). SAPs, in line with the prescriptions of neoliberalism scaled down ―the
developmental role of the state and increased faith in the ability of the market forces and private
capitalists‘ economic efficiency to bring about to increased broad-based economic growth‖
(Haynes, 2008, p. 38). Unfortunately, results produced by the implementation of SAPs was
highly disappointing as it was unable to lessen developmental inequalities and poverty; measures
of SAPs ―certainly did not lead to poverty reduction,‖ neither did it improve human welfare
despite of its achievement of economic stabilization (Stiglitz, 2006; Mcllwaine, 2002, p. 99;
Simon, et al., 1995). The downsizing of the state culminated in lack of safety nets and any form
of assistance the down and out and the most vulnerable (Cornia, et al., 1987). The effects of

132
SAPs went from bad to worse to the extent that there was an extensive demand for reforms to
subdue financial markets, scale down the single global market and upsize the state (Pettifor,
2003; Patamiko and Tievanen, 2006).
Neoliberalism has been criticized on the premise that it brings about adverse economic
consequences under which its policies bring about inequality with the gap between the richest
and the poorest 20 percent continuing to widen during the last 20th
century decades (Pieterse,
2004; Chang and Grabel, 2004); the focus of these policies on economic growth relegates
growing inequality to the background. This does not align with Wolf (2005) and Norberg (2003)
which claim that both the rich and the poor are assisted by economic growth. Neoliberalism has
also been criticized on the premise that its downsizing of the state roles in the development
process and substituting it by upsizing the roles of the market through competitive private
companies which takes off the efficiency accruable from the economy of scale (Katter, 2012);
and on the premise that wealth distribution process under neoliberalsm promotes exploitation and
social injustice as its process naturally benefits the upper class courtesy of shift in the state and
economic policies which heighten corporate power (Wolff, 2012). It is important to acknowledge
that while there is a clear positive link between growth and poverty reduction, the impact of the
distribution of income on this link is particularly less clear even at a point where higher
inequality lessens the reduction in poverty generated by growth. The effect growth has in poverty
reduction is determinable by initial levels of inequality. To buttress this, Ravallion (2007)
estimates that it is possible for a one per cent increase in income levels to result to a 4.3 per cent
decline in poverty in countries with very low inequality or as little as a 0.6 per cent decline in
poverty in highly unequal countries. It is equally important to acknowledge that it is not a
compulsion that growth leads to increased inequality. A recent common position suggests that

133
there exists no consistent relationship between inequality and changes in income as this is
evidenced in the experiences of developing nations between the 1980s and 1990s which suggest
that the chance of growth being accompanied by increasing or decreasing inequality is roughly
equal (Ravallion, 2001).
3.3.5 Perspective of Development in the 1990s
In the 1990s, development meant ―illusion‖ from the perspective of postdevelopment
(Greig, Hulme and Turner, 2007, p. 252). Postdevelopment approach is a radical response to the
crisis of development; it arose following a realization that the attainment of middle-class life for
most of the people of the world is impracticable (Dasgupta, 1985). In his own account, Esteva
(1992), development starts off as a Western concept long used by the Western powers with
respect to colonialism `which is characterized by the domination of the South by the North.
Corroborating this, Kothari (1988, p. 143) states that ―where colonialism left off, development
took over.‖ In his postdevelopment discourse, Sachs (1992, p. 1) states that ―the idea of
development stands in ruin in the intellectual landscape;‖ he goes ahead to state that ―delusion
and disappointment, failures and crimes have been steady companions of development and they
tell a common story: it did not work.‖ Further discrediting the term development, Sachs states
that ―the historical conditions which catapulted the idea into prominence have vanished:
development has become outdated‖ and that ―above all, the hopes and desires that made the idea
fly, are now exhausted: development has grown obsolete‖ (p. 4). Development is described by
Sachs as ―amoeba-like concept, shapeless but ineradicable, with no contours, so blurred it
denotes nothing‖ (p. 4). Arturo Escobar, the most famous postdevelopmentalist sees
development as a kind of external norm of Eurocentrism and colonialism imposed on the poorer
countries of the South by the richer countries of the North and their institutions in the post
134
Second World War period of which should be confronted from the grassroot level to put an end
to an unequal Western-dominated rhetoric that refuses the grassroot level approach (Escobar,
1995). This Eurocentric domination has ―destroyed indigenous cultures, threatened the
sustainability of natural environments and has created feelings of inferiority among people of the
South‖ (Willis, 2011, p. 32). Escobar does not pitch his tent with any form of alternative
development because most of the efforts put into such forms of alternative development ―are also
products of the same worldview which has produced the mainstream concept of development‖
(Nandy, 1989, p. 270). Postdevelopment approach rejects development because it is new religion
of the West; it is the imposition of science as power; it does not work; it means cultural
Westernization and homogenization; and because it brings environmental destruction (Rist,
1990; Nandy, 1998, Kothari, 1998; Constantino, 1985 cited in Pieterse, 2010). This is a clear
indication that postdevelopment does not only probe the means by which development is
achieved but the whole concept of development as comprehended in the Eurocentric discourse.
Postdevelopment supports a condition under which indigenous people of the South are
―able to choose the way they want to live without being made to feel that they are somehow
inferior or backward by not following patterns that has been adopted elsewhere‖ or imposed on
them by the North (Willis 2011, p. 32; Maiava, 2002). Therefore, participation should be key to
development under which the focal point should be the views and actions which should be given
priority in policy development rather than considering and attempting development at the global
scale (Esteva and Prakash, 1997). Clear-cut Western solutions to development problem in the
Southern countries is refuted by Esteva and Prakash (1998), Escobar (1995), and Sachs (1992);
they completely say no to universal rationality, modernization, Westernization, capitalism,
industrialization and technology. In place of these, they prescribe that the key to good life in

135
modesty and economizing which involves meeting basic needs from local sources should be
established. Quality of life should thus be advanced in a bottom-up process driven by social local
movements. In summary, the main actors of postdevelopment are the grassroot, organizations
and individuals; its scale is a very small scale; its definition of development is that it is a
dangerous, Eurocentric concept that destroys local cultures and environment; and its description
is that it focuses on grassroot activities and local level participation (Willis, 2011, p. 225). From
the account of postdevelopment so far, it can be inferred that it has a relationship with
dependency theory as it bears resemblance with its faith in endogenous development. However,
while dependency theory‘s main actor is the nation-state, that of postdevelopment is the
local/grassroot autonomy. It can further be inferred that postdevelopment has a relationship with
the alternative development approach as it bears resemblance with its focus on self reliance; the
main demarcation between the two is that postdevelopment rejects development outright while
alternative development does not.
Postdevelopment has been criticized based on a number of reasons. The idea that
development is an illusion is challenged based on the premise that progress is real, progresses in
science, technology, medicine, improved living standards, and decrease in the percentage of
people living in extreme poverty have ―been real and sustained; this claim is accurate ―as long as
it is not taken to be a claim of perfection‖ (Riggs, 2003; Sachs, 2005, p. 252). Postdevelopment
is also criticized on the premise that it fails to proffer solution to or offer concrete actions to the
development problems such as poverty and inequality; it is therefore worrisome and worrisome
that postdevelopment approaches with all their sharp rejection of the concept of development are
mere replica of ―studies that cry out for some proposal of what to do in desperate situations
suddenly ending where they should propose or call safely for further research‖ (Peet, 1999, p.

136
193). Specifically criticizing Escobar‘s idea of sharp rejection of the concept of development,
Willis (2011) states that his ―influential study is based largely on the policies in Colombia in the
1950s and 1960s;‖ further to this, Willis states that ―rather than recognizing the diversity and
dynamism of development theorizing and practice, much postdevelopment analysis has drawn on
a stereotypical image of how development has been defined and implemented‖ (p. 232). These
criticisms notwithstanding, postdevelopment approaches have so far functioned to contest some
long-held assumptions which revolve around the nature of development. In line with this, Rapley
(2002, p. 16) states that ―if postdevelopment theory fails to provide answers to the pressing needs
of today‘s Third World, it remains useful for the questions it raises.‖
3.4 The Millennium Development Goals (MDGs)
3.4.1 A Brief Description of the MDGs
In history, development has meant different things from different perspectives including
modernization theory in the 1950s; dependency theory in the 1960s; world system theory and
alternative development in the 1970s; human development in the 1980s; neoliberalism in the
1980s through the 1990s; and postdevelopment in the 1990s (see chapter three for discussions on
the perspectives of development over time). From the 2000s, the focus of development policies
has been on the eradication of global poverty from the perspective of the MDGs. The prevailing
intensity of the incidence of poverty across the globe led the General Assembly of the UN on the
18th
day of September, 2000 at a Millennium Summit to adopt a Resolution 55/2 known as the
United Nations Millennium Declaration (UN, 2000a). The declaration sets out a bold vision,
uniting ―larger freedom‖ and human development recognizing that although, individuals freedom
matters, people are restricted in what they can do with that freedom if they are poor, ill, illiterate,
discriminated against, threatened by violent conflict or denied a political voice (Poku and

137
Whitman, 2011). According to Bertucci and Rosenbaum (2007, p. 7), the declaration is
obviously ―one of the boldest, indeed probably the boldest, initiative ever undertaken by any
multi-national organization to improve the human social and economic condition.‖ This set the
stage for the promotion of the eight different goals known as the Millennium Development Goals
(MDGs) of which targets were adopted in 2001. These international goals ―are the world‘s
biggest promise – a global agreement to reduce poverty and human deprivation at historically
unprecedented rates through collaborative action;‖ and this is perhaps the most significant step in
the war against poverty (Hulme, 2009, p. 4; Davidson and Esubalew, 2009). The MDGs have
further been described as ―the world‘s most comprehensive time-bound set goals designed for
addressing poverty in its many dimensions - namely income poverty, disease, lack of adequate
shelter and exclusion, while promoting gender equality, education, and environmental
sustainability.‖(UNMP, 2005, p. 1).
According to the UNDG (2003), ERD (2008), UN (2008a; b; 2010), ITU (2011), and
World Bank (2011a), the first goal is to eradicate poverty and hunger; the second goal is to
achieve universal primary education; the third goal is to promote gender equality and empower
women; the fourth goal is to reduce child mortality; the fifth goal is to improve maternal
mortality; the sixth goal is to combat HIV and AIDS, malaria and other diseases; the seventh
goal is to ensure environmental sustainability; and the eighth goal is to develop a global
partnership for development (see appendix 7 for complete goals, targets and indicators of the
MDGs). The prospects of the MDGs, according to Poku and Whitman (2011), cannot be reduced
to the sum of the eight goals, divorced from international dynamics, the hard interests of states
and the global dynamics that affect both, or from the complexities and intractability of
widespread poverty and consequences. The central idea of these goals is to improve both the
138
economic and social conditions of the very poor countries across the globe to generate
development. At Monterrey, Mexico in 2005, the international commitment to achieve the
MDGs was reaffirmed by all member states of the UN (INAFI, 2010). The MDGs thus constitute
a normative consensus in the development community of the beginning of the 21st century (Ziai,
2011). In general, the idea of the international community is that development is achievable by
―developing a holistic approach to development that stresses the linkage between security, good
governance and economic development;‖ suggesting that ―development can only be achieved in
a secure and democratic environment, conducive to long-term investments‖ (Bagoyoko and
Gibert, 2007, p. 9). The MDGs closely link development and poverty reduction in that they are
committed to sparing ―no effort to free fellow men, women and children from abject and
dehumanizing conditions of extreme poverty‖ and ―making the right to development a reality for
everyone and to freeing the entire human race from want‖ (UN, 2000b, p. 4). The MDGs support
making core investments in infrastructure and human capital which enables the poor to make full
use of them wherever they are domiciled; this evidences a construction of a harmonious,
mutually reinforcing relationship between poverty and economic growth (Anan, 2005; World
Bank, 2000a). With these descriptions of the MDGs, it follows that to achieve the goals, strong
political will from national leaders is required and simultaneously, citizens‘ participation is a
prerequisite for developing and developed countries by holding their governments to account to
fulfil their pledges (INAFI, 2010). To guarantee poverty reduction and promote global
prosperity for all, primary responsibility should be recommitted by developing nations for their
own development by strengthening governance, combating corruption, and putting in place the
policies and investments to drive private-sector led growth and maximizing domestic resources
to fund national development strategies (UNMP, 2005).

139
To ensure the implementation of the MDGs in poorer countries, richer ones have been
providing aid. For example, since 2000, the vast majority of European Commission general
budgetary allocations have been for the support of African, Caribbean and Pacific countries. The
European Union (EU) as a whole, including its member states, contributes around 60 percent of
global Official Development Assistance (ODA). The European Commission Development
Programme allocated €51 billion for the period 2007–2013, making it a critical player in global
efforts to achieve the MDGs (Alliance 2015, 2008). In general, the ―European states have shown
a keen interest in Africa‘s political and economic development throughout the postcolonial era‖
(Gibert, 2007, p. 107). The MDGs are fashioned on the belief that poverty in the poorest
countries can be dramatically reduced only if developing countries put in place well-designed
and well-implemented plans to reduce poverty. According to UNMP (2005), world poverty can
be effectively reduced if a number of quick wins approaches are followed which include: access
to information on sexual and reproductive health; action against domestic violence; appointment
of government scientific advisors in every country; deworming school children in affected areas;
provision of drugs for AIDS, tuberculosis, and malaria; phasing out of school fees; ending user
fees for basic health care in developing countries; provision of free school meals for
schoolchildren; legislation for women‘s rights, including rights to property; tree planting;
provision of soil nutrients to farmers in SSA; provision of mosquito nets; access to electricity,
water and sanitation; support for breast-feeding; training programs for community health in rural
areas; and upgrading slums, and providing land for public housing. Implementation of the MDGs
was guided by the Poverty Reduction Strategy Papers (PRSPs) for achieving the goals. The
formulation of PRSPs‘ requires quick and correct understanding of its many technicalities,
theoretical foundations, scope and contents and processes as in preparing it, capability of

140
different interpretations is not unlikely (Hunter, May and Padayyachee, 2003). The formulation
of PRSPs globally is not a new invention; the new things on board are both the MDGs and the
MDGs-based PRSPs. Before the emergence of the MDGs, both the World Bank and the
International Monetary Fund (IMF) were at the vanguard of promoting poverty reduction
strategy programme in many developing countries including Nigeria and went far with
developing methodologies for PRSPs. So, it is an incontestable fact that PRSPs have got their
origin in SAP. No thanks to the failures of SAP in many African countries including Nigeria
which informed the first set of PRSPs. This is a major factor as to why PRSPs are not fully
acceptable (Craig and Portel, 2001; Hunter, May and Padayyachee, 2003). In some countries,
their PRSPs are known as Poverty Reduction Strategy Process (PRSP) instead of Poverty
Reduction Strategy Paper that it originally meant.
The MDGs have been criticized for a number of reasons. One such criticism is on the
premise that the chosen objectives of the MDGs have no analytical power and justification. In
relation to the poorer countries of the South, the MDGs have no strong objectives and indicators
for within-country equality in spite of their fundamental disparities (Deneulin and Shahani, 2009;
Kabeer, 2010). According to Easterly (2009), the way the targets and indicators of the MDGs are
designed is unfair to poor countries, particularly Africa countries as basing the measurement of
changes on proportion makes it very difficult for these countries to progress. Easterly further
states that if in Latin America, the rate of poverty is halved from 10 percent to 5 percent, and the
rate is cut from 50 percent to 35 percent in Africa, it means that the former has more progress
representing 50 percent poverty reduction against the latter that has 30 percent poverty reduction.
Another criticism is on the basis that the mechanism of using external innovations supported by
external financing to get local change introduced is inadequate. This could have been
141
alternatively achieved with the use of community initiative, building from resources of solidarity
and local growth within existing cultural and government structures (Rodrik, 2008; Marglin,
2008). The MDGs have also been criticized on the premise that the process involved fails to
make an inclusion of the voices of those they aim to assist as the creational process of the MDGs
has little involvement of developing countries and civil society constituencies (Kabeer, 2005;
Waage, et al., 2010). According to Amin (2006), the United States (US), Europe and Japan drove
the overall creation process of the MDGs with co-sponsorship from the World Bank, IMF and
the Organisation for Economic Co-operation and Development (OECD). This according to
Fukuda-Parr (2010) makes the MDGs framework to suit the interests of these rich states and
institutions. The MDGs have also been criticized on the ground that they are unrealistic and
overambitious as limited local capacities with particular respect to missing capabilities of
governance are neglected by the goals (Oya, 2011). Another account criticizes the MDGs on the
ground that they are less ambitious when they are considered against the sheer volume of basic
human needs not met (Barnes and Brown, 2011). For example, the less ambitious characteristic
of the MDGs reflects in the first MDG which aims to eradicate extreme poverty and hunger
when juxtaposed with the 1996 World Food Summit‘s goals on poverty alleviation; rather than
aiming to halve the proportion of people suffering from extreme poverty and hunger, the MDGs
should have aimed to halve the absolute numbers of people suffering (Pogge, 2004). The failure
of the MDGs in Low Income Countries (LICs) and Middle Income Countries (MICs) is
attributed to the over-ambition of the goals for some countries and the non-challenging stance of
the goals for other countries (Langford, 2010). The MDGs are again criticized on the premise
that its contents exclude political and human rights. According to Ziai (2011), the contents of the
MDGs‘ targets suggest that the problems to be tackled are technical rather than political; which

142
further suggests that the solution solely lies on increasing financial resources. An inclusion of
human rights orientation within the MDGs‘ framework could have positively impacted on the
monitoring and co-functions of the MDGs‘ targets (Cecchini and Notti, 2011). One last criticism
of the MDGs is based on the ground that with respect to the implementation of the MDGs, the
data are not readily available and most available ones are not reliable which put the progress
reports of the MDGs into question as they are difficult to interpret (Sachs, 2012; Dar and Khan,
2011; Reddy and Heuty, 2008). For example, in LICs, reports on global MDGs‘ targets are
founded on limited and insufficient evidence of feasibility (AbouZahr and Boerma, 2010); also,
from 1990, the health-related baselines are founded on inaccurate and undependable household
surveys that have no information on health records/statistics, and death and birth
records/statistics (Attaran, 2005).
The criticisms of the MDGs notwithstanding, they have got their strength in an assertion
that they represent an ―important frame of reference ―through which a more ―decent and fairer‖
world can be built (ILO, 2004, p. 106; Sachs, 2005, p. 210). This is sensible because challenges
in development always need an ―overarching framework‖ like the MDGs with which global
energy can be well coordinated (Shetty, 2005, p. 28). Shetty (2005) and Vandemoortele (2005)
claim that another visible strength of the MDGs is their quantitative targets whose attainment or
non-attainment can be more rigorously monitored.
3.5 The Links between Perspectives of Development and the MDGs
There exist some links between modernization theory and the MDGs. The MDGs
discourse seemingly aligns with the principles of modernization theory as two terms associated
with the theory namely big push and poverty trap were consistently used in the 2005 United
Nations Millennium Project report directed by Jeffrey Sachs. The report emphasizes that it is the

143
poverty trap and not bad government that is associable with the poor growth of Low Income
Countries and their negative progress towards the attainment of the MDGs (UNMP, 2005). It
goes on to state that ―a big push of basic investments between now and 2015 in public
administrations, human capital (nutrition, health, education), and key infrastructure (roads,
electricity, ports)‖ may offer solutions to the poverty trap (p. 19). According to Easterly (2006),
MDGs initiative is imbued with ideas from Rostow‘s modernization theory of the 1950s as the
call for big push in donor aids by leaders across the globe has been loud; and national and
centrally harmonized plans have apparently been prevailing over grassroot projects. In line with
this, UNDP (2005) states that ―aid provides governments with a resource for making the multiple
investments in health, education and economic infrastructure needed to break cycles of
deprivation;‖ and that ―without a sustained increase in aid, the MDGs will not be achieved‖ (pp.
4, 76). Further showing the relevance of modernization theory to the MDGs, Sachs (2005)
advises that if there was a big push in 2005, it would take countries off the poverty trap to enable
them meet the targets of the MDGs through which a self sustaining growth could be achieved by
2025.
Another term associable with modernization theory that is prominent in MDGs discourse
is takeoff. Easterly (2006, pp. 4-5) further emphasizes that ―the positive outcome of escaping a
poverty trap is a takeoff,‖ and that ―judging by old and new language, a big push involves a
combination of (1) a big increase in foreign aid, (2) a simultaneous increase in investment in
many different sectors, (3) with the consequence that poor countries escape from a ―poverty
trap‖ and have a rapid acceleration of growth (a takeoff). It is claimed by UNDP (2003) that
poverty reduction has to with critical thresholds of human and economic development suggestive
of Rostow‘s preconditions for takeoff being reached. The impetus to attain ―takeoff to sustained

144
economic growth‖ is produced by thresholds ―of health, education, infrastructure and
governance‖ (p. 18). Further to this, in line with Rostow‘s positive belief, UNDP (2003)
emphasizes that takeoff is achievable ―within a generation‖ (p. 178). Greig, Hulme and Turner
(2007) write that within the framework of the MDGs, donor assistance and foreign investments
act as important components of reversal of the vicious circle via the provision of the financing
for takeoff in the economic sense.
There exist some links between dependency theory and the MDGs. The MDGs discourse
seemingly aligns with principles of dependency theory. According to UNMP, (2005, p. 212),
historical experience reveals that the global trading system did serve ―the interests of developed
countries‖ at the expense of the poorer countries. The MDGs framework is suggestive of a claim
that the ―history relations between the richer and the poorer countries has involved hindering
development rather than assistance‖ with the exception that ―the framework departs from more
radical dependency theories in its rejection of the claim that exploitation is inherent within the
process of capitalist development‖ (Greig, Hulme and Turner, 2007, p. 160). UNDP (2003, p.
145) states it clearer that ―poor countries face constraints that can only be eased through policy
changes in rich countries.‖ Even at a state of developing, the structural position of the poorer
countries ―operates against catching up with the wealthiest nations, especially as the market
rewards the most efficient‖ (Greig, Hulme and Turner, 2007, p. 160).
There exists a link between human development and the MDGs. The MDGs embodies the
idea of human development and the HDI by reckoning with a number of indicators which
include adult literacy rate and life expectancy (UNDP, 2006). Corroborating this, UNDP (2003,
p. 143) states that human development is emphasized by the MDGs with respect to the

145
―elimination of poverty, provision of employment, the reduction of inequality and the
progressive realization and guarantee of human rights.‖
There exist some links between neoliberalism and the MDGs. The MDGs seemingly align
with neoliberalism as they are founded in the economic growth model of the neo-liberal theory,
which emphasizes that the long term poverty reduction requires sustained economic growth,
which in turn depends on technological advancement and capital accumulation (Odusola, 2006).
In line with this, Heeks (2005) argues that the MDGs arose as a counter-blast to the perceived
failure of the neoliberal agenda – the one favouring markets, the private sector, and globalization
to deliver for the world poor. The MDGs appear to be a better option for poverty because while
the standard formulae in neoliberal discourse is globalization which is assumed to inevitably
bring huge opportunities and benefits;‘ the key MDGs documents present global economic
liberalization as a potentially beneficial force, having put into consideration the costs and the
even distribution of the benefits of globalization (Ziai, 2011).
3.6 Progress of the MDGs’ Targets on Global Poverty Reduction
According to the World Bank (2011d, p. 15), ―75 percent of countries in East Asia and
Pacific, 75 percent of countries in Europe and Central Asia, 59 percent of countries in Latin
America and the Caribbean are on target to achieve the MDGs‘ targets on poverty reduction‖ by
2015; also, ―19 percent of countries in South Asia and 35 percent of countries in SSA are on
target to achieve the MDGs‘ targets on poverty reduction‖ by 2015. On the basis of the recently
updated projections, the overall poverty rate is still expected to decline below 15 percent by
2015, indicating that the MDGs‘ targets on poverty reduction can be met. This is as a result of
the fastest growth and sharpest reductions in poverty consistent in Eastern Asia, particularly in
China, where the poverty rate is expected to fall to below 5 percent by 2015 and India where

146
poverty rates are projected to fall from 51 percent in 1990 to about 22 percent in 2015. Between
1990 and 2005 in these countries, the number of people living in extreme poverty reduced by
about 455 million, and expected to join their ranks by 2015 is an additional 320 million people
(World Bank, 2011d).
The first target of the MDGs on poverty reduction which has to do with halving between
1990 and 2015, the proportion of people whose income is less than US$1 a day; this used to be
the common international poverty line in the past. Poverty line or threshold refers to the
minimum level of income considered appropriate in a particular country (Ravallion, 1992). The
international poverty line was adjusted to US$1.25 at the 2005 Purchasing-Power Parity (PPP)
by the World Bank in 2008 (Ravallion, Chen and Sangraula, 2009). In the developing countries,
the number of people living on less than $1.25 a day was reduced from about 1.8 billion in 1990
to 1.4 billion in 2005 courtesy of the ―robust growth in the first half of the decade.‖ The
―corresponding poverty rate‖ simultaneously ―dropped from 46 percent to 27 percent.‖ The 2008
economic and financial crisis of the Global North and the World Bank projection that it was
expected to push an estimated 64 million more people into extreme poverty in 2010
notwithstanding, ―current trends suggest that the momentum of growth in the developing world
remains strong enough to sustain the progress needed to reach the global poverty-reduction
target.‖ As adjusted by the World Bank in 2008 however, even if these positive trends
continued, in 2015, roughly 920 million people would still be living under the international
poverty line of $1.25 a day (UN, 2011a, 6-7). According to World Bank (2011d, pp. 18-19), 17
‗lagging countries‘ across the globe are close to the target of halving the number of people in
extreme poverty by 2015; 67 are far from the target of halving the proportion of people in

147
extreme poverty by 2015; while 96 are off the target of the target of halving the number of
people in extreme poverty by 2015.‖
In relation to achieving the second target of the MDGs on poverty reduction which has to
do with achieving full and productive employment and decent work for all, including women and
young people ―the employment-to-population ratio dropped from 56.8 percent in 2007 to 55.4
percent in 2009, with a further drop to 54.8 percent in 2010‖ in the Global North. Without
capturing the Caucasus and Central Asia and Eastern Asia in the Global South, ―the estimated
employment-to-population ratio in 2010 has changed little since 2007.‖ Based on the available
data, the estimate of ―the vulnerable employment rate remained roughly the same between 2008
and 2009, both in developing and developed regions;‖ also, the rate of vulnerable employment
increased in ―Sub-Saharan Africa and Western Asia.‖ Going by the figures captured by the
International Labour Organization (ILO), ―one in five workers and their families worldwide were
living in extreme poverty (on less than $1.25 per person per day) in 2009 which ―represents a
sharp decline in poverty from a decade earlier, but also a flattening of the slope of the working
poverty incidence curve beginning in 2007.‖ This 2009 estimated rate represents ―1.6 percentage
points higher than the rate projected on the basis of the pre-crisis trend.‖ Though, "a crude
estimate, it amounts to about 40 million more working poor at the extreme $1.25 level in 2009
than would have been expected on the basis of pre-crisis trends‖ (UN, 2011a, pp. 8-10).
The last target of the MDGs on poverty reduction has to do with halving, between 1990
and 2015, the proportion of people who suffer from hunger. According to HTF (2003, p. 33),
hunger is ―a condition, in which people lack the basic food intake to provide them energy and
nutrients for fully productive lives.‖ Food poverty refers to the inability to acquire or consume an
adequate quality or sufficient quality of food in socially acceptable ways, or the uncertainty that

148
one will be able to do so (Riches, 1997). It has been consistently revealed by research that
―nutritional status is related to income; that is, the poorer you are, the worse your diet‖ (Dowler,
Turner and Dobson, 2001, p. 2). In other words, ―those who are better off are more likely to eat
healthier diets than those who are poorer, to grow better infants and young children, and to be a
healthier body size when adult‖ (Dowler, 2008, p. 34). UN (2011b) reports that in the
developing world, ―the proportion of people who went hungry in 2005-2007 remained stable at
16 percent, despite significant reductions in extreme poverty.‖ On the basis of this trend
including the economic crisis and rising food prices, ―it will be difficult to meet the hunger-
reduction target in many regions of the developing world;‖ and going by the flows noticed in
South-Eastern Asia, Eastern Asia, Latin America and the Caribbean, ―they are likely to meet the
hunger-reduction target by 2015;‖ though, there exist wide disparities among countries in these
regions (p. 11). As for SSA, on the basis of the current trends, it ―will be unable to meet the
hunger-reduction target by 2015‖ (p. 12). According to UN (2010, p. 1), there is decline in the
proportion of people suffering from hunger; this is however at an ―unsatisfactory pace;‖
and irrespective of the fact that the number of people globally suffering from malnutrition and
hunger has reduced since the early 1990s, ―progress has stalled since 2000-2002.‖ UN (2010)
further reports that the figure captured by the Food and Agriculture Organization (FAO) as the
estimate of the number of people who will suffer chronic hunger in 2011 is "925 million, down
from 1.023 billion in 2009, but still more than the number of undernourished people in 1990
(about 815 million)." Approximately "one in four children under the age of five was underweight
in the developing world, down from almost one in three in 1990" and "between 1990 and 2009,
the proportion of children under age five who are underweight declined from 30 percent to 23
percent in developing regions‖ (p. 13). As for Eastern Asia, Latin America, the Caribbean, and

149
the Caucasus and Central Asia, they ―have reached or nearly reached the MDGs‘ target, and
South-Eastern Asia and Northern Africa are on track" (p. 13). Overall, this is not sufficient to
reach this MDGs‘ target on poverty reduction by 2015. In developing regions, "the proportion of
underweight children under five declined from 31 percent to 26 percent between 1990 and
2008;" this is with particular success in Eastern Asia, notably China (UN, 2010, p. 1). These
improvements notwithstanding, progress is currently not fast enough to reach the MDGs‘ target,
and particular focus is required in Southern Asia, a region that accounts for almost half the
world‘s undernourished children. In these regions, children in rural areas are almost two times as
likely to be underweight as those in urban centres. For the developing world, the figure captured
as the new estimate of the average prevalence of undernourishment in 2006-2008 is 15 percent.
If compared to the figure captured by the estimate for 2005-2007, it is slightly different. Going
by this, it follows that the average number of people suffering from lack of adequate food over
the three years remained discomfortingly high at 840 million worldwide (UN 2011a, pp. 11-13;
UNDP, 2011). According to World Bank (2011d, pp. 18-19), 9 ―lagging countries‖ across the
globe are close to the target of halving the number of people suffering from hunger by 2015; 35
are far from the target of halving the proportion of people suffering from hunger by 2015; while
60 are off the target of halving the proportion of people suffering from hunger by 2015.
Coming to the overall poverty rates, the level of achievements recorded in the poverty
reduction targets of the MDGs is as a result of extraordinary success in Asia, mostly East Asia.
The poverty rate in East Asia fell from nearly 60 percent to under 20 percent over a 25-year
period. By 2015, poverty rates are expected to fall to around 5 percent in China and 24 percent in
India (UN, 2010). In SSA, little progress has been made to alleviate extreme poverty; here, the
poverty rate has declined only slightly, from 58 to 51 percent between 1990 and 2005. SSA,

150
Western Asia and parts of Eastern Europe and Central Asia are the few regions not expected to
achieve the MDGs‘ poverty reduction targets (UN, 2010). On the basis of the recent economic
growth performance and forecasted trends, the extreme poverty rate SSA is expected to fall
below 36 percent (World Bank, 2011d). Some other pieces of information suggest that very few
of the MDGs will be achieved in the region within the stipulated time (Rispel and Nkibua, 2011).
According to McGillivray (2008), UN (2009a), and UNECA (2005), with the current trend,
SSA is not in the right position to attain the MDGs goals for the reduction of extreme poverty
and hunger. Corroborating this, Beaglehole and Bonita (2008) state that, the data available as at
June 2007, suggest that none of the MDGs would be achieved by SSA. The region has been
argued to be a most off-track on the MDGs as it lags behind the rest of the developing world on
most of the MDGs; the Millennium Project estimates that a typical country in SSA will need to
significantly increase public investments to approximately US$75-US$80 per capita by 2006,
rising to US$125-US$160 by 2015, in order to meet the goals. In a typical rural community, the
required investments average US$110 per capita/year over 5-10 year period (DCPP, 2007;
Chovwen et al., 2009). However, Easterly (2009) sees the attainment of the MDGs by SSA from
a different angle; though, he pitches his tent with other authors that SSA could not meet the
MDGs targets by 2015 but he does not see the region as a complete failure as it is often
presented. According to him, ―a series of arbitrary choices made in defining success or failure as
achieving numerical targets for the MDGs made attainment of the MDGs less likely in Africa
than in other regions even when its progress was in line with or above historical or contemporary
experience of other regions;‖ therefore, ―the statement that Africa will miss all the MDGs thus
has the unfortunate effect of making African successes look like failures‖ (p. 26).

151
All the preceding arguments suggesting SSA‘s inability of meeting the MDGs
notwithstanding, UNECA (2014) confirms that over the past decades, there has been continuous
decline in the number of Africans living in extreme poverty ―in spite of the excruciating impact
of the recent food, fuel, financial and Eurozone crises‖ and that the proportion of people living in
extreme poverty ―in Southern, East, Central and West Africa as a group decreased from 56.5
percent in 1990 to 48.5 percent in 2010, an 8 percentage point reduction‖ (p. 12).
3.7 Progress of the MDGs’ Targets on Poverty Reduction in Nigeria
Generally, Nigeria‘s progress towards attaining the MDGs by 2015 is mixed; while
progress towards some MDGs has been average, progress as a whole has been less satisfactory
(OSSAP-MDGs, 2010a). Regarding attaining the first goal of the MDGs which is eradicating
extreme poverty and hunger, its progress has been said to be slow as five out of every ten
Nigerians still lived in poverty (OSSAP-MDGs, 2010a). It was reported by (OSSAP-MDGs,
2010b) that the economic growth experienced by Nigeria, particularly in the agricultural sector
had been able to reduce the proportion of underweight children, from 35.7 percent in 1990 to
23.1 percent in 2008. However, the growth experienced was not able to generate enough jobs and
its effect on poverty was not that clear as most of the data relied on which was from 2004 and the
policy in place suggested that this goal would be difficult to meet. For this goal to be attained,
relative poverty which was 60 percent in 2000 was expected to have fallen to 21.35 percent by
2015 in line with the first MDG‘s targets. Regrettably, as at 2007 which was the mid-point for
implementation of the relevant MDGs‘ programmes in Nigeria, 54.4 percent of the country‘s
population still lived in relative poverty instead of 28.78 percent it ought to have fallen to if this
goal‘s targets were to be met. If the trend as it then was continued, by the year 2015, the poverty
incidence would have fallen to 48.7 percent which would be 27.3 percent more than the expected
figure indicating that the goal could simply not be attained by 2015 (OSSAP-MDGs, 2010a).

152
Imoudu (2012) and Oshewolo (2011), claimed that the prospects of economic revival in
Nigeria in order to meet the MDGs appear dim as the progress towards the attainment of the
goals was approximately at a snail‘s pace, hence attaining the targets of the goals remained a
distant goal. In a study conducted by Alabi and Adams (2011), it was claimed that Nigeria‘s
progress towards attaining the MDGs‘s targets, particularly the ones on poverty reduction is
slow. To support this, they based this claim on the premise that Nigeria appropriated more than
₦340 billion (US$ 2.27 billion) for MDGs implementation between 2007 and 2010 and that the
country needed as much as over ₦24 trillion (US$160 billion) in the following five years to
attain the MDGs‘ targets. They inferred that Nigeria would be unable to raise such huge amount
of money and that also, owing to the global financial crisis which induced a dwindling export
prices (oil and cocoa prices), diminishing international remittances from developed countries, a
downturn or even withdrawal of Foreign Direct Investments as well as increased inflation and
taxation, Nigeria‘s progress of achieving the MDGs would be clogged. Further to this, they
emphasized corruption in the use of MDGs fund as one other factor that would bar the progress
of achieving the MDGs in Nigeria. They concluded by suggesting the diversification of
economic base in Nigeria by implementing ―lower interest rate for the real sectors of the
economy, targeted bailout for farmers‘ loans, rural employment and social security programmes‖
(p. 24).
In a study conducted by Chete (2009), it was claimed that Nigeria was unlikely to attain
the MDGs‘ targets in general as the progress towards meeting the targets was slow. This was
attributed to the global economy that was facing crisis of monumental proportions and
the financial crisis cum economic meltdown that did not only threaten the prospects of meeting
the MGDs but also raised a real feasibility of back-pedaling the gain already achieved in the
153
pursuit of these goals. It was further claimed that this slowdown was a negative factor to the
MDGs because it undermined progress by reducing per capita growth rates and causing severe
budget problems. According to him, the slower growth rates in developing countries including
Nigeria were expected to actively put the attainment of the MDGs in jeopardy, and further trap a
larger proportion of people into poverty. He further reported that 1 percent drop in growth of
third world nations including Nigeria could trap as much as 20 million people into poverty. He
stated further that it was unlikely Nigeria will meet the MDGs because the slowdown decreased
remittances, reduced foreign direct investment and felled the demand for goods and services. He
wrote that the country‘s relatively developed financial market directly suffered from capital
flight as a result of their direct exposure to the international financial system; its stock market
indices declined by about 67 percent between March 2008 and March 2009; its currency, the
Naira depreciated against the US dollar by 10 percent in 2009; and importation of food by the
country which was a major component of the consumer price index cum currency depreciation
was to increase domestic prices of consumer goods and reduce access to food by vulnerable
groups, thereby having negative implication particularly on the attainment of the MDGs‘ targets
on poverty reduction. He said that it was unlikely for Nigeria to achieve the MDGs because the
downturn led to high rate of unemployment; also, it affected the amount of ODA that was
available to the country. In a nutshell, Nigeria‘s progress toward achieving the MDGs‘s targets
was slow and the country could not meet the MDGs owing to the effects of the global economic
downturn as it put at risk the chances of doing so.
In a study conducted by Bello and Roslan (2010), it was scientifically proved that the
MDGs in general were not achievable in Nigeria under the trends identified thereby suggesting
that the progress towards achieving the goal was negative. The trends identified included lack of

154
adequate planning such as mapping the MDGs into short, medium and long-term development
plans and lack of funding or investment to achieve the MDGs; the study reported that Nigeria
required as much as ₦4 trillion on an annual basis from 2009 until 2015 to attain the MDGs. In
their analysis, they forecasted Nigeria‘s chances of meeting the MDGs using the Trend
Regression, Model Holt‘s Method and Box-Jenkins Method. The first, second and third methods
showed that the rate of poverty in Nigeria would be 67.4 percent, 75.1 percent and 54.2 percent
respectively by 2015; with the average forecast being 65.57 percent. They claimed that from the
results of the three forecasting models employed, it was clear that Nigeria would not meet the
MDGs‘ targets, particularly the ones on poverty reduction.
In a study conducted by Essien and Usenobong (2009), it was claimed that there was no
significant progress made by Nigeria towards meeting the MDGs goals in general as the country
recorded not up to 20 percent achievement towards the targets; and as such was unlikely to
achieve them. This claim was made after they assessed the progress made in the country towards
attaining these goals and examined the likely pressure the global economic crisis might exert
on attaining the goals. They stressed that probable factors responsible for the sticky response
included deficiencies in infrastructure, high level of illiteracy (especially in rural areas), feeble
political will in programme implementation and corruption. With respect to the global economic
crisis, the probable factors responsible for same were listed to include precipitous fall in oil
prices, increased unemployment, high food prices, high lending rates, retrenchment, credit
squeeze, and decrease in investment, and fall in aggregate demand which negatively affected all
the facets of Nigeria‘s economy.
In a study conducted by Ogunmola and Badmus (2010), it was claimed that Nigeria‘s
yearning towards achieving the MDGs in general was very unrealistic as the Nigerian

155
government score sheet was unimpressive. They used descriptive approach to probe the
problems that were militating against the implementation and realization of the MDGs in the
country; through this, they were able to attribute impossibility of meeting the targets to the
implementation of MDGs that was beclouded with deeply entrenched corruption, gross
inefficiency, and wastefulness. In addition, they stressed it could be attributed to poor
administration and lack of political will. .
In a study by Ogege (2012), the achievement of the MDGs‘ targets on poverty reduction
by Nigeria remained a mirage because the country had not been able to win its war against
poverty from the commencement of the implementation of the MDGs. He situated his discourse
within the feedback system theory also known as vicious cycle of poverty or the culture of
poverty framework; maintaining that poverty bred poverty in Nigeria through time and this
metamorphosed in a force of culture which was transmitted from one generation to another in a
cyclical manner with no beginning and no end to the cycle. Buttressing his point, he stated that
the poverty trap in the country was explicated by the poverty correlate of the occupation of
household that was predominately agriculture with large household sizes. This peculiar
circumstance according to him made it not only difficult for them to escape from poverty but
they also bequeath it to their children. This culminated in a culture of poverty under which
people, resigned to fate. He stated further that this culture of poverty is reinforced and sustained
by bad governance, corruption, unemployment and impotent poverty reduction programmes
thereby explaining the reasons the country was not getting positive results from the various
attempts it made over the years to eradicate poverty. He recommended the formulation and
implementation of policies that could overcome the institutional constraints that militated against
actualization of the MDGs in Nigeria within the targeted time frame.

156
In a 2004 MDGs Report, NPC (2004b) asserted that it was unlikely that Nigeria would be
able to meet most of the goals by 2015 especially the MDGs‘ targets on poverty reduction,
thereby pointing to a negative progress. The report was based on available information which
attributed this to a number of challenges which included corruption that was said to make the
country unattractive to investors and which was said to raise the cost and risk of doing business
in the country. It was also attributed to the heavy external debt which was a burden on the
finances of the government and economy as a whole and to poor resource utilization. According
to the report, if those challenges continued, it would be gargantuan for the country to attain the
MDGs‘ targets. In its 2006 MDGs Report, NPC (2007) reported that it was not certain the
country would attain MDGs‘ targets on poverty reduction and this was mainly attributed to
insufficient data; and bad governance. In a 2000 to 2007 Midpoint Assessment of the MDGs,
OSSAP-MDGs (2008) reported that the progress towards attaining the MDGs‘ targets on poverty
reduction was slow and it was unlikely the targets were met in the country owing to insufficient
data; poor implementation and bad governance. In its 2010 MDGs Report, OSSAP-MDGs
(2010b) reported that Nigeria was making real progress towards attaining the MDGs but
unfortunately, no goal was certain to be achieved; this was attributed to insufficient data; global
financial economic crisis; global food crisis; and climate change.
In all these MDGs Reports, it was claimed that MDGs‘ targets on poverty reduction were
unlikely to be attained by Nigeria. In its analysis, NPC (2007) stressed that the rate of reduction
in poverty was too slow to meet the targets set for 2015 to attain the MDGs. According to the
report, if the rate of poverty reduction as it was then was maintained, poverty incidence would
reduce to 43 percent as opposed to 21.4 percent by 2015. In a related analysis, OSSAP-MDGs
(2008) stated that for MDGs‘ targets on poverty reduction to be met in 2015, the proportion of

157
the population living in relative poverty was expected to have fallen to 28.78 percent in 2007 and
since this was not the case, meeting the targets was not realistic. The report stressed that this did
not happen as among every ten Nigerians in that year, five were still living in poverty. This was
attributed to some challenges that were militating against effective performance of the
agricultural sector which included the dominance of aged people in agriculture, lack of access to
modern agricultural implements, non promotion of strong industrial processing technology and
linkages, lack of encouragement for agriculture sector-market linkages, non promotion of stable
costs of production and non stabilization of the constantly declining purchasing power of
farmers. Corroborating this, OSSAP-MDGs (2010a; b) stated that the progress towards attaining
the MDGs targets on poverty reduction was slow and the available data which was based on
economic growth and the policy environment as it then was suggested that the target would be
difficult to meet as the economic growth did not lead to less poverty. The reports attributed this
to the low level of agricultural mechanization; the predominance of older people unfamiliar with
modern technologies in agricultural production; poor industrial processing and storage
technology, resulting in high post-harvest losses and weak links with markets; poor rural
infrastructure, spurring migration leading to high unemployment in urban areas; huge under-
investment in poverty alleviating projects, infrastructure and agricultural production in rural
areas; and poor water, sanitation and hygiene, leading to recurring diarrhea and nematode
infections, child malnutrition, low productivity and low incomes; loss of a national development
planning culture whose effect was lack of a reliable system for collecting national planning and
development data; lack of dexterity and capability to execute initiatives, and poor arrangement
between different levels and arms of government.
158
In consonance with the claim of the different MDGs Reports, Nweke (2012) in a study
claimed that Nigeria had no capacity to halve extreme poverty and hunger by the year 2015 and
as such, this target of the MDGs could not be attained. He attributed ―the increase in the number
of people living in extreme poverty and hunger to state capitalism and class politics in the
programme implementation‖ (p. 7). He stated that the ―culture of state capitalism and capitalist
accumulation‖ greatly rubbed-off on MDGs as it induced ―the managers of the programme to
turn its implementation into a means for political patronage‖ (p. 8). Further to this, he stated that
though the practice empowered and protected the rich, and by this virtue made ―the vulnerable
and impoverished to get trapped in extreme poverty‖ (p. 8). He concluded that the ―crisis of
poverty reduction within the MDGs‘ framework‖ was ―a product of derailment in
implementation, target and service delivery‖ (p. 8).
According to Alabi and Adams (2011) and NPC (2007), to achieve the MDGs in general,
proper arrangement of MDGs‘ projects and programmes among the three tiers of government in
collaboration with the private sector, civil society organizations and the international community
was a necessary condition for Nigeria to make faster progress in achieving the desirable goals.
They emphasized that ―all the public funds meant for MDGs should be transparently and
prudently used‖ for their intended aims, and that ―donor agencies, government, the public sector
and the private sector‖ should engage in partnership to brighten Nigeria‘s chances of meeting the
MDGs (p. 1). In their analysis, Bello and Roslan (2010) recommended adjustments with respect
to ODA, funding from governments, non-governmental organizations, private sector and
international; and need for strategic planning and effective implementation of their
recommendations. As for Essien and Usenobong (2009), they recommended that the Nigerian
government should stimulate the economy by introducing implementable projects within the

159
short and medium terms to create new jobs; make conscious effort to diversify the economy;
provide the necessary infrastructure such as good roads, steady power supply, steady water
supply, good learning environment (from primary to university level), and well-equipped
hospital; embark on poverty reduction strategy via promotion of rural development with
emphasis on rural infrastructure and agriculture, increased human resource development, and
improved access to employment opportunities especially for the vulnerable groups. Also, the
leadership should be transparent and committed in order to reduce corruption. To attain the
MDGs in general, there should be effective policy coordination and the political will to match
rhetoric with actions which implied that it was a requirement to formulate and implement
policies that would promote transparency cum accountability; overcome institutional constraints;
promote pro-poor growth; bring about structural change; enhance distributive equity; and
promote human development; funding gap should be filled; and efforts should be made towards
having accurate and reliable data to measure and track the progress on the MDGs (Ogunmola
and Badmus, 2010; Ogege, 2012; OSSAP-MDGs, 2010b).
3.8 Summary of Chapter
This chapter describes that development has meant different things over time from
different perspectives. It shows that development emerged in the second half of the 20th
century
meaning economic growth, and was to study the determinants of poverty and underdevelopment
in a more systematic and sustained way than it had been done before. This suggests that the main
contours of development thinking in different periods can be mapped alongside the patterns of
international hegemony and structures of explanation that were prevalent at each time, assuming
that the paradigms that are available in the intellectual market at each time shape the explanatory
frameworks that inform development thinking. The chapter suggests that development is

160
understood through an assessment of development interaction of relevant domestic and external
factors and that development is a constant consideration of alternative.
This chapter discusses the commencement of the MDGs and its strengths and weaknesses.
It states that the targets of the MDGs on reducing extreme poverty and hunger have made
progress which is attributable to the encouraging rates of reduction in China and India. However,
the targets are not attainable in all the regions of the world as SSA for example would not meet
the targets by 2015. The chapter highlights the claims by authors and reports in different studies
that generally, Nigeria‘s progress towards attaining the MDGs is mixed while the progress
towards some MDGs has been average, progress as a whole has been less satisfactory; and that
specifically, the progress of attaining the first goal of the MDGs (eradication extreme poverty
and hunger) is slow as five out of every ten Nigerians still live in poverty as at 2010; and that
Nigeria is unlikely to attain the MDGs, particularly the first goal on extreme poverty and hunger
reduction. Reasons listed by authors in support of this claims include funding gap; global
financial economic crisis; corruption, inadequate planning, inadequate infrastructure; poor
implementation illiteracy; poor implementation, bad governance, culture of poverty,
unemployment, heavy external debt, insufficient data, global food crisis, and state capitalism.

161
CHAPTER FOUR
RESEARCH METHODOLOGY
4.1 Introduction
This chapter describes the research paradigm and methods employed by the study which
are pragmatism and the mixed methods research comprising both the quantitative and qualitative
methods; states the rationale for capturing two Nigerian states for the research; describes the
method of collecting the primary quantitative data for the study which is by administration of
questionnaires and explains the reason for the choice; describes its method of collecting the
primary qualitative data for the study which is via the Focus Group Discussions (FGDs) and
explains the reason for the choice. Finally, this chapter describes the data analysis of the
quantitative and qualitative elements of the study and the reasons for the types of data analysis;
and states the limitations to the study.
4.2 Paradigm, Ontology, Epistemology and Methods of the Research
The study employed the mixed methods research. The paradigmatic position taken by the
employed mixed methods research was the single paradigm approach which involved the use of
both the quantitative and qualitative methods. As stated by Diriwächter and Valsiner (2006) and
Brannen (2005, p. 4), this allowed the researcher to gather and work with ―different types of
data.‖ This study‘s mixed methods research was underpinned by a form of the single paradigm
approach known as pragmatism. Pragmatism underpinned the study because rather than focusing
on assumptions about the nature, the orientation of pragmatism is founded in ―solving practical
problems in the real world‖ (Feilzer, 2010, p. 8). Pragmatism was a good paradigm for this study
because it ―places high regard for the reality of and influence of the inner world of human
experience in action;‖ views knowledge ―as being both constructed and based on the reality of
the world we experience and live in;‖ views current truth, meaning, and knowledge ―as tentative

162
and as changing over time‖ and views human inquiry (i.e., what we do in our day-to-day lives as
we interact with our environments) as being analogous to experimental and scientific inquiry‖
(Johnson and Onwuegbozie, 2004, p. 18). In support of these characteristics of pragmatism,
Brannen (2005, p. 10) clearly asserts that the paradigm is ―more interested in ideas and their
origin, in the ideas which drive the research and the ideas upon which the research should be
founded;‖ that its concern is ―to open up the world to social enquiry and hence to be less purist in
terms of methods and preconceptions (about theory and method);‖ and that its ―rationality will
more readily embrace a mix of methods if the research questions and practicalities of the
research context allow it.‖ This supports the positions of Mertens (2005, p. 26), Tashakkori and
Teddlie (2003) and Somekh and Lewin (2005) which claim that ―the scientific notion that social
inquiry was able to access the truth about the real world solely by virtue of a single method‖ is
rejected by pragmatism; and that the underlying philosophical framewok for mixed methods
research is pragmatism.
Based on the pragmatic paradigm adopted, the ontology of the study, that is, ―the nature of
reality‖ as it is referred to by Le Bon (2001, p. 11) was that there was a single reality in the study
areas which was that there were levels of income and food poverty in the study areas with which
the progress of attaining the MDGs‘ targets on poverty reduction could be assessed in those
areas. Another aspect of the ontology of this study was in an assertion that all persons had their
own exclusive interpretation of this reality. The epistemology of this study, that is, ―the nature of
knowledge and the relation between the knower and would be known‖ as it is referred to by Le
Bon (2001, p. 11) was that the researcher positioned himself as one who was committed to
studying what was of interest and of value to the participants/respondents in the ways he deemed
appropriate in order to get the results utilized in manners that could generate ―positive

163
consequences‖ within their value system‖ as asserted by Tashakkori and Teddlie (1998, p. 30).
Income and food poverty, the central focus of the study was of interest to the
participants/respondents and the appropriate ways by which results were got were through focus
group discussions and adminstartion of questionnaires. The results were committed to being used
to bring about positive consequences.
An alternative form of the single paradigm approach, the transformative-emancipatory
approach did not underpin this study because it places ―central importance on the lives and
experiences of marginalized groups such as women, ethnic/racial minorities, members of the gay
and lesbian communities and people with disabilities (Mertens, 2003, pp. 139-140). Also, it
―analyzes how and why inequities based on gender, race or ethnicity, disability, sexual
orientation, and socioeconomic classes are reflected in asymmetric power relationships;‖ it
―examines how results of social inquiry on inequities are linked to political and social action;‖
and there is a need to intertwine its inquiry with ―politics and political agenda‖ (Le Bon, 2001, p.
21; Creswell, 2003, p. 9). The transformative-emancipatory approach did not underpin this study
because its principles and characteristics do not fit in well in to the objectives of the study.
The mix of the two methods by the research discharged the functions of ―integrating
methodologies for better measurement, sequencing information for better analysis and merging
findings for better action‖ (Carvalho and White, 1997, p. 18). Combining both the quantitative
and qualitative methods made a lot of sense to the researcher as the ―desirability and usefulness‖
to mix both in analyzing social realities is at the moment much agreed to if compared to what
obtained in the 1980s (Hentschel, 2003, p. 75). The values of methods involved in poverty
assessment are likened to the merit of seeing a mountain from two perspectives (Bourguignon,
2003); therefore, the combination of the two methods has complementary strengths and non-

164
overlapping weaknesses; the combination of the two methods ensures corroboration which
means that a researcher has a superior evidence for his/her research result (Tashakkori and
Teddlie, 2003). While quantitative methods are good for specifying or describing relationships,
qualitative methods on the other hand are good for explaining and understanding relationships
values (Thomas and Johnson, 2002). In other words, quantitative research functions to prioritize
―descriptive, analytical breadth of coverage‖ while qualitative research has the ―explanatory
power‖ and the information it generates is rich and deep; also, the data produced by quantitative
method ―can be aggregated and analyzed to describe and predict relationships‖ while qualitative
method helps to ―probe and explain these relationships and to explain contextual differences in
their quality‖ (Holland and Campbell, 2005, p. 5). In summary, quantitative and qualitative
methods combined by the research did ―strengthen both‖ (White, 2002, p. 512).
In this research, the mixed method research adopted suggested links between the level and
determinants of extreme poverty and hunger in the specific study areas in Nigeria. The collected
quantitative data were used to identify the level of extreme poverty and hunger, and the collected
qualitative data were used to explain the determinants of extreme poverty and hunger to assess
the progress of the study areas towards attaining the MDGs targets on extreme poverty and
hunger reduction.
Table 4.1 Research Paradigm and Methods Research Paradigm Research Methods
Pragmatism Mixed Methods Research Comprising the Quantitative and the
Qualitative Methods
Source: Author
4.3 Rationale for the Choice of Study Areas
This study covers two states in Nigeria namely Jigawa and Osun States (see brief profiles
of the two states in chapter one). It was worthwhile to capture these two states as the study areas
of the research because statistical figures confirmed that there existed very wide gaps among

165
poverty rates in the two states. While the dollar per day, food, absolute and relative poverty rates
of Osun State stood at 22.66 percent, 24.67 percent, 24.67 percent, and 24.08 percent in 2004, it
was 89.54 percent, 90.91 percent, 90.91 percent, and 95.07 percent in Jigawa State the same
year. In 2010, while the rates stood at 30.1 percent, 19.5 percent, 37.9 percent and 47.5 percent
in Osun State, it stood at 74.2 percent, 71.1 percent, 74.1 percent, and 79 percent in Jigawa State
the same year (NBS, 2005; 2012a). The choice of these two states allowed for comparison at the
analysis stage of the research. Comparison of these states made it possible to identify, analyse
and explain similarities and differences across societies as argued by Gilbert (1995).
Table 4.2 Osun State Poverty Profile Source % of
People in
Dollar a
Day
Poverty
(2004)
% of
People in
Dollar a
Day
Poverty
(2010)
% of
People in
Food
Poverty
(2004)
% of
People in
Food
Poverty
(2010))
% of
People in
Absolute
Poverty
(2004)
% of
People in
Absolute
Poverty
(2010))
% of
People in
Relative
Poverty
(2004))
% of
People in
Relative
Poverty
(2010
NBS
(2005;
2012a)
22.66% 38.1% 24.67% 19.5% 24.67% 37.9% 24.08% 47.5%
Author’s Compilation
Table 4.3 Jigawa State Poverty Profile
Source % of
People in
Dollar a
Day
Poverty
(2004)
% of
People in
Dollar a
Day
Poverty
(2010)
% of
People in
Food
Poverty
(2004)
% of
People in
Food
Poverty
(2010))
% of
People in
Absolute
Poverty
(2004)
% of
People in
Absolute
Poverty
(2010))
% of
People in
Relative
Poverty
(2004))
% of
People in
Relative
Poverty
(2010
NBS
(2005;
2012a)
89.54% 74.2% 90.91% 71.1% 90.91% 74.1% 95.07% 79%
Author’s Compilation
4.4 Data Collection
4.4.1 Primary Data Collection: Non-Survey Method - Focus Group Discussions
Generally, non-survey methods have the ―ability to focus closely and in-depth on a case
that has a number of features that are of interest from an analytical point of view, and has been
selected for that reason‖ (Appleton and Booth, 2005, p. 124). As for the collection of qualitative
data, the study relied primarily on focus group discussions. FGD was the very first data

166
collection method employed by the researcher because through its proceedings, insights were
given to both what was thought by the participants and the reason for the thought as emphasized
by (AEDEDC, 2004), and also because the data generated from it was capable of being
integrated into the contents of questionnaires that could be used for survey purposes which
further aggrandizes the reliability and validity of a research work as emphasized by (Halcomb,
et al., 2007). This study chose FGD as it method of collecting the qualitative data because it is a
more exertive and activating social discussion through which a cumulative understanding of the
identified problem is achievable (Gillis and Jackson, 2002). Also, because it creates an
atmosphere where the participants express their ideas and experiences and listen to that of others;
that is, it is characterized by the group effect under which participants are engaged in what
(Lindlof and Taylor, 2002, p. 182) refer to as ―a kind of ‗chaining‘ or ‗cascading‘ effect; talk
links to, or tumbles out of, the topics and expressions preceding it.‖ In other words, FGDs are
not limited to the ambit or confine of views, ideas or perception sought as obtained in
questionnaires administration (Burns and Grove, 2001). If well coordinated, FGD ensures that
conversation is always on track; it affords the researcher the opportunity of knowing who have
been involved; if compared to surveys, the method is reasonably low cost and it is possible for a
researcher to gets results almost quickly (Sherraden, 2001; Fern 2001; Krueger and Casey, 2000;
Marshall and Gretchen, 1999; Creswell, 1998). For this research work, the discussion took place
in February, 2011 and March, 2011 in Osun and Jigawa States respectively. In Osun State, the
discussion was held at the conference room of the STEB B programme, Federal Polytechnic,
Ede, Osun State, and in Jigawa State, it was held at conference room of Jigawa Hotels Limited,
Dutse, Jigawa State. Both places were comfortable as they were roomy, well ventilated, well lit

167
up, and they had in them upholstered chairs as prescribed by Ressel, et al. (2002). In addition to
this, they were affixed with slit air conditioners.
4.4.1.1 Focus Group Discussions’ Sampling Strategy and Recruitment
The researcher constituted an 8-member focus group in each of the two states captured by
the study, that is, Osun and Jigawa States using purposive sampling method. The reason for the
choice of a purposive sampling method was that the FGDs were not aimed at producing a
statistically representative sample or aimed at drawing statistical inference. The characteristics
of individuals were used as the basis of selection. In line with the discourse of (Burns and Grove,
2001), the researcher did carefully address the issue of the focus group composition to heighten
the level of interaction among the participants so as to generate data that were valid and reliable
from the exercise. The homogeneous focus group discussion was employed in the composition of
the participants in both states captured by the research under which the discussions consisted of
eight (8) Family Household Heads. Homogeneous focus group was employed because such
groups ―share common identity relevant to discussion‖ as they are with common threads being
the issues for discussion as emphasized by Goldmans, (1962, p. 62) and Vaughn, Schumm and
Sinagub (1996); and because they are ―generally more comfortable and open with one another‖
as claimed by Keown, (1983, p. 66). The statuses/occupations of these household heads were
however heterogenous; their statuses/occupations included farming, trading, clergy, civil servant,
public servant, teaching, lectureship, social worker, community leadership, and studentship; the
household heads were also of male and female genders. The focus groups were characterized by
such diverse profiles because ―it is usually helpful to provide for both homogeneity and contrast
within specific groups‖ as argued by Wells (1974, p. 4). Through this kind of composition, the
groups in both states did achieve an expansive magnitude of views in line with the submission of

168
(Ressel et al., 2002). The decision to limit the number of participants involved in the FGDs to
eight (8) per state was in line with the position of Barbour and Kitzinger (1999) which emphasize
that it is cumbersome to guarantee contribution from all participants if they are more than fifteen
(15) in number; it is equally in line with the position of Morgan (1997) which emphasizes that
the chances of adequately covering the themes of a FGD is limited where there are less than four
(4) participants. Eight (8) participants chosen in both states were adequate as the size was neither
to large nor too small (McLafferty, 2004).
4.4.1.2 Focus Group Discussions’ Strategy
In both Osun and Jigawa States, the researcher was the moderator of the FGDs and he did
appoint an assistant moderator who was a professional colleague and an established researcher in
the field of marketing. The mean time for conducting the discussions was one hundred and
twenty (120) minutes. Luckily, there were no time wasters as all the participants kept to time. As
the moderator, the researcher functioned to guide the participants through the process,
particularly, where conversations went off track; the participants had more control of the
discussions though. In other words, the researcher‘s involvement in the discussions was low as
he asked questions and allowed the participants to converse; this was in line with the submission
of (Burns and Grove, 2001). The moderator added no comments in the conversation but
occasionally asked follow-up questions and changed the subjects when discussions dragged, and
he indicated no specific information he wanted about the topics/themes as this might have effect
on the discussions and create biased findings. The moderator, that is, the researcher was seated in
a vantage position which enabled him have easy and smooth communication with all the
participants. Each participant was seated around the table and had a clear view of the rest of the
group.

169
Before undertaking the FGDs proper in both states, the moderator briefly introduced
himself; specified the objectives and information needs of the focus group discussion; broke
down the major topics into discussion themes; prepared probe question; reviewed the guide and
eliminated irrelevant questions. In undertaking the discussions in both states, the moderator (the
researcher) collected the demographic information of participants and discussions were based on
a list of relevant key themes drawn up by the researcher (see appendix 2 for the discussion
questions/themes of the FDGs).
The focus groups were moderately structured using a deductive approach. Going by
Kendall and Kendall (2005, pp. 4-18) the discussions followed a ‗funnel structure‘ format under
which the moderator began with generalized, open-ended questions (broad and less structured
questions) and concluded by narrowing the responses using closed questions (specific and more
structured questions); this did provide an easy, nonthreatening way to begin an interview. In
short, the ―analogy is to a discussion that moves from broader to narrower topics‖ (Morgan,
1997, p. 53). The funnel design helped the moderator to hear the participants‘ general
perspectives; led him into covering the topics of most interest; and helped him obtain answers to
his specific needs assessment questions. Also, the funnel design was useful when participants felt
emotional about a topic as they were at liberty to express themselves Kendall and Kendall
(2005). The researcher used brainstorming as a strategy of engaging the discussants in both Osun
and Jigawa States. This encouraged each group member as it gave each of them chance to speak
and this helped in casting a broad net across all the participants to ensure they were all involved.
In both states, the proceedings of the discussions exercise were recorded to ensure
adequate analysis. The assistant moderator did audiotape the focus groups using a ‗Clarity USB
Cassette Recorder.‘ Before the recording of the proceedings commenced, each participant was

170
requested to endorse an informed consent; the contents of this document was written in plain
English language, and they clearly stated the following: that the information would be collected
and used to look at a particular research topic; that participants could choose to stop at any time
without penalty; that participation was anonymous except for listed persons; and it did state who
would have access to the recording tapes (see appendix 1). This audiotape recording saved the
moderator from having to write plenteous notes during the discussions. During the discussions,
participants were served light refreshments by the assistant moderator which served the purpose
of creating a social cum friendly environment for discussion; it was ensured that this did not
disorganize the flow of discussions as non-noisy edible snacks were served. The functions
performed by the assistant moderator apart from recording the session and arranging
refreshments included taking some notes and creating a conducive environment for discussants;
this is in line with (Krueger and Casey, 2000).
In summary, the FGD exercise provided rich data via direct interaction between researcher
and participants. This was necessitated by the very fact that participants in the focus group
discussions frequently voiced views that they otherwise might not express in other settings, or if
individually interviewed. Thus, it was easy to make participants fully engaged during discussion
and non-discussion time. It allowed for social interaction within the group that did yield a more
gratuitous and more complicated responses as there did exist interactive synergy, spontaneity and
security of participants within the group.
4.4.1.3 Brief Discussion on the Cultural Context with Respect to the FGDs
All the discussants in Osun State were Yorubas. Culturally, the Yorubas are gregarious
and sociable. According to Fadipe (1970), the Yorubas are more of an extrovert than an introvert.
They are self-contained and self-reliant people that capable of keeping their mental and physical

171
suffering to themselves so that others may not express their sympathy for them. They look upon
expressions of sympathy offered to a man who is experiencing temporary or permanent injury as
helping to lighten the pain (pp. 301-303). The thoughts of the Yorubas are mainly narrative and
they hold the belief that any lore that widens people's horizons and presents food for thought is
the beginning of a philosophy. The Yorubas are very religious people professing Christianity,
Islam and traditional religions and they tolerant about their religious differences (Karade, 1994).
As for all the discussants in Jigawa State, they were all Hausas. Regardless of ethnic affiliation,
most Hausas are Muslims as there is a strong connection between Hausa and Islam. Culturally,
the Hausas value personal qualities which include consistent geniality, cheeriness and pleasant
manners. This has the connotation of a calm stoical pleasantness no matter the level of stress or
provocation. They admit their needs in public and they have the ability to endure severe pain
without complaint (LeVine, 2007).
It is important to state that in the assessment of the researcher, the cultural characteristics
of the discussants in both states seemed not to present them as people that might not be factual in
their contributions to the themes of the FGDs. Also, the extrovert characteristic of the Yorubas
and the admission of needs characteristic of the Hausas gave the researcher a bit of more
confidence in their discussions.
Table 4.4 Periods, Venues, and Duration of FGDs in Study Areas
State Month and Year of FGD Venue Duration
Osun State February, 2011 Federal Polytechnic, Ede,
Osun State
120 Minutes
Jigawa State March, 2011 Jigawa Hotels Limited,
Dutse, Jigawa State
120 Minutes
Source: Author
Table 4.5 Composition of Focus Groups in Study Areas
ID Profile 1 - Status Profile 2 -
Gender
Profile 3 -
Occupation
Number Location
FGD 1:1 Family
Household Head
Male Trading 1 Ede (Osun State)
FGD 1:2 Family
Household Head
Male Public Servant 1 Ede (Osun State)
FGD 1:3 Family Male Community 1 Ede (Osun State)

172
Household Head Leadership/Farming
FGD 1:4 Family
Household Head
Male Lectureship 1 Ede (Osun State)
FGD 1:5 Family
Household Head
Male Clergyman (Pastor) 1 Ede (Osun State)
FGD 1:6 Family
Household Head
Female Social Worker 1 Ede (Osun State)
FGD 1:7 Family
Household Head
Female Trading 1 Ede (Osun State)
FGD 1:8 Family
Household Head
Female Student/Trading 1 Ede (Osun State)
FGD 2:1 Family
Household Head
Male Farming/Trading 1 Dutse (Jigawa
State)
FDG 2:2 Family
Household Head
Male Community
Leadership
1 Dutse (Jigawa
State)
FGD 2:3 Family
Household Head
Male Civil Servant 1 Dutse (Jigawa
State)
FGD 2:4 Family
Household Head
Male Teaching 1 Dutse (Jigawa
State)
FGD 2:5 Family
Household Head
Male Clergyman
(Sheikh)
1 Dutse (Jigawa
State)
FGD 2:6 Family
Household Head
Male Social Worker 1 Dutse (Jigawa
State)
FGD 2:7 Family
Household Head
Female Trading 1 Dutse (Jigawa
State)
FGD 2:8 Family
Household Head
Female Student/Nursing 1 Dutse (Jigawa
State)
Source: Author
Table 4.6 FGD Design and Mode of Recording in Study Areas
FGD Design Mode of Recording
Funnel Structure 1. Audiotape Recording
2. Hand Note Recording of Verbal Behaviours
and Body Movements
Source: Author
4.4.2 Primary Data Collection: Survey Method-Household Questionnaire
Administration
The primary data for this study were collected primarily relying on household survey
which represented the quantitative data for the research. Survey was employed for the research
because it generally aims at ―standardization,‖ makes aggregation possible, provides results
whose reliability is measurable, and allows simulation of effects of different policy options
(Appleton and Booth, 2005, p. 121; Carvalho and White, 1997). Specifically, the research
employed the questionnaire administration as its type of survey. The reasons for the choice of
administration of questionnaires are that it allows for information to be gathered in large amounts
and in a standardized way thereby making data compilation simple and making the exercise cost

173
effective; results from the questionnaires administered can usually be briskly and dexterously
quantified by either a researcher or through the use of a computer software package; and its
analysis is more scientific and objective than other forms of research (Popper, 2004; Milne,
1999; Oppenheim, 1992; Ackroyd and Hughes, 1981). The mode of questionnaire administration
adopted by the research is the face-to-face questionnaire administration and the reason for its
choice for this research is that it allows for items to be presented orally by the researcher in form
of interview (Mellenbergh, 2008b). Another reason for employing it for the research is that it has
high potentials for more complete population coverage for sampling, survey response, item
response/completion of questionnaire, length of verbal response/amount of information and
respondent‘s preferences for mode of administration (Bowling, 2005). In their own assessment,
Tolonen (2005), Czaja and Blair (2005), and Franklin and Walker (2005) state that the high cost
and lengthy time frame of the face-to-face method notwithstanding, the method has got a number
of advantages which include the followings: the control of question order is very good, language
version is very good, control of response situation is good, the use of visual aids is very good, the
response rate is high, verifying the respondent‘s identity is high, and the item non-response and
needed literacy level are low. In line with the submission of Shaughnessy, Zechmeister and
Jeanne (2011), the survey method employed by this study assessed thoughts, opinions, and
feelings and consisted of a predetermined set of questions administered on a sample.
Table 4.7 Survey Data Collection Method and Mode of Questionnaire Administration
Data Collection Method Survey Method Mode of Questionnaire Administration
Survey Household Questionnaire
Administration
Face-to-Face Interview Method
Source: Author
For this research the study population for Osun State consisted of 730,313 regular
households by housing units consisting of 3,416,959 people of the state, and for Jigawa State, the
study population consisted of 810,310 regular households by housing units consisting of

174
4,361,002 people of the state as reported by Nigeria‘s National Population Commission in its
2006 Population and Housing Census of Nigeria (NpoC, 2006, p. 315). This research did not fail
to realize that the figures reported by NpoC (2006) in both Osun and Jigawa States might not
have exclusively captured only households that were characterized by the family element which
was one of the unit of analysis of this research, but the research work did stick to these figures as
its populations for the states because it was the only available most recent document that
reported the numbers of households by housing units and the total numbers of people in each
state of the federation and Nigeria as a whole. Thus, the research did assume that this document
was representative of the populations or of the family households in the two states.
For this research, the samples included 54 family households consisting of 353 adult
members occupying 54 housing units in Osun State and 60 family households consisting of 696
adult members occupying 60 housing units in Jigawa State. The variation in the numbers of
samples from each state was as a result of the difference in the number of housing units in each
state. From each state, the sample captured 0.0074% of its housing units consisting of
households of people. To arrive at these figures, the researcher computed the percentage of 60
housing units randomly selected in Jigawa State from a total of 810,310 housing units, and gave
a result of 0.0074%. The same percentage of 0.0074% was used to get the sample from Osun
State which gave a result of 54 housing units which was eventually randomly selected from a
total of 730,313 housing units of the state (NpoC, 2006). To get the percentage of the 60 housing
units randomly selected in Jigawa State, the percentage was thus calculated:
If 810,310 housing units represented 100%, in Jigawa State, then 60 housing units
represented: 60 x 100 ÷ 810,310 = 0.0074%
If 0.0074 represented 60 housing units in Jigawa State, then, in Osun State, it represented:
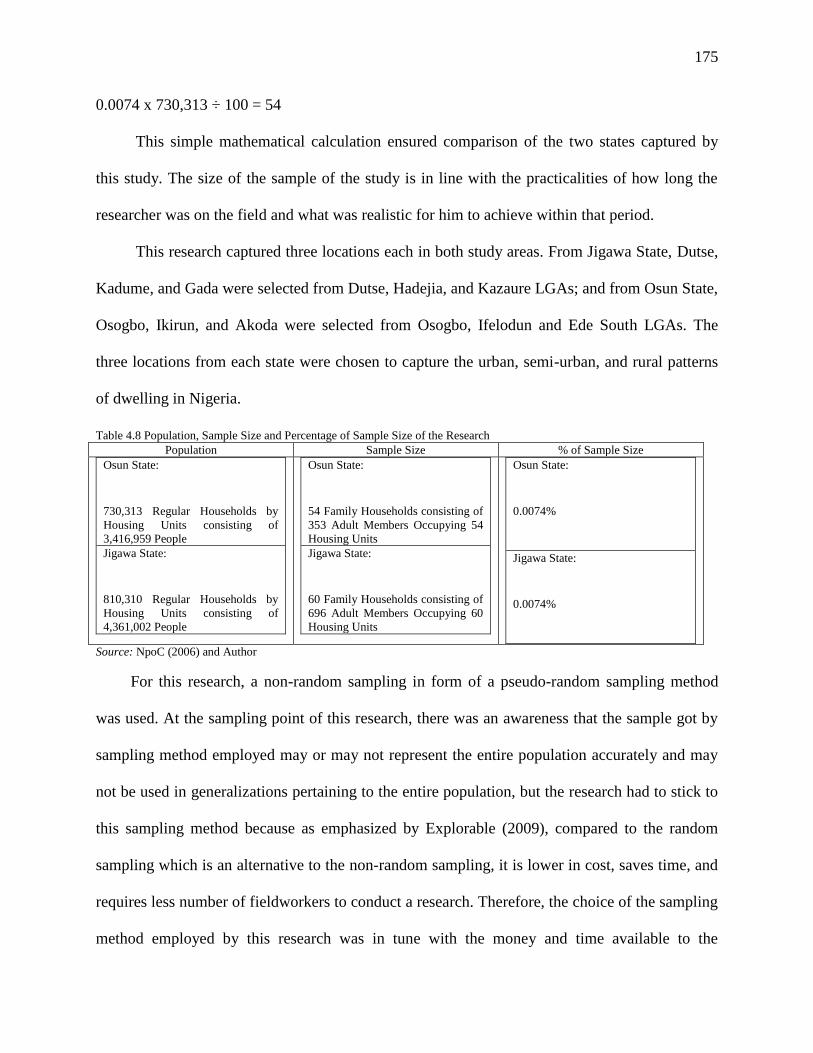
175
0.0074 x 730,313 ÷ 100 = 54
This simple mathematical calculation ensured comparison of the two states captured by
this study. The size of the sample of the study is in line with the practicalities of how long the
researcher was on the field and what was realistic for him to achieve within that period.
This research captured three locations each in both study areas. From Jigawa State, Dutse,
Kadume, and Gada were selected from Dutse, Hadejia, and Kazaure LGAs; and from Osun State,
Osogbo, Ikirun, and Akoda were selected from Osogbo, Ifelodun and Ede South LGAs. The
three locations from each state were chosen to capture the urban, semi-urban, and rural patterns
of dwelling in Nigeria.
Table 4.8 Population, Sample Size and Percentage of Sample Size of the Research
Population Sample Size % of Sample Size
Osun State:
730,313 Regular Households by
Housing Units consisting of
3,416,959 People
Jigawa State:
810,310 Regular Households by
Housing Units consisting of
4,361,002 People
Osun State:
54 Family Households consisting of
353 Adult Members Occupying 54
Housing Units
Jigawa State:
60 Family Households consisting of
696 Adult Members Occupying 60
Housing Units
Osun State:
0.0074%
Jigawa State:
0.0074%
Source: NpoC (2006) and Author
For this research, a non-random sampling in form of a pseudo-random sampling method
was used. At the sampling point of this research, there was an awareness that the sample got by
sampling method employed may or may not represent the entire population accurately and may
not be used in generalizations pertaining to the entire population, but the research had to stick to
this sampling method because as emphasized by Explorable (2009), compared to the random
sampling which is an alternative to the non-random sampling, it is lower in cost, saves time, and
requires less number of fieldworkers to conduct a research. Therefore, the choice of the sampling
method employed by this research was in tune with the money and time available to the

176
researcher during the period the survey was being conducted. Also, the choice of the sampling
method was in order for this research because basically, random sampling is best employed for
studies that are large-scale and which have representativeness as their main aim (Marshall 1996;
Small 2009). Also, achieving true random sampling is always very difficult in any form of
research and also, randomness does not represent the only desirable property of sample selection
(Calandrino, Halderman
and Felten, n.d). Therefore, the choice of the sampling method
employed by this research was in order because the research is not a large-scale study like the
2010 Harmonized Nigerian Living Standard Survey (HNLSS) which involved the use of the
―Enumeration Areas (EAs) demarcated by the National Population Commission for the 2006
Housing and Population Census in the country‘s entire 774 LGAs (NBS, 2014, p. 9).
Table 4.9 Sampling Method for the Household Questionnaire Administration
Sampling Form of Non-Random Sampling
Non-Random Sampling Pseudo-Random Sampling Method
Source: Author
Before the administration of the household questionnaires proper, the researcher did engage
in a pilot study. The reason for this was to tap into the main merit of a pilot study is that ―it might
give advance warning about where the main research project could fail, where research protocols
may not be followed, or whether proposed methods or instruments are inappropriate or too
complicated;‖ that is, it ―can reveal deficiencies in the design of a proposed experiment or
procedure and this can then be addressed before time and resources are expended on large scale
studies‖ (Van-Teilingen and Hundley, 2001, p. 1; NC3Rs, 2006, p. 1). For this research, its pilot
study took the form of household questionnaires administration; this was carried out in August,
2011 at Ibadan, Eruwa, and Ejioku Village all in Oyo State of Nigeria where five (5) household
questionnaires were administered each to cover the urban, semi-urban, and rural areas. This

177
exercise was smooth and the researcher was quite happy about it; the success of this exercise
propelled the researcher to proceed to the major survey.
Also, before the administration of the household questionnaires proper, the researcher
made visits to the traditional heads or representatives of the traditional heads of all the locations
captured by the study to inform them about the questionnaire administration exercise about to
take place in their respective communities and the reason for it. This is in line with Lofland and
Lofland (1984) that advise that a researcher should obtain permission to access an area of study.
They were quite happy about this and upon request, they all made one to two people available
with whom the researcher made visits to the housing units of family household to have
discussions with the family household heads to sensitize them on what the questionnaires were
all about and to confirm from them the best day to administer the questionnaires which was
requested to be a day that all or virtually all members of their family households would be at
home; they were given time frame though. This request was made because the researcher verily
believed that where the family household head could not provide a specific answer about an
adult member of his or her household, the person in question would be available to help out; this
really worked out as expected. While the researcher made these visits only with people made
available by the traditional heads or their representatives in Osun State, he made the visits with a
friend who understood Hausa Language along with people made available by the traditional
heads or their representatives in Jigawa State. The mobile numbers of the family household
heads who had mobile phones were collected with which they were followed up to avoid any
form of disappointments; while the researcher followed up the family household heads in Osun
State, his friend who accompanied him to Jigawa State followed up the family household heads
in that State.

178
For this research work, fieldworkers/research assistants were selected, trained and later
employed to facilitate the collection of primary data in the locations captured by the research
namely: Osogbo, Ikirun, and Akoda from Osogbo, Ifelodun and Ede South LGAs of Osun State,
and Dutse, Kadume, and Gada from Dutse, Hadejia, and Kazaure LGAs of Jigawa State. The
selected fieldworkers/research assistants for the research are graduate students from Obafemi
Awolowo University, Ile-Ife, Osun State, and Bayero University, Kano, Kano State both in
Nigeria. The main reason for the choice of these universities was proximity; they were closer to
the locations of the study areas. In Osun States, 8 (eight) fieldworkers/research assistants were
selected and trained while in Jigawa State, 9 (nine) fieldworkers/research assistants were selected
and trained. One other reason was that the selected fieldworkers/research assistants were
excellently fluent in English Language and both Yoruba and Hausa Languages widely spoken in
Osun and Jigawa States respectively; this was necessary because while the researcher could
demonstrate proficiency in English and Yoruba Language widely spoken in Osun State, he could
neither speak nor understand the Hausa Language widely spoken in Jigawa State. Therefore, the
choice of the fieldworkers/research assistants for this research work paved way for quicker
administration of the questionnaires and prevented both the researcher and his
fieldworkers/research assistants from any form of communication barriers. The researcher
engaged the services of Dapdoy Consultants, Magazine Road, Dugbe, Ibadan, Nigeria to train
the fieldworkers/research assistants. The researcher instructed the consultants to give training to
the fieldworkers/research assistants on: specific qualities, such as communication skills,
teamwork and honesty, the enrolment and consent processes, administering structured
questionnaires on a face-to-face basis, the completion of forms, motivation, and the possible
difficulties they may face in the field. The training took a day each at both Osun and Jigawa

179
States, and the researcher was quite happy about level of training given to the
fieldworkers/research assistants.
Before the questionnaire administration exercise, some amendments were made to the
contents of the questionnaires with the use of black pens. The fieldworkers/research assistants
were duly carried along with the amendments made and were trained and instructed along this
line to ensure the questionnaires they administered were in tune with the amendments made.
They were also trained and given some specific instructions on some questionnaire questions.
Amendments made included Question 2 where the age brackets were amended to capture the
target of the research and where the exact ages of respondents were requested; Question 5 where
the exact numbers of adult members of family households were requested; Question 6 and
Question 1 in the continuation sheet that paired the secondary and technical levels of education
and added master and doctorate levels of education; Question 8 and Question 2 in the
continuation sheet where full time employment was paired with self employment; and Question
9 and Question 3 in the continuation sheet where the exact figures of earnings of family
household heads and household members were requested. The specific instructions/trainings
given to the fieldworkers/research assistants included the followings: that they should bear in
mind that in the questionnaire, Question17 was to get information about the cost of food of all
household members, that is, the food bought for joint intake of the family and therefore, they
should explain further if they suspected that the question was unclear to the respondent; that
Questions 18 and 19 were extensions to Question 17 and they were to get further information on
the cost of additional food available to all the members of a family household which included
food not bought like food given to the family or food got from the family farm; that Questions
20-23 were to get the cost of food of individual member of a family household; that Questions

180
21-22 were to get information about the cost of family household head‘s food intake outside
his/her household regular food intake; that Questions 22-23 were to get same for other members
of the household; and that information related to household members apart from the family
household head should be recorded in the continuation sheet (see appendix 4 for the
questionnaire).
On the field, the researcher joined fieldworkers/research assistants to administer the
questionnaires in both Osun and Jigawa States. He also doubled as a supervisor with another
colleague who had a doctorate degree from Durham University, United Kingdom and had a wide
experience in research surveys. In Osun State, a total of 54 structured household questionnaires
were administered on 54 family households consisting of 353 adult members occupying 54
housing units in January, 2012, and in Jigawa State, a total of 60 structured household
questionnaires were administered on 60 family households consisting of 696 adult members
occupying 60 housing units in February, 2012. In each of the three (3) locations of Osun State,
18 structured household questionnaires were administered while in each of the three (3) locations
of Jigawa State, 20 structured household questionnaires were administered. The structured
household questionnaires administered by the researcher and his fieldworkers/research assistants
was prepared in English Language and contained closed questions followed by predefined
answers. The researcher anticipated all possible answers with pre-coded responses. The
researcher did stick to structured questionnaires administration because of its inherent
advantages. Such advantages according to Bryant (n.d), are that: it affords the researcher the
opportunity of contacting large numbers of people quickly, easily and efficiently; the creation,
coding and interpretation of questionnaires are faster; questionnaires are easy to standardized and
are reliable because everyone in the sample answers exactly the same questions; and

181
questionnaires have the ability to delve into areas that are of mental discomfort like criminal and
sexual matters.
The structured household questionnaires were administered on the family household heads
but captured only the adult members of each family household in both Osun and Jigawa States.
Where the family heads could not give answers to some questions about the adult members of
their households, the adult members available were on ground to help such family heads out. The
reason for capturing only adult members of family households was that the investigation of the
research work revolves around earnings of the members of family households and the cost of
feeding, and since the minor members of family households were not expected to be working and
earning pay, the research work did stick to only adult members of family households. Adult
members of family households captured by the research work were aged between 15 and above
64. This age bracket was captured as the adult members of family households because they are
classified as adults of working age, and also because ―increased proportion of people aged over
65 have strong negative effect on welfare, as does the proportion of children aged 5-15 years of
age‖ (Appleton, Mckay and Alayande, 2008, p. 351).
Table 4.11 Pilot Study
State Locations Form of Pilot Study No. Of Household
Questionnaires
Administered
Person Who Carried
Out the Exercise
Oyo State 1. Ibadan
2. Eruwa
3. Ejioku
Administration of
Household
Questionnaires
15 (5 at Each
Location)
The Researcher
Source: Author
Table 4.12 Survey Summary
State Locations No. of Research
Assistants
Recruited and
Trained
Main Characteristics of
Trained Research
Assistants
No. of Household
Questionnaires
Administered
Osun State 1. Osogbo
2. Ikirun
3. Akoda
8 1. Graduate
Students
2. Fluent in
English and
Yoruba
Languages
54 Questionnaires
administered to 54
Family Households
consisting of 353
Adult Members
Jigawa State 1. Dutse 9 1. Graduate 60 Questionnaires

182
2. Kadume
3. Gada
Students
2. Fluent in
English and
Hausa
Languages
administered to 60
Family Households
consisting of 696
Adult Members
Source: Author
Table 4.13 Survey Summary
Persons Whom Questionnaires were Administered on Family Members Captured by the Questionnaires
Family Heads Adult Members (Aged 15-64)
Source: Author
4.4.3 Secondary Data Collection
The research sources of secondary data collection included books, journals, administrative
data and other relevant international and national official documents and materials. Prominent
were the documents sourced from the World Bank, United Nations (UN) and its agencies such as
the World Health Organization (WHO), United Nations Development Programme (UNDP) and
United Nations Children‘s Fund (UNICEF). In the United Kingdom, secondary data were
gathered from the libraries of the Nottingham Trent University, University of Glasgow and
Strathclyde University; secondary data were further sourced from the Overseas Development
Institute, London, Institute of Development Studies, Sussex University, Centre for Development
Studies, University of Glasgow, Chronic Poverty Research Centre, University of Manchester,
Institute for Development Policy and Management, University of Manchester, Development
Initiative, Bristol and the Department for International Development (Dfid), London. In Nigeria,
secondary data were sourced from the official documents of such bodies as the Office of the
Senior Special Assistant to the President on MDGs, MDGs Offices in the two states captured by
the study, Osun and Jigawa States, National Bureau of Statistic, Ministries, Agencies and
Parastatals and from the libraries of the University of Ibadan, University of Lagos, University of
Abuja and Obafemi Awolowo University.
The secondary materials used by this research met at least one of the criteria listed by
Abdullahi (2005) cited in Alaye-Ogan (2008) which are the followings: secondary materials

183
must be a written one; must have been brought about on the inventiveness of the author; and
must focus on the authors personal experiences.
4.5 Data Analysis Techniques
4.5.1 Analysis of the Qualitative Data - Focus Group Discussions
The FGDs data were analyzed using the tape-based and note-based analyses under which
the researcher carefully listened to the tapes of the discussion, and read through notes taken by
the assistant moderator and consequently initiated shortened transcripts. The choice of the tape-
based analysis was good for this research because as emphasized by Onwuegbuzie, et al. (2009,
p. 4), it was ―much shorter than is the full transcript in a transcript-based analysis‖ and allowed
the researcher to ―focus on the research question and only transcribe the portions that assist in
better understanding of the phenomenon of interest‖ The note-based analysis was good to the
research because it included ―analysis of notes from the focus group, the debriefing session, and
any summary comments from the moderator or assistant moderator‖ which the researcher found
useful at the point of analysis (Onwuegbuzie, et al., 2009, p. 4). With respect to analysing the
tape recordings of the FGDs, the researcher listened carefully to the recordings and read the
transcript carefully. The researcher avoided being selective by keeping an open mind, remaining
neutral and striving for objectivity as best as he could. This helped to avoid biases in the
analysis.
The transcripts generated were coded by grouping the answers into key points or codes;
searching the text for particular phrases or words; and colour-coding the words and phrases that
matched the key points or codes by computer highlighting until each answer was accounted for.
This process partly took a form of the scissor-and-sort technique with the addition of the
computer knowledge of the researcher which produced results for analysis. The fact that the
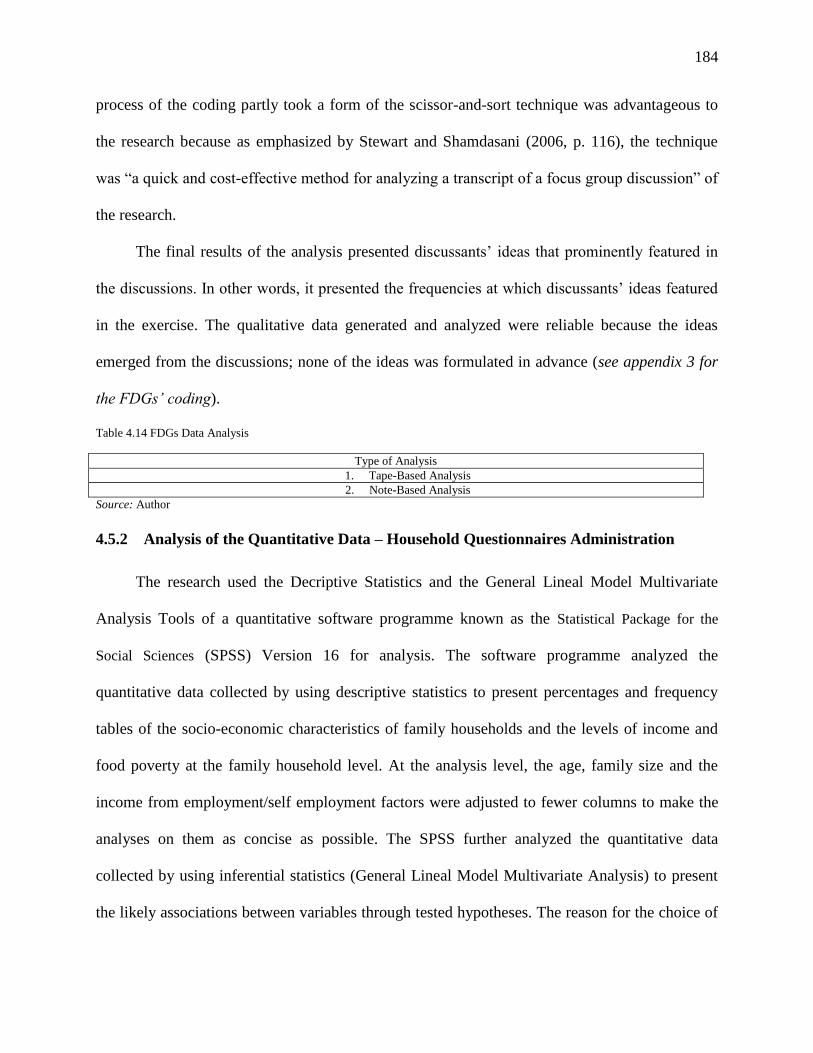
184
process of the coding partly took a form of the scissor-and-sort technique was advantageous to
the research because as emphasized by Stewart and Shamdasani (2006, p. 116), the technique
was ―a quick and cost-effective method for analyzing a transcript of a focus group discussion‖ of
the research.
The final results of the analysis presented discussants‘ ideas that prominently featured in
the discussions. In other words, it presented the frequencies at which discussants‘ ideas featured
in the exercise. The qualitative data generated and analyzed were reliable because the ideas
emerged from the discussions; none of the ideas was formulated in advance (see appendix 3 for
the FDGs’ coding).
Table 4.14 FDGs Data Analysis
Type of Analysis
1. Tape-Based Analysis
2. Note-Based Analysis
Source: Author
4.5.2 Analysis of the Quantitative Data – Household Questionnaires Administration
The research used the Decriptive Statistics and the General Lineal Model Multivariate
Analysis Tools of a quantitative software programme known as the Statistical Package for the
Social Sciences (SPSS) Version 16 for analysis. The software programme analyzed the
quantitative data collected by using descriptive statistics to present percentages and frequency
tables of the socio-economic characteristics of family households and the levels of income and
food poverty at the family household level. At the analysis level, the age, family size and the
income from employment/self employment factors were adjusted to fewer columns to make the
analyses on them as concise as possible. The SPSS further analyzed the quantitative data
collected by using inferential statistics (General Lineal Model Multivariate Analysis) to present
the likely associations between variables through tested hypotheses. The reason for the choice of

185
this software programme is to guarantee accuracy of figures which it did. SPSS has been
extensively used for analyzing data statistically in the social sciences and in other fields of study;
it has also been broadly used by various governments and organizations. To corroborate this, the
initial SPSS Manual by Nie, Brent and Hull (1970) was construed to be one of Sociology‘s most
influential books (Wellman, 1998).
The reason for the choice of descriptive statistics was that it described the main feature of
a collection of data and summarized the sample in place of using the data to acquire information
about the population which a sample is assumed or conceived to represent. In this research, as
expressed by (Texas State Auditor's Office, 1995, p. 11), descriptive statistics was ―essential for
arranging and displaying data,‖ formed ―the basis for rigorous data analysis,‖ was ―much easier
to work with, interpreted and discussed than raw data,‖ helped ―examine the tendencies, spread,
normality, and reliability of the data set,‖ and was ―rendered both graphically and numerically.‖
As for the inferential statistics, the reason for its choice was that as stated by Coolidge (2006, p.
120), it is ―concerned with making conclusion about populations from smaller samples drawn
from the population‖ which aligned with the objectives of this research. Another reason for its
choice as emphasized by Texas State Auditor's Office (1995, p. 1) was that by themselves,
inferential statistics do ―not prove causality‖ because ―their use is little more than a fishing
expedition.‖ This equally aligned with the objectives of this research (see chapter five and
appendices 5 and 6 for the results of tested hypotheses, test of hypotheses coding and the
multivariate analysis tables).
The collected quantitative data was further analyzed by using the poverty headcount ratio
calculation (FGT) developed by Foster, Greer and Thorbecke (1984). FGT was used to arrive at
the figures of the proportion of people who were income and food poor at the individual level in

186
the study areas. It was employed because it had always been the simplest and commonest
measure of poverty (Fields, 1997); and because its different dimensions of calculations had been
widely used in scholarly studies such as Appleton (1996); Appleton, et al. (1999); Appleton,
Mckay and Alayande (2008); Omonona (2009); Oluwatayo (2009); Anyanwu (2010); Adetunji
(2012); and Asogwa, Okwoche and Umeh (2012).
The standard used to measure income/extreme poverty was family household adult
members‘ earnings of less than US$1.25 a day which is the international poverty line defined by
the World Bank (Ravallion, Chen and Sangraula, 2009). Investigation was based on both the
international market and PPP exchange rates to allow for comparison of the two states captured
by the study.
Based on N155.92 (which was the international market exchange rate of US Dollar to
Nigerian Naira for December 31, 2012 according to Exchange Rates UK (2012)); US$1.25 a day
per person was calculated thus: 155.92 x 1.25
This equalled to N194.90 (US$1.25) a day per person. In a month, it equalled to N5,928.21
(US$38.02) per person, and in a year, it equalled to N71,138.50 (US$456.25) per person.
Therefore, based on the international market exchange rate, the study analysis classified any
family household adult member whose income was less than N194.90 (US$1.25) a day as
income poor.
To determine the daily US$1.25 per day poverty line based on the PPP exchange rate, the
figures arrived at through the international market rate exchange change was cross-multiplied by
US$0.60 which was the equivalent of US$1in Nigeria as at the time of this research (World
Bank, 2012). At the PPP exchange rate, US$1.25 a day per person was calculated thus:
If 1 = 0.60, then, 1.25 would be: 1.25 x 0.60
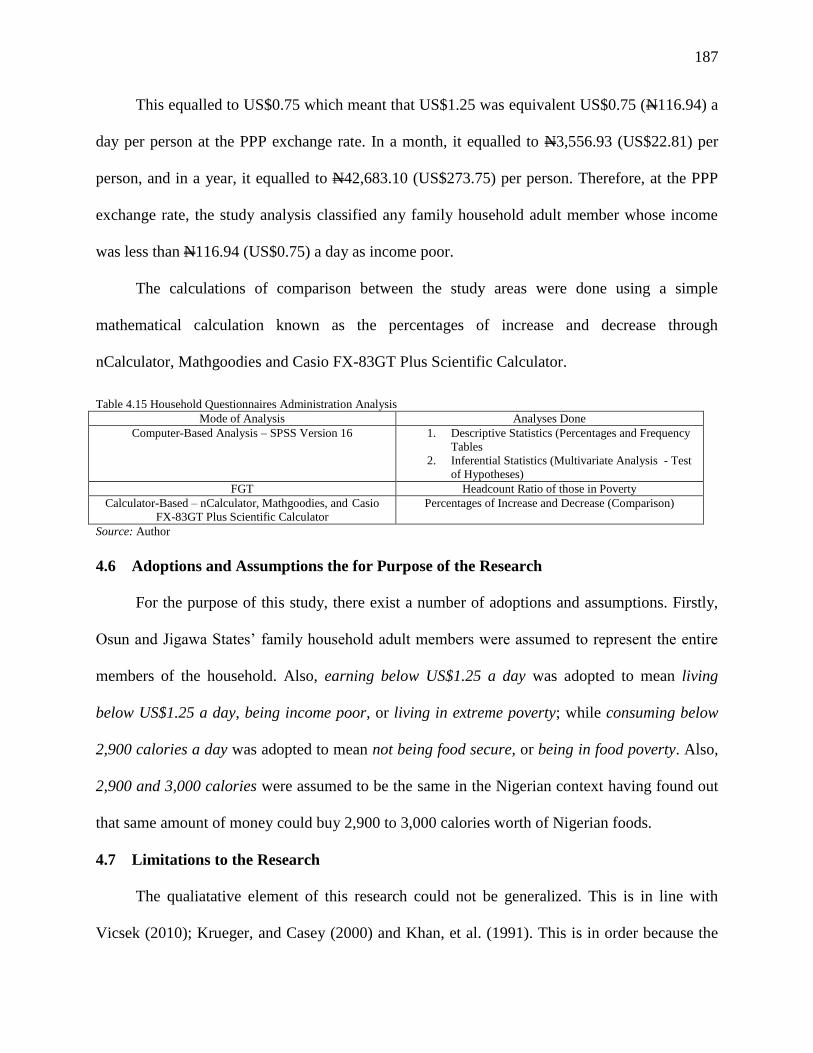
187
This equalled to US$0.75 which meant that US$1.25 was equivalent US$0.75 (N116.94) a
day per person at the PPP exchange rate. In a month, it equalled to N3,556.93 (US$22.81) per
person, and in a year, it equalled to N42,683.10 (US$273.75) per person. Therefore, at the PPP
exchange rate, the study analysis classified any family household adult member whose income
was less than N116.94 (US$0.75) a day as income poor.
The calculations of comparison between the study areas were done using a simple
mathematical calculation known as the percentages of increase and decrease through
nCalculator, Mathgoodies and Casio FX-83GT Plus Scientific Calculator.
Table 4.15 Household Questionnaires Administration Analysis Mode of Analysis Analyses Done
Computer-Based Analysis – SPSS Version 16 1. Descriptive Statistics (Percentages and Frequency
Tables
2. Inferential Statistics (Multivariate Analysis - Test
of Hypotheses)
FGT Headcount Ratio of those in Poverty
Calculator-Based – nCalculator, Mathgoodies, and Casio
FX-83GT Plus Scientific Calculator
Percentages of Increase and Decrease (Comparison)
Source: Author
4.6 Adoptions and Assumptions the for Purpose of the Research
For the purpose of this study, there exist a number of adoptions and assumptions. Firstly,
Osun and Jigawa States‘ family household adult members were assumed to represent the entire
members of the household. Also, earning below US$1.25 a day was adopted to mean living
below US$1.25 a day, being income poor, or living in extreme poverty; while consuming below
2,900 calories a day was adopted to mean not being food secure, or being in food poverty. Also,
2,900 and 3,000 calories were assumed to be the same in the Nigerian context having found out
that same amount of money could buy 2,900 to 3,000 calories worth of Nigerian foods.
4.7 Limitations to the Research
The qualiatative element of this research could not be generalized. This is in line with
Vicsek (2010); Krueger, and Casey (2000) and Khan, et al. (1991). This is in order because the
188
central idea behind FGDs is not for generalization creation (Fern, 2001). This is the case because
samples of the FGDs ―are small and purposively selected and therefore do not allow
generalization to larger populations;‖ and also because ―the method of asking questions is not
standardized and thus it might differ according to the individual situation (Khan, et al. 1991, p. 2;
Vicsek, 2010, p. 123). However, this limitation did not adversely affect the findings generated
from the FGDs because the researcher did not make a choice of the FGDs because he wanted to
generalize the findings but because he wanted to use the FGDs to get in-depth insights into the
factors that had possible association with income and food poverty in the two study areas; and to
know the discussants‘ positions as to whether or not the level of Nigeria‘s progress towards
meeting the MDGs‘ targets on extreme poverty and hunger was promising. In short, the objective
for which the choice of FGDs was employed by the researcher was achieved.
The quantitative element of this research had the non-generalizable stance as the non-
survey aspect. Generalization of the survey aspect of the data collection was not possible because
a non-random sampling in form of a pseudo-random sampling method which may not represent
the entire population accurately was used. This limitation did not adversely affect the findings
generated from questionnaire administration because the researcher did not make a choice of the
questionnaire administration because he was bent on proving causality between varaiables and
generalizing the findings from the exercise but rather, he wanted to use the questionnaire
administration for research expedition which was achieved.
This study made no adjustments with reference to the difference in the caloric
requirements for a man and a woman. It assumed the same caloric requirements for both sexes in
line with the position of Nigeria‘s National Bureau of Statistics which set a food poverty line of
N39,759.49, an amount that could feed an average Nigerian up to a minimum calorific intake of

189
3000 per day. Though, this is a limitation to this research but it did flow well with it because it
adopted the same methodology used by the NBS whose poverty line was used as yardstick for
the measurement of food poverty in the study areas.

190
CHAPTER FIVE
DATA ANALYIS AND DISCUSSION
5.1 Introduction
As a follow up to the previous chapter which gave a full account of the research
methodology (including the data analysis techniques used and the rationale for using them), this
chapter presents the findings of this research. This chapter presents the findings of the Focus
Group Discussions based on the themes captured by the exercise across the groups. The
presentation of the FGDs‘ findings includes some direct quotations from the texts generated from
the exercise. The chapter presents the results of the socio-economic characteristics of family
households in the study areas and the level of income poverty at the individual level. Finally, the
chapter presents the results of six hypotheses which test the relationships between the
independent and dependent variables. The results of the levels of income poverty at the
individual level and the tested hypotheses are based on both the international market and the
Purchasing-Power Parity (PPP) exchange rates and are compared. All the presented results are
based on the samples of the research and are followed with interpretations. The author/researcher
is the source of all tables and figures contained in this chapter.
5.2 Analysis of the Qualitative Element of the Research
5.2.1 Focus Group Discussions (FGDs) Analysis
This analysis contains findings that are based on the FGDs conducted in the study areas of
the research, that is, Nigeria‘s States of Osun and Jigawa. Focus groups discussions explored
discussants‘ people‘s knowledge, experiences, beliefs, and opinions to arrive at the findings. In
all, two FGDs were conducted in the two states, that is, one per state with groups that were
homogenous. This FGDs analysis reveals four themes across the two FGDs. The themes revolve

191
around the the meaning of poverty, levels of income and food poverty, likely factors associated
with income and food poverty and the progress towards the attainment of the MDGs targets on
poverty reduction. For these themes, the coding process that produced these findings relied on
frequencies of the some words and phrases in the texts of the two FGDs.
5.2.1.1 Theme 1: The Meaning of Poverty
In both focus groups, discussants were asked to describe in their own words what poverty
meant to them. They were instructed to reflect upon how poverty was best understood and
characterized. Following brainstorming sessions, majority of discussants in the two focus groups
provided answers that aligned poverty to the income and basic needs approaches (see chapter 2).
Vast majority of the discussants across the groups defined poverty in absolute/extreme terms
itemizing the main traits or characteristics of poverty to include lack of income/low income, lack
of food/lack of adequate feeding, lack of shelter/inadequate shelter, lack of clothing/lack of
sufficient clothing, unemployment/underemployment, and lack/limited access to education.
In Osun State, all the discussants believed that poverty involved hunger/lack of adequate
feeding, lack of income/low income, and homelessness/inadequate housing; vast majority of
them believed that poverty involved lack of clothing/sufficient clothing and
unemployment/underemployment, lack/limited access to education; half of them believed that
poverty involved lack/limited access to health; and few of them believed that poverty involved
lack of assets. In this state, a discussant tagged FGD 1:1 stated that ―to me, somebody is in
poverty if he or she does not have enough money to take care of his or her basic needs and that
of his or her family such as food, shelter and clothing. Also, somebody is in poverty when he or
she is unemployed or underemployed which results in such a person not having enough money to
take care of basic needs of life.‖ Another discussant tagged FGD 1:2 stated that ―a person is

192
also poor when he or she lacks access to education and good healthcare due to lack of enough
money and when a person struggles to get education and good health for his or her family
members‖ In Jigawa State, all the discussants believed that poverty involved hunger/lack of
adequate feeding, lack of income/low income, unemployment/underemployment, and
homelessness/inadequate housing; vast majority of them believed that poverty involved lack of
clothing/sufficient clothing and lack/limited access to health; majority of them believed that
poverty involved lack/limited access to health was a trait; and few of them believed that poverty
involved lack/limited access to education. One of the discussants in the state tagged FGD 2:1
stated that ―poverty is when there is no food at home or when there is little food and a person is
often hungry; it is when the employable people within a household have no jobs, that is, when
they are unemployed and there is no money at all or no enough money for a household to spend,;
it is when there is no shelter or when the available shelter is inadequate; it is when there is no
clothing at all or no adequate clothing as in when a person cannot afford to provide for himself
clothes that march different climates, like not being able to get for oneself thick clothes during
the harmattan season. That is what poverty is, no more, no less.‖ Out of all the discussants in
both states, there was only one dissenting voice that defined poverty in relative terms (see
chapter 2). The discussant from Jigawa State tagged FGD 2:8 described poverty as not being
able to afford what others could afford for themselves and their families. She said that ―poverty
to me means a condition under which one cannot afford what others can. Like for example if my
neighbour can send his son to a standard private school and I can only send mine to a public
school or when my neighbour is eating chicken and rice everyday and I cannot do the same; that
is poverty as far as I am concerned.‖

193
5.2.1.2 Theme 2: Levels of Income and Food Poverty
Discussants in the two focus groups were asked to assess what the levels of income and
food poverty were in their communities/societies. There was a widespread agreement by the
focus groups that the rates of income and food poverty were high in their communities as most
discussants stated this and backed up the agreement with beliefs and stories of experiences that
better explained the high rates of income and food poverty in their communities. A discussant
from Osun State tagged FGD 1:5 stated that ―I do not agree that the levels of income and food
poverty within this community are low or moderate. People trek long distances to churches to
worship because they cannot afford to pay for their transportation. It is very rare not to see scores
of people waiting after church services to have discussions with their pastors or having them
pray for them, and the prayer request of more than 95 percent of this set of people is always
about provision from God to help them meet the basic needs of life which are shelter, food, and
clothing. In short, within this community, the levels of income and food poverty are very high
and it is only prayers to God that can help people out poverty in general.‖ From Jigawa State, a
discussant tagged FGD 2:5 stated that ―embarrassing high numbers of beggars on our streets is
enough to tell anybody that the levels of income and food poverty are high in our community.
Majority of the members of my congregation complain of hunger day in, day out. We have
scores of them who sleep in the mosque because they are homeless, these set of people have
nothing. Things are very tight for people to the extent that they cannot keep their heads above
water, they cannot meet the basic needs of common living in all aspects. And that is why we
would not stop praying to Allah to rescue us from poverty.‖ However, there were very few
dissenting voices that did not agree that the levels of income and food poverty were high in their
communities, rather, they in their assessments believed that the levels of income and food

194
poverty in their communities were moderate. Accounts of two of the discussants are given
hereunder: A discussant from Osun State tagged FGD 1:4 stated that ―in my own assessment,
people in this community are not as poor as people think. I am a researcher and most of my
academic investigations involve the levels of poverty in relation to Agriculture in this state. I am
confirming to you that none of the results of my findings confirmed up to 50 percent poverty
incidence in the state which to me is not as bad as people paint it to be. But to answer your
question, I will say the levels of income and food poverty in this state are not high and not low,
rather, they are moderate.‖ From Jigawa State, a discussant tagged FGD 2:8 stated that ―of
course, there are income and food poverty in our society but I strongly believe that their levels
are moderate. Personal observations of a number of families within this society has revealed to
me that it is not extremely difficult for them to have a level of income, though, it may not be
enough but it is not total lack of money in the family. My personal observation also reveals to me
that families are housed, they feed and wear clothes, though, all these may not be adequate, but it
is not total lack of these basic needs.‖
5.2.1.3 Theme 3: Factors with Probable Association Income and Food Poverty
Question that revolved around factors that had likely associations with income and food
poverty at the household level and in general terms was posed to the discussants. There was
considerable debate as to what such factors were; this debate captured the experiences, opinions,
and beliefs of the discussants. The discussants listed a number of factors with varying levels of
agreement. Listed factors included corruption, unemployment, form of employment, lack of
income, overpopulation, global inequality, individual deficiencies/laziness, culture of poverty,
inadequate education/poor educational system, educational attainment, family/household size,
195
age composition of the family/household, gender/sex composition of the family/household, and
geographical disparities/ location variables.
In Osun State, all the discussants believed that factors that had probable association with
income and food poverty included corruption, unemployment, wages/income, and educational;
vast majority of them believed that the factors included family/household size and inadequate
education/poor educational system; majority of them believed that the factors included culture of
poverty; few of them believed that the factors included form of employment, individual
deficiencies/laziness, overpopulation, age composition of the family/household, and
geographical disparities/ location variables; and very few of them believed that the factors
included global inequality and sex composition of the family/household. In Jigawa State, all the
discussants believed that the factors included corruption, wages/income, educational attainment,
and family/household size; vast majority of them believed that the factors included
unemployment; majority of them believed that the factors included form of employment; half of
them believed that the factors included individual deficiencies/laziness and geographical
disparities/location variables; few of them believed that the factors included age composition of
the family/household, inadequate education/poor educational system and sex composition of the
family/household; and very few of them believed that the factors included overpopulation, global
inequality and culture of poverty. A discussant from Osun State tagged FGD 1:4 stated that
―inadequate education or poor educational system as we have in Nigeria may be used to explain
poverty of any kind and at any level. I am a lecturer and I can confirm to you that since the
1990s, there have been disruptions in academic calendars at the primary, secondary, and tertiary
levels of education due to incessant strikes following government insensitivity. With this, there is
no way these schools can 50 percent roll out productive individuals that can secure income

196
generating jobs. With bad quality of schools and teachers, there is a high rate of illiteracy and a
corresponding high rate of poverty. That is what obtains in Nigeria.‖ Another discussant from the
same state tagged FGD 1:6 stated that ―unemployment is key to how poor one is. My life is a
good example. I lost my father at a very tender age and as at this time, my mother was
unemployed and she had to take up responsibilities over four children, myself and three others. It
was struggle, we were poor, and we went to bed without food on a number of occasions. We had
to practically beg for money and food. We would have been homeless if not for the fact that my
father left a small uncompleted building where we moved to after his demise. I was lucky to be
assisted by an uncle who was responsible for my education. My other siblings were not that
lucky because none of them was able to complete primary school. That is what unemployment
can do to people.‖ From Jigawa State, a discussant tagged FGD 2:2 stated that ―corruption is
everywhere particularly among the political class. Just last week, a member of the state house of
assembly came to my village to commission a 10 million naira constituency project which was a
water bore-hole. Shortly after the commissioning, the whole structure collapsed. This is
corruption of the highest order because the cost of the project itself should not be more than half
a million naira. Another bad thing is that the project did not serve the purpose for which it was
done. Corruption breeds poverty because money meant for the welfare of the masses is stolen by
the political class in this country.‖ One other discussant from the same state tagged FGD 2:6
―stated that ―from time immemorial, there have been global inequalities across the world under
which there has always been unequal distribution of resources between the rich and the poor
countries of the world. This is a factor that may explain poverty of any form, be it income, food,
material and so on. The unfair trade regime between these countries is disadvantageous to third
world nations such as Nigeria as they have always been dependent on the first world nations.

197
This high level of dependency has created a gap that has been very difficult to fill by the third
world nations. With this kind of scenario, the third world nations including Nigeria will always
have a high rate of poverty of any kind.‖
5.2.1.4 Theme 4: Progress towards Attaining the MDGs’ Targets on Poverty Reduction
Before proceeding to the main question which was on the progress towards attaining the
MDGs‘ targets on poverty reduction, the discussants in the two focus groups were first asked if
they had the knowledge of the existence of the United Nations and if they knew that halving
extreme poverty and hunger was the main focus of the MDGs of the UN. Vast majority of the
discussants claimed to have the knowledge of the existence of the UN and having the knowledge
that halving extreme poverty and hunger was the main focus of the MDGs. This majority of
discussants did not believe that the level of Nigeria‘s progress could make the MDGs‘ targets on
poverty reduction attainable for the country and their communities. They attributed this to a
number of factors with varying levels of agreement. Listed factors included corruption,
unemployment, illiteracy, bad governance, culture of poverty, and heavy external debt.
In Osun State, vast majority of the discussants attributed the country‘s progress towards
attaining MDGs‘ targets on poverty reduction to corruption, bad governance and unemployment;
majority of them attributed it to illiteracy and culture of poverty; and very few of them attributed
it to heavy external debt. In Jigawa State, majority of the discussants attributed it to corruption,
unemployment and bad governance; few of them attributed it to culture of poverty; and very few
of them of them attributed it to illiteracy. A discussant from Osun State tagged FGD 1:2 stated
that ―that is absolutely impossible. With the level of corruption in Nigeria at all tiers of
government, poverty cannot be reduced; it will rather go up and up. The point is that those who
constitute government at all levels in Nigeria are concerned about themselves and their families

198
alone, so the poor masses stand no chance of getting off the poverty trap. As I am talking to you,
Nigeria is yet to fix the electricity problem we have been facing for decades despite the fact that
millions have been spent to do this as they have claimed but no result. If there is no corruption
and they truly spent millions, we should have uninterrupted electricity in Nigeria by now. Can a
country that cannot fix ordinary electricity problem take its citizens out of poverty? No! No!!
No!!!‖ From the same state, another discussant tagged FGD 1:4 said that ―Nigeria cannot halve
the rate of poverty by 2015. Unemployment is everywhere. Parents struggle to send their
children to different tertiary institutions so that they can have a better future but what do you get?
No jobs for them to do after graduation. Without employment, there is no income, and without
income, there is poverty. I do not see this condition is changing in years to come. Therefore, high
rate of poverty will persist in Nigeria beyond 2015.‖ From Jigawa State, a discussant tagged
FGD 2:3 stated that ―I do not agree that level of poverty in Nigeria can be halved by 2015. An
illiterate community is a doomed community and that is what a community like ours is. Here, too
many people are uneducated and very many others did not go beyond primary education. With
the low educational attainments our community is characterized by, there is no enough income
for people because their educational qualifications more often than not provides them with no
jobs or with jobs with very low pay or profit. This lack of enough income surely breeds poverty
in this community. And in as much as the government is not ready to provide qualitative
education for the old and young and since a lot of people are not ready to go to school in their
present form out of their lackadaisical attitudes, then poverty will be with us in this community
for a very long time.‖ Another discussant from the same state tagged FGD 2:8 stated that
―poverty is an inheritance in our community in most cases; it flows from generations to

199
generations and just few people can escape poverty if it is inherited. If poverty is an inheritance
and our government is insensitive to the plights of the poor, poverty will persist beyond 2015.‖
5.3. Analysis of the Quantitative Elements of the Research Based on Administered
Questionnaires
5.3.1 Socio-Economic Characteristics of the Family Households in the Research Study
Areas
5.3.1.1 Gender of the Family Household Head
Table 5.1 Osun and Jigawa States - Gender of Family Household Head
Gender of Family Household Head Osun State Jigawa State
Frequency Percentage (%) Frequency Percentage (%)
Male Family Household Heads 46 85.2 56 93.3
Female Family Household Heads 8 14.8 4 6.7
Total 54 100 60 100
Fig 5.1 Osun and Jigawa States - Gender of Family Household Head
0
10
20
30
40
50
60
70
80
90
100
Osun State Jigawa State
Gender of Family Household Head
Perc
en
tag
e
Male Family Household Heads
Female Family Household Heads

200
Comparison between the two states with respect to the gender of the family household head
reveals that the proportion of male-headed family households in Jigawa State is 9.5% higher
than that of Osun State while the proportion of female-headed family households in Jigawa State
is 54.7% lesser than that of Osun State.
5.3.1.2 Age of the Family Household Head
Table 5.2 Osun and Jigawa States - Age of Family Household Head
Age of Family
Household Head
Osun State Jigawa State
Frequency Percentage (%) Frequency Percentage (%)
Below 25 yrs 1 1.8 5 8.3
26 – 39 yrs 13 24.1 14 23.3
40 – 54 yrs 27 50.0 16 26.7
55 - 64 yrs 13 24.1 25 28.3
65 yrs and Above 0 0.0 0 13
Total 54 100 60 100
Fig 5.2 Osun and Jigawa States - Age of the Family Household Head
Comparison between the two states with respect to the age of the family household head
reveals that the proportion of family household heads who are below 25 years, 26 – 39 years, 40
0
10
20
30
40
50
60
Below 25 yrs 26 – 39 yrs 40 – 54 yrs 55 - 64 yrs 65 yrs and
Above
Age of Family Household Head
Perc
en
tag
e
Osun State
Jigawa State

201
– 54 years, 55 - 64 years and 65 yrs and above in Jigawa State are 361.1% higher than, 3.3%,
46.6% lesser than, and 14.8% higher than that of Osun State.
5.3.1.3 Educational Attainment of the Family Household Head
Table 5.3 Osun and Jigawa States - Educational Attainment of Family Household Head
Educational Attainment of Family
Household Head
Osun State Jigawa State
Frequency Percentage (%) Frequency Percentage (%)
No Education 5 9.3 17 28.3
Primary/Quaranic 9 16.7 15 25.0
Secondary/ Technical 13 24.1 12 20.0
NCE/ND 5 9.3 2 3.3
First Degree/HND 16 29.6 11 18.3
Master Degree 4 7.4 2 3.3
Doctorate Degree 2 3.7 1 1.7
Total 54 100 60 100
Fig 5.3 Osun and Jigawa States - Educational Attainment of the Family Household Head
Comparison between the two states with respect to family household head educational
attainment reveals that the family household heads in Osun State are more educated than those in
0
5
10
15
20
25
30
35
No
Educat
ion
Primar
y/Q
uara
nic
Secon
dary
/ Tec
hnical
NCE/N
D
First D
egree/
HND
Mas
ter D
egre
e
Doc
tora
te D
egre
e
Educational Attainment of Family Household Head
Perc
en
tag
e
Osun State
Jigawa State

202
Jigawa State. While the proportion of family household heads who attained doctoral, master, first
degree, college and secondary levels of education in Osun State are 54.1%, 55.4%, 38.8%,
64.5%, and 17.0% higher than that of Jigawa State; the proportion of those who attained primary
level of education and those with no education in Osun State are 49.7% and 67.1% lower than
that of Jigawa State.
5.3.1.4 Employment Status of the Family Household Head
Table 5.4 Osun and Jigawa States - Employment Status of Family Household Head
Employment Status of Family
Household Head
Osun State Jigawa State
Frequency Percentage (%) Frequency Percentage (%)
Full time employment/Self
employment
40
74.1
41
68.3
Part time employment 6 11.1 7 11.7
Unemployed 8 14.8 12 20.0
Student 0 0.0 0 0.0
Total 54 100 60 100
Fig 5.4 Osun and Jigawa States - Employment Status of the Family Household Head
0
10
20
30
40
50
60
70
80
90
Full time
employment/Self
employment
Part time employment Unemployed Student
Employment Status of Family Household Head
Perc
en
tag
e
Osun State
Jigawa State

203
Comparison between the two states with respect to the employment status of the family
household head reveals that the family household with full time employment/self employment,
with part time employment and those that are unemployed in Osun State are 7.8% higher than,
5.4% and 35.1% lesser than the proportion of those in Jigawa State.
5.3.1.5 Family Household Head Monthly Income
Table 5.5 Osun and Jigawa States - Family Household Head Monthly Income from Employment/Self Employment
Family Household Head Monthly
Income
Osun State Jigawa State
Frequency Percentage (%) Frequency Percentage (%)
Below N5000 1 1.9 7 11.7
N5001 – N99999 32 59.3 34 56.7
N100000 – N199999 10 18.5 11 18.3
N200000 – N299999 3 5.6 6 10.0
N300000 – N399999 3 5.6 2 3.3
N400000 – N499999 3 5.6 0 0.0
N500000 – N749999 2 3.7 0 0.0
N750000 – N999999 0 0.0 0 0.0
Above N1000000 0 0.0 0 0.0
Total 54 100 60 100
Fig 5.5 Osun and Jigawa - Family Household Head Monthly Income from Employment/Self Employment
0
10
20
30
40
50
60
70
Below
N50
00
N50
01 –
N99
999
N10
0000
– N19
9999
N20
0000
– N29
9999
N30
0000
– N39
9999
N40
0000
– N49
9999
N50
0000
– N74
9999
N75
0000
– N99
9999
Above
N10
00000
Family Household Head Monthly Income
Perc
en
tag
e
Osun State
Jigawa State

204
Comparison between the two states with respect to the family household head monthly
income from employment/self-employment reveals that the proportion of family household
heads whose monthly earnings are below N5000, at the range of N100000 – N199999, N200000
– N299999, N300000 – N399999, N400000 – N499999, and N500000 – N749999 in Osun State
are 515.8%, 1.08% lesser than, 78.6% higher than, 41.1 lesser than, 100% lesser than, and 100%
lesser than that of those in Jigawa State.
5.3.1.6 Family Household Size
Table 5.6 Osun and Jigawa States - Family Household Size
Family Household
Size
Osun State Jigawa State
Frequency Percentage (%) Frequency Percentage (%)
2 – 5 18 33.3 10 16.7
6 – 10 30 55.6 15 25.0
11 – 15 5 9.3 17 28.3
Above 15 1 1.9 18 30.0
Total 54 100 60 100
Fig 5.6 Osun and Jigawa States - Family Household Size
0
10
20
30
40
50
60
2 – 5 6 – 10 11 – 15 Above 15
Family Household Size
Perc
en
tag
e
Osun State
Jigawa State

205
Comparison between the two states with respect to family household size reveals that t
family households in Osun State, Family Household numbered 2 – 5, family household
numbered 6 – 10, family household numbered 11 – 15, and family household numbered above
15 are 49.8% higher than, 55.0% higher than, 204.3% lesser than and 1478% lesser than those in
Jigawa State.
5.3.2 Levels of Income Poverty: Foster, Greer and Thorbecke (FGT) Headcount
Calculations Based on the International Market Exchange Rate
Based on the samples of this research, the proportion of people in income poverty was
calculated using the FGT formula for calculating poverty headcount ratio. Foster, Greer and
Thorbecke (1984) give the formula for calculating proportion of people in poverty (headcount
ratio) thus:
P0 is the proportion of people living below US$1.25 a day (people in income poverty) in
the study areas; N is the total number of people contained in the samples of the study areas for
the research; and Np is the total number of people contained in the samples of the study areas of
the research living below US$1.25 a day (people in income poverty).
5.3.2.1 Osun State: FGT Calculation of the Proportion of People in Income Poverty
Using the formula above, the proportion of people living below US$1.25 in Osun State is
calculated thus: N = 353 and Np = 221. Therefore, P0 = 353
221 = 0.6261
Conversion of P0 above from a decimal to percentage is calculated thus: 0.6260 x 100 = 62.6%.
Therefore, the proportion of people living below US$1.25 a day in Osun State is 62.6% while the
proportion of people living on US$1.25 or above a day in the state is 37.4%.

206
5.3.2.2 Jigawa State: FGT Calculation of the Proportion of People in Income Poverty
Using the formula above, the proportion of people living below US$1.25 Jigawa State is
calculated thus: N = 696 and Np = 487. Therefore, P0 = 696
487 = 0.69971
Conversion of P0 above from a decimal to percentage is calculated thus: 0.69971 x 100 = 69.97%
Therefore, the proportion of people living below US$1.25 a day in Jigawa State is 70% while the
proportion of people living on US$1.25 or above a day in the state is 30% approximately.
Fig 5.7 Osun and Jigawa States – Proportion of Income Poor People at International Market Exchange Rate
0
10
20
30
40
50
60
70
80
Osun State Jigawa State
Daily Income
Perc
en
tag
e
Below US$1.25
US$1.25 and above

207
5.3.3 Levels of Income Poverty: Foster, Greer and Thorbecke (FGT) Headcount
Calculations Based on the Purchasing-Power-Parity Exchange Rate
5.3.3.1 Osun State: FGT Calculation of the Proportion of People in Income Poverty
Based on the samples of this research, the proportion of people in income was calculated
by adjusting the income poverty line from international market exchange rates of US$1.25
(N194.90) to PPP exchange rates of US$0.75 (N116.94).
Using the formula above, the proportion of people living below US$1.25 in Osun State is
calculated thus: N = 353 and Np = 133. Therefore, P0 = 353
133
Converting P0 above from a decimal to percentage is calculated thus: 0.3767 x 100 = 37.7%
Therefore, the proportion of people living below US$1.25 a day in Osun State is 37.7% while the
proportion of people living on US$1.25 or above a day in the state is 62.3%.
5.3.3.2 Jigawa State: FGT Calculation of the Proportion of People in Income Poverty
Using the formula above, the proportion of people living below US$1.25 Jigawa State is
calculated thus: N = 696 and Np = 292. Therefore, P0 = 696
292 = 0.4195
Converting P0 above from a decimal to percentage is calculated thus: 0.4195 x 100 = 41.95%.
Therefore, the proportion of people living below US$1.25 a day in Jigawa State is 42% while the
proportion of people living on US$1.25 or above a day in the state is 58% approximately.

208
Fig 5.8 Osun and Jigawa States – Proportion of Income Poor People at PPP Exchange Rate
Comparison between the two states with respect to the level of income poverty based on
the international market exchange rate reveals that the level of income poverty in Jigawa State is
11.8% higher than that of Osun State; and based on the PPP exchange rate, the level in Jigawa
State is 11.4% higher than that of Osun State. Within Jigawa State, the level of income poverty
based on the international market exchange rate is 66.7% higher than the level being based on
the on the PPP exchange rate; and in Osun State, the former is 66% higher than the latter.
5.3.4 Test of Research Hypotheses Based on the International Market and the Purchasing-
Power-Parity Exchange Rates
The data is a categorical data, Categorical Regression (CATREG) analysis was used to
analyze the data. The decision rule shall be 0.05. If the p value of the analysis is less 0.05, the
0
10
20
30
40
50
60
70
Osun State Jigawa State
Daily Income
Perc
en
tag
e
Below US$1.25
US$1.25 and above

209
null hypothesis (H0) will be accepted and the alternative hypothesis (H1) will be rejected but if
otherwise, then, the H1 will be accepted and the H0 will be rejected. Income poverty serve as
the dependent variable while the household head‘s gender, age, educational attainment,
employment, family size and geographical location of the household serve as the
independent variables.
In Osun State, the p-values of using the daily income poverty line at the international
market exchange rate to test the relationship between the household head‘s gender, age,
educational attainment, employment, family size and geographical location of the
household and income poverty 0.454, 0.217, 0.492, 0.451, 0.210, and 0.129 respectively. This
means that the null hypotheses are rejected while the alternative hypotheses are accepted in all.
This suggests that there are significant relationships between the household head‘s gender,
age, educational attainment, employment, family size and geographical location of the
household gender of a family household head and income poverty in the state. In Jigawa State,
the p-values of using the daily income poverty line at the international market exchange rate to
test the relationship between the household head‘s gender, age, educational attainment,
employment, family size and geographical location of the household and income poverty
0.541, 0.262, 0.511, 0.475, 0.253, and 0.152 respectively. This means that the null hypotheses
are rejected while the alternative hypotheses are accepted in all. This suggests that there are
significant relationships between the household head‘s gender, age, educational attainment,
employment, family size and geographical location of the household gender of a family
household head and income poverty in the state.

210
In Osun State, the p-values of using the daily income poverty line at the PPP exchange rate
to test the relationship between the household head‘s gender, age, educational attainment,
employment, family size and geographical location of the household and income poverty
0.599, 0.129, 0.308, 0.401, 0.109, and 0.115 respectively. This means that the null hypotheses
are rejected while the alternative hypotheses are accepted in all. This suggests that there are
significant relationships between the household head‘s gender, age, educational attainment,
employment, family size and geographical location of the household gender of a family
household head and income poverty in the state. In Jigawa State, the p-values of using the daily
income poverty line at the PPP exchange rate to test the relationship between the household
head‘s gender, age, educational attainment, employment, family size and geographical
location of the household and income poverty 0.521, 0.100, 0.311, 0.455, 0.202, and 0.2.53
respectively. This means that the null hypotheses are rejected while the alternative hypotheses
are accepted in all. This suggests that there are significant relationships between the household
head‘s gender, age, educational attainment, employment, family size and geographical
location of the household gender of a family household head and income poverty in the state.
5.4 Discussion of Research Findings
This section highlights the relationships between the findings of both the qualitative and
quantitative elements of this research and the rates at which the research findings of this study
align with the positions and claims of authors and reports in both chapters two and three.
5.4.1 Levels of Income and Food Poverty in the Study Areas
The findings of the qualitative element of this research with respect to the levels of income
and food poverty in the study areas are in two folds. Much of the findings reveal that in general,
the levels of income and food poverty in the study areas are high. These findings of the

211
qualitative element of this research are confirmed by the results of the quantitative elements of
the research. At the individual level, the results reveal that based on the international market
exchange rate in both Osun and Jigawa States, the level of income poverty is high with income
poverty rates of 62.6% and 70% respectively. However, based on the PPP exchange rate, the
results reveal that the level of income poverty at the individual level is moderate in Osun States
at 37.7% and a bit higher in Jigawa State at 42%. The aspect of the two findings that suggests
that the levels of income and food poverty are high in the study areas aligns with the positions of
NBS (2012a) which reveals that levels of income and food poverty are high in Jigawa State
based on the international market exchange rate. This aspect of the findings does not align with
the position of the same report which reveals that levels of income and food poverty are
moderate/low in Osun State based on the same exchange rate (see chapters one and four).
5.4.2 Probable Determinants of Poverty in the Study Areas
The findings of the qualitative element of this research with respect to the likely
determinants of income and food poverty in the study areas suggest a number of factors as
having likely association with income and food poverty. These factors include corruption,
unemployment, educational attainment, family/household size, form of employment, inadequate
education/poor educational system, and individual deficiencies/laziness, culture of poverty,
geographical location of family/household, and both age and gender factors within the
family/household. Some of these findings of the qualitative element of this research that revolve
around the individual and the family household which are this research units of analysis are
confirmed by the results of the quantitative elements of the research. The results reveal that
based on the international market and the PPP exchange rates in both Osun and Jigawa States,
factors such as the gender of the family household head, age of the family household head,

212
educational attainment of the family household head, employment status of the family household
head, family household size, and family household geographical location have some levels of
association with income poverty and food poverty (see chapter five).
Likely association of employment/unemployment with income and food poverty by the
findings of this research aligns with the positions of Ucha (2010) and Englama (2001) which
clarify unemployment as a dominant factor responsible for poverty in Nigeria (see chapter two).
It aligns with the position of Osinubi (2005) which states that the most very poor in the country,
in most cases, are the ones with no regular employment or those in unstable part-time
employment (see chapter two). Again, it aligns with the position of Aiyedogbon and Ohwofasa
(2012) which confirms that unemployment impacts on the level of poverty in Nigeria; and whose
findings further confirm that a unit increase in employment was responsible for 0.02 percent
increase in poverty between 1987 and 2011 in Nigeria (see chapter two). Likely association of
the form of employment with income and food poverty by the findings of this research aligns
with the positions of Appleton, Mckay and Alayande (2008) and Anyanwu (2012) which confirm
form of employment/sector of employment as a determinant of the level of poverty (see chapter
two).
Probable association of educational attainment with income and food poverty by the
findings of this research aligns with the positions of OSSAP-MDGs (2010a; b) and Ojowu et al.
(2004) which state that household with heads that have got little or no education experience the
highest poverty incidence, depth and severity (see chapter two). It further aligns with the
findings of Appleton, Mckay and Alayande (2008) where it is confirmed that a household
where all members completed their schooling has welfare of up to 24% higher than a household
of comparable measure whose members are all unschooled (see chapter two). Finally, it aligns
213
with the positions of UNFPA (2002), Akerele and Adewuyi (2011), Bastos, et al. (2009),
Canagarajah, Ngwafon and Thomas (1997), Anyanwu (2012), UNDP (2009), Ucha (2010) and
Ijaiya and Nuhu (2011) which all confirm that there exists wealth differences owing to the level
of school attainment; that low educational attainment leads to high level of poverty, and that
lack of education has an overwhelming characteristic among the extreme poor in Nigeria (see
chapters two and three).
Likely association of family/household size with income and food poverty by the findings
of this research aligns with the position of Lanjouw and Ravallion (1994) which confirms that
the level of poverty is higher in large families (see chapter two). It aligns with the position of
UNDP (2009) which confirms that the incidence of poverty is high in large households and that
poverty incidence increases with household size (see chapter two). It aligns with the positions of
Anyanwu (2005) and Omonona (2010) which confirm that household size is the most important
factor determining poverty and that there exists a significant reduction in the welfare of large
family in Nigeria (see chapter three). It further aligns with the positions of Akerele and Adewuyi
(2011); Etim and Ukoha (2010); and Ijaiya and Nuhu (2011) which all establish a link between
poverty and family/household size (see chapter two).
Probable association of geographical location of a family household and the age and
gender factors with income and food poverty by the findings of this research aligns with the
position of Appleton, Mckay and Alayande (2008) and Anyanwu (2010; 2012) which analyze
that where one lives raises and lowers one‘s welfare, which impliedly points to a notion that
location variables are connected to the level of poverty; and which analyze that the age and
gender of the family/household head and the age composition of the family/household determine
the levels of poverty within families/households (see chapter two).

214
Other factors with likely association to income and food poverty are exclusive to the
findings of the qualitative element of this research. These factors include corruption which aligns
with the position of Chetwynd, Chetwynd and Spector (2003) which states that there exists an
indirect correlation between poverty and corruption thereby qualifying corruption as a
determinant of poverty in general (see chapter two); Ucha (2010) which states that corruption is
hugely perpetrated in Nigeria by politicians and government officials who are in constant habit
of stealing public funds at the expense of the populace thereby multiplying poverty (see chapter
two); and Transparency International (2008) and Ogboru (2007) which state that a relationship
exists between corruption and poverty in Nigeria as funds meant for poverty reduction are often
diverted into private pockets thereby having a negative effect on economic growth and
investments in human capital, the result of which is the multiplication of poverty (see chapter
two). The factors further include inadequate education/poor educational system which aligns
with the positions of Gueye and Gauci (2003), UNFPA (2002) and Ucha (2010) which clarify
that poor quality of schools begets inadequate education which makes getting income-generating
jobs difficult, thereby heightening the level of poverty (see chapters two and three); individual
deficiencies/laziness which aligns with the positions of Bradshaw (2006), Jordan (2004), Loewen
(2009), Andy (2011), and Ucha (2010) which state that individual inefficiency/laziness is a
determinant of poverty in that poverty is well connected to characteristics that are deep-rooted in
individuals such as a person‘s habit and abilities like intelligence and overdependence on family
fortunes (see chapters two and three); and culture of poverty which aligns with the positions of
Bradshaw (2006), Lewis and La Farge (1959), Lewis (1964; 1966), Rodgers (2000), and
Shulman (1990) which state that culture of poverty is a determinant of poverty on the premise
that that poverty is generational, that is, it is passed from one generation to the other (see chapter

215
three). Lastly, the factors include overpopulation which aligns to the positions of Malthus (1798)
which sees overpopulation as a determinant of poverty under which it is said that poverty is one
of the effects of a situation where supply of food is lower than the human population; and UN
(2005b) which states that global inequality is a cause/determinant of poverty based on an
assertion that inequality is evident in health, education, employment, gender and opportunities
for social and political participation between the Global North and Global South which
precipitate poverty (see chapter three).
5.4.3 Progress towards Attaining the MDGs’ Targets on Poverty Reduction
The findings of the qualitative element of this research with respect to the progress
towards the attainment of the MDGs‘ targets on poverty reduction in both Osun and Jigawa
States reveal that the progress is negative suggesting that it is unlikely these targets of the MDGs
are met. The links between the findings of the qualitative and the quantitative elements of this
research with respect to the progress of the MDGs are in two folds. Firstly, the findings of the
qualitative element of this research are confirmed by the results of the quantitative elements of
the research. As the revelation of findings of the qualitative element of this research, the findings
of the quantitative elements of this research reveal that the levels of income and food poverty are
high in the two states based on the international market exchange rate in both states suggesting
that the progress towards the attainment of the MDGs‘ targets on poverty reduction in the two
states is slow and thereby negative. Also, the findings of the qualitative element of this research
are confirmed by the results of the quantitative elements of the research in Jigawa State. The
findings reveal that based on the PPP exchange rate in this state, the level of food poverty is high
suggesting that the progress towards the attainment of the MDGs‘ targets on poverty reduction
with respect to food poverty in this state is slow and thereby negative. Secondly, the findings of

216
the qualitative element of this research are refuted by the results of the quantitative elements of
the research. Contrary to the findings of the qualitative element of this research, the findings of
the quantitative elements of this research based on the PPP exchange rate in both states reveal
that the level of income poverty is moderate in the two states suggesting that the progress
towards the attainment of the MDGs‘ targets on poverty reduction in the two states is fine and
thereby positive. The findings further reveal that in Osun State, the level of food poverty is
moderate suggesting that the progress towards the attainment of the MDGs‘ targets on poverty
reduction with respect to food poverty in this state is fine and thereby positive (see chapter five).
The aspect of the findings of the research that reveals that the levels of income and food poverty
are high in the two states suggesting that the progress towards the attainment of the MDGs‘
targets on poverty reduction in the two states is slow and thereby negative aligns with the
positions of Alabi and Adams (2011), Chete (2009), Bello and Rosland (2010), Essien and
Usenobong (2009), Ogunmola and Badmus (2010); Ogege (2012), NPC (2004b), NPC (2007),
and OSSAP-MDGs (2008; 2010a) which all state that it is unlikely Nigeria will meet the MDGs‘
targets on poverty reduction (see chapter two).
The negative progress towards the attainment of the MDGs‘ targets on poverty reduction
in the two states is attributed to some factors which are exclusive to the findings of the
qualitative element of this research. These factors include corruption which aligns with the
positions of Alabi and Adams (2011) which emphasize corruption in the use of MDGs fund;
Essien and Usenobong (2009) which list corruption as a clog in the wheel of progress of
Nigeria‘s attainment of the MDGs by 2015; Ogunmola and Badmus (2010) which attribute the
impossibility of meeting the 2015 targets to the implementation of MDGs that is beclouded with
deeply entrenched corruption; Ogege (2012) which states that the uncertainty of meeting the

217
MDGs is attributable to corruption which reinforces and sustains the culture of poverty; and NPC
(2004b) which states that corruption is key to the reason Nigeria cannot meet the MDGs by
2015 (see chapter two).
The negative progress is also attributed to bad governance which aligns with the position
of Ogunmola and Badmus (2010) which attribute Nigeria‘s uncertainty of meeting the MDGs‘
targets to bad governance generated from gross inefficiency, wastefulness poor administration
and lack of political will; with Ogege (2012) which attributes Nigeria‘s uncertainty of being able
to meet the MDGs‘ targets to bad governance which reinforces and sustains the culture of
poverty; and NPC (2007) and OSSAP-MDGs (2008) which both attribute Nigeria‘s uncertainty
of meeting the MDGs‘ targets to bad governance (see chapter two). The negative progress is
further attributed to unemployment which aligns with the position of Ogege (2012) which states
that the uncertainty of meeting the MDGs is attributable to unemployment which reinforces and
sustains the culture of poverty (see chapter two).
Culture of poverty is claimed to be one of the attributes responsible for Nigeria‘s
uncertainty of meeting the MDGs‘ targets by the findings; this aligns with the position of Ogege
(2012) which maintains that poverty breeds poverty in Nigeria through time which
metamorphoses in a force of culture which is transmitted from one generation to another in a
cyclical manner with no beginning and no end to the cycle (see chapter two). Illiteracy and
heavy external debt are further claimed to be attributes responsible for Nigeria‘s uncertainty of
meeting the MDGs‘ targets, this aligns with the position of Essien and Usenobong (2009) which
attribute Nigeria‘s uncertainty of being able to meet the MDGs by 2015 to illiteracy particularly
in the rural areas. Finally, the negative progress is attributed to heavy external debt which aligns
with the position of NPC (2004b) which attributes Nigeria‘s uncertainty of being able to meet the

218
MDGs by 2015 to heavy external debt which is expressed to be a burden on the finances of the
government and economy as a whole, and to poor resource utilization.
The findings do not align with the positions of Alabi and Adams (2011), Chete (2009),
Essien and Usenobong (2009), and OSSAP-MDGs (2010b) which all claim that global
crisis/climate change is an attribute to Nigeria‘s uncertainty of being able to meet the MDGs‘
targets; NPC (2007) and OSSAP-MDGs (2008; 2010b) which all state that insufficient data is
one of the reasons Nigeria will not meet the MDGs‘ targets; and finally, Nweke (2012) which
attributes Nigeria‘s uncertainty of being able to meet the MDGs‘ targets to culture of state
capitalism and capitalist accumulation which greatly impact on MDGs by inducing the managers
of the programme to turn its implementation into a means for political patronage.

219
CHAPTER SIX
CONCLUSION AND AGENDA FOR FURTHER RESEARCH
6.1 Introduction
The objective of this chapter is to give a summary of this study, including an overview of
the findings of the study, and establish the links between the research findings and the
positions/claims of authors/reports on the levels of income and food poverty in the study areas to
suggest the progress towards attaining the MDGs‘ targets on the reduction of extreme poverty
and hunger in the study areas. It further highlights the major contributions of the study to
knowledge in the area of the United Nations MDGs targets on alleviating extreme poverty and
hunger within the context of Nigeria‘s States of Osun and Jigawa.
6.2 Summary and Conclusion
The aims of this research work were to explore the literature on the MDGs, concept of
poverty, poverty in Nigeria, and the progress of the MDGs in Nigeria with respect to poverty
reduction; describe the idea of development and the general causes and consequences of poverty
across the globe; investigate and analyze the levels of income and food poverty in the study
areas to assess the progress of the MDGs‘ targets on extreme poverty reduction in the areas; test
the relationships among variables in the study areas to suggest the determinants of income
and food poverty in the areas; compare the socio-economic characteristics of the family
households in the study areas; and suggest measures the study areas and Nigeria as a whole could
take to further reduce the level of poverty to make further progress towards the attainment of
MDGs‘ targets on extreme poverty reduction. This study also gave a brief overview of the study
areas, Osun and Jigawa States.

220
This research explored the literature on the characteristics of the MDGs by giving its brief
description, enumerating its goals, targets and indicators, and giving an account of its global
progress on poverty reduction. The research further explored the literature on the description of
poverty and the poor, different approaches to poverty; poverty in Nigeria; percentages of the
income poor; the food poor and the population living in poverty in Nigeria; major determinants
of poverty in Nigeria; progress of the MDGs‘ targets on poverty reduction in Nigeria; and the
poverty reduction strategies in Nigeria. Also, it presented a description of development by
looking at it from the historical background and from what the concept has meant over the years
from different perspectives, and their links to the MDGs. The chapter also gives theoretical
explanations of the causes of poverty and gives a description of the major causes and
consequences of poverty across the globe.
This study stated the individual and the family household as its units of analysis. It
itemized the research independent variables which included the gender, age, educational
attainment, and employment status of the family household head, family household size and
family household geographical location income; and the research dependent variables which
included income and food poverty; listed the hypotheses tested by the study; described the
research method employed by the study which was the mixed methods research, comprising both
the quantitative and qualitative methods; described the method of collecting the primary
quantitative data for the study which was by administration of questionnaires; described its
method of collecting the primary qualitative data for the study which was via the FGDs. The
study described data analysis techniques of the study which involved the use of descriptive
statistics and multivariate analysis; and the software package used in the analysis of the
quantitative data of the research which was the SPSS, and the methods used in the analysis of the

221
qualitative data of the research which involved a process that took a form of the scissor-and-sort
technique with the addition of the computer knowledge of the researcher.
The research investigated and analyzed the levels of income and food poverty to verify
existing claims on the levels of income and food poverty in Nigeria‘s States of Osun and Jigawa.
This was done by collecting its primary qualitative data of the research through the FGDs in the
study areas and the quantitative data for the research via the administration of questionnaires on
family households in the study areas. Analysis of the qualitative data was purely in a non-
numerical form; while the analysis of the quantitative data was presented via descriptive
statistics and multivariate analysis with frequency tables and bar charts. Furthermore, the
quantitative analysis of the levels of income and food poverty in the study areas were presented
via the results of the FGT calculations which revealed the proportion of family adult members
who were income poor, and the proportion of family adult members who were food poor. The
yardstick used to measure income poverty was ‗living below US $1.25 per day‘ based on the
daily earnings or income of family adult members at both the international market and the PPP
exchange rates; while the yardstick used to measure food poverty was consuming below 2,900
calories per day‘ based on the daily cost of these number calories for family adult members at
both the international market and the PPP exchange rates.
This study investigated and analyzed the likely determinants of poverty in the study areas
to verify existing claims on the determinants of poverty in Nigeria by making an enquiry into the
determinants of poverty in these areas. This was done through qualitative and quantitative data
collected via the administered questionnaires and FGDs in the study areas which were
subsequently analyzed. The findings of the study suggested negative progress towards the
attainment of the MDGs‘ targets on poverty reduction based on the international market

222
exchange rate, while it suggested a positive progress towards the attainment of the MDGs‘
targets on poverty reduction based on the PPP market exchange rate.
Finally, the results from the entire analysis of both the quantitative and qualitative data of
this research were linked to establish the levels of confirmation and refutation. They were further
used to verify the level and determinants of income and food poverty in study areas by
highlighting the rates at which the research findings of the study align to the positions and claims
of authors and reports that existed prior this study.
This study found the rates of income and food poverty in the study areas which suggested
the level of progress towards attaining the MDGs‘ targets on the reduction of extreme poverty
and hunger with attributes associated with the progress level; and it revealed the factors with
possible association with income and food poverty. The study further found out the relationships
between independent and dependent variables of the research
The aforementioned achievements of this study thus suggests links to the position of NBS
(2012a) on the levels of income and food poverty in Nigeria‘s States of Osun and Jigawa (see
chapters one, three and six). The achievements of the study through its findings on the
determinants of income and food poverty suggests links to Chetwynd, Chetwynd and Spector
(2003); Ucha (2010), Transparency International (2008); Ogboru (2007); Englama (2001);
Osinubi (2005); Aiyedogbon and Ohwofasa (2012); OSSAP-MDGs (2010a; b); Ojowu et al.
(2004); Appleton, Mckay and Alayande (2008); UNFPA (2002); Akerele and Adewuyi (2011);
Bastos, et al., 2009); Canagarajah, Ngwafon and Thomas (1997); Anyanwu (2010; 2012); UNDP
(2009); Ijaiya and Nuhu (2011); Lanjouw and Ravallion (1994); UNDP (2009); Anyanwu
(2005); Omonona (2010); Etim and Ukoha (2010); Gueye and Gauci (2003); UNFPA (2002);
Bradshaw (2006); Jordan (2004); Loewen (2009); Andy (2011); Lewis and La Farge (1959);

223
Lewis (1964; 1966); Rodgers (2000); Shulman (1990); and UN (2005) (see chapters one, two,
three, and six).
Also, the achievements of this study through its findings on the progress towards attaining
the MDGs‘ targets on the reduction of extreme poverty and hunger and the factors attributed to
the level of progress suggests links to NBS (2005); Alabi and Adams (2011); Chete (2009);
Bello and Rosland (2010); Essien and Usenobong (2009); Ogunmola and Badmus (2010); Ogege
(2012); NPC (2004b); NPC (2007); and OSSAP-MDGs (2008, 2010a) (see chapters one, two,
three, and six). Finally, the achievements of the study through its findings on the relationships
between income poverty and educational attainment on one hand, and between food poverty and
family household size on the other establish links to Appleton (2001); UNDP (2009); (Bastos, et
al. (2009); Ucha (2010); Canagarajah, Ngwafon, and Thomas (1997); Ojowu et al. (2004);
OSSAP-MDGs (2010a; b) Akerele and Adewuyi (2011); and Anyanwu (2005; 2012); Appleton,
Mckay and Alayande (2008); Lanjouw and Ravallion (1994); Omonona (2010); UNDP (2009);
Etim and Ukoha 2010; and Ijaiya and Nuhu (2011) (see chapters one, two, three, and six).
The précis of this conclusion section is that based on the international market exchange
rate, the levels of income and food poverty in the study areas are high suggesting that the
progress towards attaining the MDGs‘ targets on the reduction of extreme poverty and hunger in
the study areas is negative. But based on the PPP exchange rate, the levels of income and food
poverty are moderate suggesting that the progress towards attaining the MDGs‘ targets on the
reduction of extreme poverty and hunger in the study areas is positive. Thus, what the states
captured by the research and Nigeria as a whole can do is to take some measures to alleviate
poverty in general is to increase the prospect of meeting the MDGs‘ targets on the reduction of
extreme poverty and hunger.

224
6.3 Agenda for Further Research
The study has some limitations. One of them is that the findings of its quantitative element
could not be generalized to the entire population of Nigeria‘s States of Osun and Jigawa because
a non-random sampling in form of a pseudo-random sampling method was used in collecting the
primary quantitative data through questionnaire admimistration. Though, this limitation did not
adversely affect the findings generated from questionnaire administration because the study did
not make a choice of the questionnaire administration because it was hell bent on proving
causality between varaiables and generalizing the findings from the exerice but rather, it used the
questionnaire administration for research expedition which was achieved.
In view of this limitation, it is suggested that a further large-scale research on the levels of
income and food poverty in the study areas that uses a random sampling method which involves
the use of the Enumeration Areas (EAs) demarcated by the National Population Commission for
the 2006 Housing and Population Census in the country‘s entire 774 LGAs should be carried out
in the study areas so that the findings from such a large-scale study will be generalizeable to the
entire population of the study areas to an extent possible.
Another limitation of the research is that it made no adjustments with reference to the
difference in the caloric requirements for both sexes in its calculation of food poverty in the
study areas. It assumed the same caloric requirements for both sexes in line with the position of
Nigeria‘s National Bureau of Statistics which set a food poverty line of N39,759.49, an amount
that could feed an average Nigerian up to a minimum calorific intake of 2900/3000 per day.
Though, this flowed well with the study because it adopted the same methodology used by the
NBS whose poverty line was used as yardstick for the measurement of food poverty in the study
areas.

225
In view of this limitation, it is suggested that a further research on food poverty based on
daily minimum caloric requirement in the study areas should involve multiple adjustments based
on factors such as age, body weight, physical activity, pregnancy, lactation, infection and
rehabilitation so that the findings from such a research will reduce the level of bias.
.
226
APPENDICES
Appendix 1
THE CONSENT FORM AND ATTACHED INFORMATION
The Thesis Title: Progress towards Achieving the United Nations First Millennium
Development Goal: An Analysis of Income and Food Poverty in Nigeria’s States of Osun
and Jigawa
I have read and understood the information sheet and this consent form. I have had an
opportunity to ask questions about my participation.
I understand that I am under no obligation to take part in this study.
I agree to participate in this study.
Name of participant:
Signature of participant:
Signature of researcher:
Date:
Ponnle Solomon Lawson
Email: [email protected]
Mobile: +447576102893; +2348033264154

227
INFORMATION
This Focus Group Discussion exercise is to collect information from the participants.
The collected information will be used for research purposes (see consent form for
research topic)
Participants can choose to stop at any time without penalty
Participation is anonymous and confidential except for person(s) involved in the research
work.
Access to the recording tapes is exclusive to the researcher.

228
Appendix 2
FOCUS GROUP DISCUSSION THEMES AND QUESTIONS
Theme 1: The Meaning of Poverty
Question: What does poverty mean to you?
Theme 2: Levels of Income and Food Poverty
Question: What are the levels of income and food poverty in your community?
Theme 3: Factors with Probable Association with Income and Food Poverty
Question: Which factors have probable association with income and food poverty within your
community?
Theme 4: Progress towards Attaining the MDGs’ Targets on Poverty Reduction
Question: In your assessment, is the level of progress by the government towards reducing
poverty in your community positive or negative? Give reasons for your answer.

229
Appendix 3
QUESTIONNAIRE
Dear Sir/Madam,
I am currently a research student of International Relations at the Nottingham Trent University,
United Kingdom. I am conducting a research on the Nigeria‘s Prospects of attaining the
Millennium Development Goals‘ (MDGs) targets on poverty reduction by 2015. Specifically, I
would be looking at the level and causes of poverty as it relates income and food poverty in
Nigeria and the country‘s prospects of attaining of the MDGs targets on poverty reduction by
2015.
It would be much appreciated if you could help complete this questionnaire. The information
obtained would be used for the purpose for which it is meant stated above. Information gathered
from you would be treated as confidential; results would be collated and presented anonymously.
Thank you in advance for taking time and effort to complete this questionnaire.
Yours sincerely,
Ponnle Solomon Lawson
Nottingham Trent University, U.K

230
Questionnaire Questions
NOTE: Please mark X where applicable
1. Please confirm your gender
o Male----------
o Female----------
2. How old are you?
o Below 25----------
o 26 - 40----------
o 41 – 55----------
o 56 - 70 ----------
o Above 70----------
3. What is responsible for your being the head of your household?
o Father/Husband ----------
o Widow----------
o Single Mother ----------
4. How many people do you have in your household including you?
o 2 - 5----------
o 6 - 10----------
o 11 – 15----------
o 16 - 20 ----------
o 21 - 30----------
5. How many adult people (aged 15-64) do you have in your household including you?
6. What is your level of academic attainment?
o No Schooling----------
o Primary/Quaranic----------
o Secondary----------
o Technical----------
o NCE/ND----------
o HND/University----------
o Apprenticeship
o Others----------
7. What are levels of academic attainment of the other adult members of your household? Please complete this on
the continuation form.

231
8. What is your employment status?
o Full time employment ----------
o Part time employment
o Unemployed----------
o Student----------
9. How much do you earn monthly from employment?
o Below N5000 (US$32) ----------
o N5001 (US$32) – N9999 (US$64) ----------
o N10000 (US$65) – N19999 (US$129) ----------
o N20000 (US$130) – N29999 (US$194) ----------
o N30000 (US$195) – N39999 (US$258) ----------
o N40000 (US$259) – N49999 (US$323) ----------
o N50000 (US$324) – N74999 (US$483) ----------
o N75000 (US$484) – N99999 (US$645) ----------
o N100000 (US$646) – N149999 (US$968) ----------
o N150000 (US$131) – N199999 (US$1290) ----------
o N200000 (US$1291) – N299999 (US$1935) ----------
o N300000 (US$1936) – N399999 (US$2581) ----------
o N400000 (US$324) – N499999 (US$3226) ----------
o N500000 (US$3227) – N749999 (US$4839) ----------
o N750000 (US$4840) – N999999 (US$6452) ----------
o Above N1000000 (US$6453) ----------
10. Do you get money from any other sources apart from employment on monthly basis?
11. If YES, how much do you get from other sources apart from employment?
o Please state amount ----------
12. What is the employment status of other adult members of your household? Please complete this on the
continuation form.
13. How much do the other adult members of your household earn from employment? Please complete this on the
continuation form.
14. Do the adult members of your household get money from any other sources apart from employment on monthly
basis? Please complete this on the continuation form.
15. If YES, how much do the adult members of your household get from other sources apart from employment?
Please complete this on the continuation form.
o Please state amount ----------

232
16. How many times does your household feed in a day?
o Once----------
o Twice
o Thrice----------
o More than Thrice----------
17. What is the cost of feeding the members of your household daily?
o Please state amount ----------
18. Do your household get food from any other sources on daily or monthly basis apart from purchase from the
market?
o Yes ----------
o No ----------
19. If YES, what is the cost of such food from any other sources on monthly basis?
o Please state amount ----------
20. Do you eat outside your household cooking?
21. If YES, how much does out of household feeding cost you daily?
o Please state amount ----------
22. Do the adult members of your household eat outside your household cooking?
23. If YES, how much does out of household feeding cost the adult members of your household daily? Please
complete this on the continuation form
o Please state amount ----------
24. Do you consider your household poor?

233
Questionnaire Questions Continuation Sheet
One Continuation sheet per Adult Member of a Family Household
1. What is the level of academic attainment of the adult member of your household?
o No Schooling----------
o Primary/Quaranic----------
o Secondary----------
o Technical----------
o NCE/ND----------
o HND/University----------
o Apprenticeship
o Others----------
2. What is the employment status of the adult member of your household?
o Full time employment ----------
o Part time employment
o Unemployed----------
o Student----------
3. How much do the the adult member earn from employment?
o Below N5000 (US$32) ----------
o N5001 (US$32) – N9999 (US$64) ----------
o N10000 (US$65) – N19999 (US$129) ----------
o N20000 (US$130) – N29999 (US$194) ----------
o N30000 (US$195) – N39999 (US$258) ----------
o N40000 (US$259) – N49999 (US$323) ----------
o N50000 (US$324) – N74999 (US$483) ----------
o N75000 (US$484) – N99999 (US$645) ----------
o N100000 (US$646) – N149999 (US$968) ----------
o N150000 (US$131) – N199999 (US$1290) ----------
o N200000 (US$1291) – N299999 (US$1935) ----------
o N300000 (US$1936) – N399999 (US$2581) ----------
o N400000 (US$324) – N499999 (US$3226) ----------
o N500000 (US$3227) – N749999 (US$4839) ----------
o N750000 (US$4840) – N999999 (US$6452) ----------

234
o Above N1000000 (US$6453) ----------
4. Does the adult member of your household get money from any other sources apart from employment on
monthly basis?
5. 5. If YES, how much does he/she get from other sources apart from employment?
o Please state amount ----------
6. Does the adult member of your household eat outside your household cooking?
7. If YES, how much does out of household feeding cost he/she daily?
o Please state amount ----------

235
Appendix 4
OFFICIAL LIST OF MDGs’ TARGETS AND INDICATORS
Millennium Development Goals (MDGs)
Goals and Targets
(from the Millennium Declaration) Indicators for monitoring progress
Goal 1: Eradicate extreme poverty and hunger
Target 1.A: Halve, between 1990 and 2015, the proportion of people whose income is less than one dollar a day
(i) Proportion of population below $1 (PPP) per dayi (ii) Poverty gap ratio (iii) Share of poorest quintile in national consumption
Target 1.B: Achieve full and productive employment and decent work for all, including women and young people
(iv) Growth rate of GDP per person employed (v) Employment-to-population ratio (vi) Proportion of employed people living below $1 (PPP) per day (vii) Proportion of own-account and contributing family workers in total
employment
Target 1.C: Halve, between 1990 and 2015, the proportion of people who suffer from hunger
(viii) Prevalence of underweight children under-five years of age (ix) Proportion of population below minimum level of dietary energy
consumption
Goal 2: Achieve universal primary education
Target 2.A: Ensure that, by 2015, children everywhere, boys and girls alike, will be able to complete a full course of primary schooling
2.1 Net enrolment ratio in primary education 2.2 Proportion of pupils starting grade 1 who reach last grade of primary 2.3 Literacy rate of 15-24 year-olds, women and men
Goal 3: Promote gender equality and empower women
Target 3.A: Eliminate gender disparity in primary and secondary education, preferably by 2005, and in all levels of education no later than 2015
3.1 Ratios of girls to boys in primary, secondary and tertiary education 3.2 Share of women in wage employment in the non-agricultural sector 3.3 Proportion of seats held by women in national parliament
Goal 4: Reduce child mortality
Target 4.A: Reduce by two-thirds, between 1990 and 2015, the under-five mortality rate
4.1 Under-five mortality rate 4.2 Infant mortality rate 4.3 Proportion of 1 year-old children immunised against measles
Goal 5: Improve maternal health
Target 5.A: Reduce by three quarters, between 1990 and 2015, the maternal mortality ratio
5.1 Maternal mortality ratio 5.2 Proportion of births attended by skilled health personnel
Target 5.B: Achieve, by 2015, universal access to reproductive health
5.3 Contraceptive prevalence rate 5.4 Adolescent birth rate 5.5 Antenatal care coverage (at least one visit and at least four visits) 5.6 Unmet need for family planning
Goal 6: Combat HIV/AIDS, malaria and other diseases
Target 6.A: Have halted by 2015 and begun to reverse the spread of HIV/AIDS
6.1 HIV prevalence among population aged 15-24 years
6.2 Condom use at last high-risk sex
6.3 Proportion of population aged 15-24 years with comprehensive correct
knowledge of HIV/AIDS
6.4 Ratio of school attendance of orphans to school attendance of non-
orphans aged 10-14 years
Target 6.B: Achieve, by 2010, universal access to treatment for HIV/AIDS for all those who need it
6.5 Proportion of population with advanced HIV infection with access to antiretroviral drugs
Target 6.C: Have halted by 2015 and begun to reverse the incidence of malaria and other major diseases
6.6 Incidence and death rates associated with malaria 6.7 Proportion of children under 5 sleeping under insecticide-treated
bednets 6.8 Proportion of children under 5 with fever who are treated with

236
appropriate anti-malarial drugs 6.9 Incidence, prevalence and death rates associated with tuberculosis 6.10 Proportion of tuberculosis cases detected and cured under directly
observed treatment short course
Goal 7: Ensure environmental sustainability
Target 7.A: Integrate the principles of sustainable development into country policies and programmes and reverse the loss of environmental resources Target 7.B: Reduce biodiversity loss, achieving, by 2010, a significant reduction in the rate of loss
7.1 Proportion of land area covered by forest 7.2 CO2 emissions, total, per capita and per $1 GDP (PPP) 7.3 Consumption of ozone-depleting substances 7.4 Proportion of fish stocks within safe biological limits 7.5 Proportion of total water resources used 7.6 Proportion of terrestrial and marine areas protected 7.7 Proportion of species threatened with extinction
Target 7.C: Halve, by 2015, the proportion of people without sustainable access to safe drinking water and basic sanitation
7.8 Proportion of population using an improved drinking water source 7.9 Proportion of population using an improved sanitation facility
Target 7.D: By 2020, to have achieved a significant improvement in the lives of at least 100 million slum dwellers
7.10 Proportion of urban population living in slumsii
Goal 8: Develop a global partnership for development
Target 8.A: Develop further an open, rule-based, predictable, non-discriminatory trading and financial system Includes a commitment to good governance, development and poverty reduction – both nationally and internationally Target 8.B: Address the special needs of the least developed countries Includes: tariff and quota free access for the least developed countries' exports; enhanced programme of debt relief for heavily indebted poor countries (HIPC) and cancellation of official bilateral debt; and more generous ODA for countries committed to poverty reduction Target 8.C: Address the special needs of landlocked developing countries and small island developing States (through the Programme of Action for the Sustainable Development of Small Island Developing States and the outcome of the twenty-second special session of the General Assembly) Target 8.D: Deal comprehensively with the debt problems of developing countries through national and international measures in order to make debt sustainable in the long term
Some of the indicators listed below are monitored separately for the least developed countries (LDCs), Africa, landlocked developing countries and small island developing States.
Official development assistance (ODA) 8.1 Net ODA, total and to the least developed countries, as percentage of
OECD/DAC donors’ gross national income 8.2 Proportion of total bilateral, sector-allocable ODA of OECD/DAC donors
to basic social services (basic education, primary health care, nutrition, safe water and sanitation)
8.3 Proportion of bilateral official development assistance of OECD/DAC donors that is untied
8.4 ODA received in landlocked developing countries as a proportion of their gross national incomes
8.5 ODA received in small island developing States as a proportion of their gross national incomes
Market access 8.6 Proportion of total developed country imports (by value and excluding
arms) from developing countries and least developed countries, admitted free of duty
8.7 Average tariffs imposed by developed countries on agricultural products and textiles and clothing from developing countries
8.8 Agricultural support estimate for OECD countries as a percentage of their gross domestic product
8.9 Proportion of ODA provided to help build trade capacity Debt sustainability 8.10 Total number of countries that have reached their HIPC decision points
and number that have reached their HIPC completion points (cumulative)
8.11 Debt relief committed under HIPC and MDRI Initiatives 8.12 Debt service as a percentage of exports of goods and services
Target 8.E: In cooperation with pharmaceutical companies, provide access to affordable essential drugs in developing countries
8.13 Proportion of population with access to affordable essential drugs on a sustainable basis
Target 8.F: In cooperation with the private sector, make available the benefits of new technologies, especially information and communications
8.14 Fixed-telephone subscriptions per 100 inhabitants 8.15 Mobile-cellular subscriptions per 100 inhabitants 8.16 Internet users per 100 inhabitants
Source: UNStats

237
BIBLIOGRAPHY
Aboderin, I., Kalache, A., Ben-Shlomo, Y., Lynch, J.W., Yajnik, C.S., Kuh, D. and Yach, D., 2001. Life
Course Perspectives on Coronary Heart Disease, Stroke and Diabetes: Key Issues and Implications for
Policy and Research. Geneva: World Health Organisation.
AbouZahr, C. and Boerma, T., 2010. Five Years to go and Counting: Progress towards the Millennium
Development Goals, Bulletin of the World Health Organization, 88, 324, pp. 1–14.
ABS (Australian Bureau of Statistics), 2006. Labour Statistics: Concepts, Sources and Methods.
Available at:
<http://www.abs.gov.au/AUSSTATS/[email protected]/7d12b0f6763c78caca257061001cc588/ac11a39053f8f86b
ca25710e007321ab!OpenDocument> [Accessed 11 January 2012].
Abu-Raddad L.J., Patnaik P. and Kublin J.G., 2006. Dual Infection with HIV and Malaria Fuels the
Spread of Both Diseases in Sub-Saharan Africa, Science, 314 (5805), pp. 1603–1606.
Acemoglu, D. and Robinson, J.A., 2001. Inefficient Redistribution, American Political Science Review,
95(03), 649 - 661.
Acemoglu, D., Ticchi, D. and Vindigni, A., 2011. Emergence and Persistence of Inefficient States,
Journal of the European Economic Association, 9(2), pp. 177- 208.
Acheme J., 2012. Reps to Investigate 39.6 Billion MDG Funds, VON (Voice of Nigeria), 02 October.
Available at:
<http://www.voiceofnigeria.org/nigeria/reps-to-investigate-39-6-billion-mdg-funds.html> [Accessed 22
November 2012].
Ackah, J., Morrissey, O. and Appleton, S., 2007. Who Gains from Trade Protection in Ghana: A
Household-Level Analysis, Credit Research Paper, No. 07/02.
Ackroyd, S. and Hughes, J.A., 1981. Data Collection in Context. London: Longman.
Adaranijo, L.O., 2001. Business Research Methods. Ibadan: Aseda Publishing.
Aderemi, A., 2002. Nigeria: A Complete Fact Finder. Lagos: Tee Rex Ltd.
Adetunji, M.O., 2012. Determinants of Urban Poverty in Osun State Nigeria, Interdisciplinary Journal of
Contemporary Research in Business, 3(11), pp. 267-279.
Adogamhe, P.G., 2010. Economic Policy Reform and Poverty Alleviation: A Critique of Nigeria‘s
Strategic Plan for Poverty Reduction, Poverty & Public Policy, 2(4), pp. 49-80.
AEDEDC (Academy for Educational Development and Education Development Centre), 2004. Focus
Group. Available at: <www.2edc.org/NTP/focusgrouo.htm> [Accessed 15 August 2012].
Ahmed, S., 2009. Methods in Sample Surveys, The Johns Hopkins University and Saifuddin Ahmed.
Aigbokan, B.E., 2000. Poverty, Growth and Inequity in Nigeria: A Case Study, AERC (African Economic
Research Consortium) Research Paper 102, Nairobi, November.

238
Aigbokan,.B.E., 2008. Growth, Inequality and Poverty in Nigeria, Paper Prepared for UNECA (United
Nations Economic Commission for Africa), Addis Ababa, Ethiopia.
Ainsworth, M., 1996. Introduction: Fertility in Sub-Saharan Africa, The World Bank Economic Review,
10 (1), pp. 81-82.
Aiyedogbon, J.O. and Ohwofasa, B.O., 2012. Poverty and Youth Unemployment in Nigeria, 1987-2011,
International Journal of Business and Social Science, 3(20), pp. 269-279.
Ajakaiye D.O. and Olumola, A.S., 1999. Conceptual and Methodological Issues in Poverty Alleviation,
Bullion Publication of the Central Bank of Nigeria, 23(4).
Ajakaiye, D.O. and Adeyeye, V.A., 2001. The Nature of Poverty in Nigeria, NISER Monigraph Series,
No. 13.
Ajayi, J.F.A., 1961. The British Occupation of Lagos, 1851–1861: A Critical Review, Nigeria Magazine,
69, pp. 96-105.
Ake, C., 1995. Democracy and Development in Africa. Washington D.C. Brookings.
Akerele, D. and Adewuyi, S.A., 2011. Analysis of Poverty Profiles and Socioeconomic Determinants of
Welfare among Urban Households of Ekiti State, Nigeria, Current Research Journal of Social Sciences,
3(1), pp. 1-7.
Akinyele, I.O., 1997. Household Food Security in Africa, Journal of the Society for International
Development-English Edition, (2), pp. 71-74.
Akinyele, I.O., 2009. Ensuring Food and Nutrition Security in Rural Nigeria: An Assessment of the
Challenges, Information Needs, and Analytical Capacity Nigeria Strategy Support Programme (NSSP),
Background Paper No. NSSP 007, November.
Akosile, A. and Iroegbu, S., 2012. MDGs Office Scales Up Conditional Grants Scheme, MDGS News
Nigeria, 26 July. Available at:
<http://mdgsnewsnigeria.blogspot.co.uk/2012_07_01_archive.html> [Accessed 15 August 2012].
Akpobasah, M., 2004. The Development Strategy for Nigeria, Paper Presented at the Overseas
Development/Nigerian Economic Summit Group, Institute of Development, London, 16-17 June.
Alabi, R.A. and Adams O.O., 2011. Impacts of the Global Financial Crisis on the Economic Reforms in
Africa. In: R.A Alabi et al., eds, Africa and the Global Financial Crisis-Impact on Economic Reform
Processes. Berlin: Lit Publication.
Alaye-Ogan, E.O., 2008. Rural Poverty among Women in Nigeria: A Case Study of Abuja Satellite
Communities of Nigeria, A Dissertation Submitted To the School Of Post Graduate
Studies, St Clements University, Turks and Caicos Islands, British West Indies in Fulfillment of the
Requirements for the Award of a Degree of Doctor of Philosophy Degree in Development Economics.
Albrecht D.E., 1999. Poverty, Inequality and Social Justice in Nonmetropolitan America, Regional
Research Institute, West Virginia University.

239
Alehile, K.S., 2009. Extreme Poverty and Hunger Eradication in Nigeria: A Halfway- Through
Assessment of the Millennium Development Goals, Bullion, 33(4), pp. 43-48.
Aliu, A., 2001. National Poverty Eradication Programme (NAPEP): Completion, Implementation,
Coordination and Monitoring, NAPEP Secretariat, Abuja, April.
Alkire, S., 2002. Valuing Freedoms: Sen’s Capability Approach and Poverty Reduction.
Allan, G. and Crow, G., 2001. Families, Households and Society. Basingstoke: Palgrave Macmillan.
Alliance 2015., 2008. The EU’s Contribution to the MDGS Poverty Eradication: From Rhetoric to
Results? Copenhagen: Alliance 2015.
Aluko, G.B. and Alfa, M.O., 1985. Marriage and Family, Women in Nigeria Today. WIN Editorial
Committee. London: Zed Books Ltd.
Ames, L., 1998. The View from Peekskill; Tending the Flame of a Motivator, The New York Times, 02
August. Available at: <http://www.nytimes.com/1998/08/02/nyregion/the-view-from-peekskill-tending-
the-flame-of-a-motivator-motivator.html?n=Top%2FNews%2FScience%2FTopics%2FResearch>
[Accesed 05 July 2012].
Amin, S., 1976. Unequal Development: An Essay on Social Formation of Peripheral Capitalism. New
York: Monthly Review Press.
Amin, S., 2006. The Millennium Development Goals – A Critique from the South, Independent Socialist
Magazine, 57(10).
Anan, K., 2005. In Larger Freedom: Towards Development, Security and Human Rights for All, Report
of the Secretary-General, United Nations Document A/59/2005.
Anaro, B., 2012. Nigeria: World Bank Advocates less Dependence on Oil Revenue, Leadership (Abuja),
06 April. Available at: <http://allafrica.com/stories/201204060599.html> [Accessed 26 September
2012].
Anbumozhi, V. and Bauer A., 2010. Impact of Global Recession on Sustainable Development and
Poverty Linkages, ADBI Working Paper Series, No. 227.
Andersen, M.L. and Taylor, H.F., 2007. Sociology: Understanding a Diverse Society. California:
Wadsworth Publishing Company.
Andy, E., 2011. Critical Analysis of Poverty Theories. [pdf]. Available at:
<http://www.academia.edu/1116707/critical_analysis_of_poverty_theories> [Accessed 14 February,
2012].
Anheier, H., Glasius, M. and Kaldor, M., 2001. Introducing Global Civil Society, Global Civil
Society, 2001, pp. 3-22.
Anyanwu, J. C., 2005. Rural Poverty in Nigeria: Profile, Determinants and Exit Paths, African
Development Review, 17(3), pp. 435-460.
240
Anyanwu, J. C., 2010. Poverty in Nigeria: A Gendered Analysis, The African Statistical Journal, 11, pp.
38-61.
Anyanwu, J. C., 2012. Accounting for Poverty in Africa: Illustration with Survey Data from Nigeria,
Working Paper Series No. 149, African Development Bank, Tunis, Tunisia.
Appleton, S., 1995. The Rich Are Just Like Us Only Richer - Poverty Functions or Consumptions
Functions?, CSAE (Centre for the Study of African Economies) Working Paper Series, 95-4.
Appleton, S., 1996. Women-Headed Households and Household Welfare: An Empirical Deconstruction
for Uganda, World Development, 24(12), pp. 1811-1827.
Appleton, S. (1998). Changes in Poverty in Uganda, 1992–1996, CSAE (Centre for the Study of African
Economies) Working Paper Series, 98-15.
Appleton, S. and Teal, F., 1998. Human Capital and Economic Development, A Background Paper
prepared for The African Development Report.
Appleton, S., with Emwanu, T., Kagugube. J. and Muwonge, J., 1999. Changes in Poverty in Uganda,
1992-1997, CSAE (Centre for the Study of African Economies) Working Paper Series, 99-22.
Appleton, S., 2000. Education and Health at the Household Level in Sub-Saharan Africa, CID (Center for
International Development) Working Paper No. 33, Havard University.
Appleton, S., 2001. Education, Incomes and Poverty in Uganda in the 1990s, Credit Research Paper
01/22, University of Nottingham.
Appleton, S. and Booth, D., 2005. Strong Fences Make Good Neighbours: Surveys and Participatory
Appraisal Methods in Poverty Assessment and Poverty Reduction Strategy Monitoring. In: J. Holland and
J. Campbell, eds. 2005. Methods in Development Research: Combining Quantitative and Qualitative
Approaches. Rugby: ITDG Publishing.
Appleton, S., Mckay, A. and Alayande, B.A., 2008. Poverty in Nigeria. In: P. Collier, C.C. Soludo and
C. Pattillo, eds. 2008. Economic Policy Options for a Prosperous Nigeria. Basingstoke: Palgrave
Macmillan.
Arizona-Ogwu, L.C., 2008. Yar‘Adua‘s 7-Point Agenda: Impost and Implementations. Available at:
<http://www.nigerianmuse.com/20081225105058zg/sections/general-articles/yaraduas-7-point-agenda-
impost-and-implementations.> [Accessed 04 September 2011].
Ashafa, T., 2009. National Human Development Report for Nigeria 2009. Available at:
<http://nepadadamawa.org/development-partners/2009-undp-report> [Accessed 28 December 2010].
Asika, N., 1991. Research Methodology in the Behavioural Sciences. Ikeja: Longman Nigeria.
Asogwa, B.C., Okwoche, V.A. and Umeh, J.C., 2012. Analysing the Determinants of Poverty Severity
among Rural Farmers in Nigeria: A Censored Regression Model Approach, American International
Journal of Contemporary Research, 2(5), pp. 166-176.

241
Atoloye, A.S., 1997. Strategy for Growth-Led Poverty Alleviation in Nigeria, CBN Economic and
Financial Review, 3, pp. 298-314.
Attaran, A., 2005. An Immeasurable Crisis? A Criticism of the Millennium Development Goals and
Why They Cannot Be Measured, Plos Medicine, 2, pp. 955–961.
Attaran, A., 2005. An Immeasurable Crisis? A Criticism of the Millennium Development Goals and
Why They Cannot Be Measured, Plos Medicine, 2, pp. 955–961.
Azarya, V., 1988. Re-Ordering State-Society Relations: Incorporation and Disengagement. In: D.
Rothchild and N. Chazzan, eds. 1988. The Precarious Balance: State and Society in Africa. Boulder:
Westview Press, pp. 3-21.
Babalola, S., 1991. The Educated Wife and Decision Making: The Study of a Professional Group, LASU
(Lagos State University) Journal of Humanities, 2 (1-2), pp. 132-142.
Babbie, E., 2001. The Practice of Social Research. 9th ed. California: Wadsworth Thomson.
Babbie, E., 2009. The Practice of Social Research. 12th
ed. California: Wadsworth Publishing.
Babones, S.J. and Alvarez-Rivadulla, M.J., 2007. Standardized Income Inequality Data for Use in
Cross-National Research, Sociological Inquiry 77, pp. 3-22.
Baca Zinn, M., 1989. Family, Race, and Poverty in the Eighties, Signs 14(4), pp. 854-874.
Baez, J.E. and Santos I.V., 2008. On Shaky Ground: the Effects of Earthquakes on Household Income
and Poverty, Background paper of the ISDR/RBLAC-UNDP Project on Disaster Risk and Poverty in
Latin America.
Bagayoko, N. and Gibert, M., 2007. The European Union in Africa: The Linkage between Security,
Governance and Development from an Institutional Perspective, IDS (Institute of Development Studies
Working Paper) – 284.
Bakare, A.S., 2012. Measuring the Income Inequality in Nigeria: the Lorenz Curve and Gini Co-efficient
Approach, American Journal of Economics, 2(1), pp. 47-52.
Baker, J. and Schuler, N., 2004. Analysing Urban Poverty - A Summary of Methods and Approaches,
World Bank Policy Research Working Paper 3399, September.
Baker, T.L., 1994. Doing Social research. 2nd
ed. New York: McGraw-Hill Incorporated.
Balogun, D., 1999. Analysing Poverty: Concepts and Methods, Bullion, 23(4), pp. 11-16.
Banerjee, A.V. and Duflo, E., 2010. Aging and Death under A Dollar A Day, Research Findings in the
Economics of Aging, Research Findings in the Economics of Aging, University of Chicago Press, pp. 169-
203.
Bankole, S.A., 2000. Gender Perceptions of Fertility Preferences and Motivations among the Yoruba of
Nigeria. In: J.A Ebigbola and E.P Renne, eds. 2000. Population and Development Issues: Ideas and
Debates. Ibadan: African Book Builders, pp. 173 – 199.

242
Barbour, R. and Kitzinger, J., 1999. The Challenge and Promise of Focus Groups. In: R. Barbour, R. and
J. Kitzinger, eds. 1999. Developing focus group research: Politics, Theory and Practice, London: Sage
Publications, pp. 1–20.
Bardhan, P. and Mookherjee, D., 2003. Poverty Alleviation Effort of West Bengal Panchayats. Available
at: <http://www.globetrotter.berkeley.edu/macarthur> [Accessed 09 October 2011].
Barfield, T. ed., 1997. The Dictionary of Anthropology (Vol. 306). Oxford: Blackwell.
Bargery, G.P., 1934. A Hausa-English & English-Hausa dictionary. London: Oxford University Press.
Barnes, A. and Brown, G.W., 2011. The Idea Of Partnership Within The Millennium Development
Goals: Context, Instrumentality and the Normative Demands of Partnership, Third World Quarterly, 32,
pp. 165–180.
Barrett, C.B., Reardon, T. and Webb P., 2001. Nonfarm Income Diversification and Household
Livelihood Strategies in Rural Africa: Concepts, Dynamics and Policy Implications, Food Policy 26(4),
pp. 315–331.
Barrett, R.E. and Whyte, M.K., 1982. Dependency Theory and Taiwan: Analysis of a Deviant Case,
American Journal of Sociology 87, pp. 1064-1089.
Barro, R. and Lee J., 2010. A New Data Set of Educational Attainment in the World, 1950–2010, NBER
(National Bureau of Economic Research) Working Paper No. 15902.
Bastos, A., Casaca, S.F., Nunes, F. and Pereirinha, J., 2009. Women and Poverty: A Gender-Sensitive
Approach, Journal of Socio-Economics, 38(5), pp. 764-778.
Basu, R. L., 2005. Why the Human Development Index Does Not Measure Up to Ancient Indian
Standards, Culture Mandala: The Bulletin of the Centre for East-West Cultural and Economic Studies,
6(2), p. 5.
Battaglini, M. and Coate, S., 2008. A Dynamic Theory of Public Spending, Taxation, and Debt, American
Economic Review 98(1), pp. 201-36.
Bauer, P., 1981. Equality: The Third World and Economic Delusion. Cambridge: Havard University
Press.
Bayart, J.F., Ellis, S. and Hibou, B., 1999. The Criminalization of the State in Africa. Oxford: James
Curry.
BBC (British Broadcasting Corporation) News, 2002. Nigeria's Economy Dominated by Oil, 16 January
2002. Available at: <http://news.bbc.co.uk/1/hi/business/1763464.stm> [Accessed 28 February 2010].
Beaglehole, R. and Bonita, R., 2008. Global Public Health: A Scorecard. The Lancet, 372 (9654), pp.
1988 – 1996.
Becker, G. S., 1968. Crime and Punishment: An Economic Approach, Journal of Political Economy,
169(177), pp. 183-184.

243
Beirne, P., 1987.. Adolphe Quetelet and the Origins of Positivist Criminology, American Journal of
Sociology, 92(5), 1140-1169.
Bello, M.A and Roslan, A., 2010. Future of Millennium Development Goals in Nigeria. International
Conference. Available at: < http://www.internationalconference.com>
[Accessed 03 July 2011].
Bennion, F., 1962. Constitutional Law of Ghana Part I - The Republican Constitution [pdf].
Butterworths. Available at:
< http://www.francisbennion.com/pdfs/fb/1962/1962-001-003-ghana-pt1-ch1.pdf> [Accessed 04 April
2010].
Benokraitis, N.V., 2012. Marriages and Families: Changes Census Update: Choices and Constraints.,
New Jersey: Pearson Education Incorporated.
Berger, P., 1985. Speaking to the Third World. In: P. Berger and M. Novak, eds.1985. Essays on
Development and Democracy. Washington DC: American Enterprise Institute for Public Policy Research.
Bertucci, G and Rosenbaum, A. eds, 2007. Introduction In: UNDESA (United Nations Department of
Economic and Social Affairs), Implementing the Millennium Development Goals: Challenges and
Responses for Public Administration, ST/ESA/PAD/SER.E/116. New York: United Nations.
Berk, R.A., Lenihan, K.J. and Rossi, P.H., 1980. Crime and Poverty: Some Experimental Evidence from
Ex-Offenders, American Sociological Review, 45(5), pp. 766-786.
Besley T. and Burgess, R., 2003. Halving Global Poverty [pdf]. Available at:
<http://econ.lse.ac.uk/staff/rburgess/wp/jep11.pdf> [Accessed 29 May 2010].
Bevan, P. and Lister, S., 2000. Strengthening Policy Reform by Addressing the Needs, Interests and the
Rights of Poor and Vulnerable People, Social Development Department, Department for International
Development.
Bigman, D. and Fofack, H., 2000. Geographical Targeting for Poverty Alleviation: Methodology and
Applications. Washington D.C: The World Bank.
Birsdsall, N., 1988. Economic Approaches to Population Growth and Development. In H.B.
Chenery and T.N. Srinivasan (eds.), Handbook of Development Economics. Amsterdam:
Elsevier.
Black, M., 2007. No-Nonsense Guide to International Development. 2nd
ed. Oxford: New Internationalist
Publications Incorporated.
Blackwood, D.L. and Lynch, R.G., 1994. The Measurement of Inequality and Poverty: A Policy Maker‘s
Guide to the Literature, World Development, 22 (4), pp. 567-578.
Blastland, M., 2009. Just what is poor? BBC NEWS. Available at:
<http://news.bbc.co.uk/1/hi/magazine/8177864.stm > [Accessed 15 March 2014].
Blomstrom, M. and Hettne, B., 1984. Development Theory in Transition: The Dependency Debate and
Beyond – Third World Responses. London: Zed Books.

244
Boas T.C. and Gans-Morse, J., 2009. Neoliberalism: From New Liberal Philosophy to Anti-Liberal
Slogan, Studies in Comparative International Development, 44 (2), pp. 149-150.
Bodenheimer, S., 1970. Dependency And Imperialism: The Roots of Latin American Underdevelopment,
NACLA (North American Congress in Latin America Newsletter) 4(3), pp. 18-27.
Bond, M.S., 2000. The Backlash against NGOs. Prospect Magazine, April 2000.
Booth, D. and Lucas, H., 2002. Good Practice in the Development of PRSP Indicators and Monitoring
Systems. Available at:
<http://www.odi.org.uk/pppg/publications%5cworkingj3apers%5c172.htrn> [Accessed 14 June 2010].
Boserup, E. 2005. The Conditions of Agricultural Growth: The Economics of Agrarian Change
under Population Pressure. New Jersey: Transaction Publishers.
Boston, M., 2011. Poverty. Available at: <http://mickeyboston.com/poverty/boynton> [Accessed 12 June
2011).
Bourguignon, E., 2003. Qualitative and Quantitative Approaches to Poverty Analysis: Two Pictures of the
Same Mountain: In: R. Kanbur, ed. 2003. Q-Squared: Qualitative and Quantitative Methods Appraisal.
Washington DC: Permanent Black.
Bourguignon, F., 1999. Crime as a Social Cost of Poverty and Inequality: A Review Focusing on
Developing Countries, Revista Desarrollo y Sociedad.
Bowling, A., 2005. Mode of Questionnaire Administration Can Have Serious Effects on Data Quality,
Journal of Public Health, 27(3), pp. 281–291.
Boynton, V. and Malin, J. eds., 2005. Encyclopedia of Women‘s Autobiography. 2. K-Z (Vol. 2).
Westport: Greenwood Press. p. 453.
Bradshaw, T.K., 2006. Theories of Poverty and Anti-Poverty Programmes in Community Development
[pdf] RPRC Working Paper No. 06-05. Available at:
<http://www.rupri.org/forms/wp06-05.pdf> [Accessed 03 January 2011).
Brannen, J., 2005. Mixed Methods Research, A Discussion Paper, ESRC National Centre for Research
Methods Review.
Brown, D.E., 1991. Human Universals. Philadelphia: Temple University Press.
Brown, L.R., 2011. World on the Edge. Norton: Earth Policy Institute.
Brown, L.R., Gardner, G. and Halweil, B., 1999. 16 Impacts of Population Growth. The Futurist, 33(2),
pp. 36-41.
Browne, K., 2011. An Introduction to Sociology. Cambridge: Polity Press.
Bryant, L., (n.d). Structured Questionnaires. Available at:
<http://www.historylearningsite.co.uk/structured_questionnaires.htm> [Accessed 24 June 2012].
245
Buckman, G., 2005. Global Trade: Past Mistakes, Future Choices. London: Zed Books.
Bull, H., 1977. The Anarchical Society. New York: Columbia University Press.
Burke J. and Onwuegbuzie A.J., 2004. Mixed Methods Research: A Research Paradigm Whose Time
Has Come. Educational Researcher, Vol. 33 (7), pp. 14-26.
Burke, P., 1980. Sociology and History. London: George Allen and Unwin.
Burns, N. and Grove, S., 2001. The Practice of Nursing Research: Conduct, Critique and Utilization. 4th
ed. Toronto: W.B Saunders Company.
Calandrino. J.A., Halderma, J.A. and Edward W. Felten, E.W., n.d. In Defense of Pseudorandom Sample
Selection. Available at: <https://www.usenix.org/legacy/event/evt08/tech/full_papers/calandr-
ino/calandrino_htmi/index.html> [Accessed 01 May 2014].
Caldwell, J. and Caldwell, P., 2000. The Limitation of Family Size in Ibadan, Nigeria: An Explanation of
Its Comparative Rarity Derived From In-Depth Interviews. In: J.A Ebigbola, and E.D. Renne, eds. 2000.
Population and Development Issues: Ideas and Debates. Ibadan: African Book Builders, pp. 126 – 171.
Caldwell, M., 1977. The Wealth of Some Nations. London: Zed Books.
Callan, T. and Nolan, B., 1991. Concepts of Poverty and the Poverty Line, Journal of Economic
Surveys, 5(3), pp. 243-261.
Callan, T.; Nolan, B. and Whelan, C.T., 1993. Resources, Deprivation and the Measurement of
Poverty, Journal of Social Policy, 22(2), PP. 141–172.
Canagarajah, S.; Ngwafon, J. and Thomas, S. 1997. Evolution of Poverty and Welfare in Nigeria 1985-
92, Policy Research Working Paper No. 1715, January.
Capdevila, G. 2005. Human Rights: More Than 100 Million Homeless Worldwide, IPS (Inter Press
Service, 30 March.
Carr, E.R., 2005. Development and the Household: Missing the Point? Geojournal, 62(1-2), pp. 71–83.
Carvalho, S. and White, H., 1997. Combining the Quantitative and Qualitative Approaches to Poverty
Measurements and Analysis: the Practice and the Potentials, Technical Paper, No. 366, World Bank,
Washinton DC.
Cassidy, M.L. and Lee, G.R., 1989. The Study of Polyandry: A Critique and Synthesis, Journal of
Comparative Family Studies, 20(1), pp. 1-11.
Cecchini, S. and Notti, F., 2011. Millennium Development Goals and Human Rights: Faraway, So Close?
Journal of Human Development and Capabilities, 12(1), pp. 121–133.
C-GIDD (Canback Global Income Distribution Database), 2012. List of Nigerian States by GDP.
Available at: < https://www.cgidd.com/> [Accessed 30 June 2011].

246
Chambers, R., 1997. Whose Reality Counts? Putting the First Last. London: Intermediate Technology
Publications.
Champernowne, D.G. and Cowell, F.A., 1998. Economic Inequality and Income Distribution.
Cambridge: Cambridge University Press.
Chandy, L. and Gertz, G., 2011. Poverty in Numbers: The Changing State of Global Poverty from 2005
to 2015, Policy Brief of the Brookings Institution.
Chang, H.J. and Grabel, I., 2004. Reclaiming Development: An Alternative Economic Policy
Policy Manual, Revista de Economia Política, 25(1), 97.
Chen, S., Datt. G. and Ravallion, M., 1992. Is Poverty Increasing In The Developing World? Review of
Income and Wealth, 40(4), PP. 359-376
Chenery, H.B., 1974. Redistribution with Growth. London: Oxford University Press.
Chenery, H.B., Ahluwalia, M.S., Bell, C.L.G.; Duloy J.H. and R. Jolly, 1974. Redistribution with Growth.
London: Oxford University Press.
Chete, L.N., 2009. Global Financial Crisis and Challenges of Meeting the MDGs in Nigeria. Paper
submitted for The Conference of the National Economic Society.
Chetwynd, E., Chetwynd, F. and Spector, B., 2003. Corruption and Poverty: A Review of Recent
Literature Final Report. Washington: Management Systems International, 600, pp. 5-16.
Chirot, D., 1977. Social Change in the Twentieth Century. New York: Harcourt Brace Jovanovich.
Chirot, D., 1981. Changing Fashions in the Social Causes of Economic and Political Change. In J. Short,
ed. 1981. The State Of Sociology. California: Sage.
Chiu, W.H. and Madden, P., 1998. Burglary and Income Inequality, Journal of Public Economics, 69(1),
pp. 123-141.
Chovwen, A., Orebiyi, O., Savadogo, A., Afere, T. and Afolayan, E., 2009. Achieving the Millennium
Development Goals: An Assessment of Water and Sanitation Intervention of the Ikaram Millennium
Village, Nigeria, Researcher 1(2), pp. 6-13.
Christain, D., 1992. Perestroika and World History, Australian Journal of Slavonic and Eastern
European Studies, 6 (1).
CIA (Central Intelligence Agency), 2012. The World Factbook. Available at:
<https://www.cia.gov/library/publications/the-world-factbook/geos/ni.html> [Accessed 20 December
2012].
Cities Alliance, 2006. Guide to City Development Strategies-Improving Urban Performance. Washington
DC: The Cities Alliance.
Clarke, C., 2002. The Latin American Structuralists. In: V. Desai and R.B. Potter, eds. 2002. The
Companion to Development Studies. London: Arnold, pp. 92-96.

247
Clarke, P., 2011. NVIVO 9 - Part 1: Managing, Organising and Coding Qualitative Data [pdf]. Available
at:
https://wiki.brookes.ac.uk/download/attachments/21824187/NV9_Part1_clarke_March_2011_revised.pdf
> [Accessed 03 October 2012].
Cleland J.G. and Van Ginneken J.K., 1988. Maternal Education and Child Survival in Developing
Countries: The Search for Pathways of Influence, Social Science and Medicine 27(12), 1357–1368.
Cobb, C., Halstead, T. and Rowe, J., 1999. The Genuine Progress Indicator. California: Redefining
Progress.
Collier, P., 1999. On the Economic Consequences of Civil War, Oxford Economic Papers 50(4) pp. 168-
183.
Cohen, J., 1990. Things I have Learned (So Far), American Psychologist, 45, pp. 1304–1312.
Cohen, J., (1995). How Many People Can the Earth Support? New York: W.W. Norton and Company.
Collier, P., 2007. The Bottom Billion: Why the Poorest Countries Are Failing and What Can Be Done
About It. Oxford: Oxford University Press.
Collier, P., 2008. Oil, Growth and Governance in Nigeria. In: P. Collier, C.C. Soludo and C. Pattillo, eds.
2008. Economic Policy Options for a Prosperous Nigeria. Basingstoke: Palgrave Macmillan.
Collier, P. and Hoeffler, A., 1998. On Economic Causes of Civil War, Oxford Economic Papers , 50(4),
pp. 563–573.
Collier, P., Hoeffler, A. and Söderbom, M., 2004. On the Duration of Civil War, Journal of Peace
Research 41(3), pp. 253–273.
Collins, D., Jordan, C. And Coleman, H., 2009. An Introduction to Family Social Work. 3rd
ed. Andover:
Cengage Learning.
Coolidge, F.L., 2006. Statistics: A Gentle Introduction Paperback. London: Sage Publications.
Cornia, G.A., Jolly, R. and Stewart, F., 1989. Adjustment with a human face: Protecting the
Vulnerable and Promoting Growth. Oxford: Clarendon University Press. Corneliau, C., 2002. The Impasse of Modernity: Debating the Future of the Global Market Economy.
London: Zed Press.
Cowen M.P. and Shenton, R.W., 1996. Doctrines of Development. London: Routledge.
Craig, D. and Porter, D., 2001. Poverty Reduction Strategy Papers: A New Convergence. What does It
Miss and What Can Be Done about It?, Background paper for Regional Conference on National Poverty
Reduction Strategies, Organised by World Bank, UNDP, IMF and ADB. Hanoi, Vietnam, pp. 4-6.
Crawford, J.M., 1999. Co-Parent Adoptions by Same-Sex Couples: From Loophole to Law. Families in
Society: The Journal of Contemporary Human Services, 80, pp. 271-278.
Create Survey, 2012. What is Crosstabulation?. Available at:
< http://www.createsurvey.com/docs/what_is_crosstab.html> [Accessed 30 April 2012].

248
Creswell, J.W., 1998. Qualitative Inquiry and Research Design. Choosing Among Five Traditions.
California: Sage Publications.
Creswell, J.W., 2003. Research Design: Qualitative, Quantitative, and Mixed Methods
Approaches. 2nd
ed. Thousand Oaks: Sage Publication.
Crowder, M., 1986. Lugard and Colonial Nigeria – Towards an Identity?‖ History Today, 36, February,
pp. 23 – 29.
Custom Insight, 2012. Crosstabulation. Available at: <http://www.custominsight.com/articles/crosstab-
sample.asp> [Accessed 01 June 2012].
Czaja R. and Blair J., 2005. Designing Surveys. A Guide to Decisions and Procedures.
2nd
ed. California: Sage Publications, Incorporated.
D‘Souza, D., 2002. Two Cheers for Colonialism, The Chronicle of Higher Education, 48(35), p. 10.
Dag Hammarskjold Foundation Report, 1975. What now? Another Development. Uppsala: Dag
Hammarskjold Foundation.
Daly, H.E., 1996. Beyond Growth. Beacon Press.
Damerow, H., 2010. Global North and Global South, International; Politics, Gov207 Syllabus, Union
County College, Cranford, New Jersey.
Dar, O.A. and Khan, M.S., 2011. Millennium Development Goals and the Water Target: Details,
Definitions and Debate, Tropical Medicine & International Health, 16, pp. 540–544.
Dasgupta, S., 1985. Towards Postdevelopment Era. London: Mittal.
Davidson, S.A.A. and Esubalew, A., 2009. Infrastructural Provisions and the Attainment of the MDGs in
a Decentralized Systems of Africa, Conference on the Role of Sub-National Jurisdictions in Efforts to
Achieve the MDGs, Abuja, 7 – 9, May, 2009.
DCPP (Disease Control Priorities Project), 2007. Achieving the MDGs Goals for Health: So Far, Progress
Is Mixed – Can We Reach Our Targets [pdf]. Available at: <http://www.dcp2.org/file/67/DCPP%20-
%20MDGs.pdf > [Accessed 31 December 2010].
Deardorff, A., 2010. Distortion. Deardorff’s Glossary of International Economics. Available at:
<http://www-personal.umich.edu/~alandear/glossary/d.html#distortion> [Accessed 02 March 2011].
Deaton, A.; 2000. Counting the World‘s Poor: Problems and Possible Solutions, Research
Programme in Development Studies, Princeton University.
Deaton, A., 2004. Health in an Age of Globalisation. In: S. Collins and C. Graham, eds. 2004. Brookings
Trade Forum. Washington DC: The Brookings Institution.
Demery, L. and Square, L., 1996. Macroeconomic Adjustment and Poverty in Africa: An Emerging
Picture, World Bank Research Observer, 11 (1), pp. 39-59.

249
Deneulin, S. and Shahani, L., 2009. An Introduction to the Human Development and Capability Approach
Freedom and Agency. Ottawa: Earthscan International Development Research Centre.
De Rivero, O., 2001. The Myth of Development: The Non-Viable Economies of the 21st Century. London:
Zed Books Ltd.
De Soto, H., 1999. The Mystery Of Capital: Why Capitalism Triumphs in the West And Fails Everywhere
Else. London: Black Swan.
Depaulo, B. and Milardo, R., 2011. Interview: Beyond the Nuclear Family. Available at:
< http://www.vision.org/visionmedia/extended-family-relationships/47372.aspx> [Accessed 18 August
2012].
DfID (Department for International Development), 2010. Nigeria: Key Facts. Available at:
<http://www.dfid.gov.uk/Where-we-work/Africa-West--Central/Nigeria/Key-facts/> [Accessed 31
December 2010].
DfID (Department for International Development), 2012. Operational Plan 2011-2015. Available at:
<https://www.gov.uk/government/uploads/system/uploads/attachment_data/file/67410/nigeria-2011.pdf>
[Accessed 27 December 2012].
Dharam, G., 1978. Basic Needs and its Critics, Institute of Development Studies, Vol. 9 (4), pp. 16-
18.
Dickinson, E., 2011. GDP: A Brief History. Available at:
<http://www.foreignpolicy.com/articles/2011/01/02/gdp_a_brief_history?wp_login_redirect=0>
[Accessed 29 May 2011].
Diriwächter, R. and Valsiner, J., 2006. Qualitative Developmental Research Methods in their Historical
and Epistemological Contexts, Forum Qualitative Sozialforschung/Forum: Qualitative Social
Research 7(1).
Donaldson, P., 1973. World’s Apart: The Economic Gulf Between Nations. London: Penguin.
Donaldson, P., 1988. Economics of the Real World. London: Penguin.
Dongier, P.V., Domelen, J.O., E, Ryan, A. and Wakeman, W., 2003. External Debt Statistics: Guide for
Compilers and Users – Appendix III, Glossary, IMF (International Monetary fund), Washington DC.
Dos Santos, T., 1971. The Structure of Dependence. In: K.T. Kan and D.C Hodges, eds. 1971. Readings
in the US Imperialism. Boston: Extending Horizons, pp. 225-236.
Dos Santos, T., 1973. The Crisis of Development Theory and the Problem of Dependence in Latin
America. In: H. Bernstein, ed. 1973. Underdevelopment and Development. Harmondsworth: Penguin, pp.
57-80.
Dowd, N.E., 1997. In Defense of Single-Parent Families. New York: New York University Press.

250
Dowler, E., 2008. Poverty, Food and Nutrition. In: J. Strelitz and R. Lister, eds. 2008. Why Money
Matters: Family Income, Poverty and Children’s Lives. London: Save the Children.
Dowler, E., Turner, S. and Dobson, B., 2001. Poverty Bites: Food, Health and Poor Families. London:
CPAG (Child Poverty Action Group).
Dreze, J. and Sen, A., 1995. India: Economic Development and Social Opportunity. New Delhi: Oxford
University Press.
Dunn, C., Kawano, Y. and Brewer, B.D.; 2000. Trade Globalization Since 1795: Waves of
Integration in the World-System, American Sociological Review, pp. 77-95.
Duze, M.C., Mohammed, H., and Kiyawa, A.I., 2008. Poverty in Nigeria: Causes, Manifestations and
Alleviation Strategies. London: Adonis and Abbey Publishers Ltd.
DWP (Department for Work and Pensions), 2010. Households below Average Income (HBAI). Available
at: <http://research.dwp.gov.uk/asd/index.php?page=hbai> [Accessed 24 June 2011].
Easterly, W., 2002. Elusive Quest for Growth. Cambridge: MIT Press.
Easterly, W., 2006. Reliving The 1950s: The Big Push, Poverty Traps, and Takeoffs in Economic
Development, Journal of Economic Growth, 11(4) pp. 289-318.
Easterly, W., 2009. How The Millennium Development Goals are Unfair to Africa, World
Development, 37(1), pp. 26-35.
Echeruo, M.J.C., 1977. Victorian Lagos: Aspects of Nineteenth Century Lagos Life . London: Macmillan.
Economic Confidential, 2010. [Investigation] The Massive MDG Fraud: How the Health Ministry Steals
From the Sick and Dying. Available at:
<http://economicconfidential.net/new/interviews/115-nigeria-mdgs-how-we-channel-billions-of-naira-on-
8-goals-amina-az-zubair.> [Accessed 18 November 2010].
Edoh, T., 2003. Poverty and the Survival of Democracy in Nigeria, Nigerian Journal of Political and
Administrative Studies, 1(4), pp. 7-15.
Edwards, M. and Hulme, D. eds., 1992. Making a Difference: NGOs and Development in a Changing
World. London: Earthscan.
Edwards, M and Hulme, D. eds., 1995. Non-Governmental Organizations: Performance and
Accountability. London: Earthscan.
Education Centre, The Hillingdon Hospital, 2006. Sampling in Research [pdf]. Available at:
<http://www.thh.nhs.uk/documents/_Departments/Research/InfoSheets/16_sampling_research.pdf>
[Accessed 07 May 2012].
Eller, C., 1995. Living in the Lap of the Goddess: The Feminist Spirituality Movement in
America. Boston: Beacon Press.
Eller, C., 2001. The Myth Of Matriarchal Prehistory: Why an Invented Past Won’t Give Women A Future.
Boston: Beacon Press.

251
Encyclo Online Encyclopaedia, n.d. Relative Poverty. Available at:
<http://www.encyclo.co.uk/define/ relative%20poverty> [Accessed 05 January 2012].
Encyclopaedia of the Nations, 2012. Nigeria – Agriculture. Available at:
http://www.nationsencyclopedia/africa/nigeria-agriculture.html [Accessed 05 January 2012].
Englama, A., 2001. Unemployment: Concepts and Issues, CBN (Central Bank of Nigeria) Bullion, 25(4).
Englama, A. and Bamidele, A., 1997. Measurement Issues in Poverty. In: Poverty Alleviation in Nigeria:
Selected Papers for the 1997 Annual Conference of the Nigerian Economics Society, pp. 141-156.
ERD (European Report on Development), 2008. Millennium Development Goals at Midpoint: Where Do
We Stand And Where Do We Need To Go? Brussels: European Commission.
Escobar, A., 1995. Encountering Development: The Making and Unmaking of the Third World.
Princeton: Princeton University Press.
Escobar, A., 1996. Imagining a Post Development Era. In: J. Crush, ed. 1996. The Power of Development.
London: Routhledge. pp. 211-227.
Esteva, G., 1992. Development. In W. Sachs (ed.) The Development Reader. A Guide to Kowledge and
Power. London: Zed Books.
Esteva, G. and Prakash, M.S., 1997. From Global Thinking to Local Thinking. In M. Rahnema
with V. Bawtree (eds.) The Postdevelopment Reader. London: Zed Books, pp. 227-289.
Esteva, G. and Prakash, M.S., 1998. Grassroot Postmodernism. London: Zed Books.
Essein, E.B. and Usenobong, F.A., 2009. Global Economy in Crisis: Pressure in Achieving the MDGs in
Nigeria. Available at: <http//:www.economicsuniabuja.org> [Accessed 24 June 2011].
Etim, N.A. and Ukoha, O.O., 2010. Analysis of Poverty Profile of Rural Households: Evidence from
South-South Nigeria, Journal of Agriculture and Social Sciences, 6, pp. 48–52.
Explorable, 2008. Research Methodology. Available at: <http://explorable.com/research-methodology>
[Accesed 01 February 2012].
Explorable, 2009. Non-Pobability Sampling. Available at: <https://explorable.com/non-probability-
sampling> [Accessed 01 May 2014].
Fadipe, N.A., 1970. Religion and Morals, In: F.O Okediji and O.O Okediji, eds. 1970. The Sociology of
the Yoruba. Ibadan: Ibadan University Press.
Fagboungbe, O.B., 1993. Research Methods for Nigerian Tertiary Institutions. Lagos: Kole Consults.
Fajnzylber, P., Lederman, D. and Loayza. N., 2000. Crime and Victimization: An Economic Perspective,
Latin American and Caribbean Economic Association Economia 1, pp.178-219.

252
Fakhry, Y., 2003. Barriers to Development, A Talkingtglobal Online Publication. Available at: <
www.Tigweb.Org/Youth- Edia/Panorana/Article/Htmi?Contentid=1417&START=0> [Accessed 25
December 2011].
Famutimi, J.T. and Omosulu, S.B., 2008. Sustainable Urban Development and Management: A Panacea
for Poverty Alleviation in Third World Cities. In: E.O Akinnowo, ed. 2008. Socio-Economic Policies and
MDGs in Africa. Akungba: Faculty of Social Sciences, Adekunle Ajasin University, Akungba-Akoko,
Nigeria.
FAO (Food and Agriculture Organization), 2010. The State of Food Insecurity in the World 2010 [pdf].
Available at: <http://www.fao.org/docrep/013/i1683e/i1683e.pdf > [Accessed 31 December 2011).
FAO/WHO/UNU (Food and Agriculture Organization/World HealthOrganization/United Nations
Univesity), 2004. Human Energy Requirements. Report of a Joint FAO/WHO/UNU Expert Consultation.
Rome: FAO, FAO Food and Nutrition Tech. Report, Series. 1.
Feagin, J.R., 1975. Subordinating the poor: Welfare and American beliefs. New Jersey: Prentice-Hall.
Fearon, J. D., 2004. Why Do Some Civil Wars Last So Much Longer than Others?, Journal of Peace
Research, 41(3), pp. 275–301.
Feilzer, M.Y., 2010. Doing Mixed Methods Research Pragmatically: Implications for the Redisc-
overy of Pragmatism as a Research Paradigm, Journal of Mixed Methods Research, 4 pp. 6-16.
Fern, E.F., 2001. Advanced Focus Group Research. California: Sage.
FGN (Federal Government of Nigeria), 1963. Constitution of the Federation 1963‘. Available at:
<http://www.nigeriacongress.org/resources/constitution/nig_const_63.pdf> [Accessed 23 April 2010].
Ferguson, K.E., 1999. Patriachy. In: H. Tierney, ed. 1999. Women’s Studies Encyclopedia. Vol. 2.
Westport: Greenwood Publishing. p. 1048.
Ferguson, M., 1984. The Aquarian Conspiracy. Boulder: Paladin Press.
Fields, G.S., 1997. Poverty, Inequality, and Economic Well-Being: African Economic Growth in
Comparative Perspective, Paper presented at the AERC Poverty Training Workshop, Kampala.
Fisher, R.A., 1966. The Design of Experiments. 8th ed. New York: Hafner Publishing Company.
Fleming, L., 2011. The Relationship between Poverty and Crime: A Cross Section Analysis of the World,
Bryant Economic Research Paper, 4(7).
Food Access Network, 2012. What Is Food Poverty? Available at:
http://www.sustainweb.org/foodaccess/what_is_food_poverty/ [Accessed 12 September 2012].
FOS (Federal Office of Statistics), 1999. Poverty Profile for Nigeria, 1980-1996. Lagos: FOS (Federal
Office of Statistics).
Frank, A.G., 1969. Latin America: Underdevelopment or Revolution: Essays on the Development of
Underdevelopment and the Immediate Enemy. Vol. 165. New York: Monthly Review Press.

253
Frank, A.G., 1970. The Development of Underdevelopment. In: R. Rhodes, ed. 1970. Imperialism and
Underdevelopment. New York: Monthly Review Press, pp. 4-17.
Franklin, J., 1977. African: A Photographic Essay on Black Women of Ghana and Nigeria. Boulder:
Lynne Rienner Publishers.
Franklin S. and Walker C., eds., 2003. Survey Methods and Practices, Statistics Canada, Social Survey
Methods Division.
Fraser, D., 2011. Crime, Poverty and Imprisonment. CIVITAS: Institute for the Study of Civil Society.
Freeman, P.K., 2000. Infrastructure, Natural Disasters, and Poverty [pdf] Laxenburg: International
Institute for Applied Systems Analysis (IIASA). Available at:
<http://www.iiasa.ac.at/research/rmp/june99/papers/freemansolo.pdf> [Accessed 03 March 2011].
Friedman, J., 1992. Empowerment: The Politics of Alternative Development. Oxford: Blackwell.
Friedman, R.D., 1965. Poverty: Definition and Perspective, American Enterprise Institute for Public
Policy Research, Washington, D.C. Freire, P., 1982. Pedagogy of the Oppressed. New York: Continuum.
Frey, R.S. and Al-Roumi A., 1999. Political Democracy and the Physical Quality Of Life: The Cross-
National Evidence, Social Indicators Research, 47, pp. 73–97.
FRN (Federal Republic of Nigeria), 1999. Constitution of the Federal Republic of Nigeria. Lagos:
Federal Government Press.
FRN (Federal Republic of Nigeria), 2001. National Poverty Eradication Programme (NAPEP): A
Blueprint for the Schemes. Abuja: NAPEP (National Poverty Eradication Programme).
Fryer, D., 1991. Qualitative Methods in Occupational Psychology: Reflections Upon Why They Are So
Useful But So Little Used, The Occupational Psychologist, 14 (Special Issue on Qualitative Methods),
pp. 3-6.
Fukuda-Parr, S., 2010. Reducing Inequality – The Missing MDG: A Content Review of PRSPs and
Bilateral Donor Policy Statements, IDS Bulletin-Institute of Development Studies, 41(1), pp. 26–35.
Fukuyama, F., 1995. Social Capital and the Global Economy, Foreign Affairs, 74(5), PP. 89-103.
Galbraith, J. K., 1958. The Affluent Society. Boston: Houghton Mifflin.
Galloway, T.A., 2002. A Study of Poverty Based on Registry Data, Report 1/2001, Ragnar Frisch Centre
For Economic Research.
Gardner, R., 1998. Education. DHS Comparative Studies No. 29. Maryland: Macro International Inc.
Garikipati, S. and Olsen, W., 2008. The Role of Agency in Development Planning and Development
Process, International Development Planning Review 30(4), pp. 327-338.

254
Gavrov, S., 2004. Modernisation of the Empire and Cultural Aspects of Modernization Processes in
Russia. Moskva (Moscow): URSS.
Geek Interview, 2012. What is Crosstab?. Available at: <http://www.learn.geekinterview.com/data-
warehouse/dw-basics/what-is-crosstab.html> [Accessed 31 May 2012].
George, H., 2006. Progress and Poverty. New York: Schalkenbach (Robert) Foundation.
George-Kanentiio, D., 2000. Iroquois Culture & Commentary. New Mexico: Clear Light Publishers.
Ghellini, G., Pannuzi, N. and Stanghellini, L., 1995. Deprivation Pattern in the USA, Comparative
Research on Household Panel Studies, 8. Luxembourg: CEPS/INSTEAD.
Gibert, M., 2007. European Engagements in West Africa. In: W. Feichtinger and G. Hainzl, eds. 2007.
Sorting Out the Mess: Wars, Conflicts and Conflict Management. Vienna: Institute for Support and
Conflict Management, Austrian National Defence Academy, pp. 107-127.
Gilbert, N.,1995. Comparative Research Methods Social Research Update. Available at:<
http://sru.soc.surrey.ac.uk/SRU13.html > [Accessed 28 December 2013].
Gills, B., 1995. Feature Review: Dependency and World Systems, Third World Quarterly, 16(1), pp. 141-
146.
Giddens, A., 1997. Sociology. Oxford: Polity Press.
Giddens, A., 2009. Sociology. 6th
Edition. Oxford: Polity Press.
Giddens, A. and Griffiths, S., 2006. Sociology. 5th ed. Oxford Polity Press. Gidron, B., Bar, M. and Katz,
H., 2004. The Israeli Third Sector: Between Welfare State and Civil Society. New York: Lluwer
Academic/Plenum Publisher
Gillis, A. and Jackson, W., 2002. Research for Nurses: Methods and Interpretation. Philadelphia: F.A
Davis Company.
Girling, J., 1997. Corruption: Capitalism and Democracy. London: Routledge.
Given, L.M., 2008. The Sage Encyclopedia of Qualitative Research Methods. California: Sage
Publications.
Glaeser, E.L. and Shleifer, A., 2005. The Curley Effect: The Economics of Shaping the Electorate,
Journal of Law, Economics and Organization, 21(1), pp. 1-19.
Goldman, A.E., 1962. The Group Depth Interview, Journal of Marketing, pp. 61-68.
Goldstein, M.C., 1978. Pahari and Tibetan Polyandry Revisited, Ethnology 17(3), pp. 325–327.
González, M. and Lopez, R., 2007. Political Violence and Farm Household Efficiency in Colombia,
Economic Development and Cultural Change , 55 (2), pp. 367-92.
Goode, W.J., 1963. World Revolution and Family Patterns. New York: Basic Books.

255
Gordon, A.A., 1996. Transforming Capitalism and Patriarchy: Gender and Development in Africa.
Boulder: Lynne Reiner.
Gordon, D., 2005. Indicators for Poverty and Hunger. A Paper Presented at the Expert Group Meeting on
Youth Development Indicators at The United Nations Headquarters, New York, 12th – 14th December.
Gordon, D., Nandy, S., Pantazis, C., Pemberton, S. and Townsend, P., 2003. Child Poverty in the
Developing World. Bristol: The Policy Press.
Gore, C., 2000. The Rise and Fall of the Washington Consensus as a Paradigm for Developing Countries,
World Development, 28 (5), pp. 789-804.
Gray, J., 2004. Heresies: Against Progress and Other Illusions. London: Granta Books.
Green, F.J., 2010. Patriachal Ideology of Motherhood. In: A. O‘Reilly, ed. 2010. Encyclopedia of
Motherhood. Vol. 1. London: SAGE, p. 969.
Green, L. and Baxen, J., 2002. The Selection and Training of Fieldworkers in Educational Research: A
Western Cape Inquiry, South African Journal of Education, 22(4), pp. 319 – 325.
Green, M., 2002. Social Development: Issues and Approaches. In: U. Kothari and M. Minogue, eds.
2002. Development Theory and Practice: Critical Perspectives. Basingstoke: Palgrave Macmillan.
Greig, A, Hulme, D, Turner, M., 2007. Challenging Global Inequality. Basingstoke: Palgrave
Macmillan.
Grondona, M., 2000. A Cultural Typology of Economic Development. In: L.E. Harrison and S.P.
Huntington, eds. 2000. Culture Matters. New York: Basic Books. pp. 44–55.
Groves, R.M., Fowler Jr, F.J., Couper, M.P., Lepkowski, J.M., Singer, E. and Tourangeau, R.,
2009. Survey Methodology. 2nd
ed. New Jersey: John Wiley and Sons Incorporated
Gueye, A. and Gauci, A., 2003. Pro-Poor Growth Strategies in Africa: Pro-Poor Education Policies and
Labour Demand, Economic Commission for Africa/Economic Policy Research Center.
Gupta, S., Davoodi, H. and Alonso-Terme, R., 2002. Does Corruption Affect Income Inequality and
Poverty?, Economics of Governance, 3(1), pp. 23-45.
Gupta, S., Verhoeven M. and Tiongson E.R., 2002. The Effectiveness of Government Spending on
Education and Healthcare in Developing and Transition Economies, European Journal of Political
Economy, 18(7), pp. 17–37.
Haddad L. and Hoddinott J., 1994. Women’s Income and Boy–Girl Anthropometric Status
in the Côte D'Ivoire. Washington DC: INFRI (International Food Policy Research Institute).
Hagenaars, A. and De Vos, K., 1988. The Definition and Measurement of Poverty, Journal of Human
Resources, 23(2), pp. 211-221.
Hagenaars, A. and Van Praag, B., 1985. A Synthesis of Poverty Line Definitions. Review of Income and
Wealth, 31(2), pp. 139-154.

256
Halcomb, E., Gholizadeh, L., DiGiacomo, M., Phillips, J. and Davidson, P., 2007. Literature Review:
Considerations in Undertaking Focus Group Research with Culturally and Linguistically Diverse Groups,
Journal of Clinical Nursing. 16, pp. 1000-1011.
Hallward, P. 2011. Peter Hallward responds to BBC Radio 4 program on Haiti. Available at:
<http://www.tanbou.com/2011/PeterHallwardRespondsToBbcRadio4Program.htm > [Accessed 11
January 2014].
Halsall, P., 2007. Modern History Sourcebook: Summary of Wallerstein on World System Theory.
Available at: <http://www.fordham.edu/halsall/mod/wallerstein.html> [Accessed 24 April 2011].
Hamilton, C., 2003. Growth Fetish. Sidney: Allen and Unwin.
Hamilton, S., 2011. World Employment May Not Reach Pre-Crisis Level For Five Years, Businessweek
Online [Online] 31 October. Available at:
< http://www.businessweek.com/news/2011-10-31/world-employment-may-not-reach-pre-crisis-level-
for-five-years.html> [Accessed 21 April 2012].
Harney, D., 2011. Why Poverty, Is the Mother of Crime. Available at:
<http://www.labourleft.co.uk/why-poverty-isthe-mother-of-crime-by-david_harney> [Accessed 24 April
2012].
Harrison, D., 1988. The Sociology of Modernization and Development. London: Unwin Hyman Ltd.
Harrison, L.E., 2000. Promoting Progressive Cultural Change. In: L.E. Harrison, and S.P. Huntington,
eds. 2000. Culture Matters. New York: Basic Books, pp. 296–307.
Haviland, W.A., 2003. Anthropology. 10th ed. California: Wadsworth.
Haviland, W.A.; Prins, H.E.L. and Walrath, D., 2007. Cultural Anthropology: The Human Challenge. 12th
ed. Andover: Cengage Learning.
Haynes, J., 2008. Development Studies. Cambridge: Polity Press.
Hechter, M., 1975. Internal Colonialism: The Celtic Fringe in British National Development 1536-1966.
London: Routledge and Kegan Paul.
Heeks, R., 2005. ICTs and the MDGs: On the Wrong Track?, Information for Development, 3(2), pp. 9-
12.
Heineke, J. and Block, M., 1975. A Labor Theoretic Analysis of Criminal Choice, The American
Economic Review, 65(3), pp. 314-325.
Henderson, N.R., 2009. Managing Moderator Stress: Take a Deep Breath. You Can Do This!, Marketing
Research, 21(1), pp. 28-29.
Henninger, N.H. and Snel, M., 2002. Where Are the Poor? Experiences with the Development and Use of
Poverty Maps, WRI; PNUD/GRID.
Hentschel, J., 2003. Integrating the Qual and the Quan: When and Why?. In: R. Kanbur, ed. 2003. Q-
Squared: Qualitative and Quantitative Methods Appraisal. Washington DC: Permanent Black.

257
Herek, G.M., 2012. A Brief Introduction to Sampling. Available at:
<http://psychology.ucdavis.edu/rainbow/html/fact_sample.html#Fowler_text> [Accessed 08 April 2012].
Hettne, B., 1995. Development Theory and the Three Worlds. Harlow: Longman.
Hettne, B., 2008. Development Discourses in History. In: B. Hettne. ed. 2008. Sustainable Development
in a Globalized World, Studies in Development, Security and Culture. Vol. 1. Basingstoke: Palgrave
Macmillan, pp. 6-30.
Hilborn, R. and Mangel, M., 1997. The Ecological Detective: Confronting Models with Data. Princeton:
Princeton University Press.
Hobsbawm, E., 2000. The New Century. London: Abacus.
Hodler, R., Loertscher, S. and Rohner, D., 2010. Inefficient Policies and Incumbency Advantage, Journal
of Public Economics, 94(9-10), pp. 761 – 767.
Hoffman, I.F., Jere, C.S., Taylor, T.E., Munthali, P., Dyer, J.R., Wirima, J.J., Rogerson, S.J., Kumwenda,
N., Eron, J.J., Fiscus, S.A., Chakraborty H., Taha, T.E., Cohen, M.S. and Molyneux, M.E., 1999. The
Effect of Plasmodium Falciparum Malaria on HIV-1 RNA Blood Plasma Concentration, AIDS, 13(4),
pp. 487–494.
Hodgson, D., 1988. Orthodoxy and Revisionism in American Demography, Population and
Development, 14 (4), pp. 541-569.
Holland, J. and Campbell, J., 2005. Context and Challenges for Combining Methods in Development
Research. In: J. Holland and J. Campbell, eds. 2005. Methods in Development Research: Combining
Quantitative and Qualitative Approaches. Rugby: ITDG Publishing.
Home Office, 2011. Statistical News Release: Immigration Statistics - 25 August 2011. Available at:
<http://www.homeoffice.gov.uk/publications/science-research-statistics/research-statistics/immigration-
asylum-research/immigration-q2-2011/immigration-q2-2011snr?view=binary> [Accessed 23 December
2011].
Homeless World Cup, n.d. Beating Homelessness through Football. Available at:
<http://www.homelessworldcup.org/content/homelessness-statistics> [Accessed 15 August 2012].
Hostli, K.J., 1991. Peace and War: Armed Conflicts and International Order 1648-1989. Cambridge:
Cambridge University Press.
Houweling, T.A., Kunst, A.E., Looman, C.W. and Mackenbach, J.P., 2005. Determinants of Under-5
mortality among the Poor and the Rich: A Cross-national Analysis of 43 Developing
Countries. International Journal of Epidemiology, 34(6), pp. 1257-1265.
HTF (Hunger Task Force), 2003. Halving Hunger by 2015: A Framework for Action. Interim Report of
the Millennium Project. New York: United Nations Development Programme (UNDP).

258
Hui, C., 2006. Carrying Capacity, Population Equilibrium, and Envrionment‘s Maximal Load, Ecological
Modelling, 192(1), pp. 317-320.
Hulme, D., 2007. ‗The Making Of The MDGs: Human Development Meets Results-Based
Management in an Imperfect World,‘ BWPI Working Paper 16.
Hulme, D., 2009. The Millennium Development Goals (MDGs): A Short History of the World’s Biggest
Promise [pdf] Manchester, Brooks World Poverty Institute Working Paper 100. Available at: <
http://www.bwpi.manchester.ac.uk/resources/Working-Papers/bwpi-wp-10009> [Accessed 05 July 2010].
Hulme, D. and Turner, M., 1990. Sociology and Development: Theories, Policies and Practices. New
York: Harvester Wheatsheaf.
Human Rights Watch, 2007. Criminal Politics, Violence, Godfathers and Corruption in Nigeria,
19(16(A), New York .
Hunter, L. and Leahey, E., 2008. Collaborative Research in Sociology: Trends and Contributing Factors,
American Sociologist, 39(4), 290–306.
Hunter, N., May, J. and Padayachee, V. (2003). Lessons for PRSP from Poverty Reduction Strategies in
South Africa. University of KwaZulu-Natal, Centre for Social and Development Studies.
Huskey, L. and Morehouse, T.A., 1992. Development in Remote Regions: What Do We Know, Artic,
45(2), pp. 128-137.
Ibekwe, N., 2011. N600m Stolen from Poverty Eradication Programme. Available at:
<www.234next.com/csp/cms/sites/next/news/national/5670239-146/n600m_stolen_from_poverty_eradic-
ation_programme.csp> [Accessed 05 February 2012].
Idowu, A.A., 2002. Research Methodology and Project Reporting in Business Environment. Ede:
Cristatatosh Consults.
IES (International Energy Statistics), 2012. Total Oil Supply (Thousand Barrels Per Day). Available at:
<http://www.eia.gov/cfapps/ipdbproject/iedindex3.cfm?tid=5&pid=53&aid=1&cid=r6,&syid=2011&eyid
=2011&unit=tbpd> [Accessed 07 December 2012].
Igbikiowubo, H., 2004. TSKJ Saga: Swiss Govt Freezes $ 100m Accounts, Vanguard, 06 December.
Available at: < http://www.vanguardngr.com/2004/12/ TSKJ-Saga-swiss-govt- freezes-$-100m-accounts>
[Accessed 23 August 2010].
Ijaiya, G.T. and Nuhu, M.A., 2011. Low Education Attainment and the Incidence of Poverty in Ilorin
Metropolis, Nigeria, International Review of Social Sciences and Humanities 2(1), pp. 81-90.
ILO (International Labour Organization), 1982. International Labour Organization: Resolution
Concerning Statistics of the Economically Active Population, Employment, Unemployment and
Underemployment, Adopted By The Thirteenth International Conference of Labour Statisticians
(October 1982).

259
ILO (International Labour Organization), 2004. A Fair Globalization? Creating Opportunities for All.
Geneva: World Commission on Social Dimensions of Globalization.
ILO (International Labour Organization), 2008. Estimates And Projections of the Economically Active
Population: 1980-2020 [pdf]. Available at:<
http://laborsta.ilo.org/applv8/data/EAPEP/EAPEP_methodology.pdf> [Accessed 01 June 2010].
ILO (International Labour Organization), 2011. Global Employment Trends 2011: The Challenge of a
Jobs Recovery. Geneva: International Labour Organization
IMF (International Monetary Fund), 2003. External Debt Statistics: Guide for Compilers and Users –
Appendix III, Glossary, IMF, Washington DC.
IMF (International Monetary Funds), 2005. Nigeria: Poverty Reduction Strategy Paper- National
Economic Empowerment Development Strategy [pdf] IMF Country Report No. 05/433. Available at: <
http://www.imf.org/external/pubs/ft/scr/2005/cr05433.pdf> [Accessed 09 March 2010].
IMF (International Monetary Funds), 2012. Nigeria: Unemployment rate (Percent of total force), World
Economic Outlook Database. Available at:
<http://www.imf.org/external/pubs/ft/weo/2012/02/weodata/weorept.aspx?sy=2004&ey=2011&scsm=1&
ssd=1&sort=country&ds=.&br=1&pr1.x=77&pr1.y=7&c=694&s=LUR&grp=0&a=> [Accessed 30
November 2012].
IMF (International Monetary Fund), 2013. World Economic Outlook Database, April 2014. Available
at: <http://www.imf.org/external/pubs/ft/weo/2014/01/weodata/index.aspx> [Accessed 01 May
2014].
Imoudu, C.1., 2012. The Millennium Development Goals and Nigeria‘s Development: A Preliminary
Insight, International Journal of Humanities and Social Science, 2(5), pp. 89-95.
Inglehart, R. and Baker, W.E., 2000. Modernization, Cultural Change and the Persistence of Traditional
Values, American Sociological Review, 65, pp. 19-51.
Inglehart, R., 1997. Modernisation and Postmodernization. Princeton: Princeton University Press.
INAFI (International Network Alternative Financial Institution), 2010. Achieving MDGs: The Promise of
Microfinance. Available at:
<http://inafi.org/data-a-publications/60-millennium-development-goals/90-achieving-millennium-
development-goals-the-promise-of-microfinance> [Accessed 12 June 2010].
IOM (International Organization for Migration), 2010. World Migration Report, 2010. The Future of
Migration: Building Capacities for Changei, Geneva: (International Organization for Migration.
IOLNEWS, 2007. We Must End Poverty to End Crime, Says Deputy, 30 January 2007. Available at:
<http://www.iol.co.za/news/politics/we-must-end-poverty-to-end-crime-says-deputy-1.313144>
[Accessed 15 January 2010].
ITU (International Telecommunication Union), 2011. Goals, Targets and Indicators. Available at:
<http://www.itu.int/itu-d/ict/mdg/goals.html#g1> [Accessed 28 February 2012].

260
Isugo-Abanihe, U.C., 1985. Child Fosterage in West Africa. Population and Development Review, 11(1),
pp. 53-72.
Isiugo-Abanihe, U.C., 1994. Reproductive Motivation and Family Size Preference among Nigerian Men,
Studies in Family Planning, 25(3), pp. 149 – 161.
Isiugo-Abanihe, U.C., 2003. Male Role and Responsibility in Fertility and Reproductive Health in
Nigeria. Ibadan: The Centre for Population Activities and Education for Development.
Jigawa State Government, 2012. Jigawa State – Nigeria. Available at: <http://www.jigawastate.gov.ng/>
[Accessed 31 July 2011].
Johnson, D.L., Ambrose, S.H., Bassett, T.J., Bowen, M.L., Crummey, D.E., Isaacson, J.S., Johnson, D.N.,
Lamb, P., Saul, M. A.E. and Winter-Nelson, A.E., 1997. Meanings of Environmental Terms, Journal of
Environmental Quality, 26 (3), pp. 581-589.
Johnson, H. and Bernstein, H. eds., 1982. Third World Lives of Struggle. London: Heinemman.
Jokela M., Rotkirch A., Rickard I., Pettay J. and Lummaa V., 2010. Serial Monogamy Increases
Reproductive Success in Men But Not in Women, Behavioural Ecology 21(5), pp. 906–912.
Jolly, R., 1976. The World Employment Conference: The Enthronement of Basic Needs,
Development Policy Review, A9 (2), PP. 31-44.
Jolly, R., 2005. Global inequality in historical perspective, UNU-WIDER Jubilee Conference, 17-18th
June 2005.
Jones, S., 2008. Human Evolution is Over, UCL (University College London) Lunch Hour Lecture, 07
October.
Jordan, B., 1985. The State: Authority and Autonomy. Oxford: Blackwell.
Jordan, G., 2004. The Causes of Poverty—Cultural vs. Structural: Can There Be a Synthesis, Perspectives
in Public Affairs, 1, pp. 18-34.
Justino, P., 2008. Poverty and Violent Conflict: A Micro-Level Perspective on the Causes and Duration of
Warfare [pdf] MICROCON Research Working Paper 6, Brighton. Available at:
<http://www.microconflict.eu/publications/RWP6_PJ.pdf> [Accessed 11 March 2011].
Justino, P. 2010. War and Poverty, MICROCON Research Working Paper 32.
Kabeer, N., 2005. The Beijing Platform for Action and the Millennium Development Goals:Different
Processes, Different Outcomes. Baku: United Nations Division for the Advancement of Women.
Kabeer, N., 2010. Can the MDGs Provide a Pathway to Social Justice? The Challenge of
Intersecting Inequalities, Child Poverty and Inequality New Perspectives, 57.
Kalyvas, S.N., 2007. The Logic of Violence in Civil Wars. Cambridge: Cambridge University Press.

261
Kämpchen, M., 2011. Poverty - Precarious Balance. Available at:
<http://interkulturelle-zusammenarbeit.org/articles/192739/index.en.shtml> [Accessed 02 July 2011].
Kanbur, R. and Sumner, A., 2011. Poor Countries or Poor People? Development Assistance and the New
Geography of Global Poverty, Journal of International Development, 24(6), pp. 686-695.
Karade, I.,1994. The handbook of Yoruba religious concepts. York Beach: Weiser Books.
Kates, R.W., Parris, T.M. and Leiserowitz, A.A., 2005. What Is Sustainable Development? Goals,
Indicators, Values and Practice, Environment: Science and Policy for Sustainable Development, 47(3),
2005, pp. 8–21.
Katter, B., 2012. An Incredible Race of People: A Passionate History of Australia. Sydney:
Murdoch Books.
Kaufman, M.T., 2003. Robert K. Merton, Versatile Sociologist and Father of the Focus Group, Dies at
92, The New York Times, 24 April. Available at: <http://www.nytimes.com/2003/02/24/nyregion/robert-
k-merton-versatile-sociologist-and-father-of-the-focus-group-dies-at-92.html> [Accessed 04 September
2012].
Kay, J., 2004. The Truth About Markets: Why Some Countries Are Rich But Most Remain Poor. London:
Penguin.
Kayode, M.O. and Odusola, A.F., 2000. Poverty in the Midst of Plenty, Paper Delivered at the Annual
Dialogue of The Obafemi Awolowo Foundation, Nigerian Institute Of International Affairs, Lagos, 4 - 5
December.
Kegley, C., 2006. World Politics: Trend and Transformation, 11th
ed. 2012-2013 Edition. Belmont:
Thomsom-Wadworth.
Kelley, A.C., 1995. Revisionism Revisited: An Essay on the Population Debate in Historical
Perspective, Duke University Department of Economics Working Paper no. 95-45.
Kelly, M., 2000. Inequality and Crime, The Review Of Economics and Statistics, 82(4), pp. 530-539,
2000.
Kendall K.E. and Kendall, J.E., 2005. Systems Analysis and Design. 6th ed. New Jersey: Pearson
Education Incorporated.
Keown, C., 1983. Focus Group Research: Tool for the Retailer. In T.J. Hayes and B. Carol
(eds.), Focus Group Interviews: A Reader. Chicago: American Marketing Association, pp. 64-
70.
Kenyon, G.L., Chong, K., Enkoff-Sage, M., Hill, C., Mays, C. and Rochelle, L., 2003. Public Adoption
by Gay and Lesbian Parents in North Carolina: Policy and Practice. Family in Society, 84(4), pp. 571-
575.

262
Khan, M.E., Anker, M., Patel, B.C., Barge, S., Sadhwani, H. and Kohle, R. 1991. The Use of Focus
Groups in Social and Behavioural Research: Some Methodological Issues, World Health Stat Q, 44(3),
pp. 145-149.
Kiely, R., 1995. Sociology and Development: The Impasse and Beyond. London: UCL (University
College London) Press.
Kirk, J. and Miller, M., 1986. Reliability and Validity in Qualitative Research. London: Sage
Publications.
Klein, D., 2004. Liberal Anti-Imperialism: Some Notes On The Tradition Of Classical Liberal Opposition
to Colonialism, Imperialism, and Empire [pdf]. Available at:
<http://www.setav.org/ups/dosya/24514.pdf> [Accessed 18 November 2010].
Klein, D.M. and White, J.M., 1996. Family Theories – An Introduction. California: Sage Publications Inc.
Knutsson, B., 2009. The Intellectual History of Development-Towards a Widening Potential Repertoire,
Perspectives, No. 13, April.
Koo, H., 1984. World Systems, Class, Social Class, and State in the Third World Development,
Sociological Perspectives 27, pp. 33-52.
Koppstein, J. and Lichbach, M.I., 2005. Comparative Politics: Interests, Identities, and Institutions in a
Changing Global Order. Cambridge: Cambridge University Press.
Korten, D.C., 1987. Third Generation NGO Strategies: A Key to People-Centered Development, World
Development, 15, pp. 145-159.
Kothari, R., 1988. Rethinking Development: In Search of Humane Alternatives. New Delhi: Ajanta
Publications.
Kothari, U., 2002. Feminist and Postcolonial Challenges to Development. In: U. Kothari and M.
Minogue, eds. 2002. Development Theory and Practice: Critical Perspectives. Basingstoke: Palgrave.
Krueger, R.A. and Casey, M.A., 2000. Focus Groups: A Practical Guide for Applied Researchers. 3rd
ed.
California: Sage.
Krugman, P. and Wells, R., 2009. Macroeconomics. New York: Worth Publishers.
Kuhnen, F., 1987. Causes of Underdevelopment and Concepts for Development. An Introduction to
Development Theories, The Journal Of Development Studies, 8, pp. 11-25.
Kumar, K., 1987. Conducting Focus Group Interviews in Developing Countries, A.I.D. Programme
Design and Evaluation Methodology Report No. 8.
Kundu, T., 2007. Can Democracy Always Lead to Efficient Economic Transitions? Esop Working Paper,
Univeristy of Oslo.
Landes, D., 2002. The Wealth and Poverty of Nations. London: Abacus.

263
Langford, M., 2010. A Poverty of Rights: Six Ways to Fix the MDGs. IDS Bulletin-Institute of
Development Studies, 41(1), pp. 83–91.
Langmore, J., 2000. Reducing Poverty: The Implications of the 1995 Copenhagen Agreement for
Research in Poverty. In: D. Gordon and P. Townsend, eds. 2000. Breadline Europe: The Measurement of
Poverty (Studies In Poverty, Inequality & Social Exclusion Series). Cambridge: Polity Press.
Lanjouw, P. and Ravallion, M., 1994. Poverty and Household Size, Policy Research Working Paper
1332, World Bank, Washington, D. C.
Lappé, F.M. and Schurman, R., 1990. Taking Population Seriously. San Francisco: Food First Books.
Lash, S. And Urry, J., 1994. Economies of Signs and Space. London: Sage.
Lawson, P.S., 2010. Essentials of Citizenship Education. Vol. 1. Ibadan: The Lord‘s Creation Publishers.
Leacock, E., 1978. Women‘ Status in Egalitarian Society: Implication for Social Solution, Current
Anthropology, 19(2), pp. 245-275.
Le Bon, T., 2001. Wise Therapy: Philosophy for Counsellors. Thousand Oaks: Sage Publication.
Lechner, F., 2001. ,Globalization Theories: World-System Theory. Available at:
< http://sociology.emory.edu/faculty/globalization/theories01.html> [Accessed 24 April 2011].
Lepianka, D., Van Oorschot, W., and Gelissen, J. 2009. Popular explanations of poverty: A critical
discussion of empirical research. Journal of Social Policy, 38(03), 421-438.
Lewis, O., 1961. The Children of Sanchez: An Autobiography of a Mexican Family. New York: Random
House.
Lewis, O., 1964. The Culture of Poverty. In: J.J. Tepaske nd S.N. Fisher, eds., 1964 Explosive Forces in
Latin America. Columbus: Ohio State University Press.
Lewis, O., 1966. La Vida: A Puerto Rican Family in the Culture of Poverty—San Juan and New York
(Vol. 13). New York: Random House.
Lewis, O. and La Farge, O., 1959. Five Families, Mexican Case Studies in The Culture Of Poverty. New
York: Basic Books.
LeVine, R.A., 2007. Culture, behavior, and personality. New Brunswick: Transaction Publishers.
Lindlof, T.R. and Taylor, B.C., 2002. Qualitative Communication Research Methods. 2nd
ed. California:
Sage.
Lindsay, S., 2000. Culture, Mental Models, and National Prosperity. L.E. Harrison and S.P. Huntington,
eds. 2000. Culture Matters: How Values Shape Human Progress. New York: Basic Books. pp. 282–295.
Linkola, P., 2009. Can Life Prevail? A Radical Approach to the Environmental Crisis.London: Arktos
Media Ltd.

264
Lipset, S.M. and Lenz, G.S., 2000. Corruption, Culture, and Markets, in Culture Matters. In: L.E.
Harrison and S.P. Huntington, eds. 2000. Culture Matters. New York: Basic Books.
Lipton, M., 1996. Successes in Anti-Poverty, Issues in Development Discussion Paper 8,
Development and Technical Co-operation Department, ILO, Geneva.
Lipton, M., and Ravallion, M., 1995. Poverty and Policy. In: J.R. Behrman and T.N. Srinivasan, eds.
1995. Handbook of Development Economics. (Vol. 3). Amsterdam: North Holland.
Lister, R., 2004. Poverty. Cambridge: Polity Press.
Loewen, G., 2009. A Compendium of Poverty Reduction Strategies and Frameworks. Ontario: Tamarack
– An Institute for Community Engagement.
Loewenson, R. and Whiteside, A., 2001. HIV/AIDS: Implications for Poverty Reduction, UNDP (United
Nations Development Programme), , Bureau for Development Policy, Special Initiative on HIV/AIDS.
Lofland J. and Lofland, L., 1984. Analyzing Social Settings: A Guide to Qualitative Observation and
Analysis. California: Wadsworth.
Lohr, S.L., 2009. Sampling: Design and Analysis. 2nd
ed. Boston: Cengage learning Incorporated.
Lok-Dessallien, R., 1999. Review of poverty concepts and indicators. New York: United Nations
Development Programme.
Lorentzen, P., McMillan, J. and Wacziarg, R., 2008. Death and Development , Journal of Economic
Growth, 13(2), pp. 81-124.
Low A., 1989. Agricultural Development In Southern Africa: Farm Household Economics And The Food
Crisis. London: James Currey.
Lowe, I., 2005. The Big Fix: Radical Solutions to Australia’s Environmental Crisis. Melbourne: Black.
Lucid Pages, 2011. Causes and Consequences of Overpopulation. Available at:
<http://www.lucidpages.com/doom.html> [Accessed 02 July 2011].
Lutz, W., Sanderson, W. and Scherbov, S., 2001. The End of World Population Growth. Nature,
412(6846), pp. 543-545.
Maiava, S., 2002. When Development is not Development: Recognizing Unofficial Development
(or Practising Postdevelopment, Unpublished Paper, Massey University, Auckland, New
Zealand.
Make Poverty History – Canada, 2010. Global Poverty Fact. Available at:
<http://www.makepovertyhistory.ca> [Accessed 2 October 2010].
Malthus T.R., 2005. An Essay on the Principle of Population. New York: Cosimo Classics.
Malti-Douglas, F., 2007. Encyclopedia of Sex and Gender. Detroit: Macmillan.

265
Mann, P.S., 1995. Introductory Statistics, 2nd
ed. New Jersey: John Wiley.
Mansuri, G. and Rao, V., 2004. Community Based (and Driven) Development: A Critical Review, The
World Bank Research Observer, 19(1), pp. 1-39.
Marglin, S., 2008. The Dismal Science: How Thinking Like an Economist Undermines Community.
Cambridge: Harvard University Press.
Marsh, M. and Alagona, P.S. eds., 2008. Barron’s AP Human Geography. New York: Barron‘s
Educational Series Incorporated.
Marshall, C. and Rossman, G., 1989. Designing Qualitative Research. California: Sage Publications.
Marshall, C. and Rossman, G., 1999. Designing Qualitative Research. 3rd
ed. London: Sage Publications.
Marshall, M.N., 1996. Sampling for Qualitative Research, Family Practice, 13, pp. 522–526.
Marshall, T.H., 1977. Class, Citizenship and Social Development. Chicago: University of Chicago Press.
Martin, H.P. and Schumann, H., 1997. The Global Trap: Globalization and Assault on Democracy and
Prosperity. London: Zed Books.
Martin, P., 2009. Demographic and Economic Trends: Implications for International Mobility [pdf]
Human Development Research Paper 2009/17. Available at:
<http://hdr.undp.org/es/informes/mundial/idh2009/trabajos/hdrp_2009_17.pdf> [Accessed 18 January
2011].
Marx, I. and Van den Bosch, K., 2007. How Poverty Differs from Inequality on Poverty
Management in an Enlarged EU Context: Conventional and Alternate Approaches. Antwerp:
Centre for Social Policy.
Mason, J., 1996. Qualitative Researching. London: Sage.
Mathgoodies, 2013. Percent Increase and Decrease. Available at: <http://www.mathgoodies.com/lessons/-
percent/change.html [Accessed 14 February, 2013].
Mattilla-Wiro, P., 1999. Economic Theories of the Household: A Critical Review. United Nations
Working Papers No. 159, April.
McCarthy S., 1994. Africa: The Challenge of Transformation. London: I.B. Tauris and Co. Publishers.
McDaniel, S.H., Cambell, T.L., Hepworth, J. and Lorenz, A., 2005. Family-Oriented Primary Care. 2nd
ed. New York: Springer.
McGillivray, M., 1991. The Human Development Index: Yet Another Redundant Composite
Development Indicator?, World Development 19(10), pp. 1461–1468.
McGillivray, M., 2008. Achieving the Millennium Development Goals. Basingstoke: Macmillan
Publishers.
266
McGillivray, M. and White, H., 2006. Measuring Development? The UNDP‘s Human Development
Index, Journal of International Development 5(2), pp. 183–192.
McLafferty I., 2004. Focus Group Interviews as A Data Collecting Strategy, Journal of Advanced
Nursing 48(2), pp. 187-194.
Mcllwaine, C., 2002. Perspectives on Poverty, Vulnerability and Exclusion. In C. McIlwaine and
K. Willis (eds.) Challenges and Change in Middle America: Perspectives on Mexico, Central America
and the Caribbean. London: Pearson, pp. 82-109.
Meagher, M., 2011. Patriachy. In: G. Ritzer, and J.M Ryan, eds. 2011. The Concise Encyclopedia of
Sociology. West Sussex: John Wiley and Sons, pp. 441–442.
Medard, G. and Bruner, H., 2003. Global Inc: An Atlas of the Multinational Corporation. New
York: The New Press.
Mellenbergh, G.J., 2008a. Research Designs: Testing of Research Hypotheses. In: H.J. Adèr and G.J.
Mellenbergh, eds. (with contributions by D.J. Hand). 2008. Advising on Research Methods: A
Consultant's Companion. Huizen: Johannes van Kessel Publishing, pp. 183-209.
Mellenbergh, G.J., 2008b. Tests and Questionnaires: Construction and Administration. In: H.J. Adèr and
G.J. Mellenbergh, eds. (with contributions by D.J. Hand). 2008. Advising on Research Methods: A
Consultant's Companion. Huizen: Johannes van Kessel Publishing, pp. 211--236.
Mertens, D.M., 2003. Mixed Methods and the Politics of Human Research: The Transformative-
Emancipatory Perspective. In A.Tashakkori and C. Teddlie (eds.) Handbook of Mixed Methods in
Social and Behavioral Research. Thousand Oaks, CA: Sage Publications.
Mertens, D.M., 2005. Research Methods in Education and Psychology: Integrating Diversity
with Quantitative and Qualitative Approaches. 2nd
ed. Thousand Oaks: Sage Publication.
Milanovic, B., 2012. Global Income Inequality in Numbers: In History and Now, Policy Research
Working Paper 6259N. Washington DC: The World Bank.
Miller, N.Z. and Goldman, G.S., 2011. Infant Mortality Rates Regressed Against Number of Vaccine
Doses Routinely Given: Is There A Biochemical Or Synergistic Toxicity?, Human and Experimental
Toxicology, 30(9), pp. 1420-1428.
Milne, J., 1999. Questionnaires: Advantages and Disadvantages, Centre for CBL in Land Use and
Environmental Sciences, Aberdeen University, Available at:
<http://www.icbl.hw.ac.uk/ltdi/cookbook/info_questionnaires/> [Accessed 05 May 2012].
Mirowski, P. and Plehwe, D., 2009. The Road from Mont Pèlerin: The Making of The Neoliberal Thought Collective. Cambridge: Harvard University Press.
Mishra, A.P., 2011. Geography, Poverty and Development: An Interdisciplinary Debate, Sociedade and
Natureza, 23(2), pp. 227-236.

267
Monnier, C., 2009. Basic Concepts (Global Stratification): Poverty and Development. Available at:
<https://globalsociology.pbworks.com/w/page/14711159/Basic%20Concepts %20
(Global%20Stratification) [Accessed 06 March 2010].
Moore, M., 2006. Signposts to More Effective States, Paper prepared for the Seventh Annual Global
Development Conference,St. Petersburg, Russia, 19-21 January.
Morawetz, D., 1977. Twenty-Five Years of Economic Development: 1950-1975. Washington DC: World
Bank.
Morgan, D.L., 1997. Planning Focus Groups. California: Sage.
Mother Land Nigeria, 2007. Marriage and Family. Available at:
<http://www.motherlandnigeria.com/life.html> [Accessed 06 March 2010].
Mugo F.W., 2002. Sampling in Research [pdf]. Available at:
http://indiana.edu/~educy520/sec5982/week_2/mugo02sampling.pdf [Accessed 10 February 2012].
Muncie, J. and Sapsford, R., 1999. Issues in the Study of the Family. In: J. Muncie, M. Wetherell, M.
Langan R. Dallos and A. Cochrane, eds. 1999. Understanding the Family. London: SAGE Publications
Ltd, pp. 8-37.
Mundial, B., 1996. Nigeria: Poverty in the midst of plenty. The challenge of growth with inclusion, A
World Bank Poverty Assessment. Report No. 4733-UNI.
Murdock, G.P., 1965. Social Structure. New York: Free Press.
Murdock, G.P., 1968. The Universality of the Nuclear Family. In: N. Bell and E. Vogel, eds. 1968. A
Modern Introduction to the Family. New York: Free Press.
Myrdal, G., 1957. Economic Theory and Underdeveloped Regions. London: Gerald Duckworth and Co.
Nag, M., White, B.N., Peet, R.C., Bardhan, A., Hull, T. H., Johnson, A. and Tax, S., 1978. An
Anthropological Approach to the Study of the Economic Value of Children in Java and Nepal [and
Comments and Reply], Current Anthropology, pp. 293-306.
Narayan, D., with Patel, R., Schafft, K., Rademacher A. and Koch-Schulte, S., 2000. Voices of the Poor:
Can Anyone Hear Us? New York: Oxford University Press.
National Anti-Poverty Commission, 2003. Institutional Convergence Framework for Local Poverty
Reduction Programmes, Final Report Prepared by ARND (Ateneo Research Network for Development)
Working Group on Poverty and Resilience for National Anti-Poverty Commission.
National Research Council (US), 1986. Population Growth and Economic Development: Policy
Questions. Washington DC: National Academy Press.
NBS (National Bureau of Statistics), 2005. Poverty Profile for Nigeria. Lagos: NBS (National Bureau of
Statistics).
NBS (National Bureau of Statistics), 2012a. Nigeria Poverty Profile 2010. Abuja: NBS (National Bureau
of Statistics).

268
NBS (National Bureau of Statistics), 2012b. The Nigeria Poverty Profile 2010 Report [pdf] NBS Press
Briefing on Nigeria Poverty Profile 2010 Report. Available at:
<http://www.nigerdeltabudget.org/National%20Bureau%20of%20Statistics%20Poverty%20P
rofile%20of%20Nigeria%202012%20(1).pdf> [Accessed 18 August 2012].
NBS (National Bureau of Statistics), 2012c. 2011 Annual Socio-Economic Report. Abuja: NBS (National
Bureau of Statistics).
NBS (National Bureau of Statistics), 2012d. Review of the Nigerian Economy in 2011 and Economic
Outlook for 2012 – 2015. Abuja: NBS (National Bureau of Statistics).
NBS (National Bureau of Statistics), 2014. Rebasing Of National Accounts Statistics Methodology
Notes on Gross Domestic Product (GDP) Rebasing Exercise. Abuja: NBS (National Bureau of
Statistics).
NBER (National Bureau of Economic Research), 2007. Current Population Survey: 2006 Annual Social
and Economic (ASEC) Supplement [pdf]. Available at:
Nc3rs (National Centre for Replacement, Refinement and Reduction of Animals in Research), 2006. Why
Do a Pilot Study. Available at: < www.nc3rs.org.uk> [Accessed 02 November 2012].
Ncalculator., 2013. Percent Increase and Decrease. Available at: < http://www.ncalculator.com >
[Accessed 14 February, 2013].
Nerfin, M. (ed.) 1977. Another Development: Approaches and Strategies. Uppsala: Dag
Hammerskjold Foundation.
Newman, K.S., 1999. Falling From Grace: Downward Mobility in the Age of Affluence.
California: University of California Press.
Nie, N.H., Brent, D.H. and Hull, C.H., 1970. Statistical Package for the Social Sciences. New York:
McGraw Hill.
Nielsen, F., 2007. Industrialising Societies, Human Societies, Soc 111 Syllabus, University Of North
Carolina, Chapel Hill. Available at: <www.Unc.Edu/-Nielsen/Soci111/M18.Pdf> [Accessed 16 June
2011].
Nigeria First, 2012. The 7-Point Agenda: Driving Nigeria‘s Transformation. Available at:
<http://www.nigeriafirst.org/article_8489.shtml#top> [Accessed 13 October 2012].
Nigeria World, 1999. Vision 2010 Report Full Text. Available at:
<http://nigeriaworld.com/focus/documents/vision2010.html> [Accessed 13 October 2012].
NISL-Ecological Informatics, 2007. Poverty Influences Environmental Degradation. Available at:
<http://bcb706.blogspot.co.uk/2007/03/poverty-influences-environmental.html>
[Accessed 01 June 2010].
Nkom, S.A., 2001. Rural Development as a Spring-Bound for Poverty Alleviation in Nigeria, Journal of
Political and Economic Studies, 3(1), pp. 26-50.
Nkrumah, K., 1965. Neo-Colonialism: The Last Stage of Imperialism. London: Nelson Books.

269
NLCHP (National Law Centre on Homelessness and Poverty), 2012a. Homelessness and Poverty in
America: Overview. Available at: <http://www.nlchp.org/hapia.cfm> [Accessed 12 December 2012].
NLCHP (National Law Centre on Homelessness and Poverty), 2012b. Homelessness and Poverty in
America: Causes. Available at: <http://www.nlchp.org/hapia_causes.cfm> [Accessed 12 December
2012].
Nolan, B. and Whelan, C.T., 1996. Recourses, Deprivation and Poverty. Oxford: Clarendon Press.
Norberg, J., 2003. In Defense of Global Capitalism. Washington DC: CATO Institute.
Norberg, J., 2006. Three Cheers for Global Capitalism. In: R.M. Jackson, ed. 2006. Global Issues 05/06.
Iowa: McGraw-Hill/Dushkin.
Norton, M., 2005. New Evidence on Birth Spacing: Promising Findings for Improving Newborn, Infant,
Child, and Maternal Health, International Journal of Gynecology and Obstetrics, 89, pp. S1–S6.
Nozick, R., 1974. Anarchy, State, and Utopia. New York: Basic Books.
NPC (National Planning Commission), 2004a. National Economic Empowerment and Development
(NEEDS).Abuja: Federal Republic of Nigeria.
NPC (National Planning Commission), 2004b. Millennium Development Goals Report 2004 – Nigeria.
Abuja: National Planning Commission.
NPC (National Planning Commission), 2007. Millennium Development Goals Report 2006 – Nigeria.
Abuja: National Planning Commission.
NpoC (National Population Commission), 1998. 1991 Population Census of the Federal Republic of
Nigeria: Analytical Report at the National Level. Abuja: National Population Commission.
NpoC (National Population Commission), 2006. 2006 Population and Housing Census of the Federal
Republic of Nigeria. Abuja: NpoC (National Population Commission).
Nukunya, G.K., 1992. Tradition and Change in Ghana: An Introduction to Sociology. Accra: Ghana
Universities Press.
Nussbaum, M.C., 1999. Sex and Social Justice. Oxford: Oxford University Press.
Nussbaum, M., 2000. Women and Human Development: The Capabilities Approach, Cambridge:
Cambridge University Press.
Nweke, E.N., 2012. Increase of Extreme Poverty and Hunger in the Context of Millennium Development
Goals (MDGs) in Nigeria: Explanations and Framework for Improvement, Developing Country Studies,
2(5), pp. 7-12.
Nwokeoma, J., 2009. Why Nigeria May Not Meet the Millennium Development Goals, Nigerians in
America, 07 August. Available at:
<http://www.nigeriansinamerica.com/articles/3530/1/why-nigeria-may-not-meet-the-millennium-
development-goals/page1.html> [Accessed 01 June 2011].

270
Nworgu, B.G., 1991. Educational Research: Basic Issues and Methodology. Ibadan: Wisdom Publishers.
Nye, J., 2004. The Rising Power of NGOs. Available at: <http://www.project-
syndicate.org/commentary/the-rising-power-of-ngo-s > [Accessed 25 January 2014].
O'Connor, J., 2012. NGO: The Guise of Innocence - New Left Project, 2012. Available at:
<http://www.newleftproject.org/index.php/site/article_comments/ngo_the_guise_of_innocence >
[Accessed 11 January 2014].
Obadan, M.I., 2002. Poverty Reduction in Nigeria: The Way Forward, CBN Economic and Financial
Review, 39(4).
Obadan, M.I. and A.F. Odusola, 2001. The Economy and Poverty in Nigeria, Paper Presented at The
National Conference on Law And Poverty Nigerian Institute of Advanced Legal Studies, Kano, 26-28
June.
Obasan, K.A., 1999. Social Institutions. In: M.O Shoremi, P.A Edewor and O.A Olutayo, eds. The
Science of Society: A Sociological Introduction. Ago Iwoye: CESAP.
Ocholla-Ayayo, A.B.C., 1997. The African Family between Tradition and Modernity. In: A. Adepoju,
ed. 1997. Family, Population and Development in Africa. London and New Jersey: Zed Books Limited,
pp. 60 – 67.
Odewale, W.R., Aribaba, O.F. and Adeyeye, O.P., 2008. Developing the Individual Savings and
Investments Attitude Towards Exiting the Poverty Trap in Nigeria. In: E.O Akinnowo, ed. 2008. Socio-
Economic Policies and MDGs in Africa. Akungba: Faculty of Social Sciences, Adekunle Ajasin
University, Akungba-Akoko, Nigeria.
Odusola, A., 2006. Economic Foundation of National Economic Empowerment and Development
Strategy (NEEDS). In: A. Ariyo, A. Odusola and F. Ayonrinde, eds. 2006. NEEDS and Nigeria’s
Sustainable Development. Ibadan: The Centre for Public-Private Cooperation.
OECD (Organisation for Economic Co-operation and Development), 1985. Twenty-Five Years of
Development Cooperation: A Review. Paris: OECD (Organisation for Economic Co-operation and
Development).
OECD (Organisation for Economic Co-operation and Development), 2009. Net National Income Per
Capita. In: Society at a Glance 2009: OECD Social Indicators. Available at:
<http://dx.doi.org/10.1787/soc_glance-2008-5-en> [Accessed 16 July 2011].
OECD (Organisation for Economic Co-operation and Development), 2012. Infant Mortality. In: Health at
a Glance: Europe 2012, OECD Publishing.
OECD-ADB (Organisation for Economic Co-operation and Development- African Development Bank),
2006. Official Development Assistance – 1999 – 2004. Paris: OECD (Organisation for Economic Co-
operation and Development).
Oestergaard, M.Z., Inoue, M., Yoshida, S., Mahanani, W.R., Gore, F. M., Cousens, S., Lawn, J.E. and
Mathers, C.D., 2011. Neonatal Mortality Levels for 193 Countries in 2009 with Trends since 1990: A
Systematic Analysis of Progress, Projections, and Priorities, PLoS Medicine, 8(8), e1001080.

271
Ogboru, I.; (2007). Corruption in Nigeria: A Great Challenge to Economic Development. International
Journal of Development and Management Review, 2(1), pp. 62-71.
Ogefere, S., 2007. Govt Lists Challenges to NEEDS-2 Goals Achievement, The Guardian, May 8.
Ogege, S.O., 2011. Evolving Poverty Profile and the Millennium Development Goals in Nigeria, JORIND
9 (1), pp. 177-185.
Ogundipe-Leslie, M., 1994. Re-Creating Ourselves: African Women And Critical Transformations. New
Jersey: African World Press Incorporated.
Ogunmola, D. and Badmus, A., 2010. Meeting the Challenges of the Millennium Development Goals in
Nigeria: Problems, Possibilities and Prospects [pdf] Proceedings of the International Conference on
Meeting the MDGs: Old Problems, New Challenges. La Trobe University, Melbourne Australia.
Available at:<
http:www.Latrobe.Edu.Au/Humansecurity/Assets/Downloads/Mdgconfpapers/Ogunmola_And_Badmus,.
Pdf>[Accessed 24 June 2011).
Ogwumike, F.O., 2002. An Appraisal of Poverty Reduction Strategies in Nigeria, CBN Economic and
Financial Review, 39(4).
Ojowu, O., Bulus, H. and Omonona, B., 2007. Nigeria Poverty Assessment [pdf]. Available at:
<http:www.Paknigeria.Org/Pdfs/24_Nigeria_Poverty_Assessment_2007_Table_Of_Contents_Executi.Pd
f> [Accessed 07 July 2010].
Okafor, S.O., 1981. Indirect Rule: The Development of Central Legislature in Nigeria. Lagos: Nelson.
Okunmadewa, F., 1997. Nigeria: Poverty Reducing Growth Strategies and Option, CBN/World Bank
Collaborative Study On Nigeria: Prospects For Development, pp. 6-17.
Oladele, K., 2009. Africa and the Challenge of Millennium Development Goals (MDGs). Available at:
<http://www.nigeriavillagesquare.com/articles/kayode/kayode-oladele/africa-and-the-challenge-of-
milleniumdevelopment-goals-mdgs.html> [Accessed 01 November 2011).
Oladunni, E.B.I., 1999. The Dimension of Poverty in Nigeria, Bullion, 23(4).
Olajide, S.O., 1981. Elements of Rural Economy .Ibadan: Ibadan University Press.
Olawale, J.B., 1980. Topics on Government Constitutions. Vol. II. Ilesa: Jola Publications.
Olaniyan, O. and Awoyemi, T. T., 2005. Inequality in the Distribution of Household Expenditure in
Rural Nigeria: A Decomposition Analysis. Draft Final Research Report, AERC (African Economic
Research Consortium), Nairobi, Second Phase Collaborative Poverty Research Project.
Olomola A.S., 2007. Strategies For Managing the Opportunities and Challenges of the Current
Agricultural Commodity Booms in SSA, Seminar Paper on Managing Commodity Booms in Sub-
Saharan Africa, A Publication of The AERC Senior Policy Seminar IX, African Economic Research
Consortium (AERC), Nairobi, Kenya.
Olson, M. 1984. The Rise and Decline of Nations: Economic Growth, Stagflation, and Social
Rigidities. New Haven: Yale University Press.

272
Omoigui, N., 2007. Gowon‘s Broadcast to the Nation. Available at:
<http://www.dawodu.com/gowon.htm> [Accessed 10 June 2010].
Omokhodion, J.O., 1996. Sociology of Education: An African Experience. Lagos: Tropical Publications.
Omonona, B., 2010. Quantitative Analysis of Rural Poverty in Nigeria. Abuja: INFRI (International Food
Policy Research Institute).
Oni, B., Akerele, W.O., Abimbola, O.A., Odekunle, S. O. and Opatola, A. O., 2003. Human Resources
Development Perspective of Poverty in Nigeria. In: D.O. Ajalaiye and A.S. Olomola, eds. 2003. Poverty
in Nigeria. Ibadan: Nigerian Institute of Social And Economic Research.
Oniang‘o, R. and Mukudi, E., 2002. Nutrition and Gender: A Foundation for Development, Brief 7 of 12,
UNACC/SCN, Geneva.
ONS (Office for National Statistics), 2005. Households. Available at:
<http://www.ons.gov.uk/ons/downloads/theme_compendia/ghs05/> [Accessed 15 January 2010].
Onyenekenwa C.E, 2011. Nigeria‘s Vision 20:2020-Issues, Challenges and Implications for Development
Management, Asian Journal of Rural Development, 1, pp. 21-40.
Onwuegbuzie, A. J.; Dickinson, W. B., Leech, N. L. and Zoran, A. G., 2009. A Qualitative Framework
for Collecting and Analyzing Data in Focus Group Research, International Journal of Qualitative
Methods, 8(3), pp. 1-21.
Oosterlaken, I., 2009. Design for Development: A Capability Approach, Design Issues, 25(4), pp. 91-102.
Oppenheim, A., 1992. Questionnaire Design, Interviewing and Attitude Measurement. London: Pinter
Publisher.
Orubuloye, I.O., 1995. The Demographic Situation in Nigeria and Prospects for Fertility Transition,
Journal of International Development, 7(1), pp. 135 – 144.
OSSAP-MDGs, 2008. Mid-Point Assessment of the Millennium Development Goals in Nigeria 2000-
2007. Abuja: Office of the Senior Special Advisor to the President, Millennium Development Goals.
OSSAP-MDGs, 2009. MDGs Report – 2006 – 2008. Abuja: Office of the Senior Special
Adviser to the President, Millennium Development Goals.
OSSAP-MDGs, 2010a. Countdown Strategy-2010 to 2015: Achieving the MDGs. Abuja: Office of the
Senior Special Adviser to the President, Millennium Development Goals.
OSSAP-MDGs, 2010b. Nigeria Millennium Development Goals. Abuja: Office of the Senior Special
Adviser to the President, Millennium Development Goals.
Oshewolo, S., 2011. Poverty Reduction and the Attainment of the MDGs in Nigeria: Problems and
Prospects, International Journal of Politics and Good Governance, 2(23), pp. 1-22.
Osun State Government, 2012. Official Website of Government of Osun. Available at:
<http://osunstateng.com/> [Accessed 29 May 2011].

273
Osinubi, T.S., 2005. Macroeconometric Analysis of Growth, Unemployment and Poverty in Nigeria,
Pakistan Economic and Social Review, 2 XLIII(2), pp. 49-269.
Osterhammel, J. and Frisch, S.L., 2005. Colonialism: A Theoretical Overview. Princeton: Markus Weiner
Publishers.
Otite, O. and Ogionwo, W., 1985. An Introduction to Sociological Studies. Ibadan: Heinemann
Educational Books Ltd.
OXFAM, 2003. Poverty in Nigeria. Oxford: Oxfam.
Oya, C., 2011. Africa and the Millennium Development Goals (MDGs): What‘s Right, What‘s Wrong
and What‘s Missing, Revista De Economia Mundial, 27, pp. 19–33.
Pallister, D., 2000. Comment and Analysis: Pennies from Heaven: Many of Nigeria's Missing Millions
Were Laundered through Greedy Banks in London, The Guardian (London), 07 September.
Patchett, J.E., 2010. Colonial Roots, Conflict and Peacekeeping in Africa: Defining the Need for an
African Airlift Consortium, Joint Forces Staff College Joint Advanced War Fighting School.
Patterson, J.M., 1996. Family Research Methods. In C.A. Heflinger and C.T. Nixon, eds. 1996. Families
and the Mental Health System For Children and Adolescents. California: Sage Publications, pp. 117-144.
Peet, R., 1999. Theories of Development. New York: Guilford.
Petras, J., 1982. Dependency and World-System Theory: A Critique and New Directions. In: R.H
Chilcote, eds. 1982. Dependency and Marxism: Toward A Resolution of the Debate. Boulder: Westview
Petras, J. and Vieux, S., 1990. The Chilean Economic Miracle: An Empirical Critique, Critical
Sociology, 17 (2), pp. 57-72.
Pettifor, A. (ed.) 2003. Real World Economic Outlook. The Legacy of Globalisation: Debt and
Deflation. London: Palgrave.
Pfeiffer, J., 2003. International NGOs and Primary Health Care in Mozambique: The Need for a New
Model of Collaboration, Social Science & Medicine, 56 (2003), pp. 725-738
Pieterse, J. N., 2004. Globalisation or Empire? London: Routledge
Pieterse, J.N., 2010. Development Theory. London: Sage Publications Ltd.
Pillitteri, A., 2009. Maternal and Child Health Nursing: Care of the Childbearing and Childrearing
Family. Pennsylvania: Springhouse Publishing Co.
Pogge, T., 2004. The First United Nations Millennium Development Goal: A Cause for Celebration?
Journal of Human Development, 5, pp. 377–397.
Poku, N. and Whitman, J., 2011. The Millennium Development Goals: Challenges, Prospects and
Opportunities, Third World Quarterly, 32(1), pp. 3-8.
Polit, D.F., Beck, C.T. and Hungler, B.P.; 2001. Essentials of Nursing Research: Methods,

274
Appraisal and Utilization. 5th ed. Philadelphia: Lippincott Williams and Wilkins.
Polity Online., n.d. Relative Poverty [pdf]. Available at: <http:www.polity.co.uk/cbs3/pdf/glos.pdf>
[Accessed 29 May 2010].
Popkin, B.M., 2002. The Shift in Stages of the Nutritional Transition in the Developing World Differs
From Past Experiences! Public Health Nutrition, 5(1A), pp. 205-214.
Popper, K., 2004. The Logic of Scientific Discovery. London: Routledge.
Prato, C., 2011. Dynamic Political Distortions under Alternative Constitutional Settings, Job Market
Paper [pdf]. Available at:
<http://fakultaetsseminar.uni-mannheim.de/material/carlo%20prato%20paper.pdf> [Accessed 01 April
2012].
Preble, R.C., ed., 1962. Monogamy. Britannica World Language Dictionary. Chicago: Encyclopedia
Britannica Incorporated, p. 1275.
Preston, S.H., 1975. The Changing Relation between Mortality and Level of Economic
Development. Population Studies, 29(2), pp. 231–248.
Pritchett L., Summers L.H., 2006. Wealthier is Healthier, Journal of Human Resources, 31, pp. 841-68.
Pritchett, L H., 1994. Desired Fertility and the Impact of Population Policies, Population and
Development Review 20(1), pp. 1-55.
Psacharopoulos, G. and Arriagada, A., 1986. The Educational Attainment of the Labour Force: An
International Comparison, The World Bank, Report No.: EDT38.
Qizilbash, M., 1996. Ethical development, World Development, 24(7), pp. 1209-1221.
Rahman, M.A., 1993. People’s Self Development: Perspectives on Participatory Action Research.
London and Dhaka: Zed Books and Dhaka University Press.
Rajaratnam, J.K., Marcus, J.R., Levin-Rector, A, Chalupka, A.N., Wang, H., Dwyer, L., Costa, M.,
Lopez, A.D. and Murray C.J.L., 2010. Worldwide Mortality in Men and Women Aged 15–59 Years from
1970 to 2010: A Systematic Analysis, The Lancet 375 (9727), pp. 1704–1720.
Rakodi, C., 2002. A Livelihoods Approach: Conceptual Issues and Definitions. In C. Rakodi with T.
Lloyd-Jones, eds. 2002. Urban Livelihoods: A People-Centred Approach to Reducing Poverty. London:
Earthscan, pp. 3-22.
Rampell, C., 2010. Single Parents around the World. Available at:
<http://economix.blogs.nytimes.com/2010/03/10/single-parents-around-the-world/> [Accessed 12
September 2010].
Randall, V. and Theobald, R., 1985. Political Change and Underdevelopment. A Critical Introduction to
Third World Politics. London: Macmillan.
Rank, M.R., Yoon, H.S. and Hirschl, T.A., 2003. American Poverty as a Structural Failing: Evidence and
Arguments, Journal of Sociology and Social Welfare, 30 (4), pp. 3–29.
275
Rao, V.V.B., 1991. Human Development Report 1990: Review And Assessment. World
Development, 19(10), pp. 1451–1460.
Raphael, D., 2009. Poverty, Human Development, and Health in Canada: Reseach, Practice, and
Advocacy Dilemmas, Canadian Journal of Nursing Research, 41 (2), pp. 7-18.
Rapley, J., 2002. Understanding Development: Theory and Practice In The Third World. Boulder: Lynne
Rienner
Rapley, J., 2004. Globalization and Inequality: Neoliberalism’s Downward Spiral. Boulder: Lynne
Reinner.
Revallion, M., 1992. Poverty Comparisons. A Guide to Concepts and Measures Living Standard
Measurement, Working Paper No. 88, Washington, World Bank.
Ravallion, M., 2001. Growth, inequality and poverty: looking beyond averages. World
development, 29(11), 1803-1815.
Ravallion, M., 2007. Inequality is bad for the poor. InS.P. Jenkins, and J. Micklewright (Eds.).
Inequality and poverty re-examined. Oxford: Oxford University Press.
Ravallion, M., 2008. The New Palgrave Dictionary of Economics. 2nd
ed. London: Palgrave Macmillan.
Ravallion, M. and Wodon, Q., 1999. Poor Areas, or Only Poor People?, Journal of Regional
Science, 39(4), pp. 689-711.
Ravallion, M; Chen, S. and Sangraula, P., 2009. Dollar a Day Revisited, The World Bank Economic
Review, 23(2), pp. 163-184.
Reddy, S.G. and Heuty, A., 2008. Global Development Goals: The Folly of Technocratic Pretensions,
Development Policy Review, 26(1), pp. 5–28.
Reddy, S.G. and Pogge, T.W,. 2002. How Not to Count the Poor! - A Reply to Ravallion. Available
at: <www.socialanalysis.org > [Accessed 16 January 2014].
Reddy S.G. and Pogge, T.W., 2005. How Not to Count the Poor. Available at: <http://ssrn.com/abstract=893159> [Accessed 15 March 2014].
Ressel, L.B., Gualda, D.M. and Gonzales, R.M. 2002. Focus Group as a Method of Data Collection in
Nursing Research: An Experiential Report, International Journal of Qualitative Methods, 1(2), Article 5.
Reutter, L.I., Veenstra, G., Stewart, M.J., Raphael, D., Love, R., Makwarimba, E., and McMurray,
S. 2006. Public attributions for poverty in Canada. Canadian Review of Sociology and
Anthropology, 43(1), 1.
Rice, S., Graff, C. and Lewis, J., 2006) Poverty and Civil War: What Policymakers Need to
Know. Brookings Global Economy and Development Working Paper, (2).
Richie, J., 2011. Poverty. Available at:

276
<http://cnre.vt.edu/lsg/3104/overpop.%20final/poverty.html> [Accessed 23 May 2011].
Richies, G., 1997. Hunger, Food Security, and Welfare Politics: Issues and Debates in First World
Societies, Proceedings of the Nutrition Society, 56(1), pp. 63-74.
Rigg, J., 2003. Southeast Asia, 2nd
ed. London: Routledge.
Rispel, L.C. and Nkibua, T., 2011. Whither The MDGs? Stewardship for Health in Kenya, Nigeria and
South Africa. In: K. Kondlo and C. Ejiogu, eds. 2011. Governance in the 21st Century. Capetown: HSRC
Press.
Rist, G., 1999. The History of Development: From Western Origins to Global Faith. London: Zed Books.
Robeyns, I., (2005). The Capability Approach: A Theoretical Survey, Journal of Human
Development, 6(1), pp. 93-117.
Robeyns, I., 2011. The Capability Approach. In E. N. Zalta (ed.), The Stanford Encyclopedia of
Philosophy, Summer 2011 Edition. Available at:
http://plato.stanford.edu/archives/sum2011/entries/-capabilities-approach/ [Accessed 21 March
2014].
Robinson, W., 2004. A Theory of Global Capitalism. Baltimore: Johns Hopkins University Press.
Rodgers, H.R., 2000. American Poverty in a New Era of Reform. New York: M.E. Sharpe.
Rodney W., 1972. How Europe Underdeveloped Africa. London: Bogle L‘Ouverture Publications.
Rodnick, D., 2008. One Economics, Many Recipes: Globalization, Institutions, and Economic Growth.
Princeton: Princeton University Press.
Rogers, E.M. and Svenning, L., 1969. Modernization among Peasants: The Impact of
Communication. New York: Holt, Rinehart and Winston.
Roll Back Malaria, 2012. Economic Costs of Malaria. Available at:
<http://www.rbm.who.int/cmc_upload/0/000/015/363/rbminfosheet_10.htm> [Accessed 02 November
2012].
Rose-Ackerman, S., 1999. Corruption and Government: Causes, Consequences and Reform. Cambridge:
Cambridge University Press.
Ross, M., 2003. Nigeria‘s Oil Sector and the Poor, Position Paper Prepared for DfID (Department for
International Development)-Nigeria.
Rostow, W.W., 1960. The Stages of Economic Growth: A Non-Communist Manifesto. Cambridge:
Cambridge University Press.
Rothausen, T.J., 1999. Family in Organizational Research: A Review and Comparison of Definitions and
Measures, Journal of Organizational Behaviour, 20(6), pp. 817-836.
Rowntree, B.S., 1901. Poverty: A Study of Town Lif. London: Macmillan.

277
Roxas, S.K. and Ungson, G.R., 2011. From Alleviation to Eradication: A Reassessment of Modernisation,
Market-Based, and Communitarian Solutions to Global Poverty, Poverty and Public Policy, 3(2), pp.
1-25.
Ruel, M.T., Garratt, J.L. Morris, S.S., Maxwell, D., Oshaug, A., Engle, P.‘ Menon, P., Slack, A. And
Haddad, L. 1998. Urban Challenges to Foods and Nutrition Security: A Review of Food Security Health
and Care Giving In Cities, FCND Discussion Paper No. 51. IFPRI.
Ryerson, W.F., 2010. Population, the Multiplier of Everything Else. In: D. McKibben, ed. 2010. The Post
Carbon Reader: Managing the 21st Century Sustainability Crisis. Bristol: Watershed Media.
Sachs, J.D., 2005. The End of Poverty: How We Can Make it Happen in Our Lifetime. London: Penguin.
Sachs, J.D., 2012. From Millennium Development Goals to Sustainable Development Goals, Lancet,
379, pp. 2206–2211.
Sachs, W. (ed.) 1992. The Development Reader. A Guide to Kowledge and Power. London: Zed Books.
Safety Security-Crazy., 2012. 10 Top Dangerous Cities for Poverty and Crime. Available at:
<http://www.safety-security-crazy.com/poverty-and-crime.html> [Accessed 18 June 2011].
Sagara, A.D. and Najam, A., 1998. The Human Development Index: A Critical Review, Ecological
Economics, 25 (3), pp. 249–264.
Said, E., 1995. Orientalism. London: Penguin.
Sala-i-Martin, X., 2005. The World Distribution of Income: Falling Poverty and… Convergence, Period
[pdf]. Available at:
<http://www.columbia.edu/~xs23/papers/pdfs/world_income_distribution_qje.pdf> [Accessed 18 June
2010].
Salvatore J.B. and Alvarez-Rivadulla, M.J., 2007. Standardized Income Inequality Data for Use in
Cross-National Research, Sociological Inquiry 77, PP. 3-22.
Sanderson, S.K., 2005. World-Systems Analysis after Thirty Years: Should It Rest in Peace?
International Journal of Comparative Sociology, 46(3), pp. 179-213.
Sansour, M. and Zahra, N., 2011. Reducing Vulnerability through Economic Empowerment: A New
Approach to Social Protection in Palestine [pdf] International Conference: ―Social Protection for Social
Justice,‖ Institute of Development Studies, UK, 13–15 April 2011. Available at:
<http://www.ids.ac.uk/files/dmfile/SansourZahran2011Socialprotectionforempo
wermentPalestineCSPconferencefinaldraft.pdf> [Accessed 02 February 2012].
Sanusi, L.S., 2011. Youth empowerment as a Tool for Sustainable Development: The Central Bank of
Nigeria interventions, Paper Presented at the National Youth Service Corps Orientation Camp, Kwara
State.
Särndal, C.E, Swensson, B. and Wretman, J.H., 1992 Model Assisted Survey Sampling. New York:
Springer-Verlag Incorporadted.

278
Scheaffer, R.L., Mendenhal, W. and Ott. R.L., 2010. Elementary Survey Sampling. 7th
ed. Connecticut:
Cengage Learning Incorporated.
Sheikh, P., 2010. Debt-for-Nature Initiatives and the Tropical Forest Conservation Act: Status and
Implementation, Congressional Research Service Report, 30 March.
Schneider, D., 1968. American Kinship: A Cultural Account. New Jersey: Prentice Hall.
Schultz, T.P., 1981. Economics of Population. Reading: Addison-Wesley.
Sen, A., 1980. Equality of What?. In The Tanner Lecture on Human Values, I, 197-220. Cambridge:
Cambridge University Press.
Sen, A.K., 1985. Commodities and Capabilities. Oxford: Oxford University Press.
Sen, A., 1987. The Standard of Living. In A. Sen, J. Muellbauer, R. Kanbur, K. Hart, and B. Williams, The Standard of Living: The Tanner Lectures on Human Values, Cambridge: Cambridge
University Press.
Sen, A., 1992. Inequality Reexamined. Cambridge: Harvard University Press.
Sen, A. K., 1993. Capability and Well-Being. In: M. Nussabaum and A.K. Sen, eds. 1993. The Quality of
Life. Oxford: Clarendon Press, pp. 30-53.
Sen, A., 1995. The Political Economy of Targeting. In D. Van de Walle and K. Nead (eds.), Public
Spending and the Poor. Theory and Evidence. Washington DC: World Bank.
Sen, A., 1999. Development as Freedom. Oxford: Oxford University Press.
Sen, A.K., 2001. Development as Freedom. Oxford: Oxford University Press.
Sen, A., 2009. The Idea of Justice. London: Allen Lane.
Shah, A., 2010. Causes of Poverty. Available at:
<http://www.globalissues.org/issue/2/causes-of-poverty> [Accessed 06 March 2012].
Sharp, V.F., 1979. Statistics for the Social Sciences. Toronto: Little, Brown and Company.
Shaughnessy, J., Zechmeister, E. and Jeanne, Z., 2011. Research Methods in Psychology. 9th ed. New
York: McGraw Hill.
Shen, C. and Williamson J.B., 1997. Child Mortality, Women‘s Status, Economic Dependency, and State
Strength: A Cross-National Study of Less Developed Countries, Social Forces, 76(2), pp. 667–700.
Sheppard, E., Porter, E.W., Faust, D.R. and Nagar, R., 2009. A World of Difference: Encountering and
Contesting Development, 2nd
ed. New York: Guildford Press.

279
Sherraden, M., 2001. Asset-building Policy and Programmes for the Poor. In: T. Sharpiro and D. Wolff,
eds. 2001. Assets for the Poor: The Benefits of Spreading Asset Ownership. Russell Sage Foundation, pp.
302-323.
Shetty, S., 2005. The Millennium Campaign: Getting Governments to Keep Their Promises,
Development, 48(1), pp. 25-29.
Shillington, K., 1995. History of Africa. Revised ed. New York: St. Martin‘s Press.
Shivji, I.G., 2007. Silence in NGO Discourse: The Role and Future of NGOs in Africa. Oxford: Fahamu
Books.
Shulman, S., 1990. The Causes of Black Poverty: Evidence and Interpretation, Journal of Economic
Issues, 24(4), pp. 995-1016.
Shuttleworth, M., 2009. What is Sampling?. Available at: <http://explorable.com/what-is-sampling>
[Accessed 09 March 2012].
Simmons, P., 1995. Words into Action: Basic Rights and the Campaign against World Poverty UK:
Oxfam Professional.
Simon, D. (1995). Debt, Democracy and Development: Sub-Saharan Africa in the 1990s. In D. Simon
and W. Van Spengen, C. Dixon and A. Narman (eds.) Structurally Adjusted Africa: Poverty, Debt
and Basic Needs. London: Pluto.
Singer, M. and Wildavsky, A., 1993. The Real World Order: Zones of Peace/Zones of Turmoil. New
Jersey: Chatham House.
Skolnik, R.L., 2008. Essentials of Global Health. Sudbury: Jones and Bartlett Publishers Incorporated.
Small, M.L.; 2009. How Many Cases Do I Need?‘ On Science and the Logic of Case Selection in Field-
Based Research, Ethnography, Vol. 10, PP. 5-38.
Smith, A., 1776. An Inquiry into the Nature and Causes of the Wealth of Nations. Edwin Cannan's
Annotated Edition.
Smith, S., 1978. The Lagos Consulate 1851-1861. London: Macmillan.
So, A.Y., 1990. Social Change and Development. California: Sage Publications Incorporated.
Sociology Index, 2012. Bivariate Analysis. Available at:
<http://sociologyindex.com/bivariate_analysis.htm> [Accessed 29 March 2012].
Sociology Guide, 2011. Sampling. Available at: <http://www.sociologyguide.com/research-
methods&statistics/sampling.php> [Accessed 27 January 2012].
Soludo, C., 2006. Can Nigeria be the China of Africa? Paper presented at the Founders Day of the
University of Benin, Benin City, Nigeria.

280
Somekh, B. and Lewin, C., 2005. Research Methods in the Social Sciences. Thousand Oaks:
Sage Publication.
Srinivasan, T.N., 1994. Human Development: A New Paradigm or Reinvention of the Wheel?, American
Economic Review 84 (2), pp. 238–243.
Stack, C.B., 1996. All Our Kin. New York: Basic Books.
Stevens, P., 2004. Diseases of Poverty and the 10/90 Gap [pdf] International Policy Network. Available
at: < http://sarpn.org/documents/d0002617/6-Disease_Poverty_IPN_2007.pdf> [Accessed 20 March
2012].
Stewart, D.W. and Shamdasani, P.N., 2006. Focus Group: Theory and Practice. CA: Sage
Publication.
Stewart, F., Fitzgerald, V. and Associates., 2001. War and Underdevelopment. Volume 1: The Economic
and Social Consequences of Conflict. Oxford: Oxford University Press.
Stiglitz, J., 2006. Making Globalization Work. New York: W. W. Norton and Company.
Stillwaggon, E., 2008. Race, Sex, and the Neglected Risks for Women and Girls in Sub-Saharan Africa,
Feminist Economics, 14(4), pp. 67–86.
Stone, L., 2009. Kinship and Gender: An Introduction. 4th ed. Boulder: Westview.
Streeten, P., 1994. Human Development: Means and Ends, Human Development, 84(2), pp. 232–237.
Streeten, P., 1999. From Growth to Basic Needs, Finance and Development, 19(2), pp. 1847- 1864.
Streeten, P. and Burki, S.J., 1978. Basic Needs: Some Issues, World Development, 6 (3), pp. 411–421. Tashakkori, A. and Teddlie, C., 1998. Mixed Methodology: Combining Qualitative and Quantitative
Approaches. Thousand Oaks: Sage.
Stretton, H., 1987. Political Essays. Melbourne: Georgian House.
Sumner, A. and Tribe, M., 2008. International Development Studies. London: SAGE Publications Ltd.
Sutcliffe, B., 2002. 100 Ways of Seeing an Unequal World, 2nd
ed. London: Zed Books.
Sutor, K., 2000. In Defence of Globalisation. Sidney: University of New South Wales Press.
Tashakkori, A. and Teddlie, C.B., 2003. Handbook of Mixed Methods in Social and Behavioural
Research. California: SAGE Publications Incorporated.
Texas State Auditor's Office, 1995. Data Analysis: Describing Data - Descriptive Statistics [pdf]
Methodology Manual, rev. 5/95. Available at: <
http://www.preciousheart.net/chaplaincy/Auditor_Manual/10descsd.pdf> [Accessed 28 February 2012].
281
Taylor C.B. and Gans-Morse, J., 2009. Neoliberalism: From New Liberal Philosophy to Anti-Liberal
Slogan, Studies in Comparative International Development 44 (2), pp. 137-161.
Teichman, J., 2012. Social Forces and States: Poverty and Distributional Outcomes in South Korea,
Chile, and Mexico. Stanford: Stanford University Press.
Thomas, A., 2000. Meanings and Views of Development. In: T. Allen and A. Thomas, eds. 2000. Poverty
and Development into the 21st Century. Oxford: Oxford University Press.
Thomas, A., 2004. The Study of Development, Paper Prepared For DSA Annual Conference, 6
November, Church House, London.
Thomas, A. and Allen, T., 2000. Agencies of Development. In: T. Allen and A. Thomas, eds. 2000.
Poverty and Development into the 21st Century. Oxford: Oxford University Press.
Thomas, A. and Johnson, H., 2002. Not Only Reinforcing but also Different Stories: Combining Case
Studies and Survey to Investigate How Postgraduate Programmes Can Build Capacity Development
Policy and Management, Paper for Combined Methods Conference, Centre for Development Studies,
Swansea, July, 2002.
Thomas, C. and Reader, M., 2001. Development and Inequality. In B. White, R. Little and M.
Smith (eds.) Issues in World Politics. Basingstoke: Palgrave, pp. 74-92.
Thomas, V., Wang, Y. and Fan, X., 2001. Measuring Education Inequality: Gini Coefficients of
Education, World Bank Policy Research Working Paper No. 2525.
Thomson, A.N. and Metz, M., (1999). Implications of Economic Policy for Food Security: A Training
Manual. Rome: FAO (Food and Agriculture Organization).
Tipps, D.C., 1976. Modernisation Theory and Comparative Study of Societies: A Critical Perspective.
In C.E Black, ed. 1976. Comparative Modernization: A Reader. New York: Free Press.
Tiryakian, E.A., 1992. Pathways to Metatheory: Rethinking the Presuppositions of Macrosociology. In:
G. Ritzer, ed. 1992. Metatheorizing. London: Sage.
Todaro, M.P., 1982. Economics for a Developing World. London: Longman.
Todaro, M.P., 1985. Economic Development in the Third World. London: Longman.
Todaro, M.P. and Smith, S.C., 2008. Economic Development. 10th ed. Boston: Addison Wesley.
Tolonen, H., 2005. Towards the High Quality of Population Health Surveys. Standardization and Quality
Control, National Public Health Institute A27/2005, Helsinki. Available at:
<http://urn.fi/URN:ISBN:951-740-546-4> [Accessed 06 June 2012].
Townsend, P., 1979. Poverty in the United Kingdom: A Survey of Household and Standards of Living.
Harmondsworth: Penguin.
Transparency International, 2008. Poverty and Corruption [pdf]. Available at:

282
< http://www.civicus.org/new/media/Poverty-Corruption-March-2008.pdf> [Accessed 21 December
2012].
Transparency International, 2012a. Corruption Perceptions Index 2012. Available at:
<http://www.transparency.org/cpi2012/results> [Accessed 21 December 2012].
Transparency International, 2012b. Corruption Perceptions Index 2011. Available at:
<http://www.transparency.org/cpi2011/results> [Accessed 21 December 2012].
Transparency International, 2012c. Corruption Perceptions Index 2010. Available at:
<http://www.transparency.org/cpi2010/results> [Accessed 21 December 2012].
Turner, M., 1990. Papua New Guinea: The Challenge of Independence. London: Penguin.
Ucha, C., 2010. Poverty in Nigeria: Some Dimensions and Contributing Factors, Global Majority E-
Journal, 1(1), pp. 46-56.
Udry C., 1996. Gender, Agricultural Production, and the Theory of the Household, Journal of Political
Economy 104(5), pp. 1010–1046.
Ugoh, S.C. and Ukpere, W.I., 2009. Appraising the Trend of Policy on Poverty Alleviation Programmes
in Nigeria with Emphasis on a National Poverty Eradication Programme (NAPEP), African Journal of
Business Management, 3(12), pp. 847-854.
UKCAP (UK Coalition Against Poverty), 1997. Poverty and Participation. London: UKCAP.
Ukpong, G.E., 1999. Policies and Measures for Poverty Alleviation in Nigeria, Bullion 23(4), pp. 40-50.
Ul haq, M., 1995. Reflections on Human Development. Oxford: Oxford University Press.
UN (United Nations), 1948. Universal Declaration of Human Rights. Available at:
<http://www.un.org/overview/rights.html> [Accessed 12 July 2011].
UN (United Nations), 1995. Report of the World Summit for Social Development,‘ Held in Copenhagen,
Denmark, 6 -12 March, 1995. A/Conf.166/9. Available at:
<http://www.un.org/documents/ga/conf166/aconf166-9.htm> [Accessed 14 February 2010].
UN (United Nations), 1997. Principles and Recommendations for Population and Housing Censuses,
Sales Revision 1[pdf]. DESA (Department of Economic and Social Affairs). Available at: <
http://unstats.un.org/unsd/publication/SeriesM/SeriesM_67rev1E.pdf
[Accessed 16 May 2011].
UN (United Nations), 1998. Statement of Commitment for Action to Eradicate Poverty [pdf] ECOSOC
(Economic and Social Council), E/1998/73. Available at:
< http://unsceb.org/CEBPublicFiles/press/9818151e.pdf> [Accessed 14 February 2010].
UN (United Nations), 2000a. United Nations Millennium Declaration-Resolution 55/2 [pdf] General
Assembly. Available at:
<http://www.preventionweb.net/files/13539_13539ARES552ResolutiononUNMillenniu.pdf> [Accessed
15 December 2010].

283
UN (United Nations), 2000b. Long-range World Population Projections: Based on the
1998 Revision [pdf] Population Divison. Available at:
<http://www.un.org/esa/population/publications/longrange/longrangeKeyFind.pdf> [Accessed 24 October
2012].
UN (United Nations), 2001a. Poverty and International Covenant on Economic, Social and Cultural
Rights [pdf] ECOSOC (Economic and Social Council), E/C.12/2001/10. Available at:
<http://www2.ohchr.org/english/bodies/cescr/docs/statements/E.C.12.2001.10Poverty-2001.pdf>
[Accessed 16 February 2010].
UN (United Nations), 2001b. World Population Monitoring 2011: Population, Environment and
Development. New York: United Nations Publications.
UN (United Nations), 2004. Unleashing Entrepreneurship Making Business Work for the Poor. New
York: United Nations Commission on the Private Sector & Development.
UN (United Nations), 2005a. World Population to Increase by 2.6 Billion over Next 45 Years, With All
Growth Occurring In Less Developed Regions, Press Release (POP/918). Available at: <
http://www.un.org/News/Press/docs/2005/pop918.doc.htm> [Accessed 31 October 2011].
UN (United Nations), 2005b. The Inequality Predicament: Report on the World Social Situation 2005.
New York: ECOSOC (Economic and Social Council).
UN (United Nations), 2007. World Population Prospects: The 2006 Revision - Highlights. New York:
DESA (Department of Economic and Social Affairs).
UN (United Nations), 2008a. The Millennium Development Goals Report 2008. New York: United
Nations.
UN (United Nations), 2008b. Official List of MDG Indicators. Available at:
<http://mdgs.un.org/unsd/mdg/host.aspx?content=indicators/officiallist.htm> [Accessed 11 June 2010].
UN (United Nations), 2009a. The Millennium Development Goals 2009 Report. New York: United
Nations.
UN (United Nations), 2009b. Group of Experts on Population and Housing Censuses [pdf] ECOSOC
(Economic and Social Council) - Economic Commission for Europe. Available at:
<http://unstats.un.org/unsd/censuskb20/Attachments/2009MPHASIS_ECE_Homeless-
GUID25ae612721cc4c2c87b536892e1ed1e1.pdf> [Accessed 29 August 2011].
UN (United Nations), 2010. Millennium Development Goals [pdf] United Nations Summit, High-level
Plenary Meeting of the General Assembly, 20-22 September 2010, New York. Available at:
<http://www.un.org/millenniumgoals/pdf/MDG_FS_1_EN.pdf> [Accessed 27 July 2011].
UN (United Nations), 2011a. The Millennium Development Goals 2011 Report. New York: United
Nations.
UN (United Nations), 2011b.World Population Prospects: The 2010 Revision - Highlights and Advance
Tables. DESA (Department of Economic and Social Affairs).

284
UN (United Nations), 2011c. Households and Families. Available at:
< http://unstats.un.org/unsd/demographic/sconcerns/fam/fammethods.htm> [Accessed 01 April 2012].
UN (United Nations), 2012. Poverty, ECOSOC (Economic and Social Council). Available at:
<http://social.un.org/index/poverty.aspx> [Accessed 18 December 2012].
UNDESA (United Nations Department of Economic and Social Affairs), 2005. Designing Household
Survey Samples: Practical Guidelines, Statistics Division Studies in Methods Series F, No.98, United
Nations New York.
UNDESA (United Nations Department for Economic and Social Affairs), 2010. World Population
Prospects, the 2010 Revision. Available at:
http://esa.un.org/unpd/wpp/sorting-tables/tab-sorting_population.htm [Accessed 31 October, 2011].
UNDG (United Nations Development Group), 2003. Indicators for Monitoring the Millennium
Development Goals: Definitions Rationale Concepts and Sources. New York: United Nations.
UNDP (United Nations Development Programme), 1990. Human Development Report. New York:
Oxford University Press.
UNDP (United Nations Development Programme), 1992. Human Development Report 1992. New York:
Oxford University Press.
UNDP (United Nations Development Programme), 1996. Human Development Report. New York:
Oxford University Press.
UNDP (United Nations Development Programme), 1997. Human Development Report. New York:
Oxford University Press.
UNDP (United Nations Development Programme), 2002. Human Development Report 2002: Deepening
Democracy in a Fragmented World. New York: Oxford University Press.
UNDP (United Nations Development Programme), 2003. Human Development Report 2003: Millennium
Development Goals: A Compact Among Nations To End Human Poverty. New York: Oxford University
Press.
UNDP (United Nations Development Programme), 2005. Human Development Report 2005:
International Cooperation at a Crossroads – Aid, Trade and Security in an Unequal World.
New York: United Nations.
UNDP (United Nations Development Programme), 2006. Human Development Report 2006: Beyond
Scarcity: Power, Poverty and the Global Water Crisis. Basingstoke: Palgrave Macmillan.
UNDP (United Nations Development Programme), 2009a. Human Development Report 2009:
Overcoming barriers: Human mobility and development. Basingstoke and New York: Palgrave
Macmillan.
UNDP (United Nations Development Programme), 2009b. Human Development Report Nigeria: 2008 –
2009. Abuja: UNDP (United Nations Development Programme).

285
UNDP (United Nations Development Programme), 2011. Sustainability and Equity: A Better Future for
All. Basingstoke: Palgrave Macmillan.
UNDP (United Nations Development Programme), 2012. About Human Development. Available at:
<http://hdr.undp.org/en/humandev/> [Accessed 31 December 2012].
UNECA (United Nations Economic Commission for Africa), 2005. The Millennium Development Goals
in Africa: Progress and Challenges. Addis Ababa: UNECA.
UNECA (United Nations Economic Commission for Africa), 2014. MDG 2014 Report: Assessing
progress in Africa toward the Millennium Development Goals Analysis of the Common African Position
on the post-2015 Development Agenda. Addis Ababa: Economic Commission for Africa Documents
Publishing Unit.
UNFPA (United Nations Population Fund), 2002a. State of World Population 2002: People, Poverty and
Possibilities. New York: UNFPA (United Nations Population Fund).
UNFPA (United Nations Population Fund), 2002b. HIV/AIDS and Poverty. Available at:
<http://www.unfpa.org/swp/2002/english/ch6/page2.htm> [Accessed 22 April 2011].
UNFPA (United Nations Population Fund), 2011. The State of World Population 2011: People and
Possibilities in a world of 7 Billion. New York: UNFPA (United Nations Population Fund).
UN-HABITAT (United Nations Human Settlements Programme), 2003. The Challenge of Slums, UN-
HABITAT’s new Global Report on Human Settlements, 10 January.
UNHCR (United Nations High Commissioner for Refugees), 2007. 2007 Global Trends: Refugees,
Asylum-seekers, Returnees, Internally Displaced and Stateless Persons [pdf]. Available at:
<http://www.unhcr.org/statistics/STATISTICS/4852366f2.pdf> [Accessed 23 January 2012].
UNICEF (United Nations Children‘s Fund), 2012. The State of the World’s Children 2012: Children in
an Increasingly Urban World. New York: United Nations Publication.
UNICEF (United Nations Children‘s Fund), 2005. Common Water and Sanitation-Related Diseases. New
York: UNICEF.
UNISDR (United Nations International Strategy for Disaster), 2004. Terminology: Basic Terms of
Disaster Risk Reduction [pdf]. Available at:
< http://www.unisdr.org/files/7817_7819isdrterminology11.pdf> [Accessed 06 May 2012].
UNMP (United Nations Millennium Project), 2005. The MDGs Report 2005. New York: United Nation.
UNODC (United Nations Office on Drugs and Crime), n.d. Intentional Homicide, Count and Rate per
100,000 Populations (1995 - 2011). Available at:
<http://www.unodc.org/documents/data-and-analysis/statistics/crime/Homicide_
statistics2012.xls> [Accessed 22 August 2012].
Urban Poverty Group., 2004. Submission to the Commission for Africa, Homeless International,
December 2004.

286
US (United States) Congress., 1964. Report of the Joint Economic Committee on the January 1964
Economic Report of the President with Minority and Additional Views. Washington D.C.: US
Government Printing Office.
USCB (United States Census Bureau), 2001. Census 2000 Profiles of General Demographic
Characteristics, United States [pdf]. Available at:
<http://www.census.gov/prod/cen2000/doc/profilestd.pdf> [Accessed 08 February 2010].
USCB (United States Census Bureau), 2004. Current Population Survey: Definitions and Explanations.
Available at: <http://www.census.gov/population/www/cps/cpsdef.html> [Accessed 22 February 2010].
USCB (United States Census Bureau), 2011. More Young Adults Are Living in their Parents‘ Home,
Census Bureau Reports. Available at:
<http://www.census.gov/newsroom/releases/archives/families_households/cb11-183.html> [Accessed 09
February 2012].
US Conference of Mayors, 2000. A Status Report on Hunger and Homelessness in America’s Cities 2000:
A 25-City Survey[pdf] December 2000. Available at:
<http://www.usmayors.org/hungersurvey/2000/hunger2000.pdf> [Accessed 30 May 2012].
USEIA (United States Energy Information Administration), 2012. Top Net Exporter 2011 (Thousand
Barrels Per Day). Available at:
<http://www.eia.gov/countries/index.cfm?topl=exp> [Accessed 30 December 2012].
Vanguard Newspaper, 2008. $10b Spent on Power from 1999-2007 Insist Energy Minister, March, 01.
Available at: <http://www.nigeriamasterweb.com/paperfrmes.html> [Accessed 04 April 2011].
Vandemoortele, J., 2005. Ambition is Golden: Meeting the MDGs, Development, 48(1), pp. 5-11.
Van-Teijlingen, E. and Hundley, V., 2001. The Importance of Pilot Studies, Social Research Update,
(35), 1-4.
Vaughn, S., Schumn, J.S. and Sinagub, J., 1996. Focus Groups Interviews in Education and
Psychology. Thousand Oaks: Sage Publication.
Veer, U., 2005. Modern Teaching of Population Education. New Delhi: Anmol Publications PVT. Ltd.
Verpoorten, M., 2009. Household Coping in War and Peacetime: Cattle Sales in Rwanda, 1991-2001,
Journal of Development Economics, 88(1), pp. 67-86.
Vicsek, L., 2010. Issues in the Analysis of Focus Groups: Generalisability, Quantifiability, Treatment of
Context and Quotations, The Qualitative Report, 15(1), pp. 122-141.
Waage, J., Banerji, R., Campbell, O., Chirwa, E., Collender, G., Dieltiens, V. and Unterhalter, E.,
2010. The Millennium Development Goals: A Cross-Sectoral Analysis and Principles for Goal Setting
after 2015, Lancet, 376, pp. 991–1023.
Wades, R., 2004. Is Globalization Reducing Poverty And Inequality?, World Development 32(4).
WAI (West African Insight), 2010. Concerning Food Security in Nigeria [pdf]. Available at:

287
<http://westafricainsight.org/articles/pdf/81> [Accessed 09 January 2011].
Walker, A., 1990. Developments in Sociology: An Annual Review, Volume 7. M. Haralambos (ed.).
Liverpool: Causeway Books.
Wallestein, I., 1974. The Rise and Future Demise of the World Capitalist System: Concepts for
Comparative Analysis, Comparative Studies in Society and History, 16(4), pp. 387-415.
Wallestein, I., 1976. The Modern World-System: Capitalist Agriculture and the Origins of the European
World Economy in the Sixteen Century. London: Academic Press.
Wallerstein, I., 1994. Development: Lodestar or Illussion. In: L. Sklair, ed. 1994. Capitalism and
Development. London: Routledge.
Wallerstein, I., 2004. World-System Analysis: An Introduction. Durham: Duke University Press.
Walton, M., 1990. Combating Poverty: Experience and Prospects. Finance and Development, 27 (3), pp.
2-5.
Wang, Q., 2005. Disability and American Families [pdf] U.S. Census Bureau. Available at:
<http://www.census.gov/prod/2005pubs/censr-23.pdf> [Accessed 27 July 2011].
Wattenberg, B.J., 1987. The Birth Dearth. New York: Pharos Books.
Ware, H., 1979. Polygamy: Women‘s Views in a Transitional Society, Nigeria, 1975. Journal of
Marriage and Family, 41(1), pp. 185-195.
Waring, M., 1989. Counting For Nothing: What Men Value and What Women Are Worth. Wellington:
Allen and Unwin
Webster, A., 1984. Introduction to the Sociology of Development. Basingstoke: Macmillan.
Weebly., n.d. Consequences of Poverty. Available at:
<http://povertyhci.weebly.com/consequences-of-poverty.html> [Accessed 02 July 2011].
Wellman, B., 1998. Doing It Ourselves: The SPSS Manual as Sociology's Most Influential Recent Book.
In: D. Clawson, ed. 1998. Required Reading: Sociology's Most Influential Books, Amherst: University of
Massachusetts Press, pp. 71–78.
Wells, T., 2012. Sen‘s Capability Approach. Internet Encyclopedia of Philosophy.
http://www.iep.utm.edu/sen-cap/
Wells, W.D., 1974. Group Interviewing. In J.B. Higginbotham and K.K. Cox (eds.), Focus Group
Interviews. Chicago: American Marketing Association, pp. 2-12.
White, H., 2002. Combining Quantitative and Qualitative Approaches in Poverty Analysis, World
Development, 30(12), pp. 511-522.
Whitworth J., Morgan D., Quigley M., Smith A., Mayanja B., Eotu H., Omoding N., Okongo M.,
Malamba S. and Ojwiya A., 2000. Effect of HIV-1 and Increasing Immunosuppression on Malaria

288
Parasitaemia and Clinical Episodes in Adults in Rural Uganda: A Cohort Study. Lancet 356 (9235), pp.
1051-1056.
Wilk R.R. and Tannenbaum N., 2001. Household Ecology: Economic Change and Domestic Life among
The Kekchi Maya in Belize, Annals-American Academy of Political and Social Sciences, 574, p. 230.
Williamson, S.D., 2010. Macroeconomics. 4th ed. New Jersey: Pearson
Willis, K., 2011. Theories and Practices of Development. New York: Rutledge.
Wiman, R., 2012. Poverty and Deprivation of Children as a Challenge for Finland‘s Foreign Policy
Situation Analysis and Policy Perspectives, Background Research Report, National Institute for Health
and Welfare.
Wohlmuth, K., Alabi, R.B. and Burger, P., 2008. New Growth and Poverty Alleviation Strategies For
Africa: International and Regional Perspectives, LIT Verlag Münster, pp. 60–61.
Wojtyla, K., 1981. Love and Responsibility. San Francisco: Ignatius Press.
Wolcott, H., 1995. The Art of Fieldwork. California: Sage/Altamira Press.
Wolf, M., 2005. Why Globalization Works. New Haven: Yale University Press.
Wolff, H., Chong, H. and Auffhammer, M., 2011. Classification, Detection and Consequences of Data
Error: Evidence from the Human Development Index, Economic Journal, 121(553), pp. 843–870.
Wolff, R.D., 2012. Democracy at Work: A Cure for Capitalism. Chicago: Haymarket Books.
Wong, S.Y., 2012. Understanding Poverty: Comparing Basic Needs Approach and Capability
Approach. Available at: <http://papers.ssrn.com/sol3/papers.cfm?abstract_id=2066179>
[Accessed 21 March 2014].
World Bank, 2000a. World Development Report 2000/2001: Attacking Poverty. New York: Oxford
University Press.
World Bank, 2000b. Poverty and Inequality Analysis, In: The World Bank: Poverty Reduction and
Equity. Available at: <http://go.worldbank.org/vfpegf7fu0> [Accessed 19 November 2011].
World Bank, 2005., Toward a Conflict-Sensitive Poverty Reduction Strategy: Lessons from a
Retrospective Analysis, Report no. 32587, The World Bank, Washington D. C.
World Bank, 2006. World Development Report, 2006: Equity and Development. Oxford: Oxford
University Press.
World Bank, 2008. 2008 World Development Indicators. Washington: World Bank.
World Bank, 2010a. 2010 World Development Indicators. Washington: World Bank
World Bank, 2010b. World Development Report. Washington: World Bank.

289
World Bank, 2011a. Millennium Development Goals. Available through World Bank
Website<http://data.worldbank.org/about/millennium-development-goals>[accessed 31 December 2011)].
World Bank, 2011b. Poverty. Available through World Bank Website>
<http://data.worldbank.org/topic/poverty> [Accessed 31 December 2011)].
World Bank, 2011c. Poverty Headcount Ratio at $1.25 a Day (PPP) (% of Population). Available at:
<http://data.worldbank.org/indicator/si.pov.dday?page=1> [Accessed 31 October 2011].
World Bank, 2011d. Global Monitoring Report 2011: Improving the Odds of Achieving the MDGs.
Washington: The International Bank for Reconstruction and Development/The World Bank.
World Bank, 2011e. World Development Indicators 2011. Washington DC: The World Bank.
World Bank, 2012a World Development Indicators – Nigeria. Available at:
<http://data.worldbank.org/country/nigeria> [Accessed 21 December 2012].
World Bank, 2012b. World Development Indicators – Gabon. Available at:
<http://data.worldbank.org/country/gabon> [Accessed 21 December 2012].
World Bank, 2012c. World Development Indicators – South Africa. Available at:
<http://data.worldbank.org/country/southafrica> [Accessed 21 December 2012].
World Bank, 2012d. World Development Indicators – Libya. Available at:
<http://data.worldbank.org/country/libya> [Accessed 21 December 2012].
World Bank, 2012e. Poverty Headcount Ratio at $1.25 a Day (PPP) (% of Population). Available at:
<http://data.worldbank.org/indicator/SI.POV.DDAY> [Accessed 21 December 2012].
World Bank, 2012f. Poverty Headcount Ratio at $2 a Day (PPP) (% of Population). Available at:
<http://data.worldbank.org/indicator/si.pov.2day/countries> [Accessed 21 December 2012].
World Bank 2012g. Poverty Gap at $1.25 a Day (PPP) (%) (% of Population). Available at:
<http://data.worldbank.org/indicator/si.pov.gaps/countries> [Accessed 21 December 2012].
World Bank 2012h. Poverty Gap at $2 a Day (PPP) (%) (% of Population). Available at:
<http://data.worldbank.org/indicator/si.pov.gap2/countries> [Accessed 21 December 2012].
World Bank, 2012i. Mortality Rate, Infant (Per 1,000 Live Births). Available at:
<http://data.worldbank.org/indicator/sp.dyn.imrt.in> [Accessed 31 October 2012].
World Bank, 2012j. Intentional Homicides (Per 100,000 People). Available at:
<http://data.worldbank.org/indicator/vc.ihr.psrc.p5> [Accessed 31 October 2012].
World Bank, 2012k. PPP Conversion Factor (GDP) to Market Exchange Rate Ratio. Available at:
<http://data.worldbank.org/indicator/PA.NUS.PPPC.RF> [Accessed 22 November 2013].
WHO (World Health Organisation), 1995. Physical Status: The Use and Interpretation of Anthropometry.
Geneva: WHO (World Health Organisation) Technical Report Series 854.
WHO (World Health Organisation), 1998. The World Health Report 1998. Life in the 21st Century: A
Vision for All. Geneva: WHO (World Health Organisation).

290
WHO (World Health Organization), 2001. Macroeconomics and Health: Investing in Health for
Economic Development. Geneva: WHO (World Health Organization).
WHO (World Health Organization), 2002. The World Health Report 2002: Reducing Risks, Promoting
Healthy Life. Geneva: WHO (World Health Organization).
WHO (World Health Organisation), 2004a. The World Health Report: 2004 - Changing History [pdf].
Available at: <http://www.who.int/whr/2004/en/report04_en.pdf> [Accessed 26 December 2010].
WHO (World Health Organization), 2004b. Malaria. Available at:
<http://www.who.int/tdt/diseases/malaria/diseaseinfo.htm> [Accessed 29 April 2011].
WHO (World Health Organisation), 2011a. Health Status Statistics: Mortality. Available at:
<http://www.who.int/healthinfo/statistics/indunder5mortality/en/> [Accessed 25 January 2012].
WHO (World Health Organisation), 2011b. World Health Statistics 2011 Indicator compendium [pdf].
Available at:
<http://www.who.int/gho/publications/world_health_statistics/WHS2011_IndicatorCompendium.pdf>
[Accessed 10 March 2012].
WHO/FAO WHO (World Health Organization/Food and Agriculture Organization), 2003.
Report of a Joint WHO/FAO Expert Consultation on Diet, Nutrition and the Prevention Of Chronic
Diseases, Geneva, 28 January - 1 February 2002. (WHO Technical Report Series, 16).
World Statesmen, 2010. Nigerian State. Available at:
<http://www.worldstatesmen.org/nigeria_federal_states.htm> [Accessed 19 May 2010].
WRI (World Resources Institute), 2004. Poverty Indicators in Nigeria. Washington DC: WRI (World
Resources Institute).
Wusu, O., 2001. The Analysis of Childbearing and Childrearing in Nigeria: The Case of Ilogbo
Community, Ibom Journal of Social Issues, 6(2), pp. 13-29.
Yeh, S.H.K., 1989. Understanding Development: Modernization and Cultural Values in Asia and the
Pacific Regions, Working Paper Sty. 89, UNESCO (United Nations Educational, Scientific and Cultural
Organization).
Zanden, J.W., 1988. The Social Experience: An Introduction to Sociology. New York: Random House.
Zarocostas, J., 2005. Homelessness Increasing All Over the World, The Washington Times, 11 April.
Zeitzen, M.K., 2008. Polygamy: A Cross-Cultural Analysis. Oxford: Berg Publishers.
Zencey, E., 2009. G.D.P. R.I.P. Available at:
<http://www.nytimes.com/2009/08/10/opinion/10zencey.html?pagewanted=all&_r=0> [Accessed 29 May
2011].
Ziai, A., 2011. The Millennium Development Goals: Back to the Future, Third World Quarterly, 32(1),
pp. 27-43.

291


![[KOCCA포커스 2015-2호] 2015 콘텐츠산업 10대 트렌드](https://static.fdokumen.com/doc/165x107/633678ee4e9c1ac02e08186c/kocca-2015-2-2015-10-.jpg)