Pollen production in anemophilous species of the Poaceae family in Tetouan (NW Morocco
12
ORIGINAL PAPER Pollen production in anemophilous species of the Poaceae family in Tetouan (NW Morocco) Nadia Aboulaich Hassan Bouziane Mohamed Kadiri Marı ´a del Mar Trigo Hassane Riadi Mohamed Kazzaz Abderrahman Merzouki Received: 5 May 2008 / Accepted: 11 November 2008 / Published online: 9 December 2008 Ó Springer Science+Business Media B.V. 2008 Abstract Total pollen production per inflorescence and per square meter were studied in anemophilous species of the Poaceae family, to determine the relative contribution of each species to the total load of pollen released and to identify the species with the highest potential pollen emission. This was done by calculating the number of pollen grains per flower and per inflorescence and by estimating the density of inflorescences in an area of one square meter. Pollen production per inflorescence varied between 12,000 and 15 million grains, often being higher in the perennial species. Mountainous, grassland, riverside, and littoral areas contributed similarly to the amount of pollen grain production per square meter. Species such as Gaudinia fragilis, Hordeum murinum, Lolium rigidum, and Trisetaria panicea, with high pollen records, were found in all the studied areas. Aerobi- ological analysis will be undertaken to determine the main pollen season of Poaceae species. The results obtained are of great importance for respiratory health management in this region. Keywords Poaceae Pollen production Aerobiology Allergy Tetouan 1 Introduction The large Poaceae family is distributed worldwide and represents almost 20% of world vegetation cover (Mabberley 1987). Most plants of this family are anemophilous with the exception of some cleistoga- mous and a smaller number of entomopollinated species (Adams et al. 1981). The Poaceae species grow in different habitats depending on the taxon (Fernandez-Gonzalez et al. 1999) and produce large amounts of pollen grains (20–40 lm diameter as average) during a short period ranging from a few hours to a few days, although some species develop new flowers continuously (Lewis et al. 1983; Knox et al. 1993). One concern is a family of different species with different allergenic properties, thus prolonging the period of time during which allergenic pollen can be found in the air. Given all the above- mentioned features, grass pollen is the major aeroal- lergen outdoors triggering hay fever and allergic asthma in spring (Knox 1993; Ong et al. 1995; D’Amato et al. 1998; Peternel et al. 2006). Poaceae pollen is one of the most important cause of allergic diseases in Morocco, because seasonal prevalence of N. Aboulaich H. Bouziane M. Kadiri H. Riadi M. Kazzaz A. Merzouki Laboratoire Diversite ´ et Conservation des Syste `mes Biologiques, De ´partement de Biologie, Faculte ´ des Sciences, Universite ´ Abdelmalek Essaa ˆdi, Mhannech II, Tetouan, Morocco M. del Mar Trigo (&) Departamento de Biologia vegetal, Universidad de Malaga, Apdo. 59, 29080 Malaga, Spain e-mail: [email protected] 123 Aerobiologia (2009) 25:27–38 DOI 10.1007/s10453-008-9106-2
Transcript of Pollen production in anemophilous species of the Poaceae family in Tetouan (NW Morocco
ORIGINAL PAPER
Pollen production in anemophilous species of the Poaceaefamily in Tetouan (NW Morocco)
Nadia Aboulaich Æ Hassan Bouziane Æ Mohamed Kadiri ÆMarıa del Mar Trigo Æ Hassane Riadi Æ Mohamed Kazzaz ÆAbderrahman Merzouki
Received: 5 May 2008 / Accepted: 11 November 2008 / Published online: 9 December 2008
� Springer Science+Business Media B.V. 2008
Abstract Total pollen production per inflorescence
and per square meter were studied in anemophilous
species of the Poaceae family, to determine the
relative contribution of each species to the total load
of pollen released and to identify the species with the
highest potential pollen emission. This was done by
calculating the number of pollen grains per flower
and per inflorescence and by estimating the density of
inflorescences in an area of one square meter. Pollen
production per inflorescence varied between 12,000
and 15 million grains, often being higher in the
perennial species. Mountainous, grassland, riverside,
and littoral areas contributed similarly to the amount
of pollen grain production per square meter. Species
such as Gaudinia fragilis, Hordeum murinum, Lolium
rigidum, and Trisetaria panicea, with high pollen
records, were found in all the studied areas. Aerobi-
ological analysis will be undertaken to determine the
main pollen season of Poaceae species. The results
obtained are of great importance for respiratory
health management in this region.
Keywords Poaceae � Pollen production �Aerobiology � Allergy � Tetouan
1 Introduction
The large Poaceae family is distributed worldwide
and represents almost 20% of world vegetation cover
(Mabberley 1987). Most plants of this family are
anemophilous with the exception of some cleistoga-
mous and a smaller number of entomopollinated
species (Adams et al. 1981). The Poaceae species
grow in different habitats depending on the taxon
(Fernandez-Gonzalez et al. 1999) and produce large
amounts of pollen grains (20–40 lm diameter as
average) during a short period ranging from a few
hours to a few days, although some species develop
new flowers continuously (Lewis et al. 1983; Knox
et al. 1993). One concern is a family of different
species with different allergenic properties, thus
prolonging the period of time during which allergenic
pollen can be found in the air. Given all the above-
mentioned features, grass pollen is the major aeroal-
lergen outdoors triggering hay fever and allergic
asthma in spring (Knox 1993; Ong et al. 1995;
D’Amato et al. 1998; Peternel et al. 2006). Poaceae
pollen is one of the most important cause of allergic
diseases in Morocco, because seasonal prevalence of
N. Aboulaich � H. Bouziane � M. Kadiri �H. Riadi � M. Kazzaz � A. Merzouki
Laboratoire Diversite et Conservation des Systemes
Biologiques, Departement de Biologie, Faculte des
Sciences, Universite Abdelmalek Essaadi, Mhannech II,
Tetouan, Morocco
M. del Mar Trigo (&)
Departamento de Biologia vegetal, Universidad de
Malaga, Apdo. 59, 29080 Malaga, Spain
e-mail: [email protected]
123
Aerobiologia (2009) 25:27–38
DOI 10.1007/s10453-008-9106-2
its pollen-related asthma and rhinitis has risen to 10%
of patients with clinical respiratory diseases (Yazidi
Alaoui et al. 2001).
One palynological characteristic of Poaceae is the
difficulty in distinguishing between pollen grains of
the different genera and species, because few varia-
tions (stenopalynous) within the family are apparent
from light microscopy (Driessen et al. 1989). It is,
therefore, currently impossible to consider the partial
contributions of the different species to the pollen
spectrum in aerobiological studies.
In recent years, several papers have highlighted
differences or similarities between pollen counts in
the atmospheres of several specific locations in
regions with different climates, and relationships
between meteorological conditions and atmospheric
pollen concentrations (Galan et al. 1995; Green et al.
2004; Stevenson et al. 2007).
Publications regarding flowering season, and
pollen production related to the reproduction vari-
ability and aerobiology of Poaceae are extensive
(Smart et al. 1979; Liem and Groot 1980; Knox and
Singh 1987; Allisson 1990; Gutierrez and Medan
2006), but few studies report information about
pollen production per anther or per inflorescence,
and different findings have been obtained for the
species studied (Subba Reddi and Reddi 1986; Prieto-
Baena et al. 2003).
The objectives of this study were to estimate, for
the most frequent species of Poaceae in the area of
Tetouan, the density of inflorescences per square
meter, to determine total pollen production per
inflorescence instead of total production per plant,
because of their morphological variability, and to
provide information about the relative contribution of
each species to total rate of the pollen release to the
atmosphere, with the purpose of identifying the
species with the highest potential pollen emission.
2 Material and methods
The study area was located in Tetouan city and its
surroundings (35�330–35�410N and 05�190–05�210W)
in the NW of Morocco, 10 m above sea level, in the
mountainous area of Beni-Yeder (35�270 and
05�250W, 147 m), 22 km southwest far from the city
(Fig. 1). The climate conditions are predominantly
Mediterranean warm subhumid (Benabid 1982), with
an annual rainfall average of 728 mm and an annual
mean temperature average of 18.2�C. The plants were
collected in five different areas comprising different
habitats of grasses growing in the city (Fig. 1). The
species were identified according the flora of Valdes
et al. (2002).
The five selected areas were:
• Zone I: a mountainous zone of Beni-yeder located
22 km southwest of the town of Tetouan. The
natural vegetation includes a forest of Tetraclinis
articulata (Vahl) Masters with Cistus monspeli-
ensis L., Inula viscosa Aiton, Chamaerops
humilis L., Calicotome villosa Link, and Pistacia
lentiscus L. as the principal species, together with
a well developed herbaceous layer and fields of
Olea europea L.
• Zone II: the vegetation of this metropolitan area,
which contains the administration district and a
new residential zone surrounded by ample unoc-
cupied surfaces of semi natural meadow, is
formed almost exclusively by grasses. This sector
can be easily distinguished because of the total
absence of agriculture.
• Zone III: crop land and pasture area. A rural zone
with houses near fields of Hordeum vulgare L.,
Triticum aestivum L., Zea mays L., Opuntia ficus-
indica Mill., and Ficus carica L. Other plants are
used in the wake of the parcels, for example
Chamaerops humilis L., wild Olea europea L.,
Ceratonia siliqua L., Smilax aspera L., Rosa
sempervirens L., Rosa canina L., and Pistachia
lentiscus L. This area is characterized by the
presence of pasture rich in grasses.
• Zone IV: a riverside area located along the
urbanized bank of the river M’hannech. The
vegetation is made up of numerous riparian
plants, including several grasses.
• Zone V: the littoral zone of M’Dik is a spa and
tourist urban zone.
The ornamental species of the Poaceae family
which are used in the parks of the town of Tetouan
were not included in this study. To estimate pollen
production per inflorescence and total pollen produc-
tion in the selected areas, several variables were
studied for each species during 2007.
The number of pollen grains per anther was
counted. A total of nine mature and undehisced
anthers were counted for three flowers from three
28 Aerobiologia (2009) 25:27–38
123

different plants using the method proposed by Cruden
(1977) also followed by Tormo Molina et al. (1996),
Hidalgo et al. (1999), and Prieto-Baena et al. (2003).
The pollen was obtained by crushing each anther in
100 ll distilled water stained with 0.1% fuchsine.
Total pollen was counted in three 10-ll samples
deposited in a chamber of a Mac-Master slide. To fill
the slide cell, 140 ll distilled water was added. A 49
objective and a 109 ocular were used for the counts.
Finally, the number of pollen grains per flower was
calculated by multiplying by the number of anthers
per flower.
The number of flowers was estimated in 30
inflorescences from each species. In most species
the number of spikelets per inflorescence (mean of 30
inflorescences) and the number of flowers per spikelet
(mean of 30 spikelets) were counted. The number of
flowers per inflorescence was obtained by multiply-
ing the average number of flowers/spikelets by the
average number of spikelets/inflorescence in accor-
dance with Prieto-Baena et al. (2003). For species
with compound inflorescences and a large number of
flowers (Cynodon dactylon, Piptatherum miliaceum,
and Sorghum halepense), second-order spikes or
panicles of the inflorescence were counted (mean of
30 inflorescences), and multiplied by the number of
spikelets of second order spike or panicle (mean of 30
spikes or panicles) and by the number of flowers per
spikelet. Sterile flowers were not included in the
counts.
Total pollen production per inflorescence was
calculated by multiplying the average number of
pollen grains per flower by the average number of
flowers per inflorescence. Because of their morpho-
logical variability and the difficulty of counting the
number of inflorescences on an individual plant,
especially in perennial species, total pollen produc-
tion was estimated per inflorescence. To calculate the
number of inflorescences per square meter, a quad-
rant of 1 m2 was deposited randomly, ten times, over
the studied area as previously described by Prieto-
Baena et al. (2003). The total number of inflores-
cences was counted in each quadrant. The species
present in the area but always kept outside the
quadrants were recorded as occasional.
Total pollen production per square meter was
calculated by multiplying total pollen production per
inflorescence by the average number of inflores-
cences per square meter. This value was not
calculated for occasional species. For statistical
analysis, ranges, averages, and coefficients of varia-
tion were computed by the program ‘‘Statistica’’
(Statistica software program 1984–2003). A compar-
ison of means test was performed by means of
Fig. 1 Location of sampling sites near the city of Tetouan: Zone I, mountainous area; Zone II, area of grassland; Zone III, area of
cropland; Zone IV, riverside area; Zone V, littoral area
Aerobiologia (2009) 25:27–38 29
123

parametric analysis and applied to the data obtained
in the different measurements for genera with more
than one species.
3 Results
3.1 Number of pollen grains per anther
and flower
The number of pollen grains per anther varied
between 52 in Polypogon monspeliensis and 5,307
in Sorghum halepense (Table 1). Different results
were observed for the different genera and species
studied, including species of the same genera.
However, no significant variation was observed
for species of the genus Avena and between Bromus
hordeaceus and B. madritensis (Table 3). Pollen
production within species of the same genus varied
by a factor of 1.5 (Aegilops triuncialis and Aegilops
geniculata) to 2.75 (Poa trivialis and P. annua). In
the genus Bromus, B. maroccanus produces 26
times more pollen than B. diandrus (Table 1). As
said above, the number of pollen grains per flower
was calculated by multiplying by the number of
anthers per flower and the results can be seen in
Table 2.
3.2 Number of flowers per inflorescence
The number of flowers per spikelet was generally
constant in 50% of the species studied. In the others,
the coefficient of variation varied from 4 to 23%
(Table 1). Species of the same genus showed signif-
icant differences but no difference was observed for
B. diandrus and B. madritensis (Table 3).
The number of spikelets per inflorescence varied
between the different genera and species, ranging
from five in Elymus marginatus to 2,767 in Polypo-
gon monspeliensis (Table 1). Except for Bromus
hordeaceus and Bromus madritensis, the number of
spikelets showed significant differences between all
species within the same genus (Table 3).
The coefficient of variation was relatively high and
varied from 9 to 64%. Bromus madritensis and
Bromus hordeaceus had approximately three times
more spikelets than B. diandrus. In some genera, for
example Poa and Phalaris, one of the two species
studied had 3.5–3.8 times as many spikelets as the
other. Melica magnolii had seven times more spik-
elets than Melica minuta.
The number of flowers per inflorescence differed
both between genera and within species of the same
genus, except for Bromus hordeaceus and Bromus
maroccanus. The genus Aegilops contained the lowest
number of flowers per inflorescence (7–8) whereas
Trisetaria panicea produced the highest number of
flowers per inflorescence (3,784). Approximately 20%
of the species produced a large number of flowers,
exceeding 900 flowers per inflorescence (Agrostis
stolonifera, Ampelodesma mauritanica, Phalaris
coerulescens, Piptatherum miliaceum, Polypogon
monspeliensis, Rostraria cristata, Sorghum hale-
pense, and Trisetaria panicea). In the other species
the number varied between 11 (Taeniatherum caput-
medusae) and 634 (Hyparrhenia sinaica). In the
species in which the number of spikelets per second-
order spike or panicle was counted, the coefficient of
variation ranged between 15 and 37% (Table 1).
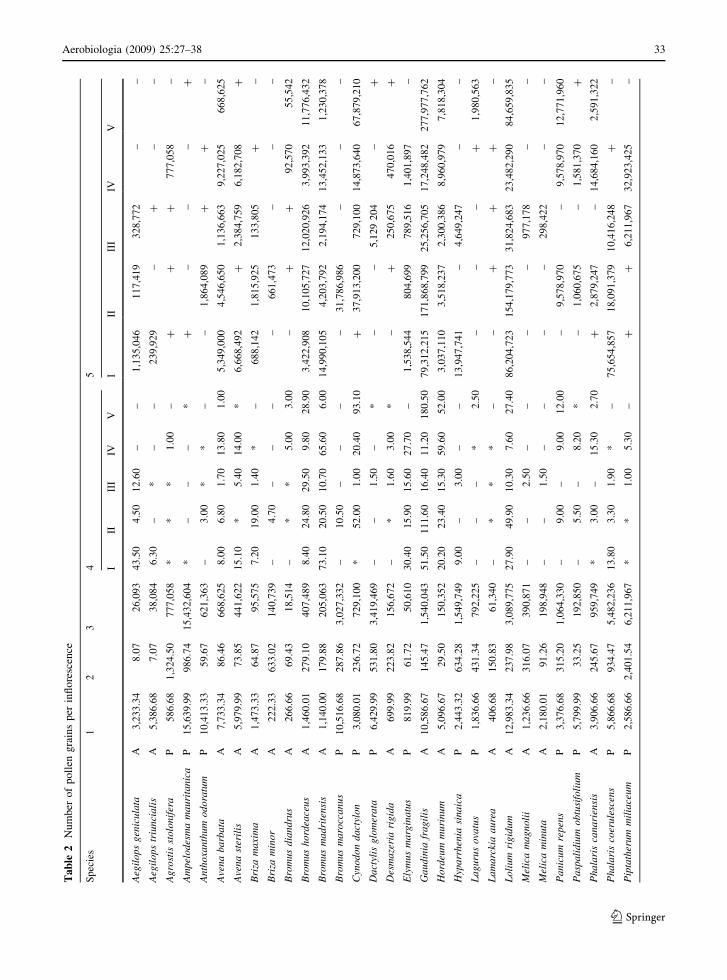
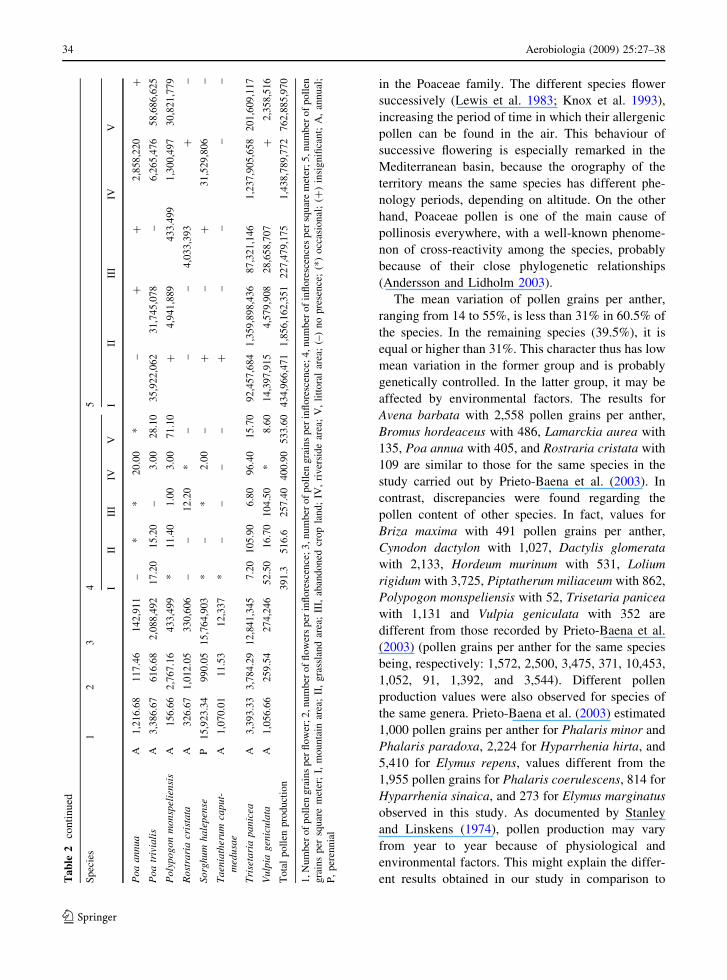
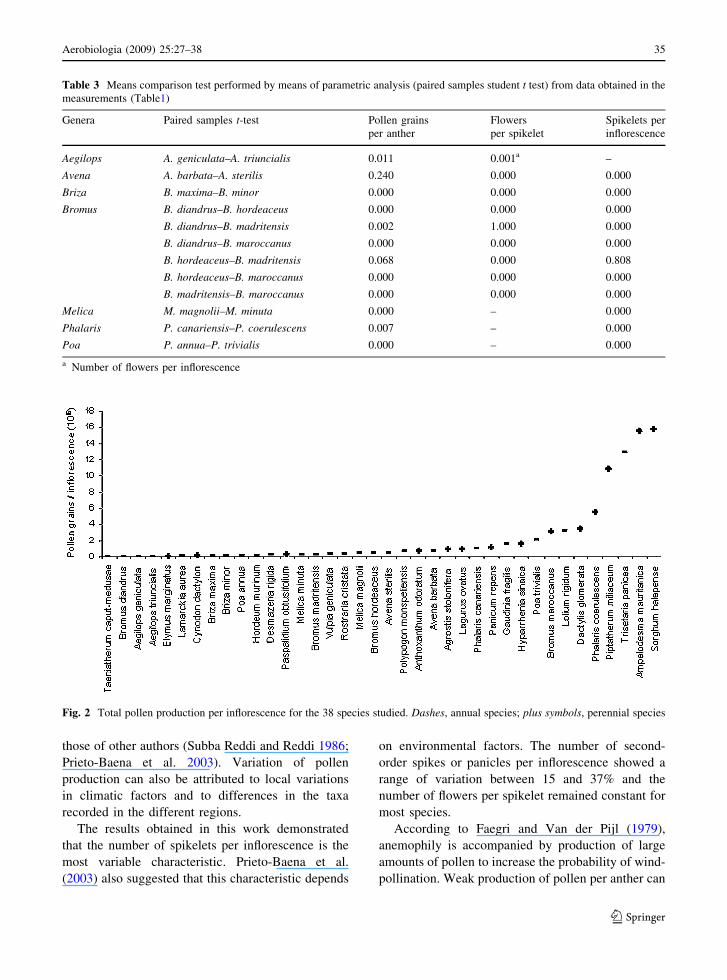
3.3 Total pollen grain production
The number of pollen grains produced by an inflo-
rescence was calculated on the basis of the number of
pollen grains per flower and number of flowers per
inflorescence. Pollen production varied between gen-
era and between species within the same genus. The
number ranged between 12,340 pollen grains for
Taeniatherum caput-medusae and 15,765,000 for
Sorghum halepense (Table 2). Trisetaria panicea,
one of the most abundant species, produced
12,841,345 pollen grains per inflorescence. Figure 2
shows total pollen production per inflorescence.
Pollen production potential was different for perennial
and annual species, the perennial species often being
much more productive than annual plants. In general,
most annual plants produced less than 990,000 pollen
grains per inflorescence whereas mean total pollen
production by perennial species was, on average, 4.25
times higher than by annual species.
3.4 Number of inflorescence per m2
The number of inflorescences per m2 of the different
species studied varied depending on the area. In
zone I, five species that had a significant presence:
Bromus madritensis, with 73.1 inflorescences/m2
(I/m2); Vulpia geniculata, with 52.5; Gaudinia
30 Aerobiologia (2009) 25:27–38
123

Ta
ble
1P
oll
enp
rod
uct
ion
of
the
Po
ace
ae
spec
ies
inv
esti
gat
ed
Sp
ecie
sN
o.
of
po
llen
gra
ins/
anth
erN
o.
of
flo
wer
s/sp
ikel
etN
o.
of
spik
elet
s/in
flo
resc
ence
No
.o
f2
nd
-ord
ersp
ikes
ver
sus
pan
icle
s/in
flo
resc
ence
12
31
23
12
31
23
Aeg
ilo
ps
gen
icu
lata
(62
0–
1,4
20
)1
,07
7.7
8(2
3)
(5–
11
)a8
.07
a(1
7)a
Aeg
ilo
ps
triu
nci
ali
s(1
,22
0–
2,6
30
)1
,79
5.5
6(2
9)
(6–
8)a
7.0
7a
(7)a
Ag
rost
isst
olo
nif
era
(10
0–
28
0)
19
5.5
6(2
8)
(1–
11
(0)
(92
7–
2,0
00
)1
,32
4.5
0(2
2)
Am
pel
od
esm
am
au
rita
nic
a(2
,40
0–
7,5
60
)5
,21
3.3
3(3
3)
(2–
2)
2(0
)(7
4–
79
7)
45
3.3
7(4
0)
An
tho
xan
thu
mo
do
ratu
m(2
,00
0–
4,8
00
)3
,47
1.1
1(2
9)
(1–
1)
1(0
)(2
0–
10
6)
59
.67
(42
)
Ave
na
ba
rba
ta(1
,04
0–
4,2
50
)2
,57
7.7
8(4
4)
(2–
2)
2(0
)(1
5–
11
2)
43
.23
(53
)
Ave
na
ster
ilis
(1,3
40
–2
,72
0)
1,9
93
.33
(23
)(3
–4
)3
.73
(12
)(9
–3
9)
19
.80
(35
)
Bri
zam
axi
ma
(32
0–
67
0)
49
1.1
1(2
6)
(9–
14
)1
1.7
3(1
0)
(3–
8)
5.5
3(2
1)
Bri
zam
ino
r(4
2–
11
0)
74
.11
(31
)(5
–9
)6
.20
(14
)(5
0–
22
8)
10
2.1
0(4
0)
Bro
mu
sd
ian
dru
s(8
0–
27
0)
13
3.3
3(4
2)
(5–
7)
5.9
7(9
)(6
–2
7)
11
.63
(50
)
Bro
mu
sh
ord
eace
us
(31
0–
66
0)
48
6.6
7(2
3)
(6–
11
)9
.10
(13
)(1
5–
51
)3
0.6
7(2
7)
Bro
mu
sm
ad
rite
nsi
s(1
80
–5
30
)3
80
.00
(34
)(4
–7
)5
.97
(14
)(1
5–
45
)3
0.1
3(2
6)
Bro
mu
sm
aro
cca
nu
s(2
,30
0–
5,0
20
)3
,50
5.5
6(2
6)
(3–
4)
3.7
0(1
3)
(40
–1
23
)7
7.8
0(2
9)
Cyn
od
on
da
ctyl
on
(62
0–
1,5
00
)1
,02
6.6
7(3
1)
(1–
1)
1.0
0(0
)(2
7–
75
)b4
7.6
3b
(24
)b(4
–7
)4
.97
(15
)
Da
ctyl
isg
lom
era
ta(1
,33
0–
4,0
00
)2
,13
3.3
3(4
1)
(3–
4)
3.7
0(1
3)
(70
–1
93
)1
43
.73
(23
)
Des
ma
zeri
ari
gid
a(9
0–
33
0)
23
3.3
3(3
8)
(5–
7)
6.2
0(1
1)
(15
–6
4)
36
.10
(40
)
Ely
mu
sm
arg
ina
tus
(17
0–
38
0)
27
3.3
3(2
5)
(9–
16
)1
2.2
7(1
5)
(4–
6)
5.0
3(1
6)
Ga
ud
inia
fra
gil
is(1
,49
0–
6,3
70
)3
,52
8.8
9(4
3)
(4–
7)
4.9
7(2
2)
(20
–4
0)
29
.27
(15
)
Ho
rdeu
mm
uri
nu
m(1
30
–9
80
)5
31
.11
(55
)(1
–1
)1
.00
(0)
(22
–3
3)
29
.50
(9)
Hyp
arr
hen
iasi
na
ica
(44
0–
1,2
40
)8
14
.44
(30
)(1
5–
17
)1
5.7
0(4
)(2
0–
92
)4
0.4
0(4
2)
La
gu
rus
ova
tus
(30
0–
79
0)
61
2.2
2(2
9)
(2–
2)
2.0
0(0
)(1
02
–4
92
)2
15
.67
(49
)
La
ma
rcki
aa
ure
a(8
0–
18
0)
13
5.5
6(2
2)
(1–
1)
1.0
0(0
)(9
5–
22
0)
15
0.8
3(1
5)
Lo
liu
mri
gid
um
(2,7
70
–4
,86
0)
3,7
25
.56
(19
)(7
–1
4)
10
.17
(17
)(1
5–
32
)2
3.4
0(1
8)
Mel
ica
ma
gn
oli
i(2
20
–6
00
)4
12
.22
(31
)(1
–1
)1
.00
(0)
(14
0–
69
1)
31
6.0
7(5
9)
Mel
ica
min
uta
(58
0–
85
0)
72
6.6
7(1
5)
(2–
2)
2.0
0(0
)(2
0–
95
)4
5.6
3(4
9)
Pa
nic
um
rep
ens
(60
0–
2,0
00
)1
,12
5.5
6(3
6)
(2–
2)
2.0
(0)
(85
–2
20
)1
57
.60
(22
)
Pa
spa
lid
ium
ob
tusi
foli
um
(1,2
00
–2
,70
0)
1,9
33
.33
(28
)(2
–4
)3
.07
(17
)(6
–1
5)
10
.83
(19
)
Ph
ala
ris
can
ari
ensi
s(1
,00
0–
1,6
40
)1
,30
2.2
2(1
4)
(1–
1)
1.0
0(0
)(1
60
–4
80
)2
45
.67
(32
)
Ph
ala
ris
coer
ule
scen
s(1
,37
0–
3,1
90
)1
,95
5.5
6(2
8)
(1–
1)
1.0
0(0
)(6
05
–1
,73
0)
93
4.4
7(3
3)
Pip
tath
eru
mm
ilia
ceu
m(5
00
–1
,20
0)
86
2.2
2(2
9)
(1–
1)
1.0
0(0
)(1
7–
47
)b2
8.8
3b
(24
)b(5
4–
13
6)
83
.30
(18
)
Aerobiologia (2009) 25:27–38 31
123
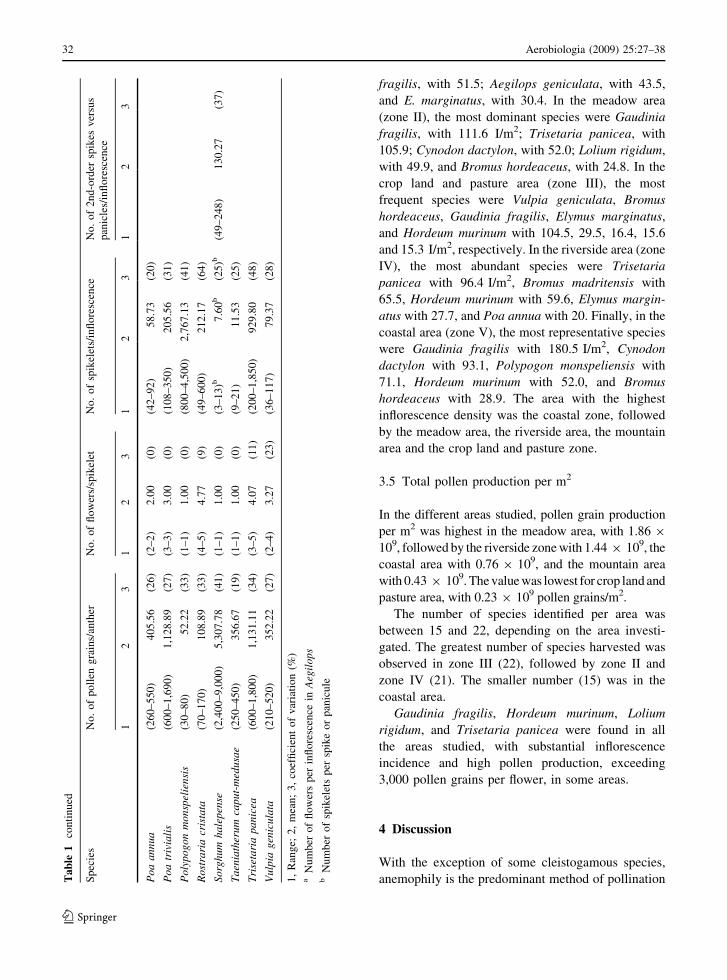
fragilis, with 51.5; Aegilops geniculata, with 43.5,
and E. marginatus, with 30.4. In the meadow area
(zone II), the most dominant species were Gaudinia
fragilis, with 111.6 I/m2; Trisetaria panicea, with
105.9; Cynodon dactylon, with 52.0; Lolium rigidum,
with 49.9, and Bromus hordeaceus, with 24.8. In the
crop land and pasture area (zone III), the most
frequent species were Vulpia geniculata, Bromus
hordeaceus, Gaudinia fragilis, Elymus marginatus,
and Hordeum murinum with 104.5, 29.5, 16.4, 15.6
and 15.3 I/m2, respectively. In the riverside area (zone
IV), the most abundant species were Trisetaria
panicea with 96.4 I/m2, Bromus madritensis with
65.5, Hordeum murinum with 59.6, Elymus margin-
atus with 27.7, and Poa annua with 20. Finally, in the
coastal area (zone V), the most representative species
were Gaudinia fragilis with 180.5 I/m2, Cynodon
dactylon with 93.1, Polypogon monspeliensis with
71.1, Hordeum murinum with 52.0, and Bromus
hordeaceus with 28.9. The area with the highest
inflorescence density was the coastal zone, followed
by the meadow area, the riverside area, the mountain
area and the crop land and pasture zone.
3.5 Total pollen production per m2
In the different areas studied, pollen grain production
per m2 was highest in the meadow area, with 1.86 9
109, followed by the riverside zone with 1.44 9 109, the
coastal area with 0.76 9 109, and the mountain area
with 0.43 9 109. The value was lowest for crop land and
pasture area, with 0.23 9 109 pollen grains/m2.
The number of species identified per area was
between 15 and 22, depending on the area investi-
gated. The greatest number of species harvested was
observed in zone III (22), followed by zone II and
zone IV (21). The smaller number (15) was in the
coastal area.
Gaudinia fragilis, Hordeum murinum, Lolium
rigidum, and Trisetaria panicea were found in all
the areas studied, with substantial inflorescence
incidence and high pollen production, exceeding
3,000 pollen grains per flower, in some areas.
4 Discussion
With the exception of some cleistogamous species,
anemophily is the predominant method of pollinationTa
ble
1co
nti
nu
ed
Sp
ecie
sN
o.
of
po
llen
gra
ins/
anth
erN
o.
of
flo
wer
s/sp
ikel
etN
o.
of
spik
elet
s/in
flo
resc
ence
No
.o
f2
nd
-ord
ersp
ikes
ver
sus
pan
icle
s/in
flo
resc
ence
12
31
23
12
31
23
Po
aa
nn
ua
(26
0–
55
0)
40
5.5
6(2
6)
(2–
2)
2.0
0(0
)(4
2–
92
)5
8.7
3(2
0)
Po
atr
ivia
lis
(60
0–
1,6
90
)1
,12
8.8
9(2
7)
(3–
3)
3.0
0(0
)(1
08
–3
50
)2
05
.56
(31
)
Po
lyp
og
on
mo
nsp
elie
nsi
s(3
0–
80
)5
2.2
2(3
3)
(1–
1)
1.0
0(0
)(8
00
–4
,50
0)
2,7
67
.13
(41
)
Ro
stra
ria
cris
tata
(70
–1
70
)1
08
.89
(33
)(4
–5
)4
.77
(9)
(49
–6
00
)2
12
.17
(64
)
So
rgh
um
ha
lep
ense
(2,4
00
–9
,00
0)
5,3
07
.78
(41
)(1
–1
)1
.00
(0)
(3–
13
)b7
.60
b(2
5)b
(49
–2
48
)1
30
.27
(37
)
Ta
enia
ther
um
cap
ut-
med
usa
e(2
50
–4
50
)3
56
.67
(19
)(1
–1
)1
.00
(0)
(9–
21
)1
1.5
3(2
5)
Tri
seta
ria
pa
nic
ea(6
00
–1
,80
0)
1,1
31
.11
(34
)(3
–5
)4
.07
(11
)(2
00
–1
,85
0)
92
9.8
0(4
8)
Vu
lpia
gen
icu
lata
(21
0–
52
0)
35
2.2
2(2
7)
(2–
4)
3.2
7(2
3)
(36
–1
17
)7
9.3
7(2
8)
1,
Ran
ge;
2,
mea
n;
3,
coef
fici
ent
of
var
iati
on
(%)
aN
um
ber
of
flo
wer
sp
erin
flo
resc
ence
inA
egil
op
sb
Nu
mb
ero
fsp
ikel
ets
per
spik
eo
rp
anic
ule
32 Aerobiologia (2009) 25:27–38
123
Ta
ble
2N
um
ber
of
po
llen
gra
ins
per
infl
ore
scen
ce
Sp
ecie
s1
23
45
III
III
IVV
III
III
IVV
Aeg
ilo
ps
gen
icu
lata
A3
,233
.34
8.0
72
6,0
93
43
.50
4.5
01
2.6
0–
–1
,135
,046
11
7,4
19
32
8,7
72
––
Aeg
ilo
ps
triu
nci
ali
sA
5,3
86
.68
7.0
73
8,0
84
6.3
0–
*–
–2
39
,92
9–
?–
–
Ag
rost
isst
olo
nif
era
P5
86
.68
1,3
24
.50
77
7,0
58
**
*1
.00
–?
??
77
7,0
58
–
Am
pel
od
esm
am
au
rita
nic
aP
15
,63
9.9
99
86
.74
15
,43
2,6
04
*–
––
*?
––
–?
An
tho
xant
hu
mo
do
ratu
mP
10
,41
3.3
35
9.6
76
21
,36
3–
3.0
0*
*–
–1
,864
,08
9?
?–
Ave
na
ba
rba
taA
7,7
33
.34
86
.46
66
8,6
25
8.0
06
.80
1.7
01
3.8
01
.00
5,3
49
,000
4,5
46
,65
01
,136
,663
9,2
27
,02
56
68
,62
5
Ave
na
ster
ilis
A5
,979
.99
73
.85
44
1,6
22
15
.10
*5
.40
14
.00
*6
,668
,492
?2
,384
,759
6,1
82
,70
8?
Bri
zam
axi
ma
A1
,473
.33
64
.87
95
,57
57
.20
19
.00
1.4
0*
–6
88
,14
21
,815
,92
51
33
,80
5?
–
Bri
zam
ino
rA
22
2.3
36
33
.02
14
0,7
39
–4
.70
––
––
66
1,4
73
––
–
Bro
mus
dia
nd
rus
A2
66
.66
69
.43
18
,51
4–
**
5.0
03
.00
–?
?9
2,5
70
55
,54
2
Bro
mus
ho
rdea
ceu
sA
1,4
60
.01
27
9.1
04
07
,48
98
.40
24
.80
29
.50
9.8
02
8.9
03
,422
,908
10
,10
5,7
27
12
,02
0,9
26
3,9
93
,39
21
1,7
76
,43
2
Bro
mus
ma
dri
tens
isA
1,1
40
.00
17
9.8
82
05
,06
37
3.1
02
0.5
01
0.7
06
5.6
06
.00
14
,99
0,1
05
4,2
03
,79
22
,194
,174
13
,45
2,1
33
1,2
30
,378
Bro
mus
maro
ccanus
P1
0,5
16
.68
28
7.8
63
,02
7,3
32
–1
0.5
0–
––
–3
1,7
86
,98
6–
––
Cyn
odo
nd
act
ylo
nP
3,0
80
.01
23
6.7
27
29
,10
0*
52
.00
1.0
02
0.4
09
3.1
0?
37
,91
3,2
00
72
9,1
00
14
,87
3,6
40
67
,87
9,2
10
Da
ctyl
isg
lom
era
taP
6,4
29
.99
53
1.8
03
,41
9,4
69
––
1.5
0–
*–
–5
,129
20
4–
?
Des
ma
zeri
ari
gid
aA
69
9.9
92
23
.82
15
6,6
72
–*
1.6
03
.00
*–
?2
50
,67
54
70
,01
6?
Ely
mus
ma
rgin
atu
sP
81
9.9
96
1.7
25
0,6
10
30
.40
15
.90
15
.60
27
.70
–1
,538
,544
80
4,6
99
78
9,5
16
1,4
01
,89
7–
Ga
ud
inia
frag
ilis
A1
0,5
86
.67
14
5.4
71
,54
0,0
43
51
.50
11
1.6
01
6.4
01
1.2
01
80
.50
79
,31
2,2
15
17
1,8
68
,79
92
5,2
56
,70
51
7,2
48
,48
22
77
,97
7,7
62
Ho
rdeu
mm
uri
nu
mA
5,0
96
.67
29
.50
15
0,3
52
20
.20
23
.40
15
.30
59
.60
52
.00
3,0
37
,110
3,5
18
,23
72
,300
,386
8,9
60
,97
97
,81
8,3
04
Hyp
arr
hen
iasi
naic
aP
2,4
43
.32
63
4.2
81
,54
9,7
49
9.0
0–
3.0
0–
–1
3,9
47
,74
1–
4,6
49
,247
––
La
guru
so
vatu
sP
1,8
36
.66
43
1.3
47
92
,22
5–
––
*2
.50
––
–?
1,9
80
,563
La
mar
ckia
au
rea
A4
06
.68
15
0.8
36
1,3
40
–*
**
––
??
?–
Lo
lium
rigi
du
mA
12
,98
3.3
42
37
.98
3,0
89
,775
27
.90
49
.90
10
.30
7.6
02
7.4
08
6,2
04
,72
31
54
,17
9,7
73
31
,82
4,6
83
23
,48
2,2
90
84
,65
9,8
35
Mel
ica
ma
gn
olii
A1
,236
.66
31
6.0
73
90
,87
1–
–2
.50
––
––
97
7,1
78
––
Mel
ica
min
uta
A2
,180
.01
91
.26
19
8,9
48
––
1.5
0–
––
–2
98
,42
2–
–
Pa
nic
um
rep
ens
P3
,376
.68
31
5.2
01
,06
4,3
30
–9
.00
–9
.00
12
.00
–9
,578
,97
0–
9,5
78
,97
01
2,7
71
,96
0
Pa
spa
lid
ium
ob
tusi
foli
um
P5
,799
.99
33
.25
19
2,8
50
–5
.50
–8
.20
*–
1,0
60
,67
5–
1,5
81
,37
0?
Ph
ala
ris
can
ari
ensi
sA
3,9
06
.66
24
5.6
79
59
,74
9*
3.0
0–
15
.30
2.7
0?
2,8
79
,24
7–
14
,68
4,1
60
2,5
91
,322
Phala
ris
coer
ule
scen
sP
5,8
66
.68
93
4.4
75
,48
2,2
36
13
.80
3.3
01
.90
*–
75
,65
4,8
57
18
,09
1,3
79
10
,41
6,2
48
?–
Pip
tath
erum
mil
iace
um
P2
,586
.66
2,4
01
.54
6,2
11
,967
**
1.0
05
.30
–?
?6
,211
,967
32
,92
3,4
25
–
Aerobiologia (2009) 25:27–38 33
123
in the Poaceae family. The different species flower
successively (Lewis et al. 1983; Knox et al. 1993),
increasing the period of time in which their allergenic
pollen can be found in the air. This behaviour of
successive flowering is especially remarked in the
Mediterranean basin, because the orography of the
territory means the same species has different phe-
nology periods, depending on altitude. On the other
hand, Poaceae pollen is one of the main cause of
pollinosis everywhere, with a well-known phenome-
non of cross-reactivity among the species, probably
because of their close phylogenetic relationships
(Andersson and Lidholm 2003).
The mean variation of pollen grains per anther,
ranging from 14 to 55%, is less than 31% in 60.5% of
the species. In the remaining species (39.5%), it is
equal or higher than 31%. This character thus has low
mean variation in the former group and is probably
genetically controlled. In the latter group, it may be
affected by environmental factors. The results for
Avena barbata with 2,558 pollen grains per anther,
Bromus hordeaceus with 486, Lamarckia aurea with
135, Poa annua with 405, and Rostraria cristata with
109 are similar to those for the same species in the
study carried out by Prieto-Baena et al. (2003). In
contrast, discrepancies were found regarding the
pollen content of other species. In fact, values for
Briza maxima with 491 pollen grains per anther,
Cynodon dactylon with 1,027, Dactylis glomerata
with 2,133, Hordeum murinum with 531, Lolium
rigidum with 3,725, Piptatherum miliaceum with 862,
Polypogon monspeliensis with 52, Trisetaria panicea
with 1,131 and Vulpia geniculata with 352 are
different from those recorded by Prieto-Baena et al.
(2003) (pollen grains per anther for the same species
being, respectively: 1,572, 2,500, 3,475, 371, 10,453,
1,052, 91, 1,392, and 3,544). Different pollen
production values were also observed for species of
the same genera. Prieto-Baena et al. (2003) estimated
1,000 pollen grains per anther for Phalaris minor and
Phalaris paradoxa, 2,224 for Hyparrhenia hirta, and
5,410 for Elymus repens, values different from the
1,955 pollen grains for Phalaris coerulescens, 814 for
Hyparrhenia sinaica, and 273 for Elymus marginatus
observed in this study. As documented by Stanley
and Linskens (1974), pollen production may vary
from year to year because of physiological and
environmental factors. This might explain the differ-
ent results obtained in our study in comparison toTa
ble
2co
nti
nu
ed
Sp
ecie
s1
23
45
III
III
IVV
III
III
IVV
Po
aa
nn
ua
A1
,21
6.6
81
17
.46
14
2,9
11
–*
*2
0.0
0*
–?
?2
,858
,220
?
Po
atr
ivia
lis
A3
,38
6.6
76
16
.68
2,0
88
,492
17
.20
15
.20
–3
.00
28
.10
35
,92
2,0
62
31
,74
5,0
78
–6
,265
,476
58
,68
6,6
25
Po
lyp
og
on
mo
nsp
elie
nsi
sA
15
6.6
62
,767
.16
43
3,4
99
*1
1.4
01
.00
3.0
07
1.1
0?
4,9
41
,889
43
3.4
99
1,3
00
,497
30
,82
1,7
79
Ro
stra
ria
cris
tata
A3
26
.67
1,0
12
.05
33
0,6
06
––
12
.20
*–
––
4,0
33
,393
?–
So
rgh
um
ha
lep
ense
P1
5,9
23
.34
99
0.0
51
5,7
64
,90
3*
–*
2.0
0–
?–
?3
1,5
29
,80
6–
Ta
enia
ther
umca
pu
t-m
edu
sae
A1
,07
0.0
11
1.5
31
2,3
37
*–
––
–?
––
––
Tri
seta
ria
panic
eaA
3,3
93
.33
3,7
84
.29
12
,84
1,3
45
7.2
01
05
.90
6.8
09
6.4
01
5.7
09
2,4
57
,68
41
,359
,89
8,4
36
87
,32
1,1
46
1,2
37
,905
,658
20
1,6
09
,11
7
Vu
lpia
gen
icu
lata
A1
,05
6.6
62
59
.54
27
4,2
46
52
.50
16
.70
10
4.5
0*
8.6
01
4,3
97
,91
54
,57
9,9
08
28
,65
8,7
07
?2
,35
8,5
16
To
tal
po
llen
pro
du
ctio
n3
91
.35
16
.62
57
.40
40
0.9
05
33
.60
43
4,9
66
,47
11
,856
,16
2,3
51
22
7,4
79
,17
51
,43
8,7
89
,772
76
2,8
85
,97
0
1,N
um
ber
of
po
llen
gra
ins
per
flo
wer
;2
,n
um
ber
of
flo
wer
sp
erin
flo
resc
ence
;3
,n
um
ber
of
po
llen
gra
ins
per
infl
ore
scen
ce;
4,n
um
ber
of
infl
ore
scen
ces
per
squ
are
met
er;
5,n
um
ber
of
po
llen
gra
ins
per
squ
are
met
er;
I,m
ou
nta
inar
ea;
II,
gra
ssla
nd
area
;II
I,ab
and
on
edcr
op
lan
d;
IV,
riv
ersi
de
area
;V
,li
tto
ral
area
;(–
)n
op
rese
nce
;(*
)o
ccas
ion
al;
(?)
insi
gnifi
can
t;A
,an
nu
al;
P,
per
enn
ial
34 Aerobiologia (2009) 25:27–38
123
those of other authors (Subba Reddi and Reddi 1986;
Prieto-Baena et al. 2003). Variation of pollen
production can also be attributed to local variations
in climatic factors and to differences in the taxa
recorded in the different regions.
The results obtained in this work demonstrated
that the number of spikelets per inflorescence is the
most variable characteristic. Prieto-Baena et al.
(2003) also suggested that this characteristic depends
on environmental factors. The number of second-
order spikes or panicles per inflorescence showed a
range of variation between 15 and 37% and the
number of flowers per spikelet remained constant for
most species.
According to Faegri and Van der Pijl (1979),
anemophily is accompanied by production of large
amounts of pollen to increase the probability of wind-
pollination. Weak production of pollen per anther can
Table 3 Means comparison test performed by means of parametric analysis (paired samples student t test) from data obtained in the
measurements (Table1)
Genera Paired samples t-test Pollen grains
per anther
Flowers
per spikelet
Spikelets per
inflorescence
Aegilops A. geniculata–A. triuncialis 0.011 0.001a –
Avena A. barbata–A. sterilis 0.240 0.000 0.000
Briza B. maxima–B. minor 0.000 0.000 0.000
Bromus B. diandrus–B. hordeaceus 0.000 0.000 0.000
B. diandrus–B. madritensis 0.002 1.000 0.000
B. diandrus–B. maroccanus 0.000 0.000 0.000
B. hordeaceus–B. madritensis 0.068 0.000 0.808
B. hordeaceus–B. maroccanus 0.000 0.000 0.000
B. madritensis–B. maroccanus 0.000 0.000 0.000
Melica M. magnolii–M. minuta 0.000 – 0.000
Phalaris P. canariensis–P. coerulescens 0.007 – 0.000
Poa P. annua–P. trivialis 0.000 – 0.000
a Number of flowers per inflorescence
Fig. 2 Total pollen production per inflorescence for the 38 species studied. Dashes, annual species; plus symbols, perennial species
Aerobiologia (2009) 25:27–38 35
123
be compensated by a large number of flowers per
inflorescence. This is proved for Polypogon mons-
peliensis, Rostraria cristata, and Agrostis stolonifera.
Reduction of the number of flowers is normally
balanced by high production of pollen per anther, as
is observed for Anthoxanthum odoratum, Bromus
maroccanus, Gaudinia fragilis, and Lolium rigidum.
This important variability in the production of pollen
is also related to the method of pollination, i.e. if the
species are autogames or allogames.
Total mean pollen production per anther of the
species studied was approximately 1,400 grains. If we
take into account only the common species included
in our study and that of Prieto-Baena et al. (2003), a
value of 1,148.5 pollen grains per anther was
obtained in Tetouan, which differs from the mean
of 1,972.5 recorded in the same species studied in
Cordoba by Prieto-Baena et al. (2003). This demon-
strates that the values genuinely differ between the
two studies and, although for most of the species
were similar, in our case the anthers often contained
less pollen. Furthermore, the high pollen-content
species in the work of Prieto-Baena et al. (2003),
for example Arrhenatherum album, Cynosurus echin-
atus, Elymus repens, and Festuca arundinacea, were
not collected in our investigation.
Regarding pollen production per square meter, the
values were between 0.44 and 1.85 9 109 pollen
grains/m2 in the different areas studied. A total of
1.24–1.36 9 109 pollen grains/m2 were estimated for
Trisetaria panicea in the meadow area and the
riverside zone. This was twice as high than the
amount detected in the study of Prieto-Baena et al.
(2003) and approximately similar to the 1.25 9 109
grains of Phalaris tuberosa and the 1.89 9 109 grains
of Vulpia geniculata (Smart et al. 1979). Smart
et al. (1979) measured production of 2.11 9 109
pollen grains per square meter for Lolium perenne.
Trisetaria panicea, by itself, accounted from 74%
and 86% of total pollen production in the grassland
and riverside zones, respectively.
Regarding maximum pollen production per square
meter, with the exception of the crop land with
0.52 9 109 pollen grains, areas I, II, IV, and V with
1.55 9 109, 1.53 9 109, 1.52 9 109, and 2.25 9 109
contributed similarly to total pollen production per
square meter. Production was much higher on natural
surfaces which still preserve semi-natural vegetation
than in the crop land. In this area, despite of the high
variety of species (22), lower pollen production per
square meter was observed. These results are because
of the low pollen content of the most frequent species
and the low grass species density, related mainly to
the pasture but also to the occurrence of other species.
The amount of pollen in the atmosphere depends
not only on pollen production but also on the duration
of the flowering season and on environmental factors
(Rogers 1993). It cannot, therefore, be deduced solely
from pollen production by the inflorescence. Accord-
ing to Galan et al. (1995), the most important
meteorological factors are moisture, minimum tem-
perature, and sunshine hours, and Peternel et al.
(2006) found that low pollen concentrations corre-
lated with high levels of rainfall and humidity. In
contrast, Green et al. (2004) found that the major
factors affecting airborne pollen counts were maxi-
mum and minimum temperatures. To understand the
temporal distribution of the pollen emission by the
Poaceae, phenological studies and aerobiological
analysis are necessary. Subba Reddi et al. (1988)
demonstrated that flowering season periods can differ
by several months between genera, and some Poaceae
species have a circadian mechanism of pollen shed-
ding, each species having their own temporal features
of pollen release, with duration that may vary
between 2 and 13 h.
There is a need to assess further phenological
studies to determine the anthesis periods of the
different species of grass and the response to
meteorological conditions, together with aerobio-
logical sampling, to analyze the eventual annual
variation in the atmospheric pollen content of the
region. This will enable monitoring of air quality, and
determine the extent to which grass pollen can cause
respiratory allergies.
5 Conclusions
This study indicates that pollen production by grasses
is higher in natural areas that still preserve semi-
natural vegetation than in crop lands in which the
occurrence of such vegetation is reduced, with a few
species being responsible for most pollen production.
To ensure their wind-pollination, the species of
Poaceae studied produce enough pollen grains per
anther or, if not, develop an inflorescence with
several flowers when the number of pollen grains per
36 Aerobiologia (2009) 25:27–38
123
anther is low, or both at the same time; this means
they release sufficient quantities of pollen to cause
allergenic disorders. The perennial species produce
much more pollen grains per anther than the annual
species. In contrast, an important inflorescence den-
sity was recorded for the annual species. This work
provides many data that must be taken into account in
the phenological studies and aerobiological analysis
that are increasing because of their importance for
epidemiology and immunotherapy, and for health
improvement and management of respiratory allergy
diseases in the atopic population within our region.
Acknowledgment This research project (A9772/07) was
financially subsidized by the Spanish Agency of International
Cooperation (AECI) of the Foreign Ministry.
References
Adams, E., Perkins, W. E., & Estes, J. R. (1981). Pollination
systems in Paspalum dilatatum Poir. (Poaceae): An
example of insect pollination in a temperate grass.
American Journal of Botany, 68, 389–394. doi:10.2307/
2442775.
Allisson, T. D. (1990). Pollen production and plant density
affect pollination and seed production in Taxus canadi-ensis. Ecology, 7, 516–522. doi:10.2307/1940305.
Andersson, L., & Lidholm, J. (2003). Characteristics and
immunobiology of grass pollen allergens. InternationalArchives of Allergy and Immunology, 130, 87–107. doi:
10.1159/000069013.
Benabid, A. (1982). Etude phytoecologique, biogeographique et
dynamique des associations et series sylvatiques du Rif
occidental (Maroc). Aix-Marseille, These de doctorat,
Faculte des Sciences et Technique Saint Jerome
Univversite.
Cruden, R. W. (1977). Pollen-ovule ratios: A conservative
indicator of breeding systems in flowering plants. Evolu-tion; International Journal of Organic Evolution, 31,
32–46. doi:10.2307/2407542.
D’Amato, G. P., Spieksma, F. T. M., Liccardi, G., Jager, S.,
Russo, M., Kontou-Fili, K., et al. (1998). Pollen-related
allergy in Europe. Allergy, 53, 567–578. doi:10.1111/j.
1398-9995.1998.tb03932.x.
Driessen, M. N. B. M., Willemse, M. T. M., & van Luijn, J. A.
G. (1989). Grass pollen grain determination by light and
UV microscopy. Grana, 28, 115–122.
Faegri, K., & Van der Pijl, L. (1979). The principle of polli-nation ecology (3rd ed.). Oxford: Pergamon press.
Fernandez-Gonzalez, D., Valencia-Barrera, R. M., Vega, A.,
Diaz de la Guardia, C., Trigo, M. M., Carinanos, P., et al.
(1999). Analysis of grasses pollen concentrations in the
atmosphere of several Spanish sites. Pollen, 10, 123–132.
Galan, C., Emberlin, J., Domınguez, E., Bryant, R. H., &
Villamandos, F. (1995). A comparative analysis of daily
variations in the gramineae pollen counts at Cordoba,
Spain and London, UK. Grana, 34, 189–198.
Green, B. J., Dettman, M., Yli-Panula, E., Rutherford, S., &
Simpson, R. (2004). Atmospheric Poaceae pollen fre-
quencies and associations with meteorological parameters
in Brisbane, Australia: A 5 years record 1994–1999.
International Journal of Biometeorology, 48, 172–178.
doi:10.1007/s00484-004-0204-8.
Gutierrez, H. F., & Medan, D. (2006). Flowering phenology,
sexual expression and pollen production. New ZealandJournal of Botany, 44, 47–55.
Hidalgo, P. J., Galan, C., & Domınguez, E. (1999). Pollen
production of the genus Cupressus. Grana, 38, 296–300.
doi:10.1080/001731300750044519.
Knox, R. B. (1993). Grass pollen, thunderstorms and asthma.
Clinical and Experimental Allergy, 23, 354–359. doi:
10.1111/j.1365-2222.1993.tb00339.x.
Knox, R. B., & Singh, M. (1987). New perspectives in pollen
biology and fertilization. Annals of Botany, 60, 15–37.
Knox, R. B., Taylor, P., Smith, P., Hough, T., Ong, E. K., Singh,
M. B., et al. (1993). Pollen allergens, botanical aspects. In
D. Kraft & A. Sehon (Eds.), Molecular biology andimmunology of allergens (pp. 31–34). Boca Raton: CRC
press Inc.
Lewis, W. H., Vinay, P., & Zenger, V. E. (1983). Airborne andallergenic pollen of North America. Baltimore: Johns
Hopkins University press.
Liem, A. S. N., & Groot, J. (1980). Anthesis and pollen dis-
persal of Holcus lanatus, Festuca rubra and Poa annua.
Grana, 19, 21–29.
Mabberley, D. J. (1987). The plant book. Cambridge: Cam-
bridge University press.
Ong, E. K., Singh, M. B., & Knox, R. B. (1995). Seasonal
distribution of pollen in the atmosphere of Melbourne: An
airborne pollen calendar. Aerobiologia, 11, 51–55. doi:
10.1007/BF02136145.
Peternel, R., Srnec, L., Culij, J., Hrga, I., & Hercog, P. (2006).
Poaceae pollen in the atmosphere of Zagreb (Croatia),
2002–2005. Grana, 45, 130–136. doi:10.1080/00173130
600662114.
Prieto-Baena, J. C., Hidalgo, P. J., Dominguez, E., & Galan, C.
(2003). Pollen production in the Poaceae family. Grana,42, 1–7. doi:10.1080/00173130310011810.
Rogers, C. A. (1993). Application of aeropalynological princi-
ples in Paleoecology. Review of Palaeobotany andPalynology, 79, 1133–1140. doi:10.1016/0034-6667(93)9
0043-T.
Smart, I. J., Tuddenham, W. G., & Knox, R. B. (1979).
Aerobiology of grasses in the city atmosphere of Mel-
bourne: Effects of weather parameters and pollen sources.
Australian Journal of Botany, 27, 333–342. doi:10.1071/
BT9790333.
Stanley, R. G., & Linskens, H. F. (1974). Pollen, biology,biochemistry, management. Berlin: Springer.
Statistica software program. (1984–2003) StatSoft Inc.
Stevenson, J., Haberle, S. G., Johnston, F. H., & Browman, D.
M. J. S. (2007). Seasonal distribution of pollen in the
atmosphere of Darwin, tropical Australia: Preliminary
results. Grana, 46, 34–42. doi:10.1080/0017313060117
8250.
Aerobiologia (2009) 25:27–38 37
123
Subba Reddi, C., & Reddi, N. S. (1986). Pollen production in
some anemophilous angiosperms. Grana, 25, 55–61.
Subba Reddi, C., Reddi, N. S., & Atluri Janaki, B. (1988).
Circadian patterns of pollen release in some species of
Poaceae. Review of Palaeobotany and Palynology, 55,
11–42. doi:10.1016/0034-6667(88)90003-6.
Tormo Molina, R., Munoz Rodrıguez, A., Silva Palacios, I., &
Gallardo Lopez, F. (1996). Pollen production in ane-
mophilous trees. Grana, 35, 38–46.
Valdes, B., Rejdali, M., Achhal El Kadmiri, A., Jury, J. L., &
Montserrat, J. M. (2002). Catalogue des plantes vascul-aires du Nord du Maroc, incluant des cles d’identification(volume II). Madrid: Biblioteca de Ciencias (CSIC).
Yazidi Alaoui, A., Nejjar, C., & Bartal, M. (2001). Sensibili-
sation cutanee aux pollens au Maroc: Etude multicentrique.
Revue des Maladies Respiratoires, 18, 523–529.
38 Aerobiologia (2009) 25:27–38
123