En ¿Qué son los valores?: Introducción a la - axiologia. México
Inter-American Development BankBanco Interamericano de Desarrollo (BID)
Research departmentDepartamento de investigación
Working Paper #468
Human Capital Policies: What they Can andHuman Capital Policies: What they Can andHuman Capital Policies: What they Can andHuman Capital Policies: What they Can andCannot Do for Productivity and PovertyCannot Do for Productivity and PovertyCannot Do for Productivity and PovertyCannot Do for Productivity and Poverty
Reduction in Latin AmericaReduction in Latin AmericaReduction in Latin AmericaReduction in Latin America
by
Suzanne DuryeaCarmen Pagés
Inter-American Development BankInter-American Development BankInter-American Development BankInter-American Development Bank
April 2002
2
Cataloging-in-Publication data provided by theInter-American Development BankFelipe Herrera Library
Duryea, Suzanne.Human capital policies : what they can and cannot do for productivity and poverty
reduction in Latin America / by Suzanne Duryea, Carmen Pagés.
p. cm. (Research Department Working paper series ; 468)Includes bibliographical references.
1. Labor supply--Latin America--Effect of Education on. 2. Wages--LatinAmerica--Effect of Education on. I. Pagés, Carmen. II. Inter-American DevelopmentBank. Research Dept. III. Title. IV. Series.
331.1 D129--------dc21
�2002Inter-American Development Bank1300 New York Avenue, N.W.Washington, D.C. 20577
The views and interpretations in this document are those of the authors and should not beattributed to the Inter-American Development Bank, or to any individual acting on itsbehalf.
The Research Department (RES) produces the Latin American Economic PoliciesNewsletter, as well as working papers and books, on diverse economic issues.
To obtain a complete list of RES publications, and read or download them please visit ourweb site at: http://www.iadb.org/res

3
Abstract
Raising labor productivity is recognized as a critical factor for increasingeconomic growth and reducing poverty levels in Latin America. Lowlevels of education continue to be singled out as the main obstacle tohigher productivity in the region. We examine the scope for education tolift labor incomes above poverty levels in Latin America and find that inmany countries education, by itself, has a positive, but limited, potential toincrease wages above a minimum level. In general, the prospects are dimbecause progress in raising average schooling levels has been slow evenunder the best historical scenarios. We also examine whether the apparentfailure of education can be explained by low wage returns to schooling,and poor underlying conditions. We find that investments in educationcontinue to have important payoffs but poor underlying conditions explainthe modest prospect for the role of education in the short run. This leads usto consider what additional policies should be pursued in order to ensurehigher productivity for workers in the region.

4
5
1. Introduction
Raising labor productivity is recognized as a critical factor for increasing economic
growth and reducing poverty levels in Latin America. In the 1990s only meager
reductions in poverty are found throughout the region. For example, Székely (2001)
finds that over the decade moderate poverty fell on average by only 4 percentage points
from a level of 43 percent to 39 percent, based on calculations for 11 countries.
Nonetheless, a series of United Nations resolutions and agreements have set ambitious
international development goals to be achieved by the year 2015, including a reduction of
poverty to half of its early 1990s levels. U.S. Treasury secretary Paul O’Neill has
repeatedly asserted that multilateral development banks and international institutions
should focus on raising productivity. In testimony to the US Congress in May 2001, he
noted that programs that raise workers’ labor income are the critical link for reducing
poverty. In turn, low levels of education are consistently singled out as the main obstacle
to higher productivity in the region.
The focus on productivity is understandable: countries with high labor
productivity tend to be rich societies. This is because when each worker is responsible for
a large share of goods and services, real wages tend to be high.1 Unfortunately, the factors
behind a high level of labor productivity are not well understood—as the number of poor
countries reflects. Although higher education scores high in the potential list of policies
that can increase labor productivity, the economic literature has found conflicting
evidence on the relationship between education, income per capita and economic growth.
At the microeconomic level, higher education tends to be associated with higher income.
An additional year of education has a value revealed by higher remuneration in the labor
market. Mincer equations (i.e., that is, regressions of individual earnings on age,
education and other individual characteristics) show that returns to schooling tend to be
positive and significant. At the aggregate level, however, there is less agreement on
whether education contributes to income per capita and economic growth; some studies
even find an empirical link between increases in women’s schooling and slowdowns in
economic growth.2 While the jury is out regarding the effect of changes in aggregate
1 This is particularly true in countries with democratic governments as shown in Rodrik (1999).2 See Pritchett (1996) and Barro and Sala-i-Martin (1995).
6
education on aggregate per capita-income using cross-country data, there is broad
consensus that, at the level of the individual, higher education is associated with higher
labor income.
In this paper we assess the role of education and other human capital policies in
productivity growth and poverty reduction. We find that when educational levels are low,
educational attainment is deeply unequal, and the quality of education in Latin America
lags behind that of other regions. We also examine the scope for education to lift labor
incomes above poverty levels in Latin America and assert that for many countries
education, by itself, has a positive, but limited, potential to increases wages above a
minimum level in the short run. In general the prospects are dim because progress in
raising average schooling levels has been slow even under the best historical scenarios.
We also examine whether the apparent failure of education can be explained by low wage
returns to schooling and poor underlying economic and institutional conditions. While
returns to every extra year of education are high relative to other countries, an expansion
of education that made secondary schooling universal will not be able to lift all workers
above poverty levels. This is because, while education can lift the earnings of a worker
without schooling or experience by a relatively large percentage, the base to which that
percentage is applied is very low. These low “base” wages are a reflection of the low
quality of the economic and institutional environment in which workers produce. Policies
addressed to improve this environment can have large effects on earnings. Moreover, the
better the quality of this environment, the larger the absolute gains in earnings given by
any expansion in education.
The paper is organized as follows. Section 2 assesses education in Latin America
relative to other regions of the world. Section 3 evaluates how fast education can be
expanded. Section 4 calculates the impact of an education expansion in reducing the
share of “poor” workers and shows that education, by itself, cannot remedy the
productivity deficit in the region. Section 5 examines the reasons behind the limited role
of education in reducing the share of poor workers. Section 6 suggests interventions for a
high productivity agenda. Section 7 concludes.
7
2. Education and Productivity
The positive relationship between schooling and higher earnings is well documented in
the microeconomics literature for industrialized as well as developing countries. There
has been intense discussion on whether earnings of educated workers reflect their
inherent abilities or instead reflect the increases in productivity associated with education.
If the most able workers are those who can complete higher levels of education,
education may be a way to signal higher ability. If this were an important part of the
story, expansions in education would not necessarily lead to more productivity. However,
recent research suggests that higher earnings do indeed demonstrate that education
imparts knowledge and skills that increase workers’ productivity.3
Despite the established relationship between education and earnings at the
individual level, some studies have found no relationship between changes in education
attainment and GDP growth.4 Some have even found an empirical link between increases
in women’s schooling and slowdowns in growth.5 There are a variety of reasons driving
inconsistencies in research with aggregate macro data. One is that it is extremely
difficult to collect comparable measures of schooling across countries. For example, the
schooling level classified as completed primary in one country may be considered
completed first cycle of secondary in another country, and average levels of quality may
differ widely. The resulting measurement error would bias the results against finding that
aggregate measures of schooling affect income growth. Krueger and Lindahl (2000) find
that once one corrects for these errors in measuring years of education, changes in
education positively affect GDP growth. So while the jury is out regarding the best
estimation approaches with aggregate level data, both the microeconomic and
macroeconomic literature suggests a strong link between schooling and productivity.
3. Education in Latin AmericaGiven the strong relationship between education, earnings, productivity, and GDP growth
found by many studies, it is not surprising that Latin America’s deficit in educational
3 See Krueger and Lindahl (2000).4 See for example Benhabib and Spiegel (1994).5 See Pritchett (1996), and Barro and Sala-i-Martin (1995).
8
attainment has been identified as the leading cause of low incomes and high poverty rates
in the region.6 Low levels of education, deep inequalities and very poor quality
characterize education outcomes in Latin America.
Low Levels of Schooling
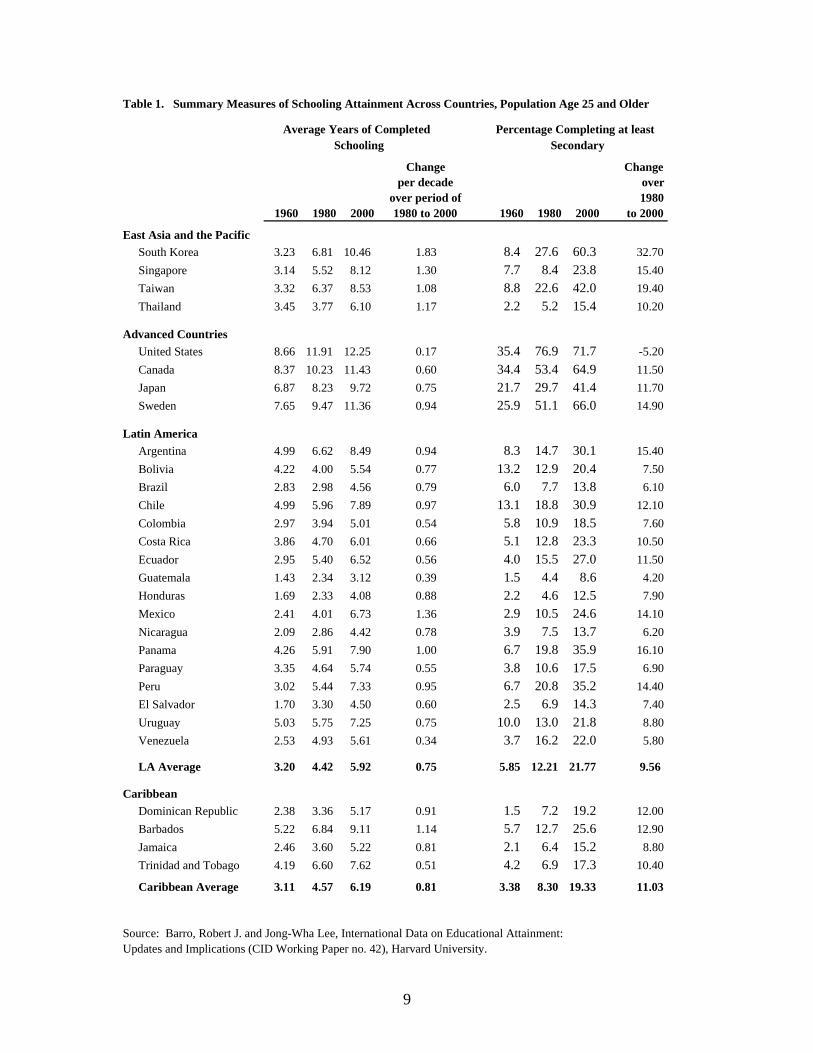
Educational attainment in Latin America lags behind attainment in other regions. Using
estimates from the Barro-Lee data set on education, Table 1 shows that the average years
of schooling attained by the population older than 25 in Latin America was
approximately 6 years of schooling in 2000. With averages over 11 years in the United
States, Canada and Sweden, attainment in these countries is twice the Latin American
average. There is, of course, much dispersion in average schooling levels within Latin
American and the Caribbean, with the lowest average attainment in the table found in
Guatemala (3.12 years) and the highest in Argentina (8.49 years).
6 See IDB (1998) and Latin American Economic Policies (2000).
9
Table 1. Summary Measures of Schooling Attainment Across Countries, Population Age 25 and Older
Change Changeper decade over
over period of 19801960 1980 2000 1980 to 2000 1960 1980 2000 to 2000
East Asia and the PacificSouth Korea 3.23 6.81 10.46 1.83 8.4 27.6 60.3 32.70Singapore 3.14 5.52 8.12 1.30 7.7 8.4 23.8 15.40Taiwan 3.32 6.37 8.53 1.08 8.8 22.6 42.0 19.40Thailand 3.45 3.77 6.10 1.17 2.2 5.2 15.4 10.20
Advanced CountriesUnited States 8.66 11.91 12.25 0.17 35.4 76.9 71.7 -5.20Canada 8.37 10.23 11.43 0.60 34.4 53.4 64.9 11.50Japan 6.87 8.23 9.72 0.75 21.7 29.7 41.4 11.70Sweden 7.65 9.47 11.36 0.94 25.9 51.1 66.0 14.90
Latin AmericaArgentina 4.99 6.62 8.49 0.94 8.3 14.7 30.1 15.40Bolivia 4.22 4.00 5.54 0.77 13.2 12.9 20.4 7.50Brazil 2.83 2.98 4.56 0.79 6.0 7.7 13.8 6.10Chile 4.99 5.96 7.89 0.97 13.1 18.8 30.9 12.10Colombia 2.97 3.94 5.01 0.54 5.8 10.9 18.5 7.60Costa Rica 3.86 4.70 6.01 0.66 5.1 12.8 23.3 10.50Ecuador 2.95 5.40 6.52 0.56 4.0 15.5 27.0 11.50Guatemala 1.43 2.34 3.12 0.39 1.5 4.4 8.6 4.20Honduras 1.69 2.33 4.08 0.88 2.2 4.6 12.5 7.90Mexico 2.41 4.01 6.73 1.36 2.9 10.5 24.6 14.10Nicaragua 2.09 2.86 4.42 0.78 3.9 7.5 13.7 6.20Panama 4.26 5.91 7.90 1.00 6.7 19.8 35.9 16.10Paraguay 3.35 4.64 5.74 0.55 3.8 10.6 17.5 6.90Peru 3.02 5.44 7.33 0.95 6.7 20.8 35.2 14.40El Salvador 1.70 3.30 4.50 0.60 2.5 6.9 14.3 7.40Uruguay 5.03 5.75 7.25 0.75 10.0 13.0 21.8 8.80Venezuela 2.53 4.93 5.61 0.34 3.7 16.2 22.0 5.80
LA Average 3.20 4.42 5.92 0.75 5.85 12.21 21.77 9.56
CaribbeanDominican Republic 2.38 3.36 5.17 0.91 1.5 7.2 19.2 12.00Barbados 5.22 6.84 9.11 1.14 5.7 12.7 25.6 12.90Jamaica 2.46 3.60 5.22 0.81 2.1 6.4 15.2 8.80Trinidad and Tobago 4.19 6.60 7.62 0.51 4.2 6.9 17.3 10.40
Caribbean Average 3.11 4.57 6.19 0.81 3.38 8.30 19.33 11.03
Source: Barro, Robert J. and Jong-Wha Lee, International Data on Educational Attainment:Updates and Implications (CID Working Paper no. 42), Harvard University.
Average Years of CompletedSchooling
Percentage Completing at leastSecondary
10
The availability of skilled workers can be proxied by the share of population who
has completed at least secondary schooling. Again using the Barro-Lee figures shown in
Table 1, the percentage of skilled workers in South Korea, Taiwan, the United States,
Canada, Japan and Sweden is at least twice that of the Latin American or Caribbean
average. For example, 42 percent of adults age 25 and above in Taiwan have completed
at least secondary school, whereas the average for Latin America is 22 percent. Among
the countries with the lowest share of potential workers with completed secondary
schooling are Guatemala, Honduras, Nicaragua, Brazil, and El Salvador, in which less
than 15 percent of the adult population has completed secondary school.
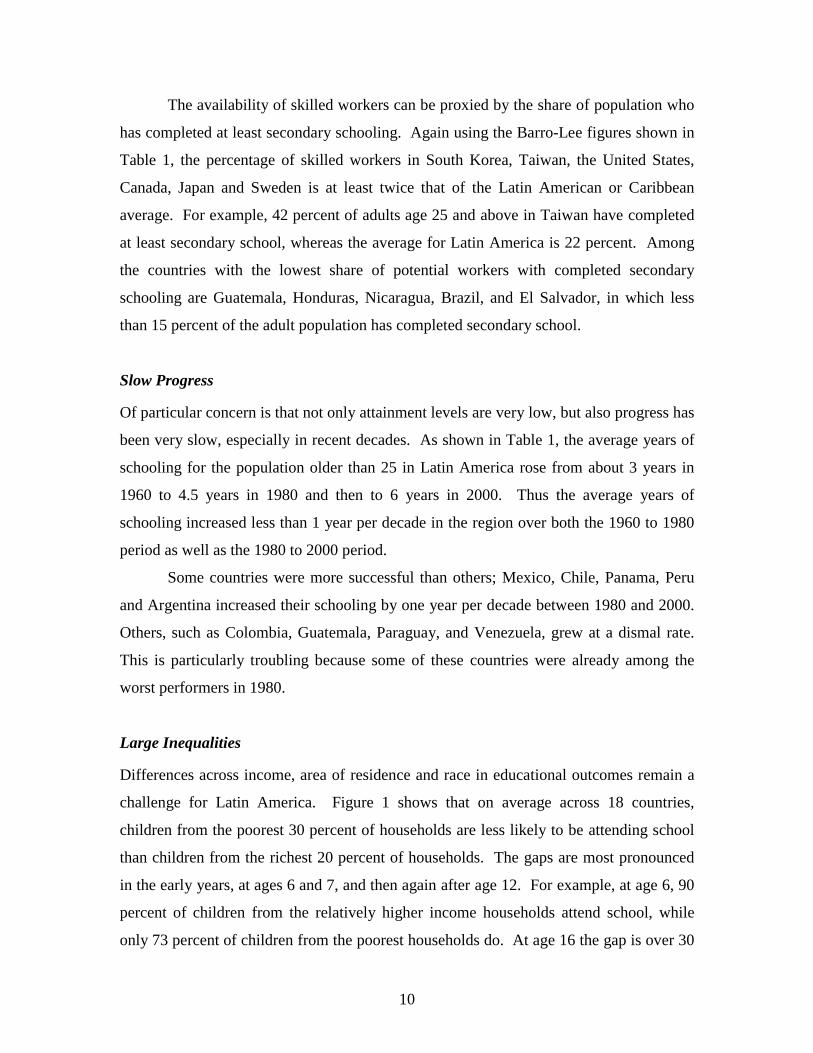
Slow Progress
Of particular concern is that not only attainment levels are very low, but also progress has
been very slow, especially in recent decades. As shown in Table 1, the average years of
schooling for the population older than 25 in Latin America rose from about 3 years in
1960 to 4.5 years in 1980 and then to 6 years in 2000. Thus the average years of
schooling increased less than 1 year per decade in the region over both the 1960 to 1980
period as well as the 1980 to 2000 period.
Some countries were more successful than others; Mexico, Chile, Panama, Peru
and Argentina increased their schooling by one year per decade between 1980 and 2000.
Others, such as Colombia, Guatemala, Paraguay, and Venezuela, grew at a dismal rate.
This is particularly troubling because some of these countries were already among the
worst performers in 1980.
Large Inequalities
Differences across income, area of residence and race in educational outcomes remain a
challenge for Latin America. Figure 1 shows that on average across 18 countries,
children from the poorest 30 percent of households are less likely to be attending school
than children from the richest 20 percent of households. The gaps are most pronounced
in the early years, at ages 6 and 7, and then again after age 12. For example, at age 6, 90
percent of children from the relatively higher income households attend school, while
only 73 percent of children from the poorest households do. At age 16 the gap is over 30
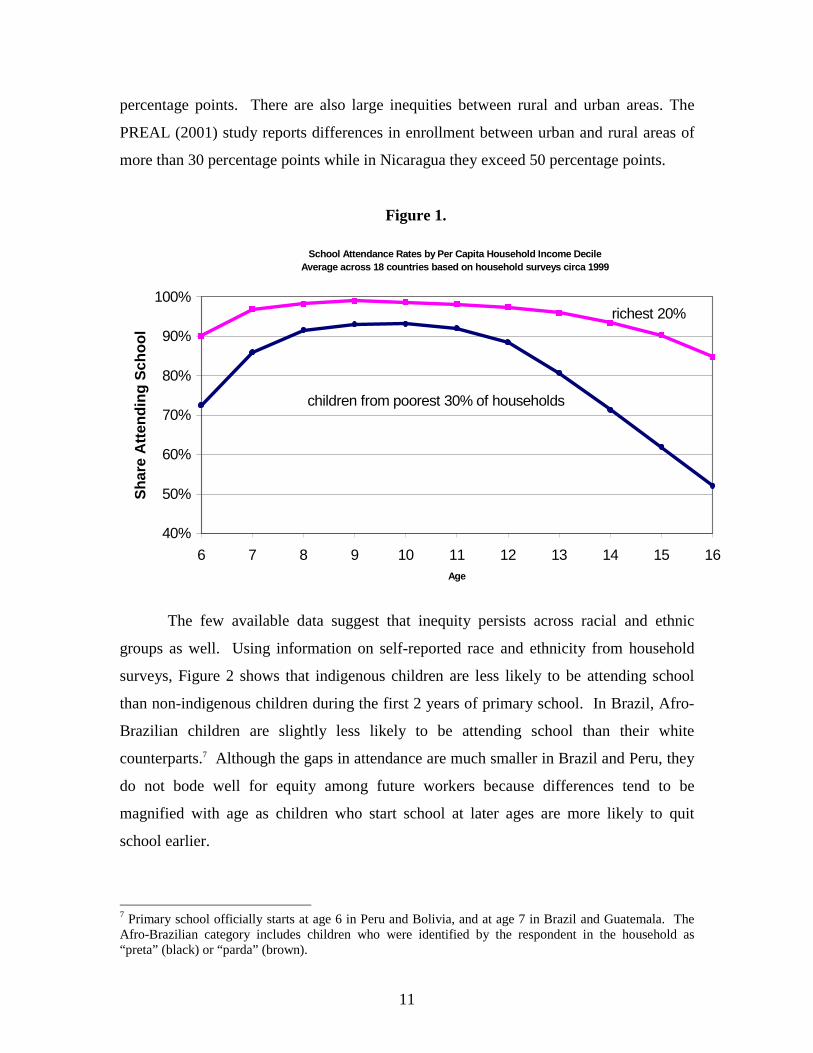
11
percentage points. There are also large inequities between rural and urban areas. The
PREAL (2001) study reports differences in enrollment between urban and rural areas of
more than 30 percentage points while in Nicaragua they exceed 50 percentage points.
Figure 1.
School Attendance Rates by Per Capita Household Income DecileAverage across 18 countries based on household surveys circa 1999
40%
50%
60%
70%
80%
90%
100%
6 7 8 9 10 11 12 13 14 15 16Age
Shar
e A
ttend
ing
Scho
ol
richest 20%
children from poorest 30% of households
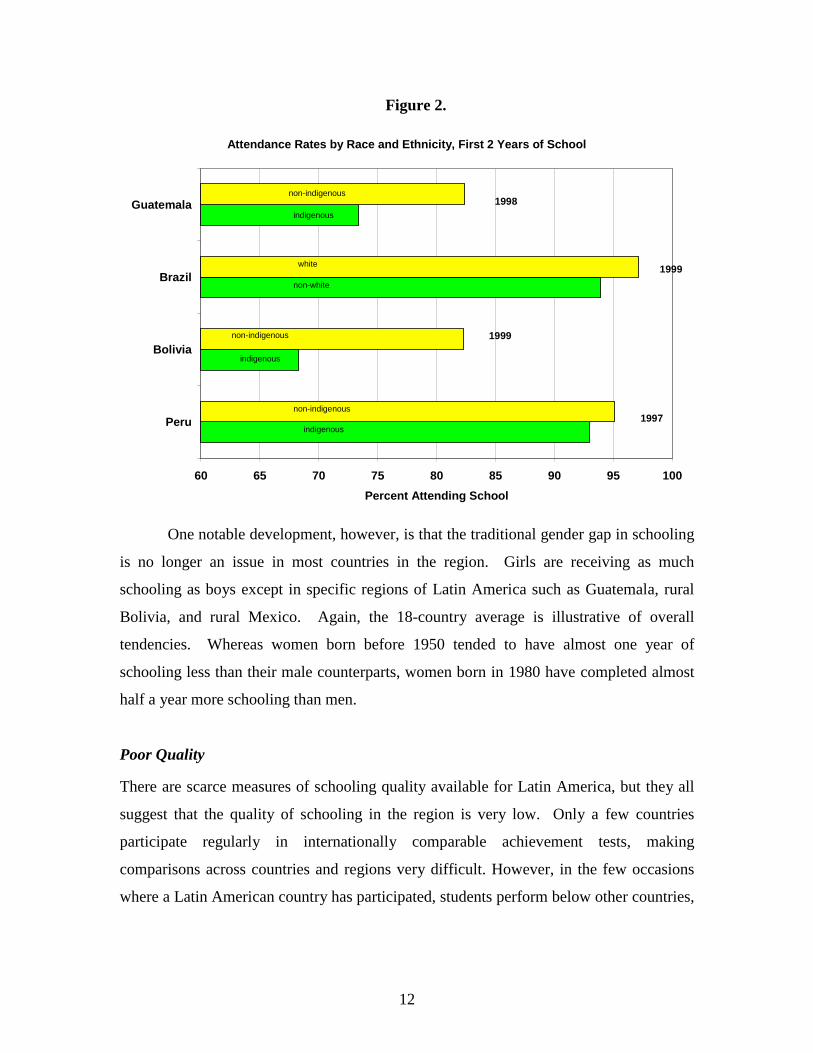
The few available data suggest that inequity persists across racial and ethnic
groups as well. Using information on self-reported race and ethnicity from household
surveys, Figure 2 shows that indigenous children are less likely to be attending school
than non-indigenous children during the first 2 years of primary school. In Brazil, Afro-
Brazilian children are slightly less likely to be attending school than their white
counterparts.7 Although the gaps in attendance are much smaller in Brazil and Peru, they
do not bode well for equity among future workers because differences tend to be
magnified with age as children who start school at later ages are more likely to quit
school earlier.
7 Primary school officially starts at age 6 in Peru and Bolivia, and at age 7 in Brazil and Guatemala. TheAfro-Brazilian category includes children who were identified by the respondent in the household as“preta” (black) or “parda” (brown).
12
Figure 2.
Attendance Rates by Race and Ethnicity, First 2 Years of School
60 65 70 75 80 85 90 95 100
Peru
Bolivia
Brazil
Guatemala
Percent Attending School
1998
1999
1999
1997
non-indigenous
indigenous
non-white
white
non-indigenous
indigenous
non-indigenous
indigenous
One notable development, however, is that the traditional gender gap in schooling
is no longer an issue in most countries in the region. Girls are receiving as much
schooling as boys except in specific regions of Latin America such as Guatemala, rural
Bolivia, and rural Mexico. Again, the 18-country average is illustrative of overall
tendencies. Whereas women born before 1950 tended to have almost one year of
schooling less than their male counterparts, women born in 1980 have completed almost
half a year more schooling than men.
Poor Quality
There are scarce measures of schooling quality available for Latin America, but they all
suggest that the quality of schooling in the region is very low. Only a few countries
participate regularly in internationally comparable achievement tests, making
comparisons across countries and regions very difficult. However, in the few occasions
where a Latin American country has participated, students perform below other countries,
13
particularly relative to those in East Asia.8 Colombia and Mexico participated in the
International Mathematics and Science Study in 1996. Colombia ranked fortieth out of 41
countries and Mexico refused to release the results. Similarly, Chile participated in the
same test in 1999 and finished thirty-fifth out of 38 countries, below any other
participating Asian, Eastern European and Middle Eastern countries. Moreover, the only
test that so far allows comparing countries within Latin America—although it is not
comparable to other countries outside the region—indicates that most countries would
achieve even lower levels in internationally comparable tests. In 1998, UNESCO’s Latin
office developed the first regionally comparable test in the subjects of Language and
Mathematics.9 The results indicated that Chile was among the best performers in the
region (after Cuba and Argentina in Math scores and after Cuba, Argentina and Brazil in
Language). The Dominican Republic, Venezuela, Honduras and Peru were the lowest
performers in both math and language tests.
Although it is not clear what is causing such failures in education, some culprits
have been identified. They relate to the low level of per-student expenditure in education,
the lack of mechanisms of control and accountability in most education systems,
inadequate pay for teachers, and credit constraints and other barriers that drive parents to
take their children out of school.
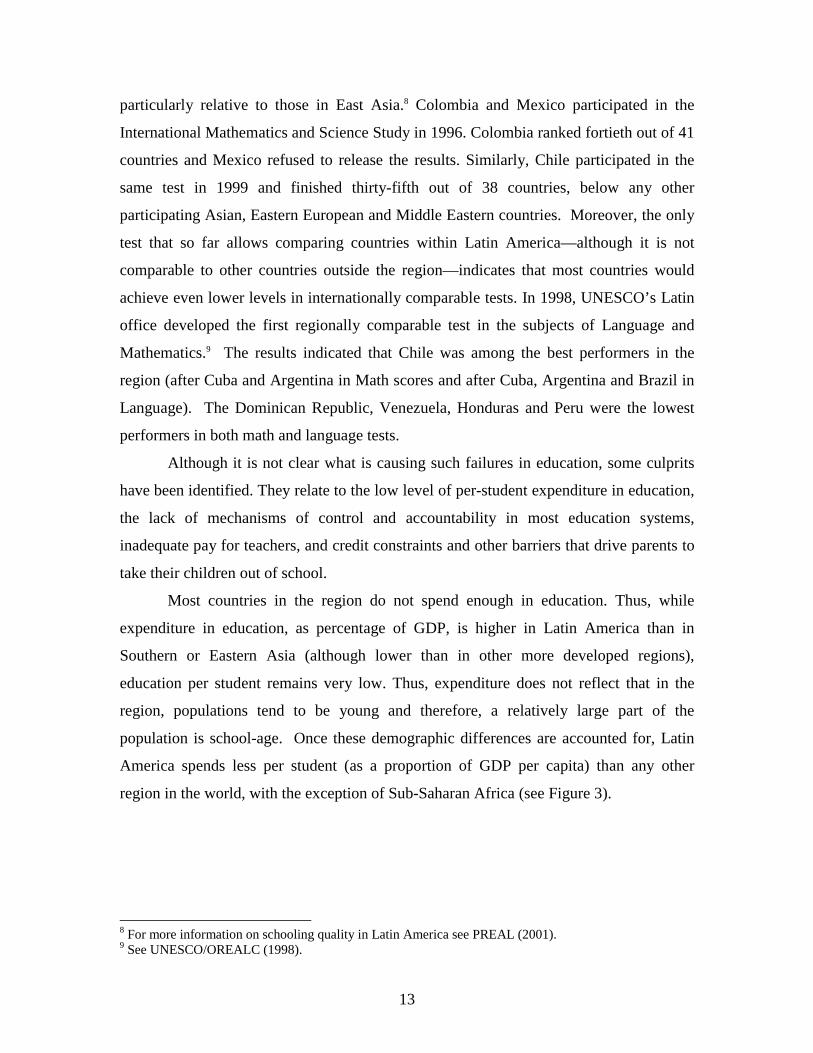
Most countries in the region do not spend enough in education. Thus, while
expenditure in education, as percentage of GDP, is higher in Latin America than in
Southern or Eastern Asia (although lower than in other more developed regions),
education per student remains very low. Thus, expenditure does not reflect that in the
region, populations tend to be young and therefore, a relatively large part of the
population is school-age. Once these demographic differences are accounted for, Latin
America spends less per student (as a proportion of GDP per capita) than any other
region in the world, with the exception of Sub-Saharan Africa (see Figure 3).
8 For more information on schooling quality in Latin America see PREAL (2001).9 See UNESCO/OREALC (1998).
14
Figure 3.
Public expenditure in education per student (as % GNP per capita)
0.0
5.0
10.0
15.0
20.0
25.0
30.0
Sub
-Sah
aran A
frica
Lati
n Ameri
ca/C
aribb
ean
Eas
tern A
sia/O
cean
ia
Lea
st de
velop
ed co
untrie
s
Sou
thern
Asia
Less
deve
loped
regio
ns
Asia
/Oce
ania
More de
velop
ed re
gions
Nort
hern
America
WORLD TOTAL
Arab
States
Euro
pe
Countr
ies in
trans
ition
Source: UNESCO
Second, educational systems lack mechanisms of control and accountability at all
levels. In many countries, education authorities do not have the mechanisms and
technological systems to collect relevant information regarding number of schools,
number of students per school, teachers per school, projected needs in each geographical
area, etc. Moreover, there are very few built-in incentives to produce high-quality
teaching or, in some instances, to even show up for work. For example, while teachers
are (informally) evaluated by students, parents and school directors, pay and other
incentives are usually determined at the Ministry of Education or local Education
Secretary level. Teachers’ performance (or even attendance) is hardly monitored, and
when it is, there are no premia or penalties associated with performance. In addition, in
most cases school budgets are directly allocated by the government without leaving much
scope for directors, parents or teachers to allocate resources in ways that are conducive to
better education outcomes. Moreover, since resources are allocated independently of
school outcomes (generally as a function of the number of teachers) there is no positive
reinforcement or negative feedback associated with school outcomes. Finally, all
15
countries lack a set of standards that clearly define what should be known at each school
level and what constitutes excellent, average and mediocre performance.
Teachers are also victims of poor educational systems. In many countries they
finish formal training without the required skills. In others, people without the required
qualifications are appointed as teachers. Often, when teachers are administered the same
tests given to their students, they achieve only slightly higher grades. Although this is not
the case in all countries, low teacher pay remains a problem. Even so, teachers’ wages
account for most of education budgets; investments in textbooks, computers and other
education inputs remain very low.
Finally, poor and disadvantaged families face important financial constraints that
force them to take children out of school. Even if they realize the market value and the
importance of education, they need the extra income (or help) brought by the work of
their children.
4. How Fast Can Education be Expanded?
Since measures that track average years of schooling for the adult population change very
slowly because only a small part of the population changes their schooling between
periods, it is instructive to examine educational progress across generations using
individual records from household survey data. Table 2 contains information for 18
countries in LAC and four non-LAC countries. The evolution of educational attainment
across birth cohorts indicates that no country grew faster than 2 years across decades.
For example, persons born in 1975 in Venezuela had on average 9 years of schooling,
whereas the generation born a decade before in 1965 had an average of 8.6 years of
education. For the region as a whole, between 1955-1965 the increase in schooling was
less than one additional year per decade. Indeed, educational progress has slowed to
almost half a year per decade for those born from 1965-1975. Within LAC, Peru, Bolivia,
Ecuador, El Salvador and the Dominican Republic have progressed at the fastest rate over
cohorts born from 1955-1975, at a rate of 1.2 years per decade. Although these patterns
are discouraging, it is important to acknowledge that while East Asian countries
progressed faster, the maximum increase observed across a decade is under 2 years of

16
schooling. This suggests that changing the distribution of education across a 10-year
period is a fundamentally difficult endeavor.
Table 2. Mean Years of Completed Schooling by Birth Cohorts(Three year moving averages.)
Born in Born in Born in Born in Born in Change Change ChangeSurvey 1935 1945 1955 1965 1975 1955-1965 1965 to 1975 1935 to 1975
Argentina * 1998 8.16 9.03 9.96 10.55 11.02 0.59 0.47 2.86Bolivia 1999 3.79 5.52 6.24 7.45 9.07 1.20 1.62 5.27Brazil 1999 3.36 4.56 6.14 6.97 7.43 0.84 0.45 4.07Chile 1998 6.80 8.18 9.83 10.70 11.46 0.87 0.76 4.66
Colombia 1999 3.99 5.46 6.99 7.75 8.59 0.76 0.83 4.59Costa Rica 1998 5.34 6.08 8.13 8.41 8.45 0.28 0.04 3.10
Dominican Rep. 1996 4.17 5.59 7.36 8.73 8.97 1.38 0.24 4.81Ecuador 1998 4.35 6.14 7.99 9.33 9.41 1.33 0.08 5.06
Guatemala 1998 2.23 3.27 3.94 4.65 5.66 0.71 1.01 3.44Honduras 1999 2.17 3.30 4.66 5.86 6.29 1.20 0.43 4.12
Mexico 1998 4.26 5.30 6.87 8.29 9.03 1.41 0.75 4.77Nicaragua 1998 2.35 3.21 5.30 5.92 6.17 0.62 0.24 3.82
Panama 1999 6.74 8.10 9.45 10.08 10.49 0.63 0.41 3.75Peru 2000 5.65 7.44 8.58 9.54 10.92 0.96 1.39 5.28
Paraguay 1998 3.86 5.12 6.35 7.72 7.89 1.37 0.17 4.03El Salvador 1998 3.01 3.79 5.73 7.02 7.76 1.29 0.74 4.75
Uruguay * 1998 6.86 8.24 9.72 10.36 10.47 0.64 0.10 3.60Venezuela 1999 4.66 6.64 7.96 8.59 8.95 0.62 0.36 4.28
LAC Average circa 198 4.54 5.83 7.29 8.22 8.78 0.93 0.56 4.24
Taiwan 1996 5.31 7.73 9.94 11.75 12.55 1.81 0.80 7.24Thailand 1998 3.81 4.94 5.72 6.75 8.29 1.03 1.54 4.48
USA 1998 12.22 13.05 13.33 13.19 12.80 -0.14 -0.39 0.58Korea 1997 6.62 8.68 10.26 11.63 12 + 1.37 na 5.38 **
Source: Author's calculations for household survey data. Data for Korea was taken from UNESCO Statistical Yearbook, 1997.* Surveys cover urban areas only.** The mean years for cohorts born in 1975 was not available. 5.38 is the increase in mean schooling across cohorts born in 1935 to 1970.
5. Quantifying the Effect of Education on Poverty
What if one does not accept the maximum observed increase in schooling in East Asia as
a natural limit for improvements in LAC? If the region managed to make significant
changes in schooling within a decade, how might productivity be expected to change?
What is the expected reduction in the share of workers with low wages, or “poor”
workers? In Duryea and Pagés (2001) we examine this question by estimating the
expected changes in wages associated with changes in education. In this section we
summarize the main findings and conclusions and refer the reader to our technical paper
for additional information.
Economists tend to associate wages with productivity. This is because standard
economic theory predicts that in sufficiently competitive labor markets, workers’ wages
will be equal to workers’ contribution to productivity. We therefore refer interchangeably
17
to workers’ earnings and workers’ productivities. To assess how changes in education
affect productivity and, in particular, the share of workers that have very low incomes
(and therefore are expected to belong to poor households in per-capita income terms) we
define a productivity threshold that can be compared across countries. We consider a
worker to have “low productivity” if he/she earns less than one dollar per hour in his
primary job.10 The one-dollar threshold has been adjusted in each country to reflect
differences in the cost of living by adjusting for purchasing power parity (PPP). We use
this definition of “low productivity” because of its simplicity and because it is
meaningfully related to the moderate poverty measure.11
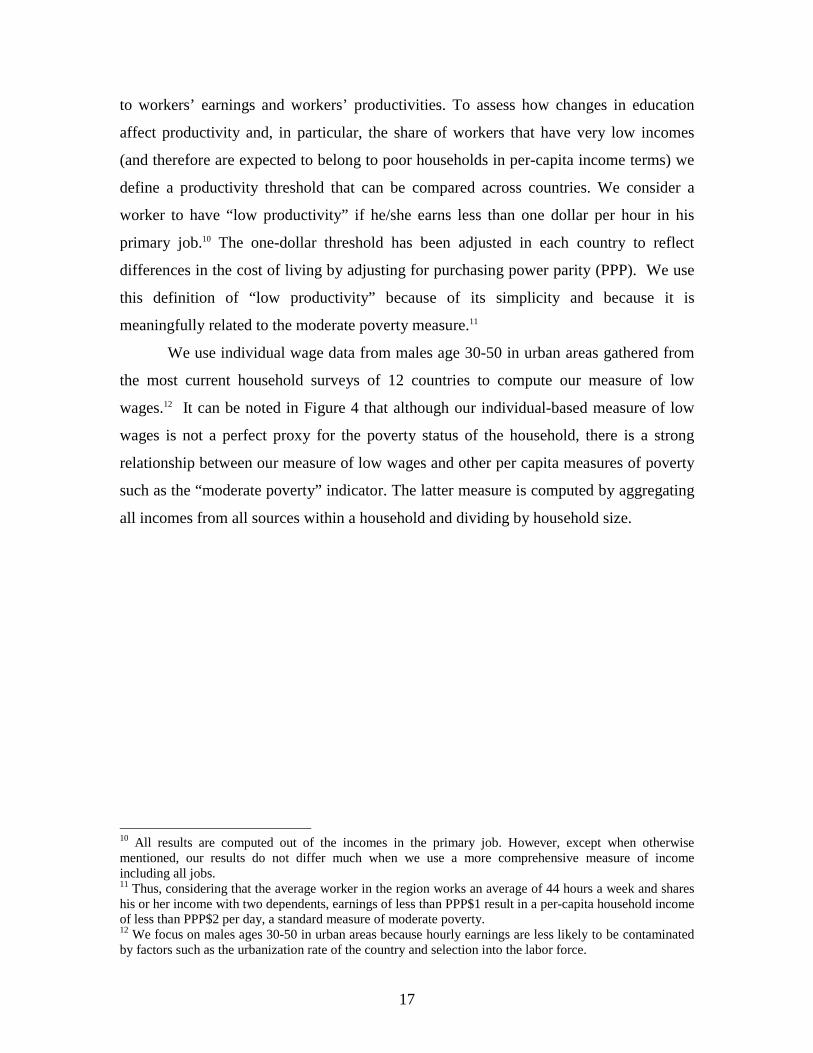
We use individual wage data from males age 30-50 in urban areas gathered from
the most current household surveys of 12 countries to compute our measure of low
wages.12 It can be noted in Figure 4 that although our individual-based measure of low
wages is not a perfect proxy for the poverty status of the household, there is a strong
relationship between our measure of low wages and other per capita measures of poverty
such as the “moderate poverty” indicator. The latter measure is computed by aggregating
all incomes from all sources within a household and dividing by household size.
10 All results are computed out of the incomes in the primary job. However, except when otherwisementioned, our results do not differ much when we use a more comprehensive measure of incomeincluding all jobs.11 Thus, considering that the average worker in the region works an average of 44 hours a week and shareshis or her income with two dependents, earnings of less than PPP$1 result in a per-capita household incomeof less than PPP$2 per day, a standard measure of moderate poverty.12 We focus on males ages 30-50 in urban areas because hourly earnings are less likely to be contaminatedby factors such as the urbanization rate of the country and selection into the labor force.
18
Figure 4.
0
10
20
30
40
50
60
70
80 M
oder
ate
Pove
rty
10 20 30 40 50 60 70 % low paid workers
ARG
BOL
BRA
CHLCRI
HND
MEX
NIC
PAN
PERSLV
URY
Mod. Poverty and % of low paid workers
Correlation coeff: 0.53
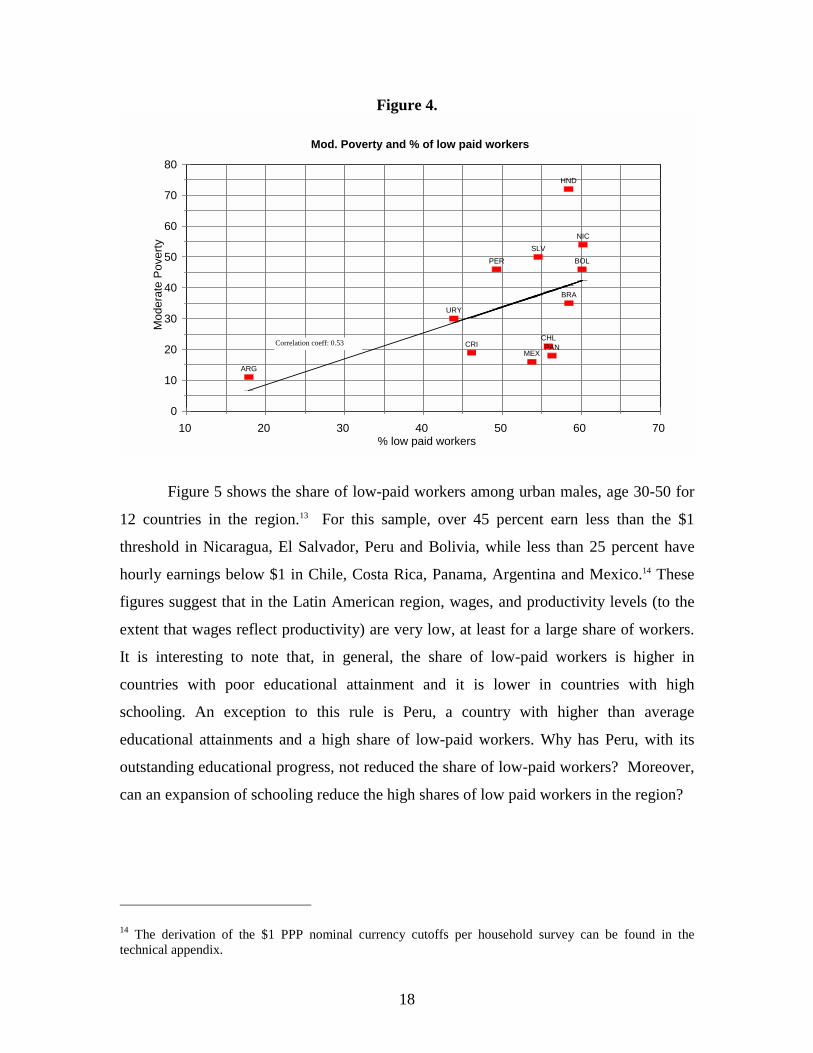
Figure 5 shows the share of low-paid workers among urban males, age 30-50 for
12 countries in the region.13 For this sample, over 45 percent earn less than the $1
threshold in Nicaragua, El Salvador, Peru and Bolivia, while less than 25 percent have
hourly earnings below $1 in Chile, Costa Rica, Panama, Argentina and Mexico.14 These
figures suggest that in the Latin American region, wages, and productivity levels (to the
extent that wages reflect productivity) are very low, at least for a large share of workers.
It is interesting to note that, in general, the share of low-paid workers is higher in
countries with poor educational attainment and it is lower in countries with high
schooling. An exception to this rule is Peru, a country with higher than average
educational attainments and a high share of low-paid workers. Why has Peru, with its
outstanding educational progress, not reduced the share of low-paid workers? Moreover,
can an expansion of schooling reduce the high shares of low paid workers in the region?
14 The derivation of the $1 PPP nominal currency cutoffs per household survey can be found in thetechnical appendix.
19
Figure 5.
Percentage of Workers in Sample Earning below $1 an hour /ppp
0 10 20 30 40 50 60
Mexico
Argentina
Panama
Costa Rica
Chile
Uruguay
Brazil
Guatemala
Bolivia
Peru
El Salvador
Nicaragua
Percentage Earning "low wages"
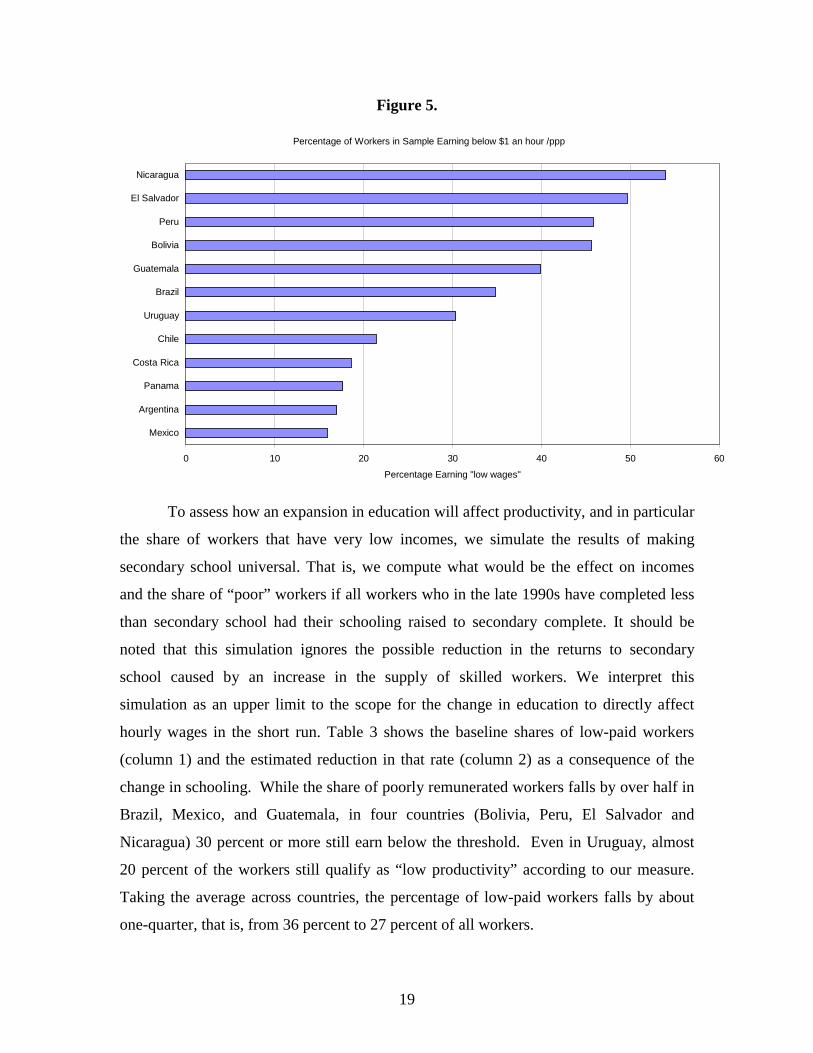
To assess how an expansion in education will affect productivity, and in particular
the share of workers that have very low incomes, we simulate the results of making
secondary school universal. That is, we compute what would be the effect on incomes
and the share of “poor” workers if all workers who in the late 1990s have completed less
than secondary school had their schooling raised to secondary complete. It should be
noted that this simulation ignores the possible reduction in the returns to secondary
school caused by an increase in the supply of skilled workers. We interpret this
simulation as an upper limit to the scope for the change in education to directly affect
hourly wages in the short run. Table 3 shows the baseline shares of low-paid workers
(column 1) and the estimated reduction in that rate (column 2) as a consequence of the
change in schooling. While the share of poorly remunerated workers falls by over half in
Brazil, Mexico, and Guatemala, in four countries (Bolivia, Peru, El Salvador and
Nicaragua) 30 percent or more still earn below the threshold. Even in Uruguay, almost
20 percent of the workers still qualify as “low productivity” according to our measure.
Taking the average across countries, the percentage of low-paid workers falls by about
one-quarter, that is, from 36 percent to 27 percent of all workers.
20
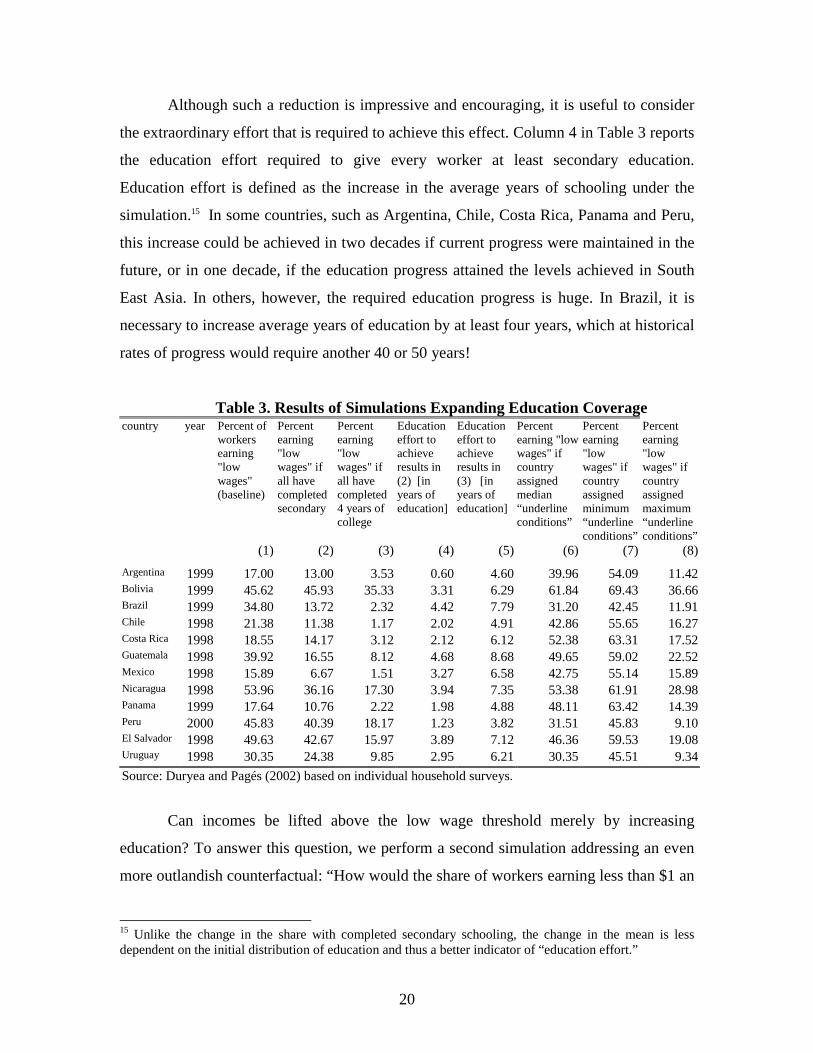
Although such a reduction is impressive and encouraging, it is useful to consider
the extraordinary effort that is required to achieve this effect. Column 4 in Table 3 reports
the education effort required to give every worker at least secondary education.
Education effort is defined as the increase in the average years of schooling under the
simulation.15 In some countries, such as Argentina, Chile, Costa Rica, Panama and Peru,
this increase could be achieved in two decades if current progress were maintained in the
future, or in one decade, if the education progress attained the levels achieved in South
East Asia. In others, however, the required education progress is huge. In Brazil, it is
necessary to increase average years of education by at least four years, which at historical
rates of progress would require another 40 or 50 years!
Table 3. Results of Simulations Expanding Education Coveragecountry year Percent of
workersearning"lowwages"(baseline)
Percentearning"lowwages" ifall havecompletedsecondary
Percentearning"lowwages" ifall havecompleted4 years ofcollege
Educationeffort toachieveresults in(2) [inyears ofeducation]
Educationeffort toachieveresults in(3) [inyears ofeducation]
Percentearning "lowwages" ifcountryassignedmedian“underlineconditions”
Percentearning"lowwages" ifcountryassignedminimum“underlineconditions”
Percentearning"lowwages" ifcountryassignedmaximum“underlineconditions”
(1) (2) (3) (4) (5) (6) (7) (8)Argentina 1999 17.00 13.00 3.53 0.60 4.60 39.96 54.09 11.42Bolivia 1999 45.62 45.93 35.33 3.31 6.29 61.84 69.43 36.66Brazil 1999 34.80 13.72 2.32 4.42 7.79 31.20 42.45 11.91Chile 1998 21.38 11.38 1.17 2.02 4.91 42.86 55.65 16.27Costa Rica 1998 18.55 14.17 3.12 2.12 6.12 52.38 63.31 17.52Guatemala 1998 39.92 16.55 8.12 4.68 8.68 49.65 59.02 22.52Mexico 1998 15.89 6.67 1.51 3.27 6.58 42.75 55.14 15.89Nicaragua 1998 53.96 36.16 17.30 3.94 7.35 53.38 61.91 28.98Panama 1999 17.64 10.76 2.22 1.98 4.88 48.11 63.42 14.39Peru 2000 45.83 40.39 18.17 1.23 3.82 31.51 45.83 9.10El Salvador 1998 49.63 42.67 15.97 3.89 7.12 46.36 59.53 19.08Uruguay 1998 30.35 24.38 9.85 2.95 6.21 30.35 45.51 9.34Source: Duryea and Pagés (2002) based on individual household surveys.
Can incomes be lifted above the low wage threshold merely by increasing
education? To answer this question, we perform a second simulation addressing an even
more outlandish counterfactual: “How would the share of workers earning less than $1 an
15 Unlike the change in the share with completed secondary schooling, the change in the mean is lessdependent on the initial distribution of education and thus a better indicator of “education effort.”

21
hour change if all workers with less than four years of tertiary schooling were to have
their schooling raised to that level?” Column 3 of Table 3 reports the results of this
exercise. Overall, the percentage of poorly remunerated workers falls by more than 20
percentage points, from 36 percent to 13 percent. Nonetheless, even in this partial
equilibrium simulation, when the congestion effects of such a dramatic expansion in
education are not considered, more than 15 percent of the workers earn wages below the
poverty threshold in Bolivia, Peru, El Salvador, and Nicaragua.16
What Limits the Effect of Education?
The results above highlight the fact that a tangible expansion in education can bring
increases in productivity and earnings, as well as reductions in poverty. However, they
also show that expansions in education by themselves will not lift everyone’s
productivity and earnings above poverty levels. It is important to understand what it is
that limits the effect of education, not only because it allows more realistic assessments
of the impact of education, but also because it yields interesting insights about how
expansions in education can be made more effective.
In order for expansions in education to have a large effect on individual incomes,
the effect of every additional year of education on wages (the so-called returns to
education) has to be large. Despite the widespread failures in the quality of education
and the poor results obtained in internationally comparable exams, in Latin America the
percentage increase in earnings associated with one extra year of primary, secondary or
tertiary education is quite high. Table 4 presents the estimated returns to one year of
education across countries.17 In our sample of countries, the median return to one year of
primary schooling is 7 percent, while the median return to secondary and tertiary
schooling are even higher (9 percent and 16 percent, respectively).18 By comparison,
Krueger and Lindahl (2000) report average returns to schooling across all schooling
16 Our results are consistent with those found by R. Paes de Barros as presented for Central America. Usinghighly sophisticated microsimulations, he asserts that in Central America the quality of the job is moreimportant than education or experience in explaining the high rates of poverty in Honduras, Guatemala andEl Salvador relative to the low rates found in Costa Rica.17 See Duryea and Pagés (2001) for a description of the methodology used to estimate returns to schoolingin Latin America.18 Properly speaking, these coefficients do not measure returns but wage effects, since in order to capturereturns to education we should subtract foregone earnings and other costs of education.
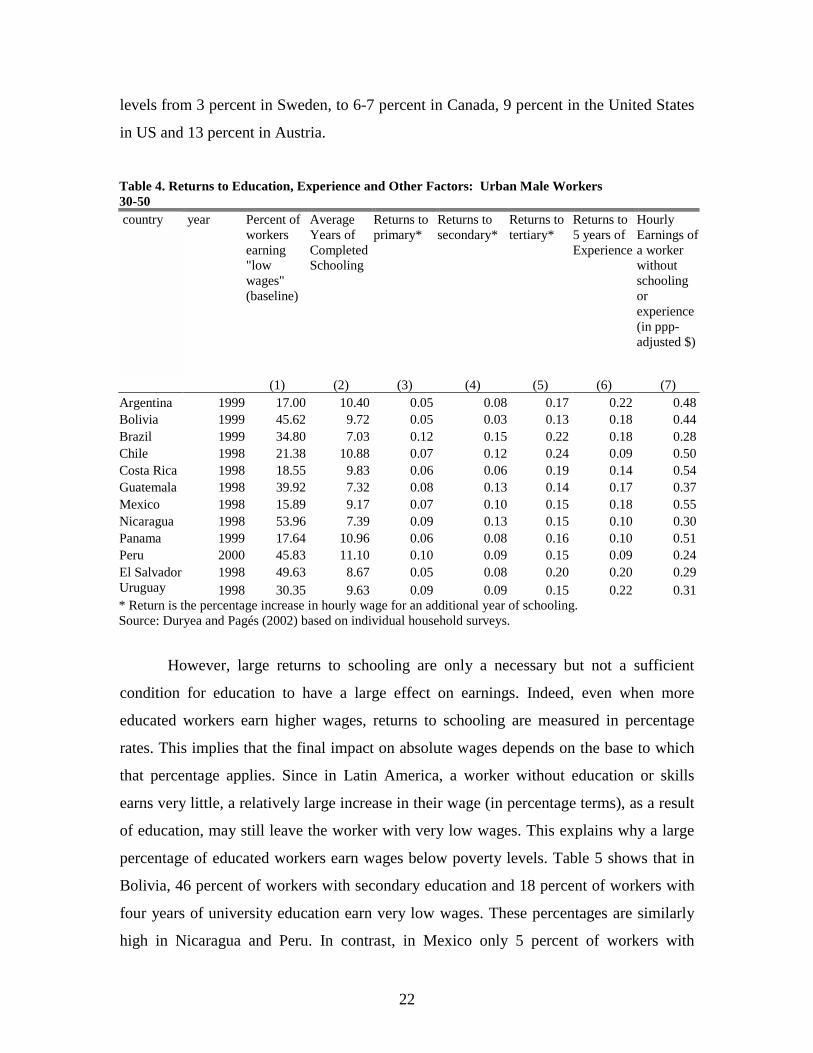
22
levels from 3 percent in Sweden, to 6-7 percent in Canada, 9 percent in the United States
in US and 13 percent in Austria.
Table 4. Returns to Education, Experience and Other Factors: Urban Male Workers30-50 country year Percent of
workersearning"lowwages"(baseline)
AverageYears ofCompletedSchooling
Returns toprimary*
Returns tosecondary*
Returns totertiary*
Returns to5 years ofExperience
HourlyEarnings ofa workerwithoutschoolingorexperience(in ppp-adjusted $)
(1) (2) (3) (4) (5) (6) (7)Argentina 1999 17.00 10.40 0.05 0.08 0.17 0.22 0.48Bolivia 1999 45.62 9.72 0.05 0.03 0.13 0.18 0.44Brazil 1999 34.80 7.03 0.12 0.15 0.22 0.18 0.28Chile 1998 21.38 10.88 0.07 0.12 0.24 0.09 0.50Costa Rica 1998 18.55 9.83 0.06 0.06 0.19 0.14 0.54Guatemala 1998 39.92 7.32 0.08 0.13 0.14 0.17 0.37Mexico 1998 15.89 9.17 0.07 0.10 0.15 0.18 0.55Nicaragua 1998 53.96 7.39 0.09 0.13 0.15 0.10 0.30Panama 1999 17.64 10.96 0.06 0.08 0.16 0.10 0.51Peru 2000 45.83 11.10 0.10 0.09 0.15 0.09 0.24El Salvador 1998 49.63 8.67 0.05 0.08 0.20 0.20 0.29Uruguay 1998 30.35 9.63 0.09 0.09 0.15 0.22 0.31* Return is the percentage increase in hourly wage for an additional year of schooling.Source: Duryea and Pagés (2002) based on individual household surveys.
However, large returns to schooling are only a necessary but not a sufficient
condition for education to have a large effect on earnings. Indeed, even when more
educated workers earn higher wages, returns to schooling are measured in percentage
rates. This implies that the final impact on absolute wages depends on the base to which
that percentage applies. Since in Latin America, a worker without education or skills
earns very little, a relatively large increase in their wage (in percentage terms), as a result
of education, may still leave the worker with very low wages. This explains why a large
percentage of educated workers earn wages below poverty levels. Table 5 shows that in
Bolivia, 46 percent of workers with secondary education and 18 percent of workers with
four years of university education earn very low wages. These percentages are similarly
high in Nicaragua and Peru. In contrast, in Mexico only 5 percent of workers with
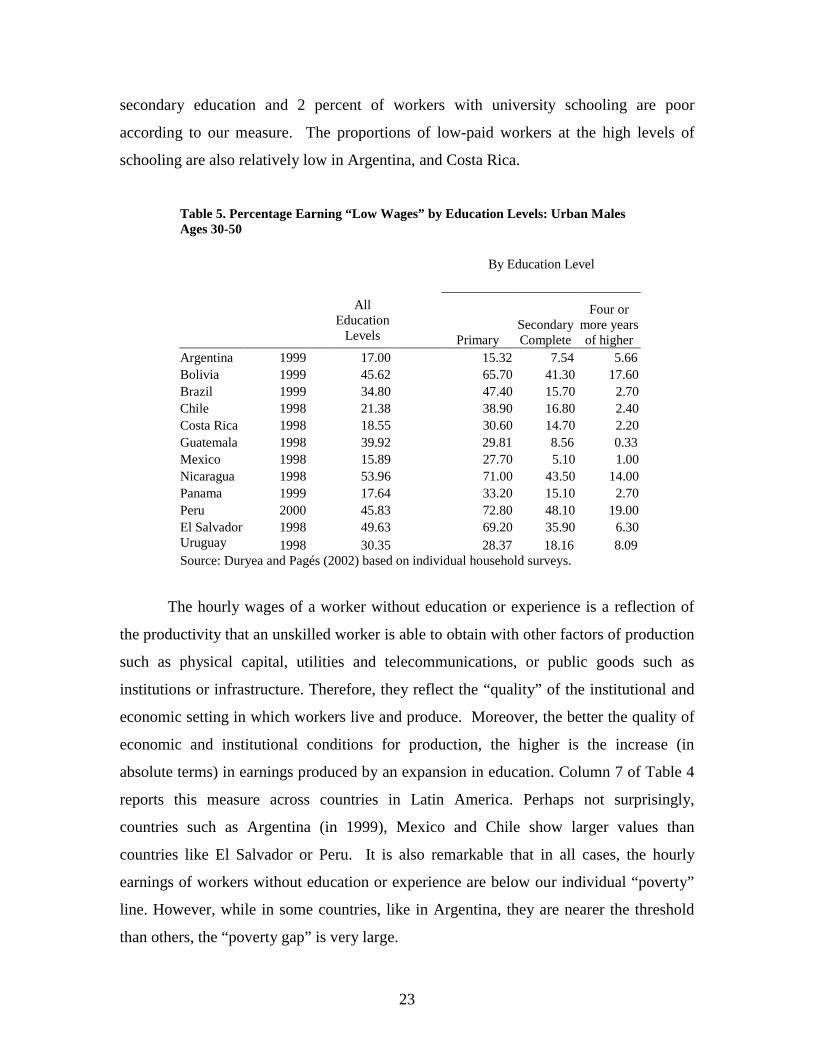
23
secondary education and 2 percent of workers with university schooling are poor
according to our measure. The proportions of low-paid workers at the high levels of
schooling are also relatively low in Argentina, and Costa Rica.
Table 5. Percentage Earning “Low Wages” by Education Levels: Urban MalesAges 30-50
By Education Level
AllEducation
Levels PrimarySecondaryComplete
Four ormore yearsof higher
Argentina 1999 17.00 15.32 7.54 5.66Bolivia 1999 45.62 65.70 41.30 17.60Brazil 1999 34.80 47.40 15.70 2.70Chile 1998 21.38 38.90 16.80 2.40Costa Rica 1998 18.55 30.60 14.70 2.20Guatemala 1998 39.92 29.81 8.56 0.33Mexico 1998 15.89 27.70 5.10 1.00Nicaragua 1998 53.96 71.00 43.50 14.00Panama 1999 17.64 33.20 15.10 2.70Peru 2000 45.83 72.80 48.10 19.00El Salvador 1998 49.63 69.20 35.90 6.30Uruguay 1998 30.35 28.37 18.16 8.09Source: Duryea and Pagés (2002) based on individual household surveys.
The hourly wages of a worker without education or experience is a reflection of
the productivity that an unskilled worker is able to obtain with other factors of production
such as physical capital, utilities and telecommunications, or public goods such as
institutions or infrastructure. Therefore, they reflect the “quality” of the institutional and
economic setting in which workers live and produce. Moreover, the better the quality of
economic and institutional conditions for production, the higher is the increase (in
absolute terms) in earnings produced by an expansion in education. Column 7 of Table 4
reports this measure across countries in Latin America. Perhaps not surprisingly,
countries such as Argentina (in 1999), Mexico and Chile show larger values than
countries like El Salvador or Peru. It is also remarkable that in all cases, the hourly
earnings of workers without education or experience are below our individual “poverty”
line. However, while in some countries, like in Argentina, they are nearer the threshold
than others, the “poverty gap” is very large.
24
While our simulations have considered the impact of an increase in the quantity of
schooling, we have made no reference to the effect of schooling quality. What is the role
of improvements in the quality of education in increasing earnings and reducing poverty?
Quantifying the scope for improvements in the quality of schooling is an extremely
challenging task. In the absence of a standardized measure, attempts to measure the
impact of quality of schooling on wages typically consider a reduction in the pupil-
student class size, an increase in the education of teachers or an increase in expenditures
on education. Behrman and Birdsall’s seminal work (1983) finds that an increase in the
schooling of teachers by region in Brazil increases the return to schooling. For South
Africa, Case and Yogo find that a reduction in class-size by five pupils is found to
increase returns to schooling by 1 percent. In their synthesis of the literature on the
quality of schooling, Card and Krueger (1996), find that reductions in class size can
increase returns by 50 percent. The range of quality found in the region suggests that
improving quality can hasten increases in wages but again in a modest manner. For
example, returns to secondary school in Chile are only 25 percent higher than in Peru,
even though these countries are at the two extremes of the range of results in the
UNESCO exams. It is clear from these estimates that while better quality will deliver
higher earnings, the magnitudes involved will not suffice to lift a large share of workers
out of poverty.
Job Training
Human capital policies can also take the form of job training. However, there is an
intense discussion on whether public training policies can increase earnings and reduce
poverty in the Region. This is because (1) around the world there is little evidence that
public training programs translate into large returns, and (2) Latin American training
policies have been particularly ineffective. Although there are interesting innovations in
Latin America that are worth examining and that can bring interesting results, the
fundamental problem is that it is very difficult to remedy educational shortcomings with
short-term, vocational training. The returns are likely to be small and probably the best
option is to bring adults back to school.
25
A recent study by the IDB (2001), shows that a significant percentage of firms
provide on-the-job training for their workers. This is particularly true for firms that are
undergoing major investments or technological changes. However, the relevant questions
pertain to whether disadvantaged workers benefit from these investments and whether
on-the-job training can remedy learning deficits. The IDB study shows that in all
countries, technicians, supervisors, and skilled workers are much more likely to receive
on-the-job training than unskilled workers, suggesting that investing in such workers
commands higher returns. These results also suggest that employer-financed, on-the-job
training is not likely to do much to improve the productivity of low skilled workers. The
question is whether public policy in the region can perform that role.
Evaluations of public training programs suggest that for workers without basic
skills, job training programs are not cost-effective. Returns to job training programs tend
to be particularly low (of the order of one-fifth of returns to schooling) for disadvantaged
male workers, and somewhat higher for women. Instead, studies tend to find that the
returns to formal adult education tend to be similar to the returns to young-age schooling
(Krueger and Lindahl, 2000). These findings suggest that rather than providing remedial
short-term training to highly unskilled workers, resources can be better allocated by
extending adults’ formal education. They also suggest that since formal education and
job training tend to be complementary rather than substitutive, workers that benefit from
extended adult education will also benefit from more employer-financed job training.
In Latin America, training policy has been channeled through public training
institutes funded by a training levy or tax (1-2 percent of payroll) and administered by the
government with the participation of employers and workers. Vocational
education/training programs began in Brazil in the 1940s, and then expanded in the late
1950s and 1960s in Colombia, Venezuela, Peru, Costa Rica, Chile and Ecuador. During
the 1970s a new generation of these training institutions emerged in Paraguay, Honduras,
Brazil, Guatemala and Panama. With a few exceptions, public training systems have
suffered from the same lack of control and accountability mechanisms as educational
systems. Operated as public monopolies, the systems have lacked discipline to manage
human resources. Instructors have been poorly trained and poorly paid, and they have had
limited experience in the private sector. Administrative costs have consumed almost the
26
totality of operational budgets while investments have been kept to a minimum. In
addition, public training systems have lacked incentives to adapt the subjects and
contents of their courses to ever-changing labor market needs. Contents have been
excessively formal and classroom-based, without sufficient firm-based experience.
Moreover, middle or high-skilled workers have been more likely to attend than low-
skilled workers. In consequence, the public training institute model does not appear to
deliver high quality training to unskilled workers. An evaluation for Colombia found that
the impact of training on wages is lower for trainees who attended public relative to
private institutions, although the difference in returns could be attributed to the higher
motivation and higher learning abilities of private sector trainees.19
In summary, although job training might be an interesting policy option for
middle and high-skilled workers, the evidence suggests that extensive investments in
training the unskilled would have only a limited role in increasing earnings and reducing
poverty.
6. What Lies Ahead
Low productivity is the main source of poverty and low competitiveness in Latin
America (IDB, 2001) In order to speed up productivity growth, public policy needs to
address Latin American educational shortcomings. However, a policy based solely on
education investments is not likely to reduce poverty sufficiently. To boost the effects of
education reforms, Latin American policymakers should also promote an economic and
institutional environment conducive to productivity growth.
Expanding the Quality, Quantity and Equity of Schooling in the Region
If Latin American countries want to overcome their educational deficits, public
expenditure per student should rise. Increasing the amount of resources that goes to
education is already a priority in the countries that are under the HIPIC initiative, but it
should be made a priority in less indebted countries as well.20 In addition, the opportunity
19 See the evaluation by Medina and Núñez (2000).20 The HIPIC is an initiative of the International Financial Institutions to reduce the external debt of highlyindebted and poor countries. By means of this initiative countries agree to expend a large share of theforegone debt service in education and other social expenditure.
27
brought about by more favorable demographic conditions should not be wasted. Thus, as
the population ages and the school-age population declines relative to adult population, it
will be possible for per student investments to increase even if total expenditure in
education remains constant. These additional resources per-capita can finance higher pay
for teachers and higher investments in books, computers and other educational inputs.
However, increasing per-student expenditure is not likely to bring substantial
gains in education without parallel reforms aimed at improving the control and
accountability mechanisms in educational systems. For this to occur, it is necessary to
improve management within the education administration. It is also necessary to transfer
authority and resources from the Ministries and local education departments to school
directors and parents. This transfer will make possible that important decisions regarding
teacher recruitment, teacher evaluation and resource allocation can progressively be made
at the school level. At the same time, it is necessary to implement learning standards and
to monitor the performance of schools and students relative to those standards and
relative to other countries. Finally, schools should be made accountable. Transfers to
schools should be made dependent both on the characteristics of the students and
communities they serve, awarding more resources to poorer and disadvantaged
communities, and on their progress in achieving educational standards. Lastly, demand-
side constraints should be addressed as well with programs that provide financial relief to
poor families with children in school age.
Not all countries start from square one. Indeed, there are a host of interesting new
experiences in the region. As far as improving control and accountability mechanisms,
some countries, particularly in Central America, have experimented with giving more
autonomy to schools, although in most cases these efforts have only applied to new or
rural schools (PREAL, 2001). This is the case of the EDUCO schools in El Salvador, or
the PROHECO initiative in Honduras.21 In other countries, such as Nicaragua, school
autonomy is being extended at the national level. Although it is too soon for conclusive
results, the available evidence shows that giving more authority to parents and school
directors increases teachers attendance and punctuality, as does interaction of teachers
21 For a description of the nature and the results of different experiences of school autonomy in LatinAmerica see Espinola (2000). For a description of the PROHECO system see Reyes and Meza (2000).
28
with parents. It also suggests that school autonomy increases learning as measured by
scores in math and language exams. There are also interesting experiences in addressing
demand-side constraints. Conditional cash-transfer programs targeted to the poorest
families are showing encouraging results. This is the case of the PROGRESA program
in Mexico or the Bolsa-Scola program in Brazil, where low-income families receive a
cash transfer in exchange for investments in health and keeping children in school.
Another promising area for policy is adult education. Although providing adult
education has been a low priority in most countries, research suggests that bringing adults
back to school can be an effective policy for increasing productivity (particularly when
compared with the results of public job training targeted to unskilled workers). Latin
American governments should devise ways to bring adults back to school. Possible
measures include issuing tax credits to employers that provide the time or the resources
for employees to attend formal school, or giving tax relief to adult workers who enroll to
finish formal schooling.
Improving the Quality of the Economic and Institutional Environment
While expanding the coverage and improving the quality and equity of education are
important development goals, the simulations reported in Section 4 make clear the
shortcomings of productivity-growth and poverty-reducing strategies that are based
solely on human capital development. Thus while education can increase the earnings of
a person relative to the earning of someone who does not have education, educated
workers will not be able to productively use their skills if the economic and institutional
environment in which they live and work is not sufficiently “fertile.” This is why without
simultaneous investments in the institutional and economic environment, the productivity
and earnings of a large share of the population will not be lifted above poverty levels any
time soon.
To assess the importance of these other environmental factors, we report the result
of two additional simulations. First, we ask how much would the share of workers with
very low earnings decline if countries could instantaneously achieve the economic and
institutional conditions of Mexico—the country with the best “underlying” conditions in
the sample—as measured by the earnings of a person without education or labor market
29
experience. Second, we compute what would be the share of low-paid workers in
countries such as Argentina or Mexico if they were to have the quality of the economic
and institutional conditions of Peru—the lowest in our sample.
Columns 7-8 in Table 3 show the results of changing the quality of the economic
environment. In column 7 we report the percentage of low-paid jobs that would result if
workers in all countries worked with the economic and institutional conditions of Peru.
The results are quite remarkable. Under these conditions, the percentage of low-paid jobs
in countries like Argentina, Mexico or Panama would increase to more than 50 percent.
This comparison illustrates that Peru has a relatively lower share of low-paid workers,
given its underlying conditions, as a consequence of its high investment in education. In
contrast, the share of poor workers would decline substantially in most countries if they
had the underlying conditions of Mexico. Peru’s share of low-paid jobs would drop
dramatically, from 46 percent to 9 percent, while El Salvador’s share would decline from
49 percent to 20 percent (Table 3: Column 8).
The results above demonstrate that improving the economic and institutional
environment can bring substantial increases in productivity and reductions in poverty.
Moreover, expansions in education will have larger effects on income when they occur in
countries with better underlying economic and institutional conditions. The relevant
question is how countries should go about improving these conditions, and the magnitude
of the effort involved. In Duryea and Pagés (2001), we attempt to answer some of these
questions by examining the statistical relation between the hourly income of a non-
educated worker (that is, our measure of the underlying conditions of a given country)
and different variables that are expected to affect those conditions. Among the variables
we analyze are labor relations and regulations, financial development, degree of
technological innovation, physical infrastructure variables and finally, institutional
variables.
Labor Relations and Regulations
Labor relations and regulations affect productivity in multiple ways. By defining the set
of rules that govern employment, labor relations can be conducive to high motivation,
high effort and high productivity, or instead, promote low moral and poor outcomes. In
30
Latin America, labor market regulations alter labor relations by shifting the balance of
power between employers and employees. In many instances, by banning forms of labor
relations that are not acceptable, government regulations level the playing field and
improve workers’ welfare. In other instances, however, governments simply fuel the fire
between labor and management: by restricting forms of payment that align the objectives
of the firm with the objectives of workers, such as profit or revenue-sharing, or by
interfering in conflict-resolution and being partial to employers or employees. The
available evidence suggests that the quality of labor relations in Latin America is poor.
According to the 2000 Global Competitiveness Report, of the six countries of the region
included in a sample of 47 countries worldwide, two ranked among the countries with the
most hostile labor relations, while the others were at the median or below. Moreover, the
1997 Latinobarómetro, an opinion survey covering the urban areas of 17 countries in the
region, suggests that a wide majority of the respondents mistrust employers and think that
relations between employers and employers are poor. In addition, a large majority of
respondents think that success in life does not depend on hard work, but rather on
connections. Given this state of affairs, employers, employees and governments should
invest in promoting more cooperative and productive labor relations. This could be
achieved by removing legislative constraints to high performance pay schemes,
facilitating permanent venues for dialog between employers and employees and, finally,
by educating managers and workers’ representatives in conflict resolution and
management of human resources.
Financial Development
Despite intense financial liberalization and improvements in financial supervision, access
to capital remains tight in the region. The World Business Environment Survey, an
opinion survey addressed to firms worldwide, suggests that the limited access to capital is
one of the biggest constraints to productivity and growth in Latin America. The available
research suggest that in order to expand access to credit, public policy should concentrate
on creating a stable economic environment, preserve low inflation rates, promote better

31
creditor rights, and expand registry services.22 It should also continue improving the
quality and the independence of financial supervision.
Technological Innovation and Adoption
Growth theory emphasizes the role of new technology adoption and development as the
engine of productivity and growth. However, in Latin America, the rates of technology
innovation and adoption are below the world average (WEF, 2000 and IDB, 2001).
Improving educational attainments in the region will help to boost innovation, which in
turn will foster more productivity. However, promoting an environment conducive to
innovation is also fundamental. This requires clear property rights as well as institutions
and resources to enforce them. It also requires financial institutions specialized in start-
ups and venture capital.
Physical Infrastructure
Poor infrastructure remains a barrier to productivity growth in Latin America. There are
too few roads, and most are in very poor condition, while sea transport is hampered by
the inefficiency of ports (IDB, 2001). Utility prices, particularly electricity and the price
of telephone service, remain high despite intense restructuring and privatization; limited
competition and poor regulation have turned public monopolies into private ones. In the
near future, governments should improve the technical capabilities and the independence
of regulatory agencies. They should also limit the monopoly power of large firms by
further opening the market to competition.
Social Infrastructure
Hall and Jones (1999) denominate the set of institutions, regulations and laws that make
economic transactions possible as “social infrastructure.” Kaufmann et al. (1999)
assemble quantitative measures of social infrastructure in the areas of political stability,
quality of government, quality of the regulatory framework, rule of law, and control of
corruption. These indicators suggest that Latin America ranks significantly lower than
22 See Galindo (2001) and Galindo and Miller (2001) for an assessment of the importance of creditor rightsand credit registries in the supply of credit.
32
OECD and South East Asian countries. Hall and Jones (1999) and Duryea and Pagés
(2001) find these variables to be highly associated with productivity per worker and
earnings. While some of this association may be due to reverse causation—i.e., richer
countries can afford better institutions—there is some evidence of causality running from
institutions to earnings. Therefore, efforts devoted to improve the quality of the
institutional environment in any of these areas can provide large payoffs. As an example,
Duryea and Pagés (2001) report that improving the quality of the Peruvian institutions to
the level achieved in Chile would achieve a reduction in poverty equivalent to that
attained with 2.71 extra years of college education, or 4.3 extra years of secondary
education. This is a remarkable gain since, assuming that education progress continues at
the current rate and returns to education remain constant, achieving this expansion in
education would take between 30 and 45 years!
7. Conclusions
Education progress has been slower in Latin America than in other developing regions.
This has prompted many to single out education as one of the most pervasive barriers to
achieving sustained productivity growth and poverty reductions in the region. However,
we have shown that education, by itself, cannot remedy the productivity deficit in the
region. Thus, the expansion of education should be complemented with policies
addressed to make all workers more productive. Some of the options suggested by our
results are: improving the institutions and government regulations that prevent diversion
of resources from productive uses, motivating workers with schemes that increase their
stakes and their participation in firms’ success, providing a stable and fertile environment
for innovation, and expanding the provision of basic infrastructure.
33
References
Barro, R., and X. Sala-i-Martin. 1995. Economic Growth. New York, United States:
McGraw-Hill.
Behrman, J.R., and N. Birdsall. 1983. “The Quality of Schooling: Quantity Alone is
Misleading.” American Economics Review 73(4): 928-946.
Benhabib, J., and M. Spiegel. “The Role of Human Capital in Economic Development:
Evidence from Aggregate Cross-Country Data.” Journal of Monetary Economics
34: 143-179.
Bils, M., and P. Klenow. 2000. “Does Schooling Cause Growth?” American Economic
Review 90(5): 1160-1183.
Case, A., and M. Yogo. 1999. “Does School Quality Matter: Returns to Education and
the Characteristics of Schools in South Africa.” NBER Working Paper 7399.
Cambridge, United States: National Bureau of Economic Research.
Card, D., and A. Krueger. 1996. “School Resources and Student Outcomes: An Overview
of the Literature and New Evidence from North and South Carolina.” Journal of
Economic Perspectives 10(4): 31-50.
Duryea, S., A. Cox-Edwards and M. Ureta. 2000. “Women in the LAC Labor Market.”
Washington, DC, United States: Inter-American Development Bank.
Mimeographed document.
Duryea, S., and C. Pagés. 2002. “Achieving High Labor Productivity in Latin America: Is
Education Enough?” Washington, DC, United States: Inter-American
Development Bank. Mimeographed document.
Galindo, A. 2001. “Creditor Rights and the Credit Market: Where Do We Stand?”
Research Department Working Paper 448. Washington, DC, United States: Inter-
American Development Bank, Research Department.
Galindo, A., and M. Miller. 2001. “Can Credit Registries Reduce Credit Restraints?
Empirical Evidence on the Role of Credit Registries in Firm Investment
Decisions.” Paper prepared for the seminar “Towards Competitiveness: The
Institutional Path, ” Annual Meetings of the Board of Governors, Inter-American
Development Bank and Inter-American Investment Corporation, Santiago, Chile.
34
Hall, R., and C. Jones. 1999. “Why Do Some Countries Produce So Much More Output
per Worker than Others?” Quarterly Journal of Economics 114(1): 83-116.
Inter-American Development Bank (IDB). 1999. Facing Up to Inequality in Latin
America. Economic and Social Progress Report 1998/99. Washington, DC,
United States: IDB.
----. 2000. Development Beyond Economics. Economic and Social Progress Report 2000.
Washington, DC, United States: IDB.
----. 2001. Competitiveness: The Business of Growth. Economic and Social Progress
Report 2001. Washington, DC, United States: IDB.
Kaufmann, D., A. Kraay and P. Zoido-Lobatón. 1999. “Aggregating Governance
Indicators.” Washington, DC, United States: World Bank. Mimeographed
document.
Krueger, A., and M. Lindahl. 2000. “Education for Growth: Why and For Whom?”
NBER Working Paper No. W7591. Cambridge, United States: National Bureau of
Economic Research.
Latin American Economic Policies. Third Quarter 2000. “Reverse Gender Gaps in
Schooling.” Washington, DC, United States: Inter-American Development Bank,
Research Department.
Pritchett, L. 1996. “Where Has All the Education Gone?” World Bank Policy Research
Department Working Paper 1581. Washington, DC, United States: World Bank.
Mammen, K., and C. Paxson. 2000. “Women’s Work and Economic Development.”
Journal of Economic Perspectives 14(4): 141-64.
Medina, C., and J. Núñez. 2000. “The Impact of Publicly Provided Job Training in
Colombia.” Washington, DC, United States: Inter-American Development Bank.
Mimeographed document.
Programa de Promoción de la Reforma Educativa en América Latina y el Caribe
(PREAL). 2001. Lagging Behind: A Report Card on Education in Latin America.
Santiago, Chile: PREAL.
Székely, M. 2001. “The 1990s in Latin America: Another Decade of Persistent
Inequality, but with Somewhat Lower Poverty.” Research Department Working
35
Paper 454. Washington, DC, United States: Inter-American Development Bank,
Research Department.
United Nations. 2000. A Better World for All. New York, United States: United Nations.
United Nations Educational, Social and Cultural Organization (UNESCO)/ Oficina
Regional de Educación para América Latina y El Caribe. 1998. Laboratorio
Latinomericano de Evaluación de la Calidad de la Educación, Primer Estudio
Internacional Comparativo. Santiago, Chile: UNESCO/OREALC.
United States Department of the Treasury Press Release May 15, 2001 PO376.
World Economic Forum (WEF). 2000. Global Competitiveness Report. Davos,
Switzerland: World Economic Forum.
Copyright © 2022 FDOKUMEN