Poliomyelitis in the United States, 1957 - NCBI
11
Poliomyelitis in the United States, 1957 LAURI D. THRUPP, M.D., HELEN E. FORESTER, B.A., and JACOB A. BRODY, M.D. POLIOMYELITIS reported in the United States during 1957 reached the lowest level since 1942. A total of 5,485 cases were re¬ ported to the National Office of Vital Statistics, Public Health Service, a rate of 3.2 per 100,000 population. Of these cases, 2,499 were re¬ ported as paralytic, and 2,826 nonparalytic. The paralytic status was unspecified for the remaining 160 cases. Table 1 presents total national poliomyelitis incidence rates from 1935 through 1957 as re¬ ported to NOVS. Although wide annual vari¬ ations occurred, the incidence of poliomyelitis remained high from 1948 through 1955. Dur¬ ing 1956, half as many cases occurred as dur¬ ing the previous year, while in 1957, reported cases were only one-fifth of the 1955 figures. Seasonal Distribution Variability in seasonal distribution patterns as well as in annual poliomyelitis incidence in recent years is further apparent from figure 1, which presents the seasonal curve of weekly reports to NOVS for the years 1942, 1947, and 1952 through 1957. For paralytic poliomyelitis alone, as shown in figure 2, the seasonal rise in 1957 was grad¬ ual, and peak incidence was not reached until Dr. Thrupp, formerly chief of the Poliomyelitis Sur¬ veillance Unit, Communicable Disease Center, Public Health Service, Atlanta, Ga., is now with the Fourth Medical Service, Boston City Hospital. Miss For¬ ester is a statistician and Dr. Brody, epidemic intelli¬ gence service officer, with the Poliomyelitis Surveil¬ lance Unit. the end of September (39th week), much later than the late August peaks reached in 1955 and 1956. Data specifying paralytic status, prior to 1955, are not available on a nationwide scale. During 1957 the seasonal distribution curve for paralytic poliomyelitis differed consider¬ ably from nonparalytic poliomyelitis. Cases reported in the poliomyelitis surveillance pro¬ gram during 1957 by week of onset are pre¬ sented in figure 3. Whereas nonparalytic dis¬ ease reached a sharp, seasonal peak in early Au¬ gust, paralytic poliomyelitis rose gradually to a minor peak in early August and subsequently remained at a plateau, not reaching maximum weekly incidence until almost 2 months later. The proportion of paralytic cases among re¬ ported poliomyelitis cases was notably lower in all regions of the country during July and Au¬ gust as compared with the remainder of the year. Morbidity Reporting In recent years increasingly widespread ap¬ plication of virus diagnostic tissue-culture tech¬ niques lias permitted study of numerous out¬ breaks of nonparalytic aseptic meningitis. It is now well documented that many agents of the ECHO and Coxsackie groups are capable of producing an illness clinically indistinguish¬ able from aseptic meningitis caused by the poliovirus. On rare occasions these agents have also been associated with paralytic disease. During 1957, large outbreaks of illness with aseptic meningitis syndrome due to nonpolio- myelitis enteroviruses were recorded in many States, including Wisconsin, Minnesota, Michi- Vol. 74, No. 6, June 1959 505077.59-5 535
-
Upload
khangminh22 -
Category
Documents
-
view
1 -
download
0
Transcript of Poliomyelitis in the United States, 1957 - NCBI

Poliomyelitis in the United States, 1957
LAURI D. THRUPP, M.D., HELEN E. FORESTER, B.A.,and JACOB A. BRODY, M.D.
POLIOMYELITIS reported in the UnitedStates during 1957 reached the lowest level
since 1942. A total of 5,485 cases were re¬
ported to the National Office of Vital Statistics,Public Health Service, a rate of 3.2 per 100,000population. Of these cases, 2,499 were re¬
ported as paralytic, and 2,826 nonparalytic.The paralytic status was unspecified for theremaining 160 cases.
Table 1 presents total national poliomyelitisincidence rates from 1935 through 1957 as re¬
ported to NOVS. Although wide annual vari¬ations occurred, the incidence of poliomyelitisremained high from 1948 through 1955. Dur¬ing 1956, half as many cases occurred as dur¬ing the previous year, while in 1957, reportedcases were only one-fifth of the 1955 figures.
Seasonal Distribution
Variability in seasonal distribution patternsas well as in annual poliomyelitis incidence inrecent years is further apparent from figure 1,which presents the seasonal curve of weeklyreports to NOVS for the years 1942, 1947, and1952 through 1957.For paralytic poliomyelitis alone, as shown
in figure 2, the seasonal rise in 1957 was grad¬ual, and peak incidence was not reached until
Dr. Thrupp, formerly chief of the Poliomyelitis Sur¬veillance Unit, Communicable Disease Center, PublicHealth Service, Atlanta, Ga., is now with the FourthMedical Service, Boston City Hospital. Miss For¬ester is a statistician and Dr. Brody, epidemic intelli¬gence service officer, with the Poliomyelitis Surveil¬lance Unit.
the end of September (39th week), much laterthan the late August peaks reached in 1955 and1956. Data specifying paralytic status, priorto 1955, are not available on a nationwide scale.During 1957 the seasonal distribution curve
for paralytic poliomyelitis differed consider¬ably from nonparalytic poliomyelitis. Casesreported in the poliomyelitis surveillance pro¬gram during 1957 by week of onset are pre¬sented in figure 3. Whereas nonparalytic dis¬ease reached a sharp, seasonal peak in early Au¬gust, paralytic poliomyelitis rose gradually toa minor peak in early August and subsequentlyremained at a plateau, not reaching maximumweekly incidence until almost 2 months later.The proportion of paralytic cases among re¬
ported poliomyelitis cases was notably lower inall regions of the country during July and Au¬gust as compared with the remainder of theyear.
Morbidity ReportingIn recent years increasingly widespread ap¬
plication of virus diagnostic tissue-culture tech¬niques lias permitted study of numerous out¬breaks of nonparalytic aseptic meningitis. Itis now well documented that many agents ofthe ECHO and Coxsackie groups are capableof producing an illness clinically indistinguish¬able from aseptic meningitis caused by thepoliovirus. On rare occasions these agentshave also been associated with paralytic disease.During 1957, large outbreaks of illness with
aseptic meningitis syndrome due to nonpolio-myelitis enteroviruses were recorded in manyStates, including Wisconsin, Minnesota, Michi-
Vol. 74, No. 6, June 1959505077.59-5
535

Data CollectionBasic functions of the National Poliomye¬
litis Surveillance Program are the continualcollection of data on the safety and efficacy ofpoliomyelitis vaccine and the study of the epi¬demiological trends of poliomyelitis in theUnited States. Established in April 1955 atthe Communicable Disease Center of the Pub¬lic Health Service, the program is based on
participation by local and State health depart¬ments, the National Office of Vital Statistics,diagnostic and research laboratories, the Na¬tional Foundation for Infantile Paralysis, andothers with responsibility and interest in thefield of poliomyelitis and poliomyelitis-likediseases. Mimeographed Poliomyelitis Sur¬veillance Reports are issued regularly, review¬ing data reported in the program. In additionto these periodic reports, reviews of informa¬tion recorded in 1955 and 1956 have been pre¬sented (1-4).During 1957, 47 States, the District of Co¬
lumbia, and three Territories participated withthe Poliomyelitis Surveillance Unit in studyingdata, including age, race, sex, date of onset ofsymptoms, paralytic status, and vaccinationstatus of reported poliomyelitis cases. Thepresent report reviews poliomyelitis incidenceduring 1957 and summarizes the epidemiologi¬cal patterns in that year in comparison with1955 and 1956.
gan, Ohio, North Carolina, Virginia, andTennessee. These included communitywideepidemics of febrile illnesses often with asepticmeningitis symptoms or skin rash, or both, as¬
sociated with ECHO-9 virus.With reported poliomyelitis at a low level,
individual case diagnosis has become more im¬portant. During the year, a relatively lowpercentage of cases were paralytic. This per¬centage was lowest in July and August, theperiod during which the aseptic meningitisepidemics were occurring. A proportion ofthe cases reported as nonparalytic poliomyelitisduring this time are felt to have been causedby the ECHO and Coxsackie viruses. In¬cluded in this group are endemic aseptic menin¬
gitis cases, as well as early cases from asepticmeningitis outbreaks later demonstrated epi-demiologically and virologically to be due toother than polioviruses.Routine practices in the morbidity reporting
of such cases vary. While a number of non-
poliomyelitis aseptic meningitis cases were in¬cluded in routine morbidity reports as
nonparalytic poliomyelitis, data recorded in theepidemiological reports to the PoliomyelitisSurveillance Unit were refined in some Statesby subtraction of cases from known asepticmeningitis outbreaks initially reported as non¬
paralytic poliomyelitis.
Distribution
GeographicIn contrast with recent years, no large out¬
breaks of paralytic poliomyelitis occurred dur¬ing 1957 in the United States. Table 2 pre¬sents poliomyelitis cases reported in the polio¬myelitis surveillance program by State andregion during 1956 and 1957 and estimated at¬tack rates by paralytic status. The generallylow incidence of paralytic disease in all regionsis apparent. Highest attack rates for 1957were reported in the southeastern, south cen¬
tral, and southwestern regions, where para¬lytic rates were 1.8, 2.9, and 2.0 per 100,000,
Table 1. Total national poliomyelitis incidence,1935-57
Yeaf
1935__.1936__.1937__.1938__.1939__.1940__.1941__.1942__.1943__.1944__.1945...1946___
Cases
10, 839^4, 5239,5111,7057,3399,8269,0864,03311,54016, 93512, 10125, 196
Rateper
100,000
8.53.57. 4135>67. 5X<6.83.0-9314.710.318.4
Year Cases
10,73427, 90242, 17333, 30023, 38657, 87935, 59238, 47628, 98515, 1405,485
Rafeyper100,000
7.519. 128.422.018. 636.922.523.917.69.03.2
Sources: For 1935-1949, The Notifiable^ Diseases,Annual Reports, Public Health Service, 1935^49; for1950-^7, National Office of Vital Statistics, "WeeklyMorbidity and Mortality Report, vol. 6, No. 53> Oct.29, 1958. Population estimates are from the Bureau of
ytne Census.
536 Public Health Reports

respectively. Only Texas and the District ofColumbia reported more than 3 paralytic cases
per 100,000, whereas in 1956 this rate was ex¬
ceeded in 27 States.
AgeDuring the past 5 years there has been a
progressive rise in the proportion of paralyticcases among preschool children. As shown in
Figure 1. Poliomyelitis incidence in the United States, 1942, 1947, 1952-57.1
40
35
30
25
20
15
10
5
V WEEK NO '* ?fi 97 5>fl PQ V> *lWEEK NO T "* 20 21 22 23 24 25 26 27 28 29 30 31 32 33 34 35 36 37 38 39 40 41 42 43 44 45 46 47 48 49 50 51 '52
MayJune July Aug Sep OctNov1 Provisional data from the National Office of Vital Statistics, Public Health Service.
Dec
Vol. 74, No. 6, June 1959 537
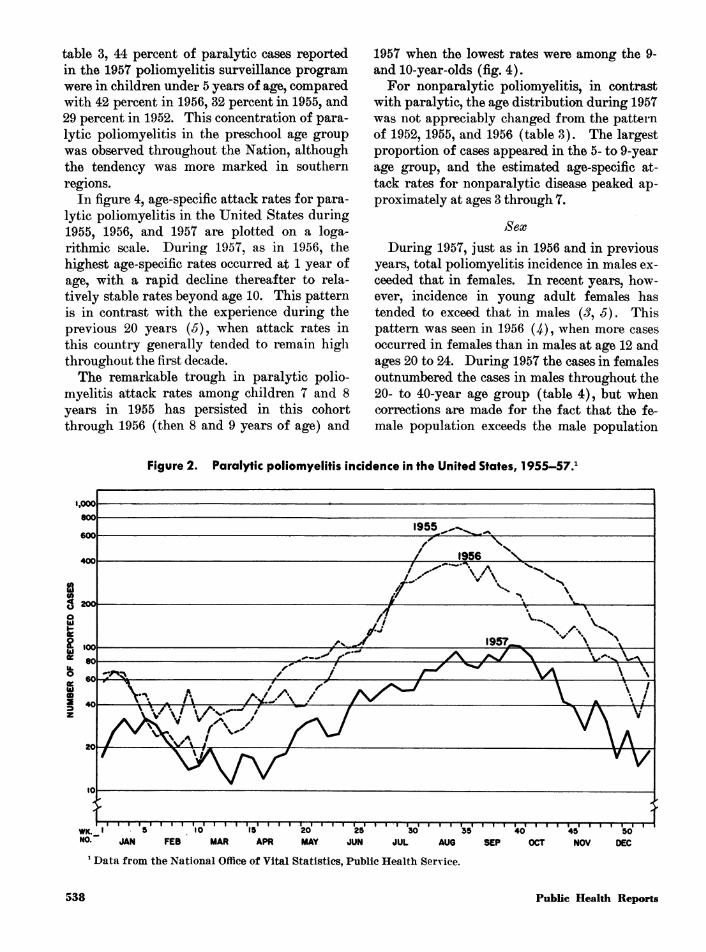
table 3, 44 percent of paralytic cases reportedin the 1957 poliomyelitis surveillance programwere in children under 5 years of age, comparedwith 42 percent in 1956, 32 percent in 1955, and29 percent in 1952. This concentration of para¬lytic poliomyelitis in the preschool age groupwas observed throughout the Nation, althoughthe tendency was more marked in southernregions.In figure 4, age-specific attack rates for para¬
lytic poliomyelitis in the United States during1955, 1956, and 1957 are plotted on a loga¬rithmic scale. During 1957, as in 1956, thehighest age-specific rates occurred at 1 year ofage, with a rapid decline thereafter to rela¬tively stable rates beyond age 10. This patternis in contrast with the experience during theprevious 20 years (J), when attack rates inthis country generally tended to remain highthroughout the first decade.The remarkable trough in paralytic polio¬
myelitis attack rates among children 7 and 8years in 1955 has persisted in this cohortthrough 1956 (then 8 and 9 years of age) and
1957 when the lowest rates were among the 9-and 10-year-olds (fig. 4).For nonparalytic poliomyelitis, in contrast
with paralytic, the age distribution during 1957was not appreciably changed from the patternof 1952, 1955, and 1956 (table 8). The largestproportion of cases appeared in the 5- to 9-yearage group, and the estimated age-specific at¬tack rates for nonparalytic disease peaked ap¬proximately at ages 3 through 7.
Sex
During 1957, just as in 1956 and in previousyears, total poliomyelitis incidence in males ex¬
ceeded that in females. In recent years, how¬ever, incidence in young adult females hastended to exceed that in males (J, 5). Thispattern was seen in 1956 (^), when more cases
occurred in females than in males at age 12 andages 20 to 24. During 1957 the cases in femalesoutnumbered the cases in males throughout the20- to 40-year age group (table 4), but whencorrections are made for the fact that the fe¬male population exceeds the male population
Figure 2. Paralytic poliomyelitis incidence in the United States, 1955-57.1
WK. t*0~ JAN FEB MAR APR MAY JUN JUL AUG
1 Data from the National Office of Vital Statistics, Public Health Service.
SEP OCT NOV DEC
538 Public Health Reports

Figure 3. Seasonal incidence of poliomyelitis in the United States, 1957.1
250n
NONPARALYTIC (2669 CASES)
PARALYTIC (2212 CASES)
WEEK OF ONSET1 Cases reported to the Poliomyelitis Surveillance Unit, Communicable Disease Center, Public Health Service.
in this age group, these differences are not so
prominent.Racial
Current age-specific attack rates cannot bederived by race since nationwide populationestimates by race and age are not availablebeyond the 1950 census and since reporting ofpoliomyelitis by race is not a uniform practice.
Nevertheless, data from southern States andfrom several urban areas suggest that paralyticpoliomyelitis attack rates in Negro populationsare increasing both absolutely and relative tothe rates in whites. Estimation of paralyticpoliomyelitis attack rates by race in southernStates in 1955 revealed the rate among whitesto be 1.8 times that among nonwhites, while in1957 the rate among whites was only 0.75 timesthat for nonwhites (.).In the 1956 Chicago epidemic attack rates for
paralytic poliomyelitis among Negroes were al¬most eight times those in whites (7, 8). During1957, the only large city with any concentrationof poliomyelitis was Washington, D.C, wherethe paralytic attack rate in nonwhites was four
times as high as in whites. In 1956 and 1957,study of 14 additional urban areas reveals that6 of these 14 experienced a similar increase inparalytic rates among nonwhites, in contrastwith patterns of previous years. These areas
were Philadelphia, Richmond, Norfolk, NewYork, Baltimore, and Atlanta.
Vaccination HistoryEvidence suggesting poliomyelitis vaccine
effectiveness in the prevention of paralytic dis¬ease continued to accumulate during 1957.Table 5 presents by age group the proportionvaccinated of paralytic and nonparalytic cases
reported during 1957 in the poliomyelitis sur¬
veillance program from 47 States and theDistrict of Columbia. Since much of the non¬
paralytic illness was caused by nonpoliovirusesagainst which the vaccine is ineffectual, it wasexpected that the proportion vaccinated amongnonparalytics would be higher than among par¬alytics. This higher incidence among nonpar¬alytics was observed in all age groups. An
Vol. 74, No. 6, June 1959 539

Table 2. Poliomyelitis cases reported in 1956 and 1957 by State and paralytic status
State and region
1956
Cases *
Para¬lytic
Non¬para¬lytic
Unspe¬cified
Rates2
Para¬lytic
Non¬para¬lytic
1957
Cases i
Para¬lytic
Non¬para¬lytic
Unspe¬cified
Rates2
Para¬lytic
Non¬para¬lytic
United States
Northeast....-Maine_New Hampshire-Vermont_Massachusetts_Rhode Island_Connecticut_New York_New Jersey-Pennsylvania-
North Central_Ohio.._Indiana_Illinois_Michigan_Wisconsin_Minnesota_Iowa_Missouri_North Dakota_South Dakota_Nebraska_Kansas_
Northwest._Montana_Wyoming_Idaho_Washington_Oregon_
Southeast_Delaware_Maryland_District of Columbia-Virginia_West Virginia_North Carolina_South Carolina_Georgia_Florida_Kentucky_Tennessee_Alabama_
South Central_Mississippi_Arkansas_Louisiana_Oklahoma_Texas_
Southwest-._Colorado_New Mexico_Arizona_Utah_Nevada_California_
Alaska_Hawaii_Puerto Rico.
7,91168414312482
3038491100
2,659313234
1,1483082637845
191138
58
2953818639878
99711907
15160179461011038410362
1,57318414641493
7361,703
87376514513
1,3567
4548
6, 555
61210527
5336911160
2,82726217679234827087
4912202728126
2391717319381
84918234
864813667851691126041
1,010757619494
571950682161246
770
2176
674 4.7 3.9 2,499 2,826 160
66
"T
i
64267
3
17
443118
18518
1161
98
192
12035
3352105
3261
5817
1.61.6.53.21.0.21.32.41.7.95.43.45.312.24 17.02.41.7452.01.24 1
496.05.6
10. 13.7453.02.73.2.8
4. 13.0402.02.72.72.83.02.08.78.78.013.84. 18.29.55.44.56. 117.95.3
10. 1
3.37.72. 1
1.6.7
2. 12.71. 1.82.42.32. 1.55.72.9408.44.67.22.718.25.24 1408.9
402.75.35.03.54.72.545.8.52.42.43. 12.82.3453.71.71.35.63.5426.5426.45.34.22.65.83.02.45.7
1.02.9.3
192414
11
131072923
71312287
161121353421607182918665761929
6211
336669395266713968684953330257435
369374261922121
294
39
40
2134101
14
25895218
1,02110173145377733257627144535415573
21506
479
3818
181411057399210
60338259580
365442221018103
379
114
236
3103
122
10
71
211238
2115
331
21
11
1.5
.5
.4
. 11. 1.2
.6
.7
.5
.21.41.31.91.71.6.91.0.81.41. 12.62.0.81.1.82.2.9.71.61.8.2
1. 17.91.82.01.22.81.91.02.22.01.62.91.41.42.41.5402.01.62.31.91.4
. 42. 1
1.51.51.8
1.7
.5
.41.3.3.3
1. 1.6.9.22.01. 11.61.5481.91.02.01.51. 12.03. 11.6.7.81.61. 1
. 11.21.5.9.2
1. 11.0.94.01.7.31.41.32.7.33.31.71.43. 13.5402.41.31.21.61.21. 12.7
.2
.2
1 Source: National Office of Vital Statistics, Mor¬bidity and Mortality Weekly Report, vol. 5, No. 53,Oct. 23, 1957, and vol. 6, No. 53, Oct. 29, 1958.
2 Rates per 100,000 population based on populationestimates by the Bureau of the Census.
540 Public Health Reports

Table 3. Percentage distribution of paralytic and nonparalytic poliomyelitis cases by age group :
1952,2 1955,2 1956,8 and 19574
Age group, in yearsParalytic
1952 1955 1956 1957
Nonparalytic
1952 1955 1956 1957
0-4_5-9_10-14_15-19_20-29_30 and over.
Total percentTotal cases_
292513
33
3221127
1611
4216117
159
441896
1310
213116
31
1929178169
21261610189
100 99 100 100 99 100
13, 552 9,564 7,399 2,262 8,321 8,775 6,269
172816111810
100
2,698
1 Based on data reported to Poliomyelitis SurveillanceUnit in the age distribution analysis. Cases in whichparalytic status was not specified are excluded.21952 data from 22 States and District of Columbia
and 1955 data from 33 States and District of Columbia
previously presented in reference 3.81956 data from 45 States and District of Columbia,
reference 4.41957 data from 47 States and District of Columbia.
1008060
40
ZOl
O
o 8
Q 6
UJ
or2H
i0.80.6
0.4-
Figure 4. Age-specific attack rates for paralytic poliomyelitis in theUnited States, 1952 and 1955-57.1
/ V
V 1952 (9051 CASES-22 STATES)
1955 (8423 CASES - 33 STATES)
1956 (7401 CASES-46 STATES)
1957 (2253 CASES-47 STATES)
V
X1.T-1 I |0 5
-i.i.i.r.i.i.i.r-10 15 ~2o" 1?T ~40
AGE25 30
1 Cases reported to the Poliomyelitis Surveillance Unit, Communicable Disease Center, Public Health Service.
Vol. 74, No. 6, June 1959 541

Table 4. Paralytic poliomyelitis cases in theUnited States in 1957, showing age distribu¬tion by sex x
Age group, in years Females
0-4_5-9_10-14_15-19_20-24_25-29_30-34_35-39_40 and over.Unknown_
TotaL
1 Cases in which sex was unknown were omitted.Source : Data reported to Poliomyelitis Surveillance
Unit from 47 States and the District of Columbia.
overall total of 54 percent of nonparalytic cases
had received some vaccine as compared with 30percent of paralytic cases.
The ability of the vaccine to modify theclinical characteristics of the disease is indi¬cated in the correlation which exists betweennumber of doses received and absence of paral¬ysis. Whereas 56 percent of all nonvaccinatedpoliomyelitis cases were paralytic, only 25 per¬cent of all triply vaccinated cases were reportedparalytic.Data obtained in August and November of
1957 for the Poliomyelitis Vaccine ActivityUnit by NOVS through a supplement to theCensus Bureau's Current Population Surveypermitted an estimate of the vaccination status
of the United States population by age group.This analysis was under the direction of Dr.Monroe Sirken, chief, Actuarial Analysis Sec¬tion, National Office of Vital Statistics. Usingas numerators the vaccination history of cases
of paralytic poliomyelitis reported by agegroups in the poliomyelitis surveillance pro¬gram and as denominators the above UnitedStates population estimates by age group andvaccination status, rough calculations of para¬lytic poliomyelitis attack rates were derived invaccinated and unvaccinated populations. Theestimated paralytic poliomyelitis rates were
lower in the triply vaccinated than in the unvac¬cinated population (table 6). The percentagereduction ranged from 90 percent in the 0-4year age group to 54 percent in the 20-29 yearage group.Such estimates represent uncontrolled com¬
parisons of ratios rather than measured attackrates in controlled populations, and as such are
subject to many potential errors. Such factorsas variations in the vaccine status in differentareas, ages, and population groups, and varia¬tions in the actual exposure to virus in individ¬ual groups should be taken into account in ana¬
lyzing effectiveness of vaccine. Various studiesare in progress at the present time to evaluatevaccine effectiveness in more controlled popula¬tion subgroups.Triply Vaccinated Cases
Ca^es occurring in triply vaccinated personsduring 1957 included 207 paralytic, 588 non¬
paralytic, and 1 unspecified case. Of these, lab-
Table 5. Paralytic and nonparalytic poliomyelitis in the United States in 1957, by age group andvaccination history 1
Age group, in years
0-4_5-9_10-14_15-19_20 and over.
TotaL
Paralytic
Totalcases
970394198132492
2, 186
One ormore doses
246198933784
658
Percentvaccinated
2550472817
30
Nonparalytic
Totalcases
434742417293733
2, 619
One ormore doses
212550311125221
1, 419
Percentvaccinated
4974754330
54
1 Omitting cases in which vaccination status or age was not reported.Source: Data reported to Poliomyelitis Surveillance Unit from 47 States and the District of Columbia.
542 Public Health Reports

Table 6. Paralytic poliomyelitis cases1 in the United States, 1957, attack rates among triplyvaccinated and nonvaccinated persons, and estimates of vaccine effectiveness 2
0-4___5-9___10-19_20-29_30-39_
TotaL
Age group, in years
Paralytic cases
Not vac¬cinated
724196200232115
1,467
3+ doses
59884512
206
Attack rates
Not vac¬cinated
92. 856. 523. 616.06.4
28. 2
3+ doses
9. 24. 47.41. 3
7. 1
Percenteffective¬
ness
9084815479
75
1 Cases reported to the Poliomyelitis Surveillance Unit.2 Population estimates of triply vaccinated and nonvaccinated persons provided by Dr. Monroe Sirken, chief,
Actuarial Analysis Unit, NOVS, Public Health Service.
oratory data were reported on 85 paralytic cases
and 171 nonparalytic cases (table 7). Studieswere negative in the large majority of thesecases; only 19 percent of the paralytic and 15
percent of the nonparalytic cases studied were
confirmed as exhibiting current or recent infec¬tion with poliovirus, while other viruses were
isolated in 10 percent of the paralytic cases andin 20 percent of nonparalytic cases.
Data regarding the extent of paralytic in¬volvement remaining after convalescence were
Table 7. Poliomyelitis cases in triply vacci¬nated individuals in 1957, as indicated inlaboratory studies
Type ofdisease
Poliomyelitis 1_Poliomyelitis2_Poliomyelitis3_Poliomyelitis, typeunspecified_
Coxsackie_ECHO_Unidentified virus__.Negative_
TotaL
Paralvtic Nonparalytic
Cases
6
10
611
61
85
Percentof totaltested
12
11
72
100
Cases
116
1151010
111
171
Percentof totaltested
644
1966
65
101
Source : Data reported to the Poliomyelitis Surveil¬lance Unit from State and local health departments,from research laboratories, and from laboratories ofthe Virus Diagnostic Unit of the Communicable Dis¬ease Center, Public Health Service.
Table 8. Paralytic poliomyelitis cases in triplyvaccinated individuals in the United Statesduring 1957, showing severity of residual pa¬ralysis as indicated in laboratory studies
Estimatedseverity
Severe_Moderate.Mild_
Total
Polio¬virusiso¬lated
14
Cox¬sackieiso¬lated
Nega¬tive
laboraTtory
results
1 151021
46
Nolabora¬torystudv
1 192329
71
Total
423954
135
1 Including one fatality.Source : Data reported to the Poliomyelitis Surveil¬
lance Unit.
submitted by physicians in 135 cases (table 8).Residual paralysis was roughly estimated to besevere in 42 cases, moderate in 39, and mild in54 cases. Of the severe cases poliovirus infec¬tion was confirmed in 7 and laboratory studieswere negative in 15.During 1957 three deaths from poliomyelitis
were reported in triply vaccinated persons.Pathological findings were characteristic ofacute poliomyelitis in one case from which type3 poliovirus was isolated. In a second case,pathological findings were suggestive but lab¬oratory studies were negative. The remainingfatal case was not confirmed; postmortem ex¬
amination was not performed, and no materialfor virus isolation was available.
Vol. 74, No. 6, June 1959 543

Vaccine DistributionDuring the period April 1955 through De¬
cember 1957, a cumulative total of 186.2 millioncc. of net bottled poliomyelitis vaccine was dis¬tributed for domestic use. This total includes27.7 million cc. shipped during the periodApril-December 1955, 70 million in 1956, and88.2 million in 1957. In addition, 19.2 millioncc. were exported during the period August 1956to December 1957. During 1957, shipmentslagged considerably behind releases, and a bal¬ance of 33.1 million cc. was cleared by theNational Institutes of Health but not shippedby the end of the year. Distribution of vaccineby calendar quarters is presented in figure 5.
Vaccine SafetyReporting of cases occurring within 30 days
of a poliomyelitis vaccine inoculation was lessthorough during 1957 than in 1955 and 1956.Analysis of 36 cases in 1957 with complete datarevealed no tendency for the onset of illnessto group in the 4- to 11-day period follow¬ing inoculation. Onset of paralysis occurred inthe inoculated limb in six cases and in the oppo¬site uninoculated limb in four cases during1957. No specific vaccine lot was known to beassociated with more than three paralytic cases.
The 1955 Cutter cases, in contrast, were associ¬ated with a small number of specific lots, andparalysis usually began in the inoculated limb4 to 11 days following vaccination (1).Discussion and SummaryReported incidence of poliomyelitis in the
United States during 1957 reached the lowestlevel since 1942. There were no major polio¬myelitis outbreaks, and attack rates, particu¬larly of paralytic disease, were low in allregions of the country.Concurrently, during 1957 almost 90 million
cc. of poliomyelitis vaccine were shipped in thiscountry, bringing to over 180 million cc. thetotal vaccine distributed for domestic use sinceApril 1955. More than half of our populationhas now received at least one dose of vaccine.The extremely low incidence for paralytic
poliomyelitis of 1.5 cases per 100,000 during1957 is impressive in view of the extensive use
of vaccine. However, marked annual varia¬tions have characterized poliomyelitis incidence
Figure 5. Poliomyelitis vaccine distribution,1955-57.1
VACCINE DISTRIBUTED I CLEARED VACCINE ON HANDDURING SPECIFIED QUARTER | AT END OF QUARTER
MILLIONS OF DOSES10 0 10
xData from Poliomyelitis Vaccine Activity Unit,Bureau of State Services, Public Health Service.
in this country in recent years. Furthermore,response to commercial poliomyelitis vaccinehas been variable (#), and vaccinated subjectsappear to be readily susceptible to gastrointes¬tinal infection upon natural exposure to polio¬virus (10-12). Therefore, it cannot be con¬
cluded that the widespread use of vaccine was
alone responsible for the low total incidence ofthe disease during 1957. Final evaluation ofthe effect of inactivated poliomyelitis vaccineon poliovirus ecology and on total poliomyelitisincidence will require continued study over thenext several years.Changes in epidemiological patterns may
nevertheless reflect the size and character of thevaccinated population since the Nation is notuniformly vaccinated. It has, therefore, becomeof increasing importance to continue detailedstudy of epidemiological trends of poliomyelitisin this country.The striking change in age distribution pat¬
tern of paralytic disease observed during 1956continued through 1957, with preschool childrenaccounting for the largest proportion of cases
544 Public Health Reports

and with peak age-specific attack rates en-countered in 1-year-old infants. Since the pre-school ages were less thoroughly vaccinatedthan older children, it is probable that thischange in the relative age distribution is atleast in part a result of the vaccination pro-grams. The trough in age-specific attack ratesfor paralytic poliomyelitis noted in 1955 among7- and 8-year-olds and again in 1956 among 8-to 9-year-olds has persisted this year among thesame cohort, now 9 and 10 years of age. Sincethis group in particular was thoroughly vac-cinated in the school programs of 1955, thepersistence of lowest paralytic attack rates inthis population for 3 years suggests both ef-fectiveness of the vaccine and duration of theinduced immunity over the 3-year period.
Relatively and absolutely increased incidenceof paralytic poliomyelitis was encountered dur-ing 1956 and 1957 among nonwhite racialgroups in the south and in several metropolitanareas throughout the country.
Paralytic poliomyelitis cases tended to occuramong unvaccinated individuals during 1957.Examination of vaccination history for para-lytic cases in comparison with the estimatedvaccination status of the United States popula-tion has permitted gross but reasonable esti-mations of paralytic attack rates in vaccinatedand unvaccinated populations. The rate ofparalytic disease in the triply vaccinated groupwas apparently reduced compared with thatin unvaccinated populations. Further, a pro-gressively lower incidence was recorded forthose who had received 1, 2, or 3 doses ofvaccine. These variations in calculations ofeffectiveness of three doses of vaccine reflect theunequal exposures of populations to virus anddiffering vaccination status of specific groups.The estimates are useful in determining therange rather than the specific degree of effec-tiveness.
Poliomyelitis vaccine shipments declined dur-ing the latter part of 1957. It is evident thatincreasingly active immunization programs willbe required in order to achieve completion ofthe requisite three-dose schedule in large seg-ments of the population as yet incompletely
vaccinated. Particular effort will be necessaryin groups at relatively increasing risk, includ-ing the preschool ages and nonwhite popula-tions.
REFERENCES
(1) Laugmuir, A. D., Nathanson, N., and Hall, W. J.:The surveillance of poliomyelitis in the UnitedStates in 1955. Am. J. Pub. Health 46: 75-88,January 1956.
(2) Nathanson, N., Hall, W. J., Thrupp, L. D., andForester, H.: Surveillance of poliomyelitis inthe United States in 1956. Pub. Health Rep.72: 381-392, May 1957.
(3) Hall, W. J., Nathanson, N., and Langmuir,A. D.: The age distribution of poliomyelitis inthe United States in 1955. Am. J. Hyg. 66:214-234, September 1957.
(4) Hall, W. J., Forester, H., Thrupp, L. D., andPage, M. I.: Age distribution of poliomyelitisin the United States in 1956. PoliomyelitisSurveillance Report, Supp. No. 14. Atlanta,Ga., Communicable Disease Center, December6, 1957.
(5) Dauer, C. C.: The changing age distribution ofparalytic poliomyelitis. Ann. New York Acad.Sci. 61: 943-955, September 1955.
(6) Thrupp, L. D., Forester, H.: Poliomyelitis in theU.S. during 1957. A preliminary report.Poliomyelitis Surveillance Report, Supp. No.15. Atlanta, Ga., Communicable DiseaseCenter, May 1958.
(7) Bundesen, H. N., Graning, H. M., Goldberg, E. L.,and Bauer, F. C.: Preliminary report and ob-servations on the 1956 poliomyelitis outbreakin Chicago. J.A.M.A 163: 1604-1619, Apr. 27,1957.
(8) Nathanson, N., and others: Epidemic polio-myelitis during 1956 in Chicago and CookCounty, Illinois. To be published.
(9) Poliomyelitis. Papers and discussions presentedat the Fourth International Poliomyelitis Con-ference. Philadelphia, J. B. Lippincott Co.,1958, pp. 103-104.
(10) Gelfand, H. M., Fox, J. P., and LeBlanc, D. R.:Observations on natural poliovirus infections inimmunized children. Am. J. Pub. Health 47:421-431, April 1957.
(11) Gelfand, H. M., LeBlanc, D. R., Fox, J. P., andConwell, D. P.: Studies on the development ofnatural immunity to poliomyelitis in Louisiana.Am. J. Hyg. 65: 367-385, May 1957.
(12) Lipson, M. J., Robbins, F. C., and Woods, W. A.:The influence of vaccination upon the in-testinal infection of family contacts of polio-myelitis patients. J. Clin. Invest. 35: 722,June 1956.
Vol. 74, No. 6, June 1959 545