Plate Cherry Picking”: A Novel Semi-Sequential Screening Paradigm for Cheaper, Faster,...
8
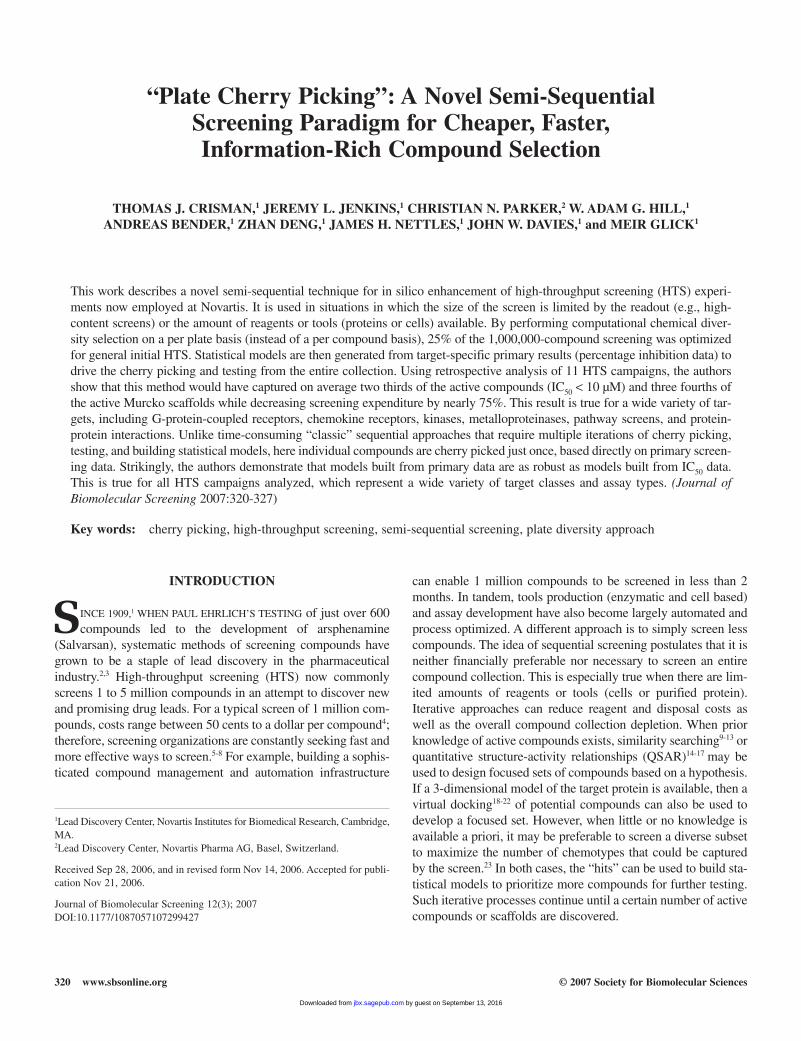
320 www.sbsonline.org © 2007 Society for Biomolecular Sciences “Plate Cherry Picking”: A Novel Semi-Sequential Screening Paradigm for Cheaper, Faster, Information-Rich Compound Selection THOMAS J. CRISMAN, 1 JEREMY L. JENKINS, 1 CHRISTIAN N. PARKER, 2 W. ADAM G. HILL, 1 ANDREAS BENDER, 1 ZHAN DENG, 1 JAMES H. NETTLES, 1 JOHN W. DAVIES, 1 and MEIR GLICK 1 This work describes a novel semi-sequential technique for in silico enhancement of high-throughput screening (HTS) experi- ments now employed at Novartis. It is used in situations in which the size of the screen is limited by the readout (e.g., high- content screens) or the amount of reagents or tools (proteins or cells) available. By performing computational chemical diver- sity selection on a per plate basis (instead of a per compound basis), 25% of the 1,000,000-compound screening was optimized for general initial HTS. Statistical models are then generated from target-specific primary results (percentage inhibition data) to drive the cherry picking and testing from the entire collection. Using retrospective analysis of 11 HTS campaigns, the authors show that this method would have captured on average two thirds of the active compounds (IC 50 < 10 μM) and three fourths of the active Murcko scaffolds while decreasing screening expenditure by nearly 75%. This result is true for a wide variety of tar- gets, including G-protein-coupled receptors, chemokine receptors, kinases, metalloproteinases, pathway screens, and protein- protein interactions. Unlike time-consuming “classic” sequential approaches that require multiple iterations of cherry picking, testing, and building statistical models, here individual compounds are cherry picked just once, based directly on primary screen- ing data. Strikingly, the authors demonstrate that models built from primary data are as robust as models built from IC 50 data. This is true for all HTS campaigns analyzed, which represent a wide variety of target classes and assay types. (Journal of Biomolecular Screening 2007:320-327) Key words: cherry picking, high-throughput screening, semi-sequential screening, plate diversity approach INTRODUCTION S INCE 1909, 1 WHEN PAUL EHRLICH’S TESTING of just over 600 compounds led to the development of arsphenamine (Salvarsan), systematic methods of screening compounds have grown to be a staple of lead discovery in the pharmaceutical industry. 2,3 High-throughput screening (HTS) now commonly screens 1 to 5 million compounds in an attempt to discover new and promising drug leads. For a typical screen of 1 million com- pounds, costs range between 50 cents to a dollar per compound 4 ; therefore, screening organizations are constantly seeking fast and more effective ways to screen. 5-8 For example, building a sophis- ticated compound management and automation infrastructure can enable 1 million compounds to be screened in less than 2 months. In tandem, tools production (enzymatic and cell based) and assay development have also become largely automated and process optimized. A different approach is to simply screen less compounds. The idea of sequential screening postulates that it is neither financially preferable nor necessary to screen an entire compound collection. This is especially true when there are lim- ited amounts of reagents or tools (cells or purified protein). Iterative approaches can reduce reagent and disposal costs as well as the overall compound collection depletion. When prior knowledge of active compounds exists, similarity searching 9-13 or quantitative structure-activity relationships (QSAR) 14-17 may be used to design focused sets of compounds based on a hypothesis. If a 3-dimensional model of the target protein is available, then a virtual docking 18-22 of potential compounds can also be used to develop a focused set. However, when little or no knowledge is available a priori, it may be preferable to screen a diverse subset to maximize the number of chemotypes that could be captured by the screen. 23 In both cases, the “hits” can be used to build sta- tistical models to prioritize more compounds for further testing. Such iterative processes continue until a certain number of active compounds or scaffolds are discovered. 1 Lead Discovery Center, Novartis Institutes for Biomedical Research, Cambridge, MA. 2 Lead Discovery Center, Novartis Pharma AG, Basel, Switzerland. Received Sep 28, 2006, and in revised form Nov 14, 2006. Accepted for publi- cation Nov 21, 2006. Journal of Biomolecular Screening 12(3); 2007 DOI:10.1177/1087057107299427 by guest on September 13, 2016 jbx.sagepub.com Downloaded from
-
Upload
independent -
Category
Documents
-
view
0 -
download
0
Transcript of Plate Cherry Picking”: A Novel Semi-Sequential Screening Paradigm for Cheaper, Faster,...
320 www.sbsonline.org © 2007 Society for Biomolecular Sciences
“Plate Cherry Picking”: A Novel Semi-Sequential Screening Paradigm for Cheaper, Faster,Information-Rich Compound Selection
THOMAS J. CRISMAN,1 JEREMY L. JENKINS,1 CHRISTIAN N. PARKER,2 W. ADAM G. HILL,1
ANDREAS BENDER,1 ZHAN DENG,1 JAMES H. NETTLES,1 JOHN W. DAVIES,1 and MEIR GLICK1
This work describes a novel semi-sequential technique for in silico enhancement of high-throughput screening (HTS) experi-ments now employed at Novartis. It is used in situations in which the size of the screen is limited by the readout (e.g., high-content screens) or the amount of reagents or tools (proteins or cells) available. By performing computational chemical diver-sity selection on a per plate basis (instead of a per compound basis), 25% of the 1,000,000-compound screening was optimizedfor general initial HTS. Statistical models are then generated from target-specific primary results (percentage inhibition data) todrive the cherry picking and testing from the entire collection. Using retrospective analysis of 11 HTS campaigns, the authorsshow that this method would have captured on average two thirds of the active compounds (IC50 < 10 µM) and three fourths ofthe active Murcko scaffolds while decreasing screening expenditure by nearly 75%. This result is true for a wide variety of tar-gets, including G-protein-coupled receptors, chemokine receptors, kinases, metalloproteinases, pathway screens, and protein-protein interactions. Unlike time-consuming “classic” sequential approaches that require multiple iterations of cherry picking,testing, and building statistical models, here individual compounds are cherry picked just once, based directly on primary screen-ing data. Strikingly, the authors demonstrate that models built from primary data are as robust as models built from IC50 data.This is true for all HTS campaigns analyzed, which represent a wide variety of target classes and assay types. (Journal ofBiomolecular Screening 2007:320-327)
Key words: cherry picking, high-throughput screening, semi-sequential screening, plate diversity approach
INTRODUCTION
SINCE 1909,1 WHEN PAUL EHRLICH’S TESTING of just over 600compounds led to the development of arsphenamine
(Salvarsan), systematic methods of screening compounds havegrown to be a staple of lead discovery in the pharmaceuticalindustry.2,3 High-throughput screening (HTS) now commonlyscreens 1 to 5 million compounds in an attempt to discover newand promising drug leads. For a typical screen of 1 million com-pounds, costs range between 50 cents to a dollar per compound4;therefore, screening organizations are constantly seeking fast andmore effective ways to screen.5-8 For example, building a sophis-ticated compound management and automation infrastructure
can enable 1 million compounds to be screened in less than 2months. In tandem, tools production (enzymatic and cell based)and assay development have also become largely automated andprocess optimized. A different approach is to simply screen lesscompounds. The idea of sequential screening postulates that it isneither financially preferable nor necessary to screen an entirecompound collection. This is especially true when there are lim-ited amounts of reagents or tools (cells or purified protein).Iterative approaches can reduce reagent and disposal costs aswell as the overall compound collection depletion. When priorknowledge of active compounds exists, similarity searching9-13 orquantitative structure-activity relationships (QSAR)14-17 may beused to design focused sets of compounds based on a hypothesis.If a 3-dimensional model of the target protein is available, then avirtual docking18-22 of potential compounds can also be used todevelop a focused set. However, when little or no knowledge isavailable a priori, it may be preferable to screen a diverse subsetto maximize the number of chemotypes that could be capturedby the screen.23 In both cases, the “hits” can be used to build sta-tistical models to prioritize more compounds for further testing.Such iterative processes continue until a certain number of activecompounds or scaffolds are discovered.
1Lead Discovery Center, Novartis Institutes for Biomedical Research, Cambridge,MA.2Lead Discovery Center, Novartis Pharma AG, Basel, Switzerland.
Received Sep 28, 2006, and in revised form Nov 14, 2006. Accepted for publi-cation Nov 21, 2006.
Journal of Biomolecular Screening 12(3); 2007DOI:10.1177/1087057107299427
by guest on September 13, 2016jbx.sagepub.comDownloaded from

A Novel Sequential Screening Procedure
Journal of Biomolecular Screening 12(3); 2007 www.sbsonline.org 321
The intuitive assumption that iterative screening is less time-consuming than screening the entire deck has become outdated.4
State-of-the-art robotic systems allow screening of 1 to 5 millioncompounds within 1 to 4 weeks. The iterative approach of“cherry picking” (i.e., automated retrieval of specific compoundsfrom plates), testing, and building statistical models can be sig-nificantly more time-consuming. Execution of a successful iter-ative or sequential screen presupposes the ability to cherry-pickselected compounds from the vast screening collection. This is anontrivial task when one approaches a 10,000-compound cherrypick. Screening collections from big pharmaceutical companiestypically contain hundreds of thousands of scaffolds if one usesthe Bemis and Murcko definition.24 In a classic sequentialapproach, only a minor fraction of the scaffolds is being tested,and many chemotypes might be simply overlooked. For a1,000,000-compound collection, an initial screen of 10K to 50Kmolecules represents less than 5%. This leaves more than 95% ofthe compounds unsampled. Intuitively, it would be unlikely thatthese sets could adequately represent the entire chemical space of the full screening collection. Similarly, we use in-house diver-sity sets, of the order of thousands of compounds for pilotscreens and assay development. Although these libraries allowdevelopers to assess quality parameters of their assay, they havelittle correlation to runs with the full collection. This leads us tobelieve that screening subsets should be significantly larger thana few thousand compounds to sufficiently sample diversity.Furthermore, for “difficult” screens such as protein-protein inter-actions, in which the hit rates tend to be low, it is important notto miss interesting chemotypes. Even in heavily studied targetssuch as kinases,25-28 selectivity of inhibitors is pivotal for success,and one would like to screen many compounds even if they sharethe same scaffold. In the context of the immense amount of timeand money invested in the preparation of an HTS campaign andthe pitfalls of “smart screening” methods, the desire to screen theentire deck seems reasonable and rational when it is technicallyfeasible.
A cost-saving variation of full-deck screening is to screen inmixtures in which more than 1 compound is pooled in the samewell. However, screening in mixtures is often too noisy in acell-based format and gives rise to additional false positivesand negatives. The increasing number of phenotypic and high-content screens makes it increasingly desirable to come up withsolutions that overcome the limitations of iterative or mixture-based screens.
Here we describe a simple method that can be used to effec-tively select a subset of the collection for screening. For 11 actualHTS campaigns, we present an approach using approximately250K compounds instead of 1,000,000 compounds or more in a1-compound-per-well format. This methodology ensures that asignificant number of the possible scaffolds and molecular typesare used to discover two thirds of the best possible lead candidates
in the screening deck. We demonstrate that such an approach isnot time-consuming and covers most of the compounds and scaf-folds that would be captured through screening the full deck.
MATERIALS AND METHODS
Data set
Activity data from 11 recent HTS campaigns were accumu-lated that spanned 2 G-protein-coupled receptors (GPCRs), 2chemokine receptors, 2 kinases, 2 metalloproteinases, 1 pathwayscreen, and 2 protein-protein interactions. The total number ofcompounds tested versus each target was 1 million. Primaryassays of individual targets detected between 2000 and 7000“actives,” whereas the number of IC50 values ranged from 70 toabout 2000 in each case.
Scaffold generation
Scaffolds in the HTS sets were calculated according to thework of Bemis and Murcko.24 In short, molecules were repre-sented as their rings and ring systems, with appendages choppedoff. Elemental atom types were treated as distinct entities.
Plate selection process
Our objective was to select the combination of in-houseplates that would maximize the information content obtainedfrom the screening (defined as the number of unique Murckoscaffolds) while screening only 25% of the entire collection.The reader should keep in mind that no individual, compound-based cherry picking was performed (which would be far tooslow). Instead, plate-based cherry picking of compounds wasperformed. Thus, 2-fold optimization needed to be achieved.On one hand, diverse plates added intrinsically more value tothe overall information obtained from screening. On the otherhand, this plate-intrinsic information needed to be balancedagainst the information already obtained from screening otherplates. Therefore, overall plate diversity defined via Murckoscaffolds was the objective function we needed to optimize.
A wealth of optimization algorithms existed for this purpose.To keep computational demands in sensible bounds, we selecteda straightforward, iterative approach based on self-consistency ofthe chosen plate set. The flowchart for our algorithm is depictedin Figure 1. First, the number of unique Murcko scaffolds wascalculated for each plate. Because the objective of plate selectionwas to cover the highest possible number of Murcko scaffolds ina given number of plates, the plate showing the largest number of Murcko scaffolds was selected as the primary plate for thescreening set. Next, the cumulative number of unique scaffoldscould be calculated for any selection of the 1st N plates. Thenumber of additional unique scaffolds gained by adding more
by guest on September 13, 2016jbx.sagepub.comDownloaded from

Crisman et al.
322 www.sbsonline.org Journal of Biomolecular Screening 12(3); 2007
plates to the existing selection was defined here as the informa-tion gain. (Note that this term should not be confused with a sim-ilar term used in information theory [i.e., as a measure of entropyloss of a system], thereby also causing “information gain.”)Because the scaffold overlap between plates chosen up to thispoint and the newly selected plate were per se unrelated to thetotal number of unique scaffolds present on the new plate, theinformation gain added by a new plate may even be larger forplates that contained a smaller absolute number of unique scaf-folds. This is true under the condition that the novel scaffoldswere dissimilar to the ones encountered previously. Thus,although overall the number of unique scaffolds per plate pro-vided a rough estimate of the information gain that can beexpected, only the determination of scaffold overlap led to thenumber of truly novel scaffolds. In the next step, the plates wereresorted by decreasing information gain (or novel scaffolds). Thisprocess was repeated until a convergence criterion of no (or verylittle) information gain between 2 iterations was achieved. This isillustrated in Figure 1, where—in a simplified example—thecumulative number of unique scaffolds found on the first 2 plateswas optimized. In the real-world setting, the total number ofplates as well as the number of plates selected was considerablylarger.
According to our experience with the Novartis collection,5 iterations were adequate for optimizing the plate selection. As alluded to above, a relatively high correlation between thenumber of unique scaffolds per plate and the information gainencountered might have been responsible for this small numberof iterations necessary for optimization. Still, as we show later,optimization of the plate selection step was greatly superior torandom selection alone. The Novartis collection was not orderedor unordered in any particular way. The number of iterationswas dependent on the structure of the library, if there is any. Itshould be noted that no attempt was made to consider howmany members of a scaffold class were needed to fully repre-sent the scaffold.
Laplacian-modified Bayesian models
We have applied the Laplacian-modified Bayesian model tobuild in silico structure-activity models of compounds, basedon their ECFP-413 as predictive variables. ECFP-4 fingerprintsare circular in nature, describing the atom connectivity aroundevery heavy atom of the compound. Hert et al.13 recentlyshowed that ECFP-4 fingerprints were by far the most effectivemolecular representation in an exhaustive comparison of topo-logical descriptors for similarity-based virtual screening ondata sets taken from the MDL Drug Data Report and, therefore,were selected for this study. Hert et al.13 benchmarked 4 typesof descriptors: structural keys, hashed fingerprints, circularsubstructure descriptors, and pharmacophore vectors.
Unlike simple Bayesian models, the Laplacian modification ismore suitable for HTS data because it can treat very frequent orvery rare features, which normally either lead to overconfident orrandom predictions. The derivation of the Laplacian-modifiedBayesian models has been described previously.29 The Laplacian-corrected estimator for a compound being active given a featureFi, Pcorr(Active|Fi), is calculated according to the following equa-tion: Pcorr(Active|Fi) = [A + P(Active)K]/(B + K), where a featureFi is contained in B samples, and A of those B samples are active.An estimate of the baseline probability of a randomly chosencompound being active, P(Active), is simply the ratio between theactive compounds and the total number of compounds selectedfor the training. K is a constant used to add virtual samples of
1 300 3002 320 203 610 2904 950 340
Plate AddedScreen
Plate AddedScreen
Plate AddedScreen
4 340 3401 2903 930 3002 20
CumulativeNumber of
Unique Scaffolds
CumulativeNumber of
Unique Scaffolds
CumulativeNumber of
Unique Scaffolds
4 3 3403 3001 930 2902 20
1+2+3+4+…+n
1+2+3+4+…+n
1+2+3+4+…+n
100000
100000
100000
100000
100000
100000
Sort By Information Gain(Added Novel Scaffolds)
Sort By Information Gain(Added Novel Scaffolds)
1
… …
0
Information Gain(=Unique Scaffolds Per
Plate)
Information Gain(=Unique Scaffolds Per
Plate)
Information Gain(=Unique Scaffolds Per
Plate)
4 340
1
630
950
640
950
…
… ……
… ……
FIG. 1. Flowchart of steps in the “plate cherry-picking” algorithm.The high-throughput screening (HTS) plates selected are optimized withrespect to the number of different scaffolds present in the set, therebymaximizing the information retrieved from the HTS screening whileminimizing effort (time, compounds). Plate selection is performed untilself-consistency of the plate set (maximum information, given a fixednumber of plates) is achieved. Iteratively, the plates exhibiting the high-est number of novel scaffolds are pulled to the top of the list. In the sim-plified example above, given 4 plates, the cumulative number of uniquescaffolds found after screening 2 plates is improved consistently.
by guest on September 13, 2016jbx.sagepub.comDownloaded from

A Novel Sequential Screening Procedure
Journal of Biomolecular Screening 12(3); 2007 www.sbsonline.org 323
P(active) to stabilize the estimator when the value of B is too low.Once the values of Pcorr(Active|Fi) are known, one can calculate arelative estimate, Pfinal(Active|Fi), in the following manner:Pfinal(Active|Fi) = Pcorr(Active|Fi)/P(Active).
More than 1 feature is normally required to characterize acompound. Therefore, the multiple features Fi in a sample haveto be combined. Given n features for a compound, the com-bined estimation, Pcombined, is calculated as follows: Pcombined =Pfinal(Active|F1) × Pfinal(Active|F2) . . . × Pfinal(Active|Fn).
RESULTS AND DISCUSSION
To study the added value of “plate cherry-picking” selectionover a random selection of plates, we compared the uniqueMurcko scaffolds found in 710 plates from our complete screen-ing library. (Note that a 384-well format plate contains 352 testcompounds plus the controls. Thus, 250K compounds, or 25% ofthe 1 million compounds typically screened, are selected.) Thenumber of scaffolds found using the optimized selection wascompared to that obtained in 10,000 random selections of thesame number of plates. The results, shown in Figure 2, depictthe fraction of scaffolds found during the optimization proceduredescribed earlier, compared to the best and the worst scaffoldcoverage obtained in the 10,000 random selection runs. Afterabout 3 iterations, the optimum scaffold coverage is achieved, inwhich 50% of Murcko scaffolds are covered by selecting 25% of
the whole library. In absolute numbers, 136,000 Murcko scaf-folds were captured on the 710 plates. By comparison, a randomscreen would capture only one third of the total unique scaffolds.In absolute numbers, the “plate cherry-picking” selection in the5th iteration outperformed the best random selection by 30,000unique Murcko scaffolds and over 40,000 in the worst randomselection of the plates. Therefore, the plate-based diversity selec-tion is able to considerably improve scaffold coverage of screen-ing collection subsets.
Next, we studied the effectiveness of the “plate cherry-picking”concept in prospectively identifying active compounds (IC50 <10 µM) and scaffolds in 11 recent HTS campaigns in which thesame deck was screened. These targets included chemokines,GPCRs, protein-protein interactions, kinases, metallopro-teinases, and a pathway screen. Hit rates of the full deck, com-pared to those of the plate diversity selection, are shown inFigure 3 for individual targets (gray bars). In 8 of 11 cases, con-siderably more actives are identified than would be expected inscreening just 25% of the deck. On average, 32% of the activesare identified by our plate diversity selection method. Based onthese HTS campaigns studied here, diversity-based compoundselection is able to retrieve more than its random share of activecompounds from a screening run. Results are even more impres-sive if the fraction of active scaffolds is considered (black bars inFig. 3). In this case, on average, 61.2% of all active scaffolds arefound by screening only 25% of the screening deck based on ourplate diversity selection method. Because scaffolds are the cru-cial starting points for later lead optimization stages, we can state that, on the compound sets studied here, we are able todecrease the screening effort to about 25% while gaining 60% ofthe scaffold-related activity information.
Based on the same 11 HTS campaigns, we performed acomparison of primary and validated screening data for thegeneration of activity models, followed by cherry picking ofnew compounds. A detailed analysis of this part of the study isshown in Figure 4 for individual compounds and in Figure 5for Murcko scaffolds.
For each individual campaign, the fraction of active (vali-dated IC50) compounds found in the 25% selection is shown inblue (Fig. 4; those numbers correspond to the gray and blackbars in Fig. 3). The smaller blocks above the blue bars refer tothe fraction of additional active compounds identified viacherry picking, based on in silico structure-activity models.The 2 solid and textured bars for each HTS campaign/targetrefer to the way activity models were generated—for modelsbased on validated (IC50) data, textured bars are plotted; forthose based on primary (percentage inhibition) data, solid col-ors are used. The models built on the primary data, on average,identify 67.3%, whereas those generated from IC50 data aver-aged 65.9%. Thus, both models may be said to be, overall, ofsimilar quality.
0.3
0.32
0.34
0.36
0.38
0.4
0.42
0.44
0.46
0.48
0.5
1st iteration
2nd iteration
3rd iteration
4th iteration
5th iteration
worst random
best random
% s
caff
old
s
80000
90000
100000
110000
120000
130000
140000
# sc
affo
lds
FIG. 2. Comparison of scaffold enrichment through “plate cherrypicking” versus random selection. Percentage and absolute number ofscaffolds captured in the 250K-compound selection (25%) are com-pared to the full screening collection of 1 million compounds. Byscreening a quarter of the compounds, half of the scaffolds of the librarycan be screened, optimizing the information obtained from the screen-ing. Although diversity-based selection is able to select 50% of the scaf-folds in the reduced set, random selection of the same number ofcompounds, repeated 10,000 times, falls far short of this number andselects only between 33% and 37% of the scaffolds.
by guest on September 13, 2016jbx.sagepub.comDownloaded from

Crisman et al.
324 www.sbsonline.org Journal of Biomolecular Screening 12(3); 2007
We would like to emphasize that in some cases, the initialenrichment favored the IC50 values by a statistically significantmargin. Thus, when cherry-picking capacity is limited to 2000compounds, the IC50 values build better models. On the otherhand, when cherry-picking capacity is high, primary data canbuild models almost as well if not better than the IC50 data. Thisresult seemed to be quite remarkable to us.
0%
10%
20%
30%
40%
50%
60%
70%
80%
chemokine receptor 1
chemokine receptor 2
GPCR 1
GPCR 2
kinase 1
kinase 2
metalloproteinase 1
metalloproteinase 2pathway screen 1
PPI 1
PPI 2
Average
Actives Found in 25% OfScreening Collection
Com
poundsS
caffolds
FIG. 3. Percentages of active compounds and scaffolds found in theoptimally diverse compound selection versus the entire library. Thefigure shows the effectiveness of plate diversity selection (Figs. 1 and 2)on retrieving active compounds across 11 different high-throughputscreening (HTS) campaigns. Shown is the number of actives retrievedfrom the 250K diversity set. In 8 of 11 cases, considerably more than25% of the actives are identified in 25% of the compounds screened.On average, 32% of actives are identified by plate diversity selectionof 25% of the plates. For active scaffolds, this number is an impressive62% that are identified in the 250K screening set. PPI, protein-proteininteraction; GPCR, G-protein-coupled receptor.
FIG. 4. Increased recall of active compounds through focusedscreening of compounds selected by the Laplacian-modified Bayesianmodels. The figure shows the effectiveness of plate diversity selectionon retrieving active compounds across 11 different high-throughputscreening (HTS) campaigns (blue bars reproduced from Fig. 3),enriched by compound “cherry picking” via 2 different kinds ofLaplacian-modified Bayesian models described in Methods. First,cherry picking of the number of compounds shown on the right wasperformed based on primary activity models (solid color). Second,cherry picking was performed based on validated IC50 data (texturedcolors). Surprisingly, very similar results are achieved in both cases.This indicates that activity models based on HTS data are of very sim-ilar quality to those based on validated activity data. PPI, protein-protein interaction; GPCR, G-protein-coupled receptor.
by guest on September 13, 2016jbx.sagepub.comDownloaded from

A Novel Sequential Screening Procedure
Journal of Biomolecular Screening 12(3); 2007 www.sbsonline.org 325
The above analysis was repeated but with Murcko scaffolds asshown in Figure 5. Here, each cherry-picked set represents anadditional 400 unique Murcko scaffolds. By repeating this step10 times, thus cherry-picking the next 4000 unique Murcko scaf-folds, in the first 25% of the collection, an average of 73.3% ofthe active Murcko scaffolds were discovered by the models built
on IC50 data. This is a very similar number to, on average, 72.4%of the scaffolds that were identified by models based on primarydata.
To summarize, although statistical activity models based onprimary data have been called into question because of the highprevalence of false positives (due to possible interference withthe assay30 or aggregate formation31-33), we show on a broaddata basis (11 HTS campaigns, diverse target types) that activ-ity models built on primary data were of at least comparablequality to the models built on the more accurate IC50 data. It isour hypothesis that this is in part due to the Laplacian-modifiedBayesian models’ ability to deal with noisy data.15
Figure 6 presents the possible costs and cost-effectiveness ofscreening the full deck versus the “plate diversity” selection. Itcannot be stressed strongly enough that these are only “ballpark”estimates and that the true costs will vary from assay to assay,and such estimates fail to account for some intangible costs such as the extra work “plate cherry picking” would create forcompound management, the increased requirement for chemin-formatic project team support, and the increased need for infor-matics support to track compounds through these processes. Inthese estimates, it is assumed that some of the time and costs for
FIG. 5. Increased recall of active scaffolds found by Laplacian-modified Bayesian models. The figure shows the effectiveness ofplate diversity selection on the identification of Murcko scaffolds ofactive compounds. As in Figure 4, activity models built on primaryand secondary data showed very similar performance in cherry-picking active structures. PPI, protein-protein interaction; GPCR,G-protein-coupled receptor.
Screen all1,000,000 cmpds
Primary hitrate~ 0.12%
1,200 compounds
Validated Hits~600
Full Deck
1 FTE, 9-12 -Months$1 mio , ~$1700/hit
Assay developmentand adaptation
Assay developmentand adaptation
“plate diversity”selection
250,000 cmpds
Single round ofTrage & Cherry Pick
10,000-20,000,compounds
Validated Hits~500
Primary hit rate~ 0.4%
1,000 comounds
PlateCherry Picking
1
~3-4 Mon.s
~3-4 Mon.s
~4-6 Mon.s
Hit List TriagingCherry-Picking
1 FTE, 8-11-Months$250,000, ~$500/hit
FIG. 6. A comparison between 2 screening scenarios: screening a fulldeck of 1 million compounds versus the “plate diversity” selection. The“cost” element describes only the cost of materials and reagents for theassay (this is where most savings due to iterative screening occur). FTE,full-time equivalent.
by guest on September 13, 2016jbx.sagepub.comDownloaded from

Crisman et al.
326 www.sbsonline.org Journal of Biomolecular Screening 12(3); 2007
running a screen will remain constant. For example, the timerequired to develop and validate an assay into a format suitablefor screening is assumed to require 3 to 4 months, regardless ofwhether the assay is used for comprehensive screening or platecherry picking. Likewise, the assumption is made that validationof hits (i.e., the generation and analysis of dose-response curves)for the primary hits will also require 2 to 3 months, regardless ofthe screening strategy used. Because of these fixed constraints,the time taken to screen the full deck or to do plate cherry pick-ing is estimated to be very similar. Indeed, the holistic compari-son of the full-deck and plate cherry-picking strategies (Fig. 6)indicates that in terms of elapsed time and full-time equivalent(FTE) requirements, the 2 approaches are near equivalent (9-12vs. 8-11 months, respectively; 1 FTE in both cases). A 4-foldsaving in operating expenditures is realized on adopting the platecherry-picking strategy. However, it must be stressed that thesetimelines are best-case “guesstimates.” Many of the uncertaintiescome from trying to estimate the time required for setting up andvalidating automation equipment, maintaining cell lines, andother “fixed” overheads.
CONCLUSIONS
In this work, we described a semi-sequential screening para-digm employing a plate cherry-picking concept. This approachmaximizes the information content (number of cumulativeunique scaffolds) that is selected for screening by cherry-pickingwhole plates (“250K selection”). We have shown that by screen-ing this selected 25% of the collection, one captures about 50%or more of the scaffolds. Furthermore, by retrospectively analyz-ing 11 HTS campaigns covering a wide range of targets, weshow that by screening this selected 25% of the library followedby in silico directed expansion, we are able to capture an aboverandom share of all actives and an even more impressive fractionof active scaffolds. Thus, plate-based diversity selection and sta-tistical modeling are able to save on compounds and screeningexpenditure while providing optimal information about activescaffolds for later lead optimization stages. It also avoids thetime-consuming step of cherry-picking individual compounds,thus saving screening time.
Primary screening data are considered to be noisy, sometimestoo noisy to generate reliable structure-activity models. In thiswork, we show that this is not generally true. Comparing themodels based on primary and validated screening data, we showthat cherry picking, after running the 25% plate-based diversityselection, gives in fact very similar numbers in terms of activecompounds in the cherry-picked sets. For small cherry-pickedsets (2000 compounds), IC50 data seem to have a slight advan-tage, but this is not the case for larger sets. Approaching a cherrypick of 20,000 compounds, primary inhibition data seem to havethe edge over validated data for model building. This may be dueto the larger data set available: over 11 HTS campaigns, 67.3%
of all actives are identified by models based on primary data,whereas 65.9% of all actives are identified by those built on val-idated activity data. It is our opinion that by employing a BayesClassifier, we are able to handle noisy HTS data very effectively,and this is the reason for these seemingly unexpected results.
The plate diversity approach is most appropriate when thenumber of targets being screened is greater than the screeningcapacity or the assay is very expensive (in terms of reagent cost,supply, data analysis, or time). The plate diversity approach isunlikely to yield all actives that could have been found by screen-ing of the full library. However, in situations in which the numberof compounds that could be screened is limited, the plate diver-sity approach will make better use of the resources. The platediversity approach is also useful in situations in which the objec-tive of the screen is not to obtain as many hits as possible but toidentify a small set of tool compounds or to validate a target.
REFERENCES
1. Hann MM, Oprea TI: Pursuing the leadlikeness concept in pharmaceuti-cal research. Curr Opin Chem Biol 2004;8:255-263.
2. Sneader W: Drug Prototypes and their Exploitation. London: John Wiley,1996.
3. Macarron R: Critical review of the role of HTS in drug discovery. DrugDiscov Today 2006;11:277-279.
4. Davies JW, Glick M, Jenkins JL: Streamlining lead discovery by aligning insilico and high-throughput screening. Curr Opin Chem Biol 2006;10:1-9.
5. Schnecke V, Bostrom J: Computational chemistry-driven decision mak-ing in lead generation. Drug Discov Today 2006;11:43-50.
6. Shoichet BK: Virtual screening of chemical libraries. Nature 2004;432:862-865.
7. Chin DN, Chuaqui CE, Singh J: Integration of virtual screening into thedrug discovery process. Mini Rev Med Chem 2004;4:1053-1065.
8. Young SS, Lam RL, Welch WJ: Initial compound selection for sequentialscreening. Curr Opin Drug Discov Dev 2002;5:422-427.
9. Bender A, Glen RC: Molecular similarity: a key technique in molecularinformatics. Org Biomol Chem 2004;2:3204–3218.
10. Bender A, Jenkins JL, Li Q, Adams SE, Cannon EO, Glen RC: Molecularsimilarity: advances in methods, applications and validations in virtualscreening and QSAR. Annu Rep Comput Chem 2006;2:145–173.
11. Jenkins JL, Glick M, Davies JW: A 3D similarity method for scaffoldhopping from known drugs or natural ligands to new chemotypes. J MedChem 2004;47:6144–6159.
12. Hert J, Willett P, Wilton DJ, Acklin P, Azzaoui K, Jacoby E, et al: Newmethods for ligand-based virtual screening: use of data fusion andmachine learning to enhance the effectiveness of similarity searching. JChem Inf Model 2006;46:462-470.
13. Hert J, Willett P, Wilton DJ, Acklin P, Azzaoui K, Jacoby E, et al:Comparison of topological descriptors for similarity-based virtual screen-ing using multiple bioactive reference structures. Org Biomol Chem 2004;2:3256-3266.
14. Rusinko A, Farmen MW, Lambert CG, Brown PL, Young SS: Analysis ofa large structure/biological activity data set using recursive partitioning. JChem Inf Comput Sci 1999;39:1017-1026.
by guest on September 13, 2016jbx.sagepub.comDownloaded from

A Novel Sequential Screening Procedure
Journal of Biomolecular Screening 12(3); 2007 www.sbsonline.org 327
15. Glick M, Klon AE, Acklin P, Davies JW: Enrichment of extremely noisyhigh-throughput screening data using a naive Bayes classifier. J BiomolScreen 2004;9:32-36.
16. Diller DJ, Hobbs DW: Deriving knowledge through data mining high-throughput screening data. J Med Chem 2004;47:6373-6383.
17. Warmuth MK, Liao J, Ratsch G, Mathieson M, Putta S, Lemmen C: Activelearning with support vector machines in the drug discovery process. J ChemInf Comput Sci 2003;43:667-673.
18. Makino S, Kuntz ID: Automated flexible ligand docking method and itsapplication for database search. J Comput Chem 1997;18:1812-1825.
19. Rarey M, Kramer B, Lengauer T, Klebe G: A fast flexible dockingmethod using an incremental construction algorithm. J Mol Biol 1996;261:470-489.
20. Jones G, Willett P, Glen RC, Leach AR, Taylor R: Development and valida-tion of a genetic algorithm for flexible docking. J Mol Biol 1997;267:727-748.
21. Friesner RA, Banks JL, Murphy RB, Halgren TA, Klicic JJ, Mainz DT, et al:Glide: a new approach for rapid, accurate docking and scoring. 1. Methodand assessment of docking accuracy. J Med Chem 2004;47:1739-1749.
22. Abagyan R, Totrov M, Kuznetsov D: ICM—a new method for proteinmodeling and design: applications to docking and structure prediction fromthe distorted native conformation. J Comput Chem 1994;15:488-506.
23. Valler MJ, Green D: Diversity screening versus focused screening in drugdiscovery. Drug Discov Today 2000;5:286-293.
24. Bemis GW, Murcko MA: The properties of known drugs. 1. Molecularframeworks. J Med Chem 1996;39:2887-2893.
25. Xia X, Maliski EG, Gallant P, Rogers D: Classification of kinaseinhibitors using a Bayesian model. J Med Chem 2004;47:4463-4470.
26. Bishop AC, Ubersax JA, Petsch DT, Matheos DP, Gray NS, Blethrow J,et al: A chemical switch for inhibitor-sensitive alleles of any proteinkinase. Nature 2000;407:395-401.
27. Gray NS, Wodicka L, Thunnissen AM, Norman TC, Kwon S, EspinozaFH, et al: Exploiting chemical libraries, structure, and genomics in thesearch for kinase inhibitors. Science 1998;281:533-538.
28. Johnson SA, Hunter T: Kinomics: methods for deciphering the kinome.Nat Methods 2005;2:17-25.
29. Nidhi, Glick M, Davies JW, Jenkins JL: Prediction of biological targetsfor compounds using multiple-category Bayesian models trained onchemogenomics databases. J Chem Inf Model 2006;46:1124-1133.
30. Roche O, Schneider P, Zuegge J, Guba W, Kansy M, Alanine A, et al:Development of a virtual screening method for identification of “frequenthitters” in compound libraries. J Med Chem 2002;45:137-142.
31. Seidler J, McGovern S, Doman T, Schoichet B: Identification and predic-tion of promiscuous aggregating inhibitors among known drugs. J MedChem 2003;46:4477-4486.
32. McGovern S, Caselli E, Grigorieff N, Schoichet B: A common mecha-nism underlying promiscuous inhibitors from virtual and high-throughputscreening. J Med Chem 2002;45:1712-1722.
33. McGovern SL, Shoichet BK: Kinase inhibitors: not just for kinases any-more. J Med Chem 2003;46:1478-1483.
Address reprint requests to:Meir Glick
Novartis Institutes for Biomedical Research Inc.250 Massachusetts Ave.Cambridge, MA 02139
E-mail: [email protected]
by guest on September 13, 2016jbx.sagepub.comDownloaded from