Plasticity in the Macromolecular-Scale Causal Networks of Cell Migration
17
Plasticity in the Macromolecular-Scale Causal Networks of Cell Migration John G. Lock 1 * . , Mehrdad Jafari Mamaghani 1,2. , Hamdah Shafqat-Abbasi 1 , Xiaowei Gong 1 , Joanna Tyrcha 2 , Staffan Stro ¨ mblad 1 * 1 Center for Biosciences, Department of Biosciences and Nutrition, Karolinska Institutet, Huddinge, Sweden, 2 Division of Mathematical Statistics, Department of Mathematics, Stockholm University, Stockholm, Sweden Abstract Heterogeneous and dynamic single cell migration behaviours arise from a complex multi-scale signalling network comprising both molecular components and macromolecular modules, among which cell-matrix adhesions and F-actin directly mediate migration. To date, the global wiring architecture characterizing this network remains poorly defined. It is also unclear whether such a wiring pattern may be stable and generalizable to different conditions, or plastic and context dependent. Here, synchronous imaging-based quantification of migration system organization, represented by 87 morphological and dynamic macromolecular module features, and migration system behaviour, i.e., migration speed, facilitated Granger causality analysis. We thereby leveraged natural cellular heterogeneity to begin mapping the directionally specific causal wiring between organizational and behavioural features of the cell migration system. This represents an important advance on commonly used correlative analyses that do not resolve causal directionality. We identified organizational features such as adhesion stability and adhesion F-actin content that, as anticipated, causally influenced cell migration speed. Strikingly, we also found that cell speed can exert causal influence over organizational features, including cell shape and adhesion complex location, thus revealing causality in directions contradictory to previous expectations. Importantly, by comparing unperturbed and signalling-modulated cells, we provide proof-of-principle that causal interaction patterns are in fact plastic and context dependent, rather than stable and generalizable. Citation: Lock JG, Mamaghani MJ, Shafqat-Abbasi H, Gong X, Tyrcha J, et al. (2014) Plasticity in the Macromolecular-Scale Causal Networks of Cell Migration. PLoS ONE 9(2): e90593. doi:10.1371/journal.pone.0090593 Editor: Jung Weon Lee, Seoul National University, Republic of Korea Received October 13, 2013; Accepted February 3, 2014; Published February 28, 2014 Copyright: ß 2014 Lock et al. This is an open-access article distributed under the terms of the Creative Commons Attribution License, which permits unrestricted use, distribution, and reproduction in any medium, provided the original author and source are credited. Funding: This work was supported by grants to SS from the EU-FP7– Systems Microscopy NoE (Grant No. HEALTH-F4-2010-258068), the Centre for Biosciences at KI, the Swedish Research Council and the Swedish Cancer Society. Imaging occurred at the live cell-imaging unit at the Department of Biosciences and Nutrition at KI, supported by grants from the Knut and Alice Wallenberg Foundation, the Swedish Research Council and the Centre for Biosciences at KI. The funders had no role in study design, data collection and analysis, decision to publish, or preparation of the manuscript. Competing Interests: The authors have declared that no competing interests exist. * E-mail: [email protected] (SS); [email protected] (JGL) . These authors contributed equally to this work. Introduction A key challenge in biology is to understand how information is coordinated globally within cells to generate and control complex cellular processes, such as cell migration. Succinctly, what is the wiring pattern of regulation that governs a particular cell behavior? Importantly, this raises a second fundamental question that we seek to address herein: is the wiring pattern for a particular process stable and generalizable, or, plastic and contextually dependent? The answer to this second question has important implications for our understanding of both complex biological processes and the design of the experimental strategies to address them. Cell migration is a process of vital importance in numerous physiological and pathological processes including cancer cell metastasis [1]. Cell migration is indeed a highly complex cellular process, arising from a large, self-organizing molecular network to produce behaviors that are dynamic, heterogeneous and adaptable [2]. The dynamism of these behaviors suggests that underlying plasticity in the wiring of the cell migration system might be both more likely and more readily detectable than in relatively constrained cellular phenomena. Thus cell migration provides an appropriate framework within which to assess both the structure and potential plasticity of cellular wiring patterns. Cell migration is the product of interactions and interdepen- dencies operating across molecular, macromolecular, and cellular scales (see Figure 1). As noted above, a huge diversity of components comprise the network underlying migration at the molecular scale (Figure 1 A) [3–8]. Such large-scale molecular networks tend to be arranged into hierarchically nested assem- blages or modules [9,10]. These macromolecular modules often represent functional units with distinct roles whose interactions ultimately produce single cell migration behaviors (Figure 1 B and C). To understand how cell migration behaviors derive from molecular-, macromolecular- and cellular-scale organization, it is desirable to characterize all scales simultaneously and with sufficient spatiotemporal resolution to delineate functional rela- tionships between features at any scale. Live cell fluorescence imaging provides the spatiotemporal resolution to track individual migrating cells while concurrently monitoring features of their molecular- and macromolecular-scale organization. Unfortunate- ly, such imaging does not permit us to directly observe the PLOS ONE | www.plosone.org 1 February 2014 | Volume 9 | Issue 2 | e90593
Transcript of Plasticity in the Macromolecular-Scale Causal Networks of Cell Migration

Plasticity in the Macromolecular-Scale Causal Networksof Cell MigrationJohn G. Lock1*., Mehrdad Jafari Mamaghani1,2., Hamdah Shafqat-Abbasi1, Xiaowei Gong1,
Joanna Tyrcha2, Staffan Stromblad1*
1Center for Biosciences, Department of Biosciences and Nutrition, Karolinska Institutet, Huddinge, Sweden, 2Division of Mathematical Statistics, Department of
Mathematics, Stockholm University, Stockholm, Sweden
Abstract
Heterogeneous and dynamic single cell migration behaviours arise from a complex multi-scale signalling networkcomprising both molecular components and macromolecular modules, among which cell-matrix adhesions and F-actindirectly mediate migration. To date, the global wiring architecture characterizing this network remains poorly defined. It isalso unclear whether such a wiring pattern may be stable and generalizable to different conditions, or plastic and contextdependent. Here, synchronous imaging-based quantification of migration system organization, represented by 87morphological and dynamic macromolecular module features, and migration system behaviour, i.e., migration speed,facilitated Granger causality analysis. We thereby leveraged natural cellular heterogeneity to begin mapping thedirectionally specific causal wiring between organizational and behavioural features of the cell migration system. Thisrepresents an important advance on commonly used correlative analyses that do not resolve causal directionality. Weidentified organizational features such as adhesion stability and adhesion F-actin content that, as anticipated, causallyinfluenced cell migration speed. Strikingly, we also found that cell speed can exert causal influence over organizationalfeatures, including cell shape and adhesion complex location, thus revealing causality in directions contradictory to previousexpectations. Importantly, by comparing unperturbed and signalling-modulated cells, we provide proof-of-principle thatcausal interaction patterns are in fact plastic and context dependent, rather than stable and generalizable.
Citation: Lock JG, Mamaghani MJ, Shafqat-Abbasi H, Gong X, Tyrcha J, et al. (2014) Plasticity in the Macromolecular-Scale Causal Networks of Cell Migration. PLoSONE 9(2): e90593. doi:10.1371/journal.pone.0090593
Editor: Jung Weon Lee, Seoul National University, Republic of Korea
Received October 13, 2013; Accepted February 3, 2014; Published February 28, 2014
Copyright: � 2014 Lock et al. This is an open-access article distributed under the terms of the Creative Commons Attribution License, which permitsunrestricted use, distribution, and reproduction in any medium, provided the original author and source are credited.
Funding: This work was supported by grants to SS from the EU-FP7– Systems Microscopy NoE (Grant No. HEALTH-F4-2010-258068), the Centre for Biosciences atKI, the Swedish Research Council and the Swedish Cancer Society. Imaging occurred at the live cell-imaging unit at the Department of Biosciences and Nutrition atKI, supported by grants from the Knut and Alice Wallenberg Foundation, the Swedish Research Council and the Centre for Biosciences at KI. The funders had norole in study design, data collection and analysis, decision to publish, or preparation of the manuscript.
Competing Interests: The authors have declared that no competing interests exist.
* E-mail: [email protected] (SS); [email protected] (JGL)
. These authors contributed equally to this work.
Introduction
A key challenge in biology is to understand how information is
coordinated globally within cells to generate and control complex
cellular processes, such as cell migration. Succinctly, what is the
wiring pattern of regulation that governs a particular cell
behavior? Importantly, this raises a second fundamental question
that we seek to address herein: is the wiring pattern for a particular
process stable and generalizable, or, plastic and contextually
dependent? The answer to this second question has important
implications for our understanding of both complex biological
processes and the design of the experimental strategies to address
them.
Cell migration is a process of vital importance in numerous
physiological and pathological processes including cancer cell
metastasis [1]. Cell migration is indeed a highly complex cellular
process, arising from a large, self-organizing molecular network to
produce behaviors that are dynamic, heterogeneous and adaptable
[2]. The dynamism of these behaviors suggests that underlying
plasticity in the wiring of the cell migration system might be both
more likely and more readily detectable than in relatively
constrained cellular phenomena. Thus cell migration provides
an appropriate framework within which to assess both the
structure and potential plasticity of cellular wiring patterns.
Cell migration is the product of interactions and interdepen-
dencies operating across molecular, macromolecular, and cellular
scales (see Figure 1). As noted above, a huge diversity of
components comprise the network underlying migration at the
molecular scale (Figure 1 A) [3–8]. Such large-scale molecular
networks tend to be arranged into hierarchically nested assem-
blages or modules [9,10]. These macromolecular modules often
represent functional units with distinct roles whose interactions
ultimately produce single cell migration behaviors (Figure 1 B and
C).
To understand how cell migration behaviors derive from
molecular-, macromolecular- and cellular-scale organization, it is
desirable to characterize all scales simultaneously and with
sufficient spatiotemporal resolution to delineate functional rela-
tionships between features at any scale. Live cell fluorescence
imaging provides the spatiotemporal resolution to track individual
migrating cells while concurrently monitoring features of their
molecular- and macromolecular-scale organization. Unfortunate-
ly, such imaging does not permit us to directly observe the
PLOS ONE | www.plosone.org 1 February 2014 | Volume 9 | Issue 2 | e90593

Figure 1. Rationale for a coarse-grained analysis of causal influence in the cell migration system. Cell migration emerges from biologicalproperties encompassing multiple scales (A–C). At the molecular scale, thousands of distinct components and their interactions produce a complexand modular molecular network comprising the cell migration system (A). At the macromolecular scale, this network gives rise to a variety offunctional macromolecular modules (B), which collectively produce single cell migration at the cellular scale (C). Unfortunately, it is not yet possible tosynchronously record the state of the molecular network underlying cell migration with spatiotemporal resolution (D). Instead, we coarse-grain(orange arrow from A to B) this molecular complexity by focusing our analysis at the scale of macromolecular modules. Specifically, we focus onCMACs and the F-actin cytoskeleton (green ovals in B) because these core modules directly mediate the process of cell migration. Their observablefeatures exemplify the state of both: i) their own molecular components (green box in A), and; ii) extrinsic sources of regulation distributedthroughout the broader molecular network from which they integrate information (black arrows in A). This information is functionalized throughadaptive changes in the organization of these core macromolecular modules and at the cellular-scale, leading to associated changes in migratorybehaviour. Through imaging and quantitative analysis of individual migrating cells expressing EGFP-Paxillin and RubyRed-LifeAct (markers for CMACand F-actin modules, respectively), we extract 88 quantitative features defining organizational (E) and behavioural features (F) of the cell migrationsystem (see Supporting Tables S1 and S2 for feature descriptions). Briefly, organizational features include those describing core macromolecular modulestatus (lime-green boxes in E, e.g. CMAC area, CMAC lifetime, RubyRed-LifeAct intensity within CMACs, etc) and cellular-scale morphological features(pink boxes in E, e.g. cell perimeter, cell compactness (roundness), number of CMACs per cell), while behavioral features addressed in this study relateexclusively to cell migration speed (F). Finally, Granger causality analysis enables causal influence mapping to define the nature and direction of causalinformation flow between pairs of these coarse-grained features of the cell migration system (G).doi:10.1371/journal.pone.0090593.g001
Plasticity in Causal Networks of Cell Migration
PLOS ONE | www.plosone.org 2 February 2014 | Volume 9 | Issue 2 | e90593

complete state of molecular networks underlying cell migration
(Figure 1 D), and as a consequence we cannot synchronously and
globally observe how molecular signaling pathways are integrated.
The canonical means to overcome such limitations on direct
observation have been to assemble, piecewise, the functional
contributions and relations of individual molecular components
through perturbation-based epistasis analyses. Yet, despite facili-
tating great progress, reductionist perturbation-based approaches
alone may be insufficient to provide a systems-level understanding,
particularly of dynamic, heterogeneous processes with potentially
emergent properties [11–14]. In particular, there are substantial
risks of misattribution associated with the inference of molecular
function based on targeted component perturbation [15]. Thus,
there remain significant limitations on our ability to spatiotempo-
rally resolve, either through direct observation or perturbation-
based inference, how global information processing at the
molecular scale gives rise to migratory behaviors.
Given the modularity in molecular network structure noted
above, an alternative strategy is to analyze the state and
interactions of functional macromolecular modules within migrat-
ing cells. This provides a means to coarse-grain the overwhelming
molecular-scale complexity to a level that is tractable with
imaging-based approaches, as recently demonstrated [16,17]
(Figure 1 A and B). However, even given such coarse-graining,
it remains necessary to focus on a subset of selected modules that
are central to the process of interest. In the case of (mesenchymal)
cell migration, integrin-mediated cell-matrix adhesion complexes
(CMACs – including focal adhesions, focal complexes and nascent
adhesions) and the F-actin microfilament system are core
macromolecular modules that directly mediate the migratory
process (Figure 1 B) [8,18,19]. CMACs and F-actin serve as both
mechanochemical-sensors and -transmitters, acting at the interface
between cells and their environment to collect and functionalize
information derived from extrinsic regulators in the distributed
molecular network (Figure 1 A) [7,20]. As such, their status is
innately linked to, and therefore partially representative of, the
aggregate informational state of the cell migration system as a
whole [8].
Using live cell fluorescence imaging and quantitative image
analyses, organizational features (morphological, positional, dynam-
ical and compositional) of the cell migration system can be
extracted to create a quantitative, multivariate characterization of
CMAC and F-actin status on a per cell basis, as well as of cellular
scale morphology (Figure 1 E). Simultaneously, behavioral features
can be recorded describing the migration of the same individual
cells (Figure 1 F). This facilitates two of the critical enabling
capabilities of the research framework described herein, namely
the: i) direct integration, and ii) temporal resolution of organizational
and behavioral data on a per cell basis [21].
Firstly, direct data integration on a per cell basis allows the co-
variance that arises between any two features as a result of natural
cellular heterogeneity to define inter-feature correlations, making
perturbations unnecessary to achieve this result. Crucially, this
includes defining the relationships between features of cell
organization and behavior. Secondly, the temporal resolution of
variations in feature values allows us to move beyond correlative
analyses to define the direction of information flow, in the form of
causal influence, between pairs of system features using the
Granger causality concept. Again, unlike many other systems-level
causal analyses using, for example, network perturbation ap-
proaches [17,22–25], directed causal influences can be defined
using Granger causality without the need for perturbations.
The Granger causality concept originates from the field of
econometrics [26,27], wherein the study of causality cannot
routinely be facilitated by perturbation-based analysis. Similarly,
Granger causality has become a key tool in the perturbation-
independent mapping of neural connectivity and information
processing [28]. Herein we demonstrate one of the first
implementations of this approach to the study of fundamental
cell biology [15]. Essentially, the Granger conception of causality
stipulates causation if the combination of past information from
both a background variable, X, and a response variable, Y,
improves the prediction of future values of Y, when compared to
prediction of Y based on only its own past values. Such improved
prediction implies the presence of unique, pre-emptive informa-
tion in variable X and therefore its causal influence over variable
Y.
We now apply a statistical implementation of the Granger
causality concept to map directionally specific causal influences
between pairs of recorded features (Figure 1 G). Thus we begin to
define a wiring pattern for the unperturbed cell migration system.
Subsequently, we employ well-characterized perturbations to
reveal plasticity in this wiring pattern. This is a fundamentally
important finding because it demonstrates that the perturbations
frequently used to illuminate wiring patterns may, in some cases,
partially distort our view of such information processing structures.
We therefore propose that, for the purpose of mapping
information flow in complex cellular systems, perturbation-
independent strategies such as that described herein may provide
a valuable complement to existing perturbation-dependent
approaches.
Results
Imaging and Quantitative Analysis of IndividualMigrating CellsLive randomly migrating H1299 (human non-small cell lung
carcinoma) cells stably expressing EGFP-Paxillin (CMAC marker)
and RubyRed-LifeAct (F-actin marker) (H1299-P/L cells) were
imaged by confocal microscopy. More than 4200 images were
analyzed to segment and track individual cells, as well as their
cohort of CMACs (totaling .70 000 CMACs) (Figure 2,
Supporting Movie S1). We then extracted 88 quantitative features
(Supporting Table S1) characterizing CMACs, their associated F-
actin, cell morphology and cell migration on a per cell basis to
produce a coarse-grained, synchronous characterization of cell
migration system organization and behavior based on morphological,
positional, dynamical and compositional features. Features
encapsulate differing states of data aggregation in accordance
with spatial and temporal data hierarchies (Supporting Figure S1).
Experimental and analytic standardization ensured the consistency
of quantitative data between, as well as within the time-course of,
individual experimental repeats (Supporting Figure S2).
Confirmation of a General Quantitative Link betweenOrganizational and Behavioral FeaturesA critical premise of this study is that the quantitatively recorded
CMAC, F-actin and cell morphological features should act as
informative representatives of the organizational state of the broader
cell migration system, and should therefore correlate on a per cell
basis with the behavioral output of that system. We tested this
premise to verify the basic relevance and informational value of
our extracted organizational features by determining whether
difference hierarchies, summarizing relative statistical distances
between cell subpopulations, were equivalent for measures of
organization and behavior (Supporting Figure S3). Importantly, we
used two complementary methodologies, stratifying control cell
subpopulations based on either their organizational (Supporting
Plasticity in Causal Networks of Cell Migration
PLOS ONE | www.plosone.org 3 February 2014 | Volume 9 | Issue 2 | e90593

Figure S3 A–D) or behavioral (Supporting Figure S3 E–G) features.
In both cases, we observed an ordinal equivalence between the
difference hierarchies defined in organizational and behavioral data.
These findings confirm the existence of a quantitative link between
our organizational and behavioral measures, and further hint at the
possibility of their functional correspondence.
Selection of Organizational Features Associated with CellMigration SpeedWe next used two independent feature selection methods to
identify specific subsets of organizational features that were
associated with variations in our main behavioral measure,
Instantaneous Cell Speed (ICS). Firstly, we used canonical vector
analysis (CVA) to cluster the slowest (S1, 1–20%) and fastest (S5,
81–100%) moving quintiles of control cells using all organizational
variables (Figure 3 A). CVA effectively separated these subpop-
ulations along the 1st canonical vector. Accordingly, ranking of
variables based on their absolute loading coefficient in the 1st
canonical vector highlighted organizational features associated with
the behavioral divergence between fast and slow migrating cells
(Figure 3 B).
As an alternative feature selection method, we performed
multiple regression via the elastic net (EN-regression) to estimate
cell migration behavior (ICS, response variable) based on iteratively
optimized combinations of 81 normalized organizational features
(background variables, non-normalizable features were excluded
to satisfy assumptions of ordinary linear regression). EN-regression
was specifically selected for this task due to the enhanced stability
of models produced in the presence of multicollinear background
variables. The resulting EN-regression model achieved a maximal
adjusted R2 value of 0.43, thus explaining 43% of the observed
variability in ICS in a linear regression model (Figure 3 C).
Figure 2. Imaging, segmentation and tracking of migrating cells and their CMACs. Confocal imaging of EGFP-Paxillin (A) and RubyRed-LifeAct (B) was performed simultaneously for 8 h at 5 min intervals (Supporting Movie S1 [left]). EGFP-Paxillin (C) and RubyRed-LifeAct (D) imageswere processed by median filtering and background correction. RubyRed-LifeAct signal was used for automated cell segmentation (dark blue outlinein E–H). CMACs were segmented based on EGFP-Paxillin signals (red outlines in E, Supporting Movie S1 [center], and enlarged in F from white box inE). The RubyRed-LifeAct channel is shown overlayed by the EGFP-Paxillin-segmentation profile from E (G and enlarged in H from white box in G). Cellsand CMACs were tracked via nearest neighbor analysis. CMAC tracking clearly differentiates stationary adhesions (I, enlarged in J from cell front(white box) in I) from sliding adhesions (I, enlarged in K from cell rear (yellow box) in I) (CMAC trajectories color coded for time, #10 time pointsshown, Supporting Movie S1 [right]). (L) Cell displacement over several hours (images from three time points, 0 h:20 min, 3 h:10 min, 5 h:50 minoverlayed as red, green, blue, respectively). Quantitative variables describing cell and CMAC features/dynamics were automatically extracted (88Single Cell Scale variables, Supporting Table S1, 29 variables defining individual CMACs, Supporting Table S2). Scale bars: A–K= 10 mm; L = 20 mm.doi:10.1371/journal.pone.0090593.g002
Plasticity in Causal Networks of Cell Migration
PLOS ONE | www.plosone.org 4 February 2014 | Volume 9 | Issue 2 | e90593
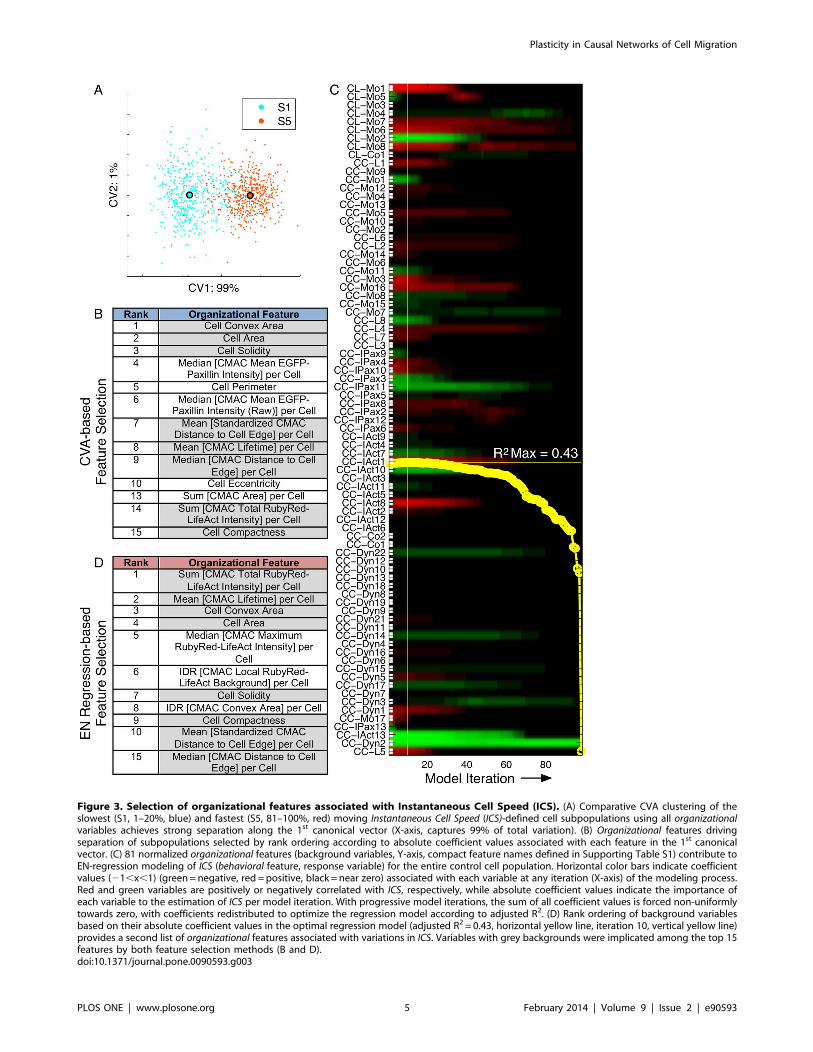
Figure 3. Selection of organizational features associated with Instantaneous Cell Speed (ICS). (A) Comparative CVA clustering of theslowest (S1, 1–20%, blue) and fastest (S5, 81–100%, red) moving Instantaneous Cell Speed (ICS)-defined cell subpopulations using all organizationalvariables achieves strong separation along the 1st canonical vector (X-axis, captures 99% of total variation). (B) Organizational features drivingseparation of subpopulations selected by rank ordering according to absolute coefficient values associated with each feature in the 1st canonicalvector. (C) 81 normalized organizational features (background variables, Y-axis, compact feature names defined in Supporting Table S1) contribute toEN-regression modeling of ICS (behavioral feature, response variable) for the entire control cell population. Horizontal color bars indicate coefficientvalues (21,x,1) (green=negative, red = positive, black = near zero) associated with each variable at any iteration (X-axis) of the modeling process.Red and green variables are positively or negatively correlated with ICS, respectively, while absolute coefficient values indicate the importance ofeach variable to the estimation of ICS per model iteration. With progressive model iterations, the sum of all coefficient values is forced non-uniformlytowards zero, with coefficients redistributed to optimize the regression model according to adjusted R2. (D) Rank ordering of background variablesbased on their absolute coefficient values in the optimal regression model (adjusted R2 = 0.43, horizontal yellow line, iteration 10, vertical yellow line)provides a second list of organizational features associated with variations in ICS. Variables with grey backgrounds were implicated among the top 15features by both feature selection methods (B and D).doi:10.1371/journal.pone.0090593.g003
Plasticity in Causal Networks of Cell Migration
PLOS ONE | www.plosone.org 5 February 2014 | Volume 9 | Issue 2 | e90593

Organizational features included within the optimal regression
model were ranked according to their absolute coefficient value,
which indicates their individual contribution to the estimation of
ICS (Figure 3 D).
Notably, comparison of the organizational features highlighted by
both CVA- and EN-regression-based feature selection methods
revealed more than 50% overlap among the high ranked
predictions (Figures 3 B and D, respectively), leading to greater
confidence in their potential importance. Conversely, disparities in
selected features may be either methodologically driven or
reflective of differences in input data, i.e. fast and slow control
cell subpopulations (40% of cells, CVA method) versus all control
cells (EN-regression method).
Analysis of Correlations between Organizational Featuresand Cell Migration SpeedWe next analyzed Spearman’s correlation coefficients (rs) for
pairwise combinations of all organizational and behavioral features
(Spearman’s selected due to improved handling of non-linear
correlations – similar values were obtained using Pearson’s
correlation coefficient). Results are represented as a global inter-
feature correlation heatmap (Figure 4 A). This summarizes the
inter-feature relationships dictated by both mathematical and
biological feature interdependencies. We then visualized the co-
distribution of rank-ordered ICS values versus rank-ordered values
of organizational features (Figure 4 B–G) chosen based on either the
feature selection process described in Figure 3 or literature-based
expectations. Ranked value visualization corresponds closely to
Spearman’s correlation analysis. Interestingly, despite ranking
highly according to both feature selection methods, Cell Area
showed little or no correlation with ICS (rs =20.05, Figure 4 B).
In contrast, Cell Compactness (rs = 0.32, higher values indicate less
round cells), Mean [CMAC Lifetime] per Cell (rs =20.56, values
indicate the temporal stability of CMAC populations, per cell) and
Sum [CMAC Total RubyRed-LifeAct Intensity] per Cell (rs =20.38,
values indicate the total enrichment (after local background
subtraction) of RubyRed-LifeAct signal within CMACs, per cell)
all showed strong correlations to ICS (Figure 4 C–E). Median
[EGFP-Paxillin – RubyRed-LifeAct Colocalization per CMAC] per Cell
(rs =20.29, values indicate the median Pearson’s correlation
between F-actin and CMAC marker signals within segmented
CMACs, per cell) also showed a negative correlation to ICS, as did
Median [CMAC Area] per Cell (rs =20.25, values indicate the
median area of individual CMACs, per cell). This final correlation
between adhesion size and cell speed is in agreement with recent
findings [16].
Identification of Directed Causal Interactions in CellMigrationTo extend upon the directionally unspecific correlative indica-
tions derived via CVA, EN-regression and Spearman correlation
analyses, we next engaged the Granger causality concept [26,27].
This permitted detection of the directional flow of information, as
revealed by causal influence, between individual features defining
cell migration system organization and behavior. Specifically, we
performed Granger causality modeling via auto-regression to
determine how the values of background (organizational) variables at
preceding time-points (temporal lags) contributed to the prediction
of future values of the behavioral response variable, ICS. These
analyses focused initially on those variables previously highlighted
via correlative analyses (Figures 3 and 4).
As shown in Figure 5 A, auto-regression modeling indicated that
progressively adding temporal lags of ICS alone increased ICS
prediction accuracy to a maximal adjusted R2 of ,0.4. Thus,
current ICS is dependent on past ICS. Notably, as implied by the
preceding correlative analyses, temporal lags of the organizational
features Sum [CMAC Total RubyRed-LifeAct Intensity] per Cell and
Mean [CMAC Lifetime] per Cell each alone enabled (partial)
estimation of future ICS (adjusted R2 max 0.12 and 0.28,
respectively, Figure 5 A and B). Such results indicate either
correlation and/or causation between these organizational features and
ICS. Crucially, explicit evidence of Granger causation was achieved
by combining lags of ICS with lags of these background variables,
resulting in clear improvements in adjusted R2. Thus, both Sum
[CMAC Total RubyRed-LifeAct Intensity] per Cell and Mean [CMAC
Lifetime] per Cell contributed additional information to the
prediction of ICS, implying association with up-stream Granger
causal mechanisms.
We next assessed whether the improvements in prediction
provided by background variables were statistically significant over
a population of .2200 control cell observations. Impressively, the
addition of information from either Sum [CMAC Total RubyRed-
LifeAct Intensity] per Cell (Figure 5 C, left panel) or Mean [CMAC
Lifetime] per Cell (Figure 5 D, left panel) conferred statistically
significant improvements in adjusted R2 values for the majority of
background and response variable lag combinations. Thus, we
conclude that these variables Granger cause ICS. Specifically,
given the negative correlations observed, increases in CMAC
lifetime and total RubyRed-LifeAct associated with CMACs both
inhibit ICS. Note that the degree of autocorrelation in response
variables does not correlate with the ability to detect causal
interactions.
Because causal interactions may be bi-directional, we also tested
for Granger causation in the reverse direction. As shown in
Figures 5 C (right panel) and D (right panel), lags of ICS could not
consistently improve the estimation of future values for the two
selected organizational features. Combined, we interpret these
results as indicating predominantly uni-directional Granger
causation of Sum [CMAC Total RubyRed-LifeAct Intensity] per Cell
and Mean [CMAC Lifetime] per Cell on ICS and not vice versa.
Similarly, causality analysis of Median [CMAC Area] per Cell also
indicated that increasing values of this variable Granger caused the
inhibition of ICS (Figure 5 E, left panel), and again, no Granger
causation could be detected from ICS towardsMedian [CMAC Area]
per Cell (Figure 5 E, right panel).
Significantly, consistent with our correlative analyses, Cell Area
data did not improve the estimation of future ICS, and nor did past
ICS improve estimation of future Cell Area (Figure 5 F, left and right
panels, respectively). Thus, no evidence for Granger causation
could be discerned between these cellular features. In a surprising
contrast, analysis of Mean [Standardized CMAC Distance to Cell Edge]
per Cell (values indicate average CMAC proximity to the nearest
cell edge as a proportion of the distance from the cell edge to cell
center of area, per cell) provided no evidence for Granger
causation on ICS (Figure 5 G, left panel), but instead was Granger
caused by ICS (Figure 5 G, right panel), such that faster cell
migration drives a more centralized distribution of CMACs within
the cell.
Identification of a Chain of Causation in Cell MigrationWe next explored the causal wiring pattern of cell migration
more comprehensively by examining an extended set of inter-
feature relationships. This revealed interconnected patterns of
Granger causation extending beyond single pairs of variables. As
an example, we present a short chain of Granger causal
interactions extending both up- and down-stream of ICS
(Figure 6 A). This sequence begins with the variable IDR [Change
Plasticity in Causal Networks of Cell Migration
PLOS ONE | www.plosone.org 6 February 2014 | Volume 9 | Issue 2 | e90593

Plasticity in Causal Networks of Cell Migration
PLOS ONE | www.plosone.org 7 February 2014 | Volume 9 | Issue 2 | e90593

in CMAC Total EGFP-Paxillin intensity] per Cell (values indicate per
cell variance in the net rate of change in EGFP-Paxillin content
per CMAC). Increases in this variable enhanced Median [EGFP-
Paxillin – RubyRed-LifeAct Colocalization per CMAC] per Cell, which, as
noted previously, signifies the Pearson’s correlation between
paxillin and F-actin protein concentrations within CMACs. Such
enhancement Granger caused reduced ICS (Figure 6 A, center
panel). Finally, ICS Granger caused changes in cell shape, as
represented by Cell Compactness (a size-independent measure of cell
roundness), such that higher ICS promoted less rounded cells with
higher Cell Compactness values.
Differential Perturbation Reveals the Plasticity of theDefined Causal Wiring PatternTo assess the question of whether causal wiring patterns are
stable and generalizable, or plastic and contextually dependent, we
assessed the robustness of the Granger causality chain described in
Figure 6 A using data derived from cells perturbed via either the
inhibition of ROCK or the activation of Rho (Supporting Movies
S2 and S3). These represent treatments with strong, well-
characterized impacts on cell migration. The effects of these
perturbations were extensively assessed (Supporting Figure S4),
revealing excellent coincidence with previous observations.
Remarkably, despite dramatically altering both cell migration
system organization and behavior, inhibition of ROCK did not
significantly disrupt the chain of Granger causality first detected
under control conditions (Figure 6 B), thereby providing additional
support for the significance of these findings. In contrast, Rho
activation disrupted the first two causal relationships such that no
evidence of Granger causation could be detected (Figure 6 C).
Strikingly, the presence of the third causal relationship was
conserved following Rho-activation, but the impact of the
relationship was reversed such that increasing ICS reduced, rather
than increased, Cell Compactness. These results, particularly the
positive evidence indicating inversion of effects in the third
interaction, reveal the differential sensitivity of causal interactions
to perturbation and, more generally, their contextual dependence.
Fundamentally, this exposes plasticity in the causal wiring pattern
underlying the cell migration process.
Discussion
A variety of studies have previously described correlations
between organizational and behavioral features of cell migration, yet
the orientation of cause and effect in these relationships has
remained undefined [16,29–33]. We now extend on such
correlative analyses by describing a novel strategy for directionally
specific mapping of information flow in the form of causal
influence. A key differentiating aspect of our approach is the focus
on charting causal influences based on sensitivity to the natural
heterogeneity (specifically, time-resolved inter-feature co-variance)
that arises within individual experimental conditions, as opposed to
relying on perturbation-induced differences between conditions.
This permits: a) the delineation of causal influence patterns on a
per condition basis, which in turn facilitates; b) the comparison of
these wiring patterns between alternatively perturbed conditions.
Through these capabilities we now provide proof-of-principle for
plasticity and contextual-dependence in the regulatory wiring of
the cell migration system, while also delineating specific,
functionally significant relationships between key features within
this system.
The plasticity of causal wiring in the cell migration system is
illuminated by differences observed in pair-wise causal influences
under control (DMSO-treated) and Rho-activated conditions.
Specifically, this plasticity is evidenced by the disruption (or
weakening to undetectable levels) of two causal interactions within
the causality chain defined in control cells, and is positively
exemplified by alterations to the causal interaction detected
between cell speed and cell compactness. The nature and
implications of these specific alterations are discussed further
below. In general, however, these perturbation-induced differences
in inter-feature connectivity provide proof-of-principle as to the
flexibility and adaptability of the causal wiring pattern governing
cell migration. Concomitantly, the equivalence between the
causality chains revealed in control and ROCK-inhibited cells
strongly support the validity and relevance of the defined causal
interactions. Thus, in combination, these unique findings demon-
strate both robustness and contextually dependent plasticity in the
functional relationships between coarse-grained features at the
core of the cell migration system. These findings hold the
important implication that although some causal regulatory
influences may be conserved even under strongly altered
conditions, a singular characterization of inter-feature relations is
unlikely to be generalizable. This notion seems likely to also be
important for the molecular-scale networks and components that
underpin the coarse-grained macromolecular features assessed
herein.
It should be noted that the concept of plasticity is already well
established in the context of cell migration behavior [2]. However,
such behavioral plasticity may arise mechanistically from two
distinct types of variation within the underlying network: 1)
variation in the properties of features (nodes) within the network,
and/or; 2) variations in the connectivity (edges) between those
features. To date, numerous studies have described how specific
perturbations induce changes in the values of features-of-interest
within the cell migration system. In notable examples, extensive
arrays of F-actin, CMAC and cell behavioral properties were
monitored and compared across a spectrum of conditions wherein
ECM-density, intracellular contractility and/or growth factor
stimulus were modulated [29,30]. Although important correlative
links were implied by these studies, direct quantitative correlations
between many of the recorded features were inaccessible because
data were derived from distinct experimental sources. This
highlights the advantages of defining inter-feature connectivity
based on multivariate data derived from within individual
experimental sources and, indeed, from within individual condi-
tions (rather than by comparison between conditions). Such
strategies rely on sensitivity to natural heterogeneity within
conditions, thereby allowing the detection of variations in the
inter-feature connectivity between conditions. A highly relevant
study where this was achieved includes an analysis of how
correlative connections between CMAC morphology-features
Figure 4. Exploration of individual feature correlations. (A) A heat map of Spearman’s rank correlation coefficients (rs) summarizes thepairwise correlative relationships between all 88 recorded variables (organizational and behavioral, compact feature names defined in SupportingTable S1) based on ranked observation values (blue= negative rs; red= positive rs; green= rs, 0). (B–G) Selected correlations to ICS (indicated in heatmap by lines (B)–(G), corresponding to panels B–G) plotted as ranked values of ICS (X-axes) vs ranked values of organizational features (Y-axes): CellArea (B); Cell Compactness (C); Mean [CMAC Lifetime] per Cell (D); Sum [CMAC Total RubyRed-LifeAct Intensity] per Cell (E); Median [EGFP-Paxillin –RubyRed-LifeAct Colocalization per CMAC] per Cell (F); Median [CMAC Area] per Cell (G). Red dotted trend lines represent linear best fits.doi:10.1371/journal.pone.0090593.g004
Plasticity in Causal Networks of Cell Migration
PLOS ONE | www.plosone.org 8 February 2014 | Volume 9 | Issue 2 | e90593

Figure 5. Mapping of directed causal influence based on Granger causality. (A and B) 3D surface plots of adjusted R2 values (Y-axes) basedon auto-regression (AR) modeling of the response variable, Instantaneous Cell Speed (ICS), using combinations of one to ten temporal lags (5 mininterval) of the response variable (ICS, Z-axes) and one to ten temporal lags of a background variable, either Sum [CMAC Total RubyRed-LifeActIntensity] per Cell (X-axis, A) or Mean [CMAC Lifetime] per Cell (X-axis, B). Grey arrows along X and Z axes indicate the inclusion of additional temporallags of the indicated variable (A and B). (C–G) Significance testing of improvements in adjusted R2 values caused by the addition of temporal lags ofbackground (X-axes) and response variables (Y-axes) to an AR model based on .2200 cell observations. White indicates no statistically significantimprovement in prediction. Blue and red color schemes (indicating negative and positive correlations between background and response variables,respectively) are each divided into 4 levels of significance, with P values,0.05 (*),,0.01 (**),,0.001 (***) or,0.0001 (****), as indicated (color scale-bar, upper right). Causation is tested reciprocally within variable pairs to discern evidence for the causal influence of organizational variables over ICS(left panels, C–G) and vice versa (right panels, C–G). We infer causal influence only where significance-testing patterns are robust and ordered (as in C
Plasticity in Causal Networks of Cell Migration
PLOS ONE | www.plosone.org 9 February 2014 | Volume 9 | Issue 2 | e90593

were altered by individual siRNAs within an RNAi screen [32].
Indeed, this study is particularly noteworthy because it documents
plasticity in the correlative relationships between morphological
CMAC features. Our work now builds on elements of this
important foundation in two ways: 1) assessment of the relation-
ships between features of cell migration system organization and
behavior, as facilitated by synchronous acquisition of both data types
on a per cell basis, and; 2) definition of the direction of causal
influences between features enabled by time-resolved data and
Granger causality analysis.
The extension of correlative analyses to delineate causal
influence marks a significant advance. As noted in a recent
commentary, the majority of analyses in cell biology are
correlative, with the analysis of causation remaining infrequent
[15]. This is particularly true at a systemic level where complex
patterns of inter-feature causation are considered. However, one
prominent strategy for empirically defining causal wiring patterns
is network perturbation [17,22–25]. Generally this approach
involves the characterization of an array of features in both the
presence and absence of perturbation(s). The variation in feature
values enforced by perturbations is then used to detect connectivity
between feature-pairs and, specifically, inter-feature causation.
Although extremely powerful, some limitations to the network
perturbation strategy may bear further consideration here. Firstly,
as with more locally focused epistasis strategies, inter-feature
connectivity is defined by comparison of feature values between
control and perturbed conditions. Because the combination of
conditions is used to define a single causal wiring pattern, network
plasticity cannot easily be addressed through the comparison of
wiring patterns. A noteworthy exception to this is the time-
resolved network perturbation analysis performed by Ku et al,
which demonstrated the temporal evolution of causal influence
patterns between coarse-grained features of microtubule, F-actin
and myosin machineries during neutrophil polarization [17]. A
second limitation associated with the network perturbation
strategy is that the required perturbations are assumed to alter
feature values (to illuminate inter-feature connectivity) without
distorting the ‘‘native’’ network architecture, or at least to do so
only locally at the expected point of perturbation [34]. Crucially,
our detection of plasticity in causal wiring following Rho activation
provides proof-of-principle that this assumption may not always
hold. Thirdly, in a critique common to many perturbation-
dependent strategies, the specificity of targeted perturbations is
often fundamental to the interpretation of causal directionality
within inferred wiring patterns. Of similar importance is the
relative timing of direct and indirect effects that propagate
downstream of the initial perturbation, including possible feedback
responses. Where these are not clearly characterized, appropriate
inference of causal directionality involves assumptions that,
although reasonable, may not always be satisfied. Thus, overall,
it seems important to recognize that limitations exist in relation to
the use of perturbations for the definition of causality, either locally
(as in epistasis) or at a network level. Though these perturbation-
based approaches are clearly valuable and indispensable, their
limitations in some cases coincide with relative strengths of the
novel strategy described here, wherein perturbations are not
required for the coarse-grained definition of ‘‘native’’ causal
influences. Thus, perturbation-independent strategies such as this
one may provide a useful complement to existing approaches.
The detection of causal wiring pattern-plasticity is a key finding,
but the individual inter-feature relationships defined herein each
also hold their own specific relevance. For example, the association
between F-actin and CMACs is thought to be a critical
determinant of migratory behavior [20]. Our finding that
increasing RubyRed-LifeAct signal (representing F-actin) associ-
ated with CMACs causes decreased cell speed resolves the
direction and effect of this previously correlative indication.
Similarly, correlations have also been shown between CMAC
stability (represented by lifetime) and cell speed [29–31]. We now
confirm existing assumptions regarding the inhibitory causal
influence of high CMAC stability over cell speed. Likewise, our
finding that increasing CMAC size inhibits cell speed is consistent
with the correlative indications of a recent study that used
aggregate inter-feature co-variance enforced by parallel perturba-
tions to define correlations between CMAC features and cell
migration [16]. Interestingly, we reveal that a variety of CMAC
features have causal influence over cell speed, while Kim et al
found that only CMAC area (of several assessed CMAC features)
robustly correlated to cell speed. One explanation for this
difference may be that causal wiring plasticity induced by each
perturbation (as demonstrated herein) may result in an uninten-
tional stringency within the Kim et al study, such that only those
correlations conserved under all conditions would be detected in
the final analysis. This emphasizes the value of a perturbation-
independent strategy for wiring pattern-definition.
While the three causal relationships noted above corresponded
to existing expectations based on previous correlative analyses, the
findings for cell area, CMAC localization and cell shape were less
expected. Firstly, no evidence was detected that cell area has any
causal relationship with cell speed. This was unexpected both
because cell area globally modulates intracellular signaling
networks [35,36] and because numerous perturbations impact
coincidently on cell migration and cell area, leading intuitively to
inference of a causal dependency. While the absence of evidence
for a causal interaction is not proof that no such relationship exists,
it might reasonably be interpreted as indicating either the absence
or relative weakness of an interaction. This is interesting in the
light of our feature selection results wherein cell area was
consistently indicated to be an important parameter. This
dichotomy may be explained by recognition of the fact that our
correlative and Granger analyses were pairwise, while feature
selection methods were multivariate. Whereas such pairwise
analyses have sensitivity for strong biological relationships that
are relatively direct and linear, multivariate analyses may provide
sensitivity towards complex and perhaps contingent relationships
between regulatory features. Thus, it is conceivable that cell area
may modulate the causal impacts of several other features
upstream of cell speed, in such a way that its own causal influence
is distributed and not directly discernable. It will therefore be
crucial in the future to develop multivariate statistical implemen-
tations of Granger causality analysis for this setting, including
improving sensitivity to non-linear causal interactions [37].
Even more surprising was that both CMAC localization and cell
shape features were regulated by cell speed. In general, these
findings highlight ongoing questions regarding the possible
orientations of causation relative to complexity in such complex
biological systems [38], and indeed about the relative positions of
such features in a hierarchy of complexity [9,10]. Specifically, we
were surprised in the first instance to find that faster cell migration
[left panel], D [left panel], E [left panel], G [right panel]. Stem plots (below X-axes, C–G, left and right panels) indicate the degree of autocorrelation inrespective response variables.doi:10.1371/journal.pone.0090593.g005
Plasticity in Causal Networks of Cell Migration
PLOS ONE | www.plosone.org 10 February 2014 | Volume 9 | Issue 2 | e90593

Plasticity in Causal Networks of Cell Migration
PLOS ONE | www.plosone.org 11 February 2014 | Volume 9 | Issue 2 | e90593

caused increased distances between CMACs and the cell edge,
reducing the peripheral skew in CMAC localization [39]. This was
unexpected because our empirical findings refute previous
perturbation-derived inferences that CMAC centralization may
cause the inhibition of cell migration [40,41]. Indeed, when
combined with evidence that CMAC lifetime causally regulates
cell speed, this finding allows the disentanglement of previously
convoluted correlations between CMAC centralization, CMAC
stabilization and cell migration. Thus, we find that CMAC
stability strongly influences cell speed, which in turn modulates
CMAC localization.
Equally unexpected was the finding that cell speed lies upstream
of cell shape determination, with faster migration in control cells
promoting a less round cell shape (with higher compactness
values). While the existence of a correlative relationship between
cell shape and cell speed has been abundantly clear [42,43], the
direction of causation has not. However, evidences that symmetry
breaking and associated cell deformations necessarily precede cell
migration [44] promote the assumption that cell shape would act
upstream of cell speed, rather than downstream as found here
under all three experimental conditions. A further investigation of
the relative magnitude and frequency of shape changes during
symmetry breaking and at different migration speeds may more
fully explain this surprising finding. In general, this observation
reveals a possible limitation in the sensitivity of our causal analysis
strategy, since each experimental conditions is described by a
single causal wiring pattern. This means that potential variations
in causal wiring arising within conditions may be lost. It is
conceivable, for example, that wiring patterns may differ during
alternate phases of migration (symmetry breaking, protrusion,
retraction) and/or between different migratory modes (mesenchy-
mal vs amoeboid). Indeed, the latter is hinted at by wiring changes
induced following Rho-activation, as discussed further below.
Methodologically, the ability to disaggregate data from within
experimental conditions to identify recurring migratory phases/
modes may help to contextualize our understanding of causal
network structures during evolving migratory behaviors, as
previously exemplified during cell polarization [17].
As noted above, the causal influence of cell speed over cell shape
revealed in control cells was recapitulated in both ROCK-
inhibited and Rho-activated cells. This is remarkable given the
dramatic alterations to organizational and behavioral features induced
by each of these perturbations. However, the inversion of the
causal effect of this interaction in Rho-activated cells is particularly
noteworthy, and not only as proof-of-principle for causal wiring
pattern-plasticity. Indeed, the finding in Rho-activated cells that
higher cell speed causes cells to become rounder, rather than more
protrusive, is reminiscent of a switch in the organizational state of
migratory machinery from a mesenchymal phenotype towards an
amoeboid phenotype. This is a known effect of Rho activation [2].
Such a switch in migratory mode is further supported by a
comparison of the quantitative changes recorded in our Rho-
activated cells and those observed following Rho-activation in
MDA-MB231 cells in 2D culture by means of Smurf1-depletion
[45] – a perturbation which drove a pronounced mesenchymal-
amoeboid transition in 3D culture. Thus, our analysis of causality
following Rho-activation reveals not only plasticity in causal
wiring, but that this plasticity may correspond to a recognized
switch between mesenchymal and amoeboid modes of migratory
behavior.
The observation that higher variation in the rate of net EGFP-
Paxillin incorporation/release from CMACs is predictive of
increased intra-CMAC colocalization between EGFP-Paxillin
and RubyRed-LifeAct is also noteworthy. It is consistent with
demonstrations that accelerated paxillin dynamics correlate with
high force application to CMACs [46,47], which in turn
correspond to CMAC maturation and reinforced associations
with F-actin [48,49], an effect observable via colocalization
analysis [33]. Remarkably, it is specifically the variance in
EGFP-Paxillin dynamics that is causal, since the median rate of
EGFP-Paxillin incorporation/release at CMACs shows no evi-
dence of causation. This highlights the potential for population
variance to have causal influence independent of mean/median
values – an information processing feature that may be associated
with relative rather than absolute signal processing. Finally, the
finding that increasing colocalization between EGFP-Paxillin and
RubyRed-LifeAct within CMACs causes inhibition of cell
migration is in correspondence with previous correlative findings
showing that increased CMAC-component-to-F-actin colocaliza-
tion coincides with force-driven CMAC maturation and reduced
cell migration [29,30].
In summary, we have presented a new imaging-based strategy
designed to detect causal influence transmission between coarse-
grained features synchronously characterizing the core machinery
and behavioral outputs of the cell migration system. This approach
employs the Granger causality concept to leverage natural
heterogeneity within experimental conditions, facilitating pertur-
bation-independent causal analyses. This is, to the best of our
knowledge, the first time the Granger causality concept has been
employed within such a cell biology setting. Using this approach,
we have mapped several pair-wise causal interactions between
features of cell organization and behavior, thereby alternately
confirming or refuting existing assumptions of causation derived
from previous correlative analyses. Most importantly, we have
provided empirical evidence of plasticity in the causal wiring
pattern underlying cell migration. This finding indicates that
causal analyses should be performed and interpreted in a
contextually dependent manner, since global causal wiring
patterns are unlikely to be entirely generalizable.
Ultimately, this work provides new insights into the architecture
of causal interactions that underlie cell migration, but more
generally also presents a highly extensible framework for further
exploration of this process. Future developments in experimental
design, data acquisition (including an emphasis on molecular-scale
information), and Granger causality analysis methods are likely to
deliver important insights into cell migration, as well as the
Figure 6. Causal influence patterns are plastic and contextually dependent. (A) Granger causality analysis revealed a sequence of causalinteractions extending both up-stream and down-stream of Instantaneous Cell Speed (ICS): Increasing IDR [Change in CMAC Total EGFP-Paxillinintensity] per Cell (indicates per cell variation in the net rate of EGFP-Paxillin recruitment/release per CMAC) caused increased Median [EGFP-Paxillin –RubyRed-LifeAct Colocalization per CMAC] per Cell (A, left panel). Increasing Median [EGFP-Paxillin – RubyRed-LifeAct Colocalization per CMAC] per Cellcaused reduced ICS (A, center panel). Increasing ICS caused increased Cell Compactness (A, right panel), indicating that fast moving cells become lessround. The causal links between these four variables are summarized schematically (grey boxes), with positive and negative relationships indicated byarrows and capped lines, respectively. Analyses of Granger causality predictions for equivalent inter-feature relationships in ROCK-inhibited cells (B)reveal comparable causal relationships while Rho-activated cells did not (C). Notably, although the final causal relationship (C, right panel) was stilldetected, the causal effect was reversed such that increasing ICS caused decreasing Cell Compactness, i.e. increased cell speed caused cells to becomemore round. All variables are defined in Supporting Table S1.doi:10.1371/journal.pone.0090593.g006
Plasticity in Causal Networks of Cell Migration
PLOS ONE | www.plosone.org 12 February 2014 | Volume 9 | Issue 2 | e90593

potential to explore a variety of complex, dynamic and hetero-
geneous cellular processes.
Materials and Methods
Cell Culture and Experimental ConditionsH1299 (human non-small cell lung carcinoma, ATCC) cells
were transfected with both EGFP-Paxillin and RubyRed-LifeAct
constructs using Lipofectamine 2000 (Gibco) according to the
manufacturers instructions. Double-expressing stable clones
(H1299-P/L) were selected and maintained in RPMI 1640
medium (Gibco) containing 1 mg/ml Geneticin (G-418 sulfate,
Gibco), supplemented with 1 mM Glutamine and 10% fetal
bovine serum (Gibco) at 37uC, 5% CO2. Fibronectin was purified
from human plasma as described previously [50]. Imaging
substrates were coated with purified Fibronectin (10 mg/ml) at
37uC for 2 h followed by blocking with 1% heat denatured bovine
serum albumin (Sigma-Aldrich) at 37uC for 1 h. H1299-P/L cells
were serum starved for 24 h prior to imaging. 4000 cells were
plated per well in fibronectin-coated 96-well glass-bottomed plates
(0.17 mm optical glass, Matrical Bioscience). Cells were treated
immediately with DMSO (Di-methyl sulfoxide, Sigma-Aldrich) as
control, or alternatively with either a Rho-associated protein
kinase (ROCK)-inhibitor (Y-27632; 25 mM, Sigma-Aldrich), or a
Rho activator (Calpeptin, 25 mg/ml, Cytoskeleton). In each
experiment, control (DMSO-treated, 9 experimental repeats) cells
were paired with one perturbed condition (ROCK-inhibition, 5
experimental repeats or Rho-activation, 4 experimental repeats) to
allow subsequent comparison of results between these three
conditions. Live cell imaging commenced after 2 h with treatments
ongoing.
Confocal Live Cell Fluorescence ImagingLive cell imaging was performed on a Nikon A1R confocal
microscope with a PlanApo VC 60X/1.4 NA oil-immersion
objective. Images were acquired at 5 min intervals for 8 h with
a pixel resolution of 0.21 mm. Cells were maintained during
imaging in normal culture medium absent fetal bovine serum, at
37uC and 5% CO2.
Image Processing and Image AnalysisAcquired images were processed in ImageJ (W.S. Rasband,
NIH) using the Hybrid 3D median filter followed by local
background subtraction. Processed images were then analyzed
using PAD software (v6.3) (Digital Cell Imaging Laboratories,
Keerbergen, Belgium). Cell boundaries were detected based on
Ruby-LifeAct fluorescence, with cells excluded when contacting
image borders. CMACs with area .0.05 mm2 were then
segmented based on EGFP-Paxillin signal. Segmented Cells and
CMACs were tracked over time based on nearest neighbor
analysis. Cell and CMAC segmentation and object tracking were
verified by direct visual inspection of all images and image
sequences. Quantitative features defining cells, per Cell CMAC
populations (Supporting Table S1) and individual CMACs
(Supporting Table S2) were then automatically extracted. Intensity
values within CMACs were corrected in each channel for local
background within a 1 mm radius around the boundary of each
CMAC, excluding signal from any other segmented CMAC.
Data ParsingAutomated data parsing was performed prior to extensive
statistical analyses. This included the removal of CMACs observed
in only a single time point, thus dramatically limiting misclassi-
fication of noise as CMACs, especially given imposed limits on the
maximal inter-time point displacement of CMACs (2 mm).
Similarly, CMACs with minor axis values of less than a single
pixel (210 nm) were removed to exclude aberrant form-factor
calculations. CMACs present in the first and final images of an
image sequence were excluded from aggregate calculations of
CMAC Lifetime due to the biasing effect associated with the
inclusion of incomplete CMAC lifetimes.
Data StandardizationCMAC fluorescence intensity data was standardized by
calculating the median of all individual CMAC mean intensities,
per recorded channel, per experimental repeat in the control
(DMSO-treated) condition, of CMACs between 0.15 and 0.2 mm2.
This size range incorporates numerous CMACs and is above both
the optical and digital resolution of the acquisition system, limiting
ambiguity about actual CMAC area. All CMAC fluorescence
intensity values per experimental repeat were standardized to this
value.
Data TransformationsCell trajectories were smoothed through the application of
smoothing splines. The parametrization of the smoothing was
based on a trade off between maintaining the properties of the
original trajectories (essentially no difference can be observed
between original and smoothed trajectories), and enhancing the
continuity of the instantaneous cell speed distribution. This
diversification of ICS values enhanced the efficacy of subsequent
statistical analyses (e.g. regression techniques).
Given our usage of ordinary least squares estimations in auto-
regression and elastic net-regression, and the associated assump-
tions of residual normality, Box-Cox transformations [51] with
individualized tunings were applied to normalize data distributions
for each cell migration system feature, so as to fulfill this necessary
assumption.
Subpopulation Discovery via the EM-algorithmPrincipal component analysis (PCA) using singular value
decomposition of the normalized data matrix was first applied to
control cell observations based on all 87 organizational variables.
Subsequently, the first 25 principal components (containing 87.5%
of total variation) were used in an expectation maximization (EM)-
algorithm [52] for assignment of control cell observations to
quantitatively defined subpopulations. EM algorithm-based as-
signments were repeated 10 times each for designation of between
2 and 8 subpopulations. The Akaike information criterion (based
on the log-likelihood of the mixture model penalized by the
number of existing groups) [53] was used to identify the optimal
number of subpopulations. This number was found to be 4
(Figure 2). The final assignment of control cell observations
between four subpopulations was then determined according to
the lowest Akaike information criterion achieved after 100
iterations of the EM-algorithm (using the same data as above).
Importantly, the EM-algorithm was initiated using random
seeding so as to relieve the locking effect of initiating the algorithm
with clustering techniques such as k-means clustering.
Comparison of Defined Cell SubpopulationsCanonical vectors analysis (CVA) [54] was performed using
decompositions of the between-group and within-group covari-
ance matrices based on eigenvalue decomposition. Mahalanobis
distance measurements were applied to determine the pairwise
between-group distances using their structures of covariance.
Plasticity in Causal Networks of Cell Migration
PLOS ONE | www.plosone.org 13 February 2014 | Volume 9 | Issue 2 | e90593

Agglomerative hierarchical clustering of the 87 dimensional
organizational data was performed on the mean vectors of
subpopulations, subject to the shortest distance using the
Euclidean distance as a metric. Notably, mean vectors were based
on principal components of the multivariate data matrix. Outputs
were displayed as standard dendograms.
Multivariate analysis of variance (MANOVA) was applied to the
87 dimensional data matrix to assess whether the between-group
and within-group covariance matrices differ significantly given
specific subpopulation assignments. Significance was determined
via Wilk’s test.
Pairwise univariate distribution tests were performed using the
two-sample Kolmogorov-Smirnov (KS)-test to determine whether
two empirical probability density functions were likely to have
arisen from the same underlying probability function. Significance
was determined based on comparison of between-distribution KS-
scores to the KS-test’s critical values at the 5% significance level.
Given KS-scores beyond the significance level, individual variable
distributions were visualized as probability distribution functions.
These were estimated using kernel density estimation with
Gaussian kernels and fixed bandwidths.
Feature SelectionCVA was applied to find the organizational features that
contribute to the separation of the fastest (5th quintile of ICS)
and slowest (1st quintile of ICS) cells (DMSO-treated). Features
were selected based on their absolute contribution to the first
canonical vector which contained .90% of the between-group
variation needed to maximally separate these subpopulations.
Regression via the elastic net (EN-regression) [55] was employed
using all control cell observations, with ICS as the response
variable (representing behavior) and organizational features as
background variables. As noted previously, in order to meet the
assumptions of the regression model, all variables were normalized
via individually tuned Box-Cox transformations. After supervision,
6 variables were discarded (as non-normalizable) and the
regression model was built using the remaining 81 organizational
features as background variables. For feature selection, features
were ranked based on their absolute contribution (coefficient) at
the model iteration yielding the optimal goodness-of-fit along the
shrinkage path of the EN-regression (as adjudged by the adjusted
coefficient of determination (adjusted R2)). The decision to use
EN-regression (as opposed to related techniques such as Ridge
regression or the LASSO) was based on its grouping effect wherein
the coefficients assigned to multicollinear (related) variables are not
shrunk independently. The use of the adjusted coefficient of
determination was motivated by our interest in the descriptive and
not the predictive accuracy of the model.
Analyses of Granger CausalityThe concept of Granger causality [26] can be expressed in
terms of auto-regression where a variable X is stated to Granger-
cause another variable Y if lags of X, in the presence of lags of Y,
improve the auto-regression model’s explanatory power of
‘present’ values of Y. More specifically, let us have two models
A and B, where A has Y as the response variable and lags of Y as
the background variables, and B has Y as the response variable
and lags of both Y and X as the background variables. Then, given
a significant reduction in the residual sum of squares of model B
compared to model A, X is said to Granger-cause Y. Our analyses
of Granger causality were performed on this basis using linear
auto-regression. It is important to observe that as ‘‘older’’ lags are
included into each regression model, ‘‘younger’’ lags are also
retained, such that if a lag from 15 minutes prior to the ‘‘present’’
is included, the 5 and 10 minute lags are also included in the
model. As noted above, all variables used in these analyses were
normalized via individually tuned Box-Cox power-transforma-
tions. Furthermore, to confirm the stationarity of our data, we
applied the augmented Dickey-Fuller test. This indicated that our
time-series data did not contain significant trends such as
fluctuating means or variances. Notably, data stationarity is
necessary to satisfy the assumptions of ordinary least squares-based
estimation and therefore the auto-regressive modeling applied in
our assessment of Granger-causality. Finally, to test for significant
improvements in model fitting (corresponding to the addition of
the candidate causal variable) we utilized the Granger-Sargent
test.
Supporting Information
Figure S1 Spatial and Temporal Data Hierarchies.Quantitative image analysis produces a data matrix that can be
aggregated and disaggregated to varying degrees in both spatial (A)
and temporal (B) dimensions, creating distinct but inter-operable
data hierarchies. (A) Statistical measures of Cell Populations
represent the most aggregated state of data in the Spatial Data
Hierarchy. Disaggregation of data to Single Cells provides the
Cellular Resolution Level. Each cell contains a CMAC Popula-
tion; therefore Aggregated CMAC Population Statistics are
necessary to describe the adhesion cohort of an individual cell.
In combination with descriptions of Individual Cell Properties,
these two spatial scales of data, collectively termed Single Cell
Scale, are used almost exclusively in this study (see green outline,
A). Features describing these scales are described in Supporting
Table S1. The properties of Single CMACs are also independently
recorded, providing access to Individual CMAC Properties as the
maximal level of spatial data disaggregation (data from this spatial
scale is presented in Supporting Figure S2, C and D, based on
features defined in Supporting Table S2). (B) Image data is
acquired over 8 h and therefore the combination of data from all
time-points represents the maximal level of data aggregation in the
Temporal Data Hierarchy. Varying degrees of data disaggregation
via Arbitrary Time Sampling, as employed in Supporting Figure
S2, can provide indications regarding the stability of experimental
conditions over time. Because migrating cells can enter and exit
imaging fields at any time, per-cell data may be aggregated to
reflect individual Cell Observation Periods. Within each cell, data
defining the properties of each CMAC may be aggregated over the
lifetime of each CMAC. Alternatively, as with Single Cell and Cell
Population data, CMAC data may be disaggregated to reflect
Instantaneous Dynamics defined at the maximal image sampling
frequency (5 min). Instantaneous Dynamics data is used in most
cases throughout this study.
(EPS)
Figure S2 Multivariate quantitative analyses indicatehigh inter- and intra-experimental data consistency.PCA analysis based on 88 Cell-Level variables (A, 2446 data
points = individual cells at single time-points, analyzed variables
defined in Supporting Table S1) or 29 CMAC-Level variables (C,
71076 data points = individual CMACs at single time-points,
analyzed variables defined in Supporting Table S2) color-coded by
experimental repeat date reveal high overlap between data derived
during independent experiments. Similar analyses of Cell-Level (B)
or CMAC-Level (D) data color-coded by intra-experimental time
(four non-overlapping 2 h windows) also show excellent consis-
tency indicating a stable-steady state during experimentation.
(TIFF)
Plasticity in Causal Networks of Cell Migration
PLOS ONE | www.plosone.org 14 February 2014 | Volume 9 | Issue 2 | e90593

Figure S3 Recorded organizational and behavioralfeatures are quantitatively linked. (A) Principal component
analysis (PCA) was performed for all control cell observations
based on all 87 organizational features. An expectation maximiza-
tion (EM)-algorithm for Gaussian mixture models using principal
components 1–20 (including .99% of total variance) was
employed to assign control cell data into two subpopulations.
This was repeated ten times to achieve an optimized assignment as
determined by assessment of relative inter- and intra-group
variability using the Akaike information criterion (AIC). This
procedure was replicated for the assignment of control cell data
into between 2 and 8 subpopulations, revealing that control cell
organizational feature data is optimally represented as four
subpopulations. Multivariate analysis of variance (MANOVA)
allowed rejection of hypotheses that 1, 2 or 3 sub-populations exist
(P values = 0), indicating support for the existence of 4 or more
subpopulations. Accordingly, control cell observations were
assigned to one of four subpopulations (G1–G4), with assignments
finalized based on the lowest achieved AIC value following 100
randomly-seeded EM-algorithm iterations. Given these assign-
ments, canonical vectors analysis (CVA) was used to visualize the
multivariate distributions of subpopulations G1–G4 based on the
original 87 organizational features. Subpopulations G1 (blue) and
G3 (orange) partially overlap, with G4 (red) relatively proximal
and G2 (green) relatively distal. Both standardized Mahalanobis
distance measurement (B, blue - near; red - far) and independent
hierarchical clustering (C) confirm the structure of the organizational
feature-based difference hierarchy for these control cell subpop-
ulations. (D) To compare this organizational difference hierarchy
with the corresponding behavioral difference hierarchy, we
visualized the probability distribution function (P.D.F.) for
Instantaneous Cell Speed (ICS, behavioral feature) associated with each
control cell subpopulation defined in A. In correspondence to
results in A–C, G1 and G3 subpopulation behavior was highly
analogous (KS-test p-value G1 vs G3= 0.56) with a bias towards
fast moving cells, G4 had a bias towards moderately motile cells
(KS-test p-value G1 vs G4=0), and G2 was biased towards slow
moving cells (KS-test p-value G1 vs G2= 0). Thus, organizational
and behavioral difference hierarchies were ordinally equivalent
when control cell subpopulations were defined based on
organizational state. (E) To complement this methodology, behavioral
stratification of control cells was performed according to quintiles
(S1 [1–20%, dark blue], S2 [21–40%, light blue], S3 [41–60%,
green], S4 [61–80%, orange], S5 [81–100%, red]) of the ICS
distribution. (F) CVA based on all 87 organizational variables
(excluding ICS) revealed the progressive divergence of these
subpopulations in accordance with differences in behavior. Stan-
dardized Mahalanobis distance measurement (G) and independent
hierarchical clustering (H) confirmed the ordinal equivalence
between the difference hierarchies defined by organizational and
behavioral features when control cell subpopulations were assigned
based on behavioral state.
(EPS)
Figure S4 Assessing the efficacy and impact of ROCKand Rho signaling perturbations. (A) CVA analysis of
control (DMSO, blue), ROCK-inhibited (ROCK, red) and Rho-
activated (Rho, yellow) cells defined by all Cell-Level variables
reveals near complete segregation of these populations as well as
high consistency within these experimental conditions. MANOVA
allows rejection of the hypotheses that there are one or two cell
populations (P values = 0), thereby supporting the existence of at
least 3 independent cell populations corresponding to treatment
conditions. These results support the general efficacy of these
perturbations. (B) KS-tests comparing the distributions of each
variable (compact feature names defined in Supporting Table S1)
between control and either Rho-activated (Rho, left column) or
ROCK-inhibited (ROCK, right column) conditions reveal a
broad array of perturbation effects (white circles denote KS-test
P-values ,0.05, colors indicate aggregate inter-distribution
distances (blue = proximal, red = distal)). (C–H) Selected probabil-
ity distribution functions (DMSO (control) = blue, ROCK
(ROCK-inhibited) = red, Rho (Rho-activated) = yellow) are high-
lighted here to provide comparison to previously published
analyses of Rho and ROCK manipulation, thereby confirming
the expected impacts of these perturbations. Specifically, Rho
activation significantly reduced cell migration speeds compared to
control [56–58], while ROCK inhibition increased the frequency
and maximal speeds of fast moving cells (C) [59–61]. Rho
activation promoted rounder, more compact cell morphologies
indicative of increased contractility (D) [62,63], while ROCK
inhibition lead to a more protrusive phenotype [64,65]. Both Rho
activation and ROCK inhibition promoted an increase in CMAC
number per cell, though ROCK inhibition had a markedly
stronger effect (E) [66,67]. ROCK inhibition dramatically reduced
the median area of CMACs (F) [60,63,68], while Rho activation
had inverse effects [67,69,70]. Correspondingly, ROCK inhibition
accelerated the turnover of CMACs, while Rho lead to a
significant increase in mean CMAC lifetime per cell (G) [61,71–
73]. Analysis of intra-CMAC colocalization between EGFP-
Paxillin and RubyRed-LifeAct showed that co-recruitment of
these components within CMACs was enhanced by Rho
activation and inhibited by ROCK inhibition (H).
(EPS)
Table S1 Definition of Organizational and Behavioralfeatures. This table includes classification and description of
those features defining cell migration system organization and
behavior that are discussed herein. Variables are alternatively
classified according to several criteria: relevance to organization or
behavior; Variable Class (Cell Dynamics, Cell Morphology, CMAC
Dynamics, CMAC Intensity, CMAC Localization, CMAC
Morphology, Colocalization); Spatial Scaling (Cellular, CMAC
population per Cell); and Temporal Scaling (Instantaneous,
CMAC Lifetime). Full variable names are listed, as well as a
shortened name code (used due to space restrictions in Figures 3
and 4 and Supporting Figure S3). The corresponding units and a
concise description are also included. Additional terms are defined
above relevant columns.
(XLSX)
Table S2 Definition of CMAC variables. This table
includes classification and description of those variables defining
instantaneous CMAC features (considered only in Supporting
Figure S2 C and D). Variables are alternatively classified
according to several criteria: Variable Class (CMAC Morphology,
CMAC Dynamics, CMAC Intensity, CMAC Localization,
CMAC Colocalization); Spatial Scaling (Individual CMAC values
only); and Temporal Scaling (Instantaneous values only). Full
variable names are listed, along with the corresponding units and a
concise variable description. Additional terms are defined above
relevant columns.
(XLSX)
Movie S1 Control cell migration. Control (DMSO-treated)
H1299-P/L cells expressing EGFP-Paxillin (green, left panel) and
RubyRed-LifeAct (red, left panel) were imaged at 5 min intervals
for 8 h. EGFP-Paxillin is concentrated within punctate cell-matrix
adhesion complexes (CMACs) while RubyRed-LifeAct associates
with the F-Actin cytoskeleton. After raw confocal image
acquisition (left panel), automated image analysis facilitated
Plasticity in Causal Networks of Cell Migration
PLOS ONE | www.plosone.org 15 February 2014 | Volume 9 | Issue 2 | e90593

segmentation of individual cells based on RubyRed-LifeAct
fluorescence (cell boundary indicated by dark blue outline,
overlaying EGFP-Paxillin channel, center panel). Subsequently,
CMACs within each cell were segmented (CMACs detected based
on EGFP-Paxillin fluorescence, indicated by red outlines, center
panel). Finally, the centroids of both cells and their constituent
CMACs were tracked via nearest neighbor analysis to facilitate
time-resolved analyses of dynamic migratory processes (right
panel). CMAC trajectories are color-coded for time, #10 time
points shown. Scale bars in 1st frame= 50 mm.
(MOV)
Movie S2 Cell migration following ROCK-inhibition.ROCK-inhibitor-treated H1299-P/L cells expressing EGFP-
Paxillin (green, left panel) and RubyRed-LifeAct (red, left panel)
were imaged at 5 min intervals for 8 h. Note the reduced size and
stability of EGFP-Paxillin-labeled CMACs, and the increased
mobility and protrusiveness of this representative cell. After raw
confocal image acquisition (left panel), automated image analysis
facilitated segmentation of individual cells based on RubyRed-
LifeAct fluorescence (cell boundary indicated by dark blue outline,
overlaying EGFP-Paxillin channel, center panel). Subsequently,
CMACs within each cell were segmented (CMACs detected based
on EGFP-Paxillin fluorescence, indicated by red outlines, center
panel). Finally, the centroids of both cells and their constituent
CMACs were tracked via nearest neighbor analysis to facilitate
time-resolved analyses of dynamic migratory processes (right
panel). CMAC trajectories are color-coded for time, #10 time
points shown. Scale bars in 1st frame= 50 mm.
(MOV)
Movie S3 Cell migration following Rho-activation. Rho-activator-treated H1299-P/L cells expressing EGFP-Paxillin
(green, left panel) and RubyRed-LifeAct (red, left panel) were
imaged at 5 min intervals for 8 h. Note the increased size and
stability of EGFP-Paxillin-labeled CMACs, as well as the reduced
area and motility of this representative cell. After raw confocal
image acquisition (left panel), automated image analysis facilitated
segmentation of individual cells based on RubyRed-LifeAct
fluorescence (cell boundary indicated by dark blue outline,
overlaying EGFP-Paxillin channel, center panel). Subsequently,
CMACs within each cell were segmented (CMACs detected based
on EGFP-Paxillin fluorescence, indicated by red outlines, center
panel). Finally, the centroids of both cells and their constituent
CMACs were tracked via nearest neighbor analysis to facilitate
time-resolved analyses of dynamic migratory processes (right
panel). CMAC trajectories are color-coded for time, #10 time
points shown. Scale bars in 1st frame=50 mm.
(MOV)
Acknowledgments
The authors thank Pablo Hernandez-Varas, Ulrich Berge, Tania Costa
and Jacob Kowalewski for their comments and discussion on the
manuscript.
Author Contributions
Conceived and designed the experiments: JGL. Performed the experi-
ments: HSA. Analyzed the data: JGL MJM HSA. Contributed reagents/
materials/analysis tools: XG. Wrote the paper: JGL MJM HSA JT SS.
References
1. Horwitz R, Webb D (2003) Cell migration. Curr Biol 13: R756–R759.
2. Friedl P, Wolf K (2010) Plasticity of cell migration: a multiscale tuning model.
J Cell Biol 188: 11–19.
3. Humphries JD, Byron A, Bass MD, Craig SE, Pinney JW et al. (2009) Proteomic
analysis of integrin-associated complexes identifies RCC2 as a dual regulator of
Rac1 and Arf6. Sci STKE 2: ra51.
4. Schiller HB, Friedel CC, Boulegue C, Fassler R (2011) Quantitative proteomics
of the integrin adhesome show a myosin II-dependent recruitment of LIM
domain proteins. EMBO Rep 12: 259–266.
5. Kuo JC, Han X, Hsiao CT, Yates Iii JR, Waterman CM (2011) Analysis of the
myosin-II-responsive focal adhesion proteome reveals a role for [beta]-Pix in
negative regulation of focal adhesion maturation. Nat Cell Biol 13: 383–393.
6. Byron A, Humphries JD, Bass MD, Knight D, Humphries MJ (2011) Proteomic
analysis of integrin adhesion complexes. Sci Signal 4: pt2.
7. Geiger T, Zaidel-Bar R (2012) Opening the floodgates: proteomics and the
integrin adhesome. Curr Opin Cell Biol 24: 562–568.
8. Lock JG, Wehrle-Haller B, Stromblad S (2008) Cell-matrix adhesion complexes:
master control machinery of cell migration. Semin Cancer Biol 18: 65–76.
9. Oltvai ZN, Barabasi AL (2002) Systems biology. Life’s complexity pyramid.
Science 298: 763–764.
10. Ravasz E, Somera AL, Mongru DA, Oltvai ZN, Barabasi AL (2002)
Hierarchical organization of modularity in metabolic networks. Science 297:
1551–1555.
11. Welf ES, Haugh JM (2011) Signaling pathways that control cell migration:
models and analysis. Wiley Interdiscip Rev Syst Biol Med 3: 231–240.
12. Karsenti E (2008) Self-organization in cell biology: a brief history. Nat Rev Mol
Cell Biol 9: 255–262.
13. Strohman RC (1997) The coming Kuhnian revolution in biology. Nat
Biotechnol 15: 194–200.
14. Lazebnik Y (2002) Can a biologist fix a radio?–Or, what I learned while studying
apoptosis. Cancer Cell 2(3): 179–182.
15. Vilela M, Danuser G (2011) What’s wrong with correlative experiments? Nat
Cell Biol 13: 1011.
16. Kim DH, Wirtz D (2012) Focal adhesion size uniquely predicts cell migration.
FASEB J 27: 1351–1361.
17. Ku C-J, Wang Y, Weiner OD, Altschuler SJ, Wu LF (2012) Network Crosstalk
Dynamically Changes during Neutrophil Polarization. Cell 149: 1073–1083.
18. Geiger B, Yamada KM (2011) Molecular architecture and function of matrix
adhesions. Cold Spring Harb Perspect Biol 3: a005033.
19. Parsons JT, Horwitz AR, Schwartz MA (2010) Cell adhesion: integrating
cytoskeletal dynamics and cellular tension. Nat Rev Mol Cell Biol 11: 633–643.
20. Gardel ML, Schneider IC, Aratyn-Schaus Y, Waterman CM (2010) Mechanicalintegration of actin and adhesion dynamics in cell migration. Annu Rev Cell
Dev Biol 26: 315–333.
21. Lock JG, Stromblad S (2010) Systems microscopy: an emerging strategy for the
life sciences. Exp Cell Res 316: 1438–1444.
22. Sachs K, Perez O, Pe’er D, Lauffenburger DA, Nolan GP (2005) Causal protein-signaling networks derived from multiparameter single-cell data. Science 308:
523–529.
23. Janes KA, Gaudet S, Albeck JG, Nielsen UB, Lauffenburger DA et al. (2006)
The response of human epithelial cells to TNF involves an inducible autocrinecascade. Cell 124: 1225–1239.
24. Tkachenko E, Sabouri-Ghomi M, Pertz O, Kim C, Gutierrez E et al. (2011)
Protein kinase A governs a RhoA-RhoGDI protrusion-retraction pacemaker inmigrating cells. Nat Cell Biol 13: 660–667.
25. Natarajan M, Lin KM, Hsueh RC, Sternweis PC, Ranganathan R (2006) Aglobal analysis of cross-talk in a mammalian cellular signalling network. Nat Cell
Biol 8: 571–580.
26. Granger CWJ (1969) Investigating causal relations by econometric models and
cross-spectral methods. Econometrica: Journal of the Econometric Society 424–
438.
27. Wiener N (1956) The theory of prediction. Modern mathematics for engineers.
165–190.
28. Bressler SL, Seth AK (2011) Wiener–Granger causality: a well established
methodology. Neuroimage 58: 323–329.
29. Gupton SL, Waterman-Storer CM (2006) Spatiotemporal feedback betweenactomyosin and focal-adhesion systems optimizes rapid cell migration. Cell 125:
1361–1374.
30. Hou Y, Hedberg S, Schneider IC (2012) Differences in adhesion and protrusion
properties correlate with differences in migration speed under EGF stimulation.BMC Biophys 5: 8.
31. Webb DJ, Donais K, Whitmore LA, Thomas SM, Turner CE et al. (2004)
FAK–Src signalling through paxillin, ERK and MLCK regulates adhesiondisassembly. Nat Cell Biol 6: 154–161.
32. Winograd-Katz SE, Itzkovitz S, Kam Z, Geiger B (2009) Multiparametricanalysis of focal adhesion formation by RNAi-mediated gene knockdown. J Cell
Biol 186: 423–436.
33. Li Z, Lock JG, Olofsson H, Kowalewski JM, Teller S et al. (2010) Integrin-mediated Cell Attachment Induces a PAK4-dependent Feedback Loop
Regulating Cell Adhesion through Modified Integrin avb5 Clustering andTurnover. Mol Biol Cell 21: 3317–3329.
34. Pe’er D (2005) Bayesian network analysis of signaling networks: a primer.Science Signaling 2005: pl4.
Plasticity in Causal Networks of Cell Migration
PLOS ONE | www.plosone.org 16 February 2014 | Volume 9 | Issue 2 | e90593

35. Huang S, Ingber DE (2000) Shape-dependent control of cell growth,
differentiation, and apoptosis: switching between attractors in cell regulatorynetworks. Exp Cell Res 261: 91–103.
36. Maree AF, Grieneisen VA, Edelstein-Keshet L (2012) How cells integrate
complex stimuli: the effect of feedback from phosphoinositides and cell shape oncell polarization and motility. PLoS Comput Biol 8: e1002402.
37. Jafari-Mamaghani M (2013) Non-parametric Analysis of Granger CausalityUsing Local Measures of Divergence. Applied Mathematical Sciences 7: 4107–
4136.
38. Bar-Yam Y (2004) A mathematical theory of strong emergence using multiscalevariety. Complexity 9: 15–24.
39. Welf ES, Naik UP, Ogunnaike BA (2011) Probabilistic modeling and analysis ofthe effects of extra-cellular matrix density on the sizes, shapes, and locations of
integrin clusters in adherent cells. BMC Biophys 4: 15.40. Colo GP, Hernandez-Varas P, Lock J, Bartolome RA, Arellano-Sanchez N et al
(2012) Focal adhesion disassembly is regulated by a RIAM to MEK-1 pathway.
J Cell Sci 125: 5338–5352.41. Ezratty EJ, Bertaux C, Marcantonio EE, Gundersen GG (2009) Clathrin
mediates integrin endocytosis for focal adhesion disassembly in migrating cells.J Cell Biol 187: 733–747.
42. Mogilner A, Keren K (2009) The shape of motile cells. Curr Biol 19: R762–
R771.43. Barnhart EL, Lee KC, Keren K, Mogilner A, Theriot JA (2011) An adhesion-
dependent switch between mechanisms that determine motile cell shape. PLoSBiol 9: e1001059.
44. Yam PT, Wilson CA, Ji L, Hebert B, Barnhart EL et al. (2007) Actin-myosinnetwork reorganization breaks symmetry at the cell rear to spontaneously initiate
polarized cell motility. J Cell Biol 178: 1207–1221.
45. Sahai E, Garcia-Medina R, Pouyssegur J, Vial E (2007) Smurf1 regulates tumorcell plasticity and motility through degradation of RhoA leading to localized
inhibition of contractility. J Cell Biol 176: 35–42.46. Wolfenson H, Bershadsky A, Henis YI, Geiger B (2011) Actomyosin-generated
tension controls the molecular kinetics of focal adhesions. J Cell Sci 124: 1425–
1432.47. Sawada Y, Sheetz MP (2002) Force transduction by Triton cytoskeletons. J Cell
Biol 156: 609–615.48. Zamir E, Geiger B, Kam Z (2008) Quantitative multicolor compositional
imaging resolves molecular domains in cell-matrix adhesions. PLoS One 3:e1901.
49. Riveline D, Zamir E, Balaban NQ, Schwarz US, Ishizaki T et al. (2001) Focal
contacts as mechanosensors: externally applied local mechanical force inducesgrowth of focal contacts by an mDia1-dependent and ROCK-independent
mechanism. J Cell Biol 153: 1175–1186.50. Smilenov L, Forsberg E, Zeligman I, Sparrman M, Johansson S (1992)
Separation of fibronectin from a plasma gelatinase using immobilized metal
affinity chromatography. FEBS Lett 302: 227–230.51. Box GEP, Cox DR (1964) An analysis of transformations. J R Stat Soc
Series B Stat Methodol 26: 211–252.52. Dempster AP, Laird NM, Rubin DB (1977) Maximum likelihood from
incomplete data via the EM algorithm. J R Stat Soc Series B Stat Methodol39: 1–38.
53. Akaike H (1974) A new look at the statistical model identification. Automatic
Control, IEEE Transactions on 19: 716–723.
54. Rao CR (1948) The utilization of multiple measurements in problems of
biological classification. J R Stat Soc Series B Stat Methodol 10: 159–203.55. Zou H, Hastie T (2005) Regularization and variable selection via the elastic net.
J R Stat Soc Series B Stat Methodol 67: 301–320.
56. Nobes CD, Hall A (1999) Rho GTPases control polarity, protrusion, andadhesion during cell movement. J Cell Biol 144: 1235–1244.
57. Ridley AJ, Comoglio PM, Hall A (1995) Regulation of scatter factor/hepatocytegrowth factor responses by Ras, Rac, and Rho in MDCK cells. Mol Cell Biol 15:
1110–1122.
58. Takaishi K, Sasaki T, Kato M, Yamochi W, Kuroda S et al. (1994) Involvementof Rho p21 small GTP-binding protein and its regulator in the HGF-induced
cell motility. Oncogene 9: 273–279.59. Totsukawa G, Wu Y, Sasaki Y, Hartshorne DJ, Yamakita Y et al. (2004) Distinct
roles of MLCK and ROCK in the regulation of membrane protrusions and focaladhesion dynamics during cell migration of fibroblasts. J Cell Biol 164: 427–439.
60. Pasapera AM, Schneider IC, Rericha E, Schlaepfer DD, Waterman CM (2010)
Myosin II activity regulates vinculin recruitment to focal adhesions throughFAK-mediated paxillin phosphorylation. J Cell Biol 188: 877–890.
61. Ridley AJ (2001) Rho GTPases and cell migration. J Cell Sci 114: 2713–2722.62. Tkach V, Bock E, Berezin V (2005) The role of RhoA in the regulation of cell
morphology and motility. Cell Motil Cytoskeleton 61: 21–33.
63. Riento K, Ridley AJ (2003) Rocks: multifunctional kinases in cell behaviour. NatRev Mol Cell Biol 4: 446–456.
64. Tsuji T, Ishizaki T, Okamoto M, Higashida C, Kimura K et al. (2002) ROCKand mDia1 antagonize in Rho-dependent Rac activation in Swiss 3T3
fibroblasts. J Cell Biol 157: 819–830.65. Salhia B, Rutten F, Nakada M, Beaudry C, Berens M et al. (2005) Inhibition of
Rho-kinase affects astrocytoma morphology, motility, and invasion through
activation of Rac1. Cancer Res 65: 8792.66. Ridley AJ, Hall A (1992) The small GTP-binding protein rho regulates the
assembly of focal adhesions and actin stress fibers in response to growth factors.Cell 70: 389–399.
67. Chrzanowska-Wodnicka M, Burridge K (1996) Rho-stimulated contractility
drives the formation of stress fibers and focal adhesions. J Cell Biol 133: 1403–1415.
68. Struckhoff AP, Vitko JR, Rana MK, Davis CT, Foderingham KE et al. (2010)Dynamic regulation of ROCK in tumor cells controls CXCR4-driven adhesion
events. J Cell Sci 123: 401–412.69. Amano M, Chihara K, Kimura K, Fukata Y, Nakamura N et al. (1997)
Formation of actin stress fibers and focal adhesions enhanced by Rho-kinase.
Science 275: 1308–1311.70. Ishizaki T, Naito M, Fujisawa K, Maekawa M, Watanabe N et al. (1997)
p160ROCK, a Rho-associated coiled-coil forming protein kinase, worksdownstream of Rho and induces focal adhesions. FEBS Lett 404: 118–124.
71. Schober M, Raghavan S, Nikolova M, Polak L, Pasolli HA et al. (2007) Focal
adhesion kinase modulates tension signaling to control actin and focal adhesiondynamics. J Cell Biol 176: 667–680.
72. Yamana N, Arakawa Y, Nishino T, Kurokawa K, Tanji M et al. (2006) TheRho-mDia1 pathway regulates cell polarity and focal adhesion turnover in
migrating cells through mobilizing Apc and c-Src. Mol Cell Biol 26: 6844–6858.73. Webb DJ, Parsons JT, Horwitz AF (2002) Adhesion assembly, disassembly and
turnover in migrating cells–over and over and over again. Nat Cell Biol 4: E97–
E100.
Plasticity in Causal Networks of Cell Migration
PLOS ONE | www.plosone.org 17 February 2014 | Volume 9 | Issue 2 | e90593