Plasma protein changes in horse after prolonged physical exercise: A proteomic study
11
Plasma protein changes in horse after prolonged physical exercise: A proteomic study ☆ Fausto Scoppetta a, 1 , Micaela Tartaglia a, 1 , Giovanni Renzone b , Luca Avellini a , Alberto Gaiti a , Andrea Scaloni b, ⁎ , Elisabetta Chiaradia a, ⁎ a Biochemistry Laboratory, Sport Horse Research Centre, Department of Pathologic, Diagnostic and Clinical Veterinary Medicine, University of Perugia, 06126 Perugia, Italy b Proteomics and Mass Spectrometry Laboratory, ISPAAM, National Research Council, 80147 Naples, Italy ARTICLE INFO ABSTRACT Available online 24 April 2012 Physical exercise induces various stress responses and metabolic adaptations that have not yet been completely elucidated. Novel biomarkers are needed in sport veterinary medicine to monitor training levels and to detect subclinical conditions that can develop into exercise- related diseases. In this study, protein modifications in horse plasma induced by prolonged, aerobic physical exercise were investigated by using a proteomic approach based on 2-DE and combined mass spectrometry procedures. Thirty-eight protein spots, associated with expres- sion products of 13 genes, showed significant quantitative changes; spots identified as membrane Cu amine oxidase, α-1 antitrypsin, α-1 antitrypsin-related protein, caeruloplasmin, α-2 macroglobulin and complement factor C4 were augmented in relative abundance after the race, while haptoglobin β chain, apolipoprotein A-I, transthyretin, retinol binding protein 4, fibrinogen γ chain, complement factor B and albumin fragments were reduced. These results indicate that prolonged physical exercise affects plasma proteins involved in pathways related to inflammation, coagulation, immune modulation, oxidant/antioxidant activity and cellular and vascular damage, with consequent effects on whole horse metabolism. This article is part of a Special Issue entitled: Farm animal proteomics. © 2012 Elsevier B.V. All rights reserved. Keywords: Horse Endurance Plasma proteins Physical exercise Proteomics 1. Introduction Depending on the intensity, duration and type of physical exercise, equine metabolism has to adapt to nervous, cardio- vascular, endocrine and respiratory system requirements. Metabolic variations include changes in catabolic reactions to maintain optimal ATP concentration and high O 2 consumption, enhanced substrate depletion and heat dissipation, as well as augmented biochemical processes to face the accumulation of resulting metabolites [1–5]. Similarly to other stressors, it needs adequate responses to re-establish homeostatic equilibrium; this is mainly achieved by the hormonal system [5,6]. Circulat- ing hormone concentrations change as result of variations in glandular production/secretion, metabolic clearance rate, tar- get tissue uptake, molecular degradation and regulation of carrier proteins [5,7]. The stress response is initiated in the hypothalamic– pituitary–adrenal axis with sympathetic nervous system acti- vation, followed by production of adrenaline and glucocorti- coids that increase cellular ATP production and promote gluconeogenesis. During the response to physical exercise, adrenaline and glucocorticoids also modulate the immune JOURNAL OF PROTEOMICS 75 (2012) 4494 – 4504 ☆ This article is part of a Special Issue entitled: Farm animal proteomics. ⁎ Corresponding authors. E-mail addresses: [email protected] (A. Scaloni), [email protected] (E. Chiaradia). 1 These authors contributed equally to this work. 1874-3919/$ – see front matter © 2012 Elsevier B.V. All rights reserved. doi:10.1016/j.jprot.2012.04.014 Available online at www.sciencedirect.com www.elsevier.com/locate/jprot
Transcript of Plasma protein changes in horse after prolonged physical exercise: A proteomic study
J O U R N A L O F P R O T E O M I C S 7 5 ( 2 0 1 2 ) 4 4 9 4 – 4 5 0 4
Ava i l ab l e on l i ne a t www.sc i enced i r ec t . com
www.e l sev i e r . com/ loca te / j p ro t
Plasma protein changes in horse after prolonged physicalexercise: A proteomic study☆
Fausto Scoppettaa, 1, Micaela Tartagliaa, 1, Giovanni Renzoneb, Luca Avellinia, Alberto Gaitia,Andrea Scalonib,⁎, Elisabetta Chiaradiaa,⁎aBiochemistry Laboratory, Sport Horse Research Centre, Department of Pathologic, Diagnostic and Clinical Veterinary Medicine,University of Perugia, 06126 Perugia, ItalybProteomics and Mass Spectrometry Laboratory, ISPAAM, National Research Council, 80147 Naples, Italy
A R T I C L E I N F O
☆ This article is part of a Special Issue entit⁎ Corresponding authors.
E-mail addresses: andrea.scaloni@ispaam1 These authors contributed equally to this
1874-3919/$ – see front matter © 2012 Elseviedoi:10.1016/j.jprot.2012.04.014
A B S T R A C T
Available online 24 April 2012
Physical exercise induces various stress responses andmetabolic adaptations that have not yetbeen completely elucidated. Novel biomarkers are needed in sport veterinary medicine tomonitor training levels and to detect subclinical conditions that can develop into exercise-related diseases. In this study, protein modifications in horse plasma induced by prolonged,aerobic physical exercise were investigated by using a proteomic approach based on 2-DE andcombined mass spectrometry procedures. Thirty-eight protein spots, associated with expres-sion products of 13 genes, showed significant quantitative changes; spots identified asmembrane Cu amine oxidase, α-1 antitrypsin, α-1 antitrypsin-related protein, caeruloplasmin,α-2 macroglobulin and complement factor C4 were augmented in relative abundance after therace, while haptoglobin β chain, apolipoprotein A-I, transthyretin, retinol binding protein 4,fibrinogen γ chain, complement factor B and albumin fragments were reduced. These resultsindicate that prolonged physical exercise affects plasma proteins involved in pathways relatedto inflammation, coagulation, immune modulation, oxidant/antioxidant activity and cellularand vascular damage, with consequent effects on whole horse metabolism.This article is part of a Special Issue entitled: Farm animal proteomics.© 2012 Elsevier B.V. All rights reserved.
Keywords:HorseEndurancePlasma proteinsPhysical exerciseProteomics
1. Introduction
Depending on the intensity, duration and type of physicalexercise, equine metabolism has to adapt to nervous, cardio-vascular, endocrine and respiratory system requirements.Metabolic variations include changes in catabolic reactions tomaintain optimal ATP concentration and highO2 consumption,enhanced substrate depletion and heat dissipation, as well asaugmented biochemical processes to face the accumulation ofresultingmetabolites [1–5]. Similarly to other stressors, it needsadequate responses to re-establish homeostatic equilibrium;
led: Farm animal proteom
.cnr.it (A. Scaloni), elisabwork.
r B.V. All rights reserved
this is mainly achieved by the hormonal system [5,6]. Circulat-ing hormone concentrations change as result of variations inglandular production/secretion, metabolic clearance rate, tar-get tissue uptake, molecular degradation and regulation ofcarrier proteins [5,7].
The stress response is initiated in the hypothalamic–pituitary–adrenal axis with sympathetic nervous system acti-vation, followed by production of adrenaline and glucocorti-coids that increase cellular ATP production and promotegluconeogenesis. During the response to physical exercise,adrenaline and glucocorticoids also modulate the immune
ics.
[email protected] (E. Chiaradia).
.
4495J O U R N A L O F P R O T E O M I C S 7 5 ( 2 0 1 2 ) 4 4 9 4 – 4 5 0 4
system. Immune cells and active muscle tissues supportproduction of potent circulating inflammatory mediators, i.e.interleukin (IL)-6, IL-1 and tumour necrosis factor (TNF)-α [8,9].An eventual imbalance in pro- and anti-inflammatory cyto-kines can even compromise immune system functions, with areduction of lymphocyte proliferative capacity [8,10]. Otherexercise-induced changes include haemolysis, oxidative stressand the release of acute phase proteins [11–17]. In equinemedicine, the effects of physical exercise-related stress aregenerally associated with poorly understood disorders, such asthe poor performance syndrome, the overtraining syndrome,exertional rhabdomyolysis and exercise-induced pulmonaryhaemorrhage [18–25]. New markers are needed to evaluate theeffect of physical exercise on horse metabolism and to improvecurrent diagnostic procedures, which are inadequate for earlydiagnosis, training level tests and detection of sub-clinicalconditions.
In animal sciences, the implementation of proteomics andother post-genomic tools is an important step towards moredetailed understanding of the complex biological systemscontrolling pathophysiology of living beings [26]. Proteomicstudies on farm animals are now providing informationon product derivatives for human consumption, such as rawmaterials and biological traits that impact yield/quality of theseproductions, but also on complex biological mechanismsaffecting individual health and disease [26–29]. In exerciseresearch studies, previous differential proteomic studies havefocused on muscle [30–33], kidney [34], and heart [35,36] fromrodents, and on muscle [37,38] from equines. These investiga-tions paralleled other studies on muscle [31,32] and urine [39]that were performed on human counterpart.
In this study, we used a proteomic approach to investi-gate the changes of plasma protein levels in horses as aresult of prolonged physical exercise. Unlike observationslimited to a single protein, proteomics provided here aholistic view of the deregulated molecular functions associ-ated with physical stress. Endurance races, as associatedwith prolonged aerobic activity, elicit remarkable metabolicand hormonal adaptations over time that end up withquantitative protein changes [9,40–42]. Some pathophysio-logical conditions have been described in horse associatedwith long distance endurance race [24,25,43,44]. Variousproteins involved in different pathways related to physicalstress response showed significant quantitative changes,suggesting novel scenarios on this highly investigatedphysiological condition.
2. Materials and methods
2.1. Animals and sample collection
Eight healthy Anglo-Arabians stallions were recruited to thestudy; they came from different racing stables and took part invarious endurance races (90–120 km). In particular one 6 yearold, one 8 year old and one 11 year old animals participated inendurance races 90 km long, while two 9 year old, two 11 yearold and one 12 year old animals competed in endurance races120 km long. With respect to animal welfare, blood samplescollected from the race veterinary committee for medical
check-ups were used. In accordance with Italian EquestrianSports Federation regulations, animal hydration status, heartand respiratory frequency, metabolic conditions (capillaryrefill time, gastrointestinal sounds, mucosal colour, recoveryindex), physical injuries and shoeing were evaluated before,during and after the race. All animals, showing all testedparameters ranging within the limits required, concluded thecompetition and were ranked. Notwithstanding the racelength, they performed the contest in about 395±50min, at aspeed value varying from 16 to 17.5 km/h. Immediately aftercompetition, all animals weremaintained in a complete restingcondition, for 15min, and then they were evaluated for heartfrequency (<55 bpm), recovery index as measured by theRidgway test (<2), serum lactate concentration (<2.1 mmol/L),and creatine kinase activity (<650 U/L), as already reported[41,45]; then, they were placed in a box for further 48 h, undercomplete resting conditions.
Blood samples were collected 15min before the race (control),15min afterwards (race) and 24 and 48 h after the race; theywerecentrifuged, immediately after collection. Plasma samples addedwith protease inhibitors cocktail (Sigma) were placed in liquidnitrogen for transport and then stored at −80 °C. Eight biologicalsamples for each condition were analysed in technical tripli-cates, which were then subjected to parallel proteomic analysis.This study was approved by the Animal Study Committee of theUniversity of Perugia (No. 3/30.09.2011).
2.2. 2-Dimensional gel electrophoresis and gel imageanalysis
Plasma samples (12–15 μL) containing about 900 μg of totalproteins were treated with an equal volume of 2.3% 1,4-dithioerythritol and 2% 3-[(3-cholamidopropyl)-dimethylam-monio]-1-propane sulfonate (CHAPS) at 95 °C, for 5 min, anddiluted in IEF sample buffer (final volume 350 μL) containing8 M urea, 2 M thiourea, 2% CHAPS, 30 mM Tris, 100 mM 1,4-dithiothreitol, 0.8% ampholytes (Bio-Rad, Hercules, CA, USA)and a trace of bromophenol blue. Protein concentration wasestimated by using the Bradford assay (Bio-Rad). IPG strips(17 cm, pH 3–10 or 4–7) (Bio-Rad) were rehydrated for 12 h at50 V. Proteins were focused by using a Protean IEF Cell (Bio-Rad) at 20 °C, with a limiting current of 50 µA/strip, accordingto the following conditions: linear gradient from 50 to 1000 Vin 5 h, at 1000 V for 7 h, and at 10,000 V until a total 95,000 Vhwas reached. After focusing, proteins were reduced byincubating the IPG strips with 5 mM tributylphosphine in10 mL of equilibration buffer (375 mM Tris–HCl pH 8.8, 6 Murea, 20% w/v glycerol, 2% w/v SDS) for 14 min, and alkylatedwith 2.5% w/v iodoacetamide in 10 mL of equilibration buffer,for 14 min. Electrophoresis in the second dimension wascarried out in gradient slab polyacrylamide gels (9–16%T)(180×240×1mm) in a Protean XL Multi-cells apparatus (Bio-Rad), hosting six gels simultaneously. IPG strips were laid on topof the gels with 0.5% agarose in the cathode buffer (192mMglycine, 15mM Tris, 0.1% SDS, pH 8.3) containing a dash ofbromophenol blue. Anode buffer consisted of 375mM Tris–HCl,pH 8.8. Gels were run at 5mA/gel for 1 h and at 10mA/gelovernight, at 10 °C, until the dye front reached the bottom of thegel. 2-DE gels were stained with colloidal Coomassie blue G250(0.12% G250, 20% v/v methanol, 10% v/v o-phosphoric acid, 10%

4496 J O U R N A L O F P R O T E O M I C S 7 5 ( 2 0 1 2 ) 4 4 9 4 – 4 5 0 4
Fig. 1 – Representative 2-dimensional gel (pH 4–7, 9–16%T)image for equine plasma after staining with colloidalCoomassie. Differentially represented spots before the race(control) and immediately afterwards, 24 and 48 h after therace, as deduced from statistical analysis (P<0.05), arereported and numbered.
w/v ammonium sulphate) and destained in 5% v/v acetic acid;resulting imageswere acquired by usingGS-800 imaging systems(Bio-Rad). Each sample was analysed in technical triplicate.Molecular mass and pI values were estimated by running asample containing plasma proteins together with a mixture ofprotein standards (Bio-Rad).
Digitized images of Coomassie-stained gels were analysedby using the PDQuest (ver 7.2) software (Bio-Rad), whichallowed spot detection, landmark identification, aligning/matching of spots within gels, quantification of matchedspots and their analysis. Manual inspection of the spots wasperformed to verify the accuracy of the automatic gel match-ing; any error in the automatic procedure was manuallycorrected prior to the final data analysis. The spot volumewas used as the analysis parameter for quantifying proteinexpression. The protein spot volume was normalized to thespot volume of the entire gel (i.e., of all the protein spots). Fold-changes in protein spot levels were calculated between spotvolumes in the treated group relative to that in the control one.Statistically significant changes in protein abundance weredetermined by using two sequential data analysis criteria. First,a protein spot had to be present in all gels for each sample to beincluded in the analysis. Next, statistically significant quanti-tative changes were determined by using the distribution offold-change values in the data. Spots were determined to bestatistically significant if the difference between the averageintensity of a specific protein spot in the resting and stressedanimals (three technical replicates of eight biological samples)was greater than one standard deviation of the spot intensitiesfor both groups. An absolute two-fold change in normalizedspot densities was then considered as indicative of a significantquantitative variation.
For statistical analysis, data were analysed by using the Rsoftware to perform analysis of variance (ANOVA) with a non-linear mixed-effects model, which includes the fixed effect oftime and the random effects of horse and of the error term.The comparisons performed were: immediately after race vs.control (race vs. control), 24 h after race vs. control (24 h vs.control), and 48 h after race vs. control (48 h vs. control). Pvalues<0.05 were considered to be significant. Measuredinter-individual coefficient of variation was within the valuereported for humans [46].
2.3. Protein digestion and mass spectrometry analysis
Spots from 2-DE were manually excised from gels, minced andwashed with water. Proteins were in-gel reduced, S-alkylatedand digested with trypsin, as previously reported [47]. Proteindigests were subjected to a desalting/concentration step onμZipTipC18 pipette tips (Millipore Corp., Bedford, MA, USA)before MALDI-TOF-MS and/or nanoLC-ESI-LIT-MS/MS analysis.
During MALDI-TOF peptide mass fingerprinting (PMF)experiments, peptide mixtures were loaded on the instru-ment target together with CHCA as matrix, using the drieddroplet technique. Samples were analysed with a Voyager-DEPRO mass spectrometer (Applied Biosystems, USA). Peptidemass spectra were acquired in reflectron mode; internal masscalibration was performed with peptides derived from trypsinautoproteolysis. Data were elaborated using the DataExplorer5.1 software (Applied Biosystems).
Peptide mixtures were eventually analysed by nanoLC-ESI-LIT-MS/MS using a LTQ XL mass spectrometer (ThermoFinni-gan, USA) equipped with Proxeon nanospray source connectedto an Easy-nanoLC (Proxeon, Denmark) [48]. Peptide mixtureswere separated on an Easy C18 column (10×0.075 mm, 3 μm)(Proxeon) using a gradient of acetonitrile containing 0.1% formicacid in aqueous 0.1% formic acid; acetonitrile ramped from 5%to 35% over 15 min and from 35% to 95% over 2 min, at a flowrate of 300 nL/min. Spectra were acquired in the range m/z400–2000. Acquisition was controlled by a data-dependentproduct ion scanning procedure over the three most abundantions, enabling dynamic exclusion (repeat count 2 and exclusionduration 1 min). The mass isolation window and collisionenergy were set tom/z 3 and 35%, respectively.
2.4. Protein identification and classification
MASCOT software package version 2.2.06 (Matrix Science, UK)[49] was used to identify spots unambiguously from an updatedhorse non-redundant sequence database (NCBI 2009/05/03).MALDI-TOF PMF data were searched using a mass tolerancevalue of 50 ppm, trypsin as proteolytic enzyme, a missedcleavage maximum value of 2 and Cys carbamidomethylationand Met oxidation as fixed and variable modifications, respec-tively. NanoLC-ESI-LIT-MS/MS data were searched by using amass tolerance value of 2 Da for precursor ion and 0.8 Da forMS/MS fragments, trypsin as proteolytic enzyme, a missedcleavage maximum value of 2 and Cys carbamidomethylationand Met oxidation as fixed and variable modifications, respec-tively. MALDI-TOF PMF candidates with a cumulative MASCOTscore>83 or nanoLC-ESI-LIT-MS/MS candidates withmore than

3as-sig-ned
pe-pti-deswi-
thanin-
di-vi-du-al
4497JO
UR
NA
LO
FPR
OT
EO
MIC
S75
(2012)
4494–4504
Table 1 – Proteinswith changed expression levels in horses before the race (control), immediately afterward d 24 and 48 h after the race. Spot number, protein name, genenumber according to the NCBI database, theoretical and experimental pI and Mr values, identification, an change±SD (each time vs. control) are listed. PMF and TMSindicate MALDI-TOF peptide mass fingerprinting and nanoLC-ESI-LIT-MS/MS, respectively. All GenBank s nces are from horse.
Spot Protein name Accessionnumber
pI/Mr (kDa)theoretical
pI/Mr (kDa)experimental
Identificatiomethod
Assignedpeptides
Sequencecoverage (%)
Mascotscore
Fold change±SD(time vs. control)
1 Haptoglobin beta chain gi|149699777 5.59/38 4.80/40 PMF 16 48 191 0.31±0.1 (race)2 Haptoglobin beta chain gi|149699777 5.59/38 4.90/40 PMF 13 43 156 0.23±0.15 (race)3 Haptoglobin beta chain gi|149699777 5.59/38 4.91/37 PMF 9 27 136 0.34±0.08 (race)4 Haptoglobin beta chain gi|149699777 5.59/38 5.03/37 PMF 9 27 129 0.29±0.16 (race)5 Haptoglobin beta chain gi|149699777 5.59/38 5.18/38 PMF 9 27 124 0.25±0.2 (race)6 Apolipoprotein A-I gi|149716548 5.66/30 5.46/24 PMF 27 75 392 0.37±0.06 (race)7 Apolipoprotein A-I gi|149716548 5.66/30 5.20/25 PMF 24 63 338 0.27±0.1 (race)8 Apolipoprotein A-I gi|149716548 5.66/30 5.75/25 PMF 21 62 281 0.43±0.03 (race)9 Complement factor B gi|149732066 6.75/87 6.10/89 PMF 13 21 169 0.20±0.23 (race)10 Complement factor B gi|149732066 6.75/87 6.18/89 PMF 17 28 168 0.37±0.02 (race)11 Complement factor B gi|149732066 6.75/87 6.27/89 PMF 11 21 156 0.30±0.20 (race)12 Membrane copper amine oxidase gi|149724387 5.75/85 5.40/89 PMF 17 25 192 2.5±0.4 (race)13 Membrane copper amine oxidase gi|149724387 5.75/85 5.44/90 PMF 16 24 169 2.46±0.3 (race)14 Membrane copper amine oxidase gi|149724387 5.75/85 5.48/90 PMF 15 23 174 2.5±0.25 (race)15 Caeruloplasmin gi|149729967 5.36/123 5.23/137 PMF 34 32 333 2.5±0.5 (race)16 Caeruloplasmin gi|149729967 5.36/123 5.26/137 PMF 24 26 207 2.45±0.3 (race)17 Caeruloplasmin gi|149729967 5.36/123 5.29/136 PMF 25 25 214 2.94±0.78 (race)18 Caeruloplasmin gi|149729967 5.36/123 5.32/138 PMF 42 40 410 2.91±0.8 (race)19 Complement component C4A gi|149732359 6.83/194 5.37/255 TMS 11 7 522 2.3±0.43 (race)
(continued on next page)
s and foldeque
n
4498JO
UR
NA
LO
FPR
OT
EO
MIC
S75
(2012)
4494–4504
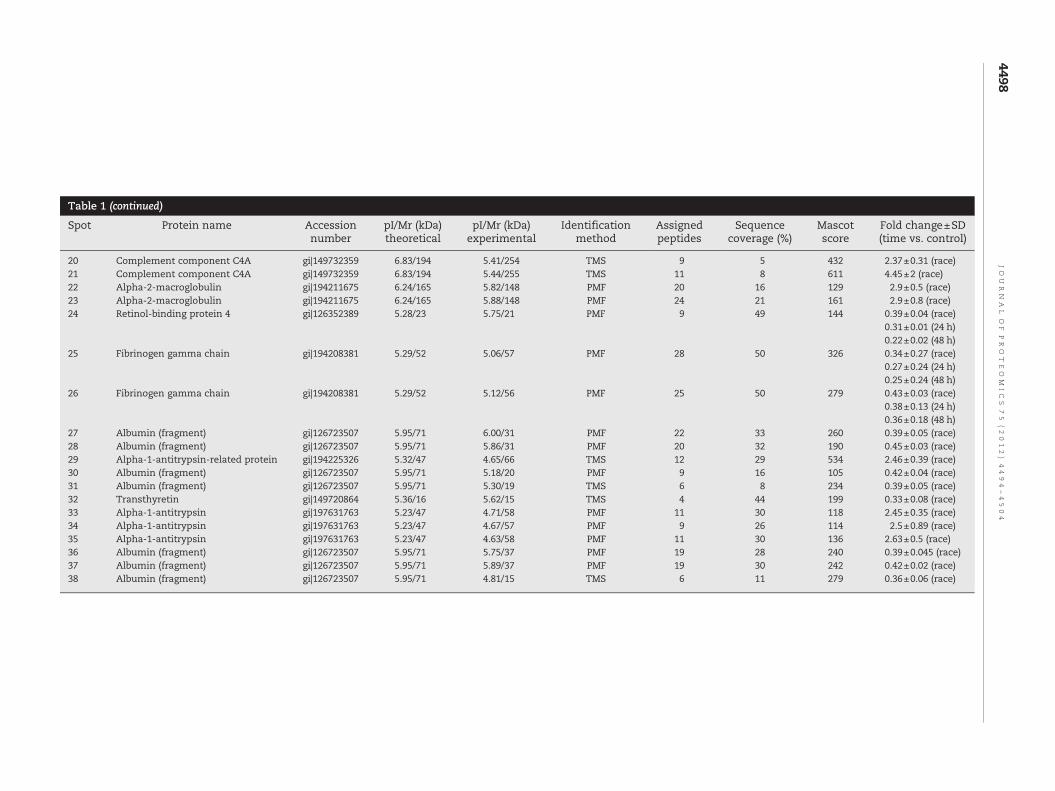
Table 1 (continued)
Spot Protein name Accessionnumber
pI/Mr (kDa)theoretical
pI/Mr (kDa)experimental
Identificationmethod
Assignedpeptides
Sequencecoverage (%)
Mascotscore
Fold change±SD(time vs. control)
20 Complement component C4A gi|149732359 6.83/194 5.41/254 TMS 9 5 432 2.37±0.31 (race)21 Complement component C4A gi|149732359 6.83/194 5.44/255 TMS 11 8 611 4.45±2 (race)22 Alpha-2-macroglobulin gi|194211675 6.24/165 5.82/148 PMF 20 16 129 2.9±0.5 (race)23 Alpha-2-macroglobulin gi|194211675 6.24/165 5.88/148 PMF 24 21 161 2.9±0.8 (race)24 Retinol-binding protein 4 gi|126352389 5.28/23 5.75/21 PMF 9 49 144 0.39±0.04 (race)
0.31±0.01 (24 h)0.22±0.02 (48 h)
25 Fibrinogen gamma chain gi|194208381 5.29/52 5.06/57 PMF 28 50 326 0.34±0.27 (race)0.27±0.24 (24 h)0.25±0.24 (48 h)
26 Fibrinogen gamma chain gi|194208381 5.29/52 5.12/56 PMF 25 50 279 0.43±0.03 (race)0.38±0.13 (24 h)0.36±0.18 (48 h)
27 Albumin (fragment) gi|126723507 5.95/71 6.00/31 PMF 22 33 260 0.39±0.05 (race)28 Albumin (fragment) gi|126723507 5.95/71 5.86/31 PMF 20 32 190 0.45±0.03 (race)29 Alpha-1-antitrypsin-related protein gi|194225326 5.32/47 4.65/66 TMS 12 29 534 2.46±0.39 (race)30 Albumin (fragment) gi|126723507 5.95/71 5.18/20 PMF 9 16 105 0.42±0.04 (race)31 Albumin (fragment) gi|126723507 5.95/71 5.30/19 TMS 6 8 234 0.39±0.05 (race)32 Transthyretin gi|149720864 5.36/16 5.62/15 TMS 4 44 199 0.33±0.08 (race)33 Alpha-1-antitrypsin gi|197631763 5.23/47 4.71/58 PMF 11 30 118 2.45±0.35 (race)34 Alpha-1-antitrypsin gi|197631763 5.23/47 4.67/57 PMF 9 26 114 2.5±0.89 (race)35 Alpha-1-antitrypsin gi|197631763 5.23/47 4.63/58 PMF 11 30 136 2.63±0.5 (race)36 Albumin (fragment) gi|126723507 5.95/71 5.75/37 PMF 19 28 240 0.39±0.045 (race)37 Albumin (fragment) gi|126723507 5.95/71 5.89/37 PMF 19 30 242 0.42±0.02 (race)38 Albumin (fragment) gi|126723507 5.95/71 4.81/15 TMS 6 11 279 0.36±0.06 (race)
4499J O U R N A L O F P R O T E O M I C S 7 5 ( 2 0 1 2 ) 4 4 9 4 – 4 5 0 4
MASCOT score>25, both corresponding to P<0.05 for a signif-icant identification, were further evaluated by the comparisonwith their calculated mass and pI values, using the experimen-tal values obtained from 2-DE.
Gene ontology (GO) classification of the identified proteinswas performed through the web-accessible DAVID (v 6.7)annotation system (http://david.abcc.ncifcrf.gov/home.jsp) [50].Briefly, the identified proteins were converted into humanRefSeq-protein identifiers through the DAVID Gene ID conver-sion tool; the new list was then submitted to functionalannotation clustering.
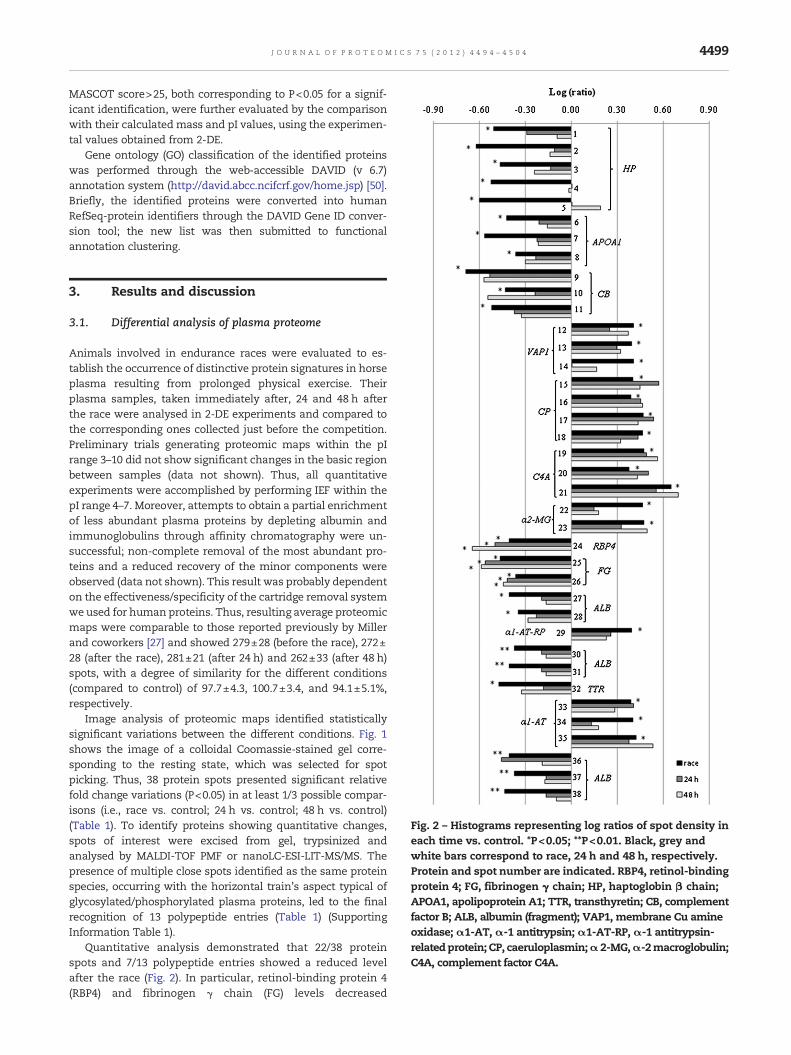
Fig. 2 – Histograms representing log ratios of spot density ineach time vs. control. *P<0.05; **P<0.01. Black, grey andwhite bars correspond to race, 24 h and 48 h, respectively.Protein and spot number are indicated. RBP4, retinol-bindingprotein 4; FG, fibrinogen γ chain; HP, haptoglobin β chain;APOA1, apolipoprotein A1; TTR, transthyretin; CB, complementfactor B; ALB, albumin (fragment); VAP1, membrane Cu amineoxidase;α1-AT,α-1 antitrypsin;α1-AT-RP,α-1 antitrypsin-relatedprotein; CP, caeruloplasmin;α2-MG,α-2macroglobulin;C4A, complement factor C4A.
3. Results and discussion
3.1. Differential analysis of plasma proteome
Animals involved in endurance races were evaluated to es-tablish the occurrence of distinctive protein signatures in horseplasma resulting from prolonged physical exercise. Theirplasma samples, taken immediately after, 24 and 48 h afterthe race were analysed in 2-DE experiments and compared tothe corresponding ones collected just before the competition.Preliminary trials generating proteomic maps within the pIrange 3–10 did not show significant changes in the basic regionbetween samples (data not shown). Thus, all quantitativeexperiments were accomplished by performing IEF within thepI range 4–7. Moreover, attempts to obtain a partial enrichmentof less abundant plasma proteins by depleting albumin andimmunoglobulins through affinity chromatography were un-successful; non-complete removal of the most abundant pro-teins and a reduced recovery of the minor components wereobserved (data not shown). This result was probably dependenton the effectiveness/specificity of the cartridge removal systemweused for human proteins. Thus, resulting average proteomicmaps were comparable to those reported previously by Millerand coworkers [27] and showed 279±28 (before the race), 272±28 (after the race), 281±21 (after 24 h) and 262±33 (after 48 h)spots, with a degree of similarity for the different conditions(compared to control) of 97.7±4.3, 100.7±3.4, and 94.1±5.1%,respectively.
Image analysis of proteomic maps identified statisticallysignificant variations between the different conditions. Fig. 1shows the image of a colloidal Coomassie-stained gel corre-sponding to the resting state, which was selected for spotpicking. Thus, 38 protein spots presented significant relativefold change variations (P<0.05) in at least 1/3 possible compar-isons (i.e., race vs. control; 24 h vs. control; 48 h vs. control)(Table 1). To identify proteins showing quantitative changes,spots of interest were excised from gel, trypsinized andanalysed by MALDI-TOF PMF or nanoLC-ESI-LIT-MS/MS. Thepresence of multiple close spots identified as the same proteinspecies, occurring with the horizontal train's aspect typical ofglycosylated/phosphorylated plasma proteins, led to the finalrecognition of 13 polypeptide entries (Table 1) (SupportingInformation Table 1).
Quantitative analysis demonstrated that 22/38 proteinspots and 7/13 polypeptide entries showed a reduced levelafter the race (Fig. 2). In particular, retinol-binding protein 4(RBP4) and fibrinogen γ chain (FG) levels decreased
4500 J O U R N A L O F P R O T E O M I C S 7 5 ( 2 0 1 2 ) 4 4 9 4 – 4 5 0 4
significantly (P<0.05 vs. control) after competition andremained low even after 48 h (Fig. 3). Conversely, haptoglobinβ chain (HP), apolipoprotein A1 (APOA1), transthyretin (TTR),complement factor B (CB) and albumin (ALB) fragment levelsdropped significantly after competition but returned compa-rable to the initial values at the end of the observation (48 h)(Fig. 3). Observed quantitative changes in ALB fragments werehighly significant (P<0.01). On the other hand, 16/38 proteinspots showed an increased level after the race (Fig. 2); theywere identified as membrane Cu amine oxidase (VAP1), α-1antitrypsin (α1-AT), α-1 antitrypsin-related protein (α1-AT-RP), caeruloplasmin (CP), α-2 macroglobulin (α2-MG) andcomplement factor C4A (C4A). Their levels were raised justafter the race, gradually returning to initial values at the endof the observation period (48 h) (Fig. 3).
3.2. Putative biomarkers of prolonged physical exercise
The quantitative pattern observed for plasma proteins fromanimals subjected to prolonged physical exercise seemedapparently associated with an inflammatory condition. How-ever, an accurate evaluation of the 13 deregulated proteins byGO classification (GOTERM_BP_ALL) highlighted a commonparticipation of nine entries to ‘response to external stimulus’
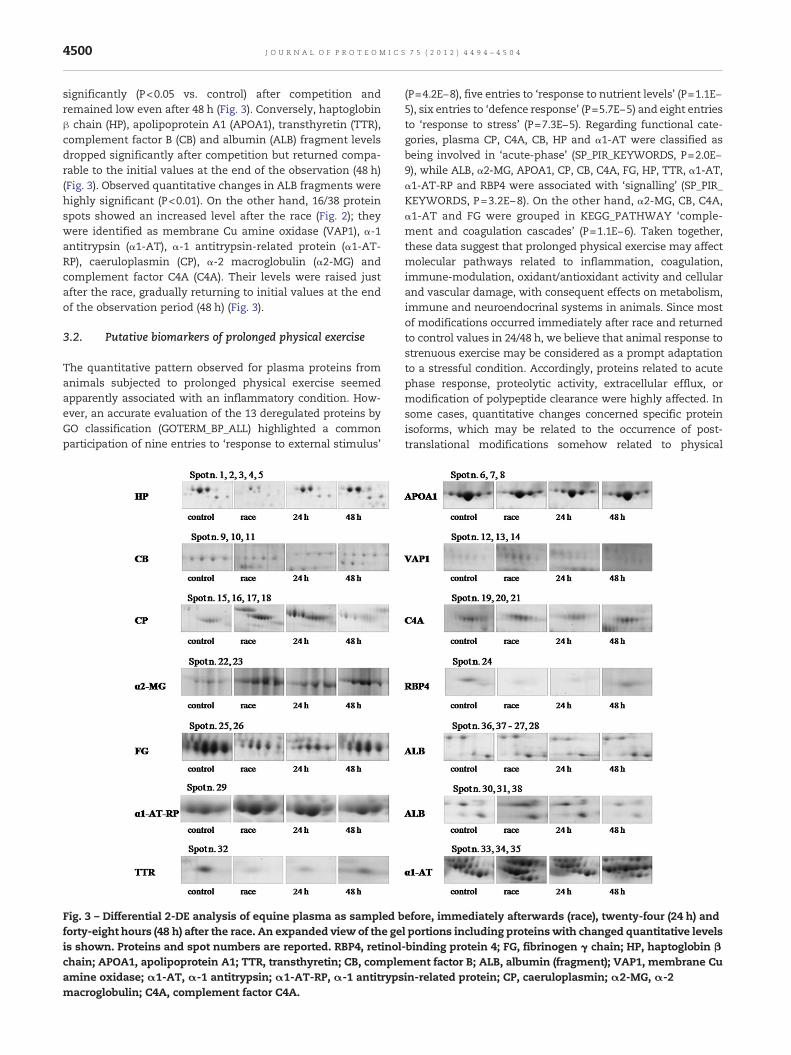
Fig. 3 – Differential 2-DE analysis of equine plasma as sampled bforty-eight hours (48 h) after the race. An expanded view of the geis shown. Proteins and spot numbers are reported. RBP4, retinolchain; APOA1, apolipoprotein A1; TTR, transthyretin; CB, compleamine oxidase; α1-AT, α-1 antitrypsin; α1-AT-RP, α-1 antitrypsmacroglobulin; C4A, complement factor C4A.
(P=4.2E−8), five entries to ‘response to nutrient levels’ (P=1.1E−5), six entries to ‘defence response’ (P=5.7E−5) and eight entriesto ‘response to stress’ (P=7.3E−5). Regarding functional cate-gories, plasma CP, C4A, CB, HP and α1-AT were classified asbeing involved in ‘acute-phase’ (SP_PIR_KEYWORDS, P=2.0E−9), while ALB, α2-MG, APOA1, CP, CB, C4A, FG, HP, TTR, α1-AT,α1-AT-RP and RBP4 were associated with ‘signalling’ (SP_PIR_KEYWORDS, P=3.2E−8). On the other hand, α2-MG, CB, C4A,α1-AT and FG were grouped in KEGG_PATHWAY ‘comple-ment and coagulation cascades’ (P=1.1E−6). Taken together,these data suggest that prolonged physical exercise may affectmolecular pathways related to inflammation, coagulation,immune-modulation, oxidant/antioxidant activity and cellularand vascular damage, with consequent effects on metabolism,immune and neuroendocrinal systems in animals. Since mostof modifications occurred immediately after race and returnedto control values in 24/48 h, we believe that animal response tostrenuous exercise may be considered as a prompt adaptationto a stressful condition. Accordingly, proteins related to acutephase response, proteolytic activity, extracellular efflux, ormodification of polypeptide clearance were highly affected. Insome cases, quantitative changes concerned specific proteinisoforms, which may be related to the occurrence of post-translational modifications somehow related to physical
efore, immediately afterwards (race), twenty-four (24 h) andl portions including proteinswith changed quantitative levels-binding protein 4; FG, fibrinogen γ chain; HP, haptoglobin βment factor B; ALB, albumin (fragment); VAP1, membrane Cuin-related protein; CP, caeruloplasmin; α2-MG, α-2

4501J O U R N A L O F P R O T E O M I C S 7 5 ( 2 0 1 2 ) 4 4 9 4 – 4 5 0 4
exercise, as already reported for carbonylation [51] or phos-phorylation [52,53].
Specific quantitative trends observed for HP, C4A and ALBfragments, differently to what is generally detected duringacute phase, indicate a distinctive response to prolongedphysical activity in horses. In particular, quantitative levels ofthe positive acute phase protein HP were highly reducedimmediately after physical exercise and return to valuescomparable to the initial values after 48 h (Figs. 2 and 3). Thistrendmay be related to an increased protein carbonylation thatshould promote its proteolytic processing, as already observedin humans [51]. Contrasting quantitative data have beenreported on total haptoglobin in horse after physical exercise[12,15,16,54–56]; these discrepanciesmay be probably related tothe different physiological conditions analysed, the differentbiochemical assays used in these studies and the nature of theprotein (total or specific isoforms) determined. HP forms verystable soluble complexes with free plasma haemoglobin(Hb), which is released into circulation during haemolysis[57,58]. HP binding to Hb, followed by macrophage receptorCD163-mediated endocytosis of the resulting HP-Hb com-plex, ensures the rapid hepatic clearance of Hb from plasmaand inhibits glomerular filtration of Hb, with a concomitantreduction of HP plasma levels. Thus, the diminution of HPlevels observed in this study may be related to the Hbrelease, since strenuous exercise in horses is frequentlyassociated with haemolysis [12,16]. In addition, these resultscould rely on a transient damage to individual muscle fibreswith resulting myoglobin release; indeed HP, as specific highcapacity heme-scavenging system, is reduced after muscledamage [58–60]. Reduced HP levels, together with quantita-tive changes of other metallo-enzymes (see below), shouldalso determine variations in plasma antioxidant capacity, asa result of the limited amounts of iron circulating in plasma,thus contributing to the well-known reactive oxygen speciesover-production observed during prolonged physical activity[3,11,13,61,62].
Similarly to changes that occur during acute phase [63,64],APOA1, TTR and RBP4 levels were highly reduced immediatelyafter the race (Figs. 2 and 3). Quantitative levels of theseproteins have been related to pro-inflammatory cytokines (IL-1, IL-6 and TNF-α) and pentraxins (C-reactive protein andserum amyloid A) [65,66]. Thus, the observed early drops ofthese proteins in stressed animals should be linked to theincreased IL-1, IL-6, TNF-α and pentraxins levels alreadyreported during physical exercise [67,9]. In addition, measuredTTR decrease could also be associated with the observedaugmented protein carbonylation under this condition, whichshould promote its proteolysis [51]. Besides being inflamma-tory proteins, APOA1, TTR and RBP4 also play major roles inmetabolism, acting as hormone/nutrient carriers [68,69] andparticipating in xenobiotic elimination [68].
After the race, there was a general increase in positive acutephase proteins, such as α1-AT, α2-MG and CP (Figs. 2 and 3),similar to that reported for inflammatory events [70,71], even ifthe first component is generally not considered as a typical acutephase molecule in horse. Augmented levels of the proteaseinhibitors α1-AT and α1-AT-RP may contribute to suppresselastase activity and indirectly inhibit elastase-related comple-ment activation [72]. This protease increases after intense
exercise in horse [43,73] as well as during airway inflammation[74], which often develops during prolonged movement andtraining [75–77]. Moreover, high levels of α1-AT have been foundafter intensified training in equine muscle biopsy [38]. A relatedanti-protease function may be also hypothesised for α2-MG,which affects α-thrombin activity [71], modulating blood coagu-lation/fibrinogen activation [78]. Recently, a α2-MG-dependentdecrease in fibrinogenwas demonstrated to occur during humanphysical exercise [79], confirming its effect on coagulationcascade [80]. Our quantitative results substantiate this observa-tion for equine α2-MG and FG, and confirm other observations onhumans undergoing strenuous exercise [81,82]. Changes in α1-AT, α1-AT-RP and α2-MG should also explain the reduced levelsobserved for ALB fragments (Figs. 2 and 3), which dropped aftercompetition and returned comparable to the initial values after48 h. In addition to an acute phase-related condition, modifica-tions in ALB content in plasma may be also related to exercise-induced damage to hepatic cell functioning [83] and/or aug-mented nutrient supply request during prolonged physicalactivity. On the other hand, the increased levels observed forCP after the racemay be related to its function in supplying Cu toother antioxidant enzymes (SOD), regulating cellular Fe(II) levelsand scavenging radicals [84,85]. Similarly, increase in CP serumlevels has been described after endurance exercise in dog [86].
Immune system modulation during prolonged physicalexercise was confirmed by the observed changes in C4A andCB levels, although opposing trends emerged (Figs. 2 and 3).C4A rose immediately after the race and returned to restinglevels only 48 h afterwards; CB fell after the race, remainedlow for 24 h and returned to the resting value after 48 h. TheC4A trend in physical exercise showed a peculiar behaviourwith respect to previous reports on its role as positive acutephase protein [87]. However, other studies have alreadydescribed this rather surprising exercise-induced pattern[72,88,89], which may be explained by rapid conversion to itsactivated form [88]. Opposite behaviour for C4A and CB mayalso be related to the different roles played by these factors inthe complement system, i.e. the C4A and CB parts of thecanonical and alternative pathways, respectively. On theother hand, augmented VAP1 levels were observed after therace (Figs. 2 and 3). VAP1 is a membrane adhesion proteinexpressed by endothelial, adipocyte and muscle cells that isreleased in blood during cell damage, inflammation andendothelial injury [90,91]. Its nicking-activated soluble formenhances lymphocyte–endothelial cell binding and monocyterecruitment [92]. Observed VAP1 levels after the race con-firmed that immuno-modulation and exercise are linkedtogether and that prolonged activity induced cell damage.
4. Conclusions
Deregulated proteins seem to be important elements for earlydiagnostics in veterinary medicine; thus, proteomic studies onanimal species are needed to identify novel biomarkers usefulto monitor their health, to investigate type/state of disease, toensure welfare as well as to monitor quality/safety of derivingproducts. In some cases, data gathered from experiments onEutheria animal models may be relevant not only for animalsciences, but also to implement our understanding of complex

4502 J O U R N A L O F P R O T E O M I C S 7 5 ( 2 0 1 2 ) 4 4 9 4 – 4 5 0 4
biological mechanisms associated with health and disease inhumans.
In this study, protein modifications in horse plasma, asinduced by prolonged physical exercise, were investigated byproteomics. Quantitative variations in specific componentsafter the race yielded indications on parallel activation of acutephase response, coagulation, immune-modulation, oxidant/antioxidant activity and cellular and vascular damage path-ways, with consequent effects on animal metabolic, immuneand neuroendocrine systems, ultimately suggesting that animalresponse to strenuous exercise may be considered as a promptadaptation to an acute stressful condition. This study is novel inthe field of proteomics applied to the investigation of physio-logical consequences related to physical exercise in horse.Previous studies have focused only on muscle protein modifi-cations [37,38]. In clinical research, plasma proteomics hasbecome one of the most rapidly emerging fields because bloodplasma is an easily accessible source and a reservoir forcirculating proteins throughout the body [27,93,94]. Ascertainedprotein modifications in horse plasma will be helpful for futureinvestigation focused to comprehend the stress responsecapacity of this animal as well as the metabolic alterationsaffecting its health/welfare.
Animal proteomics has been implemented and successfullyapplied to optimizewelfare and productivity in animal breeding.It has also become increasingly important for developing/describing animal models used in biomedicine. Inmethodology,future progress will benefit from increasing the throughput,which will allow analyses of much larger populations thancurrently feasible. This will greatly enhance our understandingof individual variation within specific biological mechanisms.Together with increased sensitivity (to reliably analyse alsominor proteome components) and the implementation of morespecific and robust quantificationmethods, these developmentswill be of great impact on our search for useful biomarkers.
Supplementary data to this article can be found online athttp://dx.doi.org/10.1016/j.jprot.2012.04.014.
Acknowledgements
This study was partially supported by grants from MIUR(PRIN2007_RKYAZS_001) to EC and from Regione Campania(Rete di Spettrometria di Massa, RESMAC) to AS.
R E F E R E N C E S
[1] Treiber KH, Hess TM, Kronfeld DS, Boston RC, Geor RJ, Friere M,et al. Glucose dynamics during exercise: dietary energy sourcesaffect minimal model parameters in trained Arabian geldingsduring endurance exercise. Equine Vet J 2006;36:631–6.
[2] Joyner MJ, Coyle EF. Endurance exercise performance: thephysiology of champions. J Physiol 2008;86:35–44.
[3] Fisher-Wellman K, Bloomer RJ. Acute exercise and oxidativestress: a 30 year history. Dyn Med 2009;8:1.
[4] Waller AP, Lindinger MI. Nutritional aspects of post exerciseskeletal muscle glycogen synthesis in horses: a comparativereview. Equine Vet J 2010;42:274–81.
[5] McKeever KH. Endocrine alterations in the equine athlete: anupdate. Vet Clin North Am Equine Pract 2011;27:197–218.
[6] McKeever KH. The endocrine system and the challenge ofexercise. Vet Clin North Am Equine Pract 2002;18:321–53.
[7] Mastorakos G, Pavlatou M, Diamanti-Kandarakis E, ChrousosGP. Exercise and the stress system. Hormones 2005;4:73–89.
[8] Donovan DC, Jackson CA, Colahan PT, Norton NN, Clapper JL,Moore JN, et al. Assessment of exercise-induced alterations inneutrophil function in horses. Am J Vet Res 2007;68:1198–204.
[9] Holbrook TC, McFarlane D, Schott II HC. Neuroendocrine andnon-neuroendocrine markers of inflammation associatedwith performance in endurance horses. Equine Vet J 2010;42:123–8.
[10] Chiaradia E, Gaiti A, Terracina L, Avellini L. Effect ofsubmaximal exercise on horse homocysteinemia: possibleimplications for immune cells. Res Vet Sci 2005;79:9–14.
[11] Chiaradia E, Avellini L, Rueca F, Spaterna A, Porciello F,Antonioni MT, et al. Physical exercise, oxidative stress andmuscle damage in racehorses. Comp Biochem Physiol BBiochem Mol Biol 1998;119:833–6.
[12] Hanzawa K, Kai M, Hiraga A, Watanabe S. Fragility of red cellsduring exercise is affected by blood pH and temperature.Equine Vet J Suppl 1999;30:610–1.
[13] Avellini L, Chiaradia E, Gaiti A. Effect of exercise training,selenium, and vitamin E on some free radical scavengers inhorse (Equus caballus). Comp Biochem Physiol B Biochem MolBiol 1999;123:147–54.
[14] Cywinska A, Gorecka R, Szarska E, Witkowski L, Dziekan P,Schollenberger A. Serum amyloid A level as a potentialindicator of the status of endurance horses. Equine Vet J2010;38:23–7.
[15] Fazio F, Assenza A, Tosto F, Casella S, Piccione G, Caola G.Modifications of some acute phase proteins and the whiteblood cell count in thoroughbreds during training. Vet Rec2010;167:370–3.
[16] Cywinska A, Szarska E, Kowalska A, Ostaszewski P,Schollenberger A. Gender differences in exercise-inducedintravascular haemolysis during race training inthoroughbred horses. Res Vet Sci 2011;90:133–7.
[17] Cywińska A, Szarska E, Górecka R, Witkowski L, Hecold M,Bereznowski A, et al. Acute phase protein concentrations afterlimited distance and long distance endurance rides in horses.Res Vet Sci 2012, http://dx.doi.org/10.1016/j.rvsc.2012.02.008.
[18] Valberg SJ, Mickelson JR, Gallant EM, MacLeay JM, Lentz L, dela Corte F. Exertional rhabdomyolysis in quarter horses andthoroughbreds: one syndrome, multiple aetiologies. EquineVet J Suppl 1999;30:533–8.
[19] MacLeay JM, Valberg SJ, Pagan JD, Xue JL, De La Corte FD,Roberts J. Effect of ration and exercise on plasma creatinekinase activity and lactate concentration in Thoroughbredhorses with recurrent exertional rhabdomyolysis. Am J VetRes 2000;61:1390–5.
[20] Martin Jr BB, Reef VB, Parente EJ, Sage AD. Causes of poorperformance of horses during training, racing, or showing:348 cases (1992–1996). J Am Vet Med Assoc 2000;216:554–8.
[21] Birks EK, Durando MM, McBride S. Exercise-inducedpulmonary hemorrhage. Vet Clin North Am Equine Pract2003;19:87–100.
[22] AlemanM. A review of equinemuscle disorders. NeuromusculDisord 2008;18:277–87.
[23] McGowan C. Clinical pathology in the racing horse: the role ofclinical pathology in assessing fitness and performance in theracehorse. Vet Clin North Am Large Anim Pract 2008;24:405–21.
[24] Amory H, Votion DM, Fraipont A, Goachet AG, Robert C, FarnirF, et al. Altered systolic left ventricular function in horsescompleting a long distance endurance race. Equine Vet J2010;42:216–9.
[25] Fraipont A, Van Erck E, Ramery E, Richard E, Denoix JM,Lekeux P, et al. Subclinical diseases underlying poorperformance in endurance horses: diagnostic methods andpredictive tests. Vet Rec 2011;169:154.

4503J O U R N A L O F P R O T E O M I C S 7 5 ( 2 0 1 2 ) 4 4 9 4 – 4 5 0 4
[26] Bendixen E, Danielsen M, Hollung K, Gianazza E, Miller I.Farm animal proteomics — a review. J Proteomics 2011;74:282–93.
[27] Miller I, Friedlein A, Tsangaris G, Maris A, Fountoulakis M,Gemeiner M. The serum proteome of Equus caballus.Proteomics 2004;4:3227–34.
[28] Barton C, Beck P, Kay R, Teale P, Roberts J. MultiplexedLC–MS/MS analysis of horse plasma proteins to study dopingin sport. Proteomics 2009;9:3058–65.
[29] Bouwman FG, van Ginneken MM, van der Kolk JH, van BredaE, Mariman EC. Novel markers for tying-up in horses byproteomics analysis of equine muscle biopsies. CompBiochem Physiol Part D Genomics Proteomics 2010;5:178–83.
[30] Guelfi KJ, Casey TM, Giles JJ, Fournier PA, Arthur PG. Aproteomic analysis of the acute effects of high-intensityexercise on skeletal muscle proteins in fasted rats. Clin ExpPharmacol Physiol 2006;33:952–7.
[31] Holloway KV, O'Gorman M, Woods P, Morton JP, Evans L,Cable NT, et al. Proteomic investigation of changes in humanvastus lateralis muscle in response to interval-exercisetraining. Proteomics 2009;9:5155–74.
[32] Moriggi M, Vasso M, Fania C, Capitanio D, Bonifacio G,Salanova M, et al. Long term bed rest with and withoutvibration exercise countermeasures: effects on humanmuscle protein dysregulation. Proteomics 2010;10:3756–74.
[33] Yamaguchi W, Fujimoto E, Higuchi M, Tabata I. A DIGEproteomic analysis for high-intensity exercise-trained ratskeletal muscle. J Biochem 2010;148:327–33.
[34] de Moraes R, Valente RH, León IR, Trugilho MR, Nóbrega AC,Perales J, et al. Chronic dynamic exercise increasesapolipoprotein A-I expression in rabbit renal cortex asdetermined by proteomic technology. Br J Sports Med 2008;42:386–8.
[35] Boluyt MO, Brevick JL, Rogers DS, Randall MJ, Scalia AF, Li ZB.Changes in the rat heart proteome induced by exercisetraining: increased abundance of heat shock protein hsp20.Proteomics 2006;6:3154–69.
[36] Burniston JG. Adaptation of the rat cardiac proteome inresponse to intensity-controlled endurance exercise.Proteomics 2009;9:106–15.
[37] Ichibangase T, Imai K. Application of fluorogenicderivatization-liquid chromatography–tandem massspectrometric proteome method to skeletal muscle proteinsin fast Thoroughbred horses. J Proteome Res 2009;8:2129–34.
[38] Bouwman FG, van Ginneken MM, Noben JP, Royackers E, deGraaf-Roelfsema E, Wijnberg ID, et al. Differential expressionof equine muscle biopsy proteins during normal training andintensified training in young standardbred horses usingproteomics technology. Comp Biochem Physiol Part DGenomics Proteomics 2010;5:55–64.
[39] Kohler M, Walpurgis K, Thomas A, de Maree M, Mester J,Schänzer W, et al. Effects of endurance exercise on theurinary proteome analyzed by 2-D PAGE and Orbitrap MS.Proteomics Clin Appl 2010;4:568–76.
[40] Capomaccio S, Cappelli K, Barrey E, Felicetti M, Silvestrelli M,Verini-Supplizi A. Microarray analysis after strenuousexercise in peripheral blood mononuclear cells of endurancehorses. Anim Genet 2010;41:166–75.
[41] Trigo P, Castejon F, Riber C, Muñoz A. Use of biochemicalparameters to predict metabolic elimination in endurancerides. Equine Vet J 2010;42:142–6.
[42] Votion DM, Fraipont A, Goachet AG, Robert C, van Erck E,Amory H, et al. Alterations in mitochondrial respiratoryfunction in response to endurance training and enduranceracing. Equine Vet J 2010;38:268–74.
[43] Serteyn D, Sandersen C, Lejeune JP, de la Rebière de PouyadeG, Ceusters J, Mouithys-Mickalad A, et al. Effect of a 120 kmendurance race on plasma and muscular neutrophil elastase
and myeloperoxidase concentrations in horses. Equine Vet J2010;38:275–9.
[44] Fielding CL, Dechant JE. Colic in competing endurance horsespresenting to referral centres: 36 cases. Equine Vet J 2011,http://dx.doi.org/10.1111/j.2042-3306.2011.00462.
[45] Kinnunen S, Atalay M, Hyyppä S, Lehmuskero A, Hänninen O,Oksala N. Effects of prolonged exercise on oxidative stressand antioxidant defense in endurance horse. J Sports Sci Med2005;4:415–21.
[46] Anderson NL, Anderson NG. The human plasma proteome:history, character, and diagnostic prospects. Mol CellProteomics 2002;1:845–67.
[47] Talamo F, D'Ambrosio C, Arena S, Del Vecchio P, Ledda,Zehender G, et al. Proteins from bovine tissues and biologicalfluids: defining a reference electrophoresis map for liver,kidney, muscle, plasma and red blood cells. Proteomics2003;3:440–60.
[48] Scippa GS, Rocco M, Ialicicco M, Trupiano D, Viscosi V, DiMichele M, et al. The proteome of lentil (Lens culinaris Medik.)seeds: discriminating between landraces. Electrophoresis2010;31:497–506.
[49] Qian WJ, Liu T, Monroe ME, Strittmatter EF, Jacobs JM, KangasLJ, et al. Probability-based evaluation of peptide and proteinidentification from tandem mass spectrometry and SEQUESTanalysis: the human proteome. J Proteome Res 2005;4:53–62.
[50] Huang DW, Sherman BT, Lempicki RA. Systematic andintegrative analysis of large gene lists using DAVIDbioinformatics resources. Nat Protoc 2009;4:44–57.
[51] Guidi F, Magherini F, Gamberi T, Bini L, Puglia M, MarzocchiniR, et al. Plasma protein carbonylation and physical exercise.Mol Biosyst 2011;7:640–50.
[52] Steinberg GR. Role of the AMP-activated protein kinase inregulating fatty acid metabolism during exercise. ApplPhysiol Nutr Metab 2009;34:315–22.
[53] Porter K, Medford HM, McIntosh CM, Marsh SA.Cardioprotection requires flipping the “posttranslationalmodification” switch. Life Sci 2012;90:89–98.
[54] Pellegrini Masini A, Tedeschi D, Baragli P, Sighieri C, Lubas G.Exercise-induced intravascular haemolysis in standardbredhorses. Comp Clin Pathol 2003;12:45–8.
[55] Inoue Y, Matsui A, Asai Y, Aoki F, Matsui T, Yano H. Effect ofexercise on iron metabolism in horses. Biol Trace Elem Res2005;107:33–42.
[56] Janakiraman K, Shenoy S, Sandhu JS. Intravascularhaemolysis during prolonged running on asphalt and naturalgrass in long and middle distance runners. J Sports Sci2011;29:1287–92.
[57] Quaye IK. Haptoglobin, inflammation and disease. Trans RSoc Trop Med Hyg 2008;102:735–42.
[58] Nielsen MJ, Møller HJ, Moestrup SK. Hemoglobin andheme scavenger receptors. Antioxid Redox Signal 2010;12:261–73.
[59] Sakata S, Yoshioka N, Atassi MZ. Human haptoglobin bindsto human myoglobin. Biochim Biophys Acta 1986;873:312–5.
[60] Morton DJ, Van Wagoner TM, Seale TW, Whitby PW, Stull TL.Utilization of myoglobin as a heme source by Haemophilusinfluenzae requires binding of myoglobin to haptoglobin. FEMSMicrobiol Lett 2006;258:235–40.
[61] Kinnunen S, Hyyppä S, Lehmuskero A, Oksala N, Mäenpää P,Hänninen O, et al. Oxygen radical absorbance capacity(ORAC) and exercise-induced oxidative stress in trotters. Eur JAppl Physiol 2005;95:550–6.
[62] Sachdev S, Davies KJ. Production, detection, and adaptiveresponses to free radicals in exercise. Free Radic Biol Med2008;44:215–23.
[63] Navab M, Anantharamaiah GM, Fogelman AM. The role ofhigh-density lipoprotein in inflammation. Trends CardiovascMed 2005;15:158–61.

4504 J O U R N A L O F P R O T E O M I C S 7 5 ( 2 0 1 2 ) 4 4 9 4 – 4 5 0 4
[64] Myron Johnson A, Merlini G, Sheldon J, Ichihara K. Clinicalindications for plasma protein assays: transthyretin(prealbumin) in inflammation and malnutrition. Clin ChemLab Med 2007;45:419–26.
[65] Rosales FJ, Ross AC. A low molar ratio of retinol bindingprotein to transthyretin indicates vitamin A deficiencyduring inflammation: studies in rats and a posteriori analysisof vitamin A-supplemented children with measles. J Nutr1998;128:1681–7.
[66] Kravitz MS, Pitashny M, Shoenfeld Y. Protective molecules —C-reactive protein (CRP), serum amyloid P (SAP), pentraxin3(PTX3), mannose-binding lectin (MBL), and apolipoprotein A1(Apo A1), and their autoantibodies: prevalence and clinicalsignificance in autoimmunity. J Clin Immunol 2005;25:582–91.
[67] Liburt NR, Adams AA, Betancourt A, Horohov DW, McKeeverKH. Exercise-induced increases in inflammatory cytokines inmuscle and blood of horses. Equine Vet J 2010;38:280–8.
[68] Ingenbleek Y, Young VR. Significance of transthyretin inprotein metabolism. Clin Chem Lab Med 2002;40:1281–91.
[69] Forterre S, Raila J, Forterre F, Brunnberg L, Schweigert FJ.Characterisation of transthyretin and retinol-binding proteinin plasma and cerebrospinal fluid of dogs. Vet J 2006;171:451–5.
[70] Brantly M. α1-Antitrypsin: not just an antiprotease extendingthe half-life of a natural anti-inflammatory molecule byconjugation with polyethylene glycol. Am J Respir Cell MolBiol 2002;27:652–4.
[71] Gruys E, Toussaint MJ, Niewold TA, Koopmans SJ. Acutephase reaction and acute phase proteins. J Zhejiang Univ SciB 2005;6:1045–56.
[72] Semple SJ, Smith LL, McKune AJ, Hoyos J, Mokgethwa B, SanJuan AF, et al. Serum concentrations of C reactive protein,alpha1 antitrypsin, and complement (C3, C4, C1 esteraseinhibitor) before and during the Vuelta a Espańa. Br J SportsMed 2006;40:124–7.
[73] Lejeune JP, Sandersen C, Votion D, Caudron I, Vander HeydenL, Franck T, et al. Effect of intensive exercise on plasmaticneutrophil elastase level in eventing and endurance horses.Equine Vet J 2010;38:12–6.
[74] Brazil TJ, Dagleish MP, McGorum BC, Dixon PM, Haslett C,Chilvers ER. Kinetics of pulmonary neutrophil recruitment andclearance in a natural and spontaneously resolving model ofairway inflammation. Clin Exp Allergy 2005;35:854–6.
[75] Bermon S. Airway inflammation and upper respiratory tractinfection in athletes: is there a link? Exerc Immunol Rev2007;13:6–14.
[76] Kusano K, Ishikawa Y, Kasuhiro S, Ryo K. Characteristic ofinflammatory airway disease in Japanese Thoroughbredracehorses. J Equine Sci 2008;19:25–9.
[77] Cardwell JM, Wood JL, Smith KC, Newton JR. Descriptiveresults from a longitudinal study of airway inflammation inBritish National Hunt racehorses. Equine Vet J 2011;43:750–5.
[78] Cvirn G, Gallistl S, Koestenberger M, Kutschera J, Leschnik B,Muntean W. Alpha 2-macroglobulin enhances prothrombin
activation and thrombin potential by inhibiting the antico-agulant protein C/protein S system in cord and adult plasma.Thromb Res 2002;105:433–9.
[79] Autenrieth C, Schneider A, Döring A, Meisinger C, Herder C,Koenig W, et al. Association between different domains ofphysical activity and markers of inflammation. Med SciSports Exerc 2009;41:1706–13.
[80] Jahangard T, Torkaman G, Ghoosheh B, Hedayati M, Dibaj A.The effect of short-term aerobic training on coagulation andfibrinolytic factors in sedentary healthy postmenopausalwomen. Maturitas 2009;64:223–7.
[81] Ernst E. Regular exercise reduces fibrinogen levels: a reviewof longitudinal studies. Br J Sports Med 1993;27:175–6.
[82] Smith JE, Garbutt G, Lopes P, Tunstall Pedoe D. Effects ofprolonged strenuous exercise (marathon) on biochemical andhaematological markers used in the investigation of patientsin the emergency department. Br J Sports Med 2004;38:292–4.
[83] Wu HJ, Chen KT, Shee BW, Chang HC, Huang YJ, Yang RS.Effects of 24 h ultra-marathon on biochemical and hemato-logical parameters. World J Gastroenterol 2004;10:2711–4.
[84] Healy J, Tipton K. Ceruloplasmin and what it might do.J Neural Transm 2007;114:777–81.
[85] Kankofer M, Albera E, Feldman M, Gundling N, HoedemakerM. Comparison of antioxidative/oxidative profiles in bloodplasma of cows with and without retained fetal placentalmembranes. Theriogenology 2010;74:1385–95.
[86] Kenyon CL, Basaraba RJ, Bohn AAJ. Influence of enduranceexercise on serum concentrations of iron and acute phaseproteins in racing sled dogs. J Am Vet Med Assoc 2011;239:1201–10.
[87] Qian WJ, Petritis BO, Kaushal A, Finnerty CC, Jeschke MG,Monroe ME, et al. Plasma proteome response to severe burninjury revealed by 18O-labeled “universal” reference-basedquantitative proteomics. J Proteome Res 2010;9:4779–89.
[88] Fallon KE, Fallon SK, Boston T. The acute phase response andexercise: court and field sports. Br J Sports Med 2001;35:170–3.
[89] Sorensen B, Jones JF, Vernon SD, Rajeevan MS. Transcrip-tional control of complement activation in an exercise modelof chronic fatigue syndrome. Mol Med 2009;15:34–42.
[90] Schwelberger HG. Origins of plasma amine oxidases indifferent mammalian species. Inflamm Res 2006;1:57–8.
[91] Schwelberger HG. The origin of mammalian plasma amineoxidases. J Neural Transm 2007;114:757–62.
[92] Koskinen K, Vainio PJ, Smith DJ, Pihlavisto M, Ylä-Herttuala S,Jalkanen S, et al. Granulocyte transmigration through theendothelium is regulated by the oxidase activity of vascularadhesion protein-1 (VAP-1). Blood 2004;103:3388–95.
[93] Qian WJ, Jacobs JM, Liu T, Camp DG2nd, Smith RD. Advancesand challenges in liquid chromatography–massspectrometry-based proteomics profiling for clinical applica-tions. Mol Cell Proteomics 2006;10:1727–44.
[94] Hanash SM, Pitteri SJ, Faca VM. Mining the plasma proteomefor cancer biomarkers. Nature 2008;452:571–9.