Planning, realisation and evaluation of an entire recording ...
37
Planning, realisation and evaluation of an entire recording process Project report Johannes Kaesbach s081558 Supervisors: Finn T. Agerkvist (DTU) and Jesper Andersen (DKDM) Date of report: April 12, 2010
-
Upload
khangminh22 -
Category
Documents
-
view
1 -
download
0
Transcript of Planning, realisation and evaluation of an entire recording ...

Planning, realisation and
evaluation
of an entire recording process
Project report
Johannes Kaesbach s081558
Supervisors: Finn T. Agerkvist (DTU) and Jesper Andersen (DKDM)
Date of report: April 12, 2010


Contents 2
Contents
List of Figures 4
List of Tables 4
1 Introduction 5
2 Planning and preparation 6
2.1 Introduction to the orchestra . . . . . . . . . . . . . . . . . . . . . . . . . . 6
2.2 Seating plan . . . . . . . . . . . . . . . . . . . . . . . . . . . . . . . . . . . . 6
2.3 Choice of microphones and routing . . . . . . . . . . . . . . . . . . . . . . . 7
3 Recording and mixing 12
3.1 Recording . . . . . . . . . . . . . . . . . . . . . . . . . . . . . . . . . . . . . 12
3.2 Mixing . . . . . . . . . . . . . . . . . . . . . . . . . . . . . . . . . . . . . . . 12
4 Evaluation 16
4.1 Measurements - Objective analysis . . . . . . . . . . . . . . . . . . . . . . . 16
4.1.1 Sound power determination . . . . . . . . . . . . . . . . . . . . . . . 16
4.1.2 Frequency Responses . . . . . . . . . . . . . . . . . . . . . . . . . . . 19
4.1.3 Directivity factor . . . . . . . . . . . . . . . . . . . . . . . . . . . . . 22
4.2 Listening test - Subjective analysis . . . . . . . . . . . . . . . . . . . . . . . 26
4.3 Comparison . . . . . . . . . . . . . . . . . . . . . . . . . . . . . . . . . . . . 31
5 Conclusions 32
References 33
6 Appendix 34

List of Figures 3
List of Figures
1 Seating plan for Fafchamps - Lettre soufie: D . . . . . . . . . . . . . . . . . 7
2 The microphone setup for the AB Stereo recording. . . . . . . . . . . . . . . 9
3 MS (mid-side) - recording technique [2] . . . . . . . . . . . . . . . . . . . . 9
4 Frequency response and polar pattern for the microphones DPA 4006 with
grid DD0297 (left) and 4011/4023 (right) . . . . . . . . . . . . . . . . . . . 10
5 Frequency response and polar pattern for the microphone Neumann TLM
193 . . . . . . . . . . . . . . . . . . . . . . . . . . . . . . . . . . . . . . . . . 11
6 Frequency response and polar pattern for the microphones Sennheiser MKH30
(left) and MKH40 (right) . . . . . . . . . . . . . . . . . . . . . . . . . . . . 11
7 Mixing and Listening test set-up . . . . . . . . . . . . . . . . . . . . . . . . 13
8 Sound power in one-third octave bands of the three loudspeakers . . . . . . 18
9 On axis frequency response of the three loudspeakers (reference point: r =
1, 60m) . . . . . . . . . . . . . . . . . . . . . . . . . . . . . . . . . . . . . . 20
10 Frequency response in a distance of 1,60m off axis shifted 20cm left and
right (Genelec) . . . . . . . . . . . . . . . . . . . . . . . . . . . . . . . . . . 20
11 Frequency response in a distance of 1,60m off axis shifted 20cm up and
down (Genelec) . . . . . . . . . . . . . . . . . . . . . . . . . . . . . . . . . . 20
12 Frequency response in a distance of 1,60m off axis shifted 20cm left and
right (Yamaha) . . . . . . . . . . . . . . . . . . . . . . . . . . . . . . . . . . 21
13 Frequency response in a distance of 1,60m off axis shifted 20cm up and
down (Yamaha) . . . . . . . . . . . . . . . . . . . . . . . . . . . . . . . . . . 21
14 Frequency response in a distance of 1,60m off axis shifted 20cm left and
right (Adam) . . . . . . . . . . . . . . . . . . . . . . . . . . . . . . . . . . . 21
15 Frequency response in a distance of 1,60m off axis shifted 20cm up and
down (Adam) . . . . . . . . . . . . . . . . . . . . . . . . . . . . . . . . . . . 21
16 Frequency response on axis in three different distances (Genelec) . . . . . . 22
17 Frequency response on axis in three different distances (Yamaha) . . . . . . 22
18 Frequency response on axis in three different distances (Adam) . . . . . . . 22
19 Directivity factor for the 3 loudspeakers referred to the on axis free-field
power response in a distance of 1,60m . . . . . . . . . . . . . . . . . . . . . 24

List of Tables 4
20 Corrected directivity factor for the 3 loudspeakers referred to the on axis
free-field power response in a distance of 1,60m. . . . . . . . . . . . . . . . . 24
21 Listening test set-up . . . . . . . . . . . . . . . . . . . . . . . . . . . . . . . 26
22 Listening test: Subjective frequency response - TM+; Adam: x; Genelec:
o; Yamaha: + . . . . . . . . . . . . . . . . . . . . . . . . . . . . . . . . . . . 27
23 Listening test: Subjective frequency response - Pop; Adam: x; Genelec: o;
Yamaha: + . . . . . . . . . . . . . . . . . . . . . . . . . . . . . . . . . . . . 28
24 Listening test: Clarity and room impression - TM+; Adam: x; Genelec: o;
Yamaha: + . . . . . . . . . . . . . . . . . . . . . . . . . . . . . . . . . . . . 29
25 Listening test: Clarity and room impression - Pop; Adam: x; Genelec: o;
Yamaha: + . . . . . . . . . . . . . . . . . . . . . . . . . . . . . . . . . . . . 29
26 Reverberation time in the reverberation room 010 in building 355 of the
department Acoustic Technology (DTU) . . . . . . . . . . . . . . . . . . . 34
27 Seating plan for Ness . . . . . . . . . . . . . . . . . . . . . . . . . . . . . . . 34
28 Seating plan for Dalbavie . . . . . . . . . . . . . . . . . . . . . . . . . . . . 34
29 Seating plan for Holt . . . . . . . . . . . . . . . . . . . . . . . . . . . . . . . 34
30 Seating plan for Grisey . . . . . . . . . . . . . . . . . . . . . . . . . . . . . . 34
31 Directivity factor for off axis responses (Genelec) . . . . . . . . . . . . . . . 35
32 Directivity factor for off axis responses (Yamaha) . . . . . . . . . . . . . . . 35
33 Directivity factor for off axis responses (Adam) . . . . . . . . . . . . . . . . 35
34 Evaluation Sheet for the listening test . . . . . . . . . . . . . . . . . . . . . 36
List of Tables
1 Routing plan . . . . . . . . . . . . . . . . . . . . . . . . . . . . . . . . . . . 8
2 Total averaged sound power . . . . . . . . . . . . . . . . . . . . . . . . . . . 24
3 Crossover frequencies . . . . . . . . . . . . . . . . . . . . . . . . . . . . . . . 25
4 Listening test: Overall impression . . . . . . . . . . . . . . . . . . . . . . . . 30
5 Listening test: Comments . . . . . . . . . . . . . . . . . . . . . . . . . . . . 30

1 Introduction 5
1 Introduction
An entire recording process of a concert covers issues from planning the concert, arranging
the microphone- and scene- set-up to recording, mixing and finally evaluating the results.
In the latter step different loudspeaker types are often used in a listening test in order
to ensure high quality sound on different loudspeaker stereo systems. In purpose of this
project an intense and practical understanding of such an entire process was given: In a
first step, necessary skills were studied during several recording and mixing sessions and
finally one concert, the recording of the ensemble TM+, was selected, where the evaluation
is carried on.
The evaluation contains a listening test as well as an analysis of different loudspeaker
pairs (3 pairs) in order to obtain a relation between analysis and perception. The analysis
takes the loudspeaker’s near field characteristics under free-field conditions and moreover
their power responses from which an on-axis directivity factor can be estimated into ac-
count. These results are then compared to the subjective listening test.
This report summarises the entire recording process and focuses on the evaluation of
the loudspeakers. Therefore one piece of music is chosen from the concert.
The project is realised by an cooperation between Danmarks Tekniske Universitet
(DTU) and Det Kongelige Danske Musikkonservatorium (DKDM) with the aim of getting
the different disciplines engineering, music and recording closer together.

2 Planning and preparation 6
2 Planning and preparation
2.1 Introduction to the orchestra
The ensemble TM+ (france) conducted by Laurent Cuniot was recorded on 22. march
2010 in ’Konservatoriets Koncertsal’. The professional ensemble is specialised in modern
classical music and performed the following five pieces of music:
Jon Øyvind Ness (born 1968): Interrupted Cycles (1996)
Marc-Andre Dalbavie (born 1961): In advance of the broken time (1994)
Simon Holt (born 1958): Lilith (1990)
Gerard Grisey (1946-98): Talea (ou la machine et les herbes folles) (1986)
Jean-Luc Fafchamps: Lettre soufie: D (2001)
The ensemble covered the following instruments in this concert: Flute (Gilles Bur-
gos), clarinet (Francis Touchard), horn (Eric Du Fay), violin (Maud Lovett and Noemi
Schindler), viola (Genevieve Strosser), cello (Florian Lauridon), doublebass (Philippe
Noharet), grand piano (Jean-Luc Ayroles), harp (Anne Ricquebourg) and percussions
(Thierry Deleruyelle).
The pieces varied in instrumentation after each piece of music which made it challenging
to place the microphones in the optimal spot in each break in between.
2.2 Seating plan
In purpose of this project one piece of music was selected, where this report is based on.
This is the last piece: Fafchamps - Lettre soufie: D. The seating plan is shown in Figure
1 showing the view from above the stage. As can be seen seven instruments are placed
on stage. The string section (violin, viola and cello) and the clarinet are situated in a
half-circle around the conductor, placing the piano to the left behind this section and
the percussions, that is the vibraphone, marimba phone, tamtam and several additional
percussion instruments, to the right. It is very important to recreate this ’image’ on the
final mix.

2 Planning and preparation 7
Figure 1: Seating plan for Fafchamps - Lettre soufie: D
2.3 Choice of microphones and routing
In a next step appropriate microphones have to be selected. The most important one is
the main system that is a microphone pair used for the stereo recording. Under several
standard methods like the AB- , XY-, ORTF- or MS-set, the first mentioned one was
chosen. The microphones in use were two DPA 4006 with black grids. In addition, two
ambience microphones, called AC-set, were used which are two microphones separated
several meters from each other allowing to record the ambience sound in the concert
hall. They were of the same kind as the AB-set. All further microphones are closed-
up microphones to the individual instruments, which are used as a support to the main
system.
The routing plan gives an overview over all instruments in the recording and the
appropriate microphones in use. The routing plan for the concert is shown in Table 1,
which is a reduced version in purpose of the selected piece of music.
The six different kinds of microphones in use are all condenser microphones and briefly
presented in the following using [1] as reference. The DPA 4006 (Figure 4) is an omnidi-
rectional microphone and commonly used for AB-main sets like in case of this recording.
In the AB setup, shown in Figure 2, the two omnidirectional microphones, separated by a
distance of 40cm, provide a time difference cue and therefore make it possible to recreate
a stereo image. It was installed in a height of approximately 5 meters above the stage
floor in a distance of ca. 7 meters from the musicians. The mounted black grids are
2 Planning and preparation 8
Channel Instrument Microphone
1 AB Left DPA 40062 AB Right 4006
3 AC Left 40064 AC Right 4006
5 PNO Left 40236 PNO Right 4023
7 VL1 40118 VLA 40119 VLC TML 19310 CLN 4011
11 MAR Left 401112 MAR Right 4011
13 VIB M MKH4014 VIB S+ MKH3015 VIB S- −||−16 Reverb Oxford17 Reverb Oxford
Table 1: Routing plan
DPA DD0297 diffuse-field grids that have a linear diffuse-field response up to 15kHz due
to a high-frequency boost on-axis of 6dB around this frequency. The choice for the AB-
recording technique is that this technique gives the recording a nice depth that is most of
the times not achievable with the XY- or ORTF-techniques. This is also due to the om-
nidirectional characteristic of the microphones used in that technique: The diffuse sound
field is recorded equally and therefore the sounding of the concert hall is represented in a
’natural’ way, meaning without attenuating the reverberant field in any direction like in the
other two techniques, where microphones with cardioidic characteristics are used. Even
though, the XY-techniques for example is more precise concerning binaural localisation,
the AB set in most cases suits best a desired esthetic in classical recordings.
The DPA 4011 is a microphone with a true first order cardioid characteristic and is
shown in Figure 4. It is a widely used all-round microphone with a totally flat off-axis
frequency response. In this case one microphone of this kind is used for the violin and one
for the viola. It was placed from the back of the player in a distance of approximately
60cm to the instrument. A disturbance of the player, especially regarding the bowing,
must be avoided. Two microphones of this kind were also used for the stereo recording
of the marimba phone. This instrument has large dimensions and therefore has the need
of a stereo recording. The two microphones were placed on either side in front of the

2 Planning and preparation 9
Figure 2: The microphone setup for the ABStereo recording.
Figure 3: MS (mid-side) - recording tech-nique [2]
instrument, in a height of approximately 50cm above the instrument and with an angle of
60 degrees pointing slightly to the middle of the instrument.
The DPA 4023 has the same characteristics and response as the DPA 4011, since it is
using the same kind of cartridge. The only difference is a built-in preamplifier. It is often
used for the ORTF-recording technique. In case of this concert it was used for the stereo
closed-up recording of the piano. There are different approaches for recording the piano.
The two microphones can be placed for example close to each other comparable to the
AB-technique in the bend of the grand piano. In case of this recording the microphones
were placed in a larger distance to each other. One around the bend and one at the bottom
of the piano, both in a distance of ca. 10cm from the opening of the instrument.
The Neumann TLM 193 microphone is a large diaphragm microphone with a cardioid
characteristic. Considering its frequency response in Figure 5 there are some slight col-
orations in its higher frequency range prominent, which suits the recording of the cello.
This microphone was placed using a baby-size stand in a hight of 20cm from the bottom
with an angle of ca. 45 degrees from the center front of the cello to avoid the recording of
scattering of sound from the player’s music stand.
The Sennheiser MKH3 and MKH40 are used as one pair to form the MS-stereo-set
for the vibraphone. This is a special kind of stereo setup (Figure 3), where a figure of 8
microphone, here the MKH30 and a cardioid microphone, the MKH40, are combined on
one stand above each other. The latter one is the M-component in this set, meaning that
due to the characteristic of this microphone the center or middle of the recording position
is represented. The former one forms the S-component in this set-up and were split
into two channels of the sequencer’s internal mixer. Due to the figure of 8 characteristic

2 Planning and preparation 10
Figure 4: Frequency response and polar pattern for the microphones DPA 4006 with gridDD0297 (left) and 4011/4023 (right)
of this microphone the left (S+) and the right (S-) channel, panned to either side, are
180 degrees phase shifted to each other. This is corrected by inverting the phase of the
negative component of the microphone. When mixing the M- and S-component in an
appropriate way the dimensions (stereo spread) of the instrument can be finely adjusted.
This technique was used for the vibraphone where the stand with the two microphones
was placed in the middle in front of the instrument.

2 Planning and preparation 11
Figure 5: Frequency response and polar pattern for the microphone Neumann TLM 193
Figure 6: Frequency response and polar pattern for the microphones Sennheiser MKH30(left) and MKH40 (right)

3 Recording and mixing 12
3 Recording and mixing
3.1 Recording
The sequencer program used in DKDM is digidesign’s Pro Tools 8. This program can only
be used in combination with converters of the same company. A project with 20 tracks
was set up choosing a sample rate of 48kHz coded with 24 bits per sample. Two main
windows are most important during the recording and mixing procedure: The tracking
window, where all tracks are listed under each other and the mixing console, allowing
external routing from the converters and internal routing via bus, as well as selecting
sound processing plug-ins like reverb, equalisers, compressors and so on. All tracks were
labeled appropriately, the routing checked by test signals and the Focusrite preamplifiers
set to appropriate levels.
For each recording of a concert there is the possibility of making a live-mix. In this case
the rehearsals of the orchestra are used to set the microphone levels, correcting microphone
positions and then recording the concert with this preset mix.
Due to time pressure and varying stage set-ups this was no choice for this recording,
so that the concert had to be mixed afterwards.
3.2 Mixing
There are different approaches in how to mix a recording. The main difference between
classical and rock/pop recordings is the following. In the latter case each instrument is
processed individually and the sound image mixing the instruments in the desired balance
is created in the end. In classical recordings the most important issue is to reproduce the
listening situation in the concert hall as close as possible. This contains the entire room
impression, that is the image on stage as well as maintaining the sound of the concert
hall including its reverberation features. This is realised by the main microphone set. A
perfectly placed stereo set makes it possible to record these features in the desired way.
The closed-up microphones are just seen as supports to the main-set that are mixed to it
in an appropriate way. This is also reflected in the mixing procedure. There are millions
of different approaches for the mixing, but the following ’strategy’ was chosen for the mix
of the piece Fafchamps - Lettre soufie: D.
The individual tracks were routed following the routing plan in 1 to the digital mixer
(Sony) in Redegering 1 (R1) in the building of DKDM (see Figure 7).

3 Recording and mixing 13
Figure 7: Mixing and Listening test set-up
A good starting position is the AB-set, where both channels are either panned to the
left and the right and the level between both sides is equally adjusted. Just listening to
the main-set recreates the image on stage. This is to be maintained during the entire
mixing procedure and enhanced if necessary. In a second step the AC-set, also panned
appropriately, was used to give the recording more wideness due to additional reverber-
ation. Too much of this component destroys the natural image and it is just to find the
limit using the faders on the mixer where the panorama is slightly enhanced. In this case
a desirable effect could be achieved. Further enhancements can now be realised by the
closed-up microphones. Considering each instrument after each other step by step leads
to the desired mix. The first step in this procedure is to pan the instrument to that side
where it was situated in the concert. Likewise, it is to find the right limit with the fader
where the single microphone ’supports’ the main-set. Too much of a single microphone
represents the particular instrument too close which is perceived unnaturally keeping a
real listening situation in the concert hall in mind. A helping tool in this procedure is
to listen solo to the considered instrument and the main mix, both seperately and at the
same time. Of course due to the recording situation each instrument is also recorded by
the other microphones which makes the mixing a bit tricky. In the case of this particular
recording the clarinet was a prominent component in the quartet placed in a half-circle
in front of the conductor and was a strong source in the cello microphone. Therefore the

3 Recording and mixing 14
clarinet was was kept a bit lower in level. Likewise, the piano placed in the left rear of
the violin and the viola was quite prominent in the microphones of these two particular
instruments. Therefore a good balance had to be found, in which the violin and viola
are supported and at the same time the piano is not overemphasised. During the mixing
5-band equalisers were tried out to reduce annoying or to enhance missing frequency com-
ponents especially in case of the cello. Since it didn’t enhance the main mix, the equalisers
were removed again. There were three stereo closed-up microphones in use: One for the
piano (2x4023), one for the marimba phone (2x4011) and one for the vibraphone (MS-set).
In each of these stereo set-ups their balance and stereo-spread had to be adjusted individ-
ually to give the instrument a natural wideness. The individual stereo mixes were then
’placed’ into the image of the scene, that is into the main mix. Sometimes the individual
panning was slightly overestimated which equaled out when it was faded into the main
mix. An additional difficulty of that particular piece is the dynamic range of each instru-
ment throughout the different parts of the piece: It starts with atmospheric sounds that
are quite weak, the strings and the bowed vibraphone for example, which are explosively
interrupted by clarinet, percussions and piano, making it difficult to find the right level for
each instrument. The middle part is very percussive (carried by the marimba phone for
example). After coming back to the initial part the piece continues with a strong carpet of
strings that leads over to a strong rhythmical part ending in a long crescendo. Therefore
the fader setting had been tried on this different parts and been slightly corrected during
several repetitions. Finally, the closed-up microphones are processed by additional reverb.
Therefore, different plug-ins are available in Pro Tools. In this case the Oxford reverb was
chosen and set to a comparable reverberation time of the concerthall, which is around 2.2
seconds. Due to the close recording position of the microphone to the instrument, mainly
direct sound from the instrument is recorded. Since this is mixed with the main-set that
contains also the diffuse sound field of the hall, the additional reverb helps to suit the main
mix by smoothing out any edges and by fitting the input of several microphones as one
coherent mix. Afterwards the mixer was routed back to a stereo input of the converter,
so that the piece could be recorded again with the mixer’s settings. The final mix is then
normalised, which means that the gain of the recording is set to -0.1dB meaning that the
full range of 24bits is used in an optimal way. In addition a fade in and a fade out is set
in the beginning and the end of the track. In order to have a recording that can be played
on a normal CD format the recording is downsampled to 44.1kHz and the number of bits

3 Recording and mixing 15
is reduced to 16 bits.
Two mixes of the same piece of music were done. The first one, where also the evalua-
tion is carried on, and a second one that corrects the first one regarding the observations
of the listening test.

4 Evaluation 16
4 Evaluation
4.1 Measurements - Objective analysis
The evaluation contains a listening test as well as an analysis of three loudspeaker pairs of
different price categories in order to obtain a relation between analysis and perception. The
analysis focuses on the near field characteristics of the loudspeakers (frequency responses)
and moreover on their power responses.
The loudspeakers under test are two-way monitoring systems of different price categories:
a Genelec 1031A, a Yamaha NS-10 and an Adam A5 in the following just referred to with
their company name. The Genelec is a bi-amplified vented loudspeaker system with active
crossover filters (for more detailed information see [5]) and were sold for a price of around
10000DKK (1340Euro). The Adam is as well a vented active loudspeaker system (see [7])
and costs around 2077DKK (279Euro). In contrast to the other two speakers the Yamaha
is a passive closed box system (see [6]). They are no longer available and cost around
200 and 300 Euro. In a first step two measurements are carried out on the individual
speakers in order to get an technical analysis of the systems: In a first measurement the
sound power of each speaker is determined making use of the reverberation room method
and in a second measurement the free field response of the speaker is measured in an
anechoic chamber. The aim of these two measurements is to relate the omnidirectional
power radiation in the diffuse sound field to the power radiation in free field conditions
via the directivity factor.
All program files, Matlab calculations and data used can be found on the enclosed CD.
4.1.1 Sound power determination
The method of sound power determination in a reverberation room follows the description
in the exercise guide [3] and refers to the theory described in [4].
Each loudspeaker is placed in the reverberation room 010 in building 355 of the department
Acoustic Technology (DTU) on the floor. The loudspeaker under test is driven with
stationary white noise of bandwidth 25,6 kHz with an overall noise level of 400V rms. As
analyse system the B&K PULSE Labshop in combination with a front-end is used. A
microphone calibrated for 94dB SPL at 1kHz is mounted on a rotating boom device that
makes one rotation in 64s. During the measurement the sound pressure is though averaged
in time and space for an average time according to the rotation time. The spatial and

4 Evaluation 17
time averaged mean-square pressure is summed in one-third octave bands in the range of
50Hz to 20kHz. The microphones in use were a pressure microphone of type B&K 4134
for the measurement of the Genelec and a free-field microphone of type B&K 4165 for
the other two loudspeakers. It is necessary for both types of microphones to correct the
power responses for the diffuse sound field, that is a random incidence of sound. For the
Genelec box the input sensitivity was set to 0dBV, where for the Yamaha box an external
amplifier was used and adjusted to the same output level. The same adjustment was done
for the internal amplifier of the Adam loudspeaker. The adjustment was done during
the frequency response measurement (see chapter 4.1.2) and kept constant throughout all
measurements.
The sound power is determined by making use of the following equation:
P = 13.8V¯< p2 >
ρc2T60(1 +
Sλ
8V), (1)
where ¯< p2 > is the spatial mean-square sound pressure in Pa2 in the according one-third
octave band, V is the Volume in m3 and S the surface area in m2 of the room, T60 is
the reverberation time in s and specifies the decay rate of the total sound energy in the
corresponding one-third octave band, λ is the wavelength in the corresponding one-third
octave band in m, c is the speed of sound in m/s and ρ is the density of air in kg/m3.
The sound power is determined accordingly in the individual one-third octave bands.
Beforehand the reverberation time T60 is determined by making use of the B& K PULSE
Labshop project file RevTime Interrupted.pls. The room is driven with random white
noise by making use of the Adam loudspeaker and after the source is turned off the decay
of sound energy is measured. The results are averaged for two different loudspeaker and
three different microphone positions, so that 6 loudspeaker/microphone combinations are
averaged. The reverberation time is automatically calculated by the program and is shown
in the Appendix.
The calculations have been done in Matlab in the file powerdetermination.m and the
results are presented in the following.
In Figure 8 the results of the sound power determination are shown in dB re 1pW.
As can be seen from the figure all loudspeakers have a quite balanced power distribution
in the frequency range from 125Hz to 6300Hz with an variation of not more than 3dB
(Genelec) to 5dB (Yamaha). The reason for that the total power radiated by the Genelec
loudspeaker is a bit lower is that for the specified input level (400Vrms) a protection was

4 Evaluation 18
Figure 8: Sound power in one-third octave bands of the three loudspeakers
activated in the Genelec loudspeaker system allowing not higher levels as shown. However,
since the overall level is a matter of adjustment and the protection function is frequency
independent, the results still can be compared. The input level was chosen in order to
ensure a signal to noise ratio of at least 30dB throughout the entire frequency range, which
is true disregarding the measurement at 50 Hz. Outside the above specified frequency range
with a flat power response the power radiated by the loudspeakers is decreasing to both
ends. Where the radiation of the Genelec speaker at the lower frequency band is 10dB
lower compared to its flat response, the responses of the other two speakers drop off more
drastically, so that for comparison issues frequencies below 100Hz are not considered.
At the higher frequency bands (above 6.3kHz) the speakers’ power responses drop off
gradually by 1 to 2dB per one-third octave band up to the band with a center frequency
of 16kHz (keeping in mind that the upper cutoff frequency of that band is around 18kHz),
where the level is reduced 8dB for the Yamaha, 10dB for the Genelec and to 11dB for the
Adam speaker, which of course drops more drastically in the highest frequency band with
center frequency 20kHz, which is -16dB, -18dB and -17dB, respectively, compared to the
flat responses.

4 Evaluation 19
4.1.2 Frequency Responses
In a second step the frequency response of each speaker has been determined in an ane-
choic chamber. For the Genelec box the large anechoic chamber in building 354 of the
department Acoustic Technology (DTU), where the free-field conditions are valid for fre-
quencies above 50Hz, was available, whereas for the other two speakers the small anechoic
chamber in the same building, with a lower frequency limit of 200Hz had to be used.
The analysis was performed by the PULSE Labshop program 31221-J2010-LabC-fft.pls
allowing the determination of frequency responses and autospectra. The microphone in
use was a free-field microphone of type B&K 4191. The microphone has been calibrated
for 94dB SPL at 1kHz before the measurements. The input signal is the same as for the
power determination: stationary white noise with an overall level of 400Vrms. Seven mea-
surements have been done for each loudspeaker. The reference point has been chosen to
be on axis on the Woofer unit in a distance of 1,60m. The recommended reference axis for
the Genelec unit is for example between the two drivers [5]. However, the chosen reference
position refers to the average listening position found in the three studios of DKDM for
the mostly used Genelec loudspeakers. Additional six measurements were done around
the reference position, moving closer to a distance of 1m, more far away to a distance of
2m, and moving slightly off axis (20cm), that is left/right and up/down, from the on axis
reference point.
In the following the results are presented. Note that due to the chosen amplifier level-
settings the individual frequency responses have an offset of +1dB.
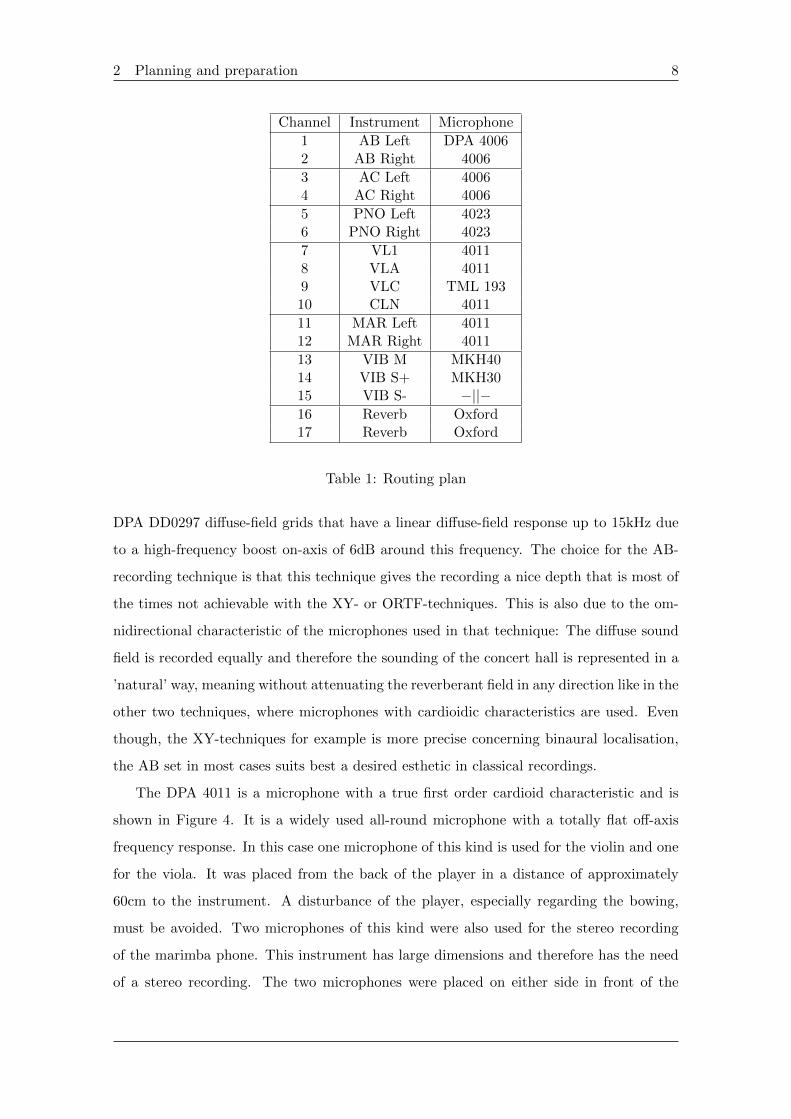
Considering the reference on axis measurement in Figure 9 the Genelec speaker shows
the most flat response (±1dB)over the entire frequency range from 100Hz to 20kHz. The
lower cut-off frequency (−3dB) is found at 40Hz. The results are consistent with the
datasheet [5]. In the frequency response of the Yamaha loudspeaker the bump at mid-
frequencies from 470 to 1500Hz with a maximum of +3dB is very prominent. Besides a
further dip of −2dB at 7.5kHz the speaker’s frequency response varies ±1dB. The bump
and dip clearly indicate some coloration effects in the spectrum. With a lower cut-off
frequency (−3dB) of 76 Hz this speaker has the weakest low-frequency response. Even
though the Adam speaker is the smallest one in this test, the lower cut-off frequency
(−3dB) is with 64Hz below the one of the Yamaha, which is due to the vented system.
The small bump at 96Hz indicates the resonance frequency of the system, which is also
found for the Yamaha system at 144Hz. The frequency response varies ±2dB with a
4 Evaluation 20
Figure 9: On axis frequency response of the three loudspeakers (reference point: r =1, 60m)
prominent dip at 3.5kHz.
Further, the off axis responses of the individual systems are analysed in order to identify
changes in the spectra that occur due to varying listening positions. The most prominent
effects are found when varying along the woofer-tweeter axis, since the phase relations
between the two units change most significantly.
Figure 10: Frequency response in a distanceof 1,60m off axis shifted 20cm left and right(Genelec)
Figure 11: Frequency response in a distanceof 1,60m off axis shifted 20cm up and down(Genelec)
The Genelec’s frequency response is most sensitive when changing the listening position
towards the woofer, where a dip of −2dB at 2.5kHz becomes prominent. The rest of the

4 Evaluation 21
spectrum is unchanged. In case of the Yamaha a change of the observation position
towards the woofer as well as the tweeter give rise to changes in the response. Moving
towards the woofer unit a dip of −3dB occurs at a frequency of 2.6kHz whereas moving
towards the opposite direction a dip (−3dB) occurs at a frequency of 3.8kHz that takes
a larger effect (−4dB) when moving further on this axis (in this case 30cm). This is the
only loudspeaker where this effect could be observed.
Figure 12: Frequency response in a distanceof 1,60m off axis shifted 20cm left and right(Yamaha)
Figure 13: Frequency response in a distanceof 1,60m off axis shifted 20cm up and down(Yamaha)
The frequency response of the Adam speaker stays almost unchanged disregarding of
which axis is varied.
Figure 14: Frequency response in a distanceof 1,60m off axis shifted 20cm left and right(Adam)
Figure 15: Frequency response in a distanceof 1,60m off axis shifted 20cm up and down(Adam)
The variation in distance, shown in Figures 16 to 18, mostly indicates an expected level
difference, but the individual shapes of responses is maintained. Some dips in the responses

4 Evaluation 22
Figure 16: Frequency response on axis inthree different distances (Genelec)
Figure 17: Frequency response on axis inthree different distances (Yamaha)
Figure 18: Frequency response on axis inthree different distances (Adam)
of the Yamaha and Adam are slightly strengthened when moving more far away. Also a
slight change in the low frequency response can be observed, but this is most probably
due to the limitations of the anechoic chamber below 200Hz.
4.1.3 Directivity factor
For the purpose of evaluating the loudspeakers the directivity factor is the most important
measure, since it will allow to link the technical objective analysis to a subjective one in
a listening test.
The directivity factor D is defined as
D(r, θ, ϕ) =Pomni
Pff (r, θ, ϕ), (2)
where Pomni is the power determined in section 4.1.1, which represents due to the diffuse

4 Evaluation 23
sound field an omnidirectional characteristic of the source, and Pff (r, θ, ϕ) is the power
given by the free-field measurements. The spherical coordinate system is used, where
r is the distance to the source and θ and ϕ describe the elevation and azimuth angle,
respectively. Mainly the directivity factor for an on axis response will be estimated,
i.e. θ = 0 and ϕ = 0. Note that D < 1 means that more power is contributed by
the loudspeaker compared to the omnidirectional characteristic for the specific free-field
measurement position.
In order to determine the power from the latter measurements the frequency responses
must be processed in the following way:
Pff (r, θ, ϕ) = IffSff , (3)
where Sff = 4πr2 is the surface area of an imaginary sphere and Iff =¯p2(r,θ,ϕ)ρc the
intensity floating through that area. The measured rms-pressure prms is isolated from
the frequency response H by multiplying it with the square-root of the signal generator’s
autospectrum γnoise (autospectrum of the white noise): prms = H√γnoise. Squaring
this value results into the mean-square pressure p2 that then has to be summed up in
the individual one-third octave bands by making use of the mfile onethirdoctavesum.m.
Finally, the free-field power Pff (r, θ, ϕ) is estimated by making use of the above mentioned
eq. 3. Due to the fact that each loudspeaker is placed in the reverberation room to
determine its omnidirectional power response the walls of the room - assumed as plane,
rigid surfaces - will give rise to image sources according to the theory of monopoles - which
is an appropriate model for a loudspeaker at low frequencies - in [8] p.11/12:
Pa =ρck2|Q|2
8π(1 +
sin 2kh
2kh), (4)
where k is the wavenumber, Q is the volume velocity of the source and h is the distance
between the source and the reflecting surface. The term in front of the parenthesis is the
radiated power of a monopole in free field conditions and the term inside the parenthesis
is the reflection factor indicating the influence of the image source that varies with a
sinc-function. Since the loudspeakers were placed on the floor of the reverberation room
the sound power is doubled for low frequencies (kh << 1), whereas the reflection factor
is approaching 1 for higher frequencies. In order to make the two power determinations
comparable, Pomni has to be divided by the reflection factor. The distance was chosen to

4 Evaluation 24
be h = 8cm, which is the average distance from the cone of the woofer units to the floor.
The results for the directivity factor are presented in the following in one-third octave
bands:
Figure 19: Directivity factor for the 3 loud-speakers referred to the on axis free-fieldpower response in a distance of 1,60m
Figure 20: Corrected directivity factor for the3 loudspeakers referred to the on axis free-field power response in a distance of 1,60m.
As mentioned before in section 4.1.1 the overall level of the Genelec box was lower com-
pared to the other two speakers due to an activated level protection. This makes it harder
to evaluate the three directivity curves. By evaluating the overall averaged sound power
radiated by each loudspeaker the following results are found:
Loudspeaker Total averaged sound power [dB]
Genelec 42.97Yamaha 45.54Adam 45.68
Table 2: Total averaged sound power
By averaging the results of the Yamaha and the Adam loudspeaker - which are very close -
the difference in total power to the Genelec box can be estimated and is 2.64dB. This value
is used in Figure 20 to shift the Genelec curve appropriately and make the three results
easier to compare. Of course, the most accurate result would be obtained by repeating
the measurements, which couldn’t be done due to lack of time.
From Figure 20 it follows that in general the directivity factor decreases (D < 1), which
means that the power is focussed by the loudspeaker in its front axis (θ = 0 and ϕ = 0
by increasing frequency as expected. The loudspeakers start getting directive above a
frequency of 400Hz. The reason for a deviation from 0dB at low frequencies, where the

4 Evaluation 25
two estimated powers are supposed to be identical due to the omnidirectional characteristic
of the sources, is simply a level mismatch between the two measurements depending also
on the measurement distance r in the free-field condition, but can be neglected since it
is not bigger than 1 to 2dB. The decrease happens in almost the same way for all three
loudspeakers at least for low to midrange frequencies up to 1600Hz. At this frequency,
the directivity factor drops about 3dB for the Genelec and Yamaha box and takes values
from −11 to −13dB before reaching an increase of 2 to 3dB again indicating the crossover-
frequencies of the individual crossover-networks. The drop occurs for the Adam speaker
in the same way, but at 2kHz, shifting also the increase of the directivity factor towards
a higher frequency. Using the center frequencies of the one-third octave bands the graph
gives the following readings which are compared to the crossover frequencies specified in
the individual data sheets in Table 3.
Loudspeaker co. freq. [kHz] Fig.20 co. freq [kHz] data sheets [5, 6, 7]
Genelec 2.5 2.2Yamaha 2.5 2Adam 3.15 2.2
Table 3: Crossover frequencies
The readings are a good approximation for the Genelec and Yamaha box and imprecise for
the Adam box. The increase of the directivity factor at these frequencies can be explained
by that the tweeter of each speaker is less directive than the woofer unit due to the fact
that the wavelength at these frequencies is bigger than the dimensions of the tweeter.
This makes it also plausible why the crossover frequencies do not coincide completely with
the one specified in the data sheets: Around this frequency there is still contribution of
the woofer and above this frequency the tweeter is increasing the directivity factor until
its dimensions get comparable to the wavelength. For high frequencies above 4kHz it is
prominent that the Genelec box has a lower directivity factor compared to the other two
speakers. Especially in the frequency range from 6.3kHz to 12.5kHz, where the directivity
of all three loudspeakers is increased more drastically, the difference to the Yamaha box is
about 4dB. In this region the directivity factor of the Adam loudspeaker lies in between
the other two speakers with 1 − 2dB lower value compared to the Yamaha box. In the
high frequency end (12.5−20kHz) the directivity factor reaches a value of −24 to −34dB
for the Genelec, −20 to −31dB for the Adam and −20 to −29dB for the Yamaha speaker.

4 Evaluation 26
Small changes in the directivity factor can be observed for each speaker especially around
the crossover frequencies most prominent for the Yamaha box. The according figures can
be found in the Appendix.
4.2 Listening test - Subjective analysis
After mixing the recording of the TM+ concert one piece was selected, where the subjective
analysis was carried on. In order to have a reference to the mix one additional piece of
music was selected.
The 2 tracks are: TM+ - Fafchamps, in the following abbreviated with ’TM+’ and
Alison Krauss + Union Station - Lucky one (from the album ’New favorite, 2001’), which
is country/pop music and in the following abbreviated with ’Pop’ .
The analysis was carried on in Studio R1 in DKDM and the three different loudspeaker
pairs were placed as shown in Figure 7 and 21.
Figure 21: Listening test set-up
There were 6 Test-Subjects available, all of which are well trained listeners due to
their education as sound engineers. Two subjects were sitting right after each other at
a time, this means one was listening in a distance of ca. 1m and the second one in a

4 Evaluation 27
distance of ca. 1,50m. The task was to evaluate each speaker system for both pieces
of music for a normal playback volume. Each evaluation procedure started with TM+
and the loudspeaker under test was chosen in random order. Except of one subject,
nobody was told which loudspeaker system is playing and due to the close placement of
the loudspeakers to each other it was not possible to tell which loudspeaker was playing.
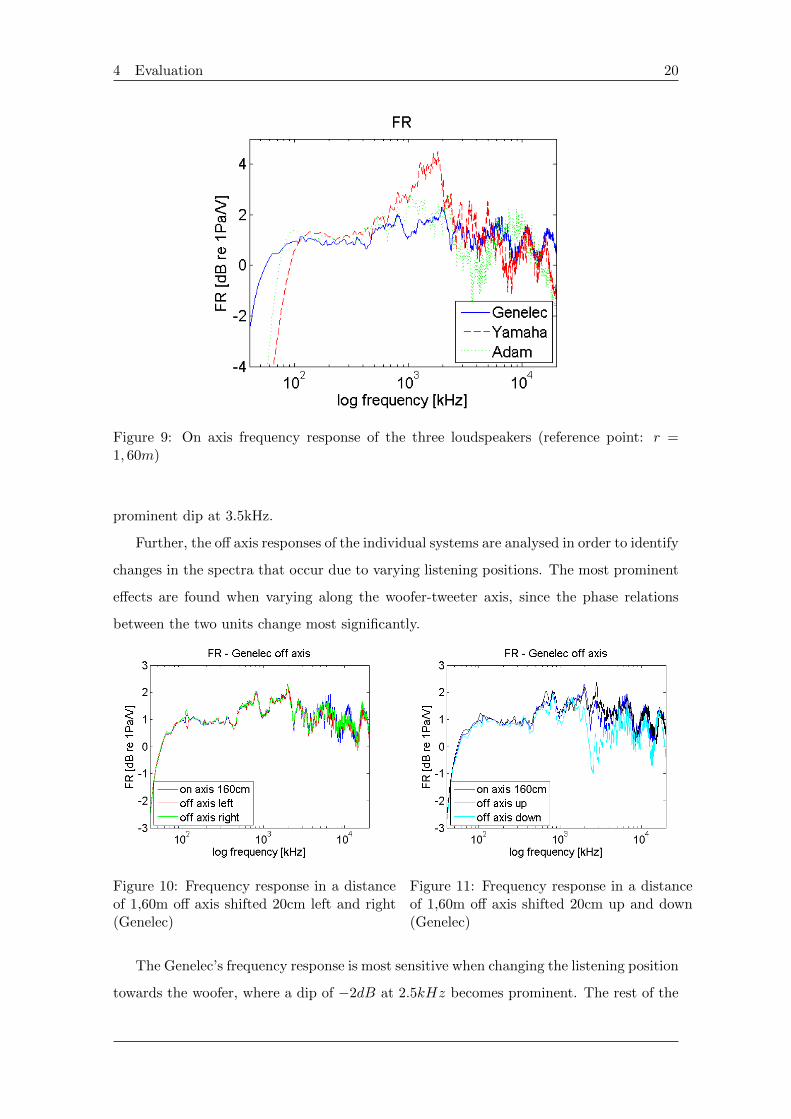
The parameters to evaluate are the balance of the frequency range (low, middle and high
frequencies), clarity, room impression and the overall impression. A seven-point scale was
chosen for this evaluation and the evaluation sheet can be found in the Appendix. All
parameters except the overall impression had to be weighted, where ’0’ is a balanced,
optimal impression. A weighting towards the positive scale means that the parameter is
’too strong’, whereas a weighting towards the negative scale means the parameter is ’too
weak’. As examples: A weak clarity is referred to as a muddy/mumbling sound whereas
a strong clarity reflects a brilliance in the sound that sticks into your ears. The room
impression describes how detailed the ’image’ or presence of the instruments is drawn. A
weak room impression reflects that the separation between instruments is not possible,
whereas in a too strong room impression one instrument is sticking out. The overall
impression had to be evaluated in a scale from 1 to 7 (1: very bad, 2: bad: 3:passed, 4:
ok, 5: good, 6:very good, 7: excellent), similar to the danish seven point scale.
The results of this evaluation are presented in the following.
Figure 22: Listening test: Subjective frequency response - TM+; Adam: x; Genelec: o;Yamaha: +
In Figure 22 the mean values (bars) for the three frequency bands low (1), middle (2)

4 Evaluation 28
and high frequencies(3) are shown for all three loudspeaker systems. All loudspeakers
deviate slightly from an subjective optimal frequency range, where bass and treble are
too weak and the midrange is too strong. In this case the Yamaha box is dominating in
the midrange and is missing low frequencies compared to the other speakers. Individual
weightings show also more drastically impressions.
It is now interesting to see if this impression is also given for the pop song, which can be
a hint for if this impression is caused by the mix itself or really by the loudspeakers.
Figure 23: Listening test: Subjective frequency response - Pop; Adam: x; Genelec: o;Yamaha: +
Looking at Figure 23 the results change indeed. The mid- and high- frequency range is
perceived as more balanced in general, but keeping a prominent midrange for the Yamaha
box and a bit stronger treble for the Adam box. The low frequencies are still weak for
both of these loudspeakers, whereas the Genelec box is slightly dominating in this range.
Also in this case the variance of individual impressions is huge.
In a next step, also clarity and room impression should be taken into account. These
are shown for both cases in Figure 24 and 25.
These two parameters take several aspects of each speaker into account and have a
more summarising character. It can be observed that the Genelec speaker has the most
balanced sound regarding these two parameters, where in general in case of TM+ the
sound is perceived as slightly mumbling and with a lack of detail (room impression). In
case of Pop this lack is perceived as even stronger, whereas regarding clarity just the
Adam speaker tends too a muddy sound. In general there is a stronger consistency in

4 Evaluation 29
Figure 24: Listening test: Clarity and room impression - TM+; Adam: x; Genelec: o;Yamaha: +
Figure 25: Listening test: Clarity and room impression - Pop; Adam: x; Genelec: o;Yamaha: +

4 Evaluation 30
these results regarding the mean and the individual weightings.
In the overall impression just the Genelec loudspeaker passes the test whereas the
other two fail in case of TM+. In the other case the Genelec loudspeaker is evaluated with
’good’, followed by the Adam and the Yamaha with ’ok’. The results are listed in table 4.
Loudspeaker TM+ Pop
Genelec 3.3 5Yamaha 2.8 3.7Adam 2.7 4
Table 4: Listening test: Overall impression
Summarising the results of the listening test the following observations are found: The
huge variance in the individual weightings make it difficult to make a clear statement.
However, there is a quite good consistence in the results when looking at the parameters
clarity and room impression. Regarding the mean values and the overall impression, the
pop song gets better results. Eventhough the task was to evaluate just the sounding of the
speakers, it is of course impossible to uncouple this task from evaluating the mix itself,
which is discussed in more detail in the conclusions.
Regarding the subjective frequency response the mix of TM+ is dominating in the mid-
frequency range, which is consistent with the impression of a lack of clarity. This im-
pression is also confirmed by an oral statement of two of the test-subjects. The overall
impression shows that the optimum for the loudspeakers is not achieved in the mix of
TM+. This is the reason why this piece of music was mixed again. Both results are found
on the enhanced CD. The link to the objective measurements is discussed in the next
section.
The test-subjects also commented some parameters, which is listed in Table 5.
Loudspeaker TM+ Pop
Genelec - A little low middle, boomybass level takes away much high frequencies
vocal level balance down
Yamaha - -
Adam boomy, compressed deep low missingboxy, sounds compressed
Table 5: Listening test: Comments
Beside the task of evaluating the speakers the subjects were asked for identifying the

4 Evaluation 31
speakers (of course the one subject knowing about the procedure is excluded here.). Three
out of five could make the right guess for the Genelec and the Yamaha speaker and even
four out of five identified the Adam speaker.
4.3 Comparison
Looking at the results of the subjective frequency responses it is prominent that in both
cases the Yamaha box gets the weakest weightings concerning bass response and an out-
lining high midrange response. Comparing to the measured frequency response in Figure
9 this is consistence, so that for this speaker the subjective impressions are reflected in the
real response. Several of the sound engineers students have outlined during this project
that the Genelec speakers are ”sticking into their ears” especially in the high frequencies
and that they are too precise meaning that they playback a ”too honest sound” that is
not reproduced in the same intense way on other speakers. Therefore it is an interest-
ing result for this speaker that this impression is not reflected at least in the subjective
evaluation: Both high frequencies are either balanced or slightly too weak and the room
impression is below a balanced impression in the both cases. It is possible that this is a
result of the selected tracks. Going back to Figure 19 the Genelec is definitely focussing
more power in the high frequencies compared to the other two speakers. So the orally
outlined impression cannot be found in this subjective evaluation, but is reflected in the
analytical measurements. Some statements about the Adam speaker show that you can
hear that it is a small speaker (’compressed sound’). From the subjective results this can
be explained by the fact of lacking low frequencies and clarity. The dip at 3.5kHz found
in the frequency response seems not to affect the listeners.

5 Conclusions 32
5 Conclusions
In the discussion of the subjective results it was mentioned that it is impossible to uncouple
the task of evaluating just the sounding of the speakers, from the task of evaluating the
mix itself. However, in terms of which task is to be estimated the following aspects could
help to focus the point of view to one of them: If the task is to evaluate the mix a
professional recording of a similar piece of music should be chosen as a reference point
that is considered as a ’standard’ in that field. To get more reliable results concerning
the evaluation of the speakers professional recordings of different kinds of music should be
used. In addition, increasing the number of test-subjects could help to lower the variance
in the results of both cases. Focussing on the task of this project a combination of both
situations occurred in my point of view: The two chosen songs are of two contradicting
music fields and the mix of TM+ is not done by a professional sound engineer. To show
a link between the listening test and the objective measurements, it is not a good idea
in general to choose a mix, that is not done by a professional sound engineer, as a sound
sample leading automatically to an evaluation of the mix. But in terms of this project this
is a nice feedback on the mix and a challenging task for the professional sound engineers.
Further aspects that have to be considered in this particular listening situation: The
classical piece of music was presented first. Maybe the results changed when also changing
the order of presentation. Each subject has to adapt to the listening conditions and has
to ’get to know’ the speakers and their possibilities in these conditions, which is also valid
for trained listeners. Two subjects were listening at a time, seated behind each other,
which leads to different distances to the speakers. Variations of the listening distances
in the analytical measurements have shown that the frequency responses do not change
besides level, but placing the loudspeakers in a room increases the influence of the room
on the listening position when the distance to the speaker is increased. The mix of TM+ is
modern classical music that works a lot with acoustical sound effects and sound collages.
It is hard to find a standard or a reference to this kind of music, since each composer
wants to create unique effects, so that there is a huge bandwidth of how the piece should
actually sound like.

References 33
References
[1] Catalogue of Rycote 2004 and www.dpamicrophones.com, copyright DPA Microphones
2009
[2] http : //emusician.com/mag/emusicfrontcenter, PentonMedia, Inc., copyright2010.
[3] Exercise 4, Sound power determination in a reverberation room, Finn Jacobsen, Acous-
tic Technology, Technical University of Denmark (DTU) 28 January 2009
[4] The sound field in a reverberation room, Finn Jacobsen, Acoustic Technology, Tech-
nical University of Denmark (DTU), February 2009
[5] Data Sheet No. 1031-0107-6, COPYRIGHT GENELEC OY 1997, Finland,
http://www.genelec.com
[6] Data Sheet NS-10 M Studio, VD29740-1 BWgV,b, Yamaha, Japan,
www.yamaha.com/yamahavgn/Documents/ProAudio/ns10ms.pdf
[7] Data Sheet Adam A5, Adam Audio GmbH/Adam Audio USA, www.adam-audio.com
[8] Radiation of sound, Finn Jacobsen, Acoustic Technology, Technical University of Den-
mark (DTU) and Peter Juhl, Institute of Sensors Signals and Electrotechnic, University
of Southern Denmark, May 2008.

6 Appendix 34
6 Appendix
Figure 26: Reverberation time in the reverberation room 010 in building 355 of the de-partment Acoustic Technology (DTU)
Figure 27: Seating plan for NessFigure 28: Seating plan for Dalbavie
Figure 29: Seating plan for HoltFigure 30: Seating plan for Grisey

6 Appendix 35
Figure 31: Directivity factor for off axis re-sponses (Genelec)
Figure 32: Directivity factor for off axis re-sponses (Yamaha)
Figure 33: Directivity factor for off axis re-sponses (Adam)
6 Appendix 36
Figure 34: Evaluation Sheet for the listening test