Plakophilin3 Loss Leads to an Increase in PRL3 Levels Promoting K8 Dephosphorylation, Which Is...
14
Plakophilin3 Loss Leads to an Increase in PRL3 Levels Promoting K8 Dephosphorylation, Which Is Required for Transformation and Metastasis Nileema Khapare 1. , Samrat T. Kundu 1.¤ , Lalit Sehgal 1. , Mugdha Sawant 1 , Rashmi Priya 1 , Prajakta Gosavi 1 , Neha Gupta 1 , Hunain Alam 1 , Madhura Karkhanis 2 , Nishigandha Naik 2 , Milind M. Vaidya 1 , Sorab N. Dalal 1 * 1 KS215, Advanced Centre for Treatment Research and Education in Cancer (ACTREC), Tata Memorial Centre, Kharghar Node, Navi Mumbai, Maharashtra, India, 2 Pharmacology Department, Piramal Life Sciences Ltd., Mumbai, Maharashtra, India Abstract The desmosome anchors keratin filaments in epithelial cells leading to the formation of a tissue wide IF network. Loss of the desmosomal plaque protein plakophilin3 (PKP3) in HCT116 cells, leads to an increase in neoplastic progression and metastasis, which was accompanied by an increase in K8 levels. The increase in levels was due to an increase in the protein levels of the Phosphatase of Regenerating Liver 3 (PRL3), which results in a decrease in phosphorylation on K8. The increase in PRL3 and K8 protein levels could be reversed by introduction of an shRNA resistant PKP3 cDNA. Inhibition of K8 expression in the PKP3 knockdown clone S10, led to a decrease in cell migration and lamellipodia formation. Further, the K8 PKP3 double knockdown clones showed a decrease in colony formation in soft agar and decreased tumorigenesis and metastasis in nude mice. These results suggest that a stabilisation of K8 filaments leading to an increase in migration and transformation may be one mechanism by which PKP3 loss leads to tumor progression and metastasis. Citation: Khapare N, Kundu ST, Sehgal L, Sawant M, Priya R, et al. (2012) Plakophilin3 Loss Leads to an Increase in PRL3 Levels Promoting K8 Dephosphorylation, Which Is Required for Transformation and Metastasis. PLoS ONE 7(6): e38561. doi:10.1371/journal.pone.0038561 Editor: Cara Gottardi, Northwestern University Feinberg School of Medicine, United States of America Received November 21, 2011; Accepted May 8, 2012; Published June 6, 2012 Copyright: ß 2012 Khapare et al. This is an open-access article distributed under the terms of the Creative Commons Attribution License, which permits unrestricted use, distribution, and reproduction in any medium, provided the original author and source are credited. Funding: This work was supported by grants from the Department of Biotechnology (grant BT/PR11537/BRB/10/661/2008) and Advanced Centre for Treatment Reserach and Education in Cancer (ACTREC) (SND) and fellowships from Council for Scientific and Industrial Research (HA) and the University Grants Commission (PG). The funders had no role in study design, data collection and analysis, decision to publish, or preparation of the manuscript. Competing Interests: Madhura Karkhanis and Nishigandha Naik are employed by Piramal Life Sciences Ltd. There are no patents, products in development or marketed products to declare. This does not alter the authors’ adherence to all the PLoS ONE policies on sharing data and materials, as detailed online in the guide for authors. * E-mail: [email protected] . These authors contributed equally to this work. ¤ Current address: Department of Thoracic H&N Medical Oncology, MD Anderson Cancer Center, Houston, Texas, United States of America Introduction Changes in cytoskeletal architecture and cell-cell adhesion are often observed in cells undergoing neoplastic transformation. Desmosomes are adherens type junctions that are required for cell- cell adhesion, especially in tissues that experience mechanical stress and anchor intermediate filaments (IF’s) leading to the generation of a tissue wide IF network (reviewed in [1,2,3]). IF’s are an important component of the cytoskeleton that give shape and rigidity to cells and are comprised of the type I (acidic K9– K28) and type II (basic K1–K8 and K71–74) subtypes in epithelial cells [4,5]. The keratins are expressed in pairs of type I and type II keratins in a tissue specific and differentiation dependent manner [6,7,8] e.g. simple epithelia express the keratin pair K8 and K18 [9,10], while all stratified epithelia express K5 and K14 in the basal layer [10,11]. The aberrant over-expression of K8 and K18 has been observed in a number of squamous cell carcinomas irrespective of their origin [9,12,13,14]. Over-expression of these two proteins is also associated with increased invasive and migratory properties [15,16] and with poor prognosis [17]. Thus, increased expression of K8/18 could lead to tumor formation. Over-expression of K8 in the immortal foetal buccal mucosal cell line, FBM, led to increased transformation in vitro and in vivo [18]. Conversely, a decrease in K8 and K18 levels leads to a decrease in transformation in tumor cell lines derived from stratified epithelia due to alterations in a6b4 integrin signalling [19]. A knockdown in K8 leads to decreases in a6b4 levels which are accompanied by a decrease in invasion, transformation and a6b4 mediated signalling. Metastasis in colon cancer often correlates with an increased expression of the Phosphatase of Regenerating Liver -3 (PRL-3) [20,21]. In addition, PRL-3 expression inhibits PTEN and PI3K mediated signalling and leads to the loss of proteins such as E- cadherin and c-catenin, which are often associated with activation of the Epithelial Mesenchymal Transition (EMT) program [22]. While these data suggested that PRL3 expression could lead to metastasis, it was not clear what targets of PRL3 were required for metastatic progression. Mizzuchi et. al. demonstrated that PRL-3 expression led to dephosphorylation of K8 and this correlated with an increase in metastatic progression in colon tumors [23], suggesting that post-translational alterations on K8 could drive PLoS ONE | www.plosone.org 1 June 2012 | Volume 7 | Issue 6 | e38561
-
Upload
independent -
Category
Documents
-
view
4 -
download
0
Transcript of Plakophilin3 Loss Leads to an Increase in PRL3 Levels Promoting K8 Dephosphorylation, Which Is...
Plakophilin3 Loss Leads to an Increase in PRL3 LevelsPromoting K8 Dephosphorylation, Which Is Required forTransformation and MetastasisNileema Khapare1., Samrat T. Kundu1.¤, Lalit Sehgal1., Mugdha Sawant1, Rashmi Priya1,
Prajakta Gosavi1, Neha Gupta1, Hunain Alam1, Madhura Karkhanis2, Nishigandha Naik2,
Milind M. Vaidya1, Sorab N. Dalal1*
1 KS215, Advanced Centre for Treatment Research and Education in Cancer (ACTREC), Tata Memorial Centre, Kharghar Node, Navi Mumbai, Maharashtra, India,
2 Pharmacology Department, Piramal Life Sciences Ltd., Mumbai, Maharashtra, India
Abstract
The desmosome anchors keratin filaments in epithelial cells leading to the formation of a tissue wide IF network. Loss of thedesmosomal plaque protein plakophilin3 (PKP3) in HCT116 cells, leads to an increase in neoplastic progression andmetastasis, which was accompanied by an increase in K8 levels. The increase in levels was due to an increase in the proteinlevels of the Phosphatase of Regenerating Liver 3 (PRL3), which results in a decrease in phosphorylation on K8. The increasein PRL3 and K8 protein levels could be reversed by introduction of an shRNA resistant PKP3 cDNA. Inhibition of K8expression in the PKP3 knockdown clone S10, led to a decrease in cell migration and lamellipodia formation. Further, the K8PKP3 double knockdown clones showed a decrease in colony formation in soft agar and decreased tumorigenesis andmetastasis in nude mice. These results suggest that a stabilisation of K8 filaments leading to an increase in migration andtransformation may be one mechanism by which PKP3 loss leads to tumor progression and metastasis.
Citation: Khapare N, Kundu ST, Sehgal L, Sawant M, Priya R, et al. (2012) Plakophilin3 Loss Leads to an Increase in PRL3 Levels Promoting K8 Dephosphorylation,Which Is Required for Transformation and Metastasis. PLoS ONE 7(6): e38561. doi:10.1371/journal.pone.0038561
Editor: Cara Gottardi, Northwestern University Feinberg School of Medicine, United States of America
Received November 21, 2011; Accepted May 8, 2012; Published June 6, 2012
Copyright: � 2012 Khapare et al. This is an open-access article distributed under the terms of the Creative Commons Attribution License, which permitsunrestricted use, distribution, and reproduction in any medium, provided the original author and source are credited.
Funding: This work was supported by grants from the Department of Biotechnology (grant BT/PR11537/BRB/10/661/2008) and Advanced Centre for TreatmentReserach and Education in Cancer (ACTREC) (SND) and fellowships from Council for Scientific and Industrial Research (HA) and the University Grants Commission(PG). The funders had no role in study design, data collection and analysis, decision to publish, or preparation of the manuscript.
Competing Interests: Madhura Karkhanis and Nishigandha Naik are employed by Piramal Life Sciences Ltd. There are no patents, products in development ormarketed products to declare. This does not alter the authors’ adherence to all the PLoS ONE policies on sharing data and materials, as detailed online in theguide for authors.
* E-mail: [email protected]
. These authors contributed equally to this work.
¤ Current address: Department of Thoracic H&N Medical Oncology, MD Anderson Cancer Center, Houston, Texas, United States of America
Introduction
Changes in cytoskeletal architecture and cell-cell adhesion are
often observed in cells undergoing neoplastic transformation.
Desmosomes are adherens type junctions that are required for cell-
cell adhesion, especially in tissues that experience mechanical
stress and anchor intermediate filaments (IF’s) leading to the
generation of a tissue wide IF network (reviewed in [1,2,3]). IF’s
are an important component of the cytoskeleton that give shape
and rigidity to cells and are comprised of the type I (acidic K9–
K28) and type II (basic K1–K8 and K71–74) subtypes in epithelial
cells [4,5]. The keratins are expressed in pairs of type I and type II
keratins in a tissue specific and differentiation dependent manner
[6,7,8] e.g. simple epithelia express the keratin pair K8 and K18
[9,10], while all stratified epithelia express K5 and K14 in the
basal layer [10,11].
The aberrant over-expression of K8 and K18 has been observed
in a number of squamous cell carcinomas irrespective of their
origin [9,12,13,14]. Over-expression of these two proteins is also
associated with increased invasive and migratory properties
[15,16] and with poor prognosis [17]. Thus, increased expression
of K8/18 could lead to tumor formation. Over-expression of K8
in the immortal foetal buccal mucosal cell line, FBM, led to
increased transformation in vitro and in vivo [18]. Conversely, a
decrease in K8 and K18 levels leads to a decrease in
transformation in tumor cell lines derived from stratified epithelia
due to alterations in a6b4 integrin signalling [19]. A knockdown in
K8 leads to decreases in a6b4 levels which are accompanied by
a decrease in invasion, transformation and a6b4 mediated
signalling.
Metastasis in colon cancer often correlates with an increased
expression of the Phosphatase of Regenerating Liver -3 (PRL-3)
[20,21]. In addition, PRL-3 expression inhibits PTEN and PI3K
mediated signalling and leads to the loss of proteins such as E-
cadherin and c-catenin, which are often associated with activation
of the Epithelial Mesenchymal Transition (EMT) program [22].
While these data suggested that PRL3 expression could lead to
metastasis, it was not clear what targets of PRL3 were required for
metastatic progression. Mizzuchi et. al. demonstrated that PRL-3
expression led to dephosphorylation of K8 and this correlated with
an increase in metastatic progression in colon tumors [23],
suggesting that post-translational alterations on K8 could drive
PLoS ONE | www.plosone.org 1 June 2012 | Volume 7 | Issue 6 | e38561
tumor progression. Further, data reported by Alam et. al.
demonstrated that K8 dephosphorylation correlates with increased
tumor progression in oral squamous cell carcinoma (OSCC) and
could be used as a prognostic marker for OSCC progression [24].
Plakophilin3 (PKP3) is a desmosomal plaque protein that
belongs to the p120 catenin sub family of the armadillo family of
proteins and is found in desmosomes in most epithelial tissues with
the exception of hepatocytes [25,26]. PKP3 interacts with multiple
desmosmal proteins as well as K18 [27] and is required for the
recruitment of various desmosomal proteins to the cell border and
the initiation of desmosome formation [28]. It has been suggested
that loss of desmosome function leads to the acquisition of the
neoplastic phenotype (reviewed in [29]). Consistent with the data
that PKP3 is required for desmosome formation [28], PKP3 loss
was associated with tumor progression and metastasis in tumors
derived from the oral cavity and the colon [30,31,32]. A previous
report from our laboratory has demonstrated that a decrease in the
levels of PKP3 in HCT116 cells, which are derived from the colon
[33], led to an increase in colony formation in soft agar and
increased tumor formation and metastasis in nude mice. PKP3 has
been shown to physically associate with keratins, specifically K18
[27], which is the obligate partner for K8 [4,5]. The results in this
report demonstrate that upon PKP3 loss, an increase in PRL3
levels is observed, which leads to increased dephosphorylation of
K8 and an increase in K8 levels. Our results also suggest that the
increase in K8 levels is required, at least in part, to mediate the
tumor progression and metastasis induced upon PKP3 loss.
Results
Previous work from this laboratory has demonstrated that PKP3
loss in HCT116 cells leads to increased neoplastic progression and
metastasis [33]. PKP3 has been shown to form a complex with
K18 in a yeast two hybrid assay [27]. To determine if PKP3 forms
a complex with K18 in HCT116 cells, protein extracts from
HCT116 cells were incubated with either non-specific IgG or
antibodies to K18. The immunoprecipitation reactions were
resolved on SDS-PAGE gels followed by Western blotting with
antibodies to K18 and PKP3. As shown in Figure S1A, complexes
immunoprecipitated by the K18 antibody contain K18 and PKP3,
in contrast to extracts incubated with the control antibody. As K8
and K18 are a keratin pair expressed mostly in simple epithelia
[9,10], the levels of K8 and K18 were determined in the HCT116
derived PKP3 knockdown clones S9 and S10 [33]. S9 and S10
were generated using two different shRNA constructs, both show
similar defects in desmosome formation, and both show increased
transformation and metastasis when injected into nude mice
[28,33]. Hence, all future experiments were performed with these
two clones. A Western blot analysis demonstrated that the levels of
both K8 and K18 were elevated in the PKP3 knockdown clones
(S9 and S10) as compared to the vector control cells (pTU6)
(figure 1A). Western blots for actin served as loading controls and a
Western blot for PKP3 shows the decrease in PKP3 levels in S9
and S10. A high salt extraction shown in Figure S1B demonstrated
that in addition to K8 and K18 one additional band was present
that was recognized by an antibody that recognises most type I
keratins (data not shown). The PKP3 knockdown clones, S9 and
S10, showed an elevation of all three keratins (Figure S1B). The
increased keratin levels did not affect filament formation by K8 or
K18 (Figure S1C). The other band was not another intermediate
filament protein like vimentin as a Western blot demonstrated that
either vector control or knockdown cells derived from HCT116
cells do not express vimentin (Figure S1D) as previously reported
[34,35].
The two clones, S9 and S10, are generated using two different
shRNA’s suggesting that the phenotypes observed are probably
not due to off-target effects of the shRNA [33]. To determine
whether the effects observed were due to PKP3 knockdown, the S9
cells were transfected with either dsRed alone or a PKP3 cDNA
construct resistant to the 3.7 shRNA used to generate the S9 clone,
dsRed PKP3 3.7R [28]. Post transfection the cells were stained
with antibody to K8 and imaged by confocal microscopy. As
shown in figure 1B, introduction of the shRNA resistant construct,
dsRed PKP3 3.7R resulted in a decrease in keratin staining in
comparison to cells transfected with the vector control. This is in
agreement with previous work from our laboratories, which
demonstrated that the introduction of an shRNA resistant PKP3
cDNA into these cell clones does reverse many of the phenotypes
observed upon PKP3 knockdown [28].
To determine if an increase in RNA levels led to the increase in
K8 protein in the PKP3 knockdown clones, a reverse transcriptase
coupled Real Time PCR analysis was performed. The mRNA
levels of K8 and K18 in the PKP3 knockdown clones were not
significantly altered as compared to the vector control (pTU6)
(figure 1C), therefore the increase was not due to an increase in
mRNA levels. GAPDH levels were also measured in this assay as
loading controls. To determine if the increase in protein stability
was due to post-translational modifications on K8/K18, protein
extracts from the vector control and PKP3 knockdown clones were
subjected to two-dimensional gel electrophoresis. In these exper-
iments, K8 migrated as three distinct spots in the vector control
cells, with the most acidic spots being the most abundant
(figure 1D, top panel). In contrast, in the PKP3 knockdown
clones, the most basic spots increased in abundance with an overall
increase in protein levels (figure 1D). The pattern observed is
similar to the pattern observed in cells that over-express the
protein phosphatase PRL3 [23], suggesting that the altered pattern
may be associated with a decrease in phosphorylation in K8. No
change in migration was observed for K18 (Figure S2A) though an
increase in protein levels was observed.
Two major sites of phosphorylation, S73 and S431, have been
reported in K8 [36,37]. Western blots with phosphospecific
antibodies for S73 and S431 demonstrated that the levels of K8
phosphorylated on S73 increase in the PKP3 knockdown clones as
compared to the vector control, which is consistent with the
increase in K8 expression (figure 1E). In contrast, the levels of K8
phosphorylated on S431 remained constant in the PKP3
knockdown clones when compared to the vector control,
suggesting that there is a decrease in phosphorylation on K8 at
S431 in the PKP3 knockdown clones (figure 1E). Western blots for
actin were performed as loading controls. These results were
quantitated by densitometry and when the levels of these
individual proteins were normalized to the levels of actin, it was
observed that while the levels of K8 and K8 phosphorylated on
S73 were elevated in the PKP3 knockdown clones, the levels of K8
phosphorylated on S431 stayed constant suggesting that S431 was
dephosphorylated upon PKP3 knockdown (Figure S2B). The
specificity of the phospho-specific antibodies was confirmed by
their inability to recognize a phospho-site mutant in a Western
blot analysis (Figure S2C and [24]). The levels of p38MAPK,
which phosphorylates S73 in response to stress [37], were similar
in both the HCT116 derived vector control and PKP3 knockdown
clones (Figure S2D), which is consistent with the observation that
S73 phosphorylation is not altered in the PKP3 knockdown clones.
A Western blot for 14-3-3c served as a loading control (Figure
S2D).
To further demonstrate that the change in migration and
stability of K8 was due to changes in phosphorylation in K8, two
Keratin 8 Required for Transformation
PLoS ONE | www.plosone.org 2 June 2012 | Volume 7 | Issue 6 | e38561
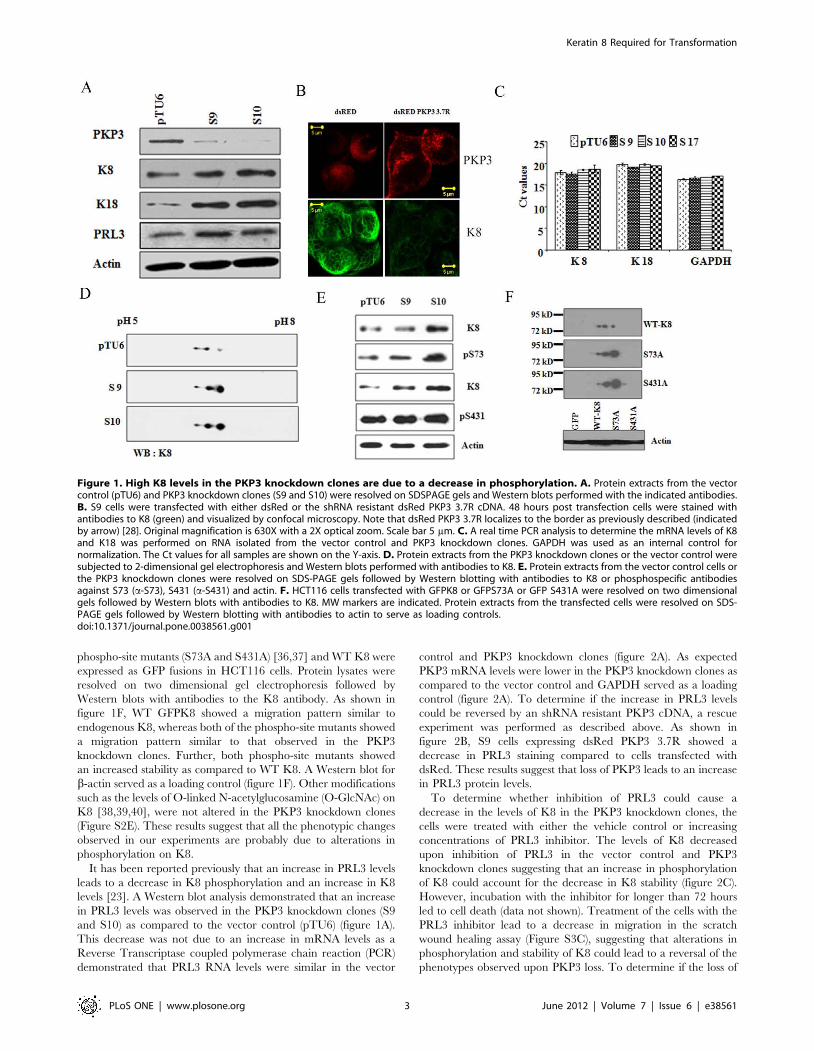
phospho-site mutants (S73A and S431A) [36,37] and WT K8 were
expressed as GFP fusions in HCT116 cells. Protein lysates were
resolved on two dimensional gel electrophoresis followed by
Western blots with antibodies to the K8 antibody. As shown in
figure 1F, WT GFPK8 showed a migration pattern similar to
endogenous K8, whereas both of the phospho-site mutants showed
a migration pattern similar to that observed in the PKP3
knockdown clones. Further, both phospho-site mutants showed
an increased stability as compared to WT K8. A Western blot for
b-actin served as a loading control (figure 1F). Other modifications
such as the levels of O-linked N-acetylglucosamine (O-GlcNAc) on
K8 [38,39,40], were not altered in the PKP3 knockdown clones
(Figure S2E). These results suggest that all the phenotypic changes
observed in our experiments are probably due to alterations in
phosphorylation on K8.
It has been reported previously that an increase in PRL3 levels
leads to a decrease in K8 phosphorylation and an increase in K8
levels [23]. A Western blot analysis demonstrated that an increase
in PRL3 levels was observed in the PKP3 knockdown clones (S9
and S10) as compared to the vector control (pTU6) (figure 1A).
This decrease was not due to an increase in mRNA levels as a
Reverse Transcriptase coupled polymerase chain reaction (PCR)
demonstrated that PRL3 RNA levels were similar in the vector
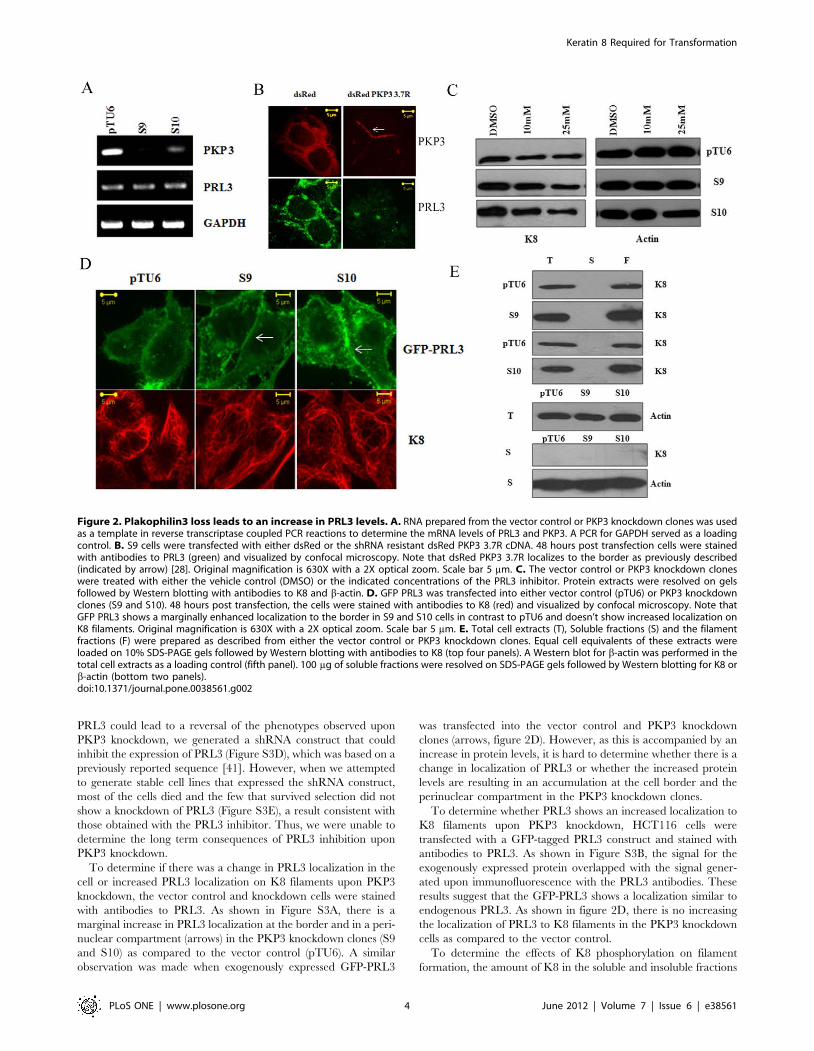
control and PKP3 knockdown clones (figure 2A). As expected
PKP3 mRNA levels were lower in the PKP3 knockdown clones as
compared to the vector control and GAPDH served as a loading
control (figure 2A). To determine if the increase in PRL3 levels
could be reversed by an shRNA resistant PKP3 cDNA, a rescue
experiment was performed as described above. As shown in
figure 2B, S9 cells expressing dsRed PKP3 3.7R showed a
decrease in PRL3 staining compared to cells transfected with
dsRed. These results suggest that loss of PKP3 leads to an increase
in PRL3 protein levels.
To determine whether inhibition of PRL3 could cause a
decrease in the levels of K8 in the PKP3 knockdown clones, the
cells were treated with either the vehicle control or increasing
concentrations of PRL3 inhibitor. The levels of K8 decreased
upon inhibition of PRL3 in the vector control and PKP3
knockdown clones suggesting that an increase in phosphorylation
of K8 could account for the decrease in K8 stability (figure 2C).
However, incubation with the inhibitor for longer than 72 hours
led to cell death (data not shown). Treatment of the cells with the
PRL3 inhibitor lead to a decrease in migration in the scratch
wound healing assay (Figure S3C), suggesting that alterations in
phosphorylation and stability of K8 could lead to a reversal of the
phenotypes observed upon PKP3 loss. To determine if the loss of
Figure 1. High K8 levels in the PKP3 knockdown clones are due to a decrease in phosphorylation. A. Protein extracts from the vectorcontrol (pTU6) and PKP3 knockdown clones (S9 and S10) were resolved on SDSPAGE gels and Western blots performed with the indicated antibodies.B. S9 cells were transfected with either dsRed or the shRNA resistant dsRed PKP3 3.7R cDNA. 48 hours post transfection cells were stained withantibodies to K8 (green) and visualized by confocal microscopy. Note that dsRed PKP3 3.7R localizes to the border as previously described (indicatedby arrow) [28]. Original magnification is 630X with a 2X optical zoom. Scale bar 5 mm. C. A real time PCR analysis to determine the mRNA levels of K8and K18 was performed on RNA isolated from the vector control and PKP3 knockdown clones. GAPDH was used as an internal control fornormalization. The Ct values for all samples are shown on the Y-axis. D. Protein extracts from the PKP3 knockdown clones or the vector control weresubjected to 2-dimensional gel electrophoresis and Western blots performed with antibodies to K8. E. Protein extracts from the vector control cells orthe PKP3 knockdown clones were resolved on SDS-PAGE gels followed by Western blotting with antibodies to K8 or phosphospecific antibodiesagainst S73 (a-S73), S431 (a-S431) and actin. F. HCT116 cells transfected with GFPK8 or GFPS73A or GFP S431A were resolved on two dimensionalgels followed by Western blots with antibodies to K8. MW markers are indicated. Protein extracts from the transfected cells were resolved on SDS-PAGE gels followed by Western blotting with antibodies to actin to serve as loading controls.doi:10.1371/journal.pone.0038561.g001
Keratin 8 Required for Transformation
PLoS ONE | www.plosone.org 3 June 2012 | Volume 7 | Issue 6 | e38561
PRL3 could lead to a reversal of the phenotypes observed upon
PKP3 knockdown, we generated a shRNA construct that could
inhibit the expression of PRL3 (Figure S3D), which was based on a
previously reported sequence [41]. However, when we attempted
to generate stable cell lines that expressed the shRNA construct,
most of the cells died and the few that survived selection did not
show a knockdown of PRL3 (Figure S3E), a result consistent with
those obtained with the PRL3 inhibitor. Thus, we were unable to
determine the long term consequences of PRL3 inhibition upon
PKP3 knockdown.
To determine if there was a change in PRL3 localization in the
cell or increased PRL3 localization on K8 filaments upon PKP3
knockdown, the vector control and knockdown cells were stained
with antibodies to PRL3. As shown in Figure S3A, there is a
marginal increase in PRL3 localization at the border and in a peri-
nuclear compartment (arrows) in the PKP3 knockdown clones (S9
and S10) as compared to the vector control (pTU6). A similar
observation was made when exogenously expressed GFP-PRL3
was transfected into the vector control and PKP3 knockdown
clones (arrows, figure 2D). However, as this is accompanied by an
increase in protein levels, it is hard to determine whether there is a
change in localization of PRL3 or whether the increased protein
levels are resulting in an accumulation at the cell border and the
perinuclear compartment in the PKP3 knockdown clones.
To determine whether PRL3 shows an increased localization to
K8 filaments upon PKP3 knockdown, HCT116 cells were
transfected with a GFP-tagged PRL3 construct and stained with
antibodies to PRL3. As shown in Figure S3B, the signal for the
exogenously expressed protein overlapped with the signal gener-
ated upon immunofluorescence with the PRL3 antibodies. These
results suggest that the GFP-PRL3 shows a localization similar to
endogenous PRL3. As shown in figure 2D, there is no increasing
the localization of PRL3 to K8 filaments in the PKP3 knockdown
cells as compared to the vector control.
To determine the effects of K8 phosphorylation on filament
formation, the amount of K8 in the soluble and insoluble fractions
Figure 2. Plakophilin3 loss leads to an increase in PRL3 levels. A. RNA prepared from the vector control or PKP3 knockdown clones was usedas a template in reverse transcriptase coupled PCR reactions to determine the mRNA levels of PRL3 and PKP3. A PCR for GAPDH served as a loadingcontrol. B. S9 cells were transfected with either dsRed or the shRNA resistant dsRed PKP3 3.7R cDNA. 48 hours post transfection cells were stainedwith antibodies to PRL3 (green) and visualized by confocal microscopy. Note that dsRed PKP3 3.7R localizes to the border as previously described(indicated by arrow) [28]. Original magnification is 630X with a 2X optical zoom. Scale bar 5 mm. C. The vector control or PKP3 knockdown cloneswere treated with either the vehicle control (DMSO) or the indicated concentrations of the PRL3 inhibitor. Protein extracts were resolved on gelsfollowed by Western blotting with antibodies to K8 and b-actin. D. GFP PRL3 was transfected into either vector control (pTU6) or PKP3 knockdownclones (S9 and S10). 48 hours post transfection, the cells were stained with antibodies to K8 (red) and visualized by confocal microscopy. Note thatGFP PRL3 shows a marginally enhanced localization to the border in S9 and S10 cells in contrast to pTU6 and doesn’t show increased localization onK8 filaments. Original magnification is 630X with a 2X optical zoom. Scale bar 5 mm. E. Total cell extracts (T), Soluble fractions (S) and the filamentfractions (F) were prepared as described from either the vector control or PKP3 knockdown clones. Equal cell equivalents of these extracts wereloaded on 10% SDS-PAGE gels followed by Western blotting with antibodies to K8 (top four panels). A Western blot for b-actin was performed in thetotal cell extracts as a loading control (fifth panel). 100 mg of soluble fractions were resolved on SDS-PAGE gels followed by Western blotting for K8 orb-actin (bottom two panels).doi:10.1371/journal.pone.0038561.g002
Keratin 8 Required for Transformation
PLoS ONE | www.plosone.org 4 June 2012 | Volume 7 | Issue 6 | e38561
was measured in the vector control and PKP3 knockdown clones.
Keratin solubility assays demonstrated that all the K8 was present
in the insoluble fraction in both the vector control and PKP3
knockdown clones, even when a 100 mg of the soluble fraction was
loaded (figure 2E). Further, as shown in Figure S1C, filament
formation was not altered in the PKP3 knockdown clones as
compared to the vector control. Similarly, staining with the
phosphospecific antibodies to K8 did not result in any detectable
alterations in keratin filament organization in the PKP3 knock-
down clones when compared to the vector control (Figure S4A). In
addition, the alteration in phosphorylation on K8 did not result in
an alteration in the interaction between K8 and K18 as confirmed
by Fluorescence Resonance Energy Transfer (FRET) assays
(Figure S4B). These are consistent with results that suggest that
the phospho-site mutants of K8 form filaments in a manner similar
to WT K8 [24]. These results suggest that the change in
phosphorylation does not alter either filament formation or
solubility of K8.
To determine whether the elevated K8 levels were required for
transformation upon PKP3 loss, we inhibited K8 expression using
RNA interference using previously described shRNA constructs
[19]. These experiments were performed in the S10 clone as
previous results from the laboratory have demonstrated that the S9
and S10 clones are indistinguishable in terms of their ability to
initiate desmosome formation and the transformed phenotype
[28,33]. The PKP3 knockdown clone (S10) was transfected with
either the vector control or the K8 knockdown construct and
single cell clones with a decrease in PKP3 and K8 expression
(8.21, 8.24, 8.28) as compared to a clone transfected with the
vector alone (S10P3) were identified (Figure S5A and figure 3A).
As reported previously [42,43], a decrease in the levels of K8 lead
to a decrease in the levels of K18 (figure 3A), despite the fact that
these constructs do not inhibit K18 [19]. Further, the level of the
other type I keratin was also altered in the double knockdown
clone 8.21 suggesting that it forms a complex with K8 (Figure
S1B). An immunofluorescence analysis demonstrated that filament
formation was not affected in the knockdown clones (Figure S5B),
though the knockdown cells showed a decrease in the immuno-
fluorescence signal as compared to the vector controls. These
results show that the alteration in K8 levels does not lead to
alterations in the ability of K8 to form filaments. Similarly,
knockdown experiments were performed for K18 in the PKP3
knockdown clone. The knockdown of K18 did not lead to a huge
decrease in the levels of K8 (Figure S5C), presumably because of
the presence of another type I keratin in the cells (Figure S1B).
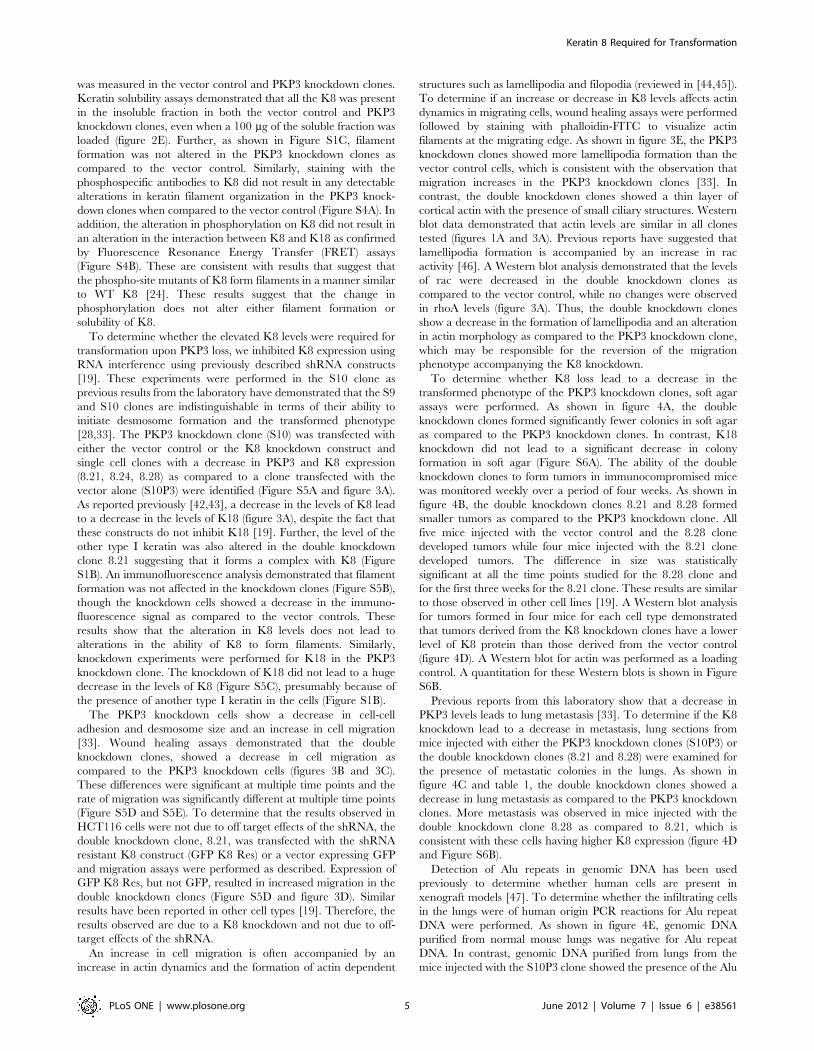
The PKP3 knockdown cells show a decrease in cell-cell
adhesion and desmosome size and an increase in cell migration
[33]. Wound healing assays demonstrated that the double
knockdown clones, showed a decrease in cell migration as
compared to the PKP3 knockdown cells (figures 3B and 3C).
These differences were significant at multiple time points and the
rate of migration was significantly different at multiple time points
(Figure S5D and S5E). To determine that the results observed in
HCT116 cells were not due to off target effects of the shRNA, the
double knockdown clone, 8.21, was transfected with the shRNA
resistant K8 construct (GFP K8 Res) or a vector expressing GFP
and migration assays were performed as described. Expression of
GFP K8 Res, but not GFP, resulted in increased migration in the
double knockdown clones (Figure S5D and figure 3D). Similar
results have been reported in other cell types [19]. Therefore, the
results observed are due to a K8 knockdown and not due to off-
target effects of the shRNA.
An increase in cell migration is often accompanied by an
increase in actin dynamics and the formation of actin dependent
structures such as lamellipodia and filopodia (reviewed in [44,45]).
To determine if an increase or decrease in K8 levels affects actin
dynamics in migrating cells, wound healing assays were performed
followed by staining with phalloidin-FITC to visualize actin
filaments at the migrating edge. As shown in figure 3E, the PKP3
knockdown clones showed more lamellipodia formation than the
vector control cells, which is consistent with the observation that
migration increases in the PKP3 knockdown clones [33]. In
contrast, the double knockdown clones showed a thin layer of
cortical actin with the presence of small ciliary structures. Western
blot data demonstrated that actin levels are similar in all clones
tested (figures 1A and 3A). Previous reports have suggested that
lamellipodia formation is accompanied by an increase in rac
activity [46]. A Western blot analysis demonstrated that the levels
of rac were decreased in the double knockdown clones as
compared to the vector control, while no changes were observed
in rhoA levels (figure 3A). Thus, the double knockdown clones
show a decrease in the formation of lamellipodia and an alteration
in actin morphology as compared to the PKP3 knockdown clone,
which may be responsible for the reversion of the migration
phenotype accompanying the K8 knockdown.
To determine whether K8 loss lead to a decrease in the
transformed phenotype of the PKP3 knockdown clones, soft agar
assays were performed. As shown in figure 4A, the double
knockdown clones formed significantly fewer colonies in soft agar
as compared to the PKP3 knockdown clones. In contrast, K18
knockdown did not lead to a significant decrease in colony
formation in soft agar (Figure S6A). The ability of the double
knockdown clones to form tumors in immunocompromised mice
was monitored weekly over a period of four weeks. As shown in
figure 4B, the double knockdown clones 8.21 and 8.28 formed
smaller tumors as compared to the PKP3 knockdown clone. All
five mice injected with the vector control and the 8.28 clone
developed tumors while four mice injected with the 8.21 clone
developed tumors. The difference in size was statistically
significant at all the time points studied for the 8.28 clone and
for the first three weeks for the 8.21 clone. These results are similar
to those observed in other cell lines [19]. A Western blot analysis
for tumors formed in four mice for each cell type demonstrated
that tumors derived from the K8 knockdown clones have a lower
level of K8 protein than those derived from the vector control
(figure 4D). A Western blot for actin was performed as a loading
control. A quantitation for these Western blots is shown in Figure
S6B.
Previous reports from this laboratory show that a decrease in
PKP3 levels leads to lung metastasis [33]. To determine if the K8
knockdown lead to a decrease in metastasis, lung sections from
mice injected with either the PKP3 knockdown clones (S10P3) or
the double knockdown clones (8.21 and 8.28) were examined for
the presence of metastatic colonies in the lungs. As shown in
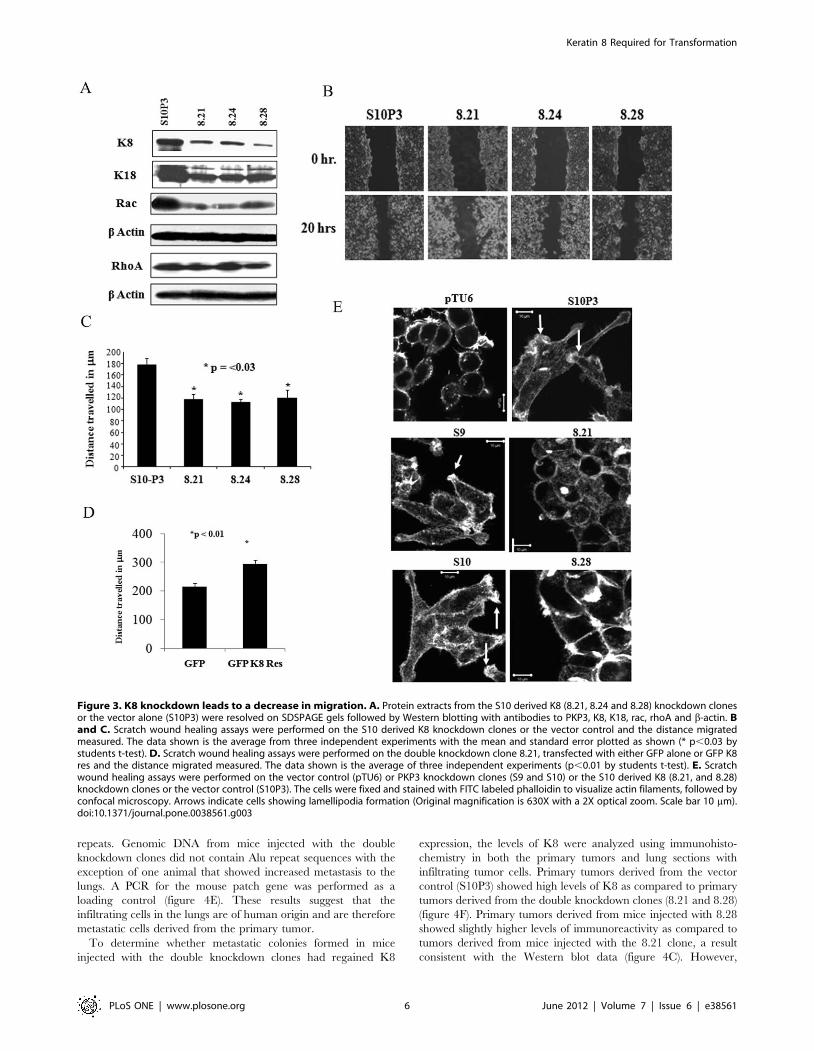
figure 4C and table 1, the double knockdown clones showed a
decrease in lung metastasis as compared to the PKP3 knockdown
clones. More metastasis was observed in mice injected with the
double knockdown clone 8.28 as compared to 8.21, which is
consistent with these cells having higher K8 expression (figure 4D
and Figure S6B).
Detection of Alu repeats in genomic DNA has been used
previously to determine whether human cells are present in
xenograft models [47]. To determine whether the infiltrating cells
in the lungs were of human origin PCR reactions for Alu repeat
DNA were performed. As shown in figure 4E, genomic DNA
purified from normal mouse lungs was negative for Alu repeat
DNA. In contrast, genomic DNA purified from lungs from the
mice injected with the S10P3 clone showed the presence of the Alu
Keratin 8 Required for Transformation
PLoS ONE | www.plosone.org 5 June 2012 | Volume 7 | Issue 6 | e38561
repeats. Genomic DNA from mice injected with the double
knockdown clones did not contain Alu repeat sequences with the
exception of one animal that showed increased metastasis to the
lungs. A PCR for the mouse patch gene was performed as a
loading control (figure 4E). These results suggest that the
infiltrating cells in the lungs are of human origin and are therefore
metastatic cells derived from the primary tumor.
To determine whether metastatic colonies formed in mice
injected with the double knockdown clones had regained K8
expression, the levels of K8 were analyzed using immunohisto-
chemistry in both the primary tumors and lung sections with
infiltrating tumor cells. Primary tumors derived from the vector
control (S10P3) showed high levels of K8 as compared to primary
tumors derived from the double knockdown clones (8.21 and 8.28)
(figure 4F). Primary tumors derived from mice injected with 8.28
showed slightly higher levels of immunoreactivity as compared to
tumors derived from mice injected with the 8.21 clone, a result
consistent with the Western blot data (figure 4C). However,
Figure 3. K8 knockdown leads to a decrease in migration. A. Protein extracts from the S10 derived K8 (8.21, 8.24 and 8.28) knockdown clonesor the vector alone (S10P3) were resolved on SDSPAGE gels followed by Western blotting with antibodies to PKP3, K8, K18, rac, rhoA and b-actin. Band C. Scratch wound healing assays were performed on the S10 derived K8 knockdown clones or the vector control and the distance migratedmeasured. The data shown is the average from three independent experiments with the mean and standard error plotted as shown (* p,0.03 bystudents t-test). D. Scratch wound healing assays were performed on the double knockdown clone 8.21, transfected with either GFP alone or GFP K8res and the distance migrated measured. The data shown is the average of three independent experiments (p,0.01 by students t-test). E. Scratchwound healing assays were performed on the vector control (pTU6) or PKP3 knockdown clones (S9 and S10) or the S10 derived K8 (8.21, and 8.28)knockdown clones or the vector control (S10P3). The cells were fixed and stained with FITC labeled phalloidin to visualize actin filaments, followed byconfocal microscopy. Arrows indicate cells showing lamellipodia formation (Original magnification is 630X with a 2X optical zoom. Scale bar 10 mm).doi:10.1371/journal.pone.0038561.g003
Keratin 8 Required for Transformation
PLoS ONE | www.plosone.org 6 June 2012 | Volume 7 | Issue 6 | e38561
metastatic colonies in the lungs showed equivalent expression of
K8 in mice injected with all three clones (figure 4F). These results
suggest that an increase in K8 expression upon PKP3 knockdown
is required for tumor progression and metastasis. Therefore, it
appears that metastasis to the lungs requires K8 expression as all
the metatstatic colonies in the lungs showed high K8 expression.
Discussion
Loss of the desmosomal plaque protein plakophilin3, leads to an
increase in tumor progression and metastasis [33]. PKP3 loss is
accompanied by an increase in K8 levels due to a decrease in K8
phosphorylation. A shRNA mediated decrease in K8 expression in
the PKP3 knockdown clones leads to a decrease in migration, a
decrease in colony formation in soft agar and decreased tumor size
and metastasis in mice.
PKP3 loss leads to an increase in metastasis to the lungs (figure 4
and [33]). K8 loss led to a decrease in the ability of the PKP3
knockdown clone, S10 to metastasize to the lungs (figure 4 and
table 1). Importantly, most of the metastatic cells observed in mice
injected with the double knockdown clones reacquired K8
expression (figure 4F). The infiltrating cells are of human origin
as they contain Alu repeat DNA (figure 4E). As the infiltrating cells
in the lung express K8 and are of human origin, it strongly
suggests that these represent a metastatic growth from the primary
tumors. The decrease in tumor size and metastasis suggest that K8
is required for transformation downstream of PKP3 loss. PKP3
has been reported to form a complex with K18 (Figure S1 and
[27]), and may play a role in anchoring IF’s to the desmosome
leading to the creation of a tissue wide IF network and improved
mechanical rigidity (reviewed in [3]). In the absence of desmosome
function, it is possible that the IF network is reorganized to
maintain rigidity to permit cell survival. One way to accomplish
this would be to increase filament formation by increasing keratin
stability.
Another possible explanation for why an increase in K8 levels
leads to increased metastasis might be the effect K8 has on cell
migration. Loss of K8 in the PKP3 knockdown clones results in an
inhibition of migration, reversing the phenotype observed upon
PKP3 loss [33]. The observed phenotypes were due to a decrease
in K8 levels as expression of an shRNA resistant K8 cDNA
rescued these phenotypes. K8 loss was accompanied by a decrease
in lamellopodia formation and a decrease in the levels of Rac.
Therefore, the increase in PRL3 levels induced by PKP3 loss
might not only alter the post translational modifications on IF’s but
also lead to alterations in the way IF’s communicate with the actin
cytoskeleton through their effects on integrin signalling as
previously reported [19].
The GFP tagged phosphosite mutants show an increase in
stability in comparison to the GFP tagged WTK8. These results
suggest that the increase in stability observed upon PKP3
knockdown is not due to an increase in translation, given that
the WT and mutant proteins are being expressed from a
heterologous promoter with different 59 and 39 untranslated
regions from the endogenous K8 gene. This is important because
plakophilin family members, including PKP3, have been shown to
regulate translation [48,49]. Treatment of the vector and PKP3
knockdown clones with a PRL3 inhibitor leads to a decrease in K8
levels in both the vector control and knockdown clones, which is
consistent with our observations on the migration phenotypes of
the phospho-site mutants in two-dimensional gels (figure 2).
Consistent with this observation, our data demonstrates that PRL3
protein levels are increased in the PKP3 knockdown clones and
this increase in expression could be reversed by over-expression of
a shRNA resistant PKP3 cDNA (figure 2B). Further, other than a
minor increase in localization at the cell border, no changes in
PRL3 localization or the association of PRL3 with keratin
filaments were observed in these studies.
PRL3 has been reported to dephosphorylate K8 at both S73
and S431 [23]. Given this data, we favour the hypothesis that
PKP3 loss leads to a decrease in the levels of a kinase that
phosphorylates S431 and an increase in PRL3 levels (figures 1 and
2) due to either an alteration in signalling events from the
desmosome [50] or due to the regulation of translation of PRL3 by
PKP3, as PKP3 has been shown to regulate translation [48]. The
increase in PRL3 levels in the PKP3 knockdown clones happens
post-transcriptionally, as PRL3 mRNA levels do not change in the
PKP3 knockdown clones as compared to the vector controls, but
protein levels do go up. Therefore, it is possible that PKP3
regulates the translation of PRL3 with subsequent effects on K8
phosphorylation and stability. Alternatively, PKP3 could positively
regulate the expression of Poly C RNA Binding Protein 1
(PCBP1), which has been shown to inhibit PRL3 translation [51].
It has been reported previously that phosphorylation of keratins
leads to an increase in solubility and filament network disassembly
[37], while dephosphorylation leads to an increased filament
formation and an increase in the insoluble fraction. However, we
do not observe any changes in filament formation and solubility
upon PKP3 knockdown and the subsequent dephoshphorylation
of K8 in HCT116 cells. This could be due to cell type/tissue type
specific effects. Consistent with this hypothesis, Mizuuchi et al.
have not observed any changes in keratin8 organization upon
expression of GFP-tagged PRL-3 in SW480 cells derived from the
colon [23]. Therefore, it is possible that in cell lines derived from
the colon, changes in K8 phosphorylation do not lead to changes
in filament formation or solubility. Similarly, no change in the
localization of phosphorylated K8 (Figure S4A) or the interaction
between K8 and K18 (Figure S4B) were observed in the PKP3
knockdown cells suggesting that loss of PKP3 does not affect
organization of the IF cytoskeleton.
The requirement for an intact filament network for transfor-
mation is supported by the data that knockdown of K18 does not
phenocopy K8 knockdown, which might be due to the fact that
another type I keratin is present in these cells (Figure S1B). The
increase in these biochemical properties is also accompanied by an
increase in transformation potential, as observed upon an increase
in PRL3 expression [23]. In agreement with these previously
published observations, an increase in PRL3 expression was
observed upon PKP3 knockdown and inhibition of PRL3 activity
lead to a decrease in K8 levels in the experiments described in this
report. We were unable to determine if the chemical inhibitor of
PRL3 could inhibit transformation as incubation of these cells with
Table 1. PKP3 CK8 double knockdown clones show adecrease in lung metastasis.
Number of mice with
Clone No metastasis ,30% metastasis .30% metastasis
S10P3 0 0 5
8.21 2 2 1
8.28 0 2 3
Hematoxylin-eosin stained sections of lungs from mice injected with theindicated clones were examined for the presence of infiltrating tumor cells andthe percentage of area occupied by the tumor cells determined microscopically.Five mice were tested for each clone.doi:10.1371/journal.pone.0038561.t001
Keratin 8 Required for Transformation
PLoS ONE | www.plosone.org 7 June 2012 | Volume 7 | Issue 6 | e38561
Keratin 8 Required for Transformation
PLoS ONE | www.plosone.org 8 June 2012 | Volume 7 | Issue 6 | e38561
the PRL3 inhibitor for greater than 72 hours led to cell death (data
not shown) and we were unable to generate clones with a double
knockdown of PKP3 and PRL3 (Figure S3D). Further, another
report from our laboratories demonstrates that dephosphorylation
of K8 correlates with increased metastasis in human oral
squamous cell carcinoma and leads to increased transformation
in vivo and in vitro [24]. Taken together these results suggest that
alterations in K8 phosphorylation could lead to tumor progression
and increased metastasis.
The results described herein suggest that PKP3 loss leads to
alterations in phosphorylation on K8, due to an increase in PRL3
levels. These result in increased K8 levels which promote
increased migration, transformation and metastasis. Loss of K8
in the PKP3 knockdown clones leads to a reversal of these
phenotypes, suggesting that an increase in K8 levels is required for
the neoplastic progression and metastasis induced upon PKP3 loss.
These results in conjunction with our data on the levels of
phosphorylated keratin in human oral squamous cell carcinoma
[24] suggest that post translational modifications on keratins could
be important predictors of metastatic disease.
Materials and Methods
Ethics StatementMaintenance of the animal facility is as per the national
guidelines provided by the Committee for the Purpose of Control
and Supervision of the Experiments on Animals (CPCSEA),
Ministry of Environment and Forest, Government of India. The
animals were housed in a controlled environment with the
temperature and relative humidity being maintained at 2362uCand 40–70% respectively and a day night cycle of 12 hrs each
(7:00 to 19:00 light; 19:00 to 7:00 dark). The animals were
received an autoclaved balanced diet prepared in-house as per the
standard formula and sterile water ad libitum. Mice were housed in
the Individually Ventilated Cage (IVC) system (M/S Citizen,
India) provided with autoclaved rice husk bedding material
available locally. Protocols for the experiments were approved
by the Institutional Animal Ethics Committee (IAEC) of the
Advanced Centre for Treatment Reserach and Education in
Cancer (ACTREC). The title of the project is ‘‘Mechanisms
underlying tumor progression upon PKP3 loss in epithelial cells.’’
Table 2. Oligonucleotides used for cloning, genomic PCRs and reverse transcriptase PCR reactions.
Construct Oligonucleotides
K8.1 59 ccggcagcagcaactttcgcggtaagttctctaccgcgaaagttgctgctgccttttttc 39 and 59
tcgagaaaaaaggcagcagcaactttcgcggtagagaacttaccgcgaaagttgctgctg 39
K8.2 59 ccggcatcaccgcagttacggtcaaagttctcttgaccgtaactgcggtgatgccttttttc39 and 59
tcgagaaaaaaggcatcaccgcagttacggtcaagagaactttgaccgtaactgcggtgatg 39
K8.3 59 ccggagagctggccattaaggataagttctctatccttaatggccagctctccttttttc 39 and 59
tcgagaaaaaaggagagctggccattaaggatagagaacttatccttaatggccagctct 93
Alu 59 59 acg cct gta atc cca gca ctt 39
Alu 39 59 tcg ccc agg ctg gag tgc a 39
Ptc 59 59 ctgcggcaagtttttggttg 39
Ptc 39 59 agggcttctcgttggctacaag 39
PRL3 FWD 59 gagctacaaacacatgcgc 39
PRL3 REV 59 gaacttggccttcaccaggctca 39
PRL3shRNA a 59ccggaacagcaagcagctcacctacctcgaggtaggtgagctgcttgctgtttttttg39
PRL3shRNA b 59aattcaaaaaaacagcaagcagctcacctacctcgaggtaggtgagctgcttgctgtt39
doi:10.1371/journal.pone.0038561.t002
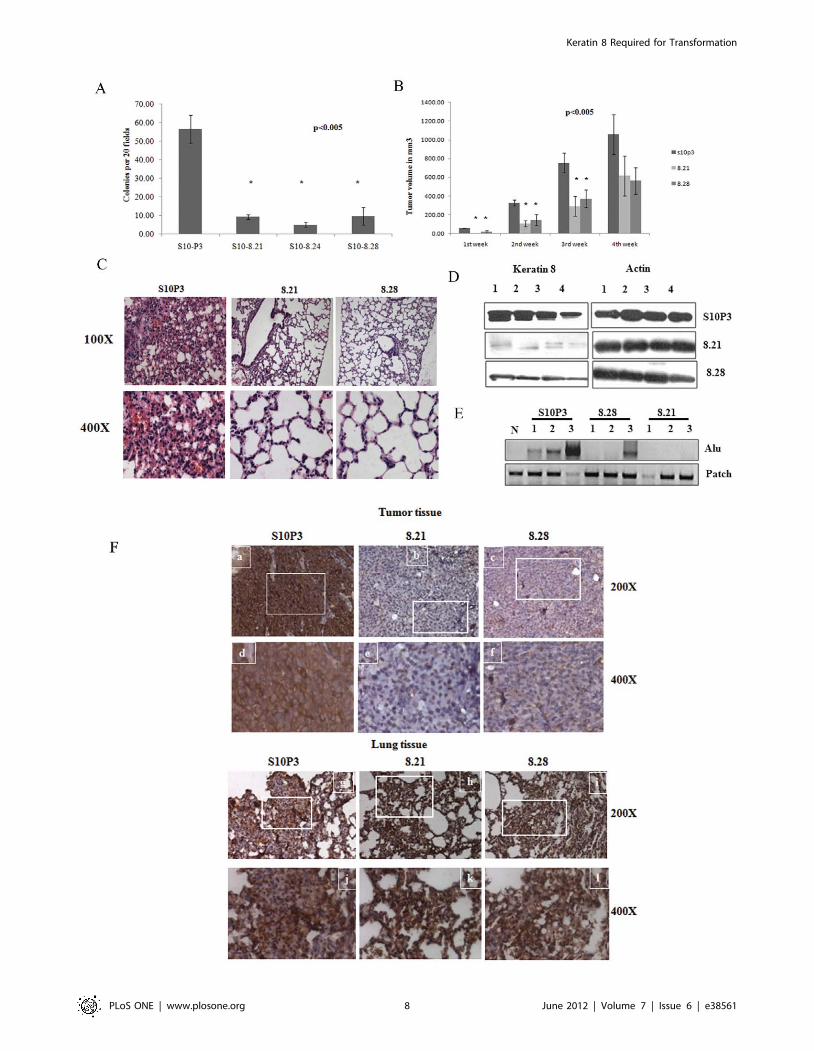
Figure 4. K8 downregulation leads to an inhibition of transformation in vitro and in vivo. A. The S10 derived K8 (8.21, 8.24 and 8.28)knockdown clones or the vector alone (S10P3) were plated in soft agar and colony formation determined after 2–3 weeks. The number of coloniesformed by the clones per 20 low power fields (10X) was counted in triplicate in each experiment and the mean and standard deviation of threeindependent experiments is plotted as shown. B. 106 cells from the S10 derived K8 (8.21 and 8.28) knockdown clones or the vector alone (S10P3)were injected subcutaneously into 5 different nude mice and tumor size determined every week as described. Tumor volume is plotted on the Y-axisand the time in weeks on the X-axis. C. Protein extracts from primary tumors from mice injected with the S10 derived K8 (8.21 and 8.28) knockdownclones or the vector alone (S10P3) were resolved on SDS-PAGE gels followed by Western blotting with antibodies to K8 and b-actin. The numbersindicate different mice injected with the single or double knockdown clones. All the samples were run on the same gel and the Western blotsperformed at the same time. D. Haematoxylin and eosin staining of paraffin embedded sections of lung tissue from nude mice injected with 106 cellsof the vector alone (S10P3) or the double knockdown clones (8.21 and 8.28). Lung section from mice injected with S10P3 cells show extensivemetastasis with thickening of alveolar walls from deposition and aggregation of metastasized tumor cells, whereas lungs from mice injected with thedouble knockdown cells show normal lungs with thin walled alveoli, with a few metastatic tumor cells. The images in the top row are atmagnification x100 and images in the bottom row are at magnification x 400. E. PCR reactions were performed on DNA isolated from paraffinsections for the presence of Alu repeats in genomic DNA. Genomic DNA was purified from normal lung tissue, lung tissue from mice injected withcells with PKP3 knockdown alone (S10P3) and lung tissue from mice injected with the double knockdown clones (8.21 and 8.28). Lung tissues fromuninjected mice (N) were used as a negative control for the Alu PCR. A PCR for the mouse patch gene was performed as a loading control. F.Immunohistochemical staining was performed with antibody against K8 on sections of paraffin embedded tissue of tumor and lungs of mice injectedwith S10P3 vector control cells or the double knockdown clones, 8.21 and 8.28. Images a, b, c, g, h and i are taken at a magnification x 200 and therespective magnified images at magnification x 400, of the indicated areas in the white rectangles, are represented by images d, e, f, j, k and l. Tumortissue from mice injected with S10P3 (a and d) show K8 staining at levels higher compared to tumors from mice injected with the double knockdownclones, 8.21 and 8.28 (b, c, e and f). In contrast lung tissue, from mice injected with the vector control S10P3 cells (g and j) and the double knockdownclones (8.21 and 8.28) (h, i, k and l) show elevated K8 staining in metastatic areas of the lungs with infiltrated tumor cells.doi:10.1371/journal.pone.0038561.g004
Keratin 8 Required for Transformation
PLoS ONE | www.plosone.org 9 June 2012 | Volume 7 | Issue 6 | e38561

The project approval number is 13/2007 and approval was
granted on the 27th of July, 2007.
Plasmids and ConstructsThe cloning of K8 shRNA constructs and the shRNA resistant
K8 (GFP K8 Res) has been described elsewhere [19]. The
phosphosite mutants S73A and S431A [37,52] were a kind gift of
Dr. Normand Marceau and were cloned downstream of GFP in a
manner similar to the WT K8 construct. To generate plasmid
based shRNA constructs targeting PRL-3, the oligonucleotide
pairs listed in table 2 were cloned into Age1-EcoR1 digested
pLVU6 plasmid, downstream of the U6 promoter. To generate
GFP tagged PRL-3, PRL-3 was PCR amplified from eukaryotic
cDNA library as a BamH1-Xho1 fragment and cloned into EGFP-
f N1 (Clontech), digested with BglII-Xho1, which resulted in the
deletion of the farnesylation signal.
Cell Lines and TransfectionsHCT116 cells, an epithelial cell line derived from a human
colorectal carcinoma, were obtained from Dr. Bert Vogelstein
([53] and ATCC). The HCT116 derived PKP3 knockdown clones
were cultured as described previously [33]. Cells were transfected
by calcium phosphate precipitation protocol as described [54]. To
generate K8 PKP3 double knockdown clones, the previously
described HCT116 derived plakophilin3 knockdown clone S10
[28,33], was transfected with 3 mg of the K8.2 shRNA construct
and selected in medium containing 0.5 mg/ml of puromycin
(Sigma) to generate single-cell clones. To determine the contribu-
tion of K8 phosphorylation to K8 stability, 3 mg of WT K8 or the
phosphosite mutants were transfected into HCT116 cells in a
35 mm dish as described [33]. To perform the rescue experiments,
3 mg of EGFPN1 (Clonetech) or GFP K8 Res were transfected
into the double knockdown clone. 48 hours post transfection the
cells were processed for cell-cell adhesion assays and for wound
healing assays as described below. The PRL3 inhibitor (Sigma
P0108) dissolved in DMSO was added to cells for 48 hours before
extracts were prepared for Western blotting.
High Salt Keratin ExtractionThe high salt extraction for keratins was performed as
previously described [40]. Briefly, HCT 116 cells were trypsinized
and lysed in detergent buffer (10 mM Tris pH 7.6, 140 mM Nacl,
5 mM EDTA, 1% Triton X-100) with protease inhibitors and
incubated for 30 minutes on ice. The lysates were cleared by
centrifugation and suspended in high salt buffer (10 mM Tris
pH 7.6, 140 mM Nacl, 1.5 M KCl 0.5% TritonX-100) with
protease inhibitors and stirred for 1–3 hours at 4uC. The insoluble
material was washed thrice in 10 mM Tris pH 7.6, the pellet
suspended in 2% SDS and 50 mg of protein loaded on SDS-PAGE
gels followed by staining with coomassie brilliant blue.
Antibodies, Western Blotting and Solubility AssaysThe primary antibodies for PKP3 (clone 23E3-4, Zymed,
dilution 1:1000), b Actin (mouse monoclonal, Sigma, dilution
1:5000), K8 (Sigma, dilution 1:5000), K18 (Sigma, dilution
1:5000), phosphospecific antibodies for K8 Serine 73 (mouse
monoclonal Lifespan Biosciences, dilution 1:2000) or Serine 431
(rabbit polyclonal Abcam, dilution 1:5,000), p38 (Santa Cruz,
dilution 1:500), rac (Cell Signalling 1:500) rhoA (Cell Signalling
1:500) and PRL3 (Abcam 1:500) were used for Western blot
analysis. Respective secondary antibodies were used at a dilution
of 1:1000 (Invitrogen) or 1:5000 (Pierce). Protein samples were
resolved on a polyacrylamide gel by SDS PAGE and then
transferred to a nitro cellulose or PVDF membranes and
processed for Western blot analysis as described [55]. Keratin
solubility assays were performed as described [56], except that the
soluble fraction was obtained by lysing the cells in 1% NP-40 in 1
X PBS and the 1% NP-40 insoluble fraction was dissolved in 1%
SDS.
FRET AssaysThe HCT116-derived PKP3 knockdown clone S9 and S10 and
the vector control were grown on glass bottom plates and co-
transfected with constructs expressing YFP K18 and CFP K8. 24
hours post transfection the cells were fed with DMEM lacking
phenol red and placed on ice for 10 minutes prior to FRET to
minimize mobility of the cells. FRET measurements were done
using the acceptor photobleaching method in live cells [57]. FRET
Calculations were performed using the following formula.
FRET efficiency = (Dpost2Bpost)2(Dpre2Bpre)/(Dpost2Bpost).
The nomenclature and equations for FRET calculations and
the FRET protocol was obtained from the Centre for Optical
Instrumentation Laboratory, Wellcome Trust Center for Cell
Biology, University of Edinburgh.
Wound Healing AssaysWound healing assays were performed as previously described
[33]. Cells were observed by time lapse microscopy and images
were taken every 5 minutes for 20 hours using an AxioCam MRm
camera with a 10 X phase 1 objective. Migration was measured
using Axiovision software version 4.5 (Zeiss). Similar experiments
were performed to compare the migratory properties of PKP3 K8
double knockdown clones transfected with either GFP or GFP K8
Res.
Immunofluorescence and Confocal MicroscopyStaining for K8 was performed as described [18] using the K8
monoclonal antibody (Sigma, dilution 1:200). Filamentous actin
was visualized by staining with a FITC-phalloidin conjugate
(Sigma, dilution 1:20) according to the manufacturer’s instruc-
tions. Staining for PRL3 was performed using PRL3 antibody
(Abcam, dilution1:50). Confocal images were obtained with a
LSM 510 Meta Carl Zeiss Confocal system with an Argon 488 nm
and Helium/Neon 543 nm lasers. All images were obtained using
an Axio Observer Z.1 microscope (numerical aperture [NA] 1.4)
at a magnification of X 630 with 2X optical zoom.
Soft Agar AssaysThe knockdown clones were trypsinized and counted. 2,500
cells were plated in 0.4% soft agarose and the cells were
maintained in the presence of the relevant antibiotic as previously
described [58]. After 2–3 weeks, the number of colonies was
counted in triplicate. Three independent experiments were
performed for each clone analyzed.
Tumor Formation in Nude MiceNude mice experiments were performed as described [33]. All
animal studies were approved by the Institutional Animal Ethics
committee constituted under the guidelines of the CPCSEA,
Government of India. 106 cells of the HCT116 derived PKP3
knockdown or K8 PKP3 double knockdown clones were
resuspended in DMEM medium without serum and injected
subcutaneously in the dorsal flank of 6–8 weeks old NMRI Nude
(Nu/Nu) [59] (obtained from ACTREC animal house facility).
Five mice were injected for each clone. Tumor formation was
Keratin 8 Required for Transformation
PLoS ONE | www.plosone.org 10 June 2012 | Volume 7 | Issue 6 | e38561
monitored at intervals of 2–3 days and tumor size was measured
by a vernier calipers. Tumor volume (mm3) was calculated by the
formula K LV2 where L is the largest dimension and V its
perpendicular dimension, as previously reported [59,60].
Histology and ImmunohistochemistryFour weeks after subcutaneous injection, the mice were
sacrificed and the tumor and lung tissues were fixed in 10%
formaldehyde (SIGMA) overnight and processed for histology.
Five micron sections of paraffin embedded tissue were prepared
and hematoxylin/eosin staining and immunohistochemical stain-
ing was performed according to standard methods [61]. The
degree of metastasis was determined by examining three lung
sections per mouse and visualizing the area of alveolar tissue that
was filled with metastatic colonies. Permeabilization for antigen
retrieval was performed by microwaving the fixed tissue sections in
10 mM Tris buffer (pH 9) with 2 mM EDTA.
Genomic PCR for Identification of Alu RepeatsGenomic DNA was purified from paraffin sections as previously
described [62]. 100ng and 200ng DNA were used as templates for
amplification of the patch and Alu products respectively. The
oligonucleotides used to amplify the Alu repeats and the patch
gene are listed in table 2. Polymerase chain reactions for Alu
repeats were performed as previously described [47].
Reverse Transcriptase and Real Time PCR AnalysisTotal RNA was extracted from the HCT116 derived vector
control (pTU6) and PKP3 knockdown clones (S9, S10 and S17)
using Qiagen RNeasy kit and reverse transcribed using the
Omniscript RT kit (Qiagen) as per the manufacturers instructions.
PCR reactions for PKP3, PRL3 and GAPDH were performed on
the cDNA using Taq polymerase (NEB) as per the manufacturers
instructions. Real time PCR analysis using TaqMan gene
expression assays (Applied Biosystems) were performed using gene
specific probes for K8 and K18 from Applied Biosystems. A
similar assay for GAPDH was performed to serve as an internal
control for normalization. Fold changes in expression of K8 and
K18 in the plakophilin3 knockdown clones were calculated
relative to the expression levels in the pTU6 vector control cells
as described previously [63,64].
Two Dimensional Gel ElectorphoresisProtein extracts were resolved on a ReadyStrip IPG strip
(BioRad) pH range 5–8 according to the instructions supplied by
the manufacturer. The proteins were then resolved in the second
dimension on 10% SDS-PAGE gels followed by Western blotting
with antibodies to K8.
Immunoprecipitations and Glycosylation AssaysTo detect the interaction between K18 and plakophilin3, HCT-
116 cells were lysed with EBC buffer (50 mM Tris HCL PH 8.0,
125 mM NaCl, 0.5% NP40 with protease inhibitor cocktail,
1 mM Na3Vo4, 50 mM Na-F ) and lysates were immunoprecip-
itated with anti K18 antibody. The immunoprecipitates were
washed with NET-N buffer (20 mM Tris-HCL PH 8.0, 100 mM
NaCl, EDTA PH 8.0, 0.5% NP40) for 3 times and run on SDS
polyacrylamide gel electrophoresis followed by Western blots with
antibodies to PKP3 and K18. The levels of O-linked N-
acetylglucosamine (O-GlcNAc) on K8 were determined as
previously described [40]. K8 was immunoprecipitated from
Empigen lysates prepared from the vector control and PKP3
knockdown clones. The reactions were resolved on SDS PAGE
followed by Western blots with antibodies to K8 or O-GlcNAc
(ABR 1:3000).
Statistical AnalysisError bars represent standard error. Statistical analysis was
performed using two tailed students t test.
Supporting Information
Figure S1 K8 and K18 organization in PKP3 knockdowncells. A. K18 forms a complex with PKP3 in HCT116 cells. EBC
extracts prepared from HCT116 cells were incubated with a
control antibody (IgG) or antibodies to K18 (K18). The reactions
were resolved on SDS-PAGE gels and Western blots performed
with antibodies to PKP3 and K18. (WCE = Whole cell extract.
IP = Immunoprecipitation) B. K8 and K18 levels are altered upon
PKP3 knockdown. High salt extracts from the vector control
(pTU6) and PKP3 knockdown clones (S9 and S10) and the PKP3
and K8 double knockdown clone (8.21) were resolved on SDS-
PAGE gels and the gel stained with coomassie blue to identify
keratin bands. C. K8 and K18 form filaments in the PKP3
knockdown clones. The PKP3 knockdown clones or the vector
control, were stained with antibodies against K8 or K18 (Original
magnification x 630 with 2X optical zoom. Scale bar 5 mm). D.
Vimentin levels are not altered upon PKP3 knockdown. Protein
extracts from the vector control (pTU6), the PKP3 knockdown
clones (S9, S10 and S10P3) and the double knockdown clones
(8.21, 8.24 and 8.28) were resolved on SDS-PAGE gels followed
by Western blotting with antibodies to vimentin. None of the
clones showed the presence of vimentin. AW13516 cells served as
a positive control and a Western blot for actin served as a loading
control.
(TIF)
Figure S2 Post-translational modifications on K8 andK18 upon PKP3 knockdown. A. Migration of K18 in two-
dimensional gel electrophoresis. Protein extracts from the vector
control and PKP3 knockdown clones were resolved in two
dimensional gels followed by Western blotting with antibodies to
K18. Note that the levels of K18 are higher in the PKP3
knockdown clones but no difference in migration in two-
dimensional gel electrophoresis was observed for K18. B.
Densitometric analysis of K8 and phospho-K8 expression in the
vector control and PKP3 knockdown clones. Expression of K8,
phosphor-S73 and phosphor-S431 was normalized to that of b-
actin and densitometry performed on Western blots using ImageJ
software. The values for these are shown in the vector control
(pTU6) and PKP3 knockdown clones (S9 and S10) as indicated. C.
Testing the specificity of K8 phosphospecific antibodies. GFP
tagged WTK8 or the phosphomutants (S73A and S431A) were
transfected into HCT116 cells. 48 hours post transfection, protein
extracts were resolved on SDS PAGE gels followed by Western
blotting with either antibodies that recognize K8 or the phosphor-
specific antibodies. Note that the phospho-specific antibodies do
not recognize the phosphor-mutant constructs. D. p38 levels are
not altered in the PKP3 knockdown clones. Protein extracts from
the PKP3 knockdown clones or the vector control were resolved
on SDSPAGE gels followed by Western blotting with antibodies to
p38. Western blots for 14-3-3c were performed as a loading
control. E. O-linked glycosylation on K8 is not altered in the
PKP3 knockdown clones. Protein extracts from the PKP3
knockdown clones or the vector control were immunoprecipitated
with antibodies to K8 followed by Western blots with antibodies
recognizing O-GlcNAc glycosylation or K8.
(TIF)
Keratin 8 Required for Transformation
PLoS ONE | www.plosone.org 11 June 2012 | Volume 7 | Issue 6 | e38561
Figure S3 PRL3 localization in PKP3 knockdown cells.A. PRL3 localization in PKP3 knockdown cells. The vector
control (pTU6) or PKP3 knockdown clones (S9 and S10) were
stained with antibodies to PRL3 and imaged by confocal
microscopy. Note that PRL3 levels increase in the PKP3
knockdown clones with an increase in perinuclear localization
and a slight increase in staining at the cell border. (Original
magnification x 630 with 2X optical zoom. Scale bar 5 mm). B.
GFP-PRL3 colocalizes with endogenous PRL3. HCT116 cells
were transfected with GFP-PRL3. The cells were fixed and stained
with antibodies to PRL-3 and visualized by confocal microscopy.
Note that the GFP-PRL3 signal overlaps with the endogenous
PRL3 signal. (Original magnification x 630 with 2X optical zoom.
Scale bar 5 mm). C. Inhibition of PRL3 results in a decrease in
migration. Scratch wound healing assays were performed in the
absence (dark grey bars) or presence (light grey bars) of a PRL3
inhibitor. The distance migrated is graphed on the Y-axis. The bar
represents an average of three different experiments and the bars
represent the standard deviation. Note that PRL3 inhibition
resulted in a significant decrease in migration in all cell types.
Statistical analysis was performed using two tailed students t test.
D. Identification of an shRNA that inhibits PRL3 expression.
HEK293 cells were transfected with GFP-PRL3 with the vector
control or a vector expressing the PRL3 shRNA. Extracts from
untransfected HEK293 cells served as controls. 60 hours post
transfection, protein extracts were resolved on SDS-PAGE gels
followed with Western blots with antibodies to GFP. Note that
GFP-PRL3 expression is observed in the vector control but not in
cells transfected with the shRNA expressing vector. Western blots
for actin served as a loading control. E. Identification of PKP3 and
PRL3 double knockdown clones. The PKP3 knockdown clone
S10, was transfected with either the vector control (vector) or a
construct expressing an shRNA targeting PRL3 (PRL3 KD).
Stable clones were generated followed by Western blotting with
antibodies to PRL3. Note that PRL3 levels were comparable
between the cells transfected with the vector control and the PRL3
KD construct. Western blots for b-actin served as a loading
control.
(TIF)
Figure S4 K8 and K18 filament formation in PKP3knockdown clones. A. Localization of phosphorylated K8 in
PKP3 knockdown clones. The vector control (pTU6) or PKP3
knockdown clones (S9 and S10) were stained with phospho-
specific antibodies to PRL3 (S73 and S431) and imaged by
confocal microscopy. Note that the intensity of the signal for pS73
increases due to an increase in K8 levels in the PKP3 knockdown
clones while the intensity of the signal for pS431 remains the same
in the PKP3 knockdown clones. (Original magnification x 630
with 2X optical zoom. Scale bar 5 mm). B. The interaction
between K8 and K18 is not altered upon PKP3 knockdown. The
vector control (pTU6) or PKP3 knockdown clones (S9 and S10)
were transfected with YFP-K18 and CFP-K8. 48 hours post
transfection, FRET experiments were performed as described.
The region in the white rectangle was bleached in the YFP
channel and a corresponding increase was observed in the CFP
channel as expected. FRET efficiencies were calculated for 5
different regions in three cells and results plotted in a bar graph.
The FRET efficiency for the K18 K8 pair is comparable between
the vector control and the PKP3 knockdown clones as shown in
the graph.
(TIF)
Figure S5 Characterization of K8 and PKP3 doubleknockdown clones. A. Generation of PKP3 and K8 double
knockdown clones. Protein extracts from the S10 derived K8
(8.21, 8.24 and 8.28) knockdown clones or the vector alone
(S10P3) or the vector control (pTU6) were resolved on SDSPAGE
gels followed by Western blotting with antibodies to PKP3 and b-
actin. B. The PKP3 K8 double knockdown clones or the PKP3
knockdown clone, were stained with antibodies against K8
(Original magnification x 630 with 2X optical zoom. Scale bars
5 mm). C. Protein extracts from the S10 derived K8 (8.21 and
8.28) or K18 knockdown clones (18.22 and 18.23) or the vector
alone (S10P3) were resolved on SDSPAGE gels followed by
Western blotting with antibodies to K8, K18, and b-actin. Note
that K18 levels are low in the K8 knockdown clones while K8
levels are not altered substantially in the K18 knockdown clones.
D. Scratch wound healing assays were performed on the double
knockdown clones (8.21, 8.24 and 8.28) or the vector alone
(S10P3). At different time points the distance migrated was
measured and plotted as shown. The bars represent the mean of
three independent experiments and the error bars represent the
standard deviation. Statistical analysis was performed using two
tailed students t test. Note that the distance migrated is
significantly lowered in the double knockdown clones at 10, 15
and 20 hour time points. E. Scratch wound healing assays were
performed on the double knockdown clones (8.21, 8.24 and 8.28)
or the vector alone (S10P3). At different time points the distance
migrated per minute was measured and plotted as shown. The
bars represent the mean of three independent experiments and the
error bars represent the standard deviation. Statistical analysis was
performed using two tailed students t test. Note that the distance
migrated is significantly lowered in the double knockdown clones
at 10, 15 and 20 hour time points. F. Scratch wound healing assays
were performed on the double knockdown clones 8.21, transfected
with either GFP alone or GFP K8 res.
(TIF)
Figure S6 Transformation induced upon keratin loss inthe PKP3 knockdown clones. A. The S10 derived K18 (18.22
and 18.23) knockdown clones or the vector alone (S10P3) were
plated in soft agar and colony formation determined after 2–3
weeks. The number of colonies formed by the clones per 20 low
power fields (10X) was counted in triplicate in each experiment
and the mean and standard deviation of three independent
experiments is plotted as shown. B. Densitometric analysis of K8
in tumor samples. Protein extracts derived from tumors generated
upon injection of either the vector control (S10P3) or the double
knockdown clones 8.21 and 8.28) were resolved on SDS PAGE
gels followed by Western blotting Expression of K8 was
normalized to that of b-actin and densitometry performed on
Western blots using ImageJ software. Note that K8 levels are lower
in the double knockdown clones when compared to the vector
control.
(TIF)
Acknowledgments
We thank the ACTREC confocal facility for help with acquiring the
confocal images, Dr. N. Marcaeu for the gift of the K8 phospho-site
mutants and Dr. R. Kalraiya and B. Srikanth for help with the
glycosylation experiments.
Author Contributions
Conceived and designed the experiments: NK LS STK HA NN MMV
SND. Performed the experiments: NK STK LS RP MS PG HA MK NG.
Analyzed the data: NK STK LS NN MMV SND. Wrote the paper: NK
STK LS SND.
Keratin 8 Required for Transformation
PLoS ONE | www.plosone.org 12 June 2012 | Volume 7 | Issue 6 | e38561
References
1. Garrod D, Chidgey M (2007) Desmosome structure, composition and function.
Biochim Biophys Acta.
2. Garrod DR, Merritt AJ, Nie Z (2002) Desmosomal adhesion: structural basis,molecular mechanism and regulation (Review). Mol Membr Biol 19: 81–94.
3. Green KJ, Gaudry CA (2000) Are desmosomes more than tethers for
intermediate filaments? Nat Rev Mol Cell Biol 1: 208–216.
4. Hesse M, Zimek A, Weber K, Magin TM (2004) Comprehensive analysis ofkeratin gene clusters in humans and rodents. Eur J Cell Biol 83: 19–26.
5. Schweizer J, Bowden PE, Coulombe PA, Langbein L, Lane EB, et al. (2006)
New consensus nomenclature for mammalian keratins. J Cell Biol 174: 169–174.
6. Franke WW, Schiller DL, Hatzfeld M, Winter S (1983) Protein complexes ofintermediate-sized filaments: melting of cytokeratin complexes in urea reveals
different polypeptide separation characteristics. Proc Natl Acad Sci U S A 80:7113–7117.
7. Steinert PM, Gullino MI (1976) Bovine epidermal keratin filament assembly in
vitro. Biochem Biophys Res Commun 70: 221–227.
8. Steinert PM, Idler WW, Zimmerman SB (1976) Self-assembly of bovineepidermal keratin filaments in vitro. J Mol Biol 108: 547–567.
9. Hendrix MJ, Seftor EA, Chu YW, Trevor KT, Seftor RE (1996) Role of
intermediate filaments in migration, invasion and metastasis. Cancer MetastasisRev 15: 507–525.
10. Moll R, Franke WW, Schiller DL, Geiger B, Krepler R (1982) The catalog of
human cytokeratins: patterns of expression in normal epithelia, tumors andcultured cells. Cell 31: 11–24.
11. Clausen H, Vedtofte P, Moe D, Dabelsteen E, Sun TT, et al. (1986)
Differentiation-dependent expression of keratins in human oral epithelia.J Invest Dermatol 86: 249–254.
12. Larcher F, Bauluz C, Diaz-Guerra M, Quintanilla M, Conti CJ, et al. (1992)
Aberrant expression of the simple epithelial type II keratin 8 by mouse skincarcinomas but not papillomas. Mol Carcinog 6: 112–121.
13. Oshima RG, Baribault H, Caulin C (1996) Oncogenic regulation and function
of keratins 8 and 18. Cancer Metastasis Rev 15: 445–471.
14. Vaidya MM, Borges AM, Pradhan SA, Bhisey AN (1996) Cytokeratinexpression in squamous cell carcinomas of the tongue and alveolar mucosa.
Eur J Cancer B Oral Oncol 32B: 333–336.
15. Ku NO, Liao J, Chou CF, Omary MB (1996) Implications of intermediatefilament protein phosphorylation. Cancer Metastasis Rev 15: 429–444.
16. Schaafsma HE, Van Der Velden LA, Manni JJ, Peters H, Link M, et al. (1993)
Increased expression of cytokeratins 8, 18 and vimentin in the invasion front ofmucosal squamous cell carcinoma. J Pathol 170: 77–86.
17. Fillies T, Werkmeister R, Packeisen J, Brandt B, Morin P, et al. (2006)
Cytokeratin 8/18 expression indicates a poor prognosis in squamous cellcarcinomas of the oral cavity. BMC Cancer 6: 10.
18. Raul U, Sawant S, Dange P, Kalraiya R, Ingle A, et al. (2004) Implications of
cytokeratin 8/18 filament formation in stratified epithelial cells: induction oftransformed phenotype. Int J Cancer 111: 662–668.
19. Alam H, Kundu ST, Dalal SN, Vaidya MM (2011) Loss of keratins 8 and 18
leads to alterations in alpha6beta4-integrin-mediated signalling and decreased
neoplastic progression in an oral-tumour-derived cell line. J Cell Sci 124: 2096–2106.
20. Bardelli A, Saha S, Sager JA, Romans KE, Xin B, et al. (2003) PRL-3 expression
in metastatic cancers. Clin Cancer Res 9: 5607–5615.21. Saha S, Bardelli A, Buckhaults P, Velculescu VE, Rago C, et al. (2001) A
phosphatase associated with metastasis of colorectal cancer. Science 294: 1343–
1346.22. Wang H, Quah SY, Dong JM, Manser E, Tang JP, et al. (2007) PRL-3 down-
regulates PTEN expression and signals through PI3K to promote epithelial-
mesenchymal transition. Cancer Res 67: 2922–2926.
23. Mizuuchi E, Semba S, Kodama Y, Yokozaki H (2009) Down-modulation ofkeratin 8 phosphorylation levels by PRL-3 contributes to colorectal carcinoma
progression. Int J Cancer 124: 1802–1810.
24. Alam H, Gangadaran P, Bhate AV, Chaukar DA, Sawant SS, et al. (2011) Lossof Keratin 8 phosphorylation leads to increased tumor progression and
correlates with clinico-pathological parameters of OSCC patients. PLoS OneManuscript accepted.
25. Bonne S, van Hengel J, Nollet F, Kools P, van Roy F (1999) Plakophilin-3, a
novel Armadiilo-like protein present in nuclei and desmosomes of epithelial cells.J Cell Sci 112: 2265–2276.
26. Schmidt A, Langbein L, Pratzel S, Rode M, Rackwitz H-R, et al. (1999)
Plakophilin 3 - a novel cell type specific desmosomal plaque protein.Differentiation 64: 291–306.
27. Bonne S, Gilbert B, Hatzfeld M, Chen X, Green KJ, et al. (2003) Defining
desmosomal plakophilin-3 interactions. J Cell Biol 161: 403–416.
28. Gosavi P, Kundu ST, Khapare N, Sehgal L, Karkhanis MS, et al. (2011) E-cadherin and plakoglobin recruit plakophilin3 to the cell border to initiate
desmosome assembly. Cell Mol Life Sci 68: 1439–1454.
29. Chidgey M, Dawson C (2007) Desmosomes: a role in cancer? Br J Cancer 96:1783–1787.
30. Aigner K, Descovich L, Mikula M, Sultan A, Dampier B, et al. (2007) The
transcription factor ZEB1 (deltaEF1) represses Plakophilin 3 during humancancer progression. FEBS Lett.
31. Papagerakis S, Shabana AH, Depondt J, Gehanno P, Forest N (2003)
Immunohistochemical localization of plakophilins (PKP1, PKP2, PKP3, and
p0071) in primary oropharyngeal tumors: correlation with clinical parameters.
Hum Pathol 34: 565–572.
32. Schwarz J, Ayim A, Schmidt A, Jager S, Koch S, et al. (2006) Differential
expression of desmosomal plakophilins in various types of carcinomas:
correlation with cell type and differentiation. Hum Pathol 37: 613–622.
33. Kundu ST, Gosavi P, Khapare N, Patel R, Hosing AS, et al. (2008) Plakophilin3
downregulation leads to a decrease in cell adhesion and promotes metastasis.
Int J Cancer 123: 2303–2314.
34. Krubasik D, Iyer NG, English WR, Ahmed AA, Vias M, et al. (2006) Absence of
p300 induces cellular phenotypic changes characteristic of epithelial to
mesenchyme transition. Br J Cancer 94: 1326–1332.
35. Roger L, Jullien L, Gire V, Roux P (2010) Gain of oncogenic function of p53
mutants regulates E-cadherin expression uncoupled from cell invasion in colon
cancer cells. J Cell Sci 123: 1295–1305.
36. Ku NO, Omary MB (2000) Keratins turn over by ubiquitination in a
phosphorylation-modulated fashion. J Cell Biol 149: 547–552.
37. Woll S, Windoffer R, Leube RE (2007) p38 MAPK-dependent shaping of the
keratin cytoskeleton in cultured cells. J Cell Biol 177: 795–807.
38. Chou CF, Omary MB (1993) Mitotic arrest-associated enhancement of O-linked
glycosylation and phosphorylation of human keratins 8 and 18. J Biol Chem
268: 4465–4472.
39. Chou CF, Smith AJ, Omary MB (1992) Characterization and dynamics of O-
linked glycosylation of human cytokeratin 8 and 18. J Biol Chem 267: 3901–
3906.
40. Srikanth B, Vaidya MM, Kalraiya RD O-GlcNAcylation determines the
solubility, filament organization, and stability of keratins 8 and 18. J Biol Chem
285: 34062–34071.
41. Jiang Y, Liu XQ, Rajput A, Geng L, Ongchin M, et al. (2011) Phosphatase
PRL-3 is a direct regulatory target of TGFbeta in colon cancer metastasis.
Cancer Res 71: 234–244.
42. Baribault H, Price J, Miyai K, Oshima RG (1993) Mid-gestational lethality in
mice lacking keratin 8. Genes Dev 7: 1191–1202.
43. Tao GZ, Toivola DM, Zhong B, Michie SA, Resurreccion EZ, et al. (2003)
Keratin-8 null mice have different gallbladder and liver susceptibility to
lithogenic diet-induced injury. J Cell Sci 116: 4629–4638.
44. Vignjevic D, Montagnac G (2008) Reorganisation of the dendritic actin network
during cancer cell migration and invasion. Semin Cancer Biol 18: 12–22.
45. Yamaguchi H, Condeelis J (2007) Regulation of the actin cytoskeleton in cancer
cell migration and invasion. Biochim Biophys Acta 1773: 642–652.
46. Ridley AJ, Paterson HF, Johnston CL, Diekmann D, Hall A (1992) The small
GTP-binding protein rac regulates growth factor-induced membrane ruffling.
Cell 70: 401–410.
47. Just L, Timmer M, Tinius J, Stahl F, Deiwick A, et al. (2003) Identification of
human cells in brain xenografts and in neural co-cultures of rat by in situ
hybridisation with Alu probe. J Neurosci Methods 126: 69–77.
48. Hofmann I, Casella M, Schnolzer M, Schlechter T, Spring H, et al. (2006)
Identification of the junctional plaque protein plakophilin 3 in cytoplasmic
particles containing RNA-binding proteins and the recruitment of plakophilins 1
and 3 to stress granules. Mol Biol Cell 17: 1388–1398.
49. Wolf A, Krause-Gruszczynska M, Birkenmeier O, Ostareck-Lederer A,
Huttelmaier S, et al. (2010) Plakophilin 1 stimulates translation by promoting
eIF4A1 activity. J Cell Biol 188: 463–471.
50. Getsios S, Simpson CL, Kojima S, Harmon R, Sheu LJ, et al. (2009)
Desmoglein 1-dependent suppression of EGFR signaling promotes epidermal
differentiation and morphogenesis. J Cell Biol 185: 1243–1258.
51. Wang H, Vardy LA, Tan CP, Loo JM, Guo K, et al. (2010) PCBP1 suppresses
the translation of metastasis-associated PRL-3 phosphatase. Cancer Cell 18: 52–
62.
52. Ku NO, Azhar S, Omary MB (2002) Keratin 8 phosphorylation by p38 kinase
regulates cellular keratin filament reorganization: modulation by a keratin 1-like
disease causing mutation. J Biol Chem 277: 10775–10782.
53. Chan TA, Hermeking H, Lengauer C, Kinzler KW, Vogelstein B (1999) 14–3-
3s is required to prevent mitotic catastrophe after DNA damage. Nature 401:
616–620.
54. Spector DL, Goldman RD, Leinwand LA (1998) Cells: A laboratory Manual.
Cold Spring Harbor: Cold Spring Harbor Laboratory.
55. Dalal SN, Schweitzer CM, Gan J, DeCaprio JA (1999) Cytoplasmic localization
of human cdc25C during interphase requires an intact 14–3-3 binding site. Mol
Cell Biol 19: 4465–4479.
56. Jaitovich A, Mehta S, Na N, Ciechanover A, Goldman RD, et al. (2008)
Ubiquitin-proteasome-mediated degradation of keratin intermediate filaments in
mechanically stimulated A549 cells. J Biol Chem 283: 25348–25355.
57. Karpova T, McNally JG (2006) Detecting protein-protein interactions with
CFP-YFP FRET by acceptor photobleaching. Curr Protoc Cytom Chapter 12:
Unit12 17.
58. Zalvide J, DeCaprio JA (1995) Role of pRb-related proteins in Simian Virus 40
Large-T-Antigen-Mediated transformation. Mol Cell Biol 15: 5800–5810.
Keratin 8 Required for Transformation
PLoS ONE | www.plosone.org 13 June 2012 | Volume 7 | Issue 6 | e38561

59. Potiron VA, Sharma G, Nasarre P, Clarhaut JA, Augustin HG, et al. (2007)
Semaphorin SEMA3F Affects Multiple Signaling Pathways in Lung CancerCells. Cancer Res 67: 8708–8715.
60. Xiang R, Davalos AR, Hensel CH, Zhou XJ, Tse C, et al. (2002) Semaphorin
3F gene from human 3p21.3 suppresses tumor formation in nude mice. CancerRes 62: 2637–2643.
61. Ihrie RA, Marques MR, Nguyen BT, Horner JS, Papazoglu C, et al. (2005) Perpis a p63-regulated gene essential for epithelial integrity. Cell 120: 843–856.
62. Gillio-Tos A, De Marco L, Fiano V, Garcia-Bragado F, Dikshit R, et al. (2007)
Efficient DNA extraction from 25-year-old paraffin-embedded tissues: study of365 samples. Pathology 39: 345–348.
63. Livak KJ, Schmittgen TD (2001) Analysis of relative gene expression data using
real-time quantitative PCR and the 2(-Delta Delta C(T)) Method. Methods 25:402–408.
64. Schmittgen TD, Livak KJ (2008) Analyzing real-time PCR data by thecomparative C(T) method. Nat Protoc 3: 1101–1108.
Keratin 8 Required for Transformation
PLoS ONE | www.plosone.org 14 June 2012 | Volume 7 | Issue 6 | e38561