Placebo-Controlled Trial of Oral Laquinimod for Multiple Sclerosis
10
original article The new england journal of medicine n engl j med 366;11 nejm.org march 15, 2012 1000 Placebo-Controlled Trial of Oral Laquinimod for Multiple Sclerosis Giancarlo Comi, M.D., Douglas Jeffery, M.D., Ludwig Kappos, M.D., Xavier Montalban, M.D., Alexey Boyko, M.D., Maria A. Rocca, M.D., and Massimo Filippi, M.D., for the ALLEGRO Study Group* From the Department of Neurology and Institute of Experimental Neurology, Università Vita-Salute San Raffaele (G.C., M.F.), and the Neuroimaging Research Unit, Institute of Experimental Neurolo- gy (M.A.R., M.F.) — both in Milan; Ad- vance Neurology and Pain, Advance, NC (D.J.); the Departments of Neurology and Biomedicine, University Hospital, University of Basel, Basel, Switzerland (L.K.); the Unit of Clinical Neuroimmu- nology, Vall d’Hebron University Hospital and Universitat Autònoma de Barcelona, Barcelona (X.M.); and the Department of Neurology and Neurosurgery, Russian State Medical University and Moscow Multiple Sclerosis Center, Moscow (A.B.). Address reprint requests to Dr. Comi at the Institute of Experimental Neurology, Department of Neurology, Università Vita- Salute, Scientific Institute San Raffaele, Via Olgettina 48, 20132 Milan, Italy, or at [email protected]. *Members of the Assessment of Oral Laquinimod in Preventing Progression in Multiple Sclerosis (ALLEGRO) study group are listed in the Supplementary Appendix, available at NEJM.org. N Engl J Med 2012;366:1000-9. Copyright © 2012 Massachusetts Medical Society. ABSTRACT BACKGROUND Two proof-of-concept clinical trials have provided evidence that laquinimod reduces disease activity in patients with relapsing–remitting multiple sclerosis. METHODS We conducted a randomized, double-blind, phase 3 study at 139 sites in 24 countries. A total of 1106 patients with relapsing–remitting multiple sclerosis were randomly assigned in a 1:1 ratio to receive oral laquinimod at a dose of 0.6 mg once daily or placebo for 24 months. The primary end point was the annualized relapse rate during the 24-month period. Secondary end points included confirmed disability progression (defined as an increase in the score on the Expanded Disability Status Scale that was sustained for at least 3 months) and the cumulative number of gadolinium-enhancing lesions and new or enlarging lesions on T 2 -weighted magnetic resonance imaging. RESULTS Treatment with laquinimod as compared with placebo was associated with a modest reduction in the mean (±SE) annualized relapse rate (0.30±0.02 vs. 0.39±0.03, P = 0.002) and with a reduction in the risk of confirmed disability progression (11.1% vs. 15.7%; hazard ratio, 0.64; 95% confidence interval, 0.45 to 0.91; P = 0.01). The mean cumulative numbers of gadolinium-enhancing lesions and new or enlarging lesions on T 2 -weighted images were lower for patients receiving laquinimod than for those receiving placebo (1.33±0.14 vs. 2.12±0.22 and 5.03±0.08 vs. 7.14±0.07, respectively; P<0.001 for both comparisons). Transient elevations in alanine aminotransferase levels to greater than three times the upper limit of the normal range were observed in 24 patients receiving laquinimod (5%) and 8 receiving placebo (2%). CONCLUSIONS In this phase 3 study, oral laquinimod administered once daily slowed the progression of disability and reduced the rate of relapse in patients with relapsing–remitting multiple sclerosis. (Funded by Teva Pharmaceutical Industries; ClinicalTrials.gov number, NCT00509145.) The New England Journal of Medicine Downloaded from nejm.org on November 9, 2013. For personal use only. No other uses without permission. Copyright © 2012 Massachusetts Medical Society. All rights reserved.
Transcript of Placebo-Controlled Trial of Oral Laquinimod for Multiple Sclerosis

original article
T h e n e w e ngl a nd j o u r na l o f m e dic i n e
n engl j med 366;11 nejm.org march 15, 20121000
Placebo-Controlled Trial of Oral Laquinimod for Multiple Sclerosis
Giancarlo Comi, M.D., Douglas Jeffery, M.D., Ludwig Kappos, M.D., Xavier Montalban, M.D., Alexey Boyko, M.D., Maria A. Rocca, M.D.,
and Massimo Filippi, M.D., for the ALLEGRO Study Group*
From the Department of Neurology and Institute of Experimental Neurology, Università Vita-Salute San Raffaele (G.C., M.F.), and the Neuroimaging Research Unit, Institute of Experimental Neurolo-gy (M.A.R., M.F.) — both in Milan; Ad-vance Neurology and Pain, Advance, NC (D.J.); the Departments of Neurology and Biomedicine, University Hospital, University of Basel, Basel, Switzerland (L.K.); the Unit of Clinical Neuroimmu-nology, Vall d’Hebron University Hospital and Universitat Autònoma de Barcelona, Barcelona (X.M.); and the Department of Neurology and Neurosurgery, Russian State Medical University and Moscow Multiple Sclerosis Center, Moscow (A.B.). Address reprint requests to Dr. Comi at the Institute of Experimental Neurology, Department of Neurology, Università Vita-Salute, Scientific Institute San Raffaele, Via Olgettina 48, 20132 Milan, Italy, or at [email protected].
* Members of the Assessment of Oral Laquinimod in Preventing Progression in Multiple Sclerosis (ALLEGRO) study group are listed in the Supplementary Appendix, available at NEJM.org.
N Engl J Med 2012;366:1000-9.Copyright © 2012 Massachusetts Medical Society.
A BS TR AC T
BACKGROUND
Two proof-of-concept clinical trials have provided evidence that laquinimod reduces disease activity in patients with relapsing–remitting multiple sclerosis.
METHODS
We conducted a randomized, double-blind, phase 3 study at 139 sites in 24 countries. A total of 1106 patients with relapsing–remitting multiple sclerosis were randomly assigned in a 1:1 ratio to receive oral laquinimod at a dose of 0.6 mg once daily or placebo for 24 months. The primary end point was the annualized relapse rate during the 24-month period. Secondary end points included confirmed disability progression (defined as an increase in the score on the Expanded Disability Status Scale that was sustained for at least 3 months) and the cumulative number of gadolinium-enhancing lesions and new or enlarging lesions on T2-weighted magnetic resonance imaging.
RESULTS
Treatment with laquinimod as compared with placebo was associated with a modest reduction in the mean (±SE) annualized relapse rate (0.30±0.02 vs. 0.39±0.03, P = 0.002) and with a reduction in the risk of confirmed disability progression (11.1% vs. 15.7%; hazard ratio, 0.64; 95% confidence interval, 0.45 to 0.91; P = 0.01). The mean cumulative numbers of gadolinium-enhancing lesions and new or enlarging lesions on T2-weighted images were lower for patients receiving laquinimod than for those receiving placebo (1.33±0.14 vs. 2.12±0.22 and 5.03±0.08 vs. 7.14±0.07, respectively; P<0.001 for both comparisons). Transient elevations in alanine aminotransferase levels to greater than three times the upper limit of the normal range were observed in 24 patients receiving laquinimod (5%) and 8 receiving placebo (2%).
CONCLUSIONS
In this phase 3 study, oral laquinimod administered once daily slowed the progression of disability and reduced the rate of relapse in patients with relapsing–remitting multiple sclerosis. (Funded by Teva Pharmaceutical Industries; ClinicalTrials.gov number, NCT00509145.)
The New England Journal of Medicine Downloaded from nejm.org on November 9, 2013. For personal use only. No other uses without permission.
Copyright © 2012 Massachusetts Medical Society. All rights reserved.

Or al Laquinimod for Multiple Sclerosis
n engl j med 366;11 nejm.org march 15, 2012 1001
Laquinimod is an oral quinoline-3-carboxamide small molecule selected for its efficacy and safety from a pool of 60 quino-
line-3-carboxamide derivatives of the parent com-pound, roquinimex, a drug previously evaluated in phase 2 trials of treatment for multiple sclerosis but withdrawn because of safety concerns.1 Pre-clinical studies have shown that laquinimod re-duces inflammatory cell infiltrates in the central nervous system, decreases demyelination, and pre-vents axonal loss.2 It is currently in clinical devel-opment for the treatment of multiple sclerosis.3-7 A 36-week, double-blind, placebo-controlled, phase 2 clinical trial showed a significant reduction in the primary end point, the cumulative number of gadolinium-enhancing lesions on magnetic res-onance imaging (MRI), and also reductions in secondary MRI end points for patients receiving 0.6 mg of laquinimod, as compared with those receiving placebo.3
Here we report results from the Assessment of Oral Laquinimod in Preventing Progression in Mul-tiple Sclerosis (ALLEGRO) trial, a 24-month, dou-ble-blind, randomized, placebo-controlled, phase 3 study that was designed to evaluate the safety, efficacy, and tolerability of oral laquinimod at a dose of 0.6 mg administered once daily in patients with relapsing–remitting multiple sclerosis.
ME THODS
STUDY OVERSIGHT
The steering committee, in collaboration with the sponsor, Teva Pharmaceutical Industries, designed and monitored the study. The data and safety mon-itoring committee periodically reviewed the safety and efficacy data. The committee members are listed in the Supplementary Appendix, available with the full text of this article at NEJM.org. The data were collected and analyzed by the sponsor. All authors signed confidentiality agreements with the sponsor, had full access to the data, and vouch for the completeness and accuracy of the data anal-yses and interpretation. An independent medical-writing-services agency, paid by the sponsor, wrote the first draft of the Methods and Results sections of this article, the first author wrote the first draft of the introduction and the Discussion section, and all authors reviewed the first and subsequent drafts of the manuscript. All the authors made the deci-sion to submit the manuscript for publication. The study was conducted according to the protocol, which is available at NEJM.org.
PATIENTS
Patients were recruited from 139 sites in 24 coun-tries (see the Supplementary Appendix for enroll-ment data by country). Recruitment was initiated in November 2007 and lasted 1 year. Eligibility criteria included a diagnosis of multiple sclerosis (according to the 2005 revised McDonald criteria8) with a relapsing–remitting course, an age of 18 to 55 years, a score of no more than 5.5 on the Kurtzke Expanded Disability Status Scale (EDSS, which ranges from 0 to 10, with higher scores in-dicating more severe disability),9 and a disease du-ration of at least 6 months before screening. Pa-tients who had not received previous treatment or who had received disease-modifying agents were eligible if they had had one or more documented relapses in the 12 months before screening, two or more documented relapses in the 24 months be-fore screening, or one documented relapse be-tween 12 and 24 months before screening with at least one gadolinium-enhancing lesion in the previous year.
Patients were excluded if they had progressive forms of multiple sclerosis, an onset of relapse or receipt of any glucocorticoid treatment between screening and the baseline visit, or clinically sig-nificant or unstable medical or surgical conditions that would preclude safe and complete participa-tion in the study. Additional exclusion criteria were use of investigative drugs or immunosuppressive agents (including mitoxantrone) within 6 months before screening; use of glatiramer acetate, any interferon, or intravenous immune globulin within 2 months before screening; use of gluco-corticoids for at least 30 days within 2 months before screening; any previous use of natalizu-mab, cladribine, or laquinimod; and use of inhibi-tors of CYP3A4 within 2 weeks before the base-line visit.
As part of informed consent, the patients were informed of the available treatments. They pro-vided written informed consent before participat-ing in any study procedure, and they were asked to sign an additional informed-consent form after a relapse or confirmed disability progression (as measured by an increase of 2.0 or more points on the EDSS that was sustained for 3 months). The protocol was approved by all local institutional review boards before initiation of the study.
STUDY DESIGN
Patients were randomly assigned in a 1:1 ratio to receive an oral laquinimod capsule at a dose of
The New England Journal of Medicine Downloaded from nejm.org on November 9, 2013. For personal use only. No other uses without permission.
Copyright © 2012 Massachusetts Medical Society. All rights reserved.

T h e n e w e ngl a nd j o u r na l o f m e dic i n e
n engl j med 366;11 nejm.org march 15, 20121002
0.6 mg once daily or a matching placebo capsule. The randomization list, stratified according to study center, was computer-generated by the sta-tistical data management department of the spon-sor. Patients and investigators were unaware of the study assignments.
Patients underwent 12 scheduled assessments at the study sites during the double-blind phase of the study: at screening, at baseline, and at months 1, 2, 3, 6, 9, 12, 15, 18, 21, and 24. EDSS scores were assessed every 3 months. Multiple Sclerosis Functional Composite (MSFC) scores were as-sessed every 6 months. The MSFC score is the aver-age of the scores on the 9-hole peg test, the timed 25-ft walk, and the paced auditory serial-addition test with a 3-second interval between stimuli, with each score converted to a z score; higher scores reflect improvement.10 MRI was performed annu-ally in all patients.
Patients who discontinued the study during the double-blind phase underwent a final assess-ment at the time of discontinuation, with no fur-ther evaluation, except for those who discontinued the study owing to adverse events. Patients com-pleting the 24-month study were given the oppor-tunity to join an open-label study extension.
STUDY PROCEDURES AND END POINTS
Efficacy MeasuresNeurologic evaluations, including safety assess-ments, were performed at screening, at baseline, and every 3 months until month 24. Neurologic assessments and general medical evaluations were conducted by two neurologists in order to mini-mize the possibility of unblinding: an examining neurologist with special training and certification (www.neurostatus.net) assessed neurologic condi-tion, and the treating neurologist determined, on the basis of the EDSS score, whether a patient had a relapse.
The primary end point was the number of con-firmed relapses during the double-blind study pe-riod. A relapse was defined as the appearance of one or more new neurologic abnormalities or the reappearance of one or more previously ob-served neurologic abnormalities lasting for at least 48 hours and occurring after an improved neurologic state for at least 30 days. An event was counted as a relapse if the patient’s symptoms were accompanied by objective neurologic changes as indicated by at least one of the following: an in-
crease of at least 0.5 points in the EDSS score, an increase of one grade in two or more of the seven functional systems that are graded in the EDSS (pyramidal, cerebellar, brain stem, sensory, bowel and bladder, visual, and cerebral),9 or an increase of two grades in one functional system. The stan-dard treatment of relapses was intravenous admin-istration of methylprednisolone at a dose of 1 g per day for up to 5 consecutive days. Decisions regarding both hospitalization and treatment with glucocorticoids were made at the discretion of the treating neurologist, who was unaware of the study-group assignment.
Secondary end points were disability progres-sion as measured by scores on the EDSS9 and the MSFC.10 Confirmed disability progression was defined as an increase in the EDSS score of at least 1.0 point from baseline if the baseline score was between 0 and 5.0 or an increase of at least 0.5 points if the baseline score was 5.5. To con-firm disability progression, these increases had to be sustained for at least 3 months. Additional predefined disability end points are listed in the Supplementary Appendix.
For the MSFC, the measure was the total z score at 24 months, and the analysis included the scores of all patients who completed the double-blind phase or discontinued the study after the 12-month visit. Additional information on the MSFC is avail-able in the Supplementary Appendix.
Secondary MRI end points were the cumulative number of gadolinium-enhancing lesions at 12 and 24 months (i.e., the sum of all gadolinium-enhancing lesions on scans at 12 months plus all gadolinium-enhancing lesions on scans at 24 months) and the cumulative number of new or enlarged lesions on T2-weighted images (>50% increase from the previous scan) at 12 and 24 months (i.e., the sum of all new or enlarged lesions on T2-weighted images at 12 months plus all new or enlarged lesions on T2-weighted im-ages at 24 months). Exploratory MRI end points included the percent change in brain volume, measured with the use of the Structural Image Evaluation, Using Normalisation, of Atrophy (SIENA) and Cross-Sectional Structural Image Eval-uation, Using Normalisation, of Atrophy (SIENAX) programs (version 2.3; FSL Release 3.2).11 Ad-ditional methodologic details of the MRI assess-ments are available in the Supplementary Ap-pendix.
The New England Journal of Medicine Downloaded from nejm.org on November 9, 2013. For personal use only. No other uses without permission.
Copyright © 2012 Massachusetts Medical Society. All rights reserved.

Or al Laquinimod for Multiple Sclerosis
n engl j med 366;11 nejm.org march 15, 2012 1003
Table 1. Clinical and Demographic Characteristics of the Study Participants at Baseline.*
CharacteristicLaquinimod
(N = 550)Placebo(N = 556)
Women — no. (%) 391 (71.1) 368 (66.2)
Age — yr 38.9±9.2 38.5±9.1
Relapses — no.
Within 1 yr before screening 1.2±0.7 1.3±0.7
Within 2 yr before screening 1.9±1.0 1.9±1.0
EDSS score† 2.6±1.3 2.6±1.3
Time from first MS symptom to screening — yr
8.7±6.9 8.7±6.7
Previous use of disease-modifying treatment — no. (%)‡
210 (38.2) 221 (39.7)
Any interferon§ 209 (38.0) 208 (37.4)
Glatiramer acetate 84 (15.3) 89 (16.0)
Other¶ 35 (6.4) 39 (7.0)
Gadolinium-enhancing lesions — no. 1.7±3.9 2.0±5.7
Volume of lesions on T2-weighted images — cm3
9.8±10.4 9.7±10.5
Normalized brain volume — cm3 1578.9±94.3 1584.7±92.1
* Plus–minus values are means ±SD. There were no significant differences be-tween the two groups in clinical or demographic characteristics. MS denotes multiple sclerosis.
† Scores on the Expanded Disability Status Scale (EDSS) range from 0 to 10, with higher scores indicating greater disability.
‡ Patients may have received more than one disease-modifying treatment be-fore enrollment in the study.
§ For specific interferons, the numbers of patients are as follows: interferon beta-1b, 76 patients in the laquinimod group and 82 in the placebo group; interferon beta-1a, 133 and 123, respectively; and interferon, 0 and 3.
¶ Other disease-modifying treatments included antineoplastic agents (17 pa-tients in the laquinimod group and 14 in the placebo group), immune globu-lin or immune serum (5 and 4, respectively), and immunosuppressive agents (13 and 21).
Safety and Adverse EventsSafety assessments included measurement of vital signs and weight, physical examination, electro-cardiography, clinical laboratory tests, and record-ing of adverse events. Adverse-event analysis was based on the percentage of patients who discontin-ued the study and the percentage of patients who discontinued the study owing to adverse events.
STATISTICAL ANALYSIS
We estimated that a sample of 1000 patients (500 per study group) would provide 90% power to detect a significant change in the annualized re-lapse rate, assuming an expected annualized re-lapse rate of 0.65 among untreated patients, a 25% or greater reduction in the annualized relapse rate with laquinimod as compared with placebo, and a 20% rate of withdrawal from the study over a pe-riod of 24 months. Clinical and demographic char-acteristics and safety variables for all patients who underwent randomization were summarized with the use of descriptive statistics. Time to withdrawal was evaluated on the basis of Kaplan–Meier curves.
Using Poisson regression with the study group as a covariate, we calculated the annualized re-lapse rate for the intention-to-treat cohort as the total number of confirmed relapses for all pa-tients in each group, divided by the total patient-years in that group. In addition to the study group, we included as covariates the EDSS score at baseline, the log of the sum of 1 plus the number of relapses that occurred in the previous 2 years, and the country or geographic region.
To control for a type 1 error, the secondary end points were analyzed only after a significant effect was found for the primary end point. Likewise, the study’s overall type 1 error was further controlled in the analysis of the secondary end points by ap-plication of the following gatekeeping approach: the cumulative number of new or enlarged lesions on T2-weighted images and the cumulative number of gadolinium-enhancing lesions at 12 months and at 24 months were tested simultaneously and the between-group difference for both end points had to be significant at an alpha level of 0.05, or the difference for one of the two end points had to be significant at an alpha level of 0.025, if the dif-ference for the other end point was not significant at the 0.05 level. If the above condition was met, we proceeded to the analysis of the end point for confirmed disability progression; if this end point
was significant at the 0.05 level, the analysis was performed for the total MSFC z scores. Additional methodologic details for the statistical analyses are included in the Statistical Analysis Plan in the Supplementary Appendix.
R ESULT S
STUDY POPULATION
Of the 1106 patients who underwent randomiza-tion, 550 were assigned to the laquinimod group and 556 to the placebo group. A total of 437 pa-tients (79.5%) in the laquinimod group and 427 (76.8%) in the placebo group completed the 24-month study treatment. Of the 1106 patients,
The New England Journal of Medicine Downloaded from nejm.org on November 9, 2013. For personal use only. No other uses without permission.
Copyright © 2012 Massachusetts Medical Society. All rights reserved.

T h e n e w e ngl a nd j o u r na l o f m e dic i n e
n engl j med 366;11 nejm.org march 15, 20121004
Table 2. Clinical and MRI End Points.*
End PointLaquinimod
(N = 550)Placebo(N = 556) P Value
Relapse
Annualized relapse rate
Adjusted mean 0.30±0.02 0.39±0.03 0.002†
Risk ratio (95% CI) 0.77 (0.65 to 0.91)
Relapse-free during study
Adjusted proportion (%) 62.90 52.24 <0.001‡
Odds ratio (95% CI) 1.55 (1.20 to 1.99)
Annualized rate of relapses requiring hospitalization or IV glucocorticoids
Adjusted mean 0.24±0.02 0.33±0.02 <0.001†
Risk ratio (95% CI) 0.72 (0.61 to 0.86)
Disability
Risk of disability progression confirmed at 3 mo
Hazard ratio (95% CI) 0.64 (0.45 to 0.91) 0.01§
Patients with confirmed disability progression (%) 11.1 15.7
Risk of disability progression confirmed at 6 mo
Hazard ratio (95% CI) 0.51 (0.34 to 0.79) 0.002§
MSFC — total z score at 24 mo, including discontinuation after 12 mo¶
Mean (95% CI) 0.06 (0.00 to 0.11) 0.04 (−0.02 to 0.09) 0.59‖
Lesion activity on brain MRI
Cumulative no. of gadolinium-enhancing lesions at 12 and 24 mo
Mean 1.33±0.14 2.12±0.22 <0.001**
Rate ratio (95% CI) 0.63 (0.49 to 0.81)
Cumulative no. of new or enlarged lesions on T2-weighted images at 12 and 24 mo
Mean 5.03±0.08 7.14±0.07 <0.001**
Rate ratio (95% CI) 0.70 (0.58 to 0.85)
Change in brain volume from baseline to 24 mo
Adjusted mean percent change −0.87 −1.30 <0.001††
Adjusted mean percentage-point difference (95% CI) 0.43 (0.27 to 0.59)
* Plus–minus values are means ±SE. IV denotes intravenous.† The P value was calculated with the use of a quasi-likelihood (overdispersed) Poisson regression analysis, with adjust-
ment for EDSS score at baseline, log of the sum of 1 plus the number of relapses in the previous 2 years, and country or geographic region.
‡ The P value was calculated with the use of a logistic-regression analysis, with adjustment for baseline EDSS score, natural log of the sum of 1 plus the number of relapses in the previous 2 years, and country or geographic region.
§ The P value was calculated with the use of a Cox model regression analysis, with adjustment for baseline EDSS score, log of the sum of 1 plus the number of relapses in the previous 2 years, and country or geographic region.
¶ The Multiple Sclerosis Functional Composite (MSFC) is the average of scores on the 9-hole peg test, the timed 25-ft walk, and the paced auditory serial-addition test with a 3-second interval between stimuli, with each converted to a z score; higher scores reflect improvement.
‖ The P value was calculated with the use of an analysis of covariance, with adjustment for baseline MSFC score as a 1-degree-of-freedom covariate and baseline EDSS score, log of the sum of 1 plus the number of relapses in the previ-ous 2 years, and country or geographic region as covariates.
** The P value was calculated with the use of a negative binomial regression model, with adjustment for number of gadolinium-enhancing lesions at baseline and country or geographic region and with an offset to adjust for absence of exposure to study treatment owing to early discontinuation.
†† The P value was calculated with the use of analysis of covariance, with adjustment for number of gadolinium-enhancing lesions at baseline and the country or geographic region.
The New England Journal of Medicine Downloaded from nejm.org on November 9, 2013. For personal use only. No other uses without permission.
Copyright © 2012 Massachusetts Medical Society. All rights reserved.

Or al Laquinimod for Multiple Sclerosis
n engl j med 366;11 nejm.org march 15, 2012 1005
13.7% discontinued the study during the first year (12.0% in the laquinimod group and 15.2% in the placebo group), and an additional 8.2% discontin-ued the study during the second year (8.5% and 7.9%, respectively). Reasons for discontinuation of the study are shown in Figure 1 in the Supplemen-tary Appendix. The most common reasons for dis-continuation were the patient’s decision not to sign the additional informed-consent form and with-drawal of consent after one relapse (8.0% of pa-tients in the laquinimod group and 10.8% in the placebo group). The clinical and demographic characteristics of the study groups at baseline were well balanced (Table 1).
RELAPSE END POINTS
The mean (±SD) annualized relapse rate during the 24-month treatment period (primary outcome) was significantly reduced in the laquinimod group as compared with the placebo group (0.30±0.02 vs. 0.39±0.03, P = 0.002) (Table 2). In exploratory analyses that were prespecified in the protocol, the percentage of patients who were re-lapse-free was 62.9% in the laquinimod group (346 of 550 patients) and 52.2% in the placebo group (290 of 556, P<0.001); the time to the first relapse during the study was longer for patients receiving laquinimod than for those receiving placebo, and the risk of relapse was significantly reduced with laquinimod (hazard ratio, 0.72; 95% confidence interval, 0.59 to 0.87; P<0.001). In an additional prespecified exploratory analy-sis, the annualized rate of relapse requiring hos-pitalization or intravenous treatment with gluco-corticoids, according to the treating neurologist’s decision, was significantly lower among patients receiving laquinimod as compared with those re-ceiving placebo (0.24 vs. 0.33, P<0.001).
DISABILITY END POINTS
The risk of disability progression as assessed by an increase in EDSS scores that was sustained for
Cum
ulat
ive
No.
of C
onfir
med
Rel
apse
s
400
300
100
200
00 10 20 30 40 50 60 70 80 90 100 110
Week since Randomization
B Confirmed Disability Progression
C Gadolinium-Enhancing Lesions
A Confirmed Relapses
374
296
Patie
nts
with
Con
firm
ed P
rogr
essi
on (%
)
100
80
90
70
60
40
30
10
50
20
00 100 200 300 400 500 700600
Day
Hazard ratio, 0.64P=0.01
30
10
20
00 100 200 300 400 500 700600
Placebo
Laquinimod
No. at RiskLaquinimodPlacebo
550556
515517
491475
475445
453408
433383
409370
390361
Laquinimod
Placebo
Mea
n N
o. o
f Les
ions
2.5
2.0
1.0
0.5
1.5
0.0Baseline 12 Months 24 Months Cumulative
Laquinimod Placebo
P=0.003
P=0.001
P<0.001
37% Reduction
Figure 1. Clinical Outcomes and MRI Measures of Efficacy According to Study Group.
Panel A shows the number of confirmed relapses. Panel B shows the Kaplan–Meier plot for the risk of disability progression that was confirmed after 3 months, as measured by scores on the Expanded Disability Status Scale. Panel C shows the adjusted mean number of gadolinium-enhancing lesions at baseline, at 12 months, and at 24 months and the cumulative number at 24 months. T bars indicate standard errors.
The New England Journal of Medicine Downloaded from nejm.org on November 9, 2013. For personal use only. No other uses without permission.
Copyright © 2012 Massachusetts Medical Society. All rights reserved.

T h e n e w e ngl a nd j o u r na l o f m e dic i n e
n engl j med 366;11 nejm.org march 15, 20121006
3 months (secondary outcome) was significantly decreased for patients receiving laquinimod, as compared with those receiving placebo (11.1% vs. 15.7%; hazard ratio, 0.64; P = 0.01) (Fig. 1B). This observation was reinforced by two findings from additional analyses: the risk of confirmed pro-gression was significantly reduced with the use of the more stringent approach, which required the persistence of the change in the EDSS score at the last available assessment (hazard ratio with la-quinimod, 0.66; P = 0.04), and the actual propor-tion of patients with confirmed disability pro-gression at the last assessment was lower in the laquinimod group than in the placebo group (9.8% [54 of 550 patients] vs. 14.0% [78 of 556], P = 0.04). The mean EDSS scores at the last assess-ment were 2.68 and 2.79 in the laquinimod and
placebo groups, respectively (P = 0.05). In an anal-ysis that was not prespecified in the protocol but was designed before the initiation of data analyses, there was a decrease in the risk of confirmed dis-ability progression at 6 months with laquinimod (hazard ratio, 0.52; P = 0.002). There was little over-all change in the MSFC scores from baseline to 24 months (secondary outcome), and the adjusted mean total MSFC z score at 24 months did not differ significantly between the laquinimod group and the placebo group (0.06 and 0.04, respec-tively; P = 0.59).
MRI END POINTS
Laquinimod reduced the mean cumulative num-ber of gadolinium-enhancing lesions (secondary outcome), as compared with placebo (rate ratio,
Table 3. Serious Adverse Events, Adverse Events, and Elevated Liver-Enzyme Levels.*
EventLaquinimod
(N = 550)Placebo(N = 556) Risk Ratio
Serious adverse events — no. of events (% of patients with ≥1 event)
Diarrhea 2 (0.4) 0
Vomiting 3 (0.2) 0
Fever 2 (0.4) 0
Peripheral edema 2 (0.4) 0
Appendicitis 5 (0.9) 1 (0.2)
Cellulitis 2 (0.4) 1 (0.2)
Hypokalemia 2 (0.4) 0
Uterine leiomyoma 2 (0.4) 1 (0.2)
Headache 2 (0.4) 1 (0.2)
Neoplasms — no. of events (% of patients) 8 (1.5) 6 (1.1)
Basal-cell carcinoma 1 (0.2) 1 (0.2)
Breast cancer† 3 (0.5) 1 (0.2)
Malignant lung neoplasm 1 (0.2) 0
Lymphoma 1 (0.2) 0
Esophageal adenocarcinoma‡ 1 (0.2) 0
Ovarian cancer 0 2 (0.4)
Prostate cancer 0 1 (0.2)
Glioblastoma multiforme§ 1 (0.2) 0
Rectal cancer 0 1 (0.2)
Adverse events — no. of events, no. of patients (% of patients)
Infection
Urinary tract infection 58, 40 (7.3) 36, 25 (4.5) 1.6
Sinusitis 37, 29 (5.3) 37, 25 (4.5) 1.2
Nervous system disorder — headache 222, 125 (22.7) 173, 99 (17.8) 1.3
Liver-function abnormality — elevated ALT¶ 47, 38 (6.9) 15, 15 (2.7) 2.6
The New England Journal of Medicine Downloaded from nejm.org on November 9, 2013. For personal use only. No other uses without permission.
Copyright © 2012 Massachusetts Medical Society. All rights reserved.
Or al Laquinimod for Multiple Sclerosis
n engl j med 366;11 nejm.org march 15, 2012 1007
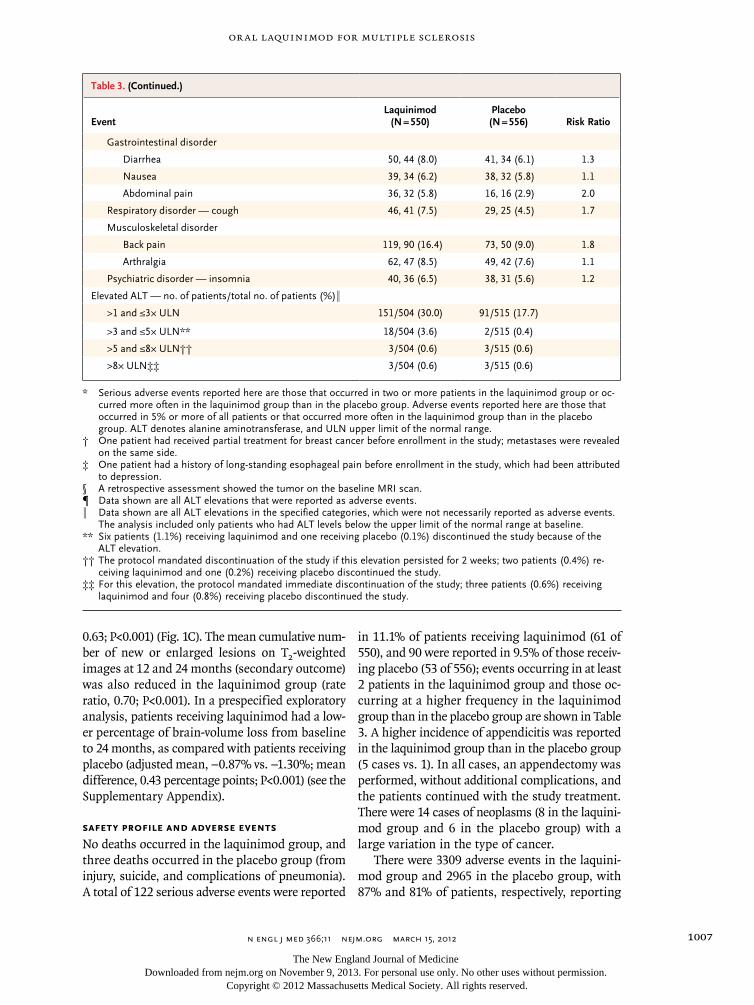
0.63; P<0.001) (Fig. 1C). The mean cumulative num-ber of new or enlarged lesions on T2-weighted images at 12 and 24 months (secondary outcome) was also reduced in the laquinimod group (rate ratio, 0.70; P<0.001). In a prespecified exploratory analysis, patients receiving laquinimod had a low-er percentage of brain-volume loss from baseline to 24 months, as compared with patients receiving placebo (adjusted mean, −0.87% vs. −1.30%; mean difference, 0.43 percentage points; P<0.001) (see the Supplementary Appendix).
SAFETY PROFILE AND ADVERSE EVENTS
No deaths occurred in the laquinimod group, and three deaths occurred in the placebo group (from injury, suicide, and complications of pneumonia). A total of 122 serious adverse events were reported
in 11.1% of patients receiving laquinimod (61 of 550), and 90 were reported in 9.5% of those receiv-ing placebo (53 of 556); events occurring in at least 2 patients in the laquinimod group and those oc-curring at a higher frequency in the laquinimod group than in the placebo group are shown in Table 3. A higher incidence of appendicitis was reported in the laquinimod group than in the placebo group (5 cases vs. 1). In all cases, an appendectomy was performed, without additional complications, and the patients continued with the study treatment. There were 14 cases of neoplasms (8 in the laquini-mod group and 6 in the placebo group) with a large variation in the type of cancer.
There were 3309 adverse events in the laquini-mod group and 2965 in the placebo group, with 87% and 81% of patients, respectively, reporting
Table 3. (Continued.)
EventLaquinimod
(N = 550)Placebo(N = 556) Risk Ratio
Gastrointestinal disorder
Diarrhea 50, 44 (8.0) 41, 34 (6.1) 1.3
Nausea 39, 34 (6.2) 38, 32 (5.8) 1.1
Abdominal pain 36, 32 (5.8) 16, 16 (2.9) 2.0
Respiratory disorder — cough 46, 41 (7.5) 29, 25 (4.5) 1.7
Musculoskeletal disorder
Back pain 119, 90 (16.4) 73, 50 (9.0) 1.8
Arthralgia 62, 47 (8.5) 49, 42 (7.6) 1.1
Psychiatric disorder — insomnia 40, 36 (6.5) 38, 31 (5.6) 1.2
Elevated ALT — no. of patients/total no. of patients (%)‖
>1 and ≤3× ULN 151/504 (30.0) 91/515 (17.7)
>3 and ≤5× ULN** 18/504 (3.6) 2/515 (0.4)
>5 and ≤8× ULN†† 3/504 (0.6) 3/515 (0.6)
>8× ULN‡‡ 3/504 (0.6) 3/515 (0.6)
* Serious adverse events reported here are those that occurred in two or more patients in the laquinimod group or oc-curred more often in the laquinimod group than in the placebo group. Adverse events reported here are those that occurred in 5% or more of all patients or that occurred more often in the laquinimod group than in the placebo group. ALT denotes alanine aminotransferase, and ULN upper limit of the normal range.
† One patient had received partial treatment for breast cancer before enrollment in the study; metastases were revealed on the same side.
‡ One patient had a history of long-standing esophageal pain before enrollment in the study, which had been attributed to depression.
§ A retrospective assessment showed the tumor on the baseline MRI scan.¶ Data shown are all ALT elevations that were reported as adverse events.‖ Data shown are all ALT elevations in the specified categories, which were not necessarily reported as adverse events.
The analysis included only patients who had ALT levels below the upper limit of the normal range at baseline.** Six patients (1.1%) receiving laquinimod and one receiving placebo (0.1%) discontinued the study because of the
ALT elevation.†† The protocol mandated discontinuation of the study if this elevation persisted for 2 weeks; two patients (0.4%) re-
ceiving laquinimod and one (0.2%) receiving placebo discontinued the study.‡‡ For this elevation, the protocol mandated immediate discontinuation of the study; three patients (0.6%) receiving
laquinimod and four (0.8%) receiving placebo discontinued the study.
The New England Journal of Medicine Downloaded from nejm.org on November 9, 2013. For personal use only. No other uses without permission.
Copyright © 2012 Massachusetts Medical Society. All rights reserved.

T h e n e w e ngl a nd j o u r na l o f m e dic i n e
n engl j med 366;11 nejm.org march 15, 20121008
one or more events. Adverse events that occurred in at least 5% of all patients and those that oc-curred at a higher rate in the laquinimod group than in the placebo group are listed in Table 3. The three most common adverse events in the la-quinimod group (excluding elevated levels of liver enzymes, discussed below) were abdominal pain (in 32 patients [5.8%], vs. 16 [2.9%] in the placebo group), back pain (in 90 patients [16.4%] vs. 50 [9.0%]), and cough (in 41 patients [7.5%] vs. 25 [4.5%]). These adverse events were rarely associat-ed with discontinuation of the study (3% and 1% of the laquinimod and placebo groups, respec-tively).
More patients in the laquinimod group than in the placebo group had alanine aminotransferase levels that were greater than 3 times the upper limit of the normal range but less than or equal to 5 times the upper limit (18 patients [3.6%] vs. 2 [0.4%]). In contrast, alanine aminotransferase levels that were greater than 5 times the upper limit of the normal range occurred equally often in the two groups (in 6 patients in each group) and led to equal rates of discontinuation. Elevations to values that were up to or equal to 5 times the up-per limit of the normal range usually occurred within the first 6 months, and in all cases, they were reversible either without discontinuation of the study drug or within 2 months after discon-tinuation. There were no cases of liver failure and no cases of concomitant elevations of bilirubin levels or coagulation values (Hy’s law, which states that an elevation of liver aminotransferases along with an elevation of bilirubin is predictive of liver failure).12 Elevated levels of alanine aminotransfer-ase (from 3 to less than 5 times the upper limit of the normal range) led to discontinuation in 6 pa-tients receiving laquinimod and in 1 receiving placebo.
DISCUSSION
The ALLEGRO study showed that, as compared with placebo, laquinimod significantly but mod-estly reduced the annualized rate of relapse of multiple sclerosis in a manner consistent with its suppression of inflammatory disease activity, as
measured by MRI. Laquinimod was also associat-ed with a significant reduction in the risk of con-firmed progression of disability. We did not detect significant between-group differences in the MSFC scores. The significant reduction in the explor-atory end point of the percent change in brain volume, as measured by MRI, in this study is an interesting corollary to the effect on disability progression.
Elevated levels of liver enzymes occurred 2 times more frequently in the laquinimod group. These elevations were transient and were not associated with clinical, imaging, or laboratory signs of liver failure. Abdominal pain occurred more frequently in the patients who received laquinimod than in those who received placebo; however, it was rarely a reason for discontinuation of the study treat-ment. It is worth noting that the safety concerns previously seen with roquinimex,13 such as sero-sitis, cardiovascular events, and thrombosis, did not emerge as signals in the current study. Al-though long-term studies are needed to adequate-ly assess the risk of infections and cancers, we did not observe increased rates of these serious ad-verse events. An open-label extension of the study, involving 844 of the 864 patients who completed the study, is ongoing. The data and safety moni-toring committee has not reported any new safety signals so far in this extension study.
In conclusion, we found that laquinimod, as compared with placebo, reduced the rate of relapse and slowed the progression of disability in patients with relapsing–remitting multiple sclerosis.
Supported by Teva Pharmaceutical Industries.Disclosure forms provided by the authors are available with
the full text of this article at NEJM.org.We thank the patients who participated in the study; the inde-
pendent data and safety monitoring committee; members of the MRI Analysis Center; the principal investigators in each country (see the Supplementary Appendix for a complete list); Dan Bar-Zohar, M.D., and Nora Tarcic, Ph.D., of the Teva Innovative Re-search and Development Clinical Team (Netanya, Israel) for participating in the development and monitoring of the study; Nissim Sasson, M.A., of the Teva Statistical Data Management Team (Netanya) for managing the statistical analyses, and the other members of his team — Yossi Levy, Ph.D., Eli Eyal, M.Sc., Maya Ben Lassan, B.A., Adam Carlquist, B.A., and Eitan Horev, M.B.A.; and Pippa Loupe, Ph.D., of Medical Affairs, Teva Phar-maceuticals (Kansas City, MO), and James D. Bergstrom, Ph.D., of Mountain Stream Communications (Hillsborough, NJ) for participating in the writing and editing of the manuscript.
The New England Journal of Medicine Downloaded from nejm.org on November 9, 2013. For personal use only. No other uses without permission.
Copyright © 2012 Massachusetts Medical Society. All rights reserved.

Or al Laquinimod for Multiple Sclerosis
n engl j med 366;11 nejm.org march 15, 2012 1009
REFERENCES
nejm 200th anniversary articles
The NEJM 200th Anniversary celebration includes publication of a series of invited review and Perspective articles throughout 2012.
Each article explores a story of progress in medicine over the past 200 years. The collection of articles is available at the NEJM 200th Anniversary website,
http://NEJM200.NEJM.org.
1. Jönsson S, Andersson G, Fex T, et al. Synthesis and biological evaluation of new 1,2-dihydro-4-hydroxy-2-oxo-3 quin-olinecarboxamides for treatment of auto-immune disorders: structure–activity re-lationship. J Med Chem 2004;47:2075-88.2. Brück W, Wegner C. Insight into the mechanism of laquinimod action. J Neurol Sci 2011;306:173-9.3. Comi G, Pulizzi A, Rovaris M, et al. Effect of laquinimod on MRI-monitored disease activity in patients with relapsing-remitting multiple sclerosis: a multicen-tre, randomised, double-blind, placebo-controlled phase IIb study. Lancet 2008; 371:2085-92.4. Comi G, Abramsky O, Arbizu T, et al. Oral laquinimod in patients with relaps-ing-remitting multiple sclerosis: 36-week double-blind active extension of the multi-centre, randomized, double-blind,
parallel-group placebo-controlled study. Mult Scler 2010;16:1360-6.5. Comi G, Abramsky O, Arbizu T, et al. Long-term open extension of oral la-quinimod in patients with relapsing multiple sclerosis shows favorable safety and sustained low relapse rate and MRI activity. Mult Scler 2009;15:Suppl 2:S127. abstract.6. Polman C, Barkhof F, Sandberg-Woll-heim M, Linde A, Nordle O, Nederman T. Treatment with laquinimod reduces de-velopment of active MRI lesions in relaps-ing MS. Neurology 2005;64:987-91.7. Preiningerova J. Oral laquinimod ther-apy in relapsing multiple sclerosis. Expert Opin Investig Drugs 2009;18:985-9.8. Polman CH, Reingold SC, Edan G, et al. Diagnostic criteria for multiple sclerosis: 2005 revisions to the “McDonald Criteria.” Ann Neurol 2005;58:840-6.
9. Kurtzke JF. Rating neurologic impair-ment in multiple sclerosis: an Expanded Disability Status Scale (EDSS). Neurology 1983;33:1444-52.10. Cutter GR, Baier ML, Rudick RA, et al. Development of a multiple sclerosis func-tional composite as a clinical trial out-come measure. Brain 1999;122:871-82.11. SIENA and SIENAX. Oxford, United Kingdom: FMRIB Software Library (http:// www.fmrib.ox.ac.uk/analysis/research/ siena/siena).12. Temple R. Hy’s law: predicting serious hepatotoxicity. Pharmacoepidemiol Drug Saf 2006;15:241-3.13. Noseworthy JH, Wolinsky JS, Lublin FD, et al. Linomide in relapsing and sec-ondary progressive MS. Part 1: trial design and clinical results. Neurology 2000;54: 1726-33.Copyright © 2012 Massachusetts Medical Society.
The New England Journal of Medicine Downloaded from nejm.org on November 9, 2013. For personal use only. No other uses without permission.
Copyright © 2012 Massachusetts Medical Society. All rights reserved.