Pituitary Tumor-Transforming 1 Increases Cell Motility and Promotes Lymph Node Metastasis in...
12
Pituitary Tumor-Transforming 1 Increases Cell Motility and Promotes Lymph Node Metastasis in Esophageal Squamous Cell Carcinoma Tetsuo Ito, 1,2 Yutaka Shimada, 4 Takatsugu Kan, 1 Stefan David, 1 Yulan Cheng, 1 Yuriko Mori, 1 Rachana Agarwal, 1 Bogdan Paun, 1 Zhe Jin, 1 Alexandru Olaru, 1 James P. Hamilton, 1 Jian Yang, 1 John M. Abraham, 1 Stephen J. Meltzer, 1 and Fumiaki Sato 1,3 1 Division of Gastroenterology, Department of Medicine, and Sidney Kimmel Comprehensive Cancer Center, Johns Hopkins University School of Medicine, Baltimore, Maryland; 2 Department of Surgery, Graduate School of Medicine, and 3 Department of Nanobio Drug Discovery, Graduate School of Pharmaceutical Sciences, Kyoto University, Kyoto, Japan; and 4 Department of Surgery and Science, Graduate School of Medicine and Pharmaceutical Sciences Research, University of Toyama, Toyama, Japan Abstract Human pituitary tumor-transforming 1 (PTTG1)/securin is a putative oncoprotein that is overexpressed in various tumor types. However, the involvement of PTTG1 in gastrointesti- nal cancer development and progression remains unclear. In this study, we investigated the clinical significance and biological effects of PTTG1 in esophageal squamous cell carcinoma (ESCC). Immunohistochemical studies performed on 113 primary ESCC specimens revealed a high prevalence of PTTG1 overexpression (60.2%), which was significantly associated with lymph node metastasis (regional, P = 0.042; distant, P = 0.005), advanced tumor stage (P = 0.028), and poorer overall survival (P = 0.017, log-rank test; P = 0.044, Cox proportional hazard model). Eleven ESCC cell lines expressed PTTG1 protein at levels 2.4 to 6.6 times higher than those in normal esophageal epithelial cells (HEEpiC). PTTG1 protein expression was confined to the nucleus in HEEpiC cells but present in both the cytoplasm and nucleus in ESCC cells. Two small interfering RNAs (siRNA) inhibited PTTG1 mRNA and protein expression in three ESCC cell lines by 77% to 97%. In addition, PTTG1 down-regulation by these siRNAs significantly reduced cell motility in all three ESCC cell lines (P < 0.01) in vitro , as well as popliteal lymph node metastases of ESCC cells in nude mice (P = 0.020). Global gene expression profiling suggested that several members of the Ras and Rho gene families, including RRAS, RHOG, ARHGAP1 , and ARHGADIA , represented potential downstream genes in the PTTG1 pathway. Taken together, these findings suggest that PTTG1 overexpression promotes cell motility and lymph node metastasis in ESCC patients, leading to poorer survival. Thus, PTTG1 constitutes a potential biomarker and therapeutic target in ESCCs with lymph node metastases. [Cancer Res 2008;68(9):3214–24] Introduction Esophageal squamous cell carcinoma (ESCC) is a highly aggressive malignancy with a 5-year survival rate of 10% worldwide (1). One reason for this poor survival is the fact that ESCC frequently metastasizes to regional and distant lymph nodes, even at initial diagnosis. Lymph node metastasis is one of the most important prognostic factors in ESCC (2). Therefore, the detection and treatment of lymph node metastases are extremely important in managing this refractory cancer. Pituitary tumor-transforming 1 (PTTG1), also known as human securin, was originally isolated from rat pituitary tumor cells (3). PTTG1 possesses multiple physiologic functions critical to normal cellular mitosis, which are exerted through the maintenance of sister chromatid separation (4). PTTG1 overexpression has been reported in a variety of cancers including ESCC (5–7). PTTG1 levels correlate with tumor invasiveness (8), and PTTG1 has been identified as a key signature gene in tumor metastasis (9). However, mechanisms underlying the involvement of PTTG1 in lymph node metastasis are poorly understood. Recently, we discovered that PTTG1 was overexpressed in ESCC tumors versus normal organs and exhibited much higher promoter activity in ESCC cells than in normal epithelial cells (10). Based on these findings, we hypothesized that PTTG1 represented a promising potential therapeutic target in ESCC. Nevertheless, the clinical significance and biological involvement of PTTG1 in the progression of gastrointestinal cancers, including ESCCs, have not yet been elucidated. Therefore, we sought to clarify the clinical effect and the in vitro and in vivo biological functions of PTTG1 in ESCC, using 113 surgically resected primary ESCC specimens, small interfering RNAs (siRNA) directed against PTTG1, esophageal cell lines, and in vitro and in vivo metastasis assays. Materials and Methods Patients and surgical specimens. Paraffin-embedded sections were obtained for immunohistochemical studies from 113 patients with primary ESCC undergoing surgery at Kyoto University Hospital (Kyoto, Japan) from 1991 to 2002. The median age of these patients was 62.5 y (range, 43–82 y). Median postoperative survival was 80 mo (range, 1–159 mo). Information on gender, age, stage of disease, and histopathologic features was abstracted from medical records. All tumors were confirmed as ESCC by the Clinicopathologic Department at Kyoto University Hospital. All cases were classified according to the sixth edition of the pathologic tumor-node- metastasis (pTNM) classification (11). Written informed consent for the research use of resected specimens was obtained from all patients before Note: Supplementary data for this article are available at Cancer Research Online (http://cancerres.aacrjournals.org/). Requests for reprints: Fumiaki Sato, Department of Nanobio Drug Discovery, Graduate School of Pharmaceutical Sciences, Kyoto University, Main Building A320, Shimoadachi-cho 46-29, Yoshida, Sakyo-ku, Kyoto 606-8501, Japan. Phone: 81-75-753-9559; Fax: 81-75-753-9557; E-mail: [email protected], or Stephen J. Meltzer, Division of Gastroenterology, Department of Medicine, Johns Hopkins University School of Medicine, Room 112, 1503 East Jefferson Street, Baltimore, MD 21231. Phone: 410-502-6071; Fax: 410-502-1099; E-mail: [email protected]. I2008 American Association for Cancer Research. doi:10.1158/0008-5472.CAN-07-3043 Cancer Res 2008; 68: (9). May 1, 2008 3214 www.aacrjournals.org Research Article Research. on January 21, 2016. © 2008 American Association for Cancer cancerres.aacrjournals.org Downloaded from
-
Upload
independent -
Category
Documents
-
view
0 -
download
0
Transcript of Pituitary Tumor-Transforming 1 Increases Cell Motility and Promotes Lymph Node Metastasis in...

Pituitary Tumor-Transforming 1 Increases Cell Motility and
Promotes Lymph Node Metastasis in Esophageal
Squamous Cell Carcinoma
Tetsuo Ito,1,2Yutaka Shimada,
4Takatsugu Kan,
1Stefan David,
1Yulan Cheng,
1Yuriko Mori,
1
Rachana Agarwal,1Bogdan Paun,
1Zhe Jin,
1Alexandru Olaru,
1James P. Hamilton,
1
Jian Yang,1John M. Abraham,
1Stephen J. Meltzer,
1and Fumiaki Sato
1,3
1Division of Gastroenterology, Department of Medicine, and Sidney Kimmel Comprehensive Cancer Center, Johns Hopkins UniversitySchool of Medicine, Baltimore, Maryland; 2Department of Surgery, Graduate School of Medicine, and 3Department of Nanobio DrugDiscovery, Graduate School of Pharmaceutical Sciences, Kyoto University, Kyoto, Japan; and 4Department of Surgery and Science,Graduate School of Medicine and Pharmaceutical Sciences Research, University of Toyama, Toyama, Japan
Abstract
Human pituitary tumor-transforming 1 (PTTG1)/securin is aputative oncoprotein that is overexpressed in various tumortypes. However, the involvement of PTTG1 in gastrointesti-nal cancer development and progression remains unclear.In this study, we investigated the clinical significance andbiological effects of PTTG1 in esophageal squamous cellcarcinoma (ESCC). Immunohistochemical studies performedon 113 primary ESCC specimens revealed a high prevalenceof PTTG1 overexpression (60.2%), which was significantlyassociated with lymph node metastasis (regional, P = 0.042;distant, P = 0.005), advanced tumor stage (P = 0.028), andpoorer overall survival (P = 0.017, log-rank test; P = 0.044,Cox proportional hazard model). Eleven ESCC cell linesexpressed PTTG1 protein at levels 2.4 to 6.6 times higherthan those in normal esophageal epithelial cells (HEEpiC).PTTG1 protein expression was confined to the nucleus inHEEpiC cells but present in both the cytoplasm and nucleusin ESCC cells. Two small interfering RNAs (siRNA) inhibitedPTTG1 mRNA and protein expression in three ESCC celllines by 77% to 97%. In addition, PTTG1 down-regulation bythese siRNAs significantly reduced cell motility in all threeESCC cell lines (P < 0.01) in vitro , as well as popliteal lymphnode metastases of ESCC cells in nude mice (P = 0.020).Global gene expression profiling suggested that severalmembers of the Ras and Rho gene families, including RRAS,RHOG, ARHGAP1 , and ARHGADIA , represented potentialdownstream genes in the PTTG1 pathway. Taken together,these findings suggest that PTTG1 overexpression promotescell motility and lymph node metastasis in ESCC patients,leading to poorer survival. Thus, PTTG1 constitutes apotential biomarker and therapeutic target in ESCCs withlymph node metastases. [Cancer Res 2008;68(9):3214–24]
Introduction
Esophageal squamous cell carcinoma (ESCC) is a highlyaggressive malignancy with a 5-year survival rate of 10% worldwide(1). One reason for this poor survival is the fact that ESCCfrequently metastasizes to regional and distant lymph nodes, evenat initial diagnosis. Lymph node metastasis is one of the mostimportant prognostic factors in ESCC (2). Therefore, the detectionand treatment of lymph node metastases are extremely importantin managing this refractory cancer.Pituitary tumor-transforming 1 (PTTG1), also known as human
securin, was originally isolated from rat pituitary tumor cells (3).PTTG1 possesses multiple physiologic functions critical to normalcellular mitosis, which are exerted through the maintenance ofsister chromatid separation (4). PTTG1 overexpression has beenreported in a variety of cancers including ESCC (5–7). PTTG1 levelscorrelate with tumor invasiveness (8), and PTTG1 has beenidentified as a key signature gene in tumor metastasis (9). However,mechanisms underlying the involvement of PTTG1 in lymph nodemetastasis are poorly understood.Recently, we discovered that PTTG1 was overexpressed in
ESCC tumors versus normal organs and exhibited much higherpromoter activity in ESCC cells than in normal epithelial cells(10). Based on these findings, we hypothesized that PTTG1represented a promising potential therapeutic target in ESCC.Nevertheless, the clinical significance and biological involvementof PTTG1 in the progression of gastrointestinal cancers, includingESCCs, have not yet been elucidated. Therefore, we sought toclarify the clinical effect and the in vitro and in vivo biologicalfunctions of PTTG1 in ESCC, using 113 surgically resectedprimary ESCC specimens, small interfering RNAs (siRNA) directedagainst PTTG1, esophageal cell lines, and in vitro andin vivo metastasis assays.
Materials and Methods
Patients and surgical specimens. Paraffin-embedded sections wereobtained for immunohistochemical studies from 113 patients with primary
ESCC undergoing surgery at Kyoto University Hospital (Kyoto, Japan) from
1991 to 2002. The median age of these patients was 62.5 y (range, 43–82 y).
Median postoperative survival was 80 mo (range, 1–159 mo). Information ongender, age, stage of disease, and histopathologic features was abstracted
from medical records. All tumors were confirmed as ESCC by the
Clinicopathologic Department at Kyoto University Hospital. All cases wereclassified according to the sixth edition of the pathologic tumor-node-
metastasis (pTNM) classification (11). Written informed consent for the
research use of resected specimens was obtained from all patients before
Note: Supplementary data for this article are available at Cancer Research Online(http://cancerres.aacrjournals.org/).
Requests for reprints: Fumiaki Sato, Department of Nanobio Drug Discovery,Graduate School of Pharmaceutical Sciences, Kyoto University, Main Building A320,Shimoadachi-cho 46-29, Yoshida, Sakyo-ku, Kyoto 606-8501, Japan. Phone: 81-75-753-9559;Fax: 81-75-753-9557; E-mail: [email protected], or Stephen J. Meltzer, Division ofGastroenterology, Department ofMedicine, JohnsHopkins University School ofMedicine,Room 112, 1503 East Jefferson Street, Baltimore, MD 21231. Phone: 410-502-6071; Fax:410-502-1099; E-mail: [email protected].
I2008 American Association for Cancer Research.doi:10.1158/0008-5472.CAN-07-3043
Cancer Res 2008; 68: (9). May 1, 2008 3214 www.aacrjournals.org
Research Article
Research. on January 21, 2016. © 2008 American Association for Cancercancerres.aacrjournals.org Downloaded from
surgery; approval was obtained from the Kyoto University Institutional
Review Board (nos. #232 and #G48).
Antibodies and siRNAs. Anti-human PTTG1 rabbit polyclonal antibody,
clone Z23 (Invitrogen; diluted 1:250), was used for immunohistochemical
studies, Western blotting, and immunofluorescence staining (diluted
1:200). Mouse monoclonal anti-human h-actin antibody, clone AC-15
(1:10,000; Sigma), mouse monoclonal anti–lamin A/C antibody (1:100;
Santa Cruz Biotechnology), and mouse monoclonal anti–glyceraldehyde-3-
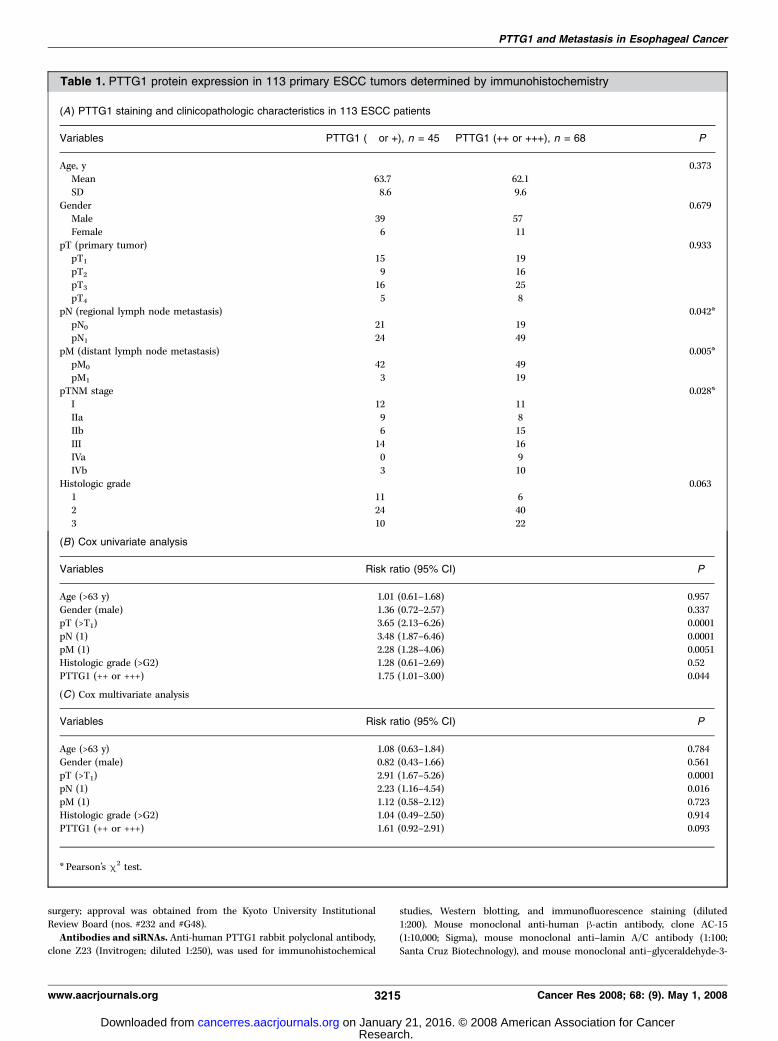
Table 1. PTTG1 protein expression in 113 primary ESCC tumors determined by immunohistochemistry
(A) PTTG1 staining and clinicopathologic characteristics in 113 ESCC patients
Variables PTTG1 (� or +), n = 45 PTTG1 (++ or +++), n = 68 P
Age, y 0.373
Mean 63.7 62.1
SD 8.6 9.6
Gender 0.679Male 39 57
Female 6 11
pT (primary tumor) 0.933pT1 15 19
pT2 9 16
pT3 16 25
pT4 5 8pN (regional lymph node metastasis) 0.042*
pN0 21 19
pN1 24 49
pM (distant lymph node metastasis) 0.005*pM0 42 49
pM1 3 19
pTNM stage 0.028*I 12 11
IIa 9 8
IIb 6 15
III 14 16IVa 0 9
IVb 3 10
Histologic grade 0.063
1 11 62 24 40
3 10 22
(B) Cox univariate analysis
Variables Risk ratio (95% CI) P
Age (>63 y) 1.01 (0.61–1.68) 0.957
Gender (male) 1.36 (0.72–2.57) 0.337pT (>T1) 3.65 (2.13–6.26) 0.0001
pN (1) 3.48 (1.87–6.46) 0.0001
pM (1) 2.28 (1.28–4.06) 0.0051Histologic grade (>G2) 1.28 (0.61–2.69) 0.52
PTTG1 (++ or +++) 1.75 (1.01–3.00) 0.044
(C) Cox multivariate analysis
Variables Risk ratio (95% CI) P
Age (>63 y) 1.08 (0.63–1.84) 0.784Gender (male) 0.82 (0.43–1.66) 0.561
pT (>T1) 2.91 (1.67–5.26) 0.0001
pN (1) 2.23 (1.16–4.54) 0.016
pM (1) 1.12 (0.58–2.12) 0.723Histologic grade (>G2) 1.04 (0.49–2.50) 0.914
PTTG1 (++ or +++) 1.61 (0.92–2.91) 0.093
* Pearson’s m2 test.
PTTG1 and Metastasis in Esophageal Cancer
www.aacrjournals.org 3215 Cancer Res 2008; 68: (9). May 1, 2008
Research. on January 21, 2016. © 2008 American Association for Cancercancerres.aacrjournals.org Downloaded from

phosphate (GAPDH) antibody, clone 71.1 (1:20,000; Sigma), were used
for Western blotting. Horseradish peroxidase–labeled antirabbit IgG
(1:2,500; Chemicon) or antimouse IgG (1:5,000; Invitrogen) was used as asecondary antibody for Western blotting. Two siRNAs directed against
PTTG1 (P1 and P2) were synthesized by Dharmacon. P1 was designed bythe authors via siDirect, an siRNA design software (12), whereas P2 hadpreviously been designed by others (13). The siRNA target sequences were
as follows: P1, 5¶-GTGACATAGATATTTAAAT-3¶ (position 638–656,NM_004219); P2, 5¶-GTCTGTAAAGACCAAGGGA-3¶ (position 264–282).A nontargeting control siRNA (NTC; Dharmacon) served as a negative
control.
Immunohistochemical staining. Resected esophageal specimenswere fixed in 10% formaldehyde and embedded in paraffin blocks. Using
4-Am-thick sections, immunohistochemical staining was done with an
Envision kit (DakoCytomation; ref. 14). As a negative control, the primary
antibody was replaced with a normal mouse IgG. All slides were
independently evaluated by two investigators (T.I. and Y.S.) lacking priorknowledge of each patient’s clinical information. Whenever opinions of these
two evaluators differed, agreement was reached by careful discussion.
Cell cultures. Human ESCC cell lines of the KYSE series, as well as HSA/c,
were established and maintained in Ham’s F12/RPMI 1640 (Invitrogen)containing 5% fetal bovine serum (FBS), as previously described (14, 15).
Nonmalignant human esophageal epithelial cells (HEEpiC; ScienCell) were
maintained in Epithelial Cell Medium 2 (ScienCell) according to theprovider’s instructions.
Western blotting and subcellular fractionation. Cells were washed
with PBS and lysed in Laemmli sample buffer (Bio-Rad) at room
temperature. Protein concentration was estimated with BCA Protein Assaykit (Pierce). Cell lysates (15 Ag) were electrophoresed on a 15%
polyacrylamide gel (Bio-Rad) and transferred onto polyvinylidene difluoride
Figure 1. PTTG1 protein expression inESCC tumor tissues and cell lines. A,PTTG1 protein expression level in primaryESCC tumors was classified according tocytoplasmic staining of PTTG1. Top left,normal esophageal epithelium with negativePTTG1 expression; top right, ESCC withweak PTTG1 expression (1+, 0–10% of cellsstained); bottom left, ESCC with moderatePTTG1 expression (2+, 10–30%); bottomright, ESCC with strong PTTG1 expression(3+, >30%). B, overall survival analysis bythe Kaplan-Meier method. PrimaryESCCs with moderate to strong PTTG1expression (2+ and 3+) were classifiedas PTTG1 positive. Patients withPTTG1-positive tumors (n = 68) hadsignificantly worse survival than did thosewith PTTG1-negative tumors (n = 45;P = 0.017, log-rank test).
Cancer Research
Cancer Res 2008; 68: (9). May 1, 2008 3216 www.aacrjournals.org
Research. on January 21, 2016. © 2008 American Association for Cancercancerres.aacrjournals.org Downloaded from

membranes (Millipore). After being blocked with TBS containing 5% skim
milk and 0.1% Tween 20 for 1 h, membranes were incubated with the
primary and secondary antibodies at room temperature for 2 and 1 h,
respectively, and then bands were visualized with enhanced chemilumines-cence plus reagent (GE Healthcare). All bands were quantified using ImageJ
v1.34 (U.S. NIH).5 For subcellular fractionation assays, nuclear and
cytoplasmic fractions were separated with NE-PER Nuclear and Cytoplas-
mic Extraction Reagents (Pierce). GAPDH and lamin A/C were usedas cytoplasmic and nuclear markers, respectively, as previously described
(16, 17).
Transfections. Three ESCC cell lines (i.e., KYSE140, KYSE410, and HSA/c) were separately and transiently transfected with three siRNAs, specifically
NTC, P1, and P2, using Lipofectamine RNAiMAX (LF; Invitrogen) according
to the manufacturer’s protocol. Cells were plated at 2 � 105 per well
onto six-well plates (Corning) 1 d before transfection (day 0). The siRNA(200 pmol/well) was transfected into cells at day 1, and total RNA and
protein were extracted at day 4. No treatment (LF�) and Lipofectamine
RNAiMAX alone (LF+) were included as negative controls.
Quantitative reverse transcription-PCR analysis. Total RNA wasextracted with Trizol reagent (Invitrogen). Quantitative reverse transcrip-
tion-PCR (RT-PCR) with SYBR Green QuantiTect RT-PCR kit (Qiagen) was
done on an iQ5 real-time PCR machine (Bio-Rad) as previously described
(10). mRNA expression in each sample was normalized to average h-actinexpression in each sample. The primer sequences are listed in Supplemen-
tary Table S1.
Immunofluorescence staining. Immunofluorescence staining was done
as previously described (18). Briefly, siRNA-transfected cells were seeded
onto a coverslip at day 4 and incubated for 1 additional day. Cells were fixed
with 1% formaldehyde in PBS for 15 min, treated with 0.2% Triton X-100 in
PBS for 10 min, blocked with 1% bovine serum albumin in PBS, and
incubated with a primary antibody and antirabbit Alexa Fluor 568
(Invitrogen) at room temperature for 1 h and 30 min, respectively. Nuclei
were counterstained with 4¶,6-diamidino-2-phenylindole (DAPI; Roche
Diagnostics). The cells were mounted and viewed under a fluorescence
microscope (Carl Zeiss).
Cell migration/invasion assays. Cell motility (chemotaxis) and
invasiveness were determined with Transwell and Matrigel chamber inserts,
respectively (24-well-format with 8-Am pores, BD Biosciences), as previouslydescribed (19). Cells (5 � 104) were seeded onto the upper chamber at day 4,
with 20% FBS in the lower chamber as a chemoattractant. After incubation
at 37jC for 24 h, membranes were stained and all cells on the lower
membrane surface were counted under a light microscope. The number ofcells migrating through Matrigel inserts represented a combination of cell
penetration through the Matrigel layer and cell migration through the small
membrane pores (20). To distinguish between these two biologicalprocesses, we defined an invasion index (i.e., cell penetration through the
Matrigel layer) as the ratio of the mean number of cells migrating through
the Matrigel insert to the mean number of cells migrating through the
Transwell membrane.In vivo lymph node metastasis assay. This assay was done using
an in vivo popliteal lymph node metastasis model (14). HSA/c cells
(3 � 106) were transfected with an siRNA in vitro , harvested 72 h after
transfection, and inoculated into both footpads of 5-wk-old male athymicnude mice (Harlan) at day 0. SiRNA (20 Ag) conjugated with
polyethylenimine (in vivo jetPEI, Polyplus Transfection) was injected
intratumorally on days 7, 14, and 21. Polyethylenimine/siRNA complexes
were prepared at a polyethylenimine/siRNA (N/P) ratio equal to 10, aspreviously described (21). For vehicle control treatments, Lipofectamine
RNAiMAX (Invitrogen) and polyethylenimine (Polyplus Transfection)
without siRNA were used in vitro and in vivo , respectively. Ten primaryfootpad tumors from five mice were analyzed for each treatment
condition (vehicle, NTC, P1, and P2). All mice were sacrificed at day 28,
and all primary tumors and popliteal lymph nodes were enucleated and
fixed in 10% formaldehyde/PBS. All lymph nodes and primary tumorswere paraffin embedded, stained with H&E and PTTG1, and examined
for the presence of metastases. All animal procedures were approved by
the institutional animal committee and executed in accordance with
institutional guidelines.Bead-array gene expression analyses. HSA/c and KYSE140 cells were
separately transfected with one of three siRNAs (NTC, P1, and P2) or with
Figure 1 Continued . C, PTTG1 protein expressionin 11 ESCC cell lines and in primary-cultured normalesophageal epithelial cells (HEEpiC). Equalamounts of whole cellular protein (15 Ag) wereloaded in all lanes. Immunoblot membranes wereprobed with anti-PTTG1 or anti–h-actin antibodies.The KYSE series and HSA/c composed the humanESCC cell lines. Bottom, PTTG1 expression foldchange in ESCC cell lines relative to HEEpiC,normalized to h-actin expression. D, subcellularlocalization of PTTG1 in ESCC cell lines (HSA/c,KYSE140, and KYSE410) and HEEpiC. Equalamounts of the cytoplasmic or nuclear fractionatedprotein (20 Ag) were loaded in all lanes. Purity offractions was verified with anti-GAPDH (cytoplasm)and anti–lamin A/C (nucleus) antibodies.C, cytoplasmic fraction; N, nuclear fraction.
5 Available at http://rsb.info.nih.gov/ij/index.html.
PTTG1 and Metastasis in Esophageal Cancer
www.aacrjournals.org 3217 Cancer Res 2008; 68: (9). May 1, 2008
Research. on January 21, 2016. © 2008 American Association for Cancercancerres.aacrjournals.org Downloaded from

Lipofectamine alone (LF+), as described above, and harvested72 h after transfection. Following RNA quality assessment done on a
Bioanalyzer 2100 (Agilent Technologies), each RNA sample (100 ng),
extracted using an RNeasy kit (Qiagen), was amplified with an Illumina
TotalPrep RNA Amplification kit (Ambion), hybridized to an IlluminaHuman RefSeq8 version 2 BeadChip containing 20,589 transcript probes
composed of optimized 50-mer oligonucleotides (Illumina), washed,and stained with Cy3-streptavidin (GE Healthcare) per manufacturer’s
instructions (22). Arrays were scanned with Illumina Beadarray Reader
confocal scanner and data were processed using Illumina BeadStudio
software. Data were subjected to intensity-dependent normalization,and differentially expressed genes associated with PTTG1 down-regulation
Figure 2. Knockdown of PTTG1expression in ESCC cells by siRNAs. HSA/c, KYSE140, and KYSE410 cells weretransfected using the following conditions:LF�, untransfected control; LF+,transfection with Lipofectamine RNAiMAXalone; NTC, nontargeting control siRNA;P1, siRNA 1 directed against PTTG1; P2,siRNA 2 directed against PTTG1.A, PTTG1 mRNA expression levels insiRNA-treated cells. Each valuerepresents the ratio of PTTG1 level versusHSA/c LF�, normalized to h-actin.Numbers at the bottom represent the ratioof PTTG1 expression for each conditionrelative to NTC-transfected cells.B, PTTG1 protein expression insiRNA-treated cells. Equal amounts ofwhole cellular protein (9 Ag) were loadedin all lanes. Numbers at the bottomrepresent the ratio of PTTG1 expressionfor each condition relative to PTTG1expression in NTC-transfected cells.C, subcellular localization of PTTG1 insiRNA-treated HSA/c cells. Equalamounts of cytoplasmic or nuclearfractionated protein (20 Ag) were loaded inall lanes. Purity of fractions was verifiedwith anti-GAPDH (cytoplasm) andanti–lamin A/C (nucleus) antibodies.D, immunofluorescence staining forPTTG1. Cells were stained with PTTG1,which was labeled with Alexa Fluor 568(red), and nuclei were counterstainedwith DAPI (blue ). Left, cells transfectedwith NTC stained without PTTG1 primaryantibody and only with secondaryantibody-Alexa Fluor 568; middle , cellstransfected with NTC; right , cellstransfected with P1. Photographs weretaken at identical exposure intervals(18.2 ms; magnification, �100).
Cancer Research
Cancer Res 2008; 68: (9). May 1, 2008 3218 www.aacrjournals.org
Research. on January 21, 2016. © 2008 American Association for Cancercancerres.aacrjournals.org Downloaded from

were identified by significance analysis of microarrays (23). All processed
and raw data are available in Minimum Information about Microarray
Gene Experiment–compliant format via the Gene Expression Omnibus.6
Accession numbers are GSE7447, GSM180360, GSM180361, GSM180362,
GSM180363, GSM180364, GSM180365, GSM180366, GSM180367, and
GSM180368. Expression profiles of HSA-P1, HSA-P2, KYSE140-P1, and
KYSE140-P2, which were designated gene profiles associated with PTTG1down-regulation, were compared with expression profiles of HSA-LF+,
HSA-NTC, KYSE140-LF+, and KYSE140-NTC, which were considered
intact-PTTG1 cell profiles. Fold changes on bead array were calculated
by dividing the average signal intensity of all down-regulated-PTTG1
profiles by the average of all intact-PTTG1 profiles. For validation of
expression profiles, the mRNA expression level of each gene was analyzed
by quantitative RT-PCR, as described above. Fold change for each geneassessed by quantitative RT-PCR was calculated as the ratio of average
expression in all PTTG1-downregulated cells (HSA-P1, HSA-P2, KYSE140-
P1, and KYSE140-P2) to average expression in all intact-PTTG1 cells (HSA-
LF+, HSA-NTC, KYSE140-LF+, and KYSE140-NTC). ELISA for basicfibroblast growth factor (bFGF; immunoassay kit, BioSource) was done
with cell culture medium according to the manufacturer’s protocol.
Statistical analyses. Survival curves were generated according to the
Kaplan-Meier method, and differences in survival were analyzed by log-ranktesting. Univariate and multivariate analyses were done using the Cox
proportional hazards model. Correlations between PTTG1 expression and
each clinicopathologic parameter were evaluated using Pearson’s m2 test.
The Tukey-Kramer multiple comparison test was used to evaluate
Figure 3. Effects of PTTG1 knockdown oncell migration in vitro and lymph nodemetastasis in vivo. A, cell migration/invasionassays in vitro. Columns, mean of triplicateexperiments; bars, SD. Left, Transwellmigration assay; numbers of cells migratingthrough Transwell membranes are shown.Middle, Matrigel invasion assay; numbers ofcells migrating through Matrigel inserts areshown. Right, invasion index (%); ratios ofcells migrating through Matrigel insertsrelative to mean numbers of cells migratingthrough Transwell membranes are shown.**, P < 0.01, versus NTC for each group(Tukey-Kramer test). B, lymph nodemetastasis assay in nude mice. Top left, aleg of a nude mouse at 28 d afterinoculation of HSA/c cells into the footpad.The leg skin was stripped to show a swollenpopliteal lymph node. The distancebetween the footpad tumor and the popliteallymph node was f1 cm. Bottom left,H&E staining of a footpad tumor(magnification, �200). Note the ‘‘cancerpearl’’ in the center. Middle, PTTG1immunostaining of a footpad tumor treatedwith NTC (top) and P1 (bottom;magnification, �100). Right, representativeH&E staining of popliteal lymph nodestreated with NTC (top) and P1 (bottom;magnification, �100).
6 http://www.ncbi.nlm.nih.gov/geo
PTTG1 and Metastasis in Esophageal Cancer
www.aacrjournals.org 3219 Cancer Res 2008; 68: (9). May 1, 2008
Research. on January 21, 2016. © 2008 American Association for Cancercancerres.aacrjournals.org Downloaded from

phenotypes of each cell. All statistical calculations were done using
StatView version 5 (SAS Institute) and Statistica version 6.1 (StatSoft).P < 0.05 was considered significant.
Results
PTTG1 protein expression in 113 primary ESCC tumors. Asshown in Table 1A , 23 patients were with stage I, 17 with stage IIa,21 with stage IIb, 30 with stage III, 9 with stage IVa, and 13 withstage IVb ESCCs. The pattern of PTTG1 staining in ESCC wasdifferent from that observed in normal epithelium. In ESCC cells,PTTG1 staining was usually observed in the cytoplasm and onlyoccasionally in the nucleus (Fig. 1A). In contrast, PTTG1 staining innormal esophageal epithelia was never observed in the cytoplasm,but still occasionally in the nucleus (f10% of cases; data notshown), particularly in the proliferative layer just above the basalcells. PTTG1 expression in ESCC specimens, evaluated basedexclusively on cytoplasmic staining, occurred as follows:14 tumors were negative for expression (�), 31 manifestedexpression in 0% to 10% of tumor cells (1+), 52 revealed expressionin 10% to 30% of tumor cells (2+), and 16 were characterized byexpression in >30% of tumor cells (3+). Next, we classified 2+ or3+ PTTG1 expression as PTTG1 positive (68 of 113, 60.2%). Underthis classification system, PTTG1 expression was significantlyassociated with regional lymph node metastasis (pN; P = 0.042),distant lymph node metastasis (pM; P = 0.005), and tumor stage(pTNM; P = 0.028), but not with depth of primary tumor invasion(pT; P = 0.933). Kaplan-Meier survival analysis showed thatpatients with PTTG1-positive tumors had significantly worsesurvivals than did those with PTTG1-negative tumors (P = 0.017,log-rank test; Fig. 1B). Furthermore, univariate analyses revealedthat PTTG1 expression was a significant predictor of survival[risk ratio, 1.75; 95% confidence interval (95% CI), 1.01–3.00;P = 0.044; Table 1B]. Multivariate analyses revealed that PTTG1expression tended to be an independent prognostic factor,although this trend did not achieve statistical significance
(risk ratio, 1.61; 95% CI, 0.92–2.91; P = 0.093; Table 1C). Severaltumors showed strong PTTG protein expression in cell nuclei. Wealso evaluated nuclear staining in all 113 ESCC tumors. NuclearPTTG1 protein expression occurring in >10% of tumor cells wasobserved in only 7 of 113 (6.2%) ESCC tumors. However, nuclearPTTG1 staining did not correlate with any clinicopathologicfeatures or survival. We also compared the no-expression group(�; n = 14) to the any-expression group (1+–3+; n = 99).In this analysis, any level of PTTG1 expression was associated withdistant lymph node metastasis (pM; P = 0.049), but not with primarytumor invasion (pT; P = 0.532), regional lymph node metastasis(pN; P = 0.222), tumor stage (pTNM; P = 0.523), or histologicgrade (P = 0.098). Kaplan-Meier survival analysis showed a trendtoward association of any PTTG1 expression with poor survival(P = 0.164, log-rank test). Interestingly, none of the 14 PTTG1-negative tumors gave rise to distant lymph node metastases.PTTG1 protein expression in squamous esophageal cells.We
performed Western blotting to assess PTTG1 protein levels in 11ESCC cell lines and in cultured normal esophageal epithelial cells(HEEpiC; Fig. 1C). PTTG1 expression in all 11 ESCC cell lines was2.4 to 6.6 times higher than in HEEpiC cells. To determinesubcellular localization of PTTG1 expression, the relative nuclearversus cytoplasmic distribution of PTTG1 protein was examined inHSA/c, KYSE140, KYSE410, and HEEpiC cells by subcellularfractionation (Fig. 1D). Purity of fractions was verified by probingmembranes with cytoplasmic (GAPDH) or nuclear (lamin A/C)protein-specific antibodies. PTTG1 in HEEpiC cells was expressedonly in the nucleus, but not in the cytoplasm. Conversely, PTTG1 inHSA/c, KYSE140, and KYSE410 cells was expressed in both thecytoplasm and nucleus. To evaluate the effect of PTTG1knockdown in ESCC cells, we selected HSA/c, KYSE140, andKYSE410 for further analyses because of their high native PTTG1expression levels.Knockdown of PTTG1 expression in ESCC cells. We
transiently transfected either a PTTG1 siRNA (P1 or P2) or a
Table 2. Effect of PTTG1 knockdown on lymph node metastasis in vivo
(A) PTTG1 siRNA treatment in lymph node metastasis model
Treatment No. mice No. total LNs No. metastatic LNs Metastatic ratio (%)
Vehicle 5 10 5 50
NTC 5 10 5 50
P1 5 10 2 20
P2 5 11 1 9.1total 20 41 13 31.7
(B) Relationship between PTTG1 down-regulation and lymph node metastasis
PTTG1 status No. metastatic LNs (%) No. nonmetastatic LNs (%)
PTTG1(+)* 10 (50) 10 (50)
PTTG1(�)c
3 (14.3) 18 (85.7)
total 13 (31.7) 28 (68.3)
NOTE: Metastatic ratio = number of metastatic lymph nodes / number of total lymph nodes.
Abbreviation: LNs, lymph nodes.
* Vehicle and NTC (n = 20).cP1 and P2 (n = 21); P = 0.020, Fisher’s exact test.
Cancer Research
Cancer Res 2008; 68: (9). May 1, 2008 3220 www.aacrjournals.org
Research. on January 21, 2016. © 2008 American Association for Cancercancerres.aacrjournals.org Downloaded from

NTC into three different ESCC cell lines (HSA/c, KYSE140, andKYSE410). By quantitative RT-PCR, PTTG1 mRNA expression wasinhibited by 84% to 86% in HSA/c, 88% to 93% in KYSE140, and 90%to 92% in KYSE410 cells (Fig. 2A). By Western blotting, PTTG1protein expression was inhibited by 77% to 93% in HSA/c, 86% to88% in KYSE140, and 92% to 97% in KYSE410 cells (Fig. 2B). Byfluorescence microscopy and flow cytometry, we confirmed thattransfected FAM-labeled siRNAs were taken up by >90% of cells(data not shown). A subcellular fractionation assay in PTTG1-down-regulated HSA/c cells showed that both of the PTTG1siRNAs (P1 and P2) suppressed both nuclear and cytoplasmicPTTG1 expression (Fig. 2C). We also examined PTTG1 expressionin these cells by immunofluorescence staining (Fig. 2D). WhereasPTTG1 was expressed in both the cytoplasm and nucleus of ESCCcells in negative control transfections (LF+ and NTC), the siRNAsdirected against PTTG1 (P1 and P2) markedly suppressed PTTG1expression in these cells, corroborating the results of Westernblotting.PTTG1 knockdown reduces motility of ESCC cells. Cell
motility and invasiveness were determined by Transwell andMatrigel chamber assays, respectively (Fig. 3A). PTTG1 knock-down in HSA/c, KYSE140, and KYSE410 cells reduced the numberof cells migrating through Transwell and Matrigel chambers by94.0% to 67.8% and by 94.1% to 70.7%, respectively (P < 0.01,versus NTC). In contrast, invasion index, representing the degreeof cell penetration through the Matrigel layer, was not altered byPTTG1 inhibition.PTTG1 knockdown suppresses lymph node metastasis
in vivo. We examined the effect of PTTG1 knockdown, usinga popliteal lymph node metastasis model, in nude mice(Fig. 3B, top left). In separate experiments, highly metastaticHSA/c cells were transfected with either siRNA P1 or siRNA P2and then inoculated into the footpads of nude mice at day 0. Tomaintain the knockdown effects of PTTG1, we carried outadditional in vivo transfections by injecting siRNAs intratumorallywith polyethylenimine weekly from day 7 to day 21. At day 28, allmice were sacrificed and all footpad tumors (Fig. 3B, bottom left)and popliteal lymph nodes were obtained and analyzed. PTTG1immunostaining (Fig. 3B, middle) showed that PTTG1 expressionin footpad tumors was inhibited by both PTTG1 siRNAs (P1 andP2) compared with negative control transfections (vehicle onlyand NTC). As shown in Table 2A , ratios of metastatic to totaldissected popliteal lymph nodes were lower in both PTTG1 siRNAgroups than in vehicle-only or NTC groups [50.0% (5 of 10) invehicle, 50.0% (5 of 10) in NTC, 20.0% (2 of 10) in P1, and 9.1%(1 of 11) in P2]. Moreover, this difference in metastatic ratiosachieved statistical significance (P = 0.020, Fisher’s exact test;Table 2B) when metastatic ratios were compared between thePTTG1-down-regulated group [PTTG1(�): P1 and P2] and theintact-PTTG1 group [PTTG1(+): vehicle only and NTC]. Repre-sentative H&E staining of a metastatic lymph nodein NTC and a nonmetastatic lymph node in P1 is shown inFig. 3B (top right and bottom right , respectively).Identification of potential downstream genes in the PTTG1
pathway in ESCC. To identify target genes potentially regulatedby PTTG1, we conducted bead array–based genome-wide mRNAprofiling. As shown in Table 3, PTTG1 siRNA treatment resultedin the up-regulation of 12 genes and down-regulation of 8 genesin HSA/c and KYSE140 cells. Differentially expressed genespreviously reported as being cell motility–related included severalRas and Rho family members, such as RRAS (related-ras viral
oncogene homologue), RHOG (ras homologue gene family,member G), ARHGAP1 (Rho GTPase activating protein 1), andARHGDIA (Rho GDP dissociation inhibitor a). We then confirmeddifferential expression of selected genes in these same RNAsamples by quantitative RT-PCR and found that fold changes ingene expression discovered by bead array correlated stronglywith fold changes found by quantitative RT-PCR (r2 = 0.885;P < 0.0001, Pearson’s correlation coefficient). PTTG1 wasidentified as the gene most markedly down-regulated among20,589 transcripts, closely agreeing with quantitative RT-PCRresults for PTTG1 (bead-array fold change, 0.12; quantitative RT-PCR fold change, 0.14).Additionally, we examined the expression levels of known PTTG1-
related genes, including bFGF (bead-array fold change, 0.93;quantitative RT-PCR fold change, 0.96) and VEGF (vascularendothelial growth factor; bead-array fold change, 0.97; quantitativeRT-PCR fold change, 1.02). This analysis revealed that PTTG1 down-regulation in HSA/c and KYSE140 cells did not alter the mRNAexpression levels of bFGF and VEGF . Moreover, ELISA assaysconfirmed that PTTG1 knockdown treatment did not alter bFGFsecretion levels in HSA/c and KYSE140 cells (HSA-LF+, 41.3F 4.2 pg/mL; HSA-NTC, 36.0F 6.4 pg/mL; HSA-P1, 41.2F 2.6 pg/mL; HSA-P2,41.4 F 3.2 pg/mL; KYSE140-LF+, 34.9 F 7.1 pg/mL; KYSE140-NTC,38.4 F 4.5 pg/mL; KYSE140-P1, 37.4 F 4.7 pg/mL; and KYSE140-P2,37.3 F 9.1 pg/mL; average value F SD, not significant).
Discussion
Several studies have shown that PTTG1 expression in primarytumors is associated with metastasis (5–7). However, biologicalevidence based on animal experiments has not yet clarified therelationship between PTTG1 and cancer metastasis. In thecurrent study, to our knowledge for the first time, we haveshown that overexpression of PTTG1 in ESCC cells increases cellmotility and promotes lymph node metastasis based on in vitroand in vivo functional assays.Overexpression of PTTG1 protein was a frequent event in ESCC
primary tumors and cell lines (Table 1A ; Fig. 2A). This findingconfirmed the observation in previous studies that PTTG1 isimplicated in the development, progression, and lymph nodemetastasis of breast, gastric, and esophageal cancers (5–7). OurPTTG1 protein expression data in 113 tumors were compatiblewith these results. In the current study, protein levels of PTTG1were associated with the presence of lymph node metastases inESCC. In addition, PTTG1 expression was a significant survivalpredictor in univariate analyses, whereas PTTG1 was not anindependent predictor by multivariate analysis. Because lymphnode status is strongly associated with PTTG1 expression leveland patient survival (Table 1A and B), PTTG1 expression maycontribute to poor patient survival (Fig. 1B) by promoting lymphnode metastasis.PTTG1 protein expression was observed in both the cytoplasm
and nucleus in ESCC primary tumors and cell lines. In contrast,PTTG1 was localized only to the nucleus in normal esophagealepithelial cells, particularly in the proliferative esophagealepithelial layer just above the basal cells (Fig. 1A). Westernblotting using subcellular fractionated samples (Fig. 2B) con-firmed this immunohistochemical finding as well as the findingsin other normal cell types (24). This difference in subcellularlocalization of PTTG1 protein between normal and cancer cellssuggests that PTTG1 localized to the nucleus may play aphysiologic role in normal cell division, whereas PTTG1 localized
PTTG1 and Metastasis in Esophageal Cancer
www.aacrjournals.org 3221 Cancer Res 2008; 68: (9). May 1, 2008
Research. on January 21, 2016. © 2008 American Association for Cancercancerres.aacrjournals.org Downloaded from

Table 3. Genes differentially expressed after anti-PTTG1 siRNA treatment in HSA/c and KYSE140 cells
Accession no. Gene symbol Description; relationship with cancer D-score
(bead array-SAM)
Fold
change(bead array)
Fold
change(quantitative RT-PCR)
Up-regulated genesNM_001219 CALU calumenin; calcium-binding protein,
down-regulated in metastatic head and
neck cancer cells, related to bettersurvival in lung cancer
1.87 1.7 2.25
NM_019558 HOXD8 homeobox D8; possible
tumor suppressor
1.54 1.17 1.16
NM_006931 SLC2A3 solute carrier family 2, glucosetransporter/GLUT3; cancer relation unknown
1.27 2.13 1.4
NM_001498 GCLC glutamate-cysteine ligase, catalytic
subunit; possible suppressor
in breast cancer
1.15 1.65 1.4
NM_001072 UGT1A6 UDP glucuronosyltransferase 1 family,
polypeptide A6, transcript variant 1; its
polymorphism relates to metabolism of
nonsteroidal anti-inflammatory drugsand carcinogenesis
1.00 1.65 1.87
NM_003932 ST13 suppression of tumorigenicity 13
(heat shock protein 70 interacting protein);down-regulated in colon and gastric cancers
0.89 1.6 1.11
NM_004887 CXCL14 chemokine (C-X-C motif)
ligand 14; angiogenesis
inhibitor, chemotactic factor in dendritic cells
0.81 1.58 2.25
NM_205862 UGT1A6 UDP glucuronosyltransferase 1 family,
polypeptide A6, transcript variant 2
0.74 1.6 1.87
NM_003246 THBS1 thrombospondin 1; possible
angiogenic inhibitor
0.65 1.76 1.27
NM_013253 DKK3 dickkopf homologue 3; possible
suppressor for melanoma
0.58 1.7 1.36
NM_001627 ALCAM activated leukocyte cell adhesion molecule;possible metastasis suppressor in breast cancer
0.54 1.46 1.73
NM_001005340 GPNMB glycoprotein (transmembrane) nmb; possible
metastasis suppressor in melanoma
0.30 1.66 1.41
NM_003739 AKR1C3 aldo-keto reductase family 1,member C3; possible
suppressor in prostate cancer
0.25 2.12 1.87
Down-regulated genes
NM_004219 PTTG1 pituitary tumor-transforming gene 1 �9.34 0.12 0.14NM_002808 PSMD2 proteasome 26S subunit 2; overexpressed
in breast cancer
�2.26 0.76 0.85
NM_001416 EIF4A1 eukaryotic translation initiation factor 4A,isoform 1; metastasis-associated gene in lung cancer
�1.63 0.72 0.81
NM_004309 ARHGDIA Rho GDP dissociation inhibitor a/RhoGDIa;related to actin cytoskeletal rearrangements,
related to poor prognosis in lung cancer
�1.55 0.82 0.92
NM_006270 RRAS related RAS viral oncogene homologue;
promotes cell motility and metastasis
in cervical cancer
�1.53 0.73 0.7
NM_001665 RHOG ras homologue gene family, member G/ARHG;promotes cytoskeletal reorganization and
migration, related to lymph node metastasis
and poor prognosis in breast cancer
�1.24 0.86 0.74
NM_004308 ARHGAP1 Rho GTPase activating protein1/RhoGAP1; modulates Rho-mediated
signaling pathways through
activation of p21-Rho, cancer relation unknown
�1.21 0.85 0.83
(Continued on the following page)
Cancer Research
Cancer Res 2008; 68: (9). May 1, 2008 3222 www.aacrjournals.org
Research. on January 21, 2016. © 2008 American Association for Cancercancerres.aacrjournals.org Downloaded from

to the cytoplasm may be related to the malignant phenotype.Therefore, it is reasonable to categorize PTTG1 expression levelsby cytoplasmic staining of PTTG1 in ESCC cells. In fact, nuclearPTTG1 staining in 113 ESCC tumors did not correlate with anyclinicopathologic features, whereas cytoplasmic PTTG1 stainingcorrelated with several clinical parameters. Mechanisms under-lying dysregulation in the subcellular translocation of PTTG1 inESCC cells remain unclear. However, two different siRNAsdirected against PTTG1 effectively knocked down both cytoplas-mic and nuclear PTTG1 protein expression in ESCC cells.The process of lymph node metastasis consists of many steps,
including tumor enlargement, lymphangiogenesis, migration intolymphatic capillaries, survival in the lymphatic stream, entry intothe subcapsular sinus, invasion of the lymph node cortex, andpersistent proliferation (25). The endothelium of lymph capillaryhas overlapping loose junctions and a discontinuous or absentbasement membrane, permitting the passage of large biologicalmacromolecules, pathogens, and migrating cells (26). Oncetumor cells reach the adjacent lymphatic capillaries ( formationof intratumor lymphatic capillaries may be unnecessary; ref. 27),tumor cells migrate into capillary lumina either through openinterendothelial gaps or by inducing the opening of closed gaps(18). As clearly shown in Transwell and Matrigel chamber assayswith siRNAs against PTTG1, PTTG1 knockdown reduced cellmotility, but interestingly, not penetration through the Matrigellayer. This finding suggests that PTTG1 may promote the entryof tumor cells into lymph capillary lumina by increasing tumorcell motility, which is considered an early stage in the multisteptheory of lymph node metastasis. Previously, we have shown thatcell motility is closely associated with lymph node metastasisand poor survival (14, 18, 28, 29). For example, reducedexpression of motility-related protein 1 and overexpression ofchemokine (CC motif) receptor 7 were associated with lymphnode metastases in ESCCs (28, 29). Similarly, overexpression offascin, an actin-bundling protein related to cell motility, wassignificantly associated with regional lymph node metastasis andpoor survival in ESCC patients, and down-regulation of fascin inESCC cells decreased their motility (18). Moreover, overexpres-sion of osteopontin, an integrin-binding secreted glycoproteinassociated with cell motility, was significantly associated withdistant lymph node metastasis and poor survival of ESCCpatients, and knockdown of osteopontin expression in ESCCcells induced by an inducible short hairpin RNA vectordecreased their motility, invasiveness, and popliteal lymph node
metastasis from footpads of nude mice (14). As shown in thecurrent study, knockdown of PTTG1 expression in ESCC cells byin vitro and in vivo transfection significantly decreased popliteallymph node metastases from footpads in nude mice. Thus,PTTG1 may be related to cell motility and lymph nodemetastasis in ESCC.To identify potential downstream genes in the PTTG1 pathway,
we performed global gene expression profiling using a beadarray–based technique and siRNAs directed against PTTG1. Asshown in Table 3, siRNAs directed against PTTG1 down-regulatedthe expression of several Ras and Rho gene family membersknown to play central roles in cell motility via actin cytoskeletonrearrangement (30). Some of the genes identified by this strategyhave exhibited clinical correlation with poor survival ormetastasis. RRAS , which plays a key role in cell motility bymodulating Rho and Rac activities (31), promotes metastasis incervical cancer (32). RHOG , which regulates cell motility throughRac1 activation (33), is related to lymph node metastasis andpoor prognosis in breast cancer patients (34). ARHGDIA , whichacts as an inhibitor of Rho family members, is related to poorsurvival in lung cancer patients (35). ARHGAP1 modulates Rho-mediated signaling pathways through activation of p21-Rho (36),but the relationship between ARHGAP1 and cancer metastasis isunknown. Interestingly, FSCN1 ( fascin), which regulates cellmotility through its actin-bundling function, was also down-regulated in our study by siRNAs against PTTG1. In contrast,potential tumor suppressors or metastasis suppressors, includingCALU (37, 38), HOXD8 (39), GCLC (40), ST13 (41), and CXCL14(42), were up-regulated by PTTG1 down-regulation. THBS1(thrombospondin 1), a potential angiogenesis inhibitor, was up-regulated by PTTG1 down-regulation. Consistent with this result,Kim et al. (43) reported that THBS1 expression was suppressed inPTTG1-overexpressing thyroid cells, and that down-regulation ofPTTG1 increased THBS1 expression. THBS1 also predicts poorsurvival and represents a marker of tumor aggressiveness inthyroid cancer (44). bFGF and VEGF, which are known PTTG1-related genes, were also included in the gene list derived from ourexpression profiling. However, their expression levels did notchange after PTTG1 knockdown in our experimental setting.Thus, cell motility regulated by PTTG1 could be independent ofbFGF or VEGF in ESCC cells. Taken together, these microarrayresults suggest that PTTG1 may modulate the expression ofmultiple cell motility–related genes, including Ras-Rho oncogenesuperfamily members, and provide potentially valuable clues
Table 3. Genes differentially expressed after anti-PTTG1 siRNA treatment in HSA/c and KYSE140 cells (Cont’d)
Accession no. Gene symbol Description; relationship with cancer D-score
(bead array-SAM)
Fold
change(bead array)
Fold
change(quantitative RT-PCR)
NM_003088 FSCN1 fascin; actin-bundling protein, promotes cellmigration, related to lymph node metastasis
in esophageal cancer
�1.13 0.71 0.89
NM_002205 ITGA5 integrin, a5, fibronectin receptor a; relatedto invasion of bladder cancer
�0.62 0.58 0.73
Abbreviation: SAM, significance analysis of microarrays.
PTTG1 and Metastasis in Esophageal Cancer
www.aacrjournals.org 3223 Cancer Res 2008; 68: (9). May 1, 2008
Research. on January 21, 2016. © 2008 American Association for Cancercancerres.aacrjournals.org Downloaded from

to understanding the mechanisms underlying cell migrationregulated by PTTG1.In summary, PTTG1 overexpression in ESCC primary tumors
was associated with lymph node metastasis and poor survival, andPTTG1 knockdown inhibited ESCC cell motility in vitro and lymphnode metastasis in vivo , possibly by regulating Ras-Rho motility-related gene family members. Therefore, it is possible that PTTG1promotes lymph node metastasis in ESCC by enhancing cellmotility. In addition, PTTG1 may represent a useful biomarker ofpoor survival and lymph node metastasis in ESCC, as well as apromising therapeutic target for the treatment of lymph nodemetastases in ESCC patients.
Acknowledgments
Received 8/7/2007; revised 2/18/2008; accepted 3/5/2008.Grant support: National Cancer Institute grants R01 CA01808-01, CA85069, and
CA106763 (S.J. Meltzer) and Japanese Ministry of Education, Culture, Sports, Science,and Technology grant 14370385 (Y. Shimada).
The costs of publication of this article were defrayed in part by the payment of pagecharges. This article must therefore be hereby marked advertisement in accordancewith 18 U.S.C. Section 1734 solely to indicate this fact.
We thank Sakiko Shimada for assistance in immunohistochemistry; Dr. Fred Bunz,Leslie Meszler, and Lillian Dasko-Vincent (Cell Imaging Core, Johns Hopkins University)for assistance in flow cytometry; Dr. Chris Cheadle and Tonya Watkins (Genomics Core,Johns Hopkins University) for support in the bead array analysis; Dr. Sandra Gugginoand Jennifer Sipes (Digestive Disease Basic Research Development Center DK06388,Johns Hopkins University) for technical support in animal studies; and Drs. GoWatanabe and Atsushi Itami (Kyoto University) for providing clinical samples.
References1. Parkin DM, Bray F, Ferlay J, Pisani P. Global cancerstatistics, 2002. CA Cancer J Clin 2005;55:74–108.
2. Sato F, Shimada Y, Li Z, Watanabe G, Maeda M,Imamura M. Lymph node micrometastasis and progno-sis in patients with oesophageal squamous cell carci-noma. Br J Surg 2001;88:426–32.
3. Pei L, Melmed S. Isolation and characterization of apituitary tumor-transforming gene (PTTG). Mol Endo-crinol 1997;11:433–41.
4. Bradshaw C, Kakar SS. Pituitary tumor transforminggene: an important gene in normal cellular functionsand tumorigenesis. Histol Histopathol 2007;22:219–26.
5. Shibata Y, Haruki N, Kuwabara Y, et al. Expression ofPTTG (pituitary tumor transforming gene) in esopha-geal cancer. Jpn J Clin Oncol 2002;32:233–7.
6. Solbach C, Roller M, Fellbaum C, Nicoletti M,Kaufmann M. PTTG mRNA expression in primarybreast cancer: a prognostic marker for lymph nodeinvasion and tumor recurrence. Breast 2004;13:80–1.
7. Wen CY, Nakayama T, Wang AP, et al. Expression ofpituitary tumor transforming gene in human gastriccarcinoma. World J Gastroenterol 2004;10:481–3.
8. Boelaert K, McCabe CJ, Tannahill LA, et al. Pituitarytumor transforming gene and fibroblast growth factor-2expression: potential prognostic indicators in differen-tiated thyroid cancer. J Clin Endocrinol Metab 2003;88:2341–7.
9. Ramaswamy S, Ross KN, Lander ES, Golub TR. Amolecular signature of metastasis in primary solidtumors. Nat Genet 2003;33:49–54.
10. Sato F, Abraham JM, Yin J, et al. Polo-like kinaseand survivin are esophageal tumor-specific promoters.Biochem Biophys Res Commun 2006;342:465–71.
11. Sobin L, Wittekind C. TNM classification ofmalignant tumours. 6th ed. New York: Wiley-Liss;2002. p. 60–4.
12. Naito Y, Yamada T, Ui-Tei K, Morishita S, Saigo K.siDirect: highly effective, target-specific siRNA designsoftware for mammalian RNA interference. NucleicAcids Res 2004;32:W124–9.
13. Tfelt-Hansen J, Yano S, Bandyopadhyay S, Carroll R,Brown EM, Chattopadhyay N. Expression of pituitarytumor transforming gene (PTTG) and its bindingprotein in human astrocytes and astrocytoma cells:function and regulation of PTTG in U87 astrocytomacells. Endocrinology 2004;145:4222–31.
14. Ito T, Hashimoto Y, Tanaka E, et al. An inducibleshort-hairpin RNA vector against osteopontin reducesmetastatic potential of human esophageal squamouscell carcinoma in vitro and in vivo . Clin Cancer Res2006;12:1308–16.
15. Shimada Y, Imamura M, Wagata T, Yamaguchi N,Tobe T. Characterization of 21 newly establishedesophageal cancer cell lines. Cancer 1992;69:277–84.
16. Voss OH, Batra S, Kolattukudy SJ, Gonzalez-MejiaME, Smith JB, Doseff AI. Binding of caspase-3 prodo-main to heat shock protein 27 regulates monocyteapoptosis by inhibiting caspase-3 proteolytic activation.J Biol Chem 2007;282:25088–99.
17. Hirota A, Kawachi Y, Itoh K, et al. Ultraviolet Airradiation induces NF-E2-related factor 2 activation indermal fibroblasts: protective role in UVA-inducedapoptosis. J Invest Dermatol 2005;124:825–32.
18. Hashimoto Y, Ito T, Inoue H, et al. Prognosticsignificance of fascin overexpression in human esoph-ageal squamous cell carcinoma. Clin Cancer Res 2005;11:2597–605.
19. Ito T, Shimada Y, Hashimoto Y, et al. Involvement ofTSLC1 in progression of esophageal squamous cellcarcinoma. Cancer Res 2003;63:6320–6.
20. Keck T, Balcom JHt, Fernandez-del Castillo C,Antoniu BA, Warshaw AL. Matrix metalloproteinase-9promotes neutrophil migration and alveolar capillaryleakage in pancreatitis-associated lung injury in the rat.Gastroenterology 2002;122:188–201.
21. Grzelinski M, Urban-Klein B, Martens T, et al. RNAinterference-mediated gene silencing of pleiotrophinthrough polyethylenimine-complexed small interferingRNAs in vivo exerts antitumoral effects in glioblastomaxenografts. Hum Gene Ther 2006;17:751–66.
22. Kuhn K, Baker SC, Chudin E, et al. A novel, high-performance random array platform for quantitativegene expression profiling. Genome Res 2004;14:2347–56.
23. Tusher VG, Tibshirani R, Chu G. Significance analysisof microarrays applied to the ionizing radiationresponse. Proc Natl Acad Sci U S A 2001;98:5116–21.
24. Vlotides G, Eigler T, Melmed S. Pituitary tumor-transforming gene: physiology and implications fortumorigenesis. Endocr Rev 2007;28:165–86.
25. Sleeman JP, Krishnan J, Kirkin V, Baumann P.Markers for the lymphatic endothelium: in search ofthe holy grail? Microsc Res Tech 2001;55:61–9.
26. Padera TP, Kadambi A, di Tomaso E, et al. Lymphaticmetastasis in the absence of functional intratumorlymphatics. Science 2002;296:1883–6.
27. Nathanson SD. Insights into the mechanisms oflymph node metastasis. Cancer 2003;98:413–23.
28. Uchida S, Shimada Y, Watanabe G, et al. Motility-related protein (MRP-1/CD9) and KAI1/CD82 expres-sion inversely correlate with lymph node metastasis inoesophageal squamous cell carcinoma. Br J Cancer 1999;79:1168–73.
29. Ding Y, Shimada Y, Maeda M, et al. Association of CCchemokine receptor 7 with lymph node metastasis of
esophageal squamous cell carcinoma. Clin Cancer Res2003;9:3406–12.
30. Yamazaki D, Kurisu S, Takenawa T. Regulation ofcancer cell motility through actin reorganization.Cancer Sci 2005;96:379–86.
31. Wozniak MA, Kwong L, Chodniewicz D, Klemke RL,Keely PJ. R-Ras controls membrane protrusion and cellmigration through the spatial regulation of Rac and Rho.Mol Biol Cell 2005;16:84–96.
32. Mora N, Rosales R, Rosales C. R-Ras promotesmetastasis of cervical cancer epithelial cells. CancerImmunol Immunother 2007;56:535–44.
33. Katoh H, Hiramoto K, Negishi M. Activation of Rac1 byRhoG regulates cell migration. J Cell Sci 2006;119:56–65.
34. Jiang WG, Watkins G, Lane J, et al. Prognostic valueof rho GTPases and rho guanine nucleotide dissociationinhibitors in human breast cancers. Clin Cancer Res2003;9:6432–40.
35. Blackhall FH, Wigle DA, Jurisica I, et al. Validating theprognostic value of marker genes derived from a non-small cell lung cancer microarray study. Lung Cancer2004;46:197–204.
36. Kandpal RP. Rho GTPase activating proteins incancer phenotypes. Curr Protein Pept Sci 2006;7:355–65.
37. Chen G, Gharib TG, Wang H, et al. Protein profilesassociated with survival in lung adenocarcinoma. ProcNatl Acad Sci U S A 2003;100:13537–42.
38. Wu W, Tang X, Hu W, Lotan R, Hong WK, Mao L.Identification and validation of metastasis-associatedproteins in head and neck cancer cell lines by two-dimensional electrophoresis and mass spectrometry.Clin Exp Metastasis 2002;19:319–26.
39. Makiyama K, Hamada J, Takada M, et al. Aberrantexpression of HOX genes in human invasive breastcarcinoma. Oncol Rep 2005;13:673–9.
40. Soini Y, Karihtala P, Mantyniemi A, Turunen N,Paakko P, Kinnula V. Glutamate-L-cysteine ligase inbreast carcinomas. Histopathology 2004;44:129–35.
41. Wang LB, Zheng S, Zhang SZ, et al. Expression ofST13 in colorectal cancer and adjacent normal tissues.World J Gastroenterol 2005;11:336–9.
42. Ozawa S, Kato Y, Komori R, Maehata Y, Kubota E,Hata R. BRAK/CXCL14 expression suppresses tumorgrowth in vivo in human oral carcinoma cells. BiochemBiophys Res Commun 2006;348:406–12.
43. Kim DS, Franklyn JA, Stratford AL, et al. Pituitarytumor-transforming gene regulates multiple down-stream angiogenic genes in thyroid cancer. J ClinEndocrinol Metab 2006;91:1119–28.
44. Tanaka K, Sonoo H, Kurebayashi J, et al. Inhibition ofinfiltration and angiogenesis by thrombospondin-1 inpapillary thyroid carcinoma. Clin Cancer Res 2002;8:1125–31.
Cancer Research
Cancer Res 2008; 68: (9). May 1, 2008 3224 www.aacrjournals.org
Research. on January 21, 2016. © 2008 American Association for Cancercancerres.aacrjournals.org Downloaded from

2008;68:3214-3224. Cancer Res Tetsuo Ito, Yutaka Shimada, Takatsugu Kan, et al. Cell CarcinomaPromotes Lymph Node Metastasis in Esophageal Squamous Pituitary Tumor-Transforming 1 Increases Cell Motility and
Updated version
http://cancerres.aacrjournals.org/content/68/9/3214
Access the most recent version of this article at:
Material
Supplementary
http://cancerres.aacrjournals.org/content/suppl/2008/04/25/68.9.3214.DC1.html
Access the most recent supplemental material at:
Cited articles
http://cancerres.aacrjournals.org/content/68/9/3214.full.html#ref-list-1
This article cites 43 articles, 15 of which you can access for free at:
Citing articles
http://cancerres.aacrjournals.org/content/68/9/3214.full.html#related-urls
This article has been cited by 8 HighWire-hosted articles. Access the articles at:
E-mail alerts related to this article or journal.Sign up to receive free email-alerts
Subscriptions
Reprints and
To order reprints of this article or to subscribe to the journal, contact the AACR Publications
Permissions
To request permission to re-use all or part of this article, contact the AACR Publications
Research. on January 21, 2016. © 2008 American Association for Cancercancerres.aacrjournals.org Downloaded from