Physical Property Parameter Set for Mode/ing ICPP Aqueous Wastes ...
97
Idaho National Engineering Laboratory INEL-96/0234 September 1996 OCT 0 7 1998 OSTI Physical Property Parameter Set for Mode/ing ICPP Aqueous Wastes with ASPEN Electrolyte NRTL Model R. E. Schindler DISTRIBUTION OF THIS DOCUMENT IS VUflO LOCKHEED MARTIN?
-
Upload
khangminh22 -
Category
Documents
-
view
5 -
download
0
Transcript of Physical Property Parameter Set for Mode/ing ICPP Aqueous Wastes ...

IdahoNational
EngineeringLaboratory
INEL-96/0234
September 1996
OCT 0 7 1998
OSTI
Physical Property Parameter Setfor Mode/ing ICPP Aqueous Wasteswith ASPEN Electrolyte NRTL Model
R. E. Schindler
DISTRIBUTION OF THIS DOCUMENT IS V U f l O
LOCKHEED MARTIN?
DISCLAIMER
Portions of this document may be illegiblein electronic image products. Images areproduced from the best available originaldocument.
DISCLAIMER
This report was prepared as an account of work sponsored by an agency of theUnited States Government Neither the United States Government nor any agencythereof, nor any of their employees, makes any warranty, express or implied, orassumes any legal liability or responsibility for the accuracy, completeness, or use-fulness of any information, apparatus, product, or process disclosed, or representsthat its use would not infringe privately owned rights. Reference herein to any spe-cific commercial product, process, or service by trade name, trademark, manufac-turer, or otherwise does not necessarily constitute or imply its endorsement, recom-mendation, or favoring by the United States Government or any agency thereof.The views and opinions of authors expressed herein do not necessarily state orreflect those of the United States Government or any agency thereof.

INEL-96/0234
Physical Property Parameter Set for Modeling ICPPAqueous Wastes with ASPEN Electrolyte NRTL Model
R. E. Schindler
Published September 1996
Idaho National Engineering LaboratoryNuclear Operations Department
Lockheed Martin Idaho Technologies CompanyIdaho Falls, Idaho 83415
Prepared for theU.S. Department of Energy
Assistant Secretary for Environmental ManagementUnder DOE Idaho Operations Office
Contract DE-AC07-94ID13223

ABSTRACT
The aqueous waste evaporators at the Idaho Chemical Processing Plant (ICPP) are being modeledusing ASPEN software leased from a vendor. The ASPEN software calculates chemical and vapor-liquidequilibria with activity coefficients calculated using the electrolyte Non-Random Two Liquid (NRTL)model for local excess Gibbs free energies of interactions between ions and molecules in solution. Theuse of the electrolyte NRTL model requires the determination of empirical parameters for the excessGibbs free energies of the interactions between species in solution. This report covers the developmentof a set parameters, from literature data, for the use of the electrolyte NRTL model with the majorsolutes in the ICPP aqueous wastes.
The major solutes in the ICPP aqueous wastes are nitric acid, sodium nitrate, and aluminum nitrate.The wastes also contain low concentrations of chloride, fluoride, and a number of metal cations. Thegreatest concern in modeling the evaporation of the wastes is calculation of the volatilization of the nitric,hydrofluoric and hydrochloric acids into the condensate. The precipitation after cooling of sodium andaluminum nitrates is also of concern.
Property parameters for the electrolyte NRTL model were regressed or verified first for binaryaqueous solutions of HNO3, HCl, and HF. Then the parameters were regressed for two-solute solutionsof HNO3 with HCl, NaNO3, KNO3, A1(NO3)3, Fe(NO3)3, Ca(NO3)2, and Cu(NO3)2. The complexingreactions of the Al+3 and F" ions, and the Hg+2 and Cl" ions were modeled; and the precipitation ofNaNO3 and A1(NO3)3 from HNO3 solutions was also modeled.
The calculations using the resulting parameter sets were tested against the literature data and againstlaboratory simulations of ICPP waste evaporations. With the regressed parameter set, the electrolyteNRTL model calculates vapor-phase HNO3 concentrations within 25 percent for NaNO3 concentrationsto 50 percent, and for concentrations of the polyvalent nitrate salts to about 20 percent. The calculationsof vapor-phase concentrations of HCL and HF appear to be within 50 percent for HCl and within a factorof two for HF.
in

IV

CONTENTS
ABSTRACT iil
1. INTRODUCTION 1
1.1 ICPP Aqueous Wastes 1
1.2 Electrolyte NRTL Solution Model 1
2. REGRESSION OF ELECNRTL MODEL PARAMETERS 2
2.1 Objectives and Evaluation Criteria 3
2.2 Nitric Acid Solutions 3
2.2.1 Evaluation of Parameter Set from ASPEN Plus™ Software 42.2.2 Preliminary Regressions of Data at 25°C 4
2.2.3 VLE Data Regressions 4
2.3 Solutions of Sodium Nitrate and Nitric Acid 11
2.4 Solutions of Aluminum Nitrate and Nitric Acid 15
2.5 Solutions of Sodium Nitrate and Aluminum Nitrate 16
2.6 Solutions of Potassium Nitrate and Nitric Acid 21
2.7 Solutions of Hydrochloric and Nitric Acids 21
2.8 Solutions of Hydrofluoric and Nitric Acids 28
2.9 Solutions of Calcium Nitrate and Nitric Acid 28
2.10 Solutions of Ferric Nitrate and Nitric Acid 35
2.11 Solutions of Minor Bivalent Nitrates and Nitric Acid 35
2.12 Mercury Chloride Solutions 36
2.12.1 Thermochemical Parameters for HgCl2 362.12.2 Activity Coefficients 382.12.3 Chemical Speciation Calculations 38

2.13 Boric Acid Solutions 41
2.14 Undissolved Solids 42
2.15 Zirconium Complexes 42
2.16 Parameters for Solution Density 42
2.16.1 Clarke Model for Aqueous Solutions 422.16.2 Density Parameter Regression 432.16.3 Test Calculations for HLLW Tanks 43
TESTING AND ADJUSTMENTS BASED ON LABORATORY TESTS OF WASTE
EVAPORATION 45
3.1 Test Operation . 45
3.2 Simulation Models of Tests 46
3.3 Comparison of Calculations with Test Results 47
3.3.1 Temperature 47
3.3.2 Liquid Density 483.3.3 Nitric Acid in Condensate 483.3.4 Chloride in Condensate 503.3.5 Fluoride in Condensate 503.3.6 Mercury Chloride 55
PROPERTIES FILE PROP-R9C 58
4.1 Properties File Usage 58
4.2 Parameter Set Verification 58
SUMMARY EVALUATION 59
5.1 Nitric Acid Solutions 59
5.2 Solutions of Nitric Acid and Nitrate Salts 59
5.3 Solutions of Hydrochloric and Nitric Acids 61
5.4 Solutions of Hydrofluoric and Nitric Acids 61
5.5 Other Molecular Solutes 61
vi

5.6 Calculated Local Excess Gibbs Free Energy Values 63
5.7 Chemical Equilibria Calculation Convergence 63
6. CONCLUSIONS ON WASTE EVAPORATION CALCULATIONS 66
7. REFERENCES 66
Appendix A—Property Parameters File PROP-R9C
FIGURES
1. Comparison of measured partial pressures of HNO3 at 25 °C with those calculated usingactivity coefficient parameters regressed from 1) VLE data only, 2) VLE plus enthalphyof mixing (HLMX) data, and 3) VLE plus solution heat capacity (CPLMX) data (E96 0296) 5
2. Comparison of calculated and measured vapor-phase concentrations of HNO3 at
760 torr (E96 0297) 7
3. Comparison of calculated and measured partial pressures of HNO3 at 25 and 50°C (E96 0298) 8
4. Comparison of calculated and measured vapor-phase concentrations of HNO3 at
200 torr (E96 0299) 9
5. Comparison of calculated and measured hydrolysis of HNO3 at 25°C (E96 0300) 10
6. Calculated activity coefficients at 25°C (E96 0301) 12
7. Comparison of calculated and measured effect of NaNO3 on vapor-phase concentrationsof HNO3 over HNO3 solutions (E96 0302) 13
8. Comparison of calculated and measured solubilities of NaNO3 in aqueous nitric acidsolutions at 15 and 20°C (E96 0303) 14
9. Comparison of calculated and measured effect on vapor-phase HNO3 concentrationsof adding A1(NO3)3 to solutions initially containing 10 and 20% HNO3 (E96 0304) 18
10. Comparison of calculated and measured solubilities of A1(NO3)3 in aqueous nitric acidsolutions at 20°C (E96 0305) 19
11. Comparison of calculated and measured solubilities of NaNO3 in aqueous A1(NO3)3
solutions at 20°C (E96 0306) 20
12. Comparison of calculated and measured solubilities of potassium nitrate in nitric acidsolutions at 20 and 30°C (E96 0307) 22
vii
13. Comparison of calculated and measured partial pressures of HC1 oversub-azeotropic HC1 solutions (E96 0308) 25
14. Comparison of calculated and measured effect of HNO3 concentration onvapor-to-liquid mole fraction ratio (Y/X) for HC1 at 200 torr (E96 0309) 26
15. Comparison of calculated and measured effect of HNO3 concentration onvapor-to-liquid mole fraction ratio (Y/X) for HC1 at 760 torr (G96-0189) 27
16. Comparison of calculated and measured partial pressures of HF over aqueous solutionsat 25, 40, 60 and 75°C (G96-0190) 29
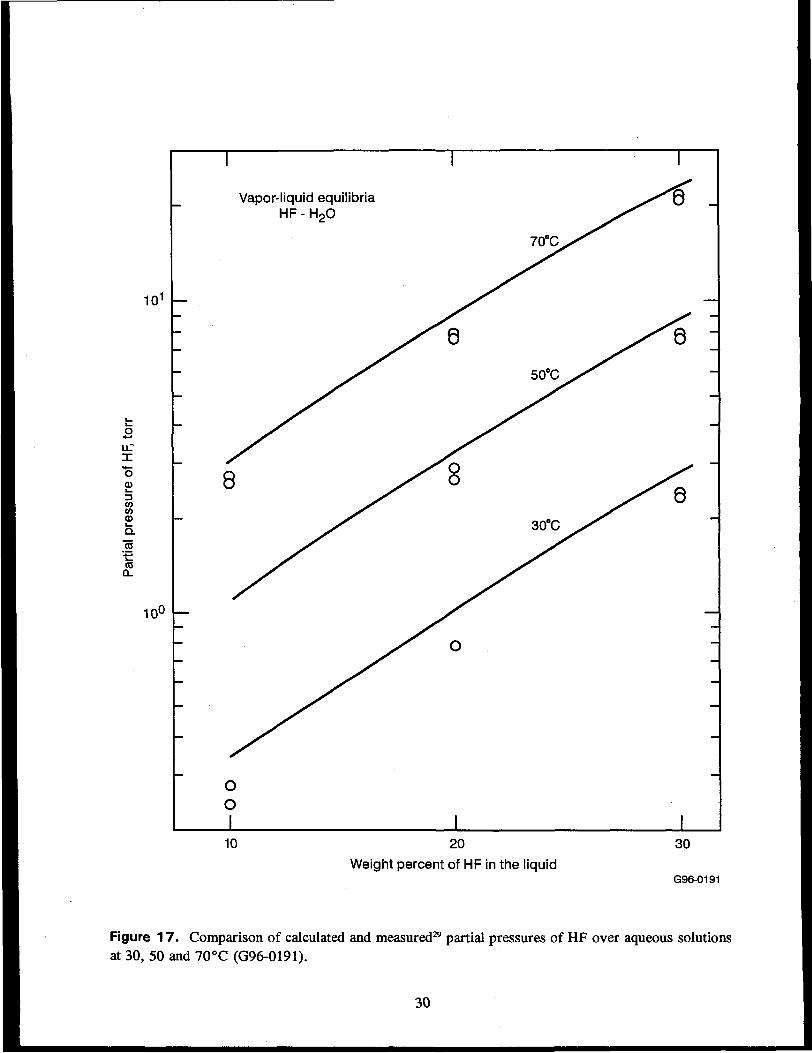
17. Comparison of calculated and measured partial pressures of HF over aqueous solutionsat 30, 50 and 70°C (G96-0191) 30
18. Comparison of calculated and measured vapor compositions over aqueous HF solutionsat 760 torr (G96-0192) 31
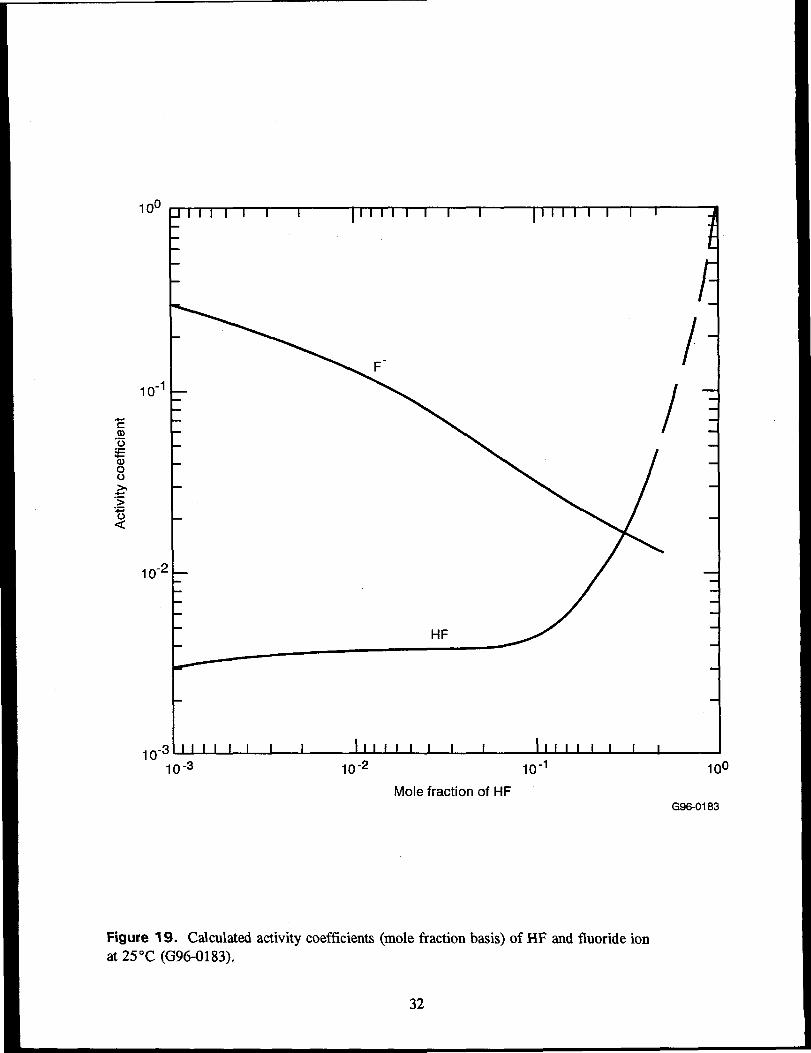
19. Calculated activity coefficients (mole fraction basis) of HF and fluoride ionat 25°C (G96-0183) 32
20. Comparison of calculated and measured effect on vapor-phase HNQ, concentrations
of adding Ca(NO3)2 to solutions initially containing 20% HNO3 (G96-0184) 34
21. Calculated activity coefficients of HgCl2 in aqueous solution (G96-0193) 39
22. Calculated partial pressure of HgCl2 over aqueous solutions (E96 0310) 40
23. Condensate nitric acid concentration during semi-batch HLLWE simulation (E96 0311) . . . 49
24. Condensate chloride concentration during semi-batch HLLWE simulation (G96-0185) . . . . 51
25. Condensate chloride concentration during batch waste simulant evaporation (G96-0186) . . . 52
26. Condensate fluoride concentration during semi-batch evaporations (E96 0312) 53
27. Comparison of calculated and measured concentrations of mercury as HgCl2 in condensate
from the batch evaporation test (G96-0187) 57
28. Vapor compositions of boiling solutions made by adding various nitrate salts to a nitricacid solution initially containing 20 percent nitric acid (E96 0313) 60
Vlll
29. Vapor compositions of boiling solutions made by adding various nitrate salts to a nitricacid solution initially containing 20 percent nitric acid (G96-0188) 62
30. Local excess Gibbs free energies (Tau) for ion pair-molecule interactions
calculated at 100°C (G96-0194) 65
TABLES
1. Activity coefficient parameters for nitric acid solutions 6
2. Activity coefficient parameters for aqueous mixtures of nitric acid and sodium nitrate . . . . 15
3. Activity coefficient parameters for aqueous mixtures of nitric acid and aluminum nitrate . . . 17
4. Activity coefficient parameters for aqueous mixtures of sodium and aluminum nitrates . . . . 17
5. Activity coefficient parameters for aqueous mixtures of potassium nitrate with nitric acid
and sodium nitrate 23
6. Activity coefficient parameters for aqueous solutions of HC1 and HNO3 24
7. Activity coefficient parameters for HF solutions 33
8. Activity coefficient parameters for aqueous mixtures of nitric acid and calcium nitrate . . . . 33
9. Activity coefficient parameters for aqueous mixtures of nitric acid and ferric nitrate 35
10. Activity coefficient parameters for aqueous mixtures of nitric acid and cupric nitrate 36
11. Calculated mercury species distributions as percentages at 100°C 41
12. Clarke density parameters in 1/kmole 44
13. Rackett density parameters (SI) 44
14. Differences between calculated and measured densities 45
15. Molar concentrations of solutes in feeds for semi-batch laboratory evaporations 46
16. Molar concentrations of solutes in feed for batch laboratory evaporation and its simulation . 47
17. Activity coefficient parameters for aqueous mixtures of nitric acid and A1F complexes . . . . 54
IX

18. Activity coefficient parameters for aqueous HgCl2 solutions containing dissolved nitrates . . 56
19. Local excess Gibbs free energies at 100°C calculated from GMELCC, GMELCD,and GMELCE parameters of this report 64

Physical Property Parameter Set forModeling ICPP Aqueous Wastes with ASPEN
Electrolyte NRTL Model
1. INTRODUCTION
The Idaho Chemical Processing Plant (ICPP) generates a variety of aqueous wastes that areconcentrated by evaporation with the concentrate being solidified by fluidized-bed calcination.Process simulation models are being developed to model the ICPP waste treatment processesbeginning with the evaporators. The process simulation models use the ASPEN Plus™ simulationsoftware (leased from ASPEN Technology, Inc.) as the thermodynamic framework for thesimulations. The vapor-liquid equilibria (VLE) and chemical equilibria calculations use its electrolyteNRTL model to calculate activity coefficients. This report documents the regression and verificationof a set of physical and chemical property parameters for use by the simulation models in calculatingVLE and chemical equilibria for the major chemical species in the ICPP wastes. The physical andchemical property parameter sets were developed in the format required for the electrolyte NRTLmodel.
1.1 ICPP Aqueous Wastes
The ICPP aqueous wastes are acid wastes, mostly dilute, in which the major chemical solutesare nitric acid, sodium nitrate and aluminum nitrate. They also contain lesser concentrations ofchloride and fluoride, and low, variable concentrations of many other cations and anions. Theevaporators concentrate the aqueous wastes to concentrations that approach the solubility of sodiumnitrate. However, the acid concentrations remain sub-azeotropic.
A major concern in the evaporators is the vaporization of the corrosive acids: nitric,hydrochloric, and hydrofluoric. The chemical equilibria of greatest concern are: (1) the complexingof the fluoride with aluminum ions to reduce the volatility and corrosiveness of HF, and (2) thecomplexing of mercuric ion with chloride ions to form mercuric chloride which is slightly volatile atboiling temperatures.
1.2 Electrolyte NRTL Solution Model
The ASPEN Plus™ process simulation software provides a thermodynamic framework for theenergy and mass balances, chemical equilibria calculations, and VLE calculations of the chemicalprocess simulations. It offers a number of number of thermodynamic and activity-coefficient modelsof which the electrolyte non-random two-liquid model1'2 (abbreviated ELECNRTL) is the mostdeveloped for use in concentrated electrolyte solutions. (Electrolyte NRTL models are also offeredwith other process simulation software from different vendors.) The ELECNRTL model is anextension by Chen,2 et. al., to multi-solvent electrolyte solutions of the Renon3 non-random two-liquid(NRTL) model3 for local excess Gibbs free energy in solution. It sums contributions to the local
excess Gibbs free energy of long-range ion-ion interactions, local ion-molecule interactions, andmolecule-molecule interactions and then calculates the activity coefficients for each specie from theexcess Gibbs free energies.
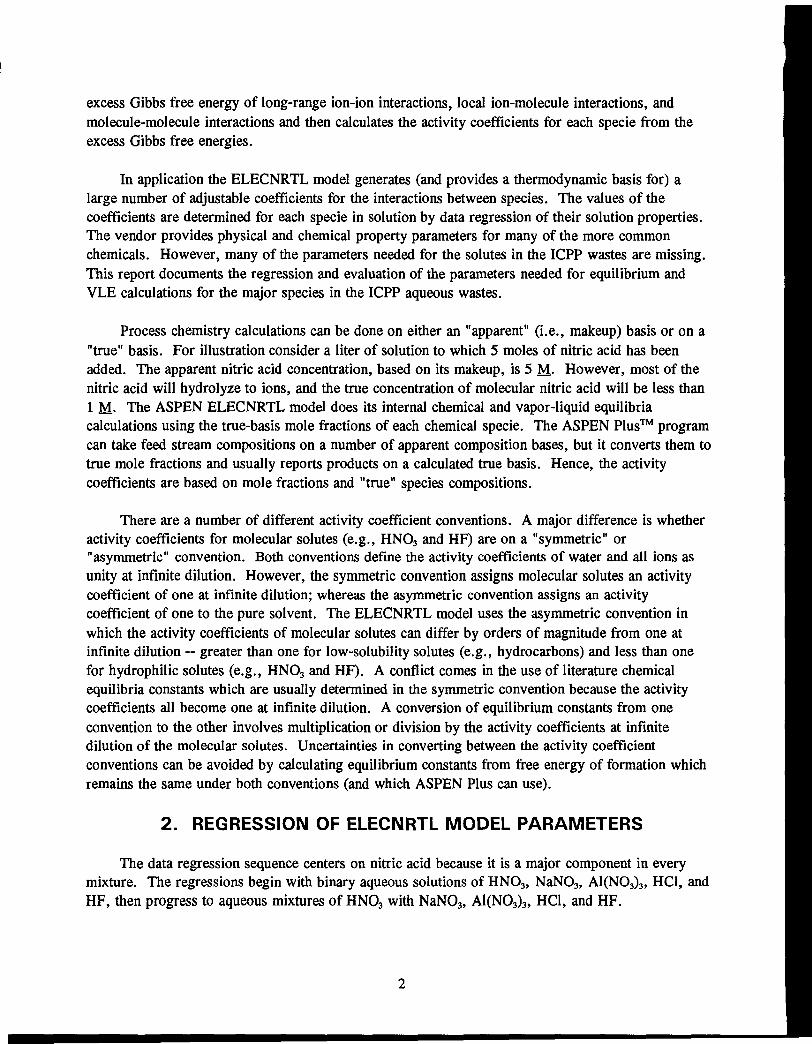
In application the ELECNRTL model generates (and provides a thermodynamic basis for) alarge number of adjustable coefficients for the interactions between species. The values of thecoefficients are determined for each specie in solution by data regression of their solution properties.The vendor provides physical and chemical property parameters for many of the more commonchemicals. However, many of the parameters needed for the solutes in the ICPP wastes are missing.This report documents the regression and evaluation of the parameters needed for equilibrium andVLE calculations for the major species in the ICPP aqueous wastes.
Process chemistry calculations can be done on either an "apparent" (i.e., makeup) basis or on a"true" basis. For illustration consider a liter of solution to which 5 moles of nitric acid has beenadded. The apparent nitric acid concentration, based on its makeup, is 5 M- However, most of thenitric acid will hydrolyze to ions, and the true concentration of molecular nitric acid will be less than1 M- The ASPEN ELECNRTL model does its internal chemical and vapor-liquid equilibriacalculations using the true-basis mole fractions of each chemical specie. The ASPEN Plus™ programcan take feed stream compositions on a number of apparent composition bases, but it converts them totrue mole fractions and usually reports products on a calculated true basis. Hence, the activitycoefficients are based on mole fractions and "true" species compositions.
There are a number of different activity coefficient conventions. A major difference is whetheractivity coefficients for molecular solutes (e.g., HNO3 and HF) are on a "symmetric" or"asymmetric" convention. Both conventions define the activity coefficients of water and all ions asunity at infinite dilution. However, the symmetric convention assigns molecular solutes an activitycoefficient of one at infinite dilution; whereas the asymmetric convention assigns an activitycoefficient of one to the pure solvent. The ELECNRTL model uses the asymmetric convention inwhich the activity coefficients of molecular solutes can differ by orders of magnitude from one atinfinite dilution — greater than one for low-solubility solutes (e.g., hydrocarbons) and less than onefor hydrophilic solutes (e.g., HNO3 and HF). A conflict comes in the use of literature chemicalequilibria constants which are usually determined in the symmetric convention because the activitycoefficients all become one at infinite dilution. A conversion of equilibrium constants from oneconvention to the other involves multiplication or division by the activity coefficients at infinitedilution of the molecular solutes. Uncertainties in converting between the activity coefficientconventions can be avoided by calculating equilibrium constants from free energy of formation whichremains the same under both conventions (and which ASPEN Plus can use).
2. REGRESSION OF ELECNRTL MODEL PARAMETERS
The data regression sequence centers on nitric acid because it is a major component in everymixture. The regressions begin with binary aqueous solutions of HNO3, NaNO3, A1(NO3)3, HC1, andHF, then progress to aqueous mixtures of HNO3 with NaNO3, A1(NO3)3, HC1, and HF.

The ASPEN Plus software contains a data regression system (DRS) which will regress theELECNRTL activity coefficient parameters and chemical equilibria constants from a variety ofphysical and chemical data. The parameters developed for this report were regressed using the DRSsystem to regress VLE, salt solubility, enthalphy of mixing, and osmotic coefficient data for two andthree component mixtures of the major solutes in the ICPP wastes.
2.1 Objectives and Evaluation Criteria
Although a property parameter set that calculates all properties well is desirable, it is rarelyachieved. Real activity coefficient models have inaccuracies and usually require weighing ofobjectives and evaluation criteria. The objectives given priority in this evaluation series are those ofconcern in modeling the waste evaporators:
1. Vapor-liquid equilibria at boiling
The first priority is given to vapor-liquid equilibria (VLE) at boiling for calculatingcondensate compositions. The composition range of interest is relatively-dilute (sub-azeotropic) acid concentrations and relatively-high concentrations of sodium and aluminumnitrates.
2. Nitrate ion activity at ambient temperatures
The calculation of the solubility of nitrate salts in nitric acid solutions at ambienttemperature is needed to evaluate precipitation potential in the waste evaporators. Anaccurate calculation of the ionization equilibria between nitric acid and the nitrate and acidions is desirable as an indication of accurate activity of the nitrate ion which is needed tocalculate the solubility of the nitrate salts.
3. Vapor-liquid equilibria at other temperatures
Accurate VLE calculations at all temperatures would be useful for other applications(e.g., the NWCF scrub system). Errors on the high side would be preferable to errors onthe low side for calculation of the partial pressure of nitric acid because many applicationsseek conservative calculations.
The regression sequence attempted to cover a range of properties and temperatures. However,when conflicts occurred in fitting data sets at different temperatures, the priority was given as listedabove and primarily to the VLE at boiling.
2.2 Nitric Acid Solutions
Nitric acid is central to the overall regression plan because it is the most concentrated acid andthe acid that most effects the other solutes. The regressions of the parameters for the interactions ofnitric acid with the other solutes use the activity coefficient parameters for nitric acid and its ions.

2.2.1 Evaluation of Parameter Set from ASPEN Plus™ Software
The activity-coefficient parameter set for nitric acid provided with the ASPEN Plus™ softwarewas tested against VLE4-5'6-7'8'9-10-11'12 and acid hydrolysis13 data and found inadequate primarily fordilute solutions. The VLE calculations at boiling provide vapor-phase nitric acid concentrations thatare a factor of two-to-three low for dilute solutions. (The data fit is acceptable for concentratedsolutions.) Also, the calculated dissociation of the nitric acid is way high (i.e., very little molecularnitric acid).
The basic physical property parameters (e.g., heat capacity, heat of vaporization, and vaporpressure) provided with the ASPEN Plus™ software appear reasonable and are used in theregressions. Also retained is the calculation of nitric acid dissociation using thermochemicalparameters from the NBS tables.14
2.2.2 Preliminary Regressions of Data at 25°C
Some preliminary regressions were run on the regressible data at 25°C to check whether theASPEN ELECNRTL model can reconcile VLE,5-6-78-9 enthalphy of mixing,14 solution heat capacity,15
and acid hydrolysis13 data for nitric acid. The activity coefficient parameters for nitric acid solutionswere regressed using (1) VLE data only, (2) VLE plus enthalphy of mixing (HLMX) data, and(3) VLE plus solution heat capacity (CPLMX) data. Nitric acid partial pressures, calculated at 25°Cusing each of the regressed activity coefficient parameter sets, are shown on Figure 1. Thecalculations with the parameter set from VLE data only fit the data well, but the addition of the otherdata pulls the calculated curves high for dilute solutions. The addition of the CPLMX data alsodistorts the shape of the curve. A comparison of calculated and measured (direct measurement13 ofnitrate ion concentrations by Raman spectroscopy) acid hydrolysis shows the cases with the HLMXand CPLMX data deviating further (high) from the data than the VLE data only case. Hence it isconcluded that the VLE, enthalphy of mixing and solution heat capacity data for nitric acid cannot bereconciled by the ASPEN ELECNRTL model.
One possible explanation of the difficulty in reconciling different types of data is that thechemistry equations describing the reactions of nitric acid with water are simplified by ignoring thehydrated forms14 of nitric acid (e.g., HNO3-H2O and HNCy3H2O) which exist at least at the lowertemperatures. The hydrated form would have a different effect on the vapor composition than onother data. The ASPEN model attempts to cover the chemistry simplifications with an activitycoefficient for nitric acid which is much less than one, but this is not entirely successful. Otherexplanations are that the ELECNRTL model may be inadequate and that some of the data may be inerror (or misinterpreted).
2.2.3 VLE Data Regressions
Based on the results of the preliminary regressions, the regressions used VLE only. First, all ofthe available VLE data4-5'6-7-8'9'10-11'12-16-17 from 25°C to boiling was regressed. (Handbook17 VLEnumbers were not used because they are extrapolations18 rather than actual data.) VLE calculations,with the parameters provided by the regression, fit the data in the middle of the temperature range but

101- I I
10°
fcom
O
Io 10"1
2?COCO
to
I
10-2
10-3 -I I
I I I I i I i I I I I I I I I I I I I I I I I I I T .
Vapor-liquid equilibriaHNO3 - H2O
T = 25°C
VLE + HLMX
VLE + CPLMX
Data of:Davis & DeBruin5
Yakimov6
Burdick & Freed7
Sproesser & Taylor8
Flatt & Benguerrel9
AO•V
i 1 i i i i i 1 1 I 1 i i i i 1 1 1 1 i 1 i0.1 0.2
Mole fraction of HNO3 in liquid
0.3
E96 0296
Figure 1 . Comparison of measured partial pressures of HNO3 at 25 °C with those calculated usingactivity coefficient parameters regressed from (1) VLE data5-6-7-8-9 only, (2) VLE plus enthalphy ofmixing14 (HLMX) data, and (3) VLE plus solution heat capacity15 (CPLMX) data (E96 0296).

calculated low vapor-phase nitric acid concentrations for dilute solutions at 760 torr and at 25 °Cwhich are the most important conditions.
The regressions were then repeated using only the VLE data at 760 torr and 25 °C to obtain theactivity coefficient parameter set listed in Table 1. The vapor compositions calculated with theparameters of Table 1 are compared with data in Figures 2, 3, and 4. The nitric acid concentrations(or partial pressures) fit the data well at 760 torr (Figure 2), are a little low at the dilute end at 25°C(Figure 3), and are high at 50°C (Figure 3) and at 200 torr (Figure 4). The calculated nitric aciddissociation, shown on Figure 5, is high but closer than calculated with the base (ASPEN Plus)parameter set. (The calculated molecular nitric acid concentration, which is about a factor of twolow, is compensated for by a nitric acid activity coefficient which is high.)
Table 1. Activity coefficient parameters for nitric acid solutions.
Parameter
NRTL 1
NRTL 1
NRTL 2
NRTL 2
NRTL 3
NRTL 3
GMELCC
GMELCC
GMELCD
GMELCD
GMELCC
GMELCC
GMELCD
GMELCD
GMELCE
GMELCE
Species Pair
HNO3 H2O
H2O HNO3
HNO3 H2O
H2O HNO2
HNO3 H2O
H2O HNO3
H2O (H3O+ NO3-)
(H3O+ NO3-) H2O
H2O (H3O+ NO3-)
(H3O+ NO3-) H2O
HNO3 (H3O+ NO3-)
(H3O+ NO3-) HNO3
HNO3 (H3O+ NO3-)
(H3O+ NO3-) HNO3
HNO3 (H3O+ NO3-)
(H3O+ NO3-) HNO3
Value
90
-3.627717
0
65.86466
0.30
0.05
-3.411562
-1.379389
4021.066
-1005.608
18.35049
28.03711
-2595.605
-9671.993
-82.78977
47.90918

10-1
5
iI•5g
I
10-2
i i i i i i i i i | I i i i i i i i i | i i i i i i i i r
Vapor-liquid equilibriaHNO3 - H2OP = 760 torr
Data of:Potier4
Boublik&Kuchynka10
Efimov12
Prosek16
OA•V
1 1 1 1 1 j _ 1 J 1 1 1 1 1 1 1 1 1 1 1 1 1 1 1 1 1 1
0.1 0.2
Mole fraction of HNO3 in liquid
0.3
E96 0297
Figure 2. Comparison of calculated and measured vapor-phase concentrations of HN03 at760 torr (E96 0297).

101
10° —
mOI"6
oQ.
Is
10-2 -
10-3 —
E '
Vapor-liquid equilibriaHNO 3 -H 2O
—
50°C
/ v Qy
' / a /
: / 7: V" 7~ 1 1 1 T* 1 1 1 1 1 1 1 1 1
1 1
O
/
1 1
1 1 1
/
/
V
25°C
/
I I 1
1 | 1 1 1 1 1 I I
/
D°
yT •
n
Data of:Davis & DeBruin5
Yakimov6
Burdick & Freed7
Sproesser & Taylor8
1 1 1 1 1 1 1 1 1
« 1 | 1 i _
-
>
1 1
1
1
1
-
LLLL
-
-
A0• -v =
-
-
• • ! • •
0.1 0.2
Mole fraction of HNO3 in liquid
0.3
E96 0298
Figure 3 . Comparison of calculated and measured partial pressures of HNO3 at 25 and50°C (E96 0298).

10-1
£ 10-2
X"oo
1
10-3
10-4
1 i r i i i i I i i I i i i i i i I r
Vapor-liquid equilibriaHNO3 - H2OP = 200 torr
Data of:Boublik&Kuchynka10 ABraatz11 O
1 1 1 1 1 1 1 1 1 1 I 1 1 1 1 1 1 1 1 1 I 1 1 1 1 1 1 1 1 1
0.1 0.2
Mole fraction of HNO3 in liquid
0.3
E96 0299
Figure 4. Comparison of calculated and measured vapor-phase concentrations of HN03 at200 torr (E96 0299).

0.8
.2COCO
"o
'•§ 0.6
4. I I I I I i i i i i i i
With ASPEN baseparameter set
0.4
With regressedparameter set
T = 25°CData of Krawetz13
i i i i i i i i i I i i i i i i i i i I i i i i i i i i i
0.1 0.2
Mole fraction of HNO3
0.3
E96 0300
Figure 5. Comparison of calculated and measured13 hydrolysis of HN03 at 25°C (E96 0300).
10
The calculated activity coefficients, shown on Figure 6, appear acceptable. The activitycoefficient for nitric acid has a small (questionable) minimum but is otherwise reasonable. Theactivity coefficients for water and nitrate ion (which is identical to the coefficient for the acid ion) areof the expected19 shape.
Figure 4 illustrates the difficulty in regressing the full VLE data set. The shape of the VLEcurves (i.e., slope vs. concentration) changes with temperature in a way that cannot be matched withthe available activity coefficient parameters. (The previously discussed omission of hydrated acidforms may contribute to the difficulty.) Allowing the nitric acid vapor pressure to be regressed didnot improve the data fit.
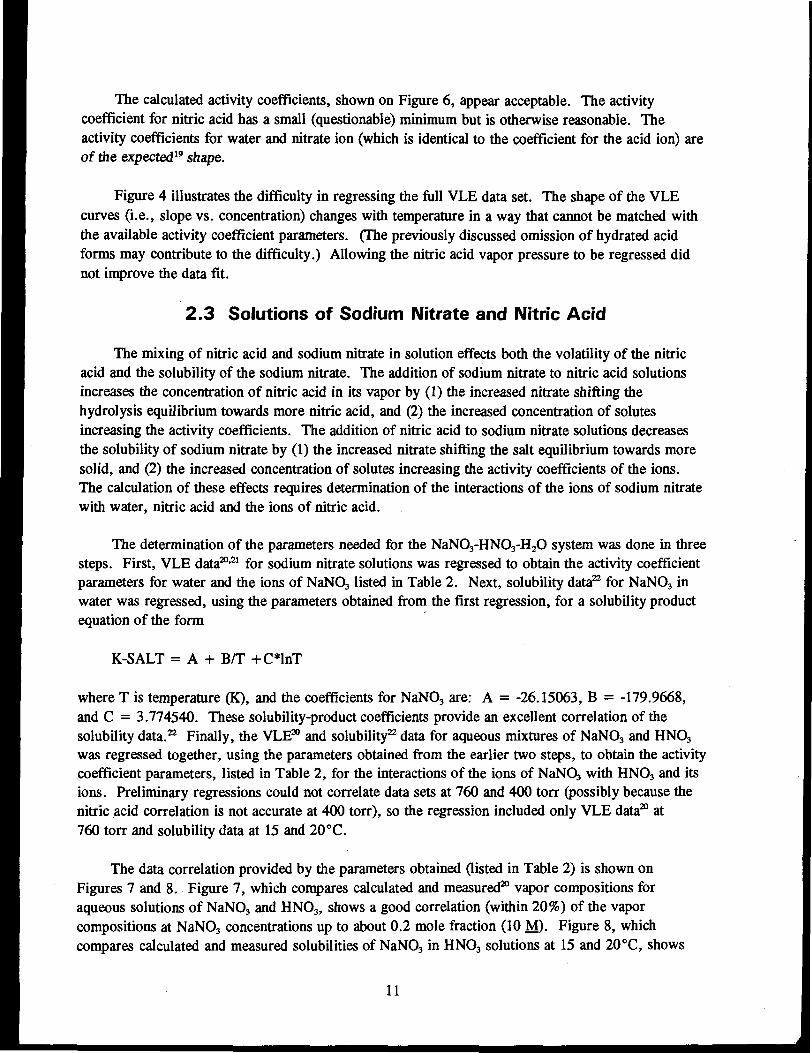
2.3 Solutions of Sodium Nitrate and Nitric Acid
The mixing of nitric acid and sodium nitrate in solution effects both the volatility of the nitricacid and the solubility of the sodium nitrate. The addition of sodium nitrate to nitric acid solutionsincreases the concentration of nitric acid in its vapor by (1) the increased nitrate shifting thehydrolysis equilibrium towards more nitric acid, and (2) the increased concentration of solutesincreasing the activity coefficients. The addition of nitric acid to sodium nitrate solutions decreasesthe solubility of sodium nitrate by (1) the increased nitrate shifting the salt equilibrium towards moresolid, and (2) the increased concentration of solutes increasing the activity coefficients of the ions.The calculation of these effects requires determination of the interactions of the ions of sodium nitratewith water, nitric acid and the ions of nitric acid.
The determination of the parameters needed for the NaNO3-HNO3-H2O system was done in threesteps. First, VLE data20'21 for sodium nitrate solutions was regressed to obtain the activity coefficientparameters for water and the ions of NaNO3 listed in Table 2. Next, solubility data22 for NaNO3 inwater was regressed, using the parameters obtained from the first regression, for a solubility productequation of the form
K-SALT = A + B/T +C*lnT
where T is temperature (K), and the coefficients for NaNO3 are: A = -26.15063, B = -179.9668,and C = 3.774540. These solubility-product coefficients provide an excellent correlation of thesolubility data.22 Finally, the VLE20 and solubility22 data for aqueous mixtures of NaNO3 and HNO3
was regressed together, using the parameters obtained from the earlier two steps, to obtain the activitycoefficient parameters, listed in Table 2, for the interactions of the ions of NaNOs with HNO3 and itsions. Preliminary regressions could not correlate data sets at 760 and 400 torr (possibly because thenitric acid correlation is not accurate at 400 torr), so the regression included only VLE data20 at760 torr and solubility data at 15 and 20°C.
The data correlation provided by the parameters obtained (listed in Table 2) is shown onFigures 7 and 8. Figure 7, which compares calculated and measured20 vapor compositions foraqueous solutions of NaNO3 and HN03 , shows a good correlation (within 20%) of the vaporcompositions at NaNO3 concentrations up to about 0.2 mole fraction (10 M)- Figure 8, whichcompares calculated and measured solubilities of NaNO3 in HNO3 solutions at 15 and 20 °C, shows
11

10°
.i%8
10'1
i i i i i T T I i i i i I i n
H2O
HNO-:
I I I I I i i I I i I I I I I I
10-2 10-1
Mole fraction of HNO3 E96 0301
Figure 6. Calculated activity coefficients at 25°C (E96 0301).
12

10-1
x
o
II 10-2
i i i i I I i r
Vapor-liquid equilibriaNaNO3 - HNO3 - H2O
P = 760 torr
i i i i i i r
6—L 1 1 1 1 1 1 1 1 1 1 1 111 1 1 1
0.1
Mole fraction of NaNO3 in liquid
0.2
E96 0302
Figure 7. Comparison of calculated and measured effect of NaNO3 on vapor-phase concentrations ofHNO3 over HNO3 solutions (E96 0302).
13

101-1
o
g
toCO
Iraoco
"•5
a.22o
10"*
SolubilityNaN03 - HNO3 '
H 2 °
Data of Linke22 at:15°C A20°C D
I I0.1 0.2 0.3
Mole fraction of HNO3 in solution
0.4 0.5
E96 0303
Figure 8. Comparison of calculated and measured solubilities of NaN03 in aqueous nitric acidsolutions at 15 and 20°C (E96 0303).
14

Table 2. Activity coefficient parameters for aqueous mixtures of nitric acid and sodium nitrate.
Parameter
GMELCC
GMELCC
GMELCD
GMELCD
GMELCC
GMELCC
GMELCD
GMELCD
GMELCC
GMELCC
Species Pair
H2O (NA+ NO3-)
(NA+ NO3-) H2O
H2O (NA+ NO3-)
(NA+ NO3-) H2O
HN03 (NA+ N03-)
(NA+ NO3-) HN03
HN03 (NA+ NO3-)
(NA+ NO3-) HN03
(H3O+ NO3-) (NA+ NO3-)
(NA+ NO3-) (H3O+ NO3-)
Value
8.509752
-4.460697
-505.2884
288.6656
. -29.90617
-33.52829
17681.22
13131.20
5.284384
-0.6550303
good solubility data22 correlation for HN03 concentrations of over 0.3 mole fraction (13 M) which isan adequate range for the HLLW and PEW evaporators. Figure 8 shows only one line for the twotemperatures because the temperatures and data are close (some of the measured solubilities at 20 °Care lower than those at 15°C).
2.4 Solutions of Aluminum Nitrate and Nitric Acid
The addition of aluminum nitrate to nitric acid solutions increases the concentration of nitric acidin its vapor by (1) shifting the hydrolysis equilibrium towards more nitric acid with the increasednitrate, and (2) increasing the activity coefficients. The addition of nitric acid to aluminum nitratesolutions decreases the solubility of aluminum nitrate by (1) shifting the salt equilibrium towards moresolid with the increased nitrate, and (2) increasing the activity coefficients of the ions. Aluminumnitrate has a stronger effect than sodium nitrate because of its higher charge.
The regression of activity coefficient parameters for aluminum nitrate solutions is inhibited by ashortage of data. Only solubility data22 and one set of osmotic pressure23 coefficients (at 25 °C) areavailable for A1(NO3)3-H2O solutions. One set12 of atmospheric pressure VLE data, an incompleteset21 (no temperature) of reduced pressure VLE data and solubility data22 are available for A1(NO3)3-HNO3-H2O solutions. The data regression worked best when done in two steps. First, the A1(NO3)3-H2O solubility data, osmotic pressure23 coefficients and VLE12 data were regressed for the A1(NO3)3-H2O activity coefficient parameters and the A1(NO3)3 solubility product coefficients. The second stepused the results of the first step and regressed the A1(NO3)3-HNO3 activity coefficient parametersusing the A1(NO3)3-HNO3-H2O VLE12 and solubility data.22
15

The solubility product coefficients were regressed for A1(NO3)3.9H2O which is the least solublealuminum nitrate salt at temperatures below 60°C:
A1(NO3)3.9H2O < - > Al+3 + 3NO3" + 9H2O.
The solubility coefficient equation is of the form,
K-SOL = A + B/T + C*lnT, with the values
A = 316.3685, B = -12511.94, C = -50.
Note that the above K-SOL equation is influenced strongly by the activity coefficient of water becausethere are nine waters in the reaction. The solubilities calculated with these coefficients agree within8% with the data over the temperature range from 0 to 60°C.
The activity coefficient parameters obtained from the regressions are listed in Table 3. Thevapor compositions calculated with the parameters of Table 3, are compared with measured vaporcompositions12 in Figure 9. The experiment measured vapor composition and temperature obtainedfrom adding increasing amounts of A1(NO3)3 to (initially) 10% and 20% solutions of HNO3 (therebydiluting the HNO3). The calculated vapor compositions agree within about 25% with the measuredvalues for A1(NO3)3 concentrations up to 30% (about 1.8 M), which is adequate for most ICPP wastesolutions, then show a negative error which increased with A1(NO3)3 concentration. The calculatedA1(NO3)3-HNO3-H2O solubilities at 20°C agree well with the measured values as shown in Figure 10.The calculated solubilities at 0°C (not shown) also agree adequately (average deviation of 25%) withthe measured values.
The data regression problem for the VLE is that the electrolyte NRTL model cannot fit both thetemperature and composition data (with the given chemistry) at the higher A1(NO3)3 concentrations. Itfits the temperatures closely and calculates low vapor nitric acid concentrations at A1(NO3)3 above30%. The regression can be constrained to fit the vapor compositions, but it then calculateserroneous temperatures [way high at 50% A1(NO3)3].
2.5 Solutions of Sodium Nitrate and Aluminum Nitrate
The addition of aluminum nitrate to sodium nitrate solutions reduces the solubility of sodiumnitrate by increasing the nitrate ion concentration and by increasing activity coefficients. Solubilitydata22 for Al(NO3)3-NaNO3-H2O solutions was regressed to obtain the activity coefficient parameterslisted in Table 4. Figure 11 shows good agreement between solubilities calculated using theparameters of Table 4 and measured22 solubilities of NaNO3 in A1(NO3)3 solutions at 20°C. Latertests showed that the parameters of Table 4, which were regressed with data at 20°C, cause erroneousHF volatility calculations at boiling. Hence, they are omitted unless solubility is the primaryobjective of the calculation.
16

Table 3. Activity coefficient parameters for aqueous mixtures of nitric acid and aluminum nitrate.
Parameter
GMELCC
GMELCC
GMELCD
GMELCD
GMELCE
GMELCE
GMELCC
GMELCC
GMELCD
GMELCD
GMELCE
GMELCE
GMELCC
GMELCC
GMELCD
GMELCD
Species Pair
H2O(A1+ N03-)
(A1+3NO3-)H2O
H2O(A1+ N03-)
(A1+3NO3-)H2O
H2O(A1+3NO3-)
(A1 + 3NO3-)H2O
HNO3 (Al + 3 N03-)
(A1+3NO3-)HNO3
HNO3 (A1+3NO3-)
(A1+3NO3-)HNO3
HN03 (A 1+3 NO3-)
(A1+3NO3-)HNO3
(H30+ N03-) (Al + 3 N03-)
(Al+3 N03-) (H30+ NO3-)
(H30+ N03-) (Al+3 N03-)
(Al + 3 N03-) (H30+ N03-)
Value
29.959114
-10.1010
-5892.001
1470.918
-100
33.16584
2.192842
-8.52746
1562.688
5736.824
93.7309
-100
12.68662
6.911549
6092.308
-550.0901
Table 4. Activity coefficient
Parameter
GMELCC
GMELCC
parameters
(Al+3
(NA +
for aqueous mixtures of sodium
Species Pair
NO3-) (NA+
NO3-) (AL+3
NO3-)
NO3-)
and aluminum nitrates.
Value
7.959875
-0.7859297
17

mOXoco
1I
10-1
10-2
I I
Vapor-liquid equilibriaAI (NO 3 ) 3 -HNO 3 -H 2 O
P = 760 torr
i I
i i
i
o X ^X^X x
- /
1
X
Data of Efimov12:20 wt. % HNO3
10wt.%HNO3
I
I
O
xX
A
0A
I
X
1 I
II
—
—1
1 1
1
0.1 0.2 0.3
Weight fraction of AI(NO3)3 in liquid
0.4 0.5
E96 0304
Figure 9. Comparison of calculated and measured effect on vapor-phase HN03 concentrations ofadding A1(NO3)3 to solutions initially containing 10 and 20% HNO3 (E96 0304).
18

8cJO
<"5cg
I10-2
I I I I I I I I
I I I I I I I
I i i i i i i i I i j I i r
SolubilityAl (NO3)3 - HNO3 - H2O
T = 20°C
l l 1 1 1 1 1 I 1 1 1 1 1 1 1 1 1
0.1 0.2
Mole fraction of HNO3 in solution
0.3
E96 0305
Figure 10. Comparison of calculated and measured solubilities22 of A1(NO3)3 in aqueous nitric acid
solutions at 20 °C (E96 0305).
19

0.5 I l l I I l l I I I l I I l l i I I l l I I l l I l I l I l
SolubilityAl (NO3)3 - NaNO3 - H2O
T = 20°C
I I I I I I I I I I l I I I I I I I I I I I I l I I i i I I i I I l i I i l i
0.1 0.2 0.3
Weight fraction of Al (NO3)3 in solution
0.4
E96 0306
Figure 1 1 . Comparison of calculated and measured solubilities22 of NaN03 in aqueous A1(NO3)3
solutions at 20 °C (E96 0306).
20

2.6 Solutions of Potassium Nitrate and Nitric Acid
The regression of data for solutions of potassium nitrate and nitric acid was troublesome. Theregressions were not able to correlate solubility data together with VLE data (25 °C), or to correlatesolubility data over a wide temperature range. So, the regression effort focused on providing acorrelation of solubility data at ambient temperature. (There is no VLE data for boiling solutions.)
The regression was a four-step series:
1. First, vapor pressure depression data24 for KNO3 solutions was regressed to obtain theactivity coefficient parameters, listed in Table 5, for water and the ions of KNO3. (Theseparameters are close to those provided with the ASPEN Plus software.) The data fit isexcellent.
2. Next, solubility data22 for KNO3 in water was regressed for the solubility product (K-SOL)coefficients: A = 111.9424, B = -8683.153, and C = -15.95728. The data fit isexcellent.
3. Then, solubility data22 for KNO3 in nitric acid solutions at 15, 20, 25, and 30°C wasregressed for the activity coefficient parameters, listed in Table 5, for the ions of KNO3
with HNO3 and its ions. The data fit at 20 and 30°C, which is shown on Figure 12, isgood at HN03 concentrations up to 25%. The data fit at 15 and 25 °C is similar to thatshown on Figure 12. Note that the GMELCC parameters (Table 5) for HNO3 (K+ NO3-)and (H3O+ NO3-) (K+ NO3-) are relatively high in opposite directions which appearsneeded to obtain the desired curvature.
4. Finally, solubility data22 for solutions of KNO3 and NaNO3 was regressed to obtain theparameters for their ions listed in Table 5. The data fit is excellent at NaN03
concentrations to 20% and KNO3 concentrations to 40%.
2.7 Solutions of Hydrochloric and Nitric Acids
Calculations of vapor compositions of hydrochloric acid solutions using the parameter set forHC1-H2O provided with the ASPEN Plus™ software were first evaluated by comparison withavailable data25 and found to give calculated vapor-phase HC1 concentrations that are over a factor oftwo low for dilute HC1 solutions. It was then decided to develop a new parameter set for HC1-H2Oand HC1-HNO3-H2O solutions.
21

35
10
i i i i i i I i i i I i I i i i l i i i T i r
SolubilityKNO3 - HNO3 - H2O
1 1 1 1 1 1 1 1 1 1 I
1 :
Weight % HNO3 in solution
0 ' 1 ' 1 1 1 1 1 1 1 I 1 1 1 1 1 1 1 1 1 I 1 1 1 1 1 1 1
0 10 20 30
E96 0307
Figure 12 . Comparison of calculated and measured22 solubilities of potassium nitrate in nitric acidsolutions at 20 and 30°C (E96 0307).
22
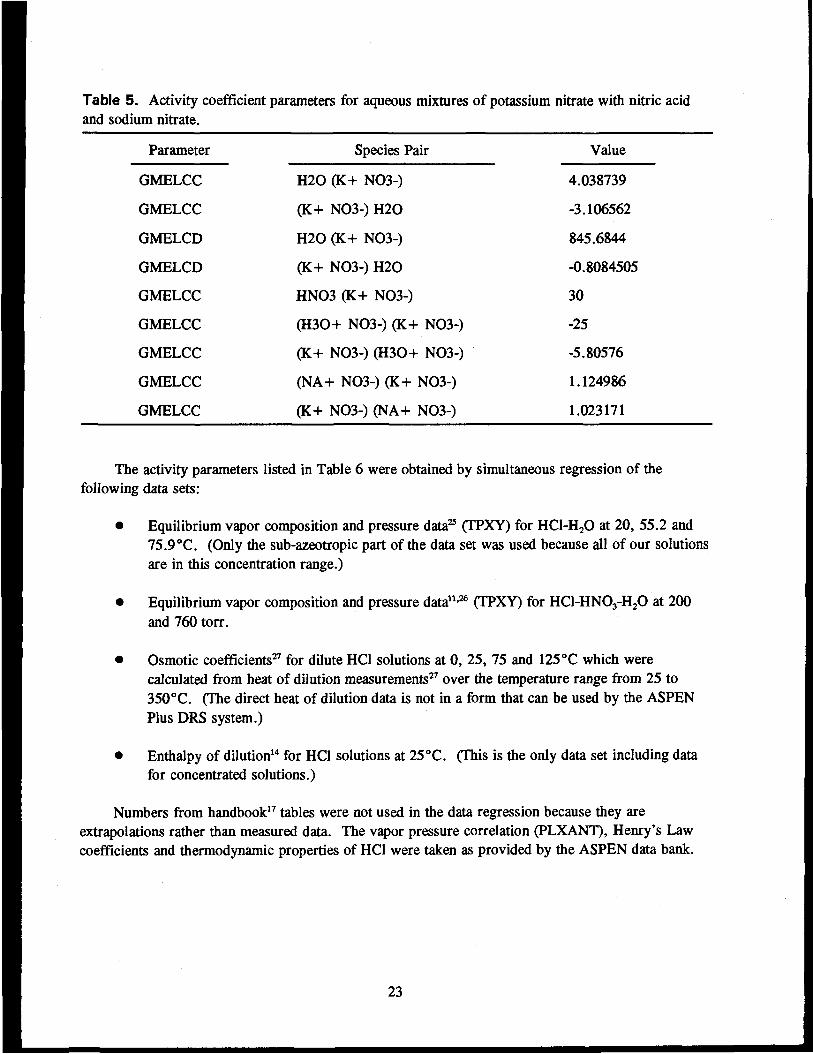
Table 5. Activity coefficient parameters for aqueous mixtures of potassium nitrate with nitric acidand sodium nitrate.
Parameter
GMELCC
GMELCC
GMELCD
GMELCD
GMELCC
GMELCC
GMELCC
GMELCC
GMELCC
Species Pair
H2O (K+ NO3-)
(K+ NO3-) H2O
H2O (K+ NO3-)
(K+ NO3-) H2O
HN03 (K+ NO3-)
(H3O+ NO3-) (K+ NO3-)
(K+ NO3-) (H3O+ NO3-)
(NA+ NO3-) (K+ NO3-)
(K+ NO3-) (NA+ NO3-)
Value
4.038739
-3.106562
845.6844
-0.8084505
30
-25
-5.80576
1.124986
1.023171
The activity parameters listed in Table 6 were obtained by simultaneous regression of thefollowing data sets:
• Equilibrium vapor composition and pressure data25 (TPXY) for HC1-H2O at 20, 55.2 and75.9°C. (Only the sub-azeotropic part of the data set was used because all of our solutionsare in this concentration range.)
• Equilibrium vapor composition and pressure data11-26 (TPXY) for HC1-HNO3-H2O at 200
and 760 torr.
• Osmotic coefficients27 for dilute HC1 solutions at 0, 25, 75 and 125 °C which werecalculated from heat of dilution measurements27 over the temperature range from 25 to350 °C. (The direct heat of dilution data is not in a form that can be used by the ASPENPlus DRS system.)
• Enthalpy of dilution14 for HC1 solutions at 25 °C. (This is the only data set including datafor concentrated solutions.)
Numbers from handbook17 tables were not used in the data regression because they areextrapolations rather than measured data. The vapor pressure correlation (PLXANT), Henry's Lawcoefficients and thermodynamic properties of HC1 were taken as provided by the ASPEN data bank.
23

Table 6. Activity coefficient parameters for aqueous solutions of HCl and HNO3.
Parameter
GMELCC
GMELCC
GMELCD
GMELCD
GMELCE
GMELCE
GMELCC
GMELCC
GMELCD
GMELCD
GMELCC
GMELCC
NRTL 1
NRTL 1
NRTL 1
NRTL 1
Species Pair
H20 (H30+ C1-)
(H30+ C1-) H2O
H20 (H3O+ C1-)
(H3O+ C1-) H20
H2O (H30+ C1-)
(H3O+ C1-) H20
HN03 (H3O+ C1-)
(H30+ C1-) HN03
HN03 (H30+ C1-)
(H30+ C1-) HN03
(H3O+ NO3-) (H3O+ C1-)
(H3O+ C1-) (H3O+ NO3-)
HCl H2O
H20 HCl
HCl HN03
HN03 HCl
Value
7.195472
-3.761581
800.3416
-394.9632
-32.12354
11.1879
6.220643
-12.895
962.7592
6372.017
19
2.220958
0.1461726
0.1822129
3.523998
4.057333
The available data on vapor compositions over HCl solutions is deficient in lacking measuredvapor composition data for HCl concentrations below five mole percent HCl (10 weight % HCl) andat temperatures above 75.9°C. The simultaneous regression of the data sets listed above uses (1) theenthalpy of dilution14 and osmotic coefficient27 data to extrapolate to low HCl concentrations, and(2) the vapor composition data11-26 (TPXY) for HC1-HNO3-H2O and the osmotic coefficient27 data toextrapolate to HCl solutions at boiling.
The results of the data regression is evaluated primarily by comparing vapor compositionscalculated using the resulting activity parameters, which are listed in Table 6 with measured datapoints. As shown in Figure 13, the ASPEN Plus calculations with the derived parameters of partialpressures of HCl over aqueous HCl solutions agree well with the data points. As shown inFigures 14 and 15, the ASPEN calculations provide a plausible data correlation over the range ofnitric acid concentrations in mole fraction of 0.03 to 0.15 (1.5 to 8 M). There is an apparentdiscrepancy for dilute solutions; however, the measured vapor HCl concentrations for these datapoints are in the range (about 1 ppm) where experimental errors are hard to avoid.
24

fco
O
3CO
S?Q.
"retr
2
101
10°
10-1
1
-
—
-
: /
A: /A
I
i i
Vapor-liquid equilibriaHCl - H2O
/
/
/
i i
i i
75.9°C /
/
55.2°C
A
/
i
/
19.95°C
/
I
l
/
/
/
I
I I
OSA
i i
i i
i
-
1 1
1
1 1
-1 I
1
1
1
1 I
0.04 0.06 0.08 0.10
Mole fraction of HCl in liquid
0.12 0.14
E96 0308
Figure 13 . Comparison of calculated and measured25 partial pressures of HCl over sub-azeotropicHCl solutions (E96 0308).
25

o
X
10°
io-1
10-2
In
i I
I I
I.
In
l
-
-
-
—
-
o /
1 1 1
Vapor-liquid equilibriaHCl - HNO3 - H2O
P = 200 torr
/
O /
O /
/ °O /
/
/ °/ O
1 1 1
|
1 t
1 1
1 1
1 1
Mil
1
-
-
-
1 1
III
;
-M
I
10.1 0.2
Mole fraction of HNO3 in liquidE96 0309
Figure 14. Comparison of calculated and measured11 effect of HNO3 concentration on vapor-to-liquid mole fraction ratio (Y/X) for HCl at 200 torr (E96 0309).
26

o
10,-1
10,-2 _
Vapor-liquid equilibriaHCl - HNO3 - H2O
P = 760 torr
0.1 0.2Mole fraction of HNO3 in liquid
8 "
0.3
G96-0189
Figure 15. Comparison of calculated and measured26 effect of HN03 concentration on vapor-to-liquid mole fraction ratio (Y/X) for HCl at 760 torr (G96-0189).
27

2.8 Solutions of Hydrofluoric and Nitric Acids
ASPEN Plus™ calculates HF chemical-reaction and vapor-liquid equilibria for aqueous solutionsusing NBS chemical thermodynamic values14 (for 25°C) plus activity coefficient and vapor pressureparameters provided in its data base. The validity of the vapor-liquid equilibria calculations wastested, as shown in Figures 16, 17 and 18, by comparing measured28-29-30-31 and calculated partialpressure or vapor compositions. The agreement of measured and calculated values hi Figures 16, 17and 18 shows that the parameters from the ASPEN Plus™ data base for HF-H2O mixtures, listed inTable 7, are adequate without additional refinement.
The activity coefficients of HF and F ion were calculated, using the parameters of Table 7, at25 and 100°C. The calculated activity coefficients at 25°C are shown on Figure 19. The activitycoefficients for HF increase steadily with concentration while those for the F" ion decrease steadily.The calculated activity coefficients at 100°C have curves of similar shape except that the values forHF are increased while the values for F" ion are decreased. The low activity coefficients of HF(about 0.003 over much of the range at 25°C) indicates strong bonding with water.
The only available data for HF-HNO3-H2O solutions is VLE data32 at 25°C. The ASPEN dataregression system could not achieve a satisfactory data fit using the previously-derived parameters forHF and HNO3 solutions (primarily because the HNO3-H2O VLE data of this set conflicted with otherHNO3-H2O VLE data at the same low concentration). The HF-HNQ, interaction parameters obtainedfrom regression of the 25 °C data were not used because of their inaccuracies and uncertainapplicability to higher temperatures. Test calculations indicate that these parameters have little effecton the calculated HF partial pressure when the fluoride is complexed with aluminum.
2.9 Solutions of Calcium Nitrate and Nitric Acid
The GMELCC parameters for aqueous solutions of calcium nitrate and nitric acid listed inTable 8 are: (1) the parameters for water and Ca(NO3)2 provided with the ASPEN Plus software and(2) parameters for HNO3 and Ca(NO3)2 obtained by regression of VLE data33 for boiling solutions ofHNO3 and Ca(NO3)2. Vapor-phase HNO3 concentrations calculated using the parameters of Table 8are compared with measured concentrations in Figure 20. The calculated vapor compositions arewithin 10% for the dilute Ca(NO3)2 concentrations usually typical of ICPP wastes but show an erroron the low side that increases with Ca(NO3)2 concentration.
Regressions were also run including: (1) GMELCD terms, (2) GMELCC terms for the ion pair(H3O+ NO3-) (CA+2 NO3-), and (3) the simultaneous regression of all the parameters of Table 7(with some VLE data24 for Ca(NO3)2 solutions included). None of them achieved a significantimprovement in data fit.
28

101
b:oU."X
|COCO
£75trCO
a.
10c
10-o _
Vapor-liquid equilibriaHF-H2O
Brosheer28 OMunter29 AKhaidukov30 D
10Weight percent of HF in the liquid
G96-0190
Figure 16. Comparison of calculated and measured28'29'30 partial pressures of HF over aqueoussolutions at 25, 40, 60 and 75°C (G96-0190).
29
LL."
Xo
(00)CDQ .
"TO• •cCO
Q_
20Weight percent of HF in the liquid
30
G96-0191
Figure 17 . Comparison of calculated and measured29 partial pressures of HF over aqueous solutionsat 30, 50 and 70°C (G96-0191).
30

101
oQ.
20)
X
O
Q.
1
10°
i—i—i—r i—i—i—i—i—i—i—r
Vapor-liquid equilibriaHF-H2O
P = 760 torr
I i
O
i i I i I I i i i i i i I i i i i10 20
Weight percent of HF in the liquidG96-0192
Figure 18. Comparison of calculated and measured31 vapor compositions over aqueous HF solutions
at 760 torr (G96-0192).
31
10"
i i i I I r
I I I I I I
io-3
i i i i i i 1
11 i i i i i i i i i i
10 -2 10 -1 10°
Mole fraction of HFG96-0183
Figure 19. Calculated activity coefficients (mole fraction basis) of HF and fluoride ionat 25°C (G96-0183).
32
J

Table 7. Activity coefficient parameters for HF solutions.
Parameter
NRTL 1
NRTL 1
GMELCC
GMELCC
GMELCC
GMELCC
GMELCD
GMELCD
GMELCD
GMELCD
GMELCE
GMELCE
Species Pair Value
H20HF
HFH20
H2O (H3O+ F-)
(H30+ F-) H2O
HF (H3O+ F-)
(H3O+ F-) HF
H2O (H30+ F-)
(H3O+ F-) H20
HF (H3O+ F-)
(H3O+ F-) HF
H2O (H3O+ F-)
(H3O+ F-) H20
97.28083
-2.297253
15.12827
-2.348784
9.667216
3.566598
-2141.079
-155.0825
-3161.984
-2071.534
0.6771824
-3.456933
Table 8. Activity coefficient parameters for aqueous mixtures of nitric acid and calcium nitrate.
Parameter
GMELCC
GMELCC
GMELCC
GMELCC
Species Pair
H2O (CA+2 NO3-)
(CA+2 NO3-) H2O
HN03 (CA+2 NO3-)
(CA+2 NO3-) HNO3
Value
7.578
-4.072
9.554692
2.741511
33

oQ.
mOX"5o"•5
a
I
10-2
1 1
Vapor-liquid equilibriaCa (NO3)2 - HNO3 - H2O
P = 760 torr
0 y
1
1
1
1
1
0
1
1
1
l 1
1 1
1 1
1
1
0.2 0.4
Weight fraction of Ca (NC>3)2 in liquid
0.6
G96-0184
Figure 2 0 . Comparison of calculated and measured33 effect on vapor-phase HN03 concentrations ofadding Ca(NO3)2 to solutions initially containing 20% HN03 (G96-0184).
34

2.10 Solutions of Ferric Nitrate and Nitric Acid
Data found for Fe(NO3)3-H2O and Fe(NO3)3-HNO3-H2O solutions consists of a set12 ofFe(NO3)3-HNO3-H2O VLE data at atmospheric pressure and a partial set21 (no temperature) ofFe(NO3)3-HNO3-H2O VLE data at reduced pressures. (Solubility data was not collected.) Aregression of the atmospheric pressure VLE data12 yielded the parameters of Table 9. Regressionswere also run including GMELCD terms and GMELCC terms for the ion pair (H3O+ NO3-)(FE+3 NO3-), but none of them achieved a significant improvement in data fit. The data fit with theparameters of Table 9 is similar to the data fit for A1(NO3)3-HNO3-H2O solutions shown in Figure 9.There is a negative error which increases with Fe(NO3)3 concentration from about 12% for 20%Fe(NO3)3 solutions to 45 to 60% for 50% Fe^Q,);, solutions. A comparison of calculations with(non-regressable) data21 at 400 torr showed a large positive error (mostly because the nitric acid VLEcalculations error high at 400 torr).
Table 9. Activity coefficient parameters for aqueous mixtures of nitric acid and ferric nitrate.
Parameter
GMELCC
GMELCC
GMELCC
GMELCC
Species Pair
H2O (FE+3 NO3-)
(FE+3 NO3-) H2O
HNO3 (FE+3 NO3-)
(FE+3 NO3-) HNO3
Value
7.994493
-4.60052
9.093591
2.850314
The data regression problem is that the electrolyte NRTL model cannot fit both the temperatureand composition data (with the given chemistry) at for the higher Fe(NO3)3 concentrations. It fits thetemperatures closely and calculates low vapor nitric acid concentrations. The regression can beconstrained to fit the vapor compositions, but it then calculates erroneous temperatures [+9°C at 50%Fe(NO3)3].
2.11 Solutions of Minor Bivalent Nitrates and Nitric Acid
The waste solutions contain low concentrations of a number of bivalent cations (e.g., Cd+2,Ni+2, and Pb+2) for which neither activity coefficient parameters nor the data from which to regressthem are available. A useful approximation for use with these minor species is to borrow parametersfrom similar species for which adequate parameter sets are available. The use of the previously-developed activity coefficient parameters of calcium nitrate for cadmium nitrate appears appropriatebecause the ionic radii34 of the cations are almost the same (0.99 vs. 0.97 Angstrom).
To provide activity coefficient parameters for another bivalent cation, VLE data12 forCu(NO3)2-HNO3-H2O were regressed to obtain the parameter set listed in Table 10. The cupric ionshould be a suitable surrogate for the metal ions (e.g., nickel) which are near it in the periodic tableand have similar ionic radii.
35
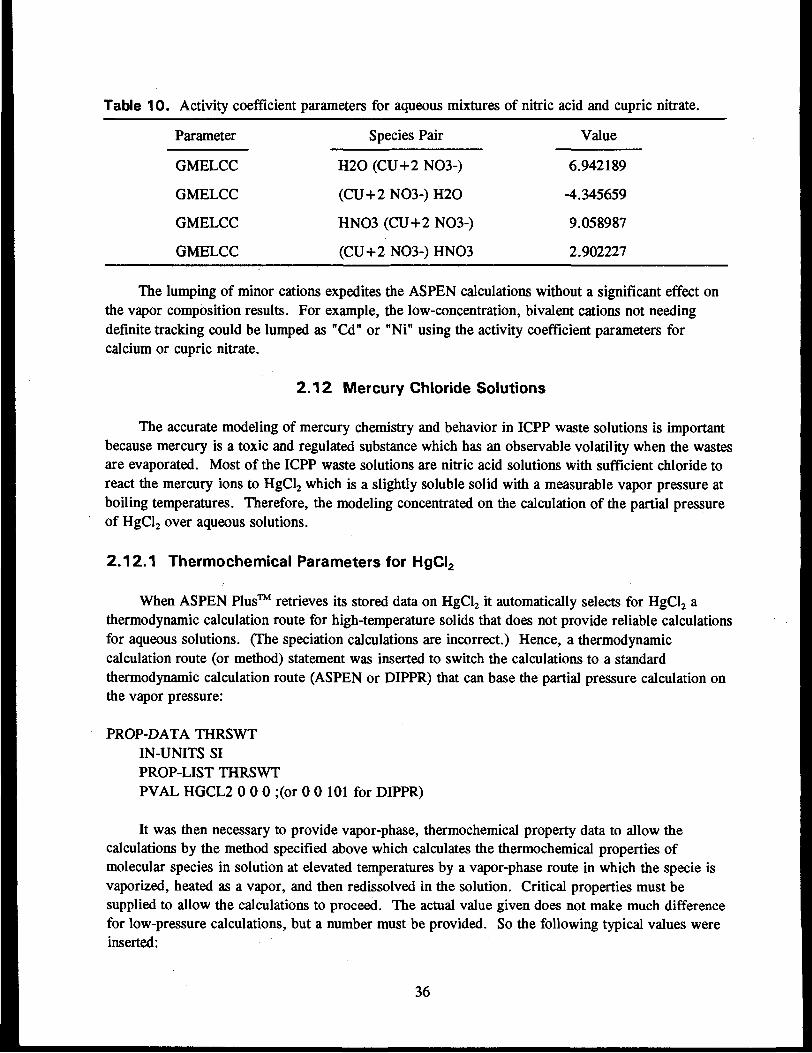
Table 10. Activity coefficient parameters for aqueous mixtures of nitric acid and cupric nitrate.
Parameter
GMELCC
GMELCC
GMELCC
GMELCC
Species Pair
H2O (CU+2 NO3-)
(CU+2 NO3-) H2O
HN03 (CU+2 NO3-)
(CU+2 NO3-) HNO3
Value
6.942189
-4.345659
9.058987
2.902227
The lumping of minor cations expedites the ASPEN calculations without a significant effect onthe vapor composition results. For example, the low-concentration, bivalent cations not needingdefinite tracking could be lumped as "Cd" or "Ni" using the activity coefficient parameters forcalcium or cupric nitrate.
2.12 Mercury Chloride Solutions
The accurate modeling of mercury chemistry and behavior in ICPP waste solutions is importantbecause mercury is a toxic and regulated substance which has an observable volatility when the wastesare evaporated. Most of the ICPP waste solutions are nitric acid solutions with sufficient chloride toreact the mercury ions to HgCl2 which is a slightly soluble solid with a measurable vapor pressure atboiling temperatures. Therefore, the modeling concentrated on the calculation of the partial pressureof HgCl2 over aqueous solutions.
2.12.1 Thermochemical Parameters for HgCI2
When ASPEN Plus™ retrieves its stored data on HgCl2 it automatically selects for HgCl2 athermodynamic calculation route for high-temperature solids that does not provide reliable calculationsfor aqueous solutions. (The speciation calculations are incorrect.) Hence, a thermodynamiccalculation route (or method) statement was inserted to switch the calculations to a standardthermodynamic calculation route (ASPEN or DIPPR) that can base the partial pressure calculation onthe vapor pressure:
PROP-DATA THRSWTIN-UNITS SIPROP-LIST THRSWTPVAL HGCL2 0 0 0 ;(or 0 0 101 for DIPPR)
It was then necessary to provide vapor-phase, thermochemical property data to allow thecalculations by the method specified above which calculates the thermochemical properties ofmolecular species in solution at elevated temperatures by a vapor-phase route in which the specie isvaporized, heated as a vapor, and then redissolved in the solution. Critical properties must besupplied to allow the calculations to proceed. The actual value given does not make much differencefor low-pressure calculations, but a number must be provided. So the following typical values wereinserted:
36

PROP-DATA U-lIN-UNTTS SIPROP-LIST PC / TC / ZC / VCPVAL HGCL2 5E6 / 1000 / .2 / .1
The standard enthalpy of formation (DHFORM) of HgCl2 vapor was obtained from a table35
without a free energy (in the form14 used by ASPEN). The Gibbs free energy of formation(DGFORM) of HgCl2 vapor was calculated by: (1) calculating the free energy of reaction for
Hg(g) + Cl 2 ->HgCl 2 (g )
from the one set35 of enthalpy (H) and entropy (S) of formation values with the formula3514
A G R = A H R - T(ASR) ,
and then (2) adding the calculated AGR to the available14 free energy of formations of Hg(g) and Cl2.(The calculation procedure was checked with Hgl2 for which a complete set14 of thermochemicalparameters is available.) The calculated DGFORM and reference14 DHFORM were then inserted:
PROP-DATA DG-FORMIN-UNITS SIPROP-LIST DGFORM / DHFORMPVAL HGCL2 -1.4202E+08 / -1.4326E+08
Values for the heat capacity (CPIG) of HgCl2 vapor from the literature35 were regressed to obtain aheat capacity correlation for HgCl2:
PROP-DATA CPIGIN-UNITS SIPROP-LIST CPIGPVAL HGCL2 18651 94.7036 0 0 0 0 273 550
Heat of vaporization values, calculated from enthalpy values35 for HgCl2 vapor and solid, wereregressed for the coefficients for the Watson heat of vaporization equation36 with several values forthe critical temperature which is a parameter in the Watson equation. The best data fit was obtainedwith a critical temperature of 1000 which was listed earlier. The Watson equation coefficients fromthe regression were then entered:
PROP-DATA DHVLWTIN-UNITS SIPROP-LIST DHVLWTPVAL HGCL2 83.931E6 298 .1043099 .03841568 273
37
A literature35 correlation for the vapor pressure of HgCl2 was converted from logi0 to In form,checked against other data37 and entered:
PROP-DATA PLXANTIN-UNITS SIPROP-LIST PLXANTPVAL HGCL2 43.8965 -10741.5 0 0 -2.13 0 0 273 550
2.12.2 Activity Coefficients
The NRTL parameters for aqueous HgCl2 solutions were calculated from solubility data22
converted to calculated vapor-liquid equilibrium based on: (1) the principle that the partial pressureof a solute in a saturated solution (i.e., in equilibrium with solid HgClj) is the same as the vaporpressure of the solid, and (2) the assumption that the partial pressure of water is proportional to itsmole fraction. As a check, the same solubility data was converted to activity coefficients, based onunit activity of HgCl2 in saturated solution, which were regressed for a second set of NRTLparameters. The HgCl2 activity coefficients and partial pressures calculated with the second set ofNRTL parameters agreed within 20 percent (and usually better) with those calculated using the firstset of NRTL parameters. The first set of NRTL parameters was used:
PROP-DATA NRTL-1IN-UNITS SIPROP-LIST NRTLBPVAL HGCL2 H2O 100 30000 .30 0.0 0.0 0.0 273 400BPVAL H2O HGCL2 -1.86809 2244.667 .30 0.0 0.0 0.0 273 400
The activity coefficients of HgCl2, calculated with the above NRTL parameters, are shown inFigure 21 as a function of concentration and temperature. The lines at concentrations greater than thesolubility are dashed because they are extrapolations for solutions that do not exist. The downwardsloping shape of the curve is characteristic of the NRTL model. (Note that the activity curves, bydefinition, go to one at 100 percent HgCl2.) The calculated partial pressures of HgCl2 at 80 and100°C are shown in Figure 22. The convex shape comes because the activity coefficient is highest atlow concentrations.
2.12.3 Chemical Speciation Calculations
As a test exercise, the chemical equilibria for the reactions of HgCl2 with chloride ion:
Hg+2 + Cl- < - > HgCl+
HgCl+ + Cr <--> HgCl2
HgCl2 + Cl- <--> HgCV
HgCl3- + Cr <--> HgCV2
38

200
_OX
cCD"oioo
:j> 100o<
HgCI2 - H2O
-Solubility
I0.02
Mole fraction of HgCI2
0.04
G96-0193
Figure 2 1 . Calculated activity coefficients of HgCl2 in aqueous solution (G96-0193).
39

0.10
0.02
Mole fraction of HgCI2
0.04
E96 0310
Figure 22 . Calculated partial pressure of HgCl2 over aqueous solutions (E96 0310).
40

was calculated, both with and without excess chloride, using the parameters from the earlierparagraphs for HgCl2 and parameters from the ASPEN Plus data base for the ionic species. Thecalculated species distributions are given in Table 11, as percent of mercury in the feed, for a typicaltank farm mercury concentration both with and without excess chloride. In both cases, the mercury is>99% as HgCl2. The percent as mercuric ion becomes extremely small with excess chloride. Thesecalculations can be verified qualitatively at ambient temperature with reported38 equilibrium constants.
When the equations given above for the chemical equilibria of the mercury complexes areincluded in calculations for a complex multi-specie mixture (e.g., most ICPP wastes), ASPEN Plus issometimes unable to converge the chemical equilibrium calculations because there are too manyinterlinked equilibria relations. (The mercury chloride complexes are linked via HC1 to all the acidspecies.) In these cases, the calculations are simplified by omitting the mercury chloride equilibriacalculations and considering all of the mercury to be HgCl2. The calculations summarized inTable 11 indicate that this approximation results in an error of less than one percent at least when theCl:Hg ratio exceeds two.
Table 1 1 . Calculated mercury species distributions as percentages at 100°C.
Specie
HgCl2, %
HgCl+
HgCl3-
Hg+2
HgCl;2
Cl:Hg = 2
99.27
0.716
1.75E-3
0.014
2.44E-6
Cl:Hg = 4
99.3
3.3E-3
0.467
3.1E-7
0.223
2.13 Boric Acid Solutions
Boron is entered into the components list as boric acid (H3BO3) because boric acid will be thepredominant boron form in the strongly acid solutions. The fluoride complexes of boric acid werenot considered because Al and Zr ions form much stronger fluoride complexes. With excess Al ionsin solution there is very little available fluoride ion in solution.
The ASPEN data base for boric acid was supplemented by inserting assumed critical properties(which are needed to run but have a negligible effect on the calculations). Heat capacity (CPIG36) andheat of vaporization (DHVLWT36) correlations were regressed from reference enthalphy data:35
CPIG = 18651 94.7036 (SI units);
DHVLWT = 7.545E+7 360 0.38 (SI units).
41

The calculation of a boric acid volatilization is suppressed by inserting a negligible vaporpressure:
PLXANT = -1E+20 (SI units).
2.14 Undissolved Solids
Undissolved solids are represented by A12O3 for which a full set of parameters is available in theASPEN data base.
2.15 Zirconium Complexes
Zirconium ions are important because they complex fluoride ions. Low concentrations of Zrcan be lumped with aluminum for HF equilibria calculations; however, Zr is often tracked separatelyon flowsheets. A full speciation calculation for the Zr complexes is usually not needed because of thelow concentrations of Zr in most ICPP liquid wastes. (Also, ASPEN Plus™ has difficulty convergingsimultaneous equilibria calculations for both the Al and Zr fluoride complexes.)
The compromise treatment of the Zr fluoride complexes is based on calculations with theHFCALC39 program which indicated that the Zr in the waste is predominantly in the form of ZrF2
+2
ion. When the Zr concentration is much less than the Al concentration, the Zr can be entered asZrF2
+2 or ZrF+3 and the fluoride equilibria calculated only for the Al fluoride complexes. Theactivity coefficient parameters for Ca+2 and Fe+3 are used for ZrF2
+2 and ZrF+3 respectively.
2.16 Parameters for Solution Density
Accurate solution density calculations are important because the ICPP waste evaporators usedensity as a control parameter.
2.16.1 Clarke Model for Aqueous Solutions
ASPEN Plus™ calculates the densities of aqueous electrolytes using the two-parameter Clarkemodel36 for the mole volume in solution (V.) of a salt (ion pair):
v, = c8l to1'2]
where x, is the apparent mole fraction of salt s; and Csl and C,2 are constants (called VLCLK) whichare determined by regression of density data. For molecular solutes (including the non-ionized HNO3
and HF), ASPEN Plus™ uses the Rackett correlation36 for which characterizes each solute by avolume constant called RKTZRA.
42

2.16.2 Density Parameter Regression
The VLCLK parameters for NaNO3, KNO3, Ca(NO3)2, Cd(NO3)2, A1(NO3)3, Fe(NO3)3 andPb(NO3)2 listed in Table 12 were regressed from reference37-24 density data. For HNO3 and HF, boththe VLCLK (Table 12) and RKTZRA (Table 13) parameters were regressed from density data.37-24
Data at different temperatures was used when available; however, only ambient temperature data isavailable for most of the salts. The parameters for HC1 and H2SO4 were taken from the ASPENPlus™ data bank and verified. The RKTZRA parameter for boric acid was regressed from a vendor-supplied density.
The VLCLK parameters for the aluminum fluoride complexes could not be regressed due to lackof density data. They are based on a mixing rule1 that postulates that the total volume of the ions isconserved in an ionic reaction. Thus, the VLCLK parameters for the aluminum fluoride complexeswere calculated from the VLCLK parameters for A1(NO3)3, HNO3 and HF. The calculated VLCLKparameters for A1F+2 and A1F2
+ are also used for ZrF+3 and ZrF2+2, respectively.
2.16.3 Test Calculations for HLLW Tanks
The accuracy of the ASPEN density calculations for the ICPP wastes with the parameters ofTables 12 and 13 was tested by calculating densities for five HLLW storage tanks with measuredcompositions and densities. First, a total ion charge concentration based on the compositions wascalculated as a check on the overall accuracy and completeness of the analyses. The speciationassumed for the end of the (buffered) acid titration was Al+3, Na+, K+, Cd+2, Ca+2, Fe+3, Pb+2,Mn+2, Ni+2, Hg+2, Zr+4, H3BO3, NO3% Cl\ F , MO4\ HSO4" and H2PO4\ The total ion chargeconcentrations (i.e., sum of ion charge times concentration), which should be zero, has a root-mean-square misbalance of 0.4 M. This misbalance, which can result from analytical errors and omittedspecies, suggests an uncertainty of about 0.4 M in the overall analyses.
Solution densities were calculated using the density parameters of Table 12 and the followingsubstitutions of species to cover minor species without density parameters:
"AT = Al + Zr,
"Cd" = Cd + Mn + Ni,
"Fe" = Fe + Cr, and
"H2SO4" = H2SO4 + H3PO4.
H3BO3 and HgCl2 were omitted; and undissolved solids (UDS) were added in afterwards. Nitric acidconcentrations were calculated based on both the acid analysis and the nitrate analysis to bracket thecomposition uncertainty. The solution densities calculated with both the higher and lower nitric acidconcentrations were compared with the measured densities. The differences (calculated - measured)
43

Table 12. Clarke density parameters in liter/kmole.
Ion Pair
H3O+ CL-
NA+ NO3-
AL+3 NO3-
K+ NO3-
H3O+ NO3-
H3O+ F-
ALF+2 NO3-
ALF2+ NO3-
ZRF + 3 NO3-
ZRF2+2 NO3-
FE+3 NO3-
CA+2 NO3-
CD+2 NO3-
PB+2 NO3-
H3O+ HS04-
Table 13 . Rackett density parameters
Specie
HF
HNO3
H3BO3
UDS
VLCLK 1
34.551110
28.385720
43.34014
37.901020
37.29077
28.67853
34.72916
26.1100
34.729
26.11
52.58633
29.73381
39.70517
36.43566
54.80395
(SI).
RKTZRA
0.1061636
0.220779
0.2072285
0.3
VLCLK 2
13.365810
22.252990
89.50370
24.333100
38.85941
15.01079
65.6551
41.8065
65.6551
41.8065
158.2994
133.6407
55.68283
171.11562
20.24347
are listed in Table 14 which shows a small but persistent underestimation of density. The averagedensity difference of Table 14 exceeds the estimated density effects of the known omissions andsubstitutions (less than 0.001 g/ml each). The average error (on densities ranging from 1.12 to1.26 g/ml) is 0.0083 g/ml low.
44
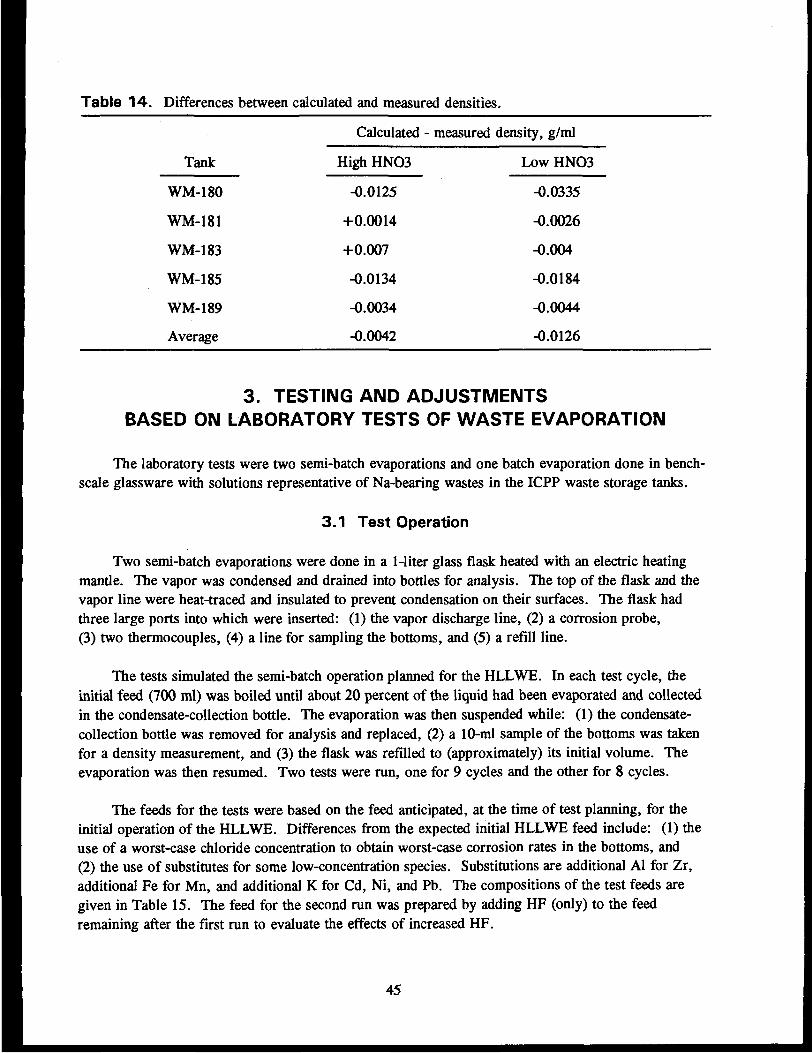
Table 14. Differences between calculated and measured densities.
Tank
WM-180
WM-181
WM-183
WM-185
WM-189
Average
Calculated
High HN03
-0.0125
+0.0014
+0.007
-0.0134
-0.0034
-0.0042
- measured density, g/ml
Low HNO3
-0.0335
-0.0026
-0.004
-0.0184
-0.0044
-0.0126
3. TESTING AND ADJUSTMENTSBASED ON LABORATORY TESTS OF WASTE EVAPORATION
The laboratory tests were two semi-batch evaporations and one batch evaporation done in bench-scale glassware with solutions representative of Na-bearing wastes in the ICPP waste storage tanks.
3.1 Test Operation
Two semi-batch evaporations were done in a 1-liter glass flask heated with an electric heatingmantle. The vapor was condensed and drained into bottles for analysis. The top of the flask and thevapor line were heat-traced and insulated to prevent condensation on their surfaces. The flask hadthree large ports into which were inserted: (1) the vapor discharge line, (2) a corrosion probe,(3) two thermocouples, (4) a line for sampling the bottoms, and (5) a refill line.
The tests simulated the semi-batch operation planned for the HLLWE. In each test cycle, theinitial feed (700 ml) was boiled until about 20 percent of the liquid had been evaporated and collectedin the condensate-collection bottle. The evaporation was then suspended while: (1) the condensate-collection bottle was removed for analysis and replaced, (2) a 10-ml sample of the bottoms was takenfor a density measurement, and (3) the flask was refilled to (approximately) its initial volume. Theevaporation was then resumed. Two tests were run, one for 9 cycles and the other for 8 cycles.
The feeds for the tests were based on the feed anticipated, at the time of test planning, for theinitial operation of the HLLWE. Differences from the expected initial HLLWE feed include: (1) theuse of a worst-case chloride concentration to obtain worst-case corrosion rates in the bottoms, and(2) the use of substitutes for some low-concentration species. Substitutions are additional Al for Zr,additional Fe for Mn, and additional K for Cd, Ni, and Pb. The compositions of the test feeds aregiven in Table 15. The feed for the second run was prepared by adding HF (only) to the feedremaining after the first run to evaluate the effects of increased HF.
45

Table 15. Molar concentrations of solutes in feeds for semi-batch laboratory evaporations.
Specie
Acid
NO3
Cl
F
SO4
Al
Na
K
Ca
Cr(IH)
Fe
* concentration
TargetFeed Cone.
1.89
4.06
0.03
0.112
0.035
0.467
0.405
0.079
0.079
0.010
0.039
used in simulation.
Run 1Feed Analysis
2.084
4.01
0.032
0.109*, 0.166
0.033
0.529
0.456
0.090
0.0645
0.011
0.043
Run 2Feed Analysis
2.072
3.94
0.0307
0.168*, 0.20
0.042
0.504
0.439
0.079
0.063
0.0104
0.041
The laboratory evaporations were continued about 40% beyond the expected HLLWE end pointto a feed:bottoms ratio of 3.2 to check the operating margins for solids precipitation or any otheradverse effect. Temperatures and corrosion rates were monitored throughout the two tests andrecorded at the end of each cycle just before taking the samples of condensate and bottoms. Theweights of each feed addition, condensate batch and sample were measured. The densities of allsamples were measured. Feed and sample volumes were then calculated from weight and density.The feed and condensate samples (only three condensate samples from second run) were analyzed forcomposition.
The batch evaporation evaporated 800 ml of liquid, whose composition is given in Table 16, inan glass flask until 551 ml of condensate was collected. The condensate was collected in batches ofabout 58 ml with half the condensate batches being analyzed.
3.2 Simulation Models of Tests
ASPEN models were prepared for each of the laboratory evaporations. The models simulatedthe first seven stages (i.e., condensate samples) using a flash block for each stage. (The last one ortwo stages were omitted from the simulations because their concentrations are well in excess of thoseof interest to the HLLWE.) Vapor fractions and flow splits were adjusted until the calculated flows
46
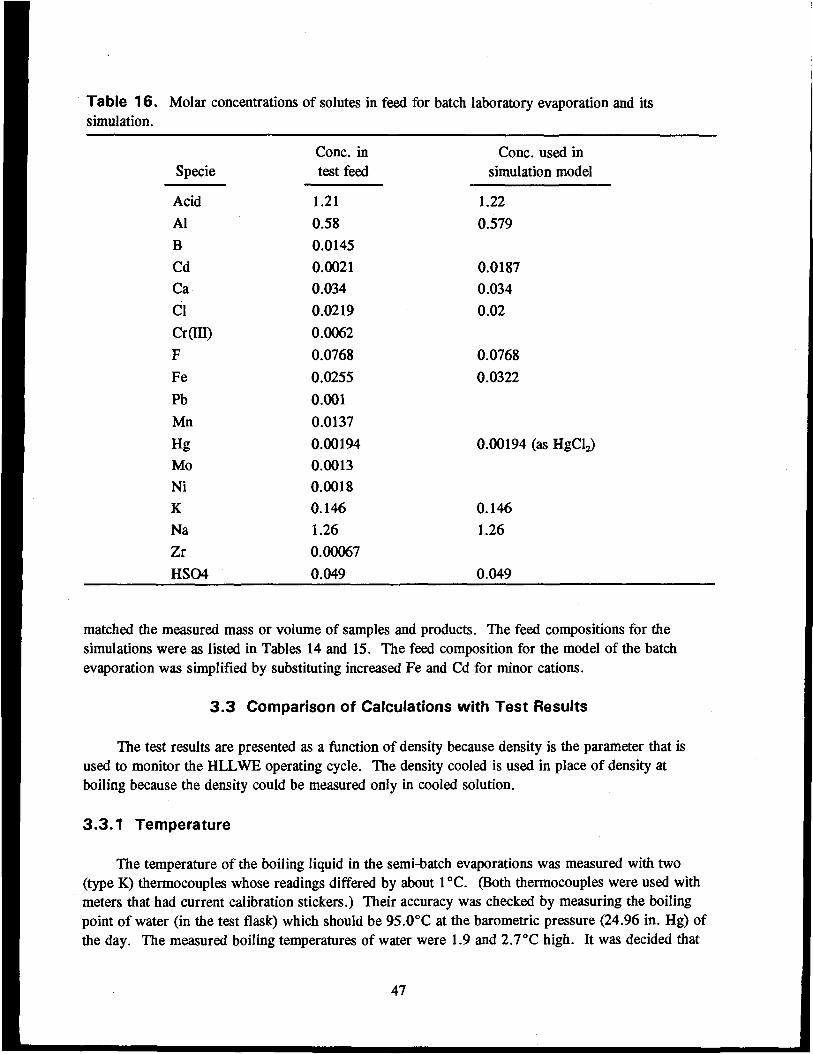
Table 16. Molar concentrations of solutes in feed for batch laboratory evaporation and itssimulation.
Specie
AcidAlBCdCa
ClCr(m)F
Fe
PbMn
HgMoNiKNaZrHSO4
Cone, intest feed
1.210.580.01450.00210.034
0.0219
0.0062
0.07680.0255
0.0010.01370.001940.00130.00180.1461.260.000670.049
Cone, used insimulation model
1.22
0.579
0.01870.0340.02
0.07680.0322
0.00194 (as HgCy
0.1461.26
0.049
matched the measured mass or volume of samples and products. The feed compositions for thesimulations were as listed in Tables 14 and 15. The feed composition for the model of the batchevaporation was simplified by substituting increased Fe and Cd for minor cations.
3.3 Comparison of Calculations with Test Results
The test results are presented as a function of density because density is the parameter that isused to monitor the HLLWE operating cycle. The density cooled is used in place of density atboiling because the density could be measured only in cooled solution.
3.3.1 Temperature
The temperature of the boiling liquid in the semi-batch evaporations was measured with two(type K) thermocouples whose readings differed by about 1 °C. (Both thermocouples were used withmeters that had current calibration stickers.) Their accuracy was checked by measuring the boilingpoint of water (in the test flask) which should be 95.0°C at the barometric pressure (24.96 in. Hg) ofthe day. The measured boiling temperatures of water were 1.9 and 2.7°C high. It was decided that
47

the discrepancy was mostly due to the superheating needed to provide sufficient overpressure to forma vapor bubble on the smooth glass wall of the flask. This conclusion is based on observing that themeasured temperature: (1) varied with boiling rate and (2) decreased with addition of a boiling chip.The superheating to form vapor bubbles will not occur in the HLLWE because metal surfaces havesufficient roughness to form vapor bubbles without significant superheating. The overpressure for themeasured thermocouple discrepancies is estimated at about 50 torr (for the lower-readingthermocouple). The correction of 50 torr was then added to the barometric pressures to obtain thepressures used in the simulation models.
The boiling temperatures were also measured in the batch evaporation. However, their usabilityis questionable because of a major difference between readings from two different readout devices.
The boiling temperatures measured at the end of each semi-batch evaporation cycle (whenbottoms density is measured) increased with evaporation as a nearly linear function of bottoms densityfrom about 103 °C at the start to about 114°C at the end of the test. The boiling temperaturescalculated by the simulations averaged 0.3°C low (compared to the lower reading thermocouple) forthe first evaporation and 0.9°C low for the second run. Both simulations can be considered withinexperimental error.
3.3.2 Liquid Density
The liquid densities calculated by the semi-batch evaporation simulations (at 25 °C) were a littlelower than the measured densities. The difference increased with evaporation from 0.005 and0.0035 g/ml respectively in the feeds for the two runs to 0.03 and 0.05 g/ml at the end of thesimulations. The comparison of the feed densities is the best comparison because analyzedcompositions were obtained for the feeds but not the bottoms samples. (The calculated densities ofthe bottoms are based on calculated compositions rather than analyzed compositions.)
The discrepancies between calculated and measured feed densities are within the uncertainties ofthe feed composition. However, they do confirm a tendency to calculate slightly low. The densityparameters most likely to be in error are those for the fluoride complexes.
3.3.3 Nitric Acid in Condensate
The measured and calculated condensate HNO3 concentrations for the first semi-batchevaporation test are shown in Figure 23. Two data points are shown for each sample because theHNO3 concentration was calculated based on both the total acid and nitrate concentrations in thecondensate sample. Horizontal lines are drawn to the left of the data point to show the range overwhich the sample averaged the condensate composition. There is an uncertainty to the feed HNO3concentration because different HNO3 concentrations are obtained using the acid and nitrate analyses.The set of three lines on Figure 23 shows the range of calculated condensate HN03 concentrationsobtained using high, low and average values for feed HNO3 concentration.
48

10°
.2IEoo
88IacSCO
Eoo
10-1
I I I I I | I I I I I I I I I j I I I I I T
Feed[HN03]
From acid analysisFrom nitrate analysis
OA
I i i i i i i i i i I i i i i i i i i i I i i i i i i
1.2 1.3 1.4
Specific gravity of cooled bottomsE96 0311
Figure 2 3 . Condensate nitric acid concentration during semi-batch HLLWE simulation (E96 0311).
49

During the test evaporations, the concentrations of nitric acid in the condensate increasedsteadily with evaporation, as shown in Figure 23, to concentrations exceeding the concentration in thefeed by the end of the test. The slope of the plots of calculated condensate HNO3 concentration donot quite match the data. The calculated HNO3 concentrations are high at the lower bottoms densitiesand low at the higher bottoms densities. A comparison of the averages of the measured andcalculated HNO3 concentrations shows the average calculated HNO3 concentration being 13% highover the HLLWE operating range (to a bottoms Sp. G. of 1.37) and 4% low over the range of thesimulation (to a bottoms Sp. G. of 1.42). The results of the second semi-batch evaporation test areessentially the same as shown on Figure 23 because the feed composition is nearly the same as for thefirst test. The condensate HNO3 concentrations are not shown for the batch evaporation test becausethere are only two measured concentrations (whose agreement with the calculations is about the sameas for Figure 23).
3.3.4 Chloride in Condensate
The measured chloride concentrations for the two semi-batch HLLWE simulation runs (whoseCl concentrations were similar) are shown on Figure 24. Again, a line is extended to the left of thedata points to show the range represented by the sample.
The condensate Cl concentration for each test increased with evaporation, as is shown onFigure 24, to concentrations exceeding that in the feed. The initial calculated condensate Clconcentrations were about 100% high. The calculated condensate Cl concentrations were adjusteddownward to the solid line with the empirically-determined (i.e., trial and error) parameters:
GMELCC (M+ NO3-) (M+ C1-) = 0GMELCC (M+ C1-) (M+ NO3-) = -1
where M+ represents Na+, K+, Al+3, Fe+3, and Ca+2. The line for the adjusted calculations still hasa slope that is too low and an incorrect downward curl at the highest densities. No ASPEN parameterwas found that would increase the slope of the plot of calculated Cl concentrations. A comparison ofthe averages of the measured and calculated Cl concentrations shows the average calculated Clconcentration being 24% high over the HLLWE operating range (to a bottoms Sp. G. of 1.37) and2% high over the range of the simulation (to a bottoms Sp. G. of 1.42).
The ASPEN calculations, using the adjusting GMELCC parameters listed in the precedingparagraph, provided a similar fit to the condensate Cl concentration data from the batch evaporationas shown in Figure 25. The calculated condensate Cl concentrations are a little high at the start and alittle low at the end of the evaporation.
3.3.5 Fluoride in Condensate
The primary difference between the two semi-batch test runs was a 50% increase in the fluorideconcentration in the feed for the second run. The measured condensate F concentrations for the twosemi-batch runs are shown in Figure 26. The condensate F concentration for the first run shows a
50
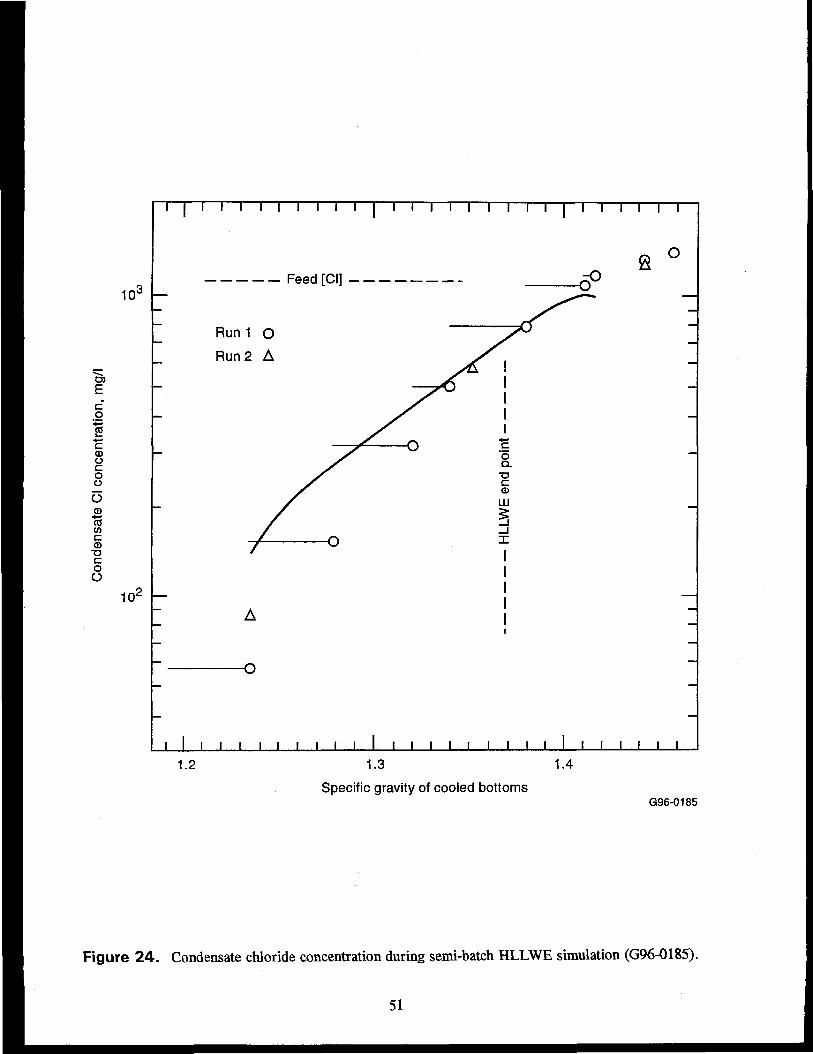
10°
Ec'•*->a*-•ooo
OCD
15(/)cCD
•DCoO
I l i I I i r \ i i r
Feed [Cl]
Run 1 O
Run 2 A
i i i i i i i i i I i i i i i i i i i I i i i i i i
1.2 1.3
Specific gravity of cooled bottoms
1.4
G96-0185
Figure 24 . Condensate chloride concentration during semi-batch HLLWE simulation (G96-0185).
51

o>Ecfo
10)oooO
ICO<DT3CoO
Condensate volume: feed volumeG96-0186
Figure 25. Condensate chloride concentration during batch waste simulant evaporation (G96-0186).
52

o
IV
u
803tow
TJ
O
o
15
10
i i r
Run 1Run 2
\ i i i i i i i r i i i i r
OA
A -
OO O -
i i i i i i i i i I i i i i i i i i i I i i i i i i
1.2 1.3 1.4
Specific gravity of cooled bottomsE96 0312
Figure 26. Condensate fluoride concentration during semi-batch evaporations (E96 0312).
53

steady increase over most of the evaporation followed by a leveling off at higher bottoms densities.The condensate F concentration for the second semi-batch run, which had increased F and a reducedA1:F ratio, increased throughout the run.
The initial calculated condensate F concentrations for the first run were high with a downwardslope with increasing evaporation. The slope of the calculated vapor-phase HF curve was improvedby: (1) deleting the GMELCC parameters from Table 4 for the sodium nitrate and aluminum nitrateion pairs, and (2) using the GMELCC parameters for A1(NO3)3 from Table 3 and use them forsolutions of A1F+2 as listed in Table 17. The calculated curves were then adjusted downward to thoseshown on Figure 26 by a trial-and-error adjustment of the DGAQFM (aqueous free energy offormation) for A1F+2 to -8.156E+8 j/kmole, which is slightly outside the range of reference14'40
DGAQFM values of -8.O3E+8 to -8.11E+8 j/kmole. The resulting calculated condensate Fconcentration curve for the first run has about the same average value (over the range up to a liquidSp. G. of 1.37) as the measured concentrations but the slope is still a little low. The calculated curvefor the second run has the same low slope and averages about 50% high.
Table 17 . Activity coefficient parameters for aqueous mixtures of nitric acid and A1F complexes.
Parameter
GMELCCGMELCCGMELCDGMELCDGMELCEGMELCEGMELCCGMELCCGMELCDGMELCDGMELCEGMELCEGMELCCGMELCCGMELCDGMELCD
Species Pair Value
H2O (A1F+2 NO3-)(A1F+2 NO3-) H2OH2O (A1F+2 NO3-)(A1F+2 NO3-) H2OH2O (A1F+2 NO3-)(A1F2+ NO3-) H2OHNO3 (A1F+2 NO3-)(A1F+2 NO3-) HNO3HN03 (A1F+2 NO3-)(A1F+2 NO3-) HNO3HNO3 (A1F+2 NO3-)(A1F+2 NO3-) HNO3(H3O+ NO3-) (A1F+2 NO3-)(A1F+2 NO3-) (H3O+ NO3-)(H3O+ NO3-) (A1F+2 NO3-)(A1F+2 NO3-) (H3O+ NO3-)
29.95914-10.1010-5892.0011470.918
-10033.165842.192842-8.527461562.6885736.82493.7309
-10012.686626.9115496092.308-550.0901
The condensate fluoride concentrations calculated by the simulation of the batch evaporationfollowed the slope of the test data but were about 35 percent low. Thus, there is an apparent errorwhich depends on the A1:F ratio. The calculated condensate fluoride concentrations are high for thesecond semi-batch evaporation, which had the lowest A1:F ratio (3:1), and low for the batchevaporation which had the highest A1:F ratio (7.5:1).
The calculation of the average F concentration in the condensate appears to have an error thatvaries with the A1:F ratio in the evaporator feed. The calculated average F concentration in thecondensate is about right for the first semi-batch evaporation in which the A1:F ratio was 4.7, highfor the second semi-batch evaporation in which the A1:F ratio was 3.0, and way low for the batchevaporation in which the A1:F ratio was 7.5. (However, difficulties in analyzing for low
54

concentrations of F in HNO3 solutions may have contributed to the apparent error. The reportedconcentrations of 2 to 15 mg F/l are at the margin of the analytical method.) The error could resultfrom errors in calculations of species activities or of the A1F+2 complexing equilibria. The calculatedactivity of the Al+3 ion is a likely source of error because the VLE calculations for A1(NO3)3-HNO3-H2O also have an error (Figure 9) which increased with concentration. At the lower A1:F ratios(< 4.7) at which HF volatility is of concern, the calculated condensate F concentrations will beconservative.
3.3.6 Mercury Chloride
The calculated vaporization of HgCl2 from boiling HLLW solutions was evaluated bycomparison of calculated vapor compositions with compositions obtained by analysis of the condensatefrom the batch evaporation test. (The feed for the semi-batch evaporation did not contain mercury.)The calculated condensate concentrations of HgCl2 were initially over a factor of ten lower than boththe measured concentrations in the condensate. The calculated HgCl2 concentrations for thecondensate from the evaporation test were also lower than the concentrations of HgCl2 in condensatefrom boiling HgCl2-H2O solutions. This discrepancy was attributed to the absence of activityparameters (GMELCC) for interactions of the ions in solution with HgCl2. The missing activityparameters were obtained by a stepwise regression with postulated feed solutions of the same totalnormality (4.5 N) as used in the test assuming all solutions with the total normality of 4.5 N have thesame vapor HgCl2 concentrations (i.e., the measured concentrations). First, the parameters(GMELCC) for nitric acid and aluminum nitrate were regressed (together) with the measuredcondensate HgCl2 concentrations and a feed containing 1.05 M HNO3 and 1.15 M A1(NO3)3. Next,the parameters (GMELCC) for sodium nitrate were regressed, using the GMELCC parameters fornitric acid from the previous regression, with the measured condensate HgCl2 concentrations and afeed containing 1.05 M HN03 and 3.45 M NaNO3. The set of GMELCC parameters for theinteractions of the ion pairs with HgCl2 listed in Table 18 are the GMELCC parameters obtained fromthe regressions applied as follows: (1) the GMELCC parameters for nitric acid are used for all theacids, (2) the GMELCC parameters for sodium nitrate are used for all the monovalent salts, (3) theGMELCC parameters for aluminum nitrate are used for all the trivalent salts and (4) averages of theGMELCC parameters for sodium nitrate and aluminum nitrate are used for the divalent salts.
The vapor-phase concentrations of HgCl2 for the batch evaporation test were then calculatedusing the above list of GMELCC parameters and the measured feed composition and condensaterfeedvolume ratios. The calculated vapor-phase concentrations of HgCl2 agreed reasonably well with theexperimental measurements as is shown in Figure 27. It is uncertain whether the mercury chloridevolatility would be effected by the relative distribution of ionic species in solution.
55

Table 18. Activity coefficient parameters for aqueous HgCl2 solutions containing dissolved nitrates.
Parameter
GMELCC
GMELCC
GMELCC
GMELCC
GMELCC
GMELCC
GMELCC
GMELCC
GMELCC
GMELCC
GMELCC
GMELCC
GMELCC
GMELCC
GMELCC
GMELCC
GMELCC
GMELCC
Species Pair
HBCL2 (H3O+ N03-)
(H3O+ N03-) HGCL2
HBCL2 (H30+ HSO4-)
(H30+ HSO4-) HGCL2
HGCL2 (AL+3 N03-)
(AL+3 N03-) HGCL2
HGCL2 (FE+3 N03-)
(FE+3 N03-) HGCL2
HGCL2 (NA+ NO3-)
(NA+ NO3-) HGCL2
HGCL2 (K+ NO3-)
(K+ NO3-) HGCL2
HGCL2 (CA+2 NO3-)
(CA+2 N03-) HGCL2
HGCL2 (CD+2 N03-)
(CD+2 NO3-) HGCL2
HGCL2 (ALF+2 N03-)
(ALF+2 NO3-) HGCL2
Value
3.81249
2.12927
3.81249
2.12927
8.67805
12.0573
8.67805
12.0573
8.057026
11.4694
8.057026
11.4694
8.35
11.75
8.35
11.75
8.35
11.75
56

(D
a>
a•a
ooc
_£\l
O
O
g
+-•
CDO
O
o
Ratio of condensate volume to feed volumeG96-0187
Figure 2 7 . Comparison of calculated and measured concentrations of mercury as HgCl2 incondensate from the batch evaporation test (G96-0187).
57

4. PROPERTIES FILE PROP-R9C
The property parameters developed in this study have been compiled in ASPEN insert filePROP-R9C which is in both the .BKP (backup) and .INP (input) forms. The PR0P-R9C.INP file islisted in Appendix A.
4,1 Properties File Usage
The PROP-R9C.BKP file can be readily imported into a new ASPEN Plus™ program. Juststart the ASPEN Plus™ Model Manager program in a directory containing PROP-R9C.BKP; thenclick "File", "Import", "PROP-R9C", and "Enter". After about five minutes, a program, containingthe PROP-R9C parameters, will be set up waiting for a flowsheet.
Importing a properties file into an existing file as an upgrade is tricky because the ASPENPlus™ import function does not delete all of the existing parameters (especially those from theASPEN Plus™ data base) that are to be replaced. Two approaches to importing a properties file intoan existing file are as follows:
1. A relatively safe approach begins with exporting a .INP file (ASCII text) of the existingprogram. Then use a text editor to copy the parameters paragraphs from PROP-R9C.INP(as a group) into the program (.INP) file placing them below the parameters to bereplaced. The key consideration is that when ASPEN Plus™ runs a .INP file containingconflicting parameters, it uses the parameters listed last. (The file can be cleaned byremoving obsolete parameters but this is not necessary.) An upgraded program .BKP fileis formed by setting ASPMMB=ON and running the upgraded program .INP file. Theupgraded program .BKP file is then imported to generate the upgraded Model Managerfile.
2. Another import approach, using Model Manager, is to delete from the Model Managerprogram all parameter sets (e.g., the GMELCC parameters) containing parameters to bereplaced. PROP-R9C.BKP can then be imported without conflict. The risk of thisapproach is that any parameters unique to the existing program will be lost.
After inserting PROP-R9C, or any other set of custom parameters, care must be taken not toclick the Model Manager "Electrolytes" button which will replace the existing parameters with thosein the ASPEN Plus™ data bank.
4.2 Parameter Set Verification
A series of PROP-TABLEs has been included in PROP-R9C to verify the parameter sets for themajor chemical species. The PROP TABLES are those used to generate some of the figures in thisreport. If the correct parameters are present, the PROP-TABLEs will reproduce the appropriatefigure. (TRUE-COMPS = NO is needed for some of the tables.)
58

• PROP-TABLEs Y-HN03 and PPMX will verify parameters for H N O J - H J O by reproducingFigures 2, 3, and 4.
• PROP-TABLE PP-HCL will verify parameters for HC1-H2O by reproducing Figure 13.
• PROP-TABLE HCL-HGH will verify parameters for HC1-HNO3-H2O by reproducingFigure 14.
• PROP-TABLE Y-HF will verify parameters for HF-H2O by reproducing Figure 18.
• PROP-TABLE Y-EF760 will verify parameters for NaNO3-HNO3-H2O by reproducingFigure 7.
• PROP-TABLE EFI-AL20 will verify parameters for A1(NO3)3-HNO3-H2O by reproducingFigure 9.
5. SUMMARY EVALUATION
This section provides a critical assessment of the set of parameters developed in this report andof the accuracy of VLE calculations using them with the ELECNRTL model.
5.1 Nitric Acid Solutions
The parameter set for nitric acid solutions provides good VLE calculations (i.e., vaporcompositions within 25%) for nitric acid concentrations up to 60% (to 0.3 mole fraction) nitric acid at25°C and from 15 to 60% nitric acid at 1 atm. However, the ELECNRTL model does not follow thechanges with temperature of the shape of the VLE (Y vs. X) curves for dilute solutions. Thecalculated vapor HNO3 concentrations error low at 1 atm for HNO3 concentrations below about 15%,and error high for temperatures between 25 °C and boiling.
5.2 Solutions of Nitric Acid and Nitrate Salts
The addition of nitrate salts to boiling nitric acid solutions increases the vapor-phaseconcentration of nitric acid as is shown on Figure 28 (which shows the experimental12'2033 addition ofnitrate salts to solution initially containing 20% HNO3). The relative increase in vapor-phase HN03
concentration increases with valence and ionic chargerradius ratio from monovalent Na to tri-valentAl. The calculated vapor-phase HNO3 concentrations, which are shown as dashed lines on Figure 28for NaNO3, Ca(NO3)2, and A1(NO3)3, agree within 25% of the data for NaNO3 concentrations to20 mole % (about 10 M) but only to about 5 mole % (about 2.5 M) for the bivalent and trivalentions. At the higher concentrations of bivalent and trivalent nitrate salts, the calculated vapor-phaseHNO3 concentrations are low.
59

102 r
>
C
i"5<DO
I
I
10°
1 1 1 1 1 I I
Vapor-liquid equilibriaP = 760 torr
j//II/ /
: Pi
7 1/m l / /11//11//1 Ar /
- //' ''4 /' / /If/' ' /
lr/ if
i i i i i
//
//
••
/
i i
1 1 | 1 1 1 1 1
/ ss
s
XAl (NO3)3
Fe (NO3)3
Al (NO3)3 (calc.)Cu (NO3)2
Ca (NO3)2
Ca (NO3)3 (calc.)NaNO3
NaNO3 (calc.)
i i 1 i i i i i
I l I I
—
-
Vm— —AD__ _ _O
1 1 1 1
10
Mole percent of nitrate salt in the liquid
20
E96 0313
Figure 2 8 . Vapor compositions of boiling solutions made by adding various nitrate salts to a nitricacid solution initially containing 20 percent nitric acid (E96 0313).
60
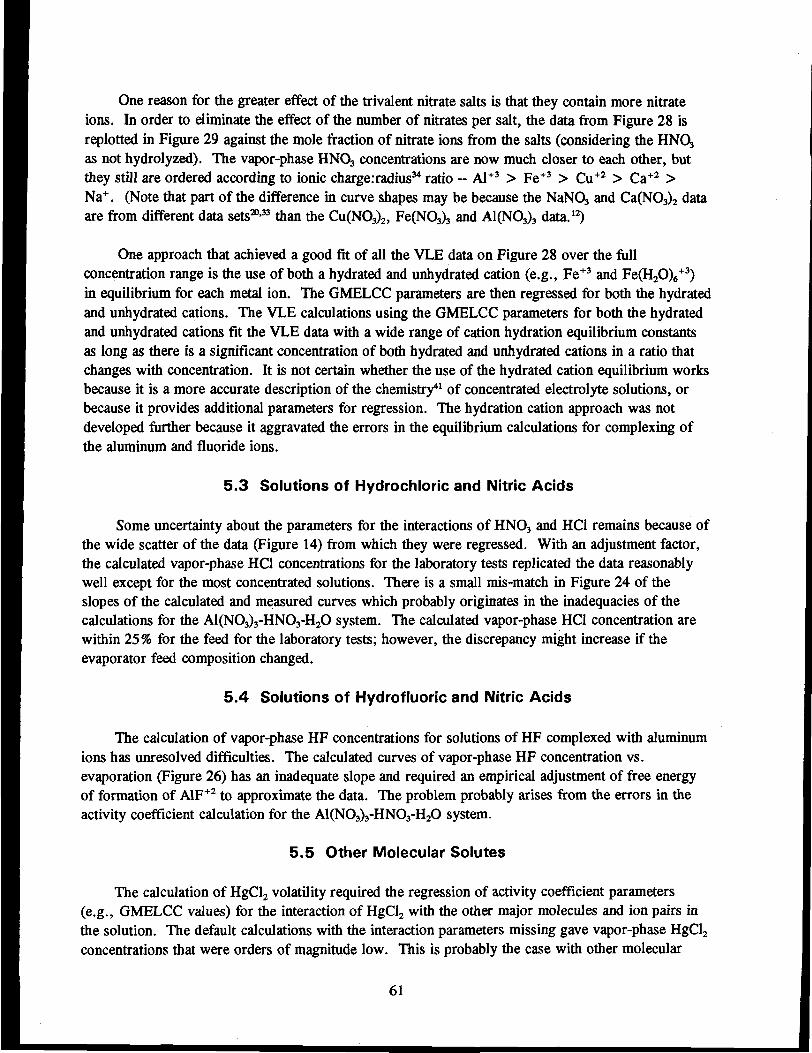
One reason for the greater effect of the trivalent nitrate salts is that they contain more nitrateions. In order to eliminate the effect of the number of nitrates per salt, the data from Figure 28 isreplotted in Figure 29 against the mole fraction of nitrate ions from the salts (considering the HNO3
as not hydrolyzed). The vapor-phase HNO3 concentrations are now much closer to each other, butthey still are ordered according to ionic chargerradius34 ratio - Al+3 > Fe+3 > Cu+2 > Ca+2 >Na+. (Note that part of the difference in curve shapes may be because the NaNO, and Ca(NO3)2 dataare from different data sets20-33 than the Cu(NO3)2, Fe(NO3)3 and A1(NO3)3 data.12)
One approach that achieved a good fit of all the VLE data on Figure 28 over the fullconcentration range is the use of both a hydrated and unhydrated cation (e.g., Fe+3 and Fe(H2O)6
+3)in equilibrium for each metal ion. The GMELCC parameters are then regressed for both the hydratedand unhydrated cations. The VLE calculations using the GMELCC parameters for both the hydratedand unhydrated cations fit the VLE data with a wide range of cation hydration equilibrium constantsas long as there is a significant concentration of both hydrated and unhydrated cations in a ratio thatchanges with concentration. It is not certain whether the use of the hydrated cation equilibrium worksbecause it is a more accurate description of the chemistry41 of concentrated electrolyte solutions, orbecause it provides additional parameters for regression. The hydration cation approach was notdeveloped further because it aggravated the errors hi the equilibrium calculations for complexing ofthe aluminum and fluoride ions.
5.3 Solutions of Hydrochloric and Nitric Acids
Some uncertainty about the parameters for the interactions of HNOj and HCl remains because ofthe wide scatter of the data (Figure 14) from which they were regressed. With an adjustment factor,the calculated vapor-phase HCl concentrations for the laboratory tests replicated the data reasonablywell except for the most concentrated solutions. There is a small mis-match in Figure 24 of theslopes of the calculated and measured curves which probably originates in the inadequacies of thecalculations for the A1(NO3)3-HNO3-H2O system. The calculated vapor-phase HCl concentration arewithin 25% for the feed for the laboratory tests; however, the discrepancy might increase if theevaporator feed composition changed.
5.4 Solutions of Hydrofluoric and Nitric Acids
The calculation of vapor-phase HF concentrations for solutions of HF complexed with aluminumions has unresolved difficulties. The calculated curves of vapor-phase HF concentration vs.evaporation (Figure 26) has an inadequate slope and required an empirical adjustment of free energyof formation of A1F+2 to approximate the data. The problem probably arises from the errors in theactivity coefficient calculation for the A1(NO3)3-HNO3-H2O system.
5.5 Other Molecular Solutes
The calculation of HgCl2 volatility required the regression of activity coefficient parameters(e.g., GMELCC values) for the interaction of HgCl2 with the other major molecules and ion pairs inthe solution. The default calculations with the interaction parameters missing gave vapor-phase HgCl2
concentrations that were orders of magnitude low. This is probably the case with other molecular
61

) the
vap
orin
t of
HN
O3 i
r
o
t pe
rce
Wei
gh
1 n 0 C
I i i i I i I i I
Vapor-liquid equilibriaP = 760 torr
V / / /
i i i i i i i i i i
i i i t i i i i i i i
Al (NO3)3
Fe (NO3)3
Cu (NO3)2
Ca (NO3)2
NaNO3
I I I I i I I I I I
l I I l
jf -
i I I
I
-
V
A•O
i i i i
10 20
Mole percent of nitrate ion from salt in the liquidG96-0188
Figure 29. Vapor compositions of boiling solutions made by adding various nitrate salts to a nitricacid solution initially containing 20 percent nitric acid (G96-0188).
62

solutes in solution. Without the regression of interaction parameters for the molecule and the ionpairs in solution their calculated volatilities will error significantly low.
5.6 Calculated Local Excess Gibbs Free Energy Values
The local excess Gibbs free energy values (Tau) at 100 °C, calculated from the GMELCC,GMELCD, and GMELCE parameters listed in the earlier sections, for the interactions of water andnitric acid with the ion pairs of the salts and acids, are listed in Table 19 for comparison anddiscussion. The salt ion pairs are listed in order of decreasing cation chargerradius ratio34. Thevalues are calculated at 100°C because the primary application is evaporation. The values at 25°Cfor salts with GMELCD parameters are a little different than at 100°C.
The calculated local excess free energies of the molecule-ion pair interactions from Table 19 areplotted, for- visualization, for some of the cations in Figure 30 as a function of ion chargerradius34
ratio. (M+n represents any cation of charge n.) The most obvious contrast shown by Figure 30 is thedifference between the values for the (M+n NO3') H2O interactions and those for the (M+n NO3")HNO3 interactions. The values for the HN03 (M+n NO3) and the H2O (M+n NO3) interactions aremostly relatively close to each other; but the values for the (M+n NO3") HN03 interactions differgreatly from those for the (M+n NO3) H2O interactions (and also from the ASPEN Plus™ defaultvalue of -2 for an ion pair-molecule interaction). The (M+n NO3") H2O excess energies are negative(i.e., the ion pair reduces the activity of H2O) while the (M+n NO3") HNO3 excess energies arepositive (i.e., the ion pair increases the activity of HNG,).
The excess energy values for Ca, Cu, and Fe are fairly orderly and could be interpolated toobtain estimated GMELCC values (i.e., the excess energy without a temperature term) for metalnitrates for which there is no data on their nitric acid solutions. Estimates taken from Figure 30should be better than default values.
The numbers shown on Figure 30 should be viewed with the following cautions: (1) those forCu and Fe are based on a small data set;12 and (2) the regressions for K, Na, and Al also regressedion pair-ion pair parameters whose presence or absence can effect the values obtained for the ion pair-molecule energies. The ion pair-ion pair interaction energies appear to be most significant in thesolubility calculations; however they have some effect on the VLE calculations. The interactionenergies for the K+ ion are significantly different from those of other ions probably because they weredetermined from solubility data and have large opposing values for ion pair-molecule and ion-pair-ionpair interaction energies.
5.7 Chemical Equilibria Calculation Convergence
The ASPEN Plus software contains convergence routines for calculating simultaneous chemicalequilibria using any of its activity coefficient models. However, convergence becomes slow andsometimes fails when there are a large number of interlinked reactions. Note that the chloride andfluoride complexing reactions are interlinked via their acids. The chemical equilibria calculationsoften fail to converge when both the aluminum fluoride and mercury chloride equilibrium reactionsare included. Hence, the solution is simplified when feasible by omitting minor reactions from the
63

Table 19. Local excess Gibbs free energies at 100°CGMELCE parameters of this report.
calculated from GMELCC, GMELCD, and
Species Pair
H2O (Al+3 NO3-)H20 (Fe+3 NO3-)H2O (Cu+2 NO3-)H2O (Ca+2 NO3-)H2O (Na+ NO3-)H2O (K+ No3-)H2O (H3O+ NO3-)H2O (H3O+ F-)H2O (H3O+ C1-)
(Al+3 NO3-) H2O(Fe+3 NO3-) H2O(Cu+2 NO3-) H2O(Ca+2 NO3-) H2O(Na+ NO3-) H2O(K+ NO3-) H2O(H3O+ NO3-) H2O(H3O+ F-) H2O(H3O+ C1-) H2O
HN03 (Al+3 NO3-)HN03 (Fe+3 NO3-)HN03 (Cu+2 NO3-)HN03 (Ca+2 NO3-)HN03 (Na+ NO3-)HNO3 (K+ No3-)HNO3 (H3O+ NO3-)HNO3 (H3O+ C1-)
(Al + 3 NO3-) HN03(Fe+3 NO3-) HN03(Cu+2 NO3-) HN03(Ca+2 NO3-) HN03(Na+ NO3-) HN03(K+ NO3-) HN03(H3O+ NO3-)HNO3(H3O+ C1-) HNO3
Local Excess GibbsFree Energy
(Tau)
11.8297.99456.9427.5787.15566.30517.36459.3908.5886
-5.383-4.60-4.346-4.072-3.687-3.109-4.074-2.764-4.658
6.3819.0949.0599.555
17.47729.8289.4578.801
6.84652.852.9022.74151.661
30
3.2384.181
64

10 -
CD
CDCDCD
CO
bCOCOCDo
Icooo
5 -
0 -
-5 -
-
-
i1i
ii
— iii
-
Q.
-
i
iii
CO
111
^ —
iiiiiCOO111
^ —
——u
1
1
1 T7
1113
o
11
l_
u—
1
1 '
V—
111
CDLL|1
1
HNO3 (M + n NO3")H2O (M + n NO3")
(M + n NO3") HNO3
(M + n NO3") H2O
" —a—_
1 1
" - — .
V0A
a
1
i1
11—1 -1
-
-
r2 4
Ion charge:radius ratioG96-0194
Figure 30 . Local excess Gibbs free energies (Tau) for ion pair-molecule interactions calculatedat 100°C (G96-0194).
65

chemistry. The full chemistry is calculated for a simplified composition; and then the minor reactionsare omitted. For example, the mercury can be entered as HgCl2 and the mercury chloridecomplexing reactions omitted with only minor errors because the concentrations of the other mercurychloride complexes are normally very small.
6. CONCLUSIONS ON WASTE EVAPORATION CALCULATIONS
The following summarizes the conclusions on calculations with the parameters of this reportapplicable to semi-batch operation of the ICPP High Level Liquid Waste Evaporator (HLLWE) atatmospheric pressure with liquid waste densities to 1.30 g/ml at boiling and 1.37 g/ml cooled:
• The calculated boiling temperatures appear accurate to within about 1 °C. Barometricpressure fluctuations can cause boiling temperature variations of about 1°C.
• The calculated solution densities at ambient temperature are accurate to within 0.01 g/mlwith a possible error on the low side. The calculated densities at boiling were not tested.
• The solubilities of sodium and aluminum nitrates can be calculated at ambient temperaturefor mixtures with nitric acid. Neither sodium or aluminum nitrate precipitates at thesolution compositions of the HLLWE.
• The calculated concentrations of nitric acid in the condensate are within 25 percent.
• The calculated concentrations of hydrochloric acid in the condensate are within 50 percent.
• The calculated concentrations of hydrofluoric acid in the condensate average within afactor of two of actual concentrations. The calculated vapor HF concentrations are high atthe start of an evaporation cycle and low at the end of the evaporation cycle.
• The mercury in the ICPP wastes is nearly all complexed with chloride as HgCl2. Itsconcentrations in the condensate can be calculated within 50 percent assuming it is allHgCl2.
7. REFERENCES
1. ASPEN Plus™ Electrolytes Manual, Aspen Technology, Inc., 1988, Ch. 10.
2. B. Mock, L. B. Evans, and C. C. Chen, "Thermodynamic Representation of Phase Equilibria ofMixed-Solvent Electrolyte Systems," AIChE Journal, 32, 1986, pp. 1655.
3. H. Renon, and J. M. Prausnitz, "Local Compositions in Thermodynamic Excess Functions forLiquid Mixtures," AIChE Journal, 14, 1968, pp. 135-144.
4. J. Potier, "Etude Ebulliometrique Du Systeme NO3H-OH2," Alger, Sciences Physiques, 4, (4),1958, pp. 91-120.
66

5. W. Davis and H. J. De Bruin, "New Activity Coefficients of 0-100 Percent Aqueous NitricAcid," J. Inorg. Nucl. Chem., 26, 1964, pp. 1069-1083.
6. M. A. Yakimov and V. Ya. Mishin, "Solution-Vapor Equilibrium of the Binary SystemHNO3-H2O at 25, 35, and 50°C," Soviet Radiochemistry, 6, (5), 1964, pp. 523-527.
7. C. L. Burdick and E. S. Freed, "The Equilibrium Between Nitric Oxide, Nitrogen Peroxide andAqueous solution of Nitric Acid," J. Am. Chem. Soc, 43, 1921, pp. 526-530.
8. W. C. Sproesser and G. B. Taylor, "Vapor Pressures of Aqueous Solutions of Nitric Acid,"J. Am. Chem. Soc, 43, 1921, pp. 1782-1787.
9. R. Flatt and F. Benguerrel, Helvetica Chemica Acta, XLV, 1962, pp. 1722-1726.
10. T. Boublik and K. Kuchynka, "Abhangigkeit der Zusammensetzung des AzeotropishenGemisches des Systems Salpetersaure-Wasser von Druck," Collection of Czechoslovak ChemicalCommunications, 25, 1960, pp. 579-582.
11. R. J. Braatz, Fractional Distillation of Dilute Nitric Acid Solutions Containing Fluoride andChloride Ions, Y-B92-71, Oak Ridge National Laboratory, 1958.
12. A. N. Efimov, et. al., "On the Influence of Nitrates on the Composition of Vapor Phase OverNitric Acid Solutions," Treat. Storage High-Level Radioactive Wastes, Proc. Symp., Vienna1962, pp. 133-139.
13. A. A. Krawetz, A Raman Spectral Study of Equilibrium in Aqueous Solutions of Nitric Acid,thesis, University of Chicago, Chicago, IL, 1955.
14. D. D. Wagman, et. al., "The NBS Tables of Chemical Thermodynamic Properties," Journal ofPhysical and Chemical Reference Data, Vol 11, Supplement No. 2, 1982.
15. Kirk and Othmer, Encyclopedia of Chemical Technology, Vol. 15, pp. 855.
16. J. Prosek, Utzcht-Csav, thesis, Prague, Czechoslovakia, 1965.
17. R. H. Perry and C. H. Chilton (eds.), Chemical Engineers' Handbook, Fifth Ed., New York:New York: McGraw-Hill Book Company Inc., 1973, Table 3-68.
18. G. B. Taylor, "Vapor Pressure of Aqueous Solutions of Nitric Acid," Ind. & Engr. Chem., 17,(6), 1925, pp. 633-635.
19. S. I. Sandier, Models for Thermodynamic and Phase Equilibria Calculations,Marcel Dekker, Inc., 1995, pp. 630.
67

20. A. N. Efimov, et. al., "Liquid-Vapor Equilibrium in the System HNO3 - H2O - NaNO3 andVariations of Boiling Point with Variation of the Liquid Composition Along Joins andTransversals of the Triangular Diagram," J. ofAppl. Chem. of USSR, 47, (No. 9), 1974,pp. 2183-2184.
21. A. N. Efimov, et. al., "Physicochemical Bases and Calculation of Vaporization Processes forHighly Active Nitric Acid Solutions," Atomnaya Energiya, Vol. 39, No. 6, 1975, pp. 416-419.
22. W. F. Linke, Solubilities, Inorganic and Metal-Organic Compounds, Vol. 1, Van Nostrand,1958, pp. 189-190, 250-252 and 1069-1072.
23. D. J. Chaiko, et. al., Measurements ofAl(NO3)3 Activities in Aqueous Nitrate Solutions,ANL/CP-75257.
24. E. W. Washburn, et. al., International Critical Tables of Numerical Data, Physics, Chemistryand Technology, Vol III, pp. 372.
25. M. C. Vrevskii, et. al., Journal of the Russian Physico-Chemical Soc. (Chemical Part), 54,1923, pp. 360-375.
26. P. F. Hagerty and A. N. Hixon, Report on Vapor-Liquid Equilibrium of Nitric Acid SolutionsContaining Chloride Ion, University of Pennsylvania, TID-5146, 1953.
27. H. F. Holmes, et. al., "The Enthalpy of Dilution of HCl(aq) to 648K and 40 MPa,Thermodynamic Properties," J. Chem. Thermodynamics, 19, 1987, pp. 863-890.
28. J. C. Brosheer, et. al., "Vapor Pressure of Hydrofluoric Acid Solutions," Ind. & Eng. Chem.,39, 1947, pp. 423-427.
29. P. A. Munter, et. al., "Partial Pressure Measurements on the System Hydrogen Fluoride-Water," Ind. & Eng. Chem., 41, 1949, pp. 1504-1508.
30. N. Khaidukov, et. el., J. Applied Chem. (USSR), 9, 1936, pp. 439^45.
31. P. A. Munter, et. al., "Hydrofluoric Acid-Water and Hydrofluoric Acid-Hydrofluorsilicic-Water," Ind. & Eng. Chem., 39, 1947, pp. 427-431.
32. V. M. Vdovenko, et. al., "Study of the Thermodynamic Characteristics of the SystemHF-HNO3-H2O, I. Measurements of the Vapor Pressure of the Components of the SystemsHF-H2O and HF-HNO3-H2O," Soviet Radiochemistry, 7, No. 1, 1964, pp. 45-47.
33. A. L. Shneerson, et. al., Russian Journal of Physical Chemistry, 39, (No. 6), 1965,pp. 744-746.
34. A. L. Horvath, Handbook of Aqueous Electrolyte Solutions, John Wiley & Sons, pp. 21.
68
35. O. Knacke, et. al., Thermochemical Properties of Inorganic Substances, Second Ed., 1991,Springer-Verlag, Berlin.
36. "Physical Property Methods and Models," ASPEN Plus™ Reference Manual - Volume 2, AspenTechnology, 1994.
37. Handbook of Chemistry and Physics, 35th Ed., pp. 2158.
38. R. M. Smith and A. E. Martell, Critical Stability Constants, Vol. 6, Second Supplement,pp. 457.
39. J. A. Murphy, Determination of the Zirconium Fluoride Stability Constants by DirectMeasurement of Equilibrium Hydrofluoric Acid Using the Amphometric Response of Titaniumand Hafnium Electrodes, WINCO-1098, May 1992, Appendix F.
40. G. B. Naumov, et. al., Handbook of Thermodynamic Data, Atomizdat, Moscow, 1971, pp. 181.
41. R. A. Robinson and R. H. Stokes, Electrolyte Solutions, 2nd. Ed., Butterworths, 1959.
69

Appendix A
Property Parameters File PR0P-R9C
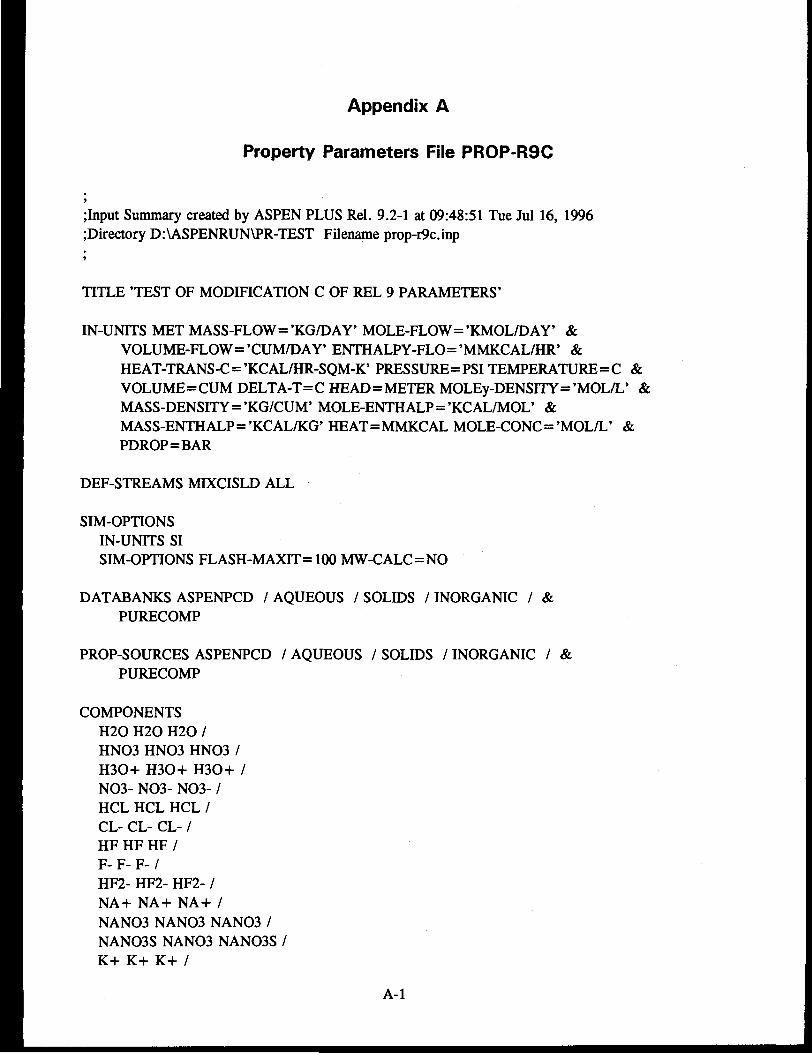
Appendix A
Property Parameters File PR0P-R9C
;Input Summary created by ASPEN PLUS Rel. 9.2-1 at 09:48:51 Tue Jul 16, 1996;Directory D:\ASPENRUN\PR-TEST Filename prop-r9c.inp
TITLE 'TEST OF MODIFICATION C OF REL 9 PARAMETERS'
IN-UNITS MET MASS-FLOW='KG/DAY' MOLE-FLOW='KMOL/DAY' &VOLUME-FLOW='CUM/DAY' ENTHALPY-FLO='MMKCAL/HR' &HEAT-TRANS-C='KCAL/HR-SQM-K' PRESSURE=PSI TEMPERATURE=C &VOLUME=CUM DELTA-T=C HEAD=METER MOLEy-DENSITY='MOL/L' &MASS-DENSITY='KG/CUM' MOLE-ENTHALP='KCAL/MOL' &MASS-ENTHALP='KCAL/KG' HEAT=MMKCAL MOLE-CONC='MOL/L' &PDROP=BAR
DEF-STREAMS MIXCISLD ALL
SIM-OPTIONSIN-UNITS SISIM-OPTIONS FLASH-MAXTT= 100 MW-CALC = NO
DATABANKS ASPENPCD /AQUEOUS /SOLIDS /INORGANIC /PURECOMP
&
PROP-SOURCES ASPENPCD / AQUEOUS / SOLIDS / INORGANIC / &PURECOMP
COMPONENTSH2O H2O H2O /HNO3 HNO3 HNO3 /H3O+ H3O+ H3O+ /NO3- NO3- NO3- /HCL HCL HCL /CL- CL- CL- /HF HF HF /F- F- F- /HF2- HF2- HF2- /NA+ NA+ NA+ /NANO3 NANO3 NANO3 /NANO3S NANO3 NANO3S /K+ K+ K+ /
A-l

KN03 KN03 KN03 /KN03S KN03 KN03S /AL+3 AL+3 AL+3 /"AL(NO3)3" "AL(0H)3" "AL(NO3)3" /ANN * ANN /ANNS * ANNS /ALF+2 ALF+2 ALF+2/ALF2+ ALF2+ ALF2+ /CA+2 CA+2 CA+2 /"CA(NO3)2" CAO MCA(NO3)2n /FE+3FE+3FE+3/"FE(NO3)3" FECL3 "FE(NO3)3" /CD+2 CD+2 CD+2/"CD(NO3)2" "CA(NO3)2" "CD(NO3)2" /PB+2PB+2PB+2/MPB(NO3)2" PBSO4 "PB(NO3)2" /H2SO4 H2SO4 H2SO4 /HSO4- HSO4- HSO4- /SO4~ SO4-2 SO4-- /HGCL2 HGCL2 HGCL2 /H3BO3 H3BO3 H3BO3 /UDS AL2O3-1 UDS /NI+2 NI+2 NI+2 /"NI(NO3)2" NISO4 "NI(NO3)2" /ZR+4 ZR+4 ZR+4/ZRF2+2 CA+2 ZRF2+2 /ZRF+3FE+3ZRF+3/NAHSO4 NAHSO4 NAHSO4
HENRY-COMPS GLOBAL HCL
CHEMISTRY GLOBALIN-UNITS SIDISS NANO3 NA+ 1.0 / NO3- 1.0DISS "AL(NO3)3" AL+3 1.0 / NO3- 3.0DISS ANN AL+3 1.0 / NO3- 3.0 / H2O 9.0DISS KNO3 K+ 1.0 / NO3- 1.0DISS "FE(NO3)3" FE+3 1.0 / NO3- 3.0DISS "CA(NO3)2" CA+2 1.0 / NO3- 2.0DISS "CD(NO3)2" CD+2 1.0 / NO3- 2.0DISS "PB(NO3)2" PB+2 1.0 / NO3- 2.0DISS "NI(NO3)2" NI+2 1.0 / NO3- 2.0DISS NAHSO4 NA+ 1 / HSO4- 1STOIC 1 HCL -1.0 / H2O -1.0 / H3O+ 1.0 / CL- 1.0STOIC 2 HF -1.0 / H2O -1.0 / H3O+ 1.0 / F- 1.0
A-2

STOIC 3 HN03 -1.0 / H2O -1.0 / H3O+ 1.0 / NO3- 1.0STOIC 4 AL+3 -1.0 / F- -1.0 / ALF+2 1.0STOIC 5 ALF+2 -1.0 / F- -1.0 / ALF2+ 1.0STOIC 6 H2SO4 -1.0 / H2O -1.0 / H3O+ 1.0 / HSO4- 1.0SALT NANO3S NA+ 1.0 / NO3- 1.0SALT ANNS AL+3 1.0 / NO3- 3.0 / H2O 9.0SALT KNO3S K+ 1.0 / NO3- 1.0K-SALT NANO3S A=-26.150630 B=-179.96680 C=3.774540K-SALT ANNS A=316.36850 B=-12511.940 C=-50.0K-SALT KNO3S A= 111.94240 B=-8683.1530 C=-15.957280
FLOWSHEET
PROPERTIES ELECNRTL HENRY-COMPS = GLOBAL CHEMISTRY=GLOBAL &TRUE-COMPS=YES
PROP-DATA ANN-SCIN-UNITS SI PRESSURE=BAR TEMPERATURE=CPROP-LIST MW / CHARGE / DHSFRM / DGSFRM / PC / TC / &
ZC/VCPVAL "AL(NO3)3" 212.9960 / 0.0 / -1.0420E+09 / -7.270E+08 &
/ 5000.0 / 2000.0 / .20/ .10PVAL ANN 375.13480 / 0.0 / -3.757060E+09 / -2.94140E+09 &
/ 5000.0 / 2000.0 / . 2 0 / . 10PVAL ANNS 375.13480 / 0.0 / -3.757060E+09 / -2.94140E+09 &
/ 5000.0 / 2000.0 / . 2 0 / . 10PROP-LIST MWPVAL "CD(NO3)2" 236.40980PVAL MFE(NO3)3" 241.86170PVAL "PB(NO3)2" 331.19980PVAL "CA(NO3)2" 164.08980PROP-LIST MW / PC / TC / ZC / VCPVAL H3BO3 61.8330 / 300.0 / 1700.0 / .260 / .370
PROP-DATA HGCL2IN-UNITS SIPROP-LIST MW / CHARGE / DHFORM / DGFORM / PC / TC / &
ZC/VC / OMEGA / DGSFRM / DHSFRM / DGAQFM / &DHAQFM
PVAL HGCL2 271.4960 / 0.0 / -1.43260E+08 / -1.42020E+08 &/ 5000000.0 / 1000.0 / .20 / .10 / .750 / &-1.7860E+08 / -2.2430E+08 / -1.7320E+08 / -2.1630E+08
A-3

PROP-DATA MWIN-UNTTS SI PRESSURE=BAR TEMPERATURE=CPROP-LIST MW / CHARGEPVAL "FE(NO3)3" 241.86170 / 0.0PVAL nPB(NO3)2" 331.19980 / 0.0PROP-LIST MWPVAL "NI(NO3)2" 182.71980PVAL ZRF2+2 129.21680PVALZRF+3 110.2168
PROP-DATA RKTZRAIN-UNTTS SIPROP-LIST RKTZRAPVALHF .10616360PVAL HNO3 .2207790PVAL H3BO3 .20722850PVAL UDS .30
PROP-DATA S025C-1IN-UNITS SIPROP-LIST DHAQFM / DGAQFM / S025CPVAL ALF+2 -8.6077E+08 / -8.156E+08 / -165300
PROP-DATA ANN-TFNIN-UNITS SIPROP-LIST PLXANTPVAL "AL(NO3)3" -1.0E+20 0.0 0.0 0.0 0.0 0.0 0.0 0.0 &
1000.0PVAL ANN -1.0E+20 0.0 0.0 0.0 0.0 0.0 0.0 0.0 1000.0PVAL ANNS -1.0E+20 0.0 0.0 0.0 0.0 0.0 0.0 0.0 1000.0PVAL "CD(NO3)2" -1.0E+20 0.0 0.0 0.0 0.0 0.0 0.0 0.0 &
1000.0PVAL H3BO3 -1.0E+20 0.0 0.0 0.0 0.0 0.0 0.0 0.0 1000.0
PROP-DATA CPAQ0IN-UNITS SIPROP-LIST CPAQ0PVAL HF 39295 0.0PVAL F- -105036 0.0PVAL AL+3 38000 0.0
A-4

PROP-DATA CPIGIN-UNTTS SIPROP-LIST CPIGPVAL HGCL2 18651.0 94.70360 0.0 0.0 0.0 0.0 273.0 400.0 &
18651.0 94.7040 1.0PVAL H3BO3 82080.0 -10.5260 .040940 -.000024970 6.4460E-09 &
-6.250E-13 200.0 1000.0 82080.0 -10.5260 1.0
PROP-DATA CPSPO1IN-UNITS SIPROP-LIST CPSPO1PVAL "AL(NO3)3" 232000.0 0.0 0.0 0.0 0.0 0.0 0.0 1000.0PVAL ANN 533500.0 0.0 0.0 0.0 0.0 0.0 0.0 1000.0PVAL ANNS 533500.0 0.0 0.0 0.0 0.0 0.0 0.0 1000.0
PROP-DATA DHVLWTIN-UNITS SIPROP-LIST DHVLWTPVAL HGCL2 83931000.0 298.0 .104310 .03841570 273.0PVAL H3BO3 75450000.0 360.0 .380
PROP-DATA PLXANTIN-UNITS SIPROP-LIST PLXANTPVAL HGCL2 43.89650 -10741.50 0.0 0.0 -2.130 0.0 0.0 &
273.0 550.0PVAL HNO3 -281.8730 0.0 0.0 -.1358020 58.15110 0.0 0.0 &
231.0 400.0
PROP-DATA HENRY-1IN-UNITS MET VOLUME-FLOW='CUM/HR' ENTHALPY-FLO='MMKCAL/HR' &
HEAT-TRANS-C = 'KCAL/HR-SQM-K' PRESSURE=BAR TEMPERATURE=C &VOLUME=CUM DELTA-T=C HEAD = METER MOLE-DENSITY='KMOL/CUM'MASS-DENSITY='KG/CUM' MOLE-ENTHALP='KCAL/MOL' &MASS-ENTHALP='KCAL/KG' HEAT=MMKCAL MOLE-CONC='MOL/L' &PDROP=BAR
PROP-LIST HENRYBPVAL HCL H2O 46.940030 -7762.8320 0.0 0.0 -.14999390 &
126.850
&
PROP-DATA NRTL-1IN-UNITS SIPROP-LIST NRTLBPVAL H2O HF 97.280830 0.0 .30 0.0 0.0 0.0 298.0 &
383.150
A-5

BPVAL HF H20 -2.2972530 0.0 .30 0.0 0.0 0.0 298.0 &383.150
BPVAL HCL H2O .14617260 0.0 .30 0.0 0.0 0.0 273.0 &1000.0
BPVAL H2O HCL .1822130 0.0 .30 0.0 0.0 0.0 273.0 1000.0BPVAL H2O HNO3 -3.6277170 65.864660 .050 0.0 0.0 0.0 &
270.0 400.0BPVAL HNO3 H2O 90.0 0.0 .050 0.0 0.0 0.0 270.0 400.0BPVAL HCL HNO3 3.5240 0.0 .30 0.0 0.0 0.0 0.0 1000.0BPVAL HNO3 HCL 4.0573330 0.0 .30 0.0 0.0 0.0 0.0 1000.0BPVAL HGCL2 H2O 100.0 30000.0 .30 0.0 0.0 0.0 273.0 &
400.0BPVAL H2O HGCL2 -1.868090 2244.6670 .30 0.0 0.0 0.0 &
273.0 400.0
PROP-DATA VLCLK-1IN-UNTTS MET VOLUME-FLOW='CUM/HR' ENTHALPY-FLO='MMKCAL/HR' &
HEAT-TRANS-C='KCAL/HR-SQM-K' PRESSURE=BAR TEMPERATURE=C &VOLUME=CUM DELTA-T=C HEAD=METER MOLE-DENSITY='KMOL/CUM' &MASS-DENSITY='KG/CUM' MOLE-ENTHALP='KCAL/MOL' &MASS-ENTHALP='KCAL/KG' HEAT=MMKCAL MOLE-CONC = 'MOL/L' &PDROP=BAR
PROP-LIST VLCLKBPVAL AL+3 NO3- 43.340140 89.50370BPVAL H3O+ NO3- 32.544040 51.212350BPVAL H3O+ CL- 34.551110 13.365810BPVAL H3O+ HSO4- 54.803950 20.243470BPVAL NA+ SO4- 8.6755260 123.26710BPVAL NA+ NO3- 26.065710 28.973860BPVAL K+ NO3- 37.901020 24.33310BPVAL H3O+ F- 28.678530 15.010790BPVAL ALF+2 NO3- 34.729160 65.65510BPVAL ALF2+ NO3- 26.110 41.80650BPVAL ZRF2+2 NO3- 26.11 41.8065BPVAL ZRF+3 NO3- 34.729 65.655BPVAL FE+3 NO3- 52.586330 158.29940BPVAL CA+2 NO3- 29.733810 133.64070BPVAL CD+2 NO3- 39.705170 55.682830BPVAL NI+2 NO3- 39.7050 55.6830BPVAL PB+2 NO3- 36.435660 171.115620
PROP-DATA GMELCC-1IN-UNITS SIPROP-LIST GMELCCPPVAL H2O ( H3O+ NO3- ) -3.411562
A-6

PPVAL ( H30+ N03- ) H20 -1.379389PPVAL H20 ( H30+ CL- ) 7.195472PPVAL (H30+ CL-) H20 -3.761581PPVAL H20 ( H30+ F- ) 15.128270PPVAL ( H3O+ F- ) H2O -2.3487840PPVAL H2O ( H3O+ HSO4-) 6.3620PPVAL (H3O+ HSO4-) H2O -3.7490PPVAL H2O ( H3O+ SO4- ) 8.0PPVAL ( H3O+ SO4- ) H2O -4.0PPVAL H2O ( NA+ NO3-) 8.509752PPVAL ( NA+ NO3- ) H2O -4.460697PPVAL H2O ( NA+ CL- ) 5.9801960PPVAL ( NA+ CL- ) H2O -3.7891680PPVAL H2O ( NA+ HSO4- ) 7.663000PPVAL ( NA+ HSO4- ) H2O -3.944000PPVAL H2O ( NA+ SO4- ) 7.689221PPVAL ( NA+ SO4- ) H2O -4.284786PPVAL H2O ( K+ NO3- ) 4.038739PPVAL ( K+ NO3- ) H2O -3.106562PPVAL H2O ( K+ CL- ) 8.288000PPVAL ( K+ CL- ) H2O -4.168000PPVAL H2O ( K+ HSO4- ) 8.101000PPVAL ( K+ HSO4- ) H2O -3.958000PPVAL H2O ( CA+2 NO3- ) 7.5780PPVAL (CA+2 NO3- ) H2O -4.0720PPVAL H2O ( CA+2 CL- ) 10.47200PPVAL ( CA+2 CL- ) H2O -5.060000PPVAL H2O ( CD+2 NO3- ) 7.7960PPVAL ( CD+2 NO3- ) H2O -4.1090PPVAL H2O ( CD+2 CL- ) 7.836000PPVAL ( CD+2 CL- ) H2O -3.685000PPVAL H2O ( PB+2 NO3-) 7.084000PPVAL (PB+2 NO3- ) H2O -3.452000PPVAL HNO3 ( H3O+ NO3- ) 18.35049PPVAL ( H3O+ NO3- ) HNO3 28.03711PPVAL HCL ( H3O+ CL- ) 12.0PPVAL ( H3O+ CL- ) HCL -.0010PPVAL HCL ( H3O+ HSO4-) 10.00000PPVAL ( H3O+ HSO4- ) HCL -2.000000PPVAL HCL ( H3O+ SO4- ) 15.00000PPVAL ( H3O+ SO4--) HCL -8.000000PPVAL HCL ( NA+ CL- ) 15.0PPVAL (NA+ CL-) HCL -8.0PPVAL HF ( H3O+ F-) 9.6672160PPVAL ( H3O+ F- ) HF 3.5665980
A-7

PPVAL H2SO4 ( H30+ CL- ) 10.00000PPVAL ( H3O+ CL- ) H2SO4 -2.000000PPVAL H2SO4 ( H3O+ HSO4- ) 12.9920PPVAL ( H3O+ HSO4- ) H2SO4 -2.9810PPVAL H2SO4 (H3O+ SO4- ) 8.000000PPVAL ( H3O+ SO4- ) H2SO4 -4.000000PPVAL ( H3O+ CL- ) ( H3O+ HSO4- ) .9536271PPVAL ( H3O+ HSO4- ) ( H3O+ CL- ) 0.0PPVAL ( NA+ CL-) ( NA+ SO4- ) -11.44869PPVAL ( NA+ SO4- ) ( NA+ CL- ) -.2697454PPVAL ( NA+ CL- ) ( K+ CL- ) 1.360000PPVAL ( K+ CL- ) ( NA+ CL- ) -1.023000PPVAL HNO3 ( NA+ NO3- ) -29.90617PPVAL ( NA+ NO3- ) HNO3 -33.52829PPVAL ( H3O+ NO3- ) ( NA+ NO3- ) 5.284384PPVAL ( NA+ NO3- ) ( H3O+ NO3- ) -0.6550303PPVAL HNO3 ( K+ NO3- ) 29.82778PPVAL ( K+ NO3- ) HNO3 30.0PPVAL ( H3O+ NO3- ) ( K+ NO3- ) -25PPVAL ( K+ NO3- ) ( H3O+ NO3-) -5.80576PPVAL HNO3 ( H3O+ CL- ) 6.220643PPVAL ( H3O+ CL- ) HNO3 -12.8950PPVAL ( H3O+ NO3- ) ( H3O+ CL- ) 19.0PPVAL ( H3O+ CL- ) ( H3O+ NO3- ) 2.220958PPVAL H2O ( AL+3 NO3- ) 29.95914PPVAL (AL+3 NO3- ) H2O -10.10100PPVAL HNO3 ( AL+3 NO3- ) 2.192842PPVAL ( AL+3 NO3- ) HNO3 -8.52746PPVAL ( H3O+ NO3-) ( AL+3 NO3-) 12.68662PPVAL ( AL+3 NO3-) ( H3O+ NO3-) 6.911549PPVAL ( NA+ NO3- ) ( AL+3 NO3- ) -0.7859297PPVAL (AL+3 NO3- ) ( NA+ NO3- ) 7.959875
PPVAL H2O ( ALF+2 NO3- ) 29.95914PPVAL ( ALF+2 NO3- ) H2O -10.10100PPVAL HNO3 ( ALF+2 NO3- ) 2.192842PPVAL ( ALF+2 NO3- ) HNO3 -8.52746PPVAL ( H3O+ NO3- ) ( ALF+2 NO3- ) 12.68662PPVAL ( ALF+2 NO3-) ( H3O+ NO3-) 6.911549PPVAL ( NA+ NO3- ) ( ALF+2 NO3-) -0.7859297PPVAL ( ALF+2 NO3- ) ( NA+ NO3-) 7.959875PPVAL ( ALF+2 NO3-) ( AL+3 NO3-) 0.5PPVAL ( AL+3 NO3- ) ( ALF+2 NO3- ) -1.5
PPVAL HNO3 ( CA+2 NO3- ) 9.554692PPVAL ( CA+2 NO3-) HNO3 2.741511PPVAL HNO3 ( CD+2 NO3- ) 10.0
A-8

PPVAL ( CD+2 N03- ) HN03 -2.0PPVAL H2O ( FE+3 NO3- ) 7.994493PPVAL ( FE+3 NO3- ) H2O -4.60052PPVAL HNO3 ( FE+3 NO3-) 9.093591PPVAL ( FE+3 NO3-) HNO3 2.850314PPVAL ( NA+ NO3- ) ( NA+ CL- ) 0PPVAL ( NA+ CL-) ( NA+ NO3-) -1PPVAL ( AL+3 NO3- ) ( AL+3 CL- ) 0PPVAL ( AL+3 CL- ) ( AL+3 NO3- ) -1PPVAL ( K+ NO3- ) (K+ CL- ) 0PPVAL ( K+ CL- ) ( K+ NO3- ) -1PPVAL ( FE+3 NO3- ) ( FE+3 CL- ) 0PPVAL ( FE+3 CL- ) ( FE+3 NO3- ) -1PPVAL ( CA+2 NO3- ) ( CA+2 CL- ) 0PPVAL ( CA+2 CL- ) ( CA+2 NO3- ) -1PPVAL H2O ( ALF2+ NO3- ) 7.578PPVAL ( ALF2+ NO3- ) H2O -4.072PPVAL HNO3 ( ALF2+ NO3- ) 9.5547PPVAL ( ALF2+ NO3- ) HNO3 2.7415PPVAL ( K+ NO3- ) ( NA+ NO3- ) -1.02317PPVAL ( NA+ NO3- ) ( K+ NO3- ) 1.124986PPVAL HGCL2 (H3O+ NO3-) 3.81249PPVAL (H3O+ NO3-) HGCL2 2.12927PPVAL HGCL2 (H3O+ HSO4-) 3.81249PPVAL (H3O+ HSO4-) HGCL2 2.12927PPVAL HGCL2 (AL+3 NO3-) 8.67805PPVAL (AL+3 NO3-) HGCL2 12.0573PPVAL HGCL2 (FE+3 NO3-) 8.67805PPVAL (FE+3 NO3-) HGCL2 12.0573PPVAL HGCL2 (NA+ NO3-) 8.057026PPVAL (NA+ NO3-) HGCL2 11.4694PPVAL HGCL2 (K+ NO3-) 8.057026PPVAL (K+ NO3-) HGCL2 11.4694PPVAL HGCL2 (CA+2 NO3-) 8.057026PPVAL (CD+2 NO3-) HGCL2 11.4694PPVAL HGCL2 (CD+2 NO3-) 8.057026PPVAL (CA+2 NO3-) HGCL2 11.4694PPVAL HGCL2 (ALF+2 NO3-) 8.057026PPVAL (ALF+2 NO3-) HGCL2 11.4694
PROP-DATA GMELCD-1IN-UNITS SIPROP-LIST GMELCDPPVAL H2O ( H3O+ NO3- ) 4021.066PPVAL ( H3O+ NO3-) H2O -1005.608
A-9

PPVAL H20 ( H30+ CL- ) 800.3416PPVAL (H3O+ CL-) H2O -394.9632PPVAL H2O ( H3O+ F- ) -2141.0790PPVAL ( H3O+ F-) H2O -155.08250PPVAL H2O ( H3O+ HSO4- ) 1958.20PPVAL ( H3O+ HSO4- ) H2O -583.20PPVAL H2O (H3O+ SO4- ) 0.0PPVAL ( H3O+ SO4-- ) H2O 0.0PPVAL H2O ( NA+ CL- ) 841.51810PPVAL ( NA+ CL- ) H2O -216.36460PPVAL H2O ( NA+ SO4- ) 565.5983PPVAL ( NA+ SO4--) H2O -56.83768PPVAL H2O (K+ CL- ) 0.0PPVAL ( K+ CL- ) H2O -4.700000PPVAL HNO3 ( H3O+ NO3- ) -2595.605PPVAL ( H3O+ NO3-) HNO3 -9671.993PPVAL HCL ( H3O+ CL- ) .0PPVAL ( H3O+ CL- ) HCL .0PPVAL HCL ( H3O+ HSO4- ) 0.0PPVAL ( H3O+ HSO4- ) HCL 0.0PPVAL HCL ( H3O+ SO4- ) 0.0PPVAL ( H3O+ SC4-- ) HCL 0.0PPVAL HCL ( NA+ CL- ) .0PPVAL ( NA+ CL- ) HCL .0PPVAL HF ( H3O+ F- ) -3161.9840PPVAL ( H3O+ F- ) HF -2071.5340PPVAL H2SO4 ( H3O+ HSO4- ) -1732.90PPVAL ( H3O+ HSO4- ) H2SO4 -162.30PPVAL H2SO4 ( H3O+ SO4- ) 0.0PPVAL ( H3O+ SO4- ) H2SO4 0.0PPVAL ( H3O+ CL- ) ( H3O+ HSO4- ) -201.7466PPVAL ( H3O+ HSO4- ) ( H3O+ CL- ) 0.0PPVAL ( NA+ CL- ) ( NA+ SO4- ) 3757.483PPVAL ( NA+ SO4- ) ( NA+ CL- ) -133.6117PPVAL ( NA+ CL- ) ( K+ CL- ) -440.5000PPVAL ( K+ CL- ) ( NA+ CL- ) 331.4000PPVAL H2O ( NA+ NO3- ) -505.2884PPVAL ( NA+ NO3- ) H2O 288.6656PPVAL HNO3 ( NA+ NO3- ) 17681.22PPVAL ( NA+ NO3- ) HNO3 13131.2PPVAL ( H3O+ NO3- ) ( NA+ NO3- ) 0PPVAL ( NA+ NO3- ) ( H3O+ NO3- ) 0PPVAL HNO3 ( H3O+ CL- ) 962.7592PPVAL ( H3O+ CL- ) HNO3 6372.017PPVAL H2O ( AL+3 NO3- ) -5892.001
A-10
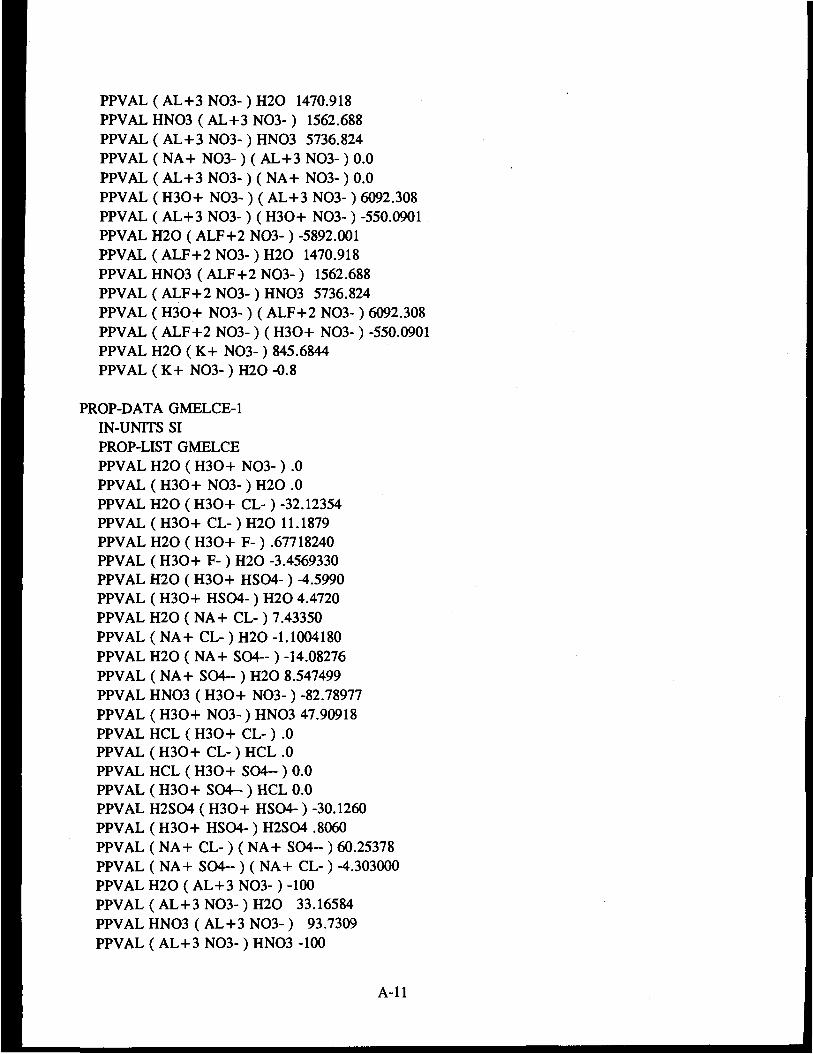
PPVAL ( AL+3 N03- ) H20 1470.918PPVAL HNO3 ( AL+3 NO3-) 1562.688PPVAL ( AL+3 NO3-) HNO3 5736.824PPVAL ( NA+ NO3- ) ( AL+3 NO3- ) 0.0PPVAL ( AL+3 NO3-) ( NA+ NO3- ) 0.0PPVAL ( H3O+ NO3- ) ( AL+3 NO3- ) 6092.308PPVAL ( AL+3 NO3- ) ( H3O+ NO3- ) -550.0901PPVAL H2O ( ALF+2 NO3-) -5892.001PPVAL ( ALF+2 NO3- ) H2O 1470.918PPVAL HNO3 ( ALF+2 NO3- ) 1562.688PPVAL ( ALF+2 NO3- ) HNO3 5736.824PPVAL ( H3O+ NO3- ) ( ALF+2 NO3- ) 6092.308PPVAL ( ALF+2 NO3- ) ( H3O+ NO3- ) -550.0901PPVAL H2O ( K+ NO3- ) 845.6844PPVAL ( K+ NO3- ) H2O -0.8
PROP-DATA GMELCE-1IN-UNTTS SIPROP-LIST GMELCEPPVAL H2O ( H3O+ NO3- ) .0PPVAL ( H3O+ NO3- ) H2O .0PPVAL H2O ( H3O+ CL- ) -32.12354PPVAL ( H3O+ CL- ) H2O 11.1879PPVAL H2O ( H3O+ F- ) .67718240PPVAL ( H3O+ F- ) H2O -3.4569330PPVAL H2O ( H3O+ HSO4- ) -4.5990PPVAL ( H3O+ HSO4- ) H2O 4.4720PPVAL H2O ( NA+ CL-) 7.43350PPVAL ( NA+ CL-) H2O -1.1004180PPVAL H2O ( NA+ SO4- ) -14.08276PPVAL ( NA+ SO4- ) H2O 8.547499PPVAL HNO3 ( H3O+ NO3- ) -82.78977PPVAL ( H3O+ NO3-) HNO3 47.90918PPVAL HCL ( H3O+ CL- ) .0PPVAL ( H3O+ CL- ) HCL .0PPVAL HCL ( H3O+ SO4- ) 0.0PPVAL ( H3O+ SO4- ) HCL 0.0PPVAL H2SO4 ( H3O+ HSO4- ) -30.1260PPVAL ( H3O+ HSO4- ) H2SO4 .8060PPVAL ( NA+ CL-) ( NA+ SO4- ) 60.25378PPVAL ( NA+ SO4- ) ( NA+ CL- ) -4.303000PPVAL H2O ( AL+3 NO3-) -100PPVAL ( AL+3 NO3- ) H2O 33.16584PPVAL HNO3 ( AL+3 NO3- ) 93.7309PPVAL ( AL+3 NO3-) HNO3 -100
A-ll

PPVAL H20 ( ALF+2 N03- ) -100PPVAL ( ALF+2 NO3- ) H2O 33.16584PPVAL HNO3 ( ALF+2 NO3- ) 93.7309PPVAL ( ALF+2 NO3- ) HNO3 -100
PROP-DATA GMELCN-1IN-UNITS MET VOLUME-FLOW='CUM/HR' ENTHALPY-FLO='MMKCAL/HR' &
HEAT-TRANS-C='KCAL/HR-SQM-K' PRESSURE=BAR TEMPERATURE=C &VOLUME=CUM DELTA-T=C HEAD=METER MOLE-DENSITY='KMOL/CUM' &MASS-DENSITY='KG/CUM' MOLE-ENTHALP='KCAL/MOL' &MASS-ENTHALP='KCAL/KG' HEAT=MMKCAL MOLE-CONC='MOL/L' &PDROP=BAR
PROP-LIST GMELCNPPVAL H2O ( H3O+ F- ) .20PPVAL H2O ( H3O+ HSO4- ) .20PPVAL H2O ( NA+ CL- ) .20PPVAL H2O ( NA+ SO4- ) .20PPVAL HCL ( H3O+ SO4- ) .10PPVAL HCL ( NA+ CL- ) .10PPVAL H2SO4 ( H3O+ HSO4- ) .20PPVAL ( H3O+ HSO4- ) H2SO4 .20PPVAL HCL ( NA+ NO3- ) .10PPVAL HCL ( AL+3 NO3- ) . 10
PROP-SET MF-HNO3 MASSFRAC SUBSTREAM=MIXED COMPS=HNO3 PHASE=V
PROP-SET MOLECONCIN-UNTTS MET VOLUME-FLOW='CUM/HR' ENTHALPY-FLO='MMKCAL/HR' &
HEAT-TRANS-C='KCAL/HR-SQM-K' PRESSURE=BAR TEMPERATURE=C &VOLUME=CUM DELTA-T=C HEAD=METER MOLE-DENSITY='KM0L/CUM' &MASS-DENSITY='KG/CUM' MOLE-ENTHALP = 'KCAL/MOL' &MASS-ENTHALP='KCAL/KG' HEAT=MMKCAL MOLE-CONC='MOL/L' &PDROP=BAR
PROPNAME-LIS MOLECONC SUBSTREAM=MIXED PHASE=L
PROP-SET PP-HCLIN-UNITS SIPROPNAME-LIS PPMX UNITS = 'TORR' SUBSTREAM=MIXED COMPS=HCL
PROP-SET PPMXIN-UNITS SIPROPNAME-LIS PPMX UNITS = 'TORR' SUBSTREAM=MIXED COMPS=HNO3 &
H2O
A-12
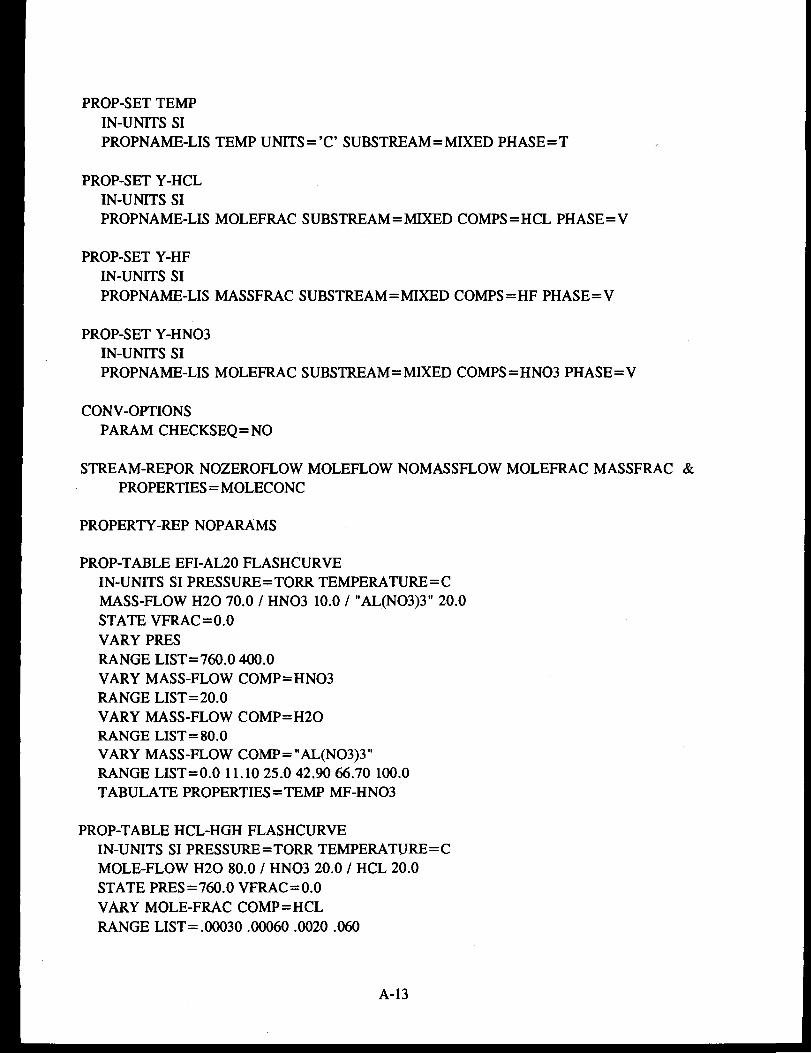
PROP-SET TEMPIN-UNTTS SIPROPNAME-LIS TEMP UNITS = 'C' SUBSTREAM=MIXED PHASE=T
PROP-SET Y-HCLIN-UNITS SIPROPNAME-LIS MOLEFRAC SUBSTREAM=MIXED COMPS=HCL PHASE=V
PROP-SET Y-HFIN-UNITS SIPROPNAME-LIS MASSFRAC SUBSTREAM=MIXED COMPS=HF PHASE=V
PROP-SET Y-HNO3IN-UNITS SIPROPNAME-LIS MOLEFRAC SUBSTREAM=MIXED COMPS=HNO3 PHASE=V
CONV-OPTIONSPARAM CHECKSEQ=NO
STREAM-REPOR NOZEROFLOW MOLEFLOW NOMASSFLOW MOLEFRAC MASSFRAC &PROPERTIES = MOLECONC
PROPERTY-REP NOPARAMS
PROP-TABLE EFI-AL20 FLASHCURVEIN-UNITS SI PRESSURE=TORR TEMPERATURE=CMASS-FLOW H2O 70.0 / HNO3 10.0 / "AL(NO3)3" 20.0STATE VFRAC=0.0VARY PRESRANGE LIST=760.0 400.0VARY MASS-FLOW COMP=HNO3RANGE LIST=20.0VARY MASS-FLOW COMP=H2ORANGE LIST=80.0VARY MASS-FLOW COMP="AL(NO3)3"RANGE LIST=0.0 11.10 25.0 42.90 66.70 100.0TABULATE PROPERTIES=TEMP MF-HNO3
PROP-TABLE HCL-HGH FLASHCURVEIN-UNITS SI PRESSURE=TORR TEMPERATURE=CMOLE-FLOW H2O 80.0 / HNO3 20.0 / HCL 20.0STATE PRES=760.0 VFRAC=0.0VARY MOLE-FRAC COMP=HCLRANGE LIST=.00030 .00060 .0020 .060
A-13

VARY MOLE-FRAC COMP=HNO3RANGE LIST=.0030 .030 .10 .150 .220TABULATE PROPERTIES=Y-HCL TEMP
PROP-TABLE PP-HCL FLASHCURVEIN-UNITS SI PRESSURE=TORR TEMPERATURE=CMOLE-FLOW H2O 80.0 / HCL 20.0STATE VFRAC=0.0VARY TEMPRANGE LIST=20.0 55.20 75.90VARY MOLE-FRAC COMP=HCLRANGE LIST=.O25O .050 .060 .070 .080 .090 .10 .110 .120
.130TABULATE PROPERTIES=Y-HCL PP-HCL
&
PROP-TABLE PPMX FLASHCURVEIN-UNITS SI PRESSURE=TORR TEMPERATURE=CMOLE-FLOW H2O 80.0 / HNO3 20.0STATE VFRAC=0.0VARY TEMPRANGE LIST=25.0 50.0VARY MOLE-FRAC COMP=HNO3RANGE LIST=.0250 .050 .10 .150 .20 .250 .30TABULATE PROPERTIES=PPMX
PROP-TABLE Y-EF760 FLASHCURVEIN-UNITS SI PRESSURE=TORR TEMPERATURE=CMOLE-FLOW H2O .000810185 / HNO3 .000231481 / NANO3 &
.000115740STATE PRES=760.0 VFRAC=0.0VARY MOLE-FRAC COMP=HNO3RANGE LIST=.030 .060 .090 .120 .150VARY MOLE-FRAC COMP=NANO3RANGE LIST=0.0 .030 .060 .090 .120 .150 .180 .210TABULATE PROPERTIES=Y-HNO3 TEMP
PROP-TABLE Y-HF FLASHCURVEIN-UNITS SI PRESSURE=TORR TEMPERATURE=CMOLE-FLOW H2O .001041666 / HF .000115740STATE PRES=760.0 VFRAC=0.0VARY MASS-FRAC COMP=HFRANGE LIST=.050 .10 .150 .20 .250TABULATE PROPERTIES=Y-HF TEMP
A-14

PROP-TABLE Y-HN03 FLASHCURVEIN-UNITS SI PRESSURE=TORR TEMPERATURE=CMASS-FLOW H2O 80.0 / HNO3 20.0VARY PRESRANGE LIST=200.0 600.0 760.0VARY VFRACRANGE LIST=0.0VARY MOLE-FRAC COMP=HNO3RANGE LIST=.O2O .040 .060 .10 .150 .20 .250 .30TABULATE PROPERTIES=Y-HNO3 TEMP
A-15