Resposta do réu no Novo CPC: uma boa ideia inspirada nos Juizados Especiais Cíveis
ORIGINALARTICLE
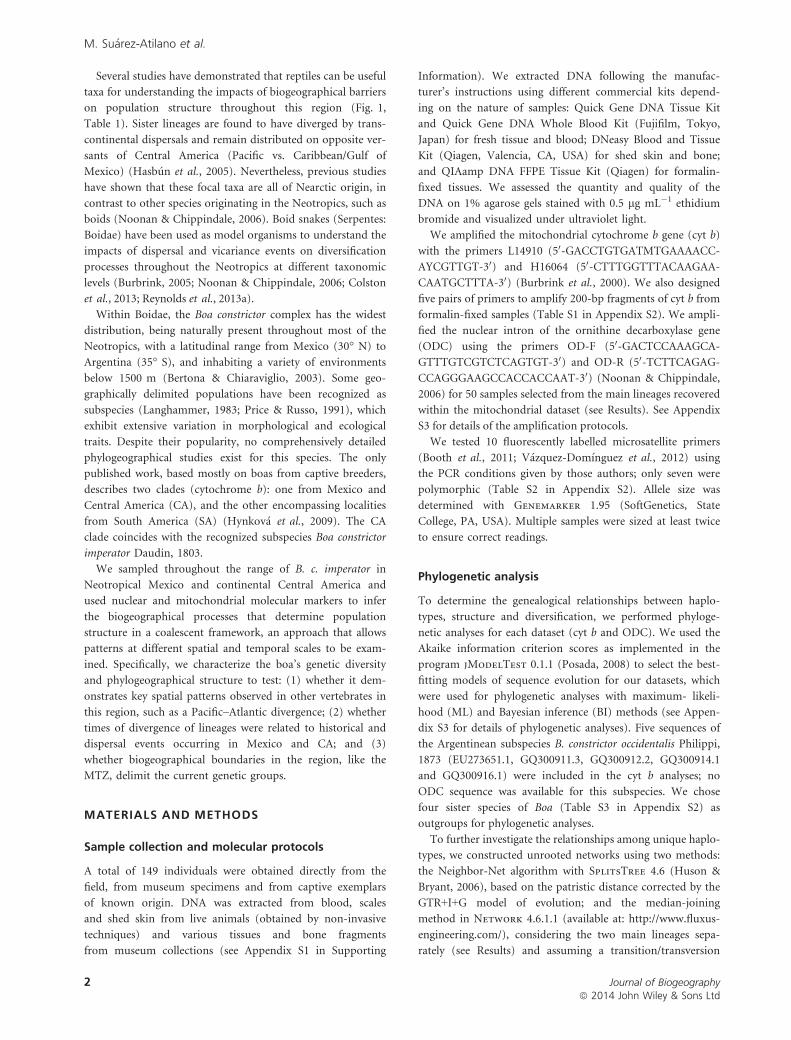
Phylogeographical structure withinBoa constrictor imperator across thelowlands and mountains of CentralAmerica and MexicoMarco Su�arez-Atilano1,4, Frank Burbrink2,3 and Ella V�azquez-Domı́nguez1*
1Departamento de Ecolog�ıa de la
Biodiversidad, Instituto de Ecolog�ıa,
Universidad Nacional Aut�onoma de M�exico,
Ciudad Universitaria, M�exico, DF 04510,
M�exico, 2Department of Biology, The
Graduate School, City University of New
York, New York, NY 10016, USA,3Department of Biology, College of Staten
Island, Staten Island, NY 10314, USA,4Posgrado en Ciencias Biol�ogicas, Universidad
Nacional Aut�onoma de M�exico, Coyoac�an,
M�exico, DF 04510, M�exico
*Correspondence: Ella V�azquez-Dom�ınguez,
Departamento de Ecolog�ıa de la Biodiversidad,
Instituto de Ecolog�ıa, Universidad Nacional
Aut�onoma de M�exico, Ap. Postal 70-275,
Ciudad Universitaria, M�exico, DF 04510,
M�exico.
E-mail: [email protected]
ABSTRACT
Aim To evaluate the genetic diversity and phylogeographical structure of Boa
constrictor imperator, in order to identify the key historical events responsible
for its current distribution and diversity.
Location The Neotropical region of Mexico and mainland Central America.
Methods We used data from the mitochondrial cytochrome b gene, nuclear
ornithine decarboxylase intron and microsatellites to perform spatial genetic
analyses, and coalescence methods to infer phylogeographical structure, diver-
gence times and historical demography.
Results Cytochrome b results revealed two main reciprocally monophyletic
lineages, one along the Mexican Pacific coast and another along the Gulf of
Mexico, Yucat�an Peninsula and Central America, diverging c. 5.2 Ma. Both lin-
eages are subdivided into haplogroups and show steady historical growth and a
more recent population expansion. High genetic diversity was observed for
both cytochrome b (h = 0.944) and microsatellites (HNei = 0.810–0.900).
Main conclusions We demonstrate deep phylogeographical structure with
two reciprocally monophyletic lineages and five genetic clusters in Mexico and
Central America. Our results suggest that several geographical barriers (includ-
ing the Trans-Mexican Volcanic Belt and the Motagua–Polochic–Jocot�anfaults) and ecological features generated this structure. We report genetic diver-
sity values for the boa at a regional scale and suggest that the two lineages may
be considered distinct species.
Keywords
Boidae, Central America, conservation biogeography, Mexico, microsatellites,
mitochondrial DNA, Neotropics, nuclear DNA, phylogeography, snakes.
INTRODUCTION
Phylogeographical research has generally focused on the
northern temperate regions of the world, including Europe
and the USA, with fewer studies occurring at the boundaries
of temperate and tropical regions (Beheregaray, 2008), even
though the Neotropical region of Mexico and Central Amer-
ica is considered one of the most biologically diverse areas on
Earth (Myers, 2003). Multiple biotic assemblages are likely to
have been shaped in this region, particularly along the frontier
between the Neotropics and Nearctic – the Mexican Transi-
tion Zone (MTZ), located in central Mexico – and associated
major geographical features, such as the Sierra Madre
Occidental, Trans-Mexican Volcanic Belt and Sierra Madre
Oriental (Savage, 1982). Accordingly, the geological and bio-
geographical history of Central America has been critical in
shaping the distribution of Neotropical biota in this region.
Central America served as a bridge connecting North America
and South America, allowing organisms to disperse between
them, in what is known as the Great American Biotic Inter-
change (Woodburne, 2010). Three major biogeographical
events in this region have been highlighted as key factors in
forming present-day patterns of biological distribution: (1)
the emergence of the Isthmus of Panama; (2) orogenic
processes across Central America during the Miocene; and
(3) global Pleistocene glacial cycles, which triggered cli-
matic, vegetation and sea-level changes (Guti�errez-Garc�ıa &
V�azquez-Dom�ınguez, 2013).
ª 2014 John Wiley & Sons Ltd http://wileyonlinelibrary.com/journal/jbi 1doi:10.1111/jbi.12372
Journal of Biogeography (J. Biogeogr.) (2014)
Several studies have demonstrated that reptiles can be useful
taxa for understanding the impacts of biogeographical barriers
on population structure throughout this region (Fig. 1,
Table 1). Sister lineages are found to have diverged by trans-
continental dispersals and remain distributed on opposite ver-
sants of Central America (Pacific vs. Caribbean/Gulf of
Mexico) (Hasb�un et al., 2005). Nevertheless, previous studies
have shown that these focal taxa are all of Nearctic origin, in
contrast to other species originating in the Neotropics, such as
boids (Noonan & Chippindale, 2006). Boid snakes (Serpentes:
Boidae) have been used as model organisms to understand the
impacts of dispersal and vicariance events on diversification
processes throughout the Neotropics at different taxonomic
levels (Burbrink, 2005; Noonan & Chippindale, 2006; Colston
et al., 2013; Reynolds et al., 2013a).
Within Boidae, the Boa constrictor complex has the widest
distribution, being naturally present throughout most of the
Neotropics, with a latitudinal range from Mexico (30° N) to
Argentina (35° S), and inhabiting a variety of environments
below 1500 m (Bertona & Chiaraviglio, 2003). Some geo-
graphically delimited populations have been recognized as
subspecies (Langhammer, 1983; Price & Russo, 1991), which
exhibit extensive variation in morphological and ecological
traits. Despite their popularity, no comprehensively detailed
phylogeographical studies exist for this species. The only
published work, based mostly on boas from captive breeders,
describes two clades (cytochrome b): one from Mexico and
Central America (CA), and the other encompassing localities
from South America (SA) (Hynkov�a et al., 2009). The CA
clade coincides with the recognized subspecies Boa constrictor
imperator Daudin, 1803.
We sampled throughout the range of B. c. imperator in
Neotropical Mexico and continental Central America and
used nuclear and mitochondrial molecular markers to infer
the biogeographical processes that determine population
structure in a coalescent framework, an approach that allows
patterns at different spatial and temporal scales to be exam-
ined. Specifically, we characterize the boa’s genetic diversity
and phylogeographical structure to test: (1) whether it dem-
onstrates key spatial patterns observed in other vertebrates in
this region, such as a Pacific–Atlantic divergence; (2) whether
times of divergence of lineages were related to historical and
dispersal events occurring in Mexico and CA; and (3)
whether biogeographical boundaries in the region, like the
MTZ, delimit the current genetic groups.
MATERIALS AND METHODS
Sample collection and molecular protocols
A total of 149 individuals were obtained directly from the
field, from museum specimens and from captive exemplars
of known origin. DNA was extracted from blood, scales
and shed skin from live animals (obtained by non-invasive
techniques) and various tissues and bone fragments
from museum collections (see Appendix S1 in Supporting
Information). We extracted DNA following the manufac-
turer’s instructions using different commercial kits depend-
ing on the nature of samples: Quick Gene DNA Tissue Kit
and Quick Gene DNA Whole Blood Kit (Fujifilm, Tokyo,
Japan) for fresh tissue and blood; DNeasy Blood and Tissue
Kit (Qiagen, Valencia, CA, USA) for shed skin and bone;
and QIAamp DNA FFPE Tissue Kit (Qiagen) for formalin-
fixed tissues. We assessed the quantity and quality of the
DNA on 1% agarose gels stained with 0.5 lg mL�1 ethidium
bromide and visualized under ultraviolet light.
We amplified the mitochondrial cytochrome b gene (cyt b)
with the primers L14910 (50-GACCTGTGATMTGAAAACC-
AYCGTTGT-30) and H16064 (50-CTTTGGTTTACAAGAA-CAATGCTTTA-30) (Burbrink et al., 2000). We also designed
five pairs of primers to amplify 200-bp fragments of cyt b from
formalin-fixed samples (Table S1 in Appendix S2). We ampli-
fied the nuclear intron of the ornithine decarboxylase gene
(ODC) using the primers OD-F (50-GACTCCAAAGCA-GTTTGTCGTCTCAGTGT-30) and OD-R (50-TCTTCAGAG-CCAGGGAAGCCACCACCAAT-30) (Noonan & Chippindale,
2006) for 50 samples selected from the main lineages recovered
within the mitochondrial dataset (see Results). See Appendix
S3 for details of the amplification protocols.
We tested 10 fluorescently labelled microsatellite primers
(Booth et al., 2011; V�azquez-Dom�ınguez et al., 2012) using
the PCR conditions given by those authors; only seven were
polymorphic (Table S2 in Appendix S2). Allele size was
determined with Genemarker 1.95 (SoftGenetics, State
College, PA, USA). Multiple samples were sized at least twice
to ensure correct readings.
Phylogenetic analysis
To determine the genealogical relationships between haplo-
types, structure and diversification, we performed phyloge-
netic analyses for each dataset (cyt b and ODC). We used the
Akaike information criterion scores as implemented in the
program jModelTest 0.1.1 (Posada, 2008) to select the best-
fitting models of sequence evolution for our datasets, which
were used for phylogenetic analyses with maximum- likeli-
hood (ML) and Bayesian inference (BI) methods (see Appen-
dix S3 for details of phylogenetic analyses). Five sequences of
the Argentinean subspecies B. constrictor occidentalis Philippi,
1873 (EU273651.1, GQ300911.3, GQ300912.2, GQ300914.1
and GQ300916.1) were included in the cyt b analyses; no
ODC sequence was available for this subspecies. We chose
four sister species of Boa (Table S3 in Appendix S2) as
outgroups for phylogenetic analyses.
To further investigate the relationships among unique haplo-
types, we constructed unrooted networks using two methods:
the Neighbor-Net algorithm with SplitsTree 4.6 (Huson &
Bryant, 2006), based on the patristic distance corrected by the
GTR+I+G model of evolution; and the median-joining
method in Network 4.6.1.1 (available at: http://www.fluxus-
engineering.com/), considering the two main lineages sepa-
rately (see Results) and assuming a transition/transversion
Journal of Biogeographyª 2014 John Wiley & Sons Ltd
2
M. Su�arez-Atilano et al.
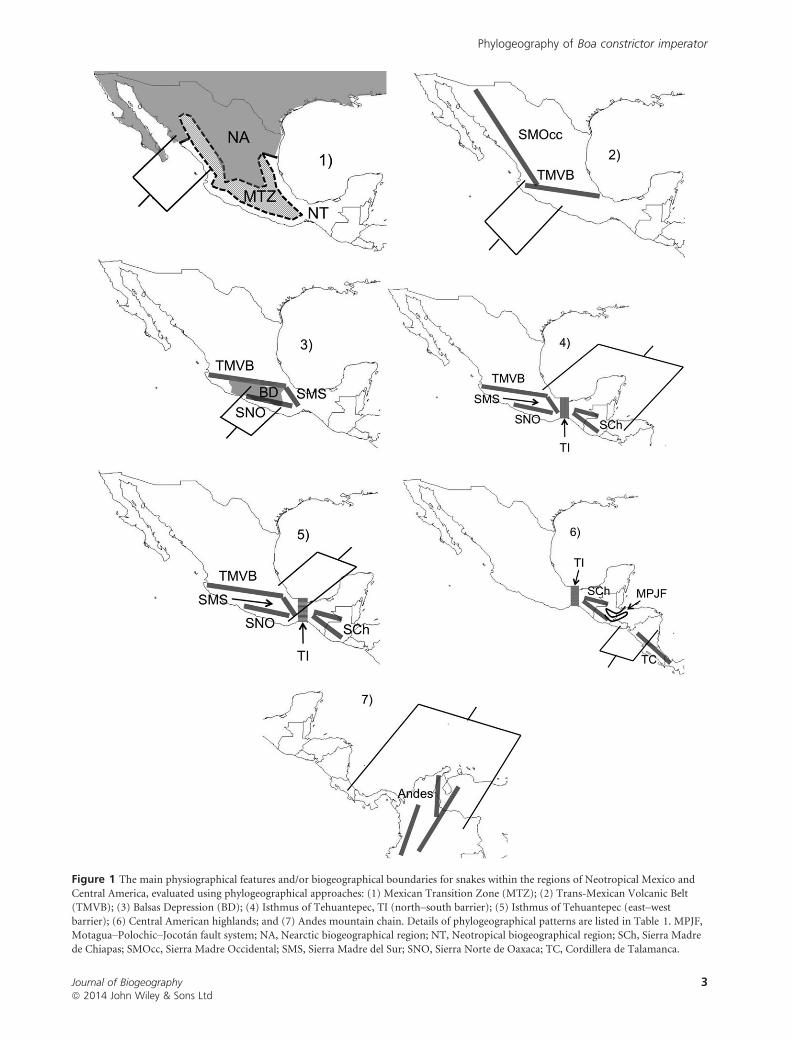
Figure 1 The main physiographical features and/or biogeographical boundaries for snakes within the regions of Neotropical Mexico and
Central America, evaluated using phylogeographical approaches: (1) Mexican Transition Zone (MTZ); (2) Trans-Mexican Volcanic Belt(TMVB); (3) Balsas Depression (BD); (4) Isthmus of Tehuantepec, TI (north–south barrier); (5) Isthmus of Tehuantepec (east–westbarrier); (6) Central American highlands; and (7) Andes mountain chain. Details of phylogeographical patterns are listed in Table 1. MPJF,Motagua–Polochic–Jocot�an fault system; NA, Nearctic biogeographical region; NT, Neotropical biogeographical region; SCh, Sierra Madre
de Chiapas; SMOcc, Sierra Madre Occidental; SMS, Sierra Madre del Sur; SNO, Sierra Norte de Oaxaca; TC, Cordillera de Talamanca.
Journal of Biogeographyª 2014 John Wiley & Sons Ltd
3
Phylogeography of Boa constrictor imperator

Table
1Themainphysiographical
featuresandbiogeographical
boundarieswithin
theNeotropical
MexicoandCentral
American
region,evaluated
phylogeographically
indifferentsnake
species.Numbers(1)–(7)arerelatedfeaturesorboundariesshownin
Fig.1.
Physiographical
feature
orbiogeographical
boundary
Phylogeographical
pattern
Species
References
Mexican
Transition
Zone(M
TZ)
(1)Genetic
differentiationassociated
withthepresence
oftheTMBV,
affectingtaxa
intheMexican
Pacificcoast.
Hypsiglenatorquata;
Trimorphodon
biscutatus;
Crotalusspp.
Devitt(2006);Mulcahy(2008);
Reyes-V
elasco
etal.(2013)
Trans-Mexican
Volcanic
Belt(TMVB)
(2)North–south
structure
associated
withthepresence
oftheTMBV,
affectingtaxa
intheMexican
Pacificcoast.
Lam
propeltistriangulum;
Trimorphodon
biscutatus
Devitt(2006);Ruaneet
al.(2014)
BalsasDepression(BD)
(3)Changesin
theBalsasRiver
levelandtectonic
activity
associated
withtheTMVBupliftfacilitatingthedifferentiationof‘inner
BD’
lineagesfrom
‘Pacificcoast’populations.
Lam
propeltissplendida;
Pituophisdeppei;
Pituophislineaticollis;
Crotalusspp.
Dazaet
al.(2009);Brysonet
al.(2011);
Reyes-V
elasco
etal.(2013)
IsthmusofTehuantepec
(north–south
barrier)
(4)Form
ationofmountain
chainsonboth
sides
oftheisthmus
(SMOcc
andSM
S)andexpansion–contractioncycles
ofpine–oak
forest,limitingdispersalforhighlandspecies.
Atropoides
olmec;
Cerrophidionspp.;
Crotalusdurissus
W€ uster
etal.(2005);Castoeet
al.(2009)
IsthmusofTehuantepec
(east–westbarrier)
(5)Sea-levelchanges,continentalupliftandvegetationtransitions
(tropical
dry
forest
inthePacificvs.rainforestin
coastalGulfof
Mexico)werefactors
associated
withthedifferentiationoflowlandtaxa.
Agkistrodon
bilineatus;
Leptodeira
annulata;
Leptodeira
maculata;
Leptodeira
septentrionalis
Parkinsonet
al.(2000);Dazaet
al.
(2009,
2010)
Central
American
Highlandsbarrier
(6)Mountain
system
s(Talam
anca,SM
Ch,Motagua–Polochic–Jocot�an
faults)
permitted,in
abroad
sense,thestructuringoflowlandand
highlandtaxa
alongtheAtlanticandPacific.
Atropoides
occidus ;
Atropoides
mexicanus;
Bothriechisspp.;
Crotalusdurissus;
Trimorphodon
biscutatus
W€uster
etal.(2005);Castoeet
al.(2009);
Devitt(2006);Dazaet
al.(2010)
AndeanCordillera
(7)NorthernAndes
uplift(above
4000
m)associated
withdivergence
oftranscontinentaltaxa.
Boa
constrictor;
Corallusspp.;Lachesis
muta
Zam
udio
&Greene(1997);
Hynko
v� aet
al.(2009);
Colstonet
al.(2013)
SMCh,Sierra
Madre
deChiapas;SM
Occ,Sierra
Madre
Occidental;SM
S,Sierra
Madre
delSu
r.
Journal of Biogeographyª 2014 John Wiley & Sons Ltd
4
M. Su�arez-Atilano et al.

ratio of 1:3. The ODC haplotypes inferred by Phase 2.1.1 (Ste-
phens & Donnelly, 2003) were used in both network
constructions.
Genetic diversity and historical demography
We performed Tajima’s D (Tajima, 1989), Fu and Li’s F
(Fu & Li, 1993) and Fu’s FS (Fu, 1997) tests to evaluate if
sequences conformed to a neutral model of evolution; statis-
tical significance was determined using the coalescent simula-
tor in DnaSP 5.10 (Librado & Rozas, 2009). We calculated
three genetic diversity estimates with DnaSP for each dataset:
the nucleotide diversity (p), haplotype diversity (h) and
average number of differences among sequences (k). For the
ODC data, the phases of heterozygous genotypes were
resolved using Phase, where the most probable pair of alleles
was used for each heterozygous individual.
We used beast 1.7.4 (Drummond & Rambaut, 2007) to
estimate diversification times for the mitochondrial lineages
obtained, an approach that uses a relaxed phylogenetic
method that does not rely on a molecular clock. The time to
the most recent common ancestor for the main lineages was
obtained using Bayesian Markov chain Monte Carlo (MCMC)
searches. We used a GTR+I+G model of evolution across all
gene and codon positions and implemented an uncorrelated
lognormal relaxed molecular clock method. The time of diver-
gence was estimated with an uncorrelated lognormal tree
prior, with a constant population size prior and lognormal cal-
ibration dates. These analyses estimated tree shape and diver-
gence dates for all nodes and were sampled every thousandth
iteration for 50,000,000 generations with 10% of the initial
samples discarded as burn-in. For the relaxed method, we
provided calibration points and error estimates derived from a
lognormal distribution. We used three calibration points: the
oldest Patagonian boa fossil (Albino & Carlini, 2008), the
unique Baja California fossil (Miller, 1980) and the oldest boa
fossil from Panama (Head et al., 2012; Table S4 in Appendix
S2). We tested these in beast using the fossil records sepa-
rately and the three points together to ensure consistency.
We examined evidence of historical demographic changes
by constructing Bayesian skyline plots for each main mito-
chondrial lineage with beast, to infer population fluctua-
tions over time by estimating the posterior distribution of
the effective population size at specified intervals along a
phylogeny (Drummond & Rambaut, 2007). Genealogies and
model parameters were sampled every thousandth iteration
along 107 generations under a relaxed lognormal molecular
clock, with uniformly distributed priors and a burn-in of
100 iterations, using coalescent intervals (m) of 10. Demo-
graphic plots for each analysis were visualized using Tracer.
Genetic clustering, diversity and differentiation
using microsatellite data
To examine spatial structure using microsatellites, we used
Geneland 3.1.4 (Guillot et al., 2005), which applies an MCMC
method that considers genetic data and geographical coordi-
nates to identify genetic discontinuities between populations in
space from individual multilocus genotypes. In addition, we
tested the consistency of the individual assignment (Gene-
land) using a spatially independent analysis with structure
2.3.3 (Pritchard et al., 2000) (see Appendix S3 for details).
To estimate genetic diversity and assess structure of the
genetic clusters defined by Geneland, we examined possible
departures from Hardy–Weinberg equilibrium (HWE) with
an exact test and calculated the unbiased P-value with a
Markov-chain algorithm (Guo & Thompson, 1992) with
10,000 dememorizations, 1000 batches and 10,000 iterations
per batch. Linkage disequilibrium was evaluated by a log-like-
lihood-ratio statistic (G-test) and heterozygote deficit or
excess and allele frequencies were estimated using FIS statistics
in GenePop 4.0 (Raymond & Rousset, 1995). We applied a
sequential Bonferroni correction (Rice, 1989) where necessary.
We estimated genetic variability based on the observed (no)
and effective number of alleles (ne) and the observed (HO)
and expected heterozygosity (HE) and Nei’s unbiased expected
heterozygosity (HNei) values for each cluster with GenAlEx
6.2 (Peakall & Smouse, 2006). We evaluated the presence of
null alleles and genotyping errors with Micro-Checker 2.2.3
(van Oosterhout et al., 2004), using a 95% confidence inter-
val, 1000 repetitions and the Brookfield 1 estimator. To assess
the degree of genetic structure among clusters, we calculated
FST using Arlequin 3.5 (Excoffier & Lischer, 2010). We also
used Arlequin to perform an analysis of molecular variance
(AMOVA) based on FST to analyse the distribution of the
genetic variation between and within populations. Signifi-
cance was calculated using a nonparametric test with 30,000
permutations of genotypes among populations.
We explored the robustness of the genetic structure
obtained and determined differentiation between clusters
with the genetic distance measure DA (Nei & Chesser, 1983).
This measure is based on the infinite-allele model and makes
no assumptions about mutational rates or of constant popu-
lation size, and therefore has a higher probability of converg-
ing and depicting the correct tree topology (Destro-Bisol
et al., 2000). We also estimated genetic distance under a
stepwise mutation model in order to generate branch lengths
proportional to evolutionary change, using dl2 (Goldstein
et al., 1995). Based on these genetic distances, we con-
structed neighbour-joining dendrograms, with 1000 replicates
for bootstrap values, using Populations 1.2.30 (available at:
http://bioinformatics.org/~tryphon/populations/).
Gene flow based on microsatellites and cytochrome b
To assess the presence and direction of migration events
between the observed lineages, we performed two analyses
using nuclear and mitochondrial information simultaneously.
We used the mitochondrial lineages as the defined popula-
tions and microsatellites as the molecular markers, consider-
ing a full asymmetrical matrix of migration rates among
lineages, using Migrate-n (Beerli, 2007). In order to infer
Journal of Biogeographyª 2014 John Wiley & Sons Ltd
5
Phylogeography of Boa constrictor imperator
the approximate times of migration events between mito-
chondrial lineages, we also performed coalescent simulations
under an isolation-with-migration model (Hey & Nielsen,
2004) with IMa2 (Linux v.10.13.10; see Appendix S3).
RESULTS
Molecular sequence diversity
and phylogenetic lineages
We amplified a 1063-bp fragment of cyt b from 122 individ-
uals, which included 174 polymorphic sites, 133 parsimony-
informative sites and 108 unique haplotypes, yielding high
haplotype diversity (h = 0.994) and low nucleotide diversity
(p = 0.033) and an average number of nucleotide differences
between haplotypes (k) of 35.2. Tajima’s D (D = �0.751;
P > 0.1), Fu and Li’s F (F = 0.172; P > 0.1) and Fu’s FS tests
(FS = �33.697; P > 0.1) indicated no departures from neu-
trality in molecular variation. The estimated Tr/Tv ratio was
3.5, with mean nucleotide frequencies of 32.7% A, 28.3% C,
13.8% G and 25.2% T. The TIM2+I+G (pinv = 0.73; a =0.95) model was chosen (the closest equivalent, GTR+I+G,was used in subsequent analyses).
Both phylogenetic inference methods (ML and BI) showed
the same topology, in which two distinct main lineages were
recovered with high levels of support (Fig. 2a): (1) Mexican
Pacific coast (PAC; 38 individuals); and (2) the Gulf of Mex-
ico, Yucat�an Peninsula and Central America (GYCA; 84 indi-
viduals). Net nucleotide divergence (DA) between the two
lineages was 4.2%. The samples from B. c. occidentalis (Argen-
tina) and Brazil were sister to the B. c. imperator clade. The
network analysis based on all haplotypes showed the same pat-
tern, with two well-defined lineages (PAC and GYCA;
Fig. 2b). Minimum-distance networks for each lineage are
consistent with the phylogenetic results, with a few widespread
and/or abundant haplotypes and numerous unique ones.
From the nuclear ODC intron, we amplified a 610-bp
fragment from 50 samples, which yielded 35 polymorphic
sites, comprising 10 parsimony-informative sites and 25 sites
that represented singleton mutations. These defined 39 hapl-
otypes, with h = 0.78, p = 0.069 and k = 4.6. Tajima’s, Fu
and Li’s and Fu’s statistics showed no deviation from neu-
trality (D = �1.02; F = 0.058; FS = �39.843; P > 0.1 in each
case). The selected model of evolution was GTR+I(pinv = 0.939), the estimated transition/transversion ratio was
1.3 and the mean nucleotide frequencies were 29.3% A,
16.9% C, 18.4% G and 35.4% T. Both phylogenetic inference
methods (ML, BI) recovered the same main topology, in
which the GYCA linage is well resolved, although the haplo-
types in PAC are less well resolved (Fig. S1 in Appendix S3).
Divergence time, demographic reconstruction
and gene flow
The simultaneous use of three calibration points was selected
as the best-fitting model of divergence-time estimation, based
on the median mutation rate of 0.0124 mutations per site per
million years. This value is similar to estimates for cyt b in
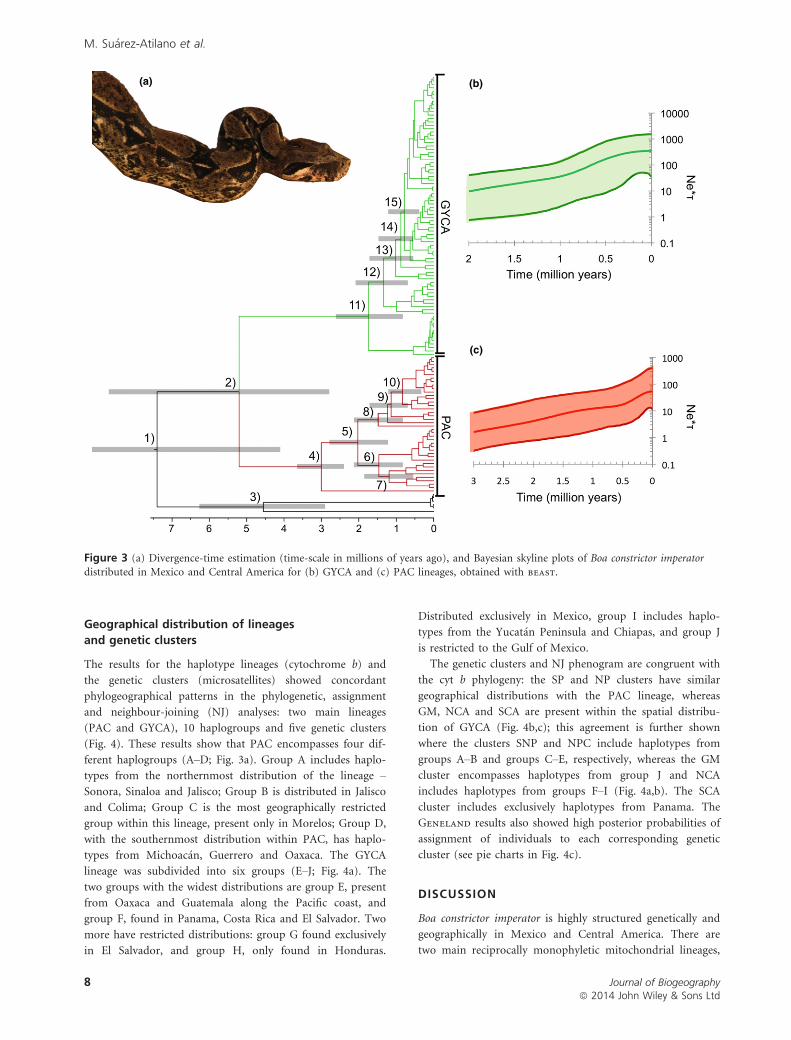
other snake species (Jiang et al., 2007). The oldest estimated
divergence event corresponds to the main split between South
American and Central American samples, dated around 7.41
million years ago (Ma) (node 1 in Fig. 3a; and see Table S5
in Appendix S2). The split of the two main B. c. imperator
lineages – PAC and GYCA (node 2) – occurred 5.20 Ma, and
was followed by the divergence between B. c. occidentalis
(Argentina) and the Brazilian sample (node 3; 4.55 Ma).
Within the PAC lineage, the next diversification event
occurred in the southernmost sampled region in Oaxaca
(node 4; 3.0 Ma); diversification continued from 2.02 Ma
(node 5) until 0.83 Ma (node 10) at different locations along
the Mexican Pacific coast. Similarly, within the GYCA line-
age, one divergence separated haplotypes exclusive to the
Guatemalan Pacific coast and the Isthmus of Tehuantepec
from the rest of Central America, the Gulf of Mexico and the
Yucat�an Peninsula (node 11; 1.79 Ma). The most recent
event (node 15; 780,000 years ago) separated individuals
from the Gulf of Mexico and the Yucat�an Peninsula.
The Bayesian skyline demographic reconstructions showed
a pattern of population growth through time, in which the
plots for PAC and GYCA indicated constant growth from
2.0 until 0.2 Ma and from 3.0 until 0.2 Ma, respectively
(Fig. 3b,c). Both lineages also showed evidence of a recent
population expansion, starting at 0.5 Ma. Skyline reconstruc-
tions showed that GYCA has a population size at least four
times that of PAC (350.3 and 89.9, respectively; Fig. 3b,c).
None of the plots showed evidence of genetic bottlenecks or
historical population contractions. Values of h were similar
under both methods (Migrate-n and BSL), indicating
higher values for GYCA (h = 4.91; 95% confidence interval,
CI: 4.9–5.0) than PAC (h = 2.81; 95% CI: 2.5–3.0).
Results for gene flow (Migrate-n) revealed a greater con-
tribution of GYCA into PAC, with a value of 31.3 migrants
per generation (95% CI: 9.3–33.0) in the direction GYCA to
PAC, compared to 7.78 (95% CI: 0–11.9) in the other direc-
tion. IMa2 analysis estimated that the gene flow from GYCA
to PAC began c. 294,000 generations ago (95% CI: 180,000–
462,000), which is c. 1.03 Ma, assuming a generation time of
3.5 years. The gene flow from PAC to GYCA occurred later,
c. 190,000 generations ago (95% CI: 68,000–336,000), or c.
619,000 years ago.
Genetic diversity and structure
with microsatellite data
The spatial clustering analysis with Geneland was based on
multilocus genotypes from 148 individuals from Mexico and
Central America, discarding a single sample from Brazil. This
analysis defined five genetic clusters (K = 5), based on con-
sistent results from 22 runs [ln Pr(K = 5) = �4263.426],
where all individuals were systematically distributed in the
same group among runs. We named these clusters based on
their geographical distributions: North Pacific (NP), South
Journal of Biogeographyª 2014 John Wiley & Sons Ltd
6
M. Su�arez-Atilano et al.

Pacific (SP), Gulf of Mexico (GM), North Central America
(NCA) and South Central America (SCA) (Fig. S2 in Appen-
dix S3). Cluster sample size varied from 48 individuals in
NCA to 6 in SCA. The assignment performed with struc-
ture showed similar results, yielding five main groups; both
methods infer the same spatial boundaries between clusters
when comparing the Gulf of Mexico cluster (GM) with the
cluster obtained with structure (G1) (see Results in
Appendix S3) and when comparing the South Pacific clusters
(SP vs. P2), although genetic discontinuities for the Central
America clusters differ between Geneland and structure
(NCA, SCA and G1, G2, G3; see Results in Appendix S3).
We found a total of 157 alleles across the seven loci, with
a range of 11 to 35 (average 25) alleles per locus for the
entire sample; Bci-14 was the most variable locus. Expected
and observed heterozygosity values across clusters were mod-
erately high (Ho = 0.48–0.70; He = 0.74–0.88; HNei = 0.81–
0.90) (Table S6 in Appendix S3), although the values for
SCA should be viewed with caution given its low sample size.
After Bonferroni correction, exact tests found departures
from HWE in three clusters regarding heterozygote defi-
ciency and only two loci showed consistent departures across
all five (Bci-18 and lsat20). All loci were in linkage equilib-
rium and most loci showed exclusive alleles in all clusters
(from three in SP to 26 in NCA). No consistent presence of
null alleles was detected in comparisons across clusters.
Genetic differentiation showed significant FST values
(0.027–0.100; P < 0.01), whereas the AMOVA results
(P < 0.01) revealed that most of the genetic variation was
found within individuals (67%), followed by that among
individuals within clusters (27%); the lowest proportion was
between clusters (6%). Genetic structuring was confirmed by
the NJ dendrograms, where each cluster can be distinguished
(Fig. 4): western (PC) clusters are clearly differentiated from
eastern ones (GM and NCA), with SCA being the most
genetically differentiated of all. The same topology was
achieved with all distance measures considered, irrespective
of what mutation model was assumed.
(a) (b) (c)
Figure 2 Phylogenetic analyses of Boa constrictor imperator distributed in Mexico and Central America based on cytochrome b. (a)
Phylogeny using Bayesian inference showing two major clades (PAC and GYCA). The 10 haplogroups recovered within each main linageare shown with coloured lines and capital letters A–J (see also Fig. 3): groups A–D (within PAC) and groups E–J (within GYCA). The
dashed line (node) represents the placement for the outgroup species (branch lengths not to scale). Haplotype networks obtained with(b) the Neighbor-Net algorithm and (c) the median-joining method. PAC and GYCA lineages are shown in red (at the bottom) and
green (at the top), respectively.
Journal of Biogeographyª 2014 John Wiley & Sons Ltd
7
Phylogeography of Boa constrictor imperator
Geographical distribution of lineages
and genetic clusters
The results for the haplotype lineages (cytochrome b) and
the genetic clusters (microsatellites) showed concordant
phylogeographical patterns in the phylogenetic, assignment
and neighbour-joining (NJ) analyses: two main lineages
(PAC and GYCA), 10 haplogroups and five genetic clusters
(Fig. 4). These results show that PAC encompasses four dif-
ferent haplogroups (A–D; Fig. 3a). Group A includes haplo-
types from the northernmost distribution of the lineage –
Sonora, Sinaloa and Jalisco; Group B is distributed in Jalisco
and Colima; Group C is the most geographically restricted
group within this lineage, present only in Morelos; Group D,
with the southernmost distribution within PAC, has haplo-
types from Michoac�an, Guerrero and Oaxaca. The GYCA
lineage was subdivided into six groups (E–J; Fig. 4a). The
two groups with the widest distributions are group E, present
from Oaxaca and Guatemala along the Pacific coast, and
group F, found in Panama, Costa Rica and El Salvador. Two
more have restricted distributions: group G found exclusively
in El Salvador, and group H, only found in Honduras.
Distributed exclusively in Mexico, group I includes haplo-
types from the Yucat�an Peninsula and Chiapas, and group J
is restricted to the Gulf of Mexico.
The genetic clusters and NJ phenogram are congruent with
the cyt b phylogeny: the SP and NP clusters have similar
geographical distributions with the PAC lineage, whereas
GM, NCA and SCA are present within the spatial distribu-
tion of GYCA (Fig. 4b,c); this agreement is further shown
where the clusters SNP and NPC include haplotypes from
groups A–B and groups C–E, respectively, whereas the GM
cluster encompasses haplotypes from group J and NCA
includes haplotypes from groups F–I (Fig. 4a,b). The SCA
cluster includes exclusively haplotypes from Panama. The
Geneland results also showed high posterior probabilities of
assignment of individuals to each corresponding genetic
cluster (see pie charts in Fig. 4c).
DISCUSSION
Boa constrictor imperator is highly structured genetically and
geographically in Mexico and Central America. There are
two main reciprocally monophyletic mitochondrial lineages,
(a) (b)
(c)
Figure 3 (a) Divergence-time estimation (time-scale in millions of years ago), and Bayesian skyline plots of Boa constrictor imperatordistributed in Mexico and Central America for (b) GYCA and (c) PAC lineages, obtained with beast.
Journal of Biogeographyª 2014 John Wiley & Sons Ltd
8
M. Su�arez-Atilano et al.

(a)
(d)
(b) (c)
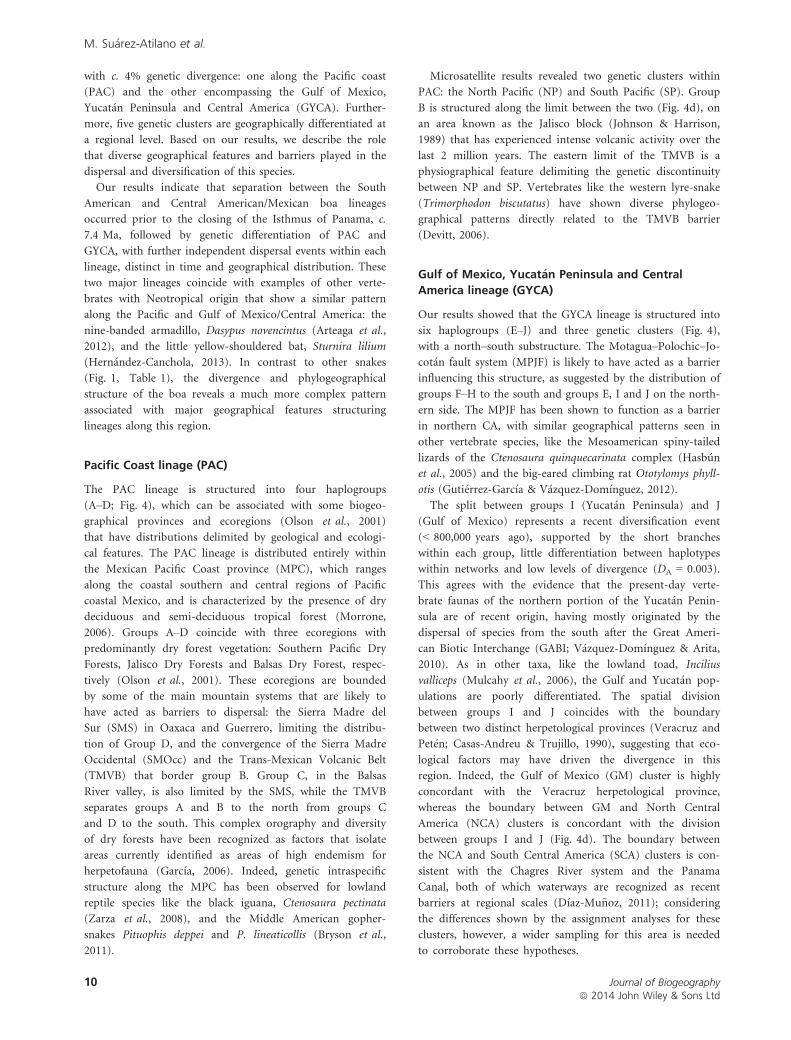
Figure 4 Summary of phylogeographical patterns within Boa constrictor imperator in Mexico and Central America. (a) beast
phylogenetic results showing 10 haplogroups recovered within each main linage: Pacific coast, PAC (groups A–D, represented withwarm colours); and Gulf of Mexico–Yucat�an Peninsula–Central America, GYCA (groups E–J; with cold colours). A time scale is shown
on the bottom (Ma). (b) Spatial delimitation of the five genetic clusters, represented by coloured squares, named in relation togeographical location: GM, Gulf of Mexico; NCA, North Central America; SCA, South Central America; SP, South Pacific; NP, North
Pacific. (c) Neighbour-joining phenogram with bootstrap support values based on the microsatellite dataset and Nei standard geneticdistances between genetic clusters; pie charts represent average assignment (posterior probability) of each individual belonging to the
corresponding inferred cluster. (d) Map depicting the geographical location of cytochrome b lineages as the different groups recovered(Pacific Coast, PAC; Gulf of Mexico–Yucat�an Peninsula–Central America, GYCA) and the five genetic clusters (microsatellites) defined
by Geneland; PAC and GYCA individuals are shown as triangles and circles, respectively (those in white represent individuals that haveno association to any group). Black solid lines represent major geographical barriers: 1, Trans-Mexican Volcanic Belt; 2, Sierra Madre
del Sur; 3, Isthmus of Tehuantepec; 4, Sierra Norte de Oaxaca; 5, Motagua–Polochic–Jocot�an fault system; 6, Chagres River system and
Panama Channel. The white dashed polygon represents the Oaxaca region.
Journal of Biogeographyª 2014 John Wiley & Sons Ltd
9
Phylogeography of Boa constrictor imperator
with c. 4% genetic divergence: one along the Pacific coast
(PAC) and the other encompassing the Gulf of Mexico,
Yucat�an Peninsula and Central America (GYCA). Further-
more, five genetic clusters are geographically differentiated at
a regional level. Based on our results, we describe the role
that diverse geographical features and barriers played in the
dispersal and diversification of this species.
Our results indicate that separation between the South
American and Central American/Mexican boa lineages
occurred prior to the closing of the Isthmus of Panama, c.
7.4 Ma, followed by genetic differentiation of PAC and
GYCA, with further independent dispersal events within each
lineage, distinct in time and geographical distribution. These
two major lineages coincide with examples of other verte-
brates with Neotropical origin that show a similar pattern
along the Pacific and Gulf of Mexico/Central America: the
nine-banded armadillo, Dasypus novencintus (Arteaga et al.,
2012), and the little yellow-shouldered bat, Sturnira lilium
(Hern�andez-Canchola, 2013). In contrast to other snakes
(Fig. 1, Table 1), the divergence and phylogeographical
structure of the boa reveals a much more complex pattern
associated with major geographical features structuring
lineages along this region.
Pacific Coast linage (PAC)
The PAC lineage is structured into four haplogroups
(A–D; Fig. 4), which can be associated with some biogeo-
graphical provinces and ecoregions (Olson et al., 2001)
that have distributions delimited by geological and ecologi-
cal features. The PAC lineage is distributed entirely within
the Mexican Pacific Coast province (MPC), which ranges
along the coastal southern and central regions of Pacific
coastal Mexico, and is characterized by the presence of dry
deciduous and semi-deciduous tropical forest (Morrone,
2006). Groups A–D coincide with three ecoregions with
predominantly dry forest vegetation: Southern Pacific Dry
Forests, Jalisco Dry Forests and Balsas Dry Forest, respec-
tively (Olson et al., 2001). These ecoregions are bounded
by some of the main mountain systems that are likely to
have acted as barriers to dispersal: the Sierra Madre del
Sur (SMS) in Oaxaca and Guerrero, limiting the distribu-
tion of Group D, and the convergence of the Sierra Madre
Occidental (SMOcc) and the Trans-Mexican Volcanic Belt
(TMVB) that border group B. Group C, in the Balsas
River valley, is also limited by the SMS, while the TMVB
separates groups A and B to the north from groups C
and D to the south. This complex orography and diversity
of dry forests have been recognized as factors that isolate
areas currently identified as areas of high endemism for
herpetofauna (Garc�ıa, 2006). Indeed, genetic intraspecific
structure along the MPC has been observed for lowland
reptile species like the black iguana, Ctenosaura pectinata
(Zarza et al., 2008), and the Middle American gopher-
snakes Pituophis deppei and P. lineaticollis (Bryson et al.,
2011).
Microsatellite results revealed two genetic clusters within
PAC: the North Pacific (NP) and South Pacific (SP). Group
B is structured along the limit between the two (Fig. 4d), on
an area known as the Jalisco block (Johnson & Harrison,
1989) that has experienced intense volcanic activity over the
last 2 million years. The eastern limit of the TMVB is a
physiographical feature delimiting the genetic discontinuity
between NP and SP. Vertebrates like the western lyre-snake
(Trimorphodon biscutatus) have shown diverse phylogeo-
graphical patterns directly related to the TMVB barrier
(Devitt, 2006).
Gulf of Mexico, Yucat�an Peninsula and Central
America lineage (GYCA)
Our results showed that the GYCA lineage is structured into
six haplogroups (E–J) and three genetic clusters (Fig. 4),
with a north–south substructure. The Motagua–Polochic–Jo-
cot�an fault system (MPJF) is likely to have acted as a barrier
influencing this structure, as suggested by the distribution of
groups F–H to the south and groups E, I and J on the north-
ern side. The MPJF has been shown to function as a barrier
in northern CA, with similar geographical patterns seen in
other vertebrate species, like the Mesoamerican spiny-tailed
lizards of the Ctenosaura quinquecarinata complex (Hasb�un
et al., 2005) and the big-eared climbing rat Ototylomys phyll-
otis (Guti�errez-Garc�ıa & V�azquez-Dom�ınguez, 2012).
The split between groups I (Yucat�an Peninsula) and J
(Gulf of Mexico) represents a recent diversification event
(< 800,000 years ago), supported by the short branches
within each group, little differentiation between haplotypes
within networks and low levels of divergence (DA = 0.003).
This agrees with the evidence that the present-day verte-
brate faunas of the northern portion of the Yucat�an Penin-
sula are of recent origin, having mostly originated by the
dispersal of species from the south after the Great Ameri-
can Biotic Interchange (GABI; V�azquez-Dom�ınguez & Arita,
2010). As in other taxa, like the lowland toad, Incilius
valliceps (Mulcahy et al., 2006), the Gulf and Yucat�an pop-
ulations are poorly differentiated. The spatial division
between groups I and J coincides with the boundary
between two distinct herpetological provinces (Veracruz and
Pet�en; Casas-Andreu & Trujillo, 1990), suggesting that eco-
logical factors may have driven the divergence in this
region. Indeed, the Gulf of Mexico (GM) cluster is highly
concordant with the Veracruz herpetological province,
whereas the boundary between GM and North Central
America (NCA) clusters is concordant with the division
between groups I and J (Fig. 4d). The boundary between
the NCA and South Central America (SCA) clusters is con-
sistent with the Chagres River system and the Panama
Canal, both of which waterways are recognized as recent
barriers at regional scales (D�ıaz-Mu~noz, 2011); considering
the differences shown by the assignment analyses for these
clusters, however, a wider sampling for this area is needed
to corroborate these hypotheses.
Journal of Biogeographyª 2014 John Wiley & Sons Ltd
10
M. Su�arez-Atilano et al.
Oaxaca, a secondary contact zone
The state of Oaxaca in Mexico (Fig. 4d) is a key region for
understanding the evolutionary history of both boa lineages.
The oldest diversification event for PAC occurred here
3.0 Ma and it is the only region of sympatry observed in our
results, where haplotypes from GYCA (group D) are found
within the geographical distribution of PAC (specifically in
the SP cluster), which is likely to be a result of secondary
contact between PAC and GYCA. Our isolation–migration
results support the latter, showing that the contribution of
GYCA into PAC occurred nearly 1 Ma. Clustering analyses
also revealed individuals assigned to the SP cluster to have
GYCA haplotypes, suggesting a more contemporary contri-
bution from PAC into GYCA (c. 600,000 years ago).
The Great American Biotic Interchange and
diversification of Boa
The Miocene fossil (Head et al., 2012) indicates that a Boa
species was present in CA around 19.3 Ma, suggesting a
transcontinental pre-GABI dispersal similar to those observed
in Neotropical colubroid and viperid snakes. Considering the
accelerated rate of mitochondrial DNA evolution in snakes
(Kumazawa & Nishida, 1999), we would expect a higher level
of sequence divergence between lineages if PAC or GYCA
had originated from older dispersal events. Our lineages
reveal a more recent spread and diversification of Boa into
Mexico and CA, in accordance with the interruption of gene
flow between Central and South America proposed by Head
et al. (2012). Moreover, the split between PAC and GYCA
around 5.2 Ma and the oldest diversification events within
each lineage (3 and 2 Ma, respectively) support the hypothe-
sis of the role of the GABI on their diversification (Green,
2011). The closure of the Isthmus of Panama (7–3.5 Ma),
the final uplift of the Colombian Andes (4–3.5 Ma) and the
maximum GABI large-scale dispersion (3.1–2.5 Ma; Coates
& Obando, 1996; Woodburne, 2010) are in agreement with
our estimated divergence and dispersal of PAC and GYCA.
Taxonomic and conservation implications
The present work provides invaluable and novel information
about this charismatic species. Our results show high levels
of nuclear and mitochondrial diversity within B. c. imperator,
which is of crucial conservation value. Few studies have per-
formed analyses with these genetic markers and none within
the geographical range we evaluated. Boas have been geneti-
cally studied with microsatellites in natural (Green, 2011)
and introduced (V�azquez-Dom�ınguez et al., 2012; Reynolds
et al., 2013b) island populations, revealing similar heterozy-
gosity values but lower allelic diversity than in the present
study.
The presence of two reciprocally monophyletic lineages
based on mtDNA, together with similar structure between
microsatellites clusters, are in agreement with the genetic
criteria established for the recognition of evolutionarily signif-
icant units (ESUs; Moritz, 1994); we therefore consider PAC
and GYCA as ESUs. Although B. c. imperator has been recog-
nized throughout Mexico and Central America as a subspe-
cies, also recently proposed as B. imperator (Reynolds et al.,
2014), our findings of two major lineages and a region of
potential secondary contact provide evidence that they can be
considered to be two distinct species under a lineage species
concept (de Queiroz, 2007), which should be confirmed using
coalescent species-delimitation methods. Moreover, our infor-
mation highlights the need for the taxonomic status and spe-
cies delimitation to be reviewed within the entire Boa
constrictor complex. The latter has important conservation
consequences considering the vulnerable and legally protected
status of the species in many countries, including Mexico.
ACKNOWLEDGEMENTS
Our immense gratitude goes to the following curators and
collections that provided tissue loans: Rafe M. Brown
(NHM, University of Kansas), Oscar Flores-Villela (MZFC,
Facultad de Ciencias, UNAM), Eduardo Gonz�alez-Correa
(RVSBR, Veracruz), David Lazcano-Villarreal (Facultad de
Ciencias Biol�ogicas, UANL), Jimmy A. McGuire (MVZ, Uni-
versity of California-Berkeley), Gregory J. Watkins-Colwell
(PMNH, Yale University), Kevin de Queiroz (USNM, Smith-
sonian Institution) and Stephen P. Rogers (CMNH, Carnegie
Museum of Natural History). We thank Omar Becerra, Itzu�e
Caviedes, Alfredo Cuar�on, Denisse Garc�ıa, Cristopher
Gonz�alez, Gualberto Pacheco, Gabriela Parra, Sergio P�erez,
Francisco Reyes, Eunice Romero, Armando Soto, David
Valenzuela and Bibiana Trivi~no for sharing samples and/or
fieldwork support. Alejandro Gonz�alez and Daniel Valle pro-
vided technical and computational support and Susette Cas-
te~neda provided molecular advice. Special thanks go to
Alexander McKelvy, Edward Myers, Sara Ruane and Xin
Chen for help with numerous analyses. We thank the editor
and three anonymous referees for helpful comments on ear-
lier versions of this manuscript. This paper constitutes a
partial fulfilment of the Graduate Program in Biological
Sciences of the National Autonomous University of Mexico
(UNAM). E.V.D. received financial support from CONACyT
(Grant 101861) and Papiit (IN217910). M.S.A. acknowledges
the scholarship and financial support provided by the
National Council of Science (CONACyT 346511), Scholar-
ship Program for Postgraduate Studies (PAEP) and UNAM.
Scientific collector permit to E.V.D.: Semarnat-FAUT-0168.
REFERENCES
Albino, A.M. & Carlini, A.A. (2008) First record of Boa con-
strictor (Serpentes, Boidae) in the Quaternary of South
America. Journal of Herpetology, 42, 82–88.
Arteaga, M.C., Pi~nero, D., Eguiarte, L.E., Gasca, J. &
Medell�ın, R.A. (2012) Genetic structure and diversity of
Journal of Biogeographyª 2014 John Wiley & Sons Ltd
11
Phylogeography of Boa constrictor imperator
the nine-banded armadillo in Mexico. Journal of Mammal-
ogy, 93, 547–559.
Beerli, P. (2007) Estimation of the population scaled
mutation rate from microsatellite data. Genetics, 177,
1967–1968.
Beheregaray, L.B. (2008) Twenty years of phylogeography:
the state of the field and the challenges for the Southern
Hemisphere. Molecular Ecology, 17, 3754–3774.
Bertona, M. & Chiaraviglio, M. (2003) Reproductive biology,
mating aggregations and sexual dimorphism of the Argen-
tine Boa Constrictor (Boa constrictor occidentalis). Journal
of Herpetology, 37, 510–516.
Booth, W., Johnson, D.H., Moore, S., Schal, C. & Vargo,
E.L. (2011) Evidence for viable, non-clonal but fatherless
Boa constrictors. Biology Letters, 7, 253–257.
Bryson, R.W., Jr, Garc�ıa-V�azquez, U.O. & Riddle, B.R.
(2011) Phylogeography of Middle American gophersnakes:
mixed responses to biogeographical barriers across the
Mexican Transition Zone. Journal of Biogeography, 38,
1570–1584.
Burbrink, F.T. (2005) Inferring the phylogenetic position of
Boa constrictor among the Boinae. Molecular Phylogenetics
and Evolution, 34, 167–180.
Burbrink, F.T., Lawson, R. & Slowinski, J.B. (2000) Mito-
chondrial DNA phylogeography of the polytypic North
American rat snake (Elaphe obsoleta): a critique of the sub-
species concept. Evolution, 54, 2107–2118.
Casas-Andreu, G. & Trujillo, T. (1990) Herpetofauna (anfibi-
os y reptiles). Mapa IV.8.6. Atlas Nacional de M�exico, Vol.
III. Instituto de Geograf�ıa, UNAM, M�exico.
Castoe, T.A., Daza, J.M., Smith, E.N., Sasa, M.M., Kuch, U.,
Campbell, J.A., Chippindale, P.T. & Parkinson, C.L.
(2009) Comparative phylogeography of pitvipers suggests
a consensus of ancient Middle American highland bioge-
ography. Journal of Biogeography, 36, 88–103.
Coates, A.G. & Obando, J.A. (1996) The geologic evolution
of the Central American isthmus. Evolution and environ-
ment in tropical America (ed. by J.B.C. Jackson, A.F. Budd
and A.G. Coates), pp. 21–56. University of Chicago Press,
Chicago, IL.
Colston, T.J., Grazziontin, F.G., Shepard, D.B., Vitt, L.J.,
Colli, G.R., Henderson, R.W., Hedges, S.B., Bonatto, S.,
Zaher, H., Noonan, B.P. & Burbrink, F.T. (2013) Molecu-
lar systematics and historical biogeography of tree boas
(Corallus spp.). Molecular Phylogenetics and Evolution, 66,
953–959.
Daza, J.M., Smith, E.N., P�aez, V.P. & Parkinson, C.L. (2009)
Complex evolution in the Neotropics: the origin and
diversification of the widespread genus Leptodeira (Serpen-
tes: Colubridae). Molecular Phylogenetics and Evolution, 53,
653–667.
Daza, J.M., Castoe, T.A. & Parkinson, C.L. (2010) Using
regional comparative phylogeographic data from snake lin-
eages to infer historical processes in Middle America. Ecog-
raphy, 33, 343–354.
Destro-Bisol, G., Spedini, G. & Pascali, V.L. (2000) Applica-
tion of different genetic distance methods to microsatellite
data. Human Genetics, 106, 130–132.
Devitt, T.J. (2006) Phylogeography of the Western Lyresnake
(Trimorphodon biscutatus): testing aridland biogeographical
hypotheses across the Nearctic–Neotropical transition.
Molecular Ecology, 15, 4387–4407.
D�ıaz-Mu~noz, S.L. (2011) Role of recent and old riverine bar-
riers in fine-scale population genetic structure of Geoff-
roy’s tamarin (Saguinus geoffroyi) in the Panama Canal
watershed. Ecology and Evolution, 2, 298–309.
Drummond, A.J. & Rambaut, A. (2007) BEAST: Bayesian
evolutionary analysis by sampling trees. BMC Evolutionary
Biology, 7, 214.
Excoffier, L. & Lischer, H.E.L. (2010) ARLEQUIN suite ver
3.5: a new series of programs to perform population
genetics analyses under Linux and Windows. Molecular
Ecology Research, 10, 564–567.
Fu, Y.-X. (1997) Statistical tests of neutrality of mutations
against population growth, hitchhiking and background
selection. Genetics, 147, 915–925.
Fu, Y.-X. & Li, W.-H. (1993) Statistical tests of neutrality of
mutations. Genetics, 133, 693–709.
Garc�ıa, A. (2006) Using ecological niche modeling to identify
diversity hotspots for the herpetofauna of Pacific lowlands
and adjacent interior valleys of Mexico. Biological Conser-
vation, 130, 25–46.
Goldstein, D.B., Ruiz-Linares, A., Cavalli-Sforza, L.L. &
Feldman, M.W. (1995) Genetic absolute dating based on
microsatellites and the origin of modern humans. Pro-
ceedings of the National Academy of Sciences USA, 92,
6723–6727.
Green, S.E.W. (2011) Evolutionary biology and conservation of
Hog Island Boa constrictor. PhD Thesis, University of
Kent, Canterbury, UK.
Guillot, G., Mortier, F. & Estoup, A. (2005) Geneland: a
computer package for landscape genetics. Molecular Ecol-
ogy Notes, 5, 712–715.
Guo, S.W. & Thompson, E.A. (1992) Performing the exact
test of Hardy-Weinberg proportion for multiple alleles.
Biometrics, 48, 361–372.
Guti�errez-Garc�ıa, T.A. & V�azquez-Dom�ınguez, E. (2012)
Biogeographically dynamic genetic structure bridging two
continents in the monotypic Central American rodent
Ototylomys phyllotis. Biological Journal of the Linnean
Society, 107, 593–610.
Guti�errez-Garc�ıa, T.A. & V�azquez-Dom�ınguez, E. (2013)
Consensus between genes and stones in the biogeographic
and evolutionary history of Central America. Quaternary
Research, 79, 311–324.
Hasb�un, C.R., G�omez, A., K€ohler, G. & Lunt, D.H. (2005)
Mitochondrial DNA phylogeography of the Mesoamerican
spiny-tailed lizards (Ctenosaura quinquecarinata complex):
historical biogeography, species status and conservation.
Molecular Ecology, 14, 3095–3107.
Journal of Biogeographyª 2014 John Wiley & Sons Ltd
12
M. Su�arez-Atilano et al.
Head, J.J., Rincon, A.F., Suarez, C., Montes, C. & Jaramillo,
C. (2012) Fossil evidence for earliest Neogene American
faunal interchange: Boa (Serpentes, Boinae) from the early
Miocene of Panama. Journal of Vertebrate Paleontology, 32,
1328–1334.
Hern�andez-Canchola, G. (2013) Filogeograf�ıa de Sturnira lili-
um (Chiroptera: Phyllostomidae) en Mesoam�erica. MSc
Thesis, UNAM, Mexico.
Hey, J. & Nielsen, R. (2004) Multilocus methods for estimat-
ing population size, migration rates and divergence time,
with applications to the divergence of Drosophila pseud-
oobscura and D. persimilis. Genetics, 167, 747–760.
Huson, D.H. & Bryant, D. (2006) Application of phyloge-
netic networks in evolutionary studies. Molecular Biology
and Evolution, 23, 254–267.
Hynkov�a, I., Starostov�a, Z. & Frynta, D. (2009) Mitochon-
drial DNA variation reveals recent evolutionary history of
main Boa constrictor clades. Zoological Science, 26,
623–631.
Jiang, Z.J., Castoe, T.A., Austin, C.C., Burbrink, F.T., Herron,
M.D., McGuire, J.A., Parkinson, C.L. & Pollock, D.D.
(2007) Comparative mitochondrial genomics of snakes:
extraordinary substitution rate dynamics and functionality
of the duplicate control region. BMC Evolutionary Biology,
7, 123.
Johnson, C.A. & Harrison, C.G.A. (1989) Tectonics and vol-
canism in Central Mexico: a landsat thematic mapper per-
spective. Remote Sensing of Environment, 28, 273–286.
Kumazawa, Y. & Nishida, M. (1999) Complete mitochon-
drial DNA sequences of the green turtle and blue-tailed
mole skink: statistical evidence for archosaurian affinity of
turtles. Molecular Biology and Evolution, 16, 784–792.
Langhammer, J.K. (1983) A new subspecies of boa constric-
tor, Boa constrictor melanogaster, from Ecuador (Serpentes:
Boidae). Tropical Fish Hobbyist, 32, 70–79.
Librado, P. & Rozas, J. (2009) DnaSP v5: a software for com-
prehensive analysis of DNA polymorphism data. Bioinfor-
matics, 25, 1451–1452.
Miller, W.E. (1980) The late Pliocene Las Tunas local fauna
from southernmost Baja California, Mexico. Journal of
Paleontology, 54, 762–805.
Moritz, C.C. (1994) Defining ‘evolutionary significant
units’ for conservation. Trends in Ecology and Evolution, 9,
373–375.
Morrone, J.J. (2006) Biogeographic areas and transition
zones of Latin America and the Caribbean islands based
on panbiogeographic and cladistic analyses of the entomo-
fauna. Annual Review of Entomology, 51, 467–494.
Mulcahy, D.G. (2008) Phylogeography and species bound-
aries of the western North American Night snake (Hypsig-
lena torquata): revisiting the subspecies concept. Molecular
Phylogenetics and Evolution, 46, 1095–1115.
Mulcahy, D.G., Morril, B.H. & Mendelson, J.R. (2006)
Historical biogeography of lowland species of toads
(Bufo) across the Trans-Mexican Neovolcanic Belt and the
Isthmus of Tehuantepec. Journal of Biogeography, 33,
1889–1904.
Myers, N. (2003) Biodiversity hotspots revisited. BioScience,
10, 916–917.
Nei, M. & Chesser, R.K. (1983) Estimation of fixation indi-
ces and gene diversities. Annals of Human Genetics, 47,
253–259.
Noonan, B.P. & Chippindale, P.T. (2006) Dispersal and
vicariance: the complex evolutionary history of boid
snakes. Molecular Phylogenetics and Evolution, 40, 347–358.
Olson, D.M., Dinerstein, E., Wikramanayake, E.D., Burgess,
N.D., Powell, G.V.N., Underwood, E.C., D’Amico, J.A.,
Itoua, I., Strand, H.E., Morrison, J.C., Loucks, C.J.,
Allnutt, T.F., Ricketts, T.H., Kura, Y., Lamoreux, J.F.,
Wettengel, W.W., Hedao, P. & Kassem, K.R. (2001)
Terrestrial ecoregions of the world: a new map of life on
Earth. BioScience, 51, 933–938.
van Oosterhout, C., Hutchinson, W.F., Willis, D.P.M. &
Shipley, P. (2004) micro-checker: software for identify-
ing and correcting genotyping errors in microsatellite data.
Molecular Ecology Notes, 4, 535–538.
Parkinson, C.L., Zamudio, K.R. & Greene, H.W. (2000)
Phylogeography of the pitviper clade Agkistrodon: histori-
cal ecology, species status, and conservation of cantils.
Molecular Ecology, 9, 411–420.
Peakall, R. & Smouse, P.E. (2006) genalex 6: genetic analy-
sis in Excel. Population genetic software for teaching and
research. Molecular Ecology Notes, 6, 288–295.
Posada, D. (2008) jModelTest: phylogenetic model averaging.
Molecular Biology and Evolution, 25, 1253–1256.
Price, R. & Russo, P. (1991) Revisionary comments on the
genus Boa with the description of a new subspecies of Boa
constrictor from Peru. Snake, 23, 29–35.
Pritchard, J.K., Stephens, M. & Donnelly, P. (2000) Inference
of population structure using multilocus genotype data.
Genetics, 155, 945–959.
de Queiroz, K. (2007) Species concepts and species delimita-
tion. Systematic Biology, 56, 879–886.
Raymond, M. & Rousset, F. (1995) GENEPOP (version 1.2):
population genetics software for exact test and ecumeni-
cism. Journal of Heredity, 86, 248–249.
Reyes-Velasco, J., Meik, J.M., Smith, E.N. & Castoe, T.A.
(2013) Phylogenetic relationships of the enigmatic long-
tailed rattlesnakes (Crotalus ericsmithi, C. lannomi, and
C. stejnegeri). Molecular Phylogenetics and Evolution, 69,
524–534.
Reynolds, R.G., Niemiller, M.L., Hedges, S.B., Dornburg, A.,
Puente-Rol�on, A.R. & Revell, L.J. (2013a) Molecular phy-
logeny and historical biogeography of West Indian boid
snakes (Chilabothrus). Molecular Phylogenetics and Evolu-
tion, 68, 461–470.
Reynolds, R.G., Puente-Rol�on, A.R., Reed, R.N. & Revell, L.J.
(2013b) Genetic analysis of a novel invasion of Puerto
Rico by an exotic constricting snake. Biological Invasions,
15, 953–959.
Journal of Biogeographyª 2014 John Wiley & Sons Ltd
13
Phylogeography of Boa constrictor imperator
Reynolds, R.G., Niemiller, M.L. & Revell, L.J. (2014) Toward
a Tree-of-Life for the boas and pythons: multilocus spe-
cies-level phylogeny with unprecedented taxon sampling.
Molecular Phylogenetics and Evolution, 71, 201–213.
Rice, W.R. (1989) Analyzing tables of statistical tests. Evolu-
tion, 43, 223–225.
Ruane, S., Bryson, R.W., Pyron, R.A. & Burbrink, F.T.
(2014) Coalescent species in milksnakes (genus Lampropel-
tis) and impacts on phylogenetic comparative analyses.
Systematic Biology, 63, 231–250.
Savage, J.M. (1982) The enigma of the Central American
herpetofauna: dispersal or vicariance? Annals of the
Missouri Botanical Garden, 69, 464–547.
Stephens, M. & Donnelly, P. (2003) A comparison of Bayes-
ian methods for haplotype reconstruction from population
genotype data. American Journal of Human Genetics, 73,
1162–1169.
Tajima, F. (1989) Statistical method for testing the neutral
mutation hypothesis by DNA polymorphism. Genetics,
123, 585–595.
V�azquez-Dom�ınguez, E. & Arita, H.T. (2010) The Yucatan
peninsula: biogeographical history 65 million years in the
making. Ecography, 33, 212–219.
V�azquez-Dom�ınguez, E., Su�arez-Atilano, M., Booth, W.,
Gonz�alez-Baca, C. & Cuar�on, A.D. (2012) Genetic evi-
dence of a recent successful colonization of introduced
species on islands: Boa constrictor imperator on Cozumel
Island. Biological Invasions, 14, 2101–2116.
Woodburne, M.O. (2010) The Great American Biotic Inter-
change: dispersals, tectonics, climate, sea level and holding
pens. Journal of Mammalian Evolution, 17, 242–264.
W€uster, W., Ferguson, J.E., Quijada-Mascare~nas, A., Pook,
C.E., da Grac�a Salom~ao, M. & Thorpe, R.S. (2005) Tracing
an invasion: landbridges, refugia, and the phylogeography
of the Neotropical rattlesnake (Serpentes: Viperidae: Crota-
lus durissus). Molecular Ecology, 14, 1095–1108.
Zamudio, K.R. & Greene, H.W. (1997) Phylogeography of
the bushmaster (Lachesis muta: Viperidae): implications
for neotropical biogeography, systematics, and conserva-
tion. Biological Journal of the Linnean Society, 62, 421–442.
Zarza, E., Reynoso, V.H. & Emerson, B.C. (2008) Diversifica-
tion in the northern neotropics: mitochondrial and
nuclear DNA phylogeography of the iguana Ctenosaura
pectinata and related species. Molecular Ecology, 17,
3259–3275.
SUPPORTING INFORMATION
Additional Supporting Information may be found in the
online version of this article:
Appendix S1 List of samples with locality and genetic
information and GenBank numbers.
Appendix S2 Tables associated with molecular protocols,
phylogenetic methods and results.
Appendix S3 Supplementary methods, results and figures.
BIOSKETCHES
Marco Su�arez-Atilano is a PhD candidate at Ecology
Institute, UNAM. His current research interests include pop-
ulation and landscape genetics, phylogeography and phyloge-
netics of native and invasive reptile species, particularly
snakes.
Frank T. Burbrink examines processes of diversification,
historical ecology, phylogenetics and phylogeography of
reptiles and amphibians across the world.
Ella V�azquez-Dom�ınguez is interested in aspects of
molecular ecology at both local and regional scales, working
with population, conservation and landscape genetics and
phylogeography, in vertebrates, insects and parasites, from
Mexico and Central America.
Editor: Brett Riddle
Journal of Biogeographyª 2014 John Wiley & Sons Ltd
14
M. Su�arez-Atilano et al.
Copyright © 2022 FDOKUMEN