Photocatalytic mineralization of benzene over gold containing titania nanotubes: Role of adsorbed...
8
Photocatalytic mineralization of benzene over gold containing titania nanotubes: Role of adsorbed water and nanosize gold crystallites S.V. Awate, R.K. Sahu, M.D. Kadgaonkar, R. Kumar, N.M. Gupta * Catalysis Division, National Chemical Laboratory, Dr. Homi Bhabha Road, Pune 411008, India 1. Introduction The photo-oxidation of benzene has been investigated earlier, both under aqueous as well as vapor phase reaction conditions. These studies were in general aimed at finding a viable route for purification of air by removal of volatile organic compounds or alternatively to develop a green chemistry route for selectively converting benzene into certain value added products such as phenols [1–13]. Various conflicting observations have, however, been reported. Thus, Fu et al. [1] found that the gas phase photo- degradation of benzene over sol–gel prepared titania gave rise to carbon dioxide and water without forming any detectable organic products and the conversion of benzene was improved on platinum dispersion. Using an aqueous suspension of TiO 2 , Park and Choi [2] reported the direct conversion of benzene to phenol and dihydroxylated products such as hydroquinone and catechol, where OH radicals generated on UV illumination played an important role. Using the techniques of temperature-programmed oxidation and desorption (TPO, TPD), Larson and Falconer [3] showed that the intermediate species formed during photocata- lytic oxidation of aromatics are adsorbed strongly and are less reactive, as compared to the original aromatic reactant. Einaga et al. [4] reported the production of CO 2 and CO during the gas phase decomposition of benzene over TiO 2 at room temperature along with the formation of phenol and certain polymeric products. The oxygen and water vapor present in the reacting stream are found to help in re-oxidation of Ti 3+ to Ti 4+ and in regeneration of surface hydroxyl groups. In a more recent study on liquid phase photo-oxidation of benzene, Shimizu et al. [5] reported the formation of dihydroxy benzenes using cation exchanged BEA zeolites, while phenol and CO 2 were the main reaction products on Degussa P-25 TiO 2 . In an FTIR spectroscopy study on adsorption and reaction over powdered TiO 2 , Wu et al. [8] suggested that the benzene molecules are adsorbed with their p- electrons interacting with surface Ti 4+ ions. The benzene in this adsorbed state was found to be stable even after elevation of sample temperature to 400 8C while the reaction products H 2 O, CO 2 and CO were produced at temperatures lower than 225 8C and only in the presence of oxygen. According to a kinetic study of Doucet et al. [11], the relative humidity plays no role in the primary attack of benzene molecules at titania surface while it helps in the degradation of some surface species. Various aspects of photo- catalytic oxidation of benzene, such as the reaction pathways, role of titania morphology, role of a noble metal co-catalyst, and the contribution of water vapor present in reaction mixture, thus need to be understood clearly. Catalysis Today 141 (2009) 144–151 ARTICLE INFO Article history: Available online 27 May 2008 Keywords: TiO 2 nanotubes Gold containing Photocatalyst Benzene degradation Role of adsorbed water Transient species ABSTRACT Well aligned titania nanotubes, with surface area of 150 m 2 g 1 and average pore diameter of 5 nm, have been synthesized by subjecting a mesoporous TiO 2 sample to alkaline treatment followed by calcination at different temperatures. Composite catalysts with gold particles dispersed in these nanotubes were also synthesized and their structural, morphological, optical and photocatalytic properties were examined. The catalytic activity of TiO 2 for UV-mediated photo-oxidation of benzene was found to be affected by several factors, such as the sample texture, presence of adsorbed water and gold crystallites. The overall conversion of benzene to form CO 2 followed a trend: Au/nanotube > TiO 2 nanotubes > mesoporous TiO 2 . In situ IR spectroscopy revealed that the adsorption and reaction of benzene molecules gave rise to formation of certain phenolic species over TiO 2 , while the temperature- programmed desorption (TPD) study showed that the Au/TiO 2 interfaces serve as distinct sites for the adsorption and activation of oxygen molecules. It is suggested that certain hydroxyl and oxygen ion radicals produced under UV-irradiation may promote the deep oxidation of surface phenolic species and phenoxyl (ArO ) type transient radicals. ß 2008 Elsevier B.V. All rights reserved. * Corresponding author. Tel.: +91 20 2590 2008; fax: +91 20 2590 2633. E-mail address: [email protected] (N.M. Gupta). Contents lists available at ScienceDirect Catalysis Today journal homepage: www.elsevier.com/locate/cattod 0920-5861/$ – see front matter ß 2008 Elsevier B.V. All rights reserved. doi:10.1016/j.cattod.2008.04.008
-
Upload
independent -
Category
Documents
-
view
0 -
download
0
Transcript of Photocatalytic mineralization of benzene over gold containing titania nanotubes: Role of adsorbed...
Photocatalytic mineralization of benzene over gold containing titania nanotubes:Role of adsorbed water and nanosize gold crystallites
S.V. Awate, R.K. Sahu, M.D. Kadgaonkar, R. Kumar, N.M. Gupta *
Catalysis Division, National Chemical Laboratory, Dr. Homi Bhabha Road, Pune 411008, India
Catalysis Today 141 (2009) 144–151
A R T I C L E I N F O
Article history:
Available online 27 May 2008
Keywords:
TiO2 nanotubes
Gold containing
Photocatalyst
Benzene degradation
Role of adsorbed water
Transient species
A B S T R A C T
Well aligned titania nanotubes, with surface area of �150 m2 g�1 and average pore diameter of �5 nm,
have been synthesized by subjecting a mesoporous TiO2 sample to alkaline treatment followed by
calcination at different temperatures. Composite catalysts with gold particles dispersed in these
nanotubes were also synthesized and their structural, morphological, optical and photocatalytic
properties were examined. The catalytic activity of TiO2 for UV-mediated photo-oxidation of benzene
was found to be affected by several factors, such as the sample texture, presence of adsorbed water and
gold crystallites. The overall conversion of benzene to form CO2 followed a trend: Au/nanotube > TiO2
nanotubes > mesoporous TiO2. In situ IR spectroscopy revealed that the adsorption and reaction of
benzene molecules gave rise to formation of certain phenolic species over TiO2, while the temperature-
programmed desorption (TPD) study showed that the Au/TiO2 interfaces serve as distinct sites for the
adsorption and activation of oxygen molecules. It is suggested that certain hydroxyl and oxygen ion
radicals produced under UV-irradiation may promote the deep oxidation of surface phenolic species and
phenoxyl (ArO�) type transient radicals.
� 2008 Elsevier B.V. All rights reserved.
Contents lists available at ScienceDirect
Catalysis Today
journal homepage: www.elsevier.com/locate/cattod
1. Introduction
The photo-oxidation of benzene has been investigated earlier,both under aqueous as well as vapor phase reaction conditions.These studies were in general aimed at finding a viable route forpurification of air by removal of volatile organic compounds oralternatively to develop a green chemistry route for selectivelyconverting benzene into certain value added products such asphenols [1–13]. Various conflicting observations have, however,been reported. Thus, Fu et al. [1] found that the gas phase photo-degradation of benzene over sol–gel prepared titania gave rise tocarbon dioxide and water without forming any detectable organicproducts and the conversion of benzene was improved onplatinum dispersion. Using an aqueous suspension of TiO2, Parkand Choi [2] reported the direct conversion of benzene to phenoland dihydroxylated products such as hydroquinone and catechol,where OH radicals generated on UV illumination played animportant role. Using the techniques of temperature-programmedoxidation and desorption (TPO, TPD), Larson and Falconer [3]showed that the intermediate species formed during photocata-lytic oxidation of aromatics are adsorbed strongly and are less
* Corresponding author. Tel.: +91 20 2590 2008; fax: +91 20 2590 2633.
E-mail address: [email protected] (N.M. Gupta).
0920-5861/$ – see front matter � 2008 Elsevier B.V. All rights reserved.
doi:10.1016/j.cattod.2008.04.008
reactive, as compared to the original aromatic reactant. Einagaet al. [4] reported the production of CO2 and CO during the gasphase decomposition of benzene over TiO2 at room temperaturealong with the formation of phenol and certain polymericproducts. The oxygen and water vapor present in the reactingstream are found to help in re-oxidation of Ti3+ to Ti4+ and inregeneration of surface hydroxyl groups. In a more recent study onliquid phase photo-oxidation of benzene, Shimizu et al. [5]reported the formation of dihydroxy benzenes using cationexchanged BEA zeolites, while phenol and CO2 were the mainreaction products on Degussa P-25 TiO2. In an FTIR spectroscopystudy on adsorption and reaction over powdered TiO2, Wu et al. [8]suggested that the benzene molecules are adsorbed with their p-electrons interacting with surface Ti4+ ions. The benzene in thisadsorbed state was found to be stable even after elevation ofsample temperature to 400 8C while the reaction products H2O,CO2 and CO were produced at temperatures lower than 225 8C andonly in the presence of oxygen. According to a kinetic study ofDoucet et al. [11], the relative humidity plays no role in the primaryattack of benzene molecules at titania surface while it helps in thedegradation of some surface species. Various aspects of photo-catalytic oxidation of benzene, such as the reaction pathways, roleof titania morphology, role of a noble metal co-catalyst, and thecontribution of water vapor present in reaction mixture, thus needto be understood clearly.
S.V. Awate et al. / Catalysis Today 141 (2009) 144–151 145
In a recent study [14], we reported that the gold nanocrys-tallites dispersed in mesoporousTiO2 serve as distinct oxygenadsorption sites and give rise to enhanced photocatalytic activityfor vapor phase oxidation of volatile organic compounds. Utilizingsimilar mesoporous TiO2 as precursor, we have now synthesizedtitania samples of tubular morphology with an objective to furtheraugment the number of adsorption sites and to facilitate thetransport of reactant molecules through their porous network. Theprocedure described in some of the earlier studies [15–18] hasbeen adopted for this purpose. Corresponding gold containing TiO2
nanotubes were prepared by impregnation. The present commu-nication deals with physico-chemical properties of Au/TiO2
nanotubes and their photocatalytic activity for benzene oxidation.The transient species formed over TiO2 and Au/TiO2 surfaces afterexposure to benzene + air, without and in presence of moisture,were examined with the help of in situ Fourier-transform infrared(FTIR) spectroscopy. Effect of gold crystallites on adsorptioncharacteristics of different samples was also investigated byrecording the temperature-programmed desorption of oxygen(TPD-O2). The reaction pathways involved in photocatalyticoxidation of benzene and the role played by gold nanocrystallitesin the process have been elucidated on the basis of thesemeasurements.
2. Experimental
The titania nanotubes were synthesized by utilizing amesoporous TiO2 sample, the details of which are describedearlier [14], as precursor. For the preparation of this TiO2 about10 ml of Ti(IV) isopropoxide (Aldrich) was added slowly to 1N HClcontaining tartaric acid (3.6 g). The HCl/alkoxide ratio was �1 andthe solution was stirred constantly for a period of about 1 h. Themixture was then heated at 403 K for 24 h in a teflon-linedautoclave. After cooling and centrifugation, the mass was dried(373 K) and finally calcined at 623 K for �3 h. This sample isdenoted as T1 in the text.
For the preparation of TiO2 nanotubes, 2 g of sample T1 wasstirred with 10 M NaOH solution in a sealed polythene reactor, andwas maintained at a temperature of 393 K for 3 days. HCl solutionwas then added drop wise until the pH was �1.5, followed bystirring for 24 h. After centrifugation, the precipitate was washedseveral times with water. The mass was finally freeze-dried (230 K)for 24 h. This sample, referred to as as-synthesized nanotube (T2),was subjected to calcination for 3 h at three different tempera-tures, i.e. 423, 523 and 623 K, and the samples are denoted,respectively, as T3, T4 and T5 (Table 1). For incorporation of gold, arepresentative nanotube sample T3 was impregnated withisopropanol solution of tetrachloroauric acid. After drying, thesample was heated again in air at 423 K and contained �1 wt% ofgold (denoted as Au/T3).
The catalysts were characterized for their structural, optical andphotocatalytic properties. The powder XRD patterns were recorded
Table 1Textural properties of titania samples as a function of calcination temperature
Serial no. Sample
notation
Calcination
temperature (K)
BET surface
area (m2/g)
1 T1a – 92.0
2 T2 As-synthesized 193.1
3 T3 423 176.5
4 T4 523 148.6
5 T5 623 77.5
T2–T5, titania nanotubes calcined at different temperatures.a Precursor mesoporous TiO2 sample.# From XRD data using Sherrer’s equation.
on a Rigaku, Miniflex (D Max III VC) XRD machine (Cu Karadiation), operated at 30 kV and 15 mA. TEM images wereobtained on a JEOL-2010 CX microscope. The information aboutthe BET surface area and the pore characteristics of differentsamples was derived from the low-temperature nitrogen adsorp-tion isotherms, recorded on a Quantachrome, NOVA 1200equipment. Prior to recording of these data, the sample wastreated at 573 K under vacuum (10�3 Torr) to remove thephysisorbed moieties. The BJH formulation was employed toobtain the pore size distribution data. The absorbance spectra wererecorded on PerkinElmer (Lambda 650) UV–vis diffuse-reflectance(DR) spectrophotometer. About 3 wt% of a sample was mixedthoroughly in barium sulphate for these measurements. In order tomonitor the thermal properties, simultaneous TG/DTA plots werecollected under argon atmosphere using an as-synthesized TiO2
nanotube sample.XPS analysis was performed on a VG Scientific ESCA-3000
spectrometer, operating at 150 W at a pressure of 10�9 Torr. Thespectra were acquired using non-monochromatized Mg Karadiation (1253.6 eV). The binding energy of XPS peaks wasreferenced to C1s line at 284.6 eV for charge compensation.
Experiments on the temperature-programmed desorption ofsaturation-covered oxygen were performed on a MicromeriticsAutochem 2910 instrument. About 0.25 g of a fresh sample wasplaced in a U-shaped flow-through, quartz microreactor for eachexperiment. The sample was activated at 600 K for 3 h under Heflow (20 ml min�1) and then cooled to ambient temperature beforebeing exposed to O2 (�20 vol% in He) flow for 30 min. The samplewas flushed again with He for about 15 min to remove physisorbedoxygen, and a desorption profile was then recorded by increasingthe sample temperature to 1000 K at a ramp rate of 10 K/min.
The photocatalytic oxidation of benzene was performed underUV radiation (400 W medium-pressure mercury vapor lamp, UVoutput 15–20%, range 225–400 nm, peak at 365 nm). The lightsource was housed in a water-cooled quartz jacket to cut-offinfrared radiation. 25 mg of a sample was placed in a quartz photo-reactor of 100 ml capacity and the benzene vapor mixed atdifferent mol ratios (0.7–3.0 mol%) in air was introduced in thereactor for activity measurement. The experiments were con-ducted at room temperature and the reaction products formed as afunction of radiation exposure were analyzed periodically with thehelp of Shimadzu model-R-15A gas chromatograph (Porapak-Qcolumn, TCD detector).
In situ FTIR experiments were conducted both in the diffuse-reflectance and transmittance modes. A Shimadzu SSU-8000spectrophotometer was used for DR study, and about 10 mgcatalyst powder was packed in the sample holder for this purpose.The sample was kept under air flow for several hours prior to itsexposure to �10 ml mixture of benzene vapor (10 mol%) + air andthe IR spectrum was recorded after a lapse of �5 min. For thetransmittance mode experiments, a self-supporting sample wafer(�80 mg) was placed in a stainless steel cell fitted with water-
Total pore
volume (cm3/g)
Average pore
diameter (nm)
Crystallite
size# (nm)
– 4.0 14.0
0.26 5.4 6.3
0.24 5.5 6.3
0.19 5.0 8.1
0.17 – 10.0

Fig. 2. Low-temperature nitrogen adsorption isotherms of titania nanotubes
calcined at different temperatures. (a) T3, (b) T4, (c) T5. Sample notations as
described in Table 1.
S.V. Awate et al. / Catalysis Today 141 (2009) 144–151146
cooled CaF2 windows [19]. The cell, equipped for in situ heattreatment under vacuum, was mounted on a Thermo Nicole(model–Nexus 870) spectrometer. The sample was activated at600 K under vacuum for several hours, followed by cooling to roomtemperature and exposure to benzene (10 mol%) + air at the cellpressure of �100 Torr. Normally 200 scans were averaged out foreach plot at a resolution of 4 cm�1. The sample spectrum recordedprior to benzene adsorption was compensated for plotting of the IRbands arising exclusively due to surface adsorbed species.
3. Results and discussion
The textural properties of samples T1–T5, as derived from N2-adsorption results, are listed in Table 1. As-synthesized nanotubesamples were of smaller crystallite size and accordingly highersurface area, as compared to sample T1. As shown in Table 1, thesurface area decreased progressively on calcination at highertemperatures. Curves (a–d) in Fig. 1 exhibit the powder XRDprofiles of TiO2 nanotube samples calcined at different tempera-tures. Curve (e) shows the comparative XRD pattern of acommercial TiO2 sample (E. Merck, India). The as-synthesizedsample (T2) shows prominent XRD reflections at 2u values of ca.25.18, 37.98, 488 and 53.98, representing (1 0 1), (0 0 4), (2 0 0) and(1 0 5) lattice planes of anatase TiO2 (curve (a)). We also observe aweak reflection at 2u = 27.38 due to (1 1 0) plane of rutile phase,indicating its presence in a small concentration (curve (a)). Thewidth of the XRD lines decreased with increase in calcinationtemperature (Fig. 1b–d). The broadening observed in these XRDlines in comparison to Fig. 1e is a characteristic feature of small(nano) size particles. The average size of crystallites in differentsamples, as estimated by using Scherrer’s equation for I1 0 0
reflection at 25.18, is listed in Table 1. Calcination at a highertemperature of 623 K resulted in the complete removal of rutilephase (curves (d)).
All the samples exhibited a mesoporous character, as indicatedby the representative N2-adsorption/desorption isotherms inFig. 2. The surface area of the samples decreased progressively
Fig. 1. XRD profiles of nanotubes prepared from mesoporous TiO2 and calcined at
different temperatures: (a) as-synthesized (T2), (b) 423 K (T3), (c) 523 K (T4) and (d)
623 K (T5). Curve (e) shows XRD pattern of a commercial TiO2 sample (E. Merck) for
comparison.
on calcination at elevated temperatures (Table 1). The effect ofcalcination on pore size distribution is shown in Fig. 3. Theseresults reveal the presence of at least two kinds of mesopores in thelow-temperature calcined samples, majority being of 40–42 nmsize and a smaller number having a diameter in range 50–100 nm(Fig. 3a and b). Calcination at 523 K resulted in a marginal increaseof larger size pores (Fig. 3b). A wide range pore size distributionwas however observed for further increase in calcinationtemperature to 623 K (curve (c)), which may be ascribed tounfolding of titania layers as a result of the release of trappedmoisture or template molecules.
3.1. TEM results
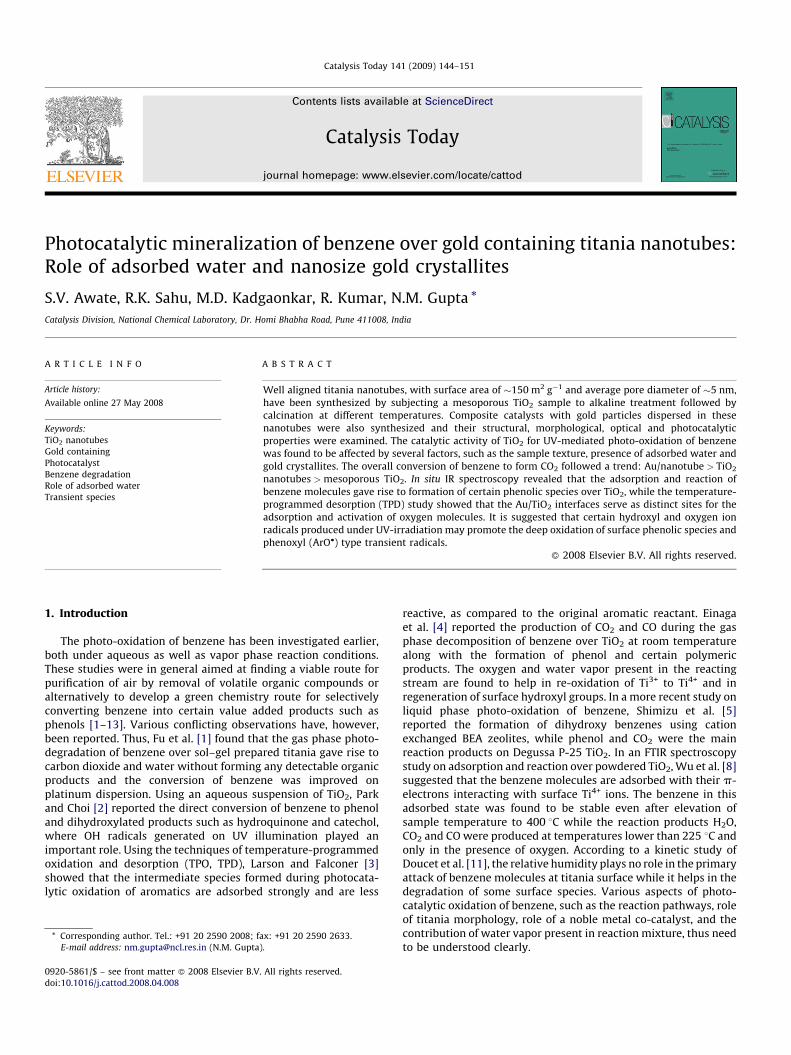
Fig. 4A shows the representative TEM picture of sample T3. Thelength, the outer diameter and the inner diameter of the multi-wallnanotubes seen in this figure are estimated to be in the ranges of60–300, 9–14 and 4–7 nm, respectively. In most of the cases thetubes appear to be in random orientations and are open at both theends. The TEM pictures of the gold containing samples indicatedthe size of gold particles to be around 10–20 nm, as seen in arepresentative micrograph in Fig. 4B for sample Au/T3. The TEMimages of sample T4 revealed marginally greater outer diameterand wider tube openings. No clear pictures could however beobtained for sample T5.
3.2. XPS analysis
Au4f XPS spectrum of Au/T3 sample exhibited peaks at thebinding energy (B.E.) values of 84.3 and 87.9 eV for 4f7/2 and 4f5/2
electrons (not shown). These XPS spectra matched well, both in B.E.
Fig. 3. Pore size distribution curves of titania nanotubes calcined at different
temperatures: (a) T3, (b) T4 and (c) T5. Sample notations as described in Table 1.
Fig. 4. TEM images of samples (A) T3 and (B) Au/T3.
S.V. Awate et al. / Catalysis Today 141 (2009) 144–151 147
and peak width, with the corresponding data recorded for a puregold powder sample and also with the XPS data reported for smallgold particles [20]. Similarly, the Ti 2p1/2 and 2p3/2 signals wereobserved at B.E. values of 464.6 and 458.9 eV for gold-free titania(sample T1), which correspond well with the values reported formesostructured TiO2 [21].
Overall, the XPS results matched with the mesoporous nature ofour titania samples and confirmed the zero valent state ofdeposited gold.
3.3. Thermal analysis
Fig. 5 exhibits differential thermal analysis (DTA) anddifferential thermal gravimetry (DTG) curves, recorded on as-synthesized titania nanotube sample (T2). An endotherm peakingat�400 K corresponds to a major weight loss in temperature range300–475 K and can be correlated with the release of adsorbedwater. At higher temperatures, we see small step-wise weight loss,with the associated high endothermicity. Since the substrate wasfree of any other contamination, we attribute these observations tothe collapse of nanotube structure on removal of water or trappedtartaric acid molecules. These observations are in agreement withthe pore size distribution data of Fig. 3c.
3.4. Optical absorption properties
Curves (b) and (c) in Fig. 6 present the diffuse-reflectance UV–vis spectra of representative samples T3 and Au/T3, respectively.Curve (a) shows comparative spectrum of precursor TiO2 sampleT1. As compared to titania nanotubes (T3), the absorbance in UVregion is found to increase considerably on gold dispersion (curve(c)). In addition to the changes in the intensity of absorbance
spectrum, a shift to lower wavelength is also noticeable in spectra(b) and (c) of Fig. 6. We also observe a marked increase in thevisible region absorbance in the case of gold-doped sample. Thebroad absorbance band in 500–700 nm region in curve (c)corresponds to the well-reported plasmon resonance associatedwith nano-structured gold particles.
3.5. Photocatalytic activity
Fig. 7 displays the batch mode photocatalytic activity ofrepresentative samples T3 and Au/T3 for oxidation of benzene(0.7–3.0 mol% in air) under ultraviolet-irradiation, where CO2 andwater were the main reaction products. The precursor TiO2 sampleT1 showed only negligible activity even after about 5 h ofirradiation time (curve (a)). A conversion to the extent of about10% benzene to CO2 was, however, observed when some water(�100 mmol) was introduced in the reaction cell. These results arepresented in curve (a) of Fig. 7. Higher conversion of benzene wasobserved for the gold-containing samples, both under dry andmoist conditions. Also, the conversion was higher for the reactionmixtures containing lower benzene concentration in air. Curves(b–d) in Fig. 7 show the typical CO2 yields when benzene mixed inair at different molar concentrations was reacted over Au/T3 in thepresence of UV radiation. As in the case of data in curve (a),addition of water in the reaction mixture gave rise to much higher

Fig. 5. DTA and DTG plots of un-calcined titania nanotubes (sample T2).
S.V. Awate et al. / Catalysis Today 141 (2009) 144–151148
yields of CO2 in the experiments over Au/T3 as well. The typicaleffect of water addition on the photocatalytic activity of Au/T3 isshown in Fig. 7e.
3.6. Temperature-programmed desorption of surface adsorbed
oxygen
Fig. 8 exhibits the TPD-O2 profiles of some representative titaniasamples. The non-porous E. Merck TiO2 sample showed very weakadsorption of oxygen, as seen in a broad peak at�460 K in curve (a)of this figure. On the other hand, an intense O2-desorption band at atemperature maximum (Tm) of�760 K and a weak shoulder peak at620 K were observed in the case of mesoporous sample T1 (Fig. 8,curve (b)). Considering the energy requirement for desorption fromdifferent possible sites of TiO2, the 620 K band may be attributed toO2 held at the external surface and 760 K band to the moleculesoccluded in the mesopores. The nanotube sample T3 at the sametime showed an additional high temperature desorption peak at
Fig. 6. Diffuse-reflectance UV–vis spectra of samples (b) T3 and (c) Au/T3. Curve (a)
shows a comparative spectrum of E. Merck TiO2 sample.
870 K (curve (c)), which may be ascribed to the O2 molecules trappedin narrow tubular structures of this sample. Furthermore, thepresence of gold resulted in considerable decrease in the intensity of760 K band and at the same time a new desorption band wasobserved at�550 K, instead of a shoulder band in curves (b) and (c).A typical TPD-O2 profile of sample Au/T3 is shown in Fig. 8d. Thisnew desorption band at 550 K can be identified with the adsorptionof O2 at Au-TiO2 interfacial sites. The decreased intensity of thehigher temperature peaks in Fig. 8d may be ascribed to the blockageof some mesopores/tubular structures in sample T3 because of theoccluded gold crystallites. This is in agreement with our N2-adsorption results.
Fig. 7. Yield of CO2 as a function of radiation dose when air mixed with different
mole percent of benzene vapor reacted over Au (1%)/T3 catalyst under UV-
irradiation. Curve (b) 2.3, (c) 1.5, (d) 0.78, and (e) 0.74 mol%. Curve (a) presents
similar data for gold-free sample T3. The arrow shown on curves (a) and (e) indicate
the change of reaction rate on addition of 150 mmol of water in the reaction cell.

Fig. 8. Temperature-programmed desorption of saturation-covered O2 from: (a)
commercial (Merck) TiO2, (b) mesoporous TiO2 (sample T1), (c) TiO2 nanotubes
(sample T3) and (d) Au (1 wt%)/T3.
Fig. 9. Difference IR spectrum (DRIFT) of TiO2 nanotubes (sample T3) exposed to
benzene vapor (10 mol%) + air at room temperature (curve (a)). Curves (b) and (c),
respectively show the IR spectra of liquid benzene and phenol in CCl4.
S.V. Awate et al. / Catalysis Today 141 (2009) 144–151 149
Overall, our TPD results reveal that the presence of gold givesrise to certain new adsorption sites at Au-TiO2 interfaces for theadsorption and activation of O2 molecules. These O2 moleculesmay in turn assist the photo-oxidation process (Fig. 7) by way ofcertain oxygen ion radicals generated on interaction with e�/h+
pair, as described below.
3.7. Infrared spectroscopy of surface adsorbed species
The uncompensated diffuse-reflectance infrared (DRIFT) spec-trum of air-exposed nanotube sample T3 (not shown), flushed innitrogen and with no benzene exposure, showed a broad band at948 cm�1 representing the lattice vibrations of titanium dioxide, inaddition to well-reported absorption bands in 3800–3000 cm�1
region and at 1635 cm�1 due to the O–H stretching anddeformation vibrations of surface hydroxyl or adsorbed watermolecules [22].
Curve (a) in Fig. 9 exhibits the spectrum of sample T3, recordedafter exposure at room temperature to benzene vapor + air andplotted after compensating for the vibrational bands of an un-exposed wafer. This spectrum reveals the removal of n(OH) IRbands at 3740 and 3694 cm�1 (negative IR bands), indicating theactive participation of water molecules and the surface hydroxylgroups during interaction of benzene molecules with TiO2. Toidentify the vibrational bands in 3600–1000 cm�1 region in Fig. 9a,the IR spectra of liquid benzene and phenol (�1 mol% solution inCCl4) are shown in curves (b) and (c), respectively, of Fig. 9. Weobserve that the spectrum in Fig. 9a does not match completelywith either of the two spectra in curves (b) and (c). Also, thespectrum in Fig. 9a finds no match with the IR spectra of otherpossible benzene derivatives, such as hydroquinone and catechol.Comparing with the spectrum in Fig. 9b, the IR band at 1478 cm�1
(in-plane C–C stretching, n19), combination 3037 cm�1 band (C–Cstretching, n19 + C–C stretching, n8) and a band at 3090 cm�1 (C–Hstretching, n20) may be identified with the correspondingvibrations of liquid benzene [23]. The relative intensity of thesebands is, however, quite different. For instance, the intensity ratioof 1478 and 3037 cm�1 band is around 1 in Fig. 9b as compared tothe value of �2.5 in Fig. 9a. We also observe a considerable shift inthe frequency of the out-of-plane benzene vibrations in theadsorbed species. Thus, the vibrational bands at 1814 cm�1 [C–H?bending, n17 + C–H? bending, n10] and 1958 cm�1 [C–H? bending,
n17 + C–H? bending, n5] in Fig. 9b are found to shift to a higherfrequency by �12 cm�1 in Fig. 9a. Again, the intensity of thesebands decreases considerably in the adsorbed state in comparisonwith the n19 band at 1478 cm�1. In addition to these features, wealso observe a complete absence of several other benzenevibrations in Fig. 9a. For instance, no out-of-plane IR bands at1529 cm�1 (n11 + n10) and 1392 cm�1 (n16 + n5) are seen in Fig. 9ain addition to several other weak bands (cf. Fig. 9b). The selectivechanges in the frequency and the intensity of the out-of-planevibration of benzene has been attributed in earlier studies to theinteraction of surface Ti4+ ions with the benzene ring through theirp-system [8,24]. Indeed, an electronic interaction of benzenemolecules at Ti4+ sites would lead to the lowering of their D6h
symmetry and hence in the changes in the vibrational modes. Thelowering of the symmetry is known to result in the frequency shiftsand band splitting.
In addition to the benzene bands mentioned above, we observea prominent band at 3610 cm�1 in Fig. 9a, which correspondsclosely with the n(OH) band of phenol in Fig. 9c. The sharpness ofthis band is a characteristic feature of a gas phase or a very dilutesolution of phenol [25], and is therefore indicative of the adsorbedstate of phenol molecules over titania surface. The n(CH) bands ofphenol in 3100–3000 cm�1 region (Fig. 9c) overlap with thebenzene bands in this region (Fig. 9a). As reviewed in [26], the IRspectra of phenols are characterized by the strong coupling of C–Ostretching (nCO) and in-plane O–H bending (dOH) vibrations withthe aromatic C–C and C–H movements, giving rise to sharp IRbands in the 1600–1000 cm�1 region. A number of sharp bandsseen in Fig. 9a in this region may therefore be assigned to theisolated phenol molecules in their adsorbed state. The difference inthe frequency and the intensity of these bands, compared to thecorresponding IR bands in Fig. 9c, may thus be attributed to theperturbation of the phenol molecules because of their binding atthe titania surface, as is also observed in an earlier study [8].
The IR bands of adsorbed benzene were removed completely onpost exposure flushing of the sample in nitrogen but the phenolicbands were comparatively more stable. Flushing of the sample alsorevealed the presence of some new bands. Curves (a) and (b) inFig. 10 show the comparative IR bands on sample T3 in 2000–
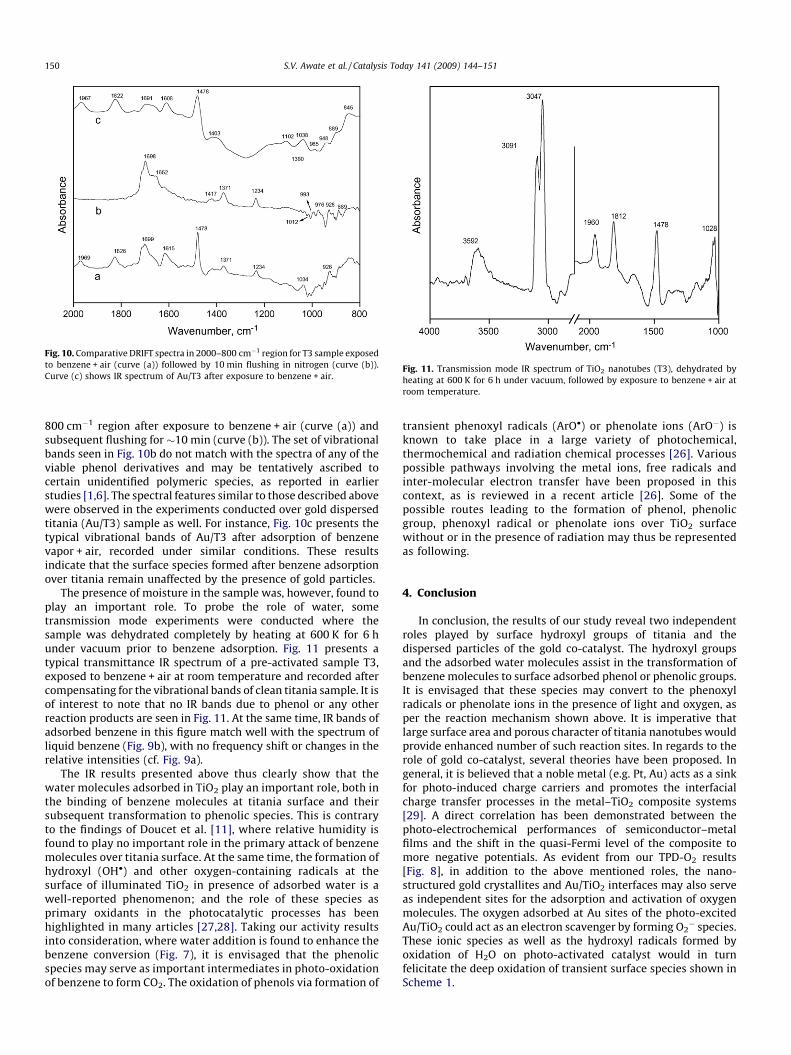
Fig. 10. Comparative DRIFT spectra in 2000–800 cm�1 region for T3 sample exposed
to benzene + air (curve (a)) followed by 10 min flushing in nitrogen (curve (b)).
Curve (c) shows IR spectrum of Au/T3 after exposure to benzene + air.Fig. 11. Transmission mode IR spectrum of TiO2 nanotubes (T3), dehydrated by
heating at 600 K for 6 h under vacuum, followed by exposure to benzene + air at
room temperature.
S.V. Awate et al. / Catalysis Today 141 (2009) 144–151150
800 cm�1 region after exposure to benzene + air (curve (a)) andsubsequent flushing for �10 min (curve (b)). The set of vibrationalbands seen in Fig. 10b do not match with the spectra of any of theviable phenol derivatives and may be tentatively ascribed tocertain unidentified polymeric species, as reported in earlierstudies [1,6]. The spectral features similar to those described abovewere observed in the experiments conducted over gold dispersedtitania (Au/T3) sample as well. For instance, Fig. 10c presents thetypical vibrational bands of Au/T3 after adsorption of benzenevapor + air, recorded under similar conditions. These resultsindicate that the surface species formed after benzene adsorptionover titania remain unaffected by the presence of gold particles.
The presence of moisture in the sample was, however, found toplay an important role. To probe the role of water, sometransmission mode experiments were conducted where thesample was dehydrated completely by heating at 600 K for 6 hunder vacuum prior to benzene adsorption. Fig. 11 presents atypical transmittance IR spectrum of a pre-activated sample T3,exposed to benzene + air at room temperature and recorded aftercompensating for the vibrational bands of clean titania sample. It isof interest to note that no IR bands due to phenol or any otherreaction products are seen in Fig. 11. At the same time, IR bands ofadsorbed benzene in this figure match well with the spectrum ofliquid benzene (Fig. 9b), with no frequency shift or changes in therelative intensities (cf. Fig. 9a).
The IR results presented above thus clearly show that thewater molecules adsorbed in TiO2 play an important role, both inthe binding of benzene molecules at titania surface and theirsubsequent transformation to phenolic species. This is contraryto the findings of Doucet et al. [11], where relative humidity isfound to play no important role in the primary attack of benzenemolecules over titania surface. At the same time, the formation ofhydroxyl (OH�) and other oxygen-containing radicals at thesurface of illuminated TiO2 in presence of adsorbed water is awell-reported phenomenon; and the role of these species asprimary oxidants in the photocatalytic processes has beenhighlighted in many articles [27,28]. Taking our activity resultsinto consideration, where water addition is found to enhance thebenzene conversion (Fig. 7), it is envisaged that the phenolicspecies may serve as important intermediates in photo-oxidationof benzene to form CO2. The oxidation of phenols via formation of
transient phenoxyl radicals (ArO�) or phenolate ions (ArO�) isknown to take place in a large variety of photochemical,thermochemical and radiation chemical processes [26]. Variouspossible pathways involving the metal ions, free radicals andinter-molecular electron transfer have been proposed in thiscontext, as is reviewed in a recent article [26]. Some of thepossible routes leading to the formation of phenol, phenolicgroup, phenoxyl radical or phenolate ions over TiO2 surfacewithout or in the presence of radiation may thus be representedas following.
4. Conclusion
In conclusion, the results of our study reveal two independentroles played by surface hydroxyl groups of titania and thedispersed particles of the gold co-catalyst. The hydroxyl groupsand the adsorbed water molecules assist in the transformation ofbenzene molecules to surface adsorbed phenol or phenolic groups.It is envisaged that these species may convert to the phenoxylradicals or phenolate ions in the presence of light and oxygen, asper the reaction mechanism shown above. It is imperative thatlarge surface area and porous character of titania nanotubes wouldprovide enhanced number of such reaction sites. In regards to therole of gold co-catalyst, several theories have been proposed. Ingeneral, it is believed that a noble metal (e.g. Pt, Au) acts as a sinkfor photo-induced charge carriers and promotes the interfacialcharge transfer processes in the metal–TiO2 composite systems[29]. A direct correlation has been demonstrated between thephoto-electrochemical performances of semiconductor–metalfilms and the shift in the quasi-Fermi level of the composite tomore negative potentials. As evident from our TPD-O2 results[Fig. 8], in addition to the above mentioned roles, the nano-structured gold crystallites and Au/TiO2 interfaces may also serveas independent sites for the adsorption and activation of oxygenmolecules. The oxygen adsorbed at Au sites of the photo-excitedAu/TiO2 could act as an electron scavenger by forming O2
� species.These ionic species as well as the hydroxyl radicals formed byoxidation of H2O on photo-activated catalyst would in turnfelicitate the deep oxidation of transient surface species shown inScheme 1.
Scheme 1. Formation of phenol (a), phenolic group (b), phenoxyl radical (c) and phenolate ion (d) adsorbed over TiO2 without (a and b) and in presence of radiation (c and d).
S.V. Awate et al. / Catalysis Today 141 (2009) 144–151 151
Acknowledgements
NMG thanks the Council of Scientific and Industrial Research(CSIR) Delhi, for a research grant under the Emeritus Scientistscheme.
References
[1] X. Fu, W.A. Zeltner, M.A. Anderson, Appl. Catal. B: Environ. 6 (1995) 209.[2] H. Park, W. Choi, Catal. Today 101 (2005) 291.[3] S.A. Larson, J.L. Falconer, Catal. Lett. 44 (1997) 57.[4] H. Einaga, S. Futamura, T. Ibusuki, Phys. Chem. Chem. Phys. 1 (1999) 4903.[5] K.-I. Shimizu, H. Akahane, T. Kodama, Y. Kitayama, Appl. Catal. A: Gen. 269 (2004)
75.[6] J. Chen, L. Eberlein, C.H. Langford, J. Photochem. Photobiol. A: Chem. 148 (2002)
183.[7] H. Einaga, S. Futamura, T. Ibusuki, Chem. Lett. (2001) 582.[8] W.-C. Wu, L.-F. Liao, C.-F. Lien, J.-L. Lin, Phys. Chem. Chem. Phys. 3 (2001) 4456.[9] N.N. Lichtin, M. Sadeghi, J. Photochem. Photobiol. A: Chem. 113 (1998) 81.
[10] O.D. Hennezel, P. Pichat, D.F. Ollis, J. Photochem. Photobiol. A: Chem. 118 (1998)197.
[11] N. Doucet, O. Zahraa, M. Bouchy, Catal. Today 122 (2007) 168.
[12] G.-M. Zuo, Z.-X. Cheng, H. Chen, G.-W. Li, T. Miao, J. Hazard. Mater. B 128 (2006)158.
[13] W. Wang, Y. Ku, J. Photochem. Photobiol. 159 (2003) 47.[14] S.V. Awate, A.A. Belhekar, S.V. Bhagwat, R. Kumar, N.M. Gupta, Int. J. Photoenergy
2008 (2008) 13, Article ID 789149.[15] R. Yoshida, Y. Suzuki, S. Yoshikawa, Mater. Chem. Phys. 91 (2005) 409.[16] Y.Q. Wang, G.Q. Hu, X.F. Duan, H.L. Sun, Q.K. Xue, Chem. Phys. Lett. 365 (2002)
427.[17] D.-S. Seo, J.-K. Lee, H. Kim, J. Cryst. Growth 229 (2001) 428.[18] G.H. Du, Q. Chen, R.C. Che, Z.Y. Yuan, L.-M. Peng, Appl. Phys. Lett. 79 (2001) 3702.[19] N.M. Gupta, in: B. Viswanathan, S. Sivasankar, A.V. Ramaswamy (Eds.), Catalysis
Principles and Applications, Narosa, Delhi, 2001, p. 127.[20] C.-M. Yang, M. Kalwei, F. Schuth, K.J. Chao, Appl. Catal. A: Gen. 254 (2003) 289.[21] Y.-D. Wang, C.-L. Ma, X.-D. Sun, H.-D. Li, J. Non-Cryst. Solids 319 (2003) 109.[22] G. Busca, H. Saussey, O. Saur, J.C. Lavalley, V. Lorenzelli, Appl. Catal. 14 (1985) 245.[23] C.L. Angell, M.V. Howell, J. Colloids Interface Sci. 28 (1968) 279.[24] Y. Suda, Langmuir 4 (1988) 147.[25] S. Steenken, P. Neta, The chemistry of Phenols, Patai Series: The chemistry of
Functional Groups, Part I, Ed- Zvi Rappoport, Wiley, England, 2003, p. 370.[26] S. Steenken, P. Neta, The Chemistry of Phenols, Patai Series: The chemistry of
Functional Groups, Part II, Ed- Zvi Rappoport, Wiley, England, 2003, p. 1107.[27] C.S. Turchi, D.F. Ollis, J. Catal. 122 (1990) 178.[28] Z. Yu, S.S.C. Chuang, J. Catal. 246 (2007) 118.[29] V. Subramanian, E. Wolf, P.V. Kamath, J. Phys. Chem. B 105 (2001) 11439.