Storybook reading at home: matrix of learning opportunities for children

Learning Disabilities Research & Practice, 23(3), 125–136C© 2008 The Division for Learning Disablilities of the Council for Exceptional Children
Phonological Awareness and Rapid Naming Skills of Children with ReadingDisabilities and Children with Reading Disabilities Who Are At Risk
for Mathematics Difficulties
Justin C. Wise, Hye Kyeong Pae, Christopher B. Wolfe, Rose A. Sevcik, and Robin D. MorrisGeorgia State University
Maureen LovettUniversity of Toronto/Hospital for Sick Children
Maryanne WolfTufts University
Limited research has examined the skills of children with a reading disability (RD) and childrenwith RD and a mathematics disability (MD). Even less research has examined the phonologicalawareness (PA) and rapid automatized naming (RAN) skills in these two groups of children andhow these skills relate to reading and math achievement. Additionally, various classificationcriteria are frequently implemented to classify children with MD. The purpose of this study,therefore, was to examine the PA and RAN skills in children who met different criteria for RDonly and children with RD who are at risk for mathematics difficulties (MDR). Participants were114 second- or third-grade students with RD from public elementary schools in three largemetropolitan areas. Students were classified as at risk for mathematics difficulties utilizinga 25th-percentile cutoff and a 15th-percentile cutoff as assessed by the KeyMath-RevisedTest (Connolly, 1988). A series of PA and RAN measures were administered along with arange of reading and mathematics measures. Hierarchical regression analyses indicated thatchildren with RD only evidenced a different pattern of results compared to children withRD + MDR. Additionally, using a more stringent criterion to classify children at risk formathematics difficulties resulted in a differential pattern of results when compared to a lessstringent classification criterion.
Students with reading disabilities (RD) constitute between17 percent and 20 percent of the school-age population(Robinson, Menchetti, & Torgesen, 2002), while 4 percent to7 percent of students are estimated to manifest math disabil-ities (MD; Fuchs, Fuchs, & Prentice, 2004). During the lasttwo decades, there has been an abundance of research thathas focused on the understanding of RD. Research focusedon the understanding of the core deficits associated with MD,however, has received less attention (Fuchs et al., 2004; Gert-sen, Jordan, & Flojo, 2005). Studies attempting to broadenthe scope of MD research to include research questions thatpertain to cooccurring reading and mathematics difficulties(RD + MD) are important because many school-identifiedstudents with learning disabilities have achievement deficitsin both reading and mathematics (Fleischner & Manheimer,1997). For example, research has reported that 56 percentof elementary and junior high school children with RD ex-hibit concomitant mathematics difficulties, and 43 percentof the children identified with MD also exhibited deficitsin reading achievement (Badian, 1983; Knopik, Alarcon, &
Requests for reprints should be sent to Justin C. Wise, Department ofPsychology, P.O. Box 5010, Georgia State University, Atlanta, GA 30302-5010. Electronic inquiries may be sent to [email protected].
DeFries, 1997). It is important, therefore, for research to at-tempt to identify core deficits in children with RD + MDand determine whether those deficits differ when comparedto children with RD only.
A large corpus of research has indicated that the pri-mary deficit in children with RD is in phonological aware-ness (PA; e.g., Catts, Fey, Tomblin, & Zhang, 2002; Morriset al., 1998; Olsen, Wise, Conners, Rack, & Fulker, 1989;Stanovich, 1988; Vellutino et al., 1996). PA is often de-fined as the ability to manipulate the individual phonemesof oral language (Elbro & Peterson, 2004). Students who arenot able to identify and manipulate the phonic elements ofspeech will not be able to map those sounds onto specific or-thographic patterns. Without established grapheme/phonemecorrespondences, children do not have the skills necessaryfor the decoding of unfamiliar words.
In addition to a deficit in PA, recent research also hasindicated that a subset of children with RD evidence deficitsin rapid automatized naming (RAN) skills, either separatelyor in combination with deficits in PA (Wolf et al., 2002).A deficit in RAN skills, therefore, represents a difficulty inefficiently and automatically retrieving stored phonologicalrepresentations. Although related, PA and naming speed taskshave been shown to contribute both shared and independent

126 WISE ET AL.: READING DISABILITIES AND MATH DIFFICULTIES
variance to real word and nonword identification (Bowers &Swanson, 1991; Manis, Doi, & Bhadha, 2000).
Research on MD recently has been criticized for beingtoo theoretical, with too little emphasis on empirical research(Gertsen et al., 2005), and for failing to adequately controlfor reading ability (Fuchs et al., 2004). With respect to thefirst criticism, limited research has sought to examine the po-tential underlying mechanisms that govern the developmentof mathematics skills. It has been speculated that the skillsimportant for successful reading, PA, and RAN skills arealso important for the development of successful mathemat-ics skills. In order to perform computational problems, a childmust accurately and efficiently access operators that are rep-resented by stored phonological representations. Deficits inPA or the speed at which phonological representations are re-trieved would, therefore, affect the development of proficientmathematics skills (Hecht, Torgesen, Wagner, & Rashotte,2001).
Support for the suggestion that the same skills that areimportant for reading also are important for mathemat-ics comes from Bryant, MacLean, Bradley, and Crossland(1990) who found significant correlations (r range: .33–.58) between PA skills (i.e., rhyme oddity, alliteration oddity,joint rhyme/alliteration choice, initial phoneme deletion, fi-nal phoneme deletion, and phoneme tapping) at 4 and 5years of age and later arithmetic performance at 6 years ofage. Bryant et al. (1990) also noted that scores on allitera-tion oddity (4 years 7 months) and phoneme tapping tasks(5 years 11 months) were predictive of later growth in arith-metic skills. In addition to these findings, Hecht and asso-ciates (2001) found evidence of PA skills influencing growthin general math computation skills. These researchers re-ported that second-grade levels of PA explained 10 percentof the unique variance in fifth-grade levels of general mathcomputation skills. In contrast, early mathematics ability wasnot found to significantly predict later levels of PA. Based onthese findings, the authors suggested that the phonologicalprocessing skills that influence growth in reading perfor-mance also contribute to growth in general math computa-tional skills. Findings such as these indicate that processespreviously found to be important for reading achievement(i.e., PA) are also important for mathematics achievement.
Further support for the suggestion that the same skillsthat are important for reading achievement are also im-portant for mathematics achievement comes from researchexamining the role that RAN skills play in reading and math-ematics performance. With respect to reading, the extant lit-erature indicates that RAN skills consistently predict readingachievement (e.g., Catts, Gillispie, Leonard, Kail, & Miller,2002; Schatschneider, Fletcher, Francis, Carlson, & Foor-man, 2004). In contrast, the nature of the relationship be-tween math achievement and RAN skills is less researchedand less well known. There is evidence in the literature, how-ever, to suggest that RAN tasks are related to math achieve-ment. For example, Clarke and Shinn (2004) developed anumber fluency identification task that required children toorally identify as many numbers as they could that werepresented in a random order in 1 minute. In a group of typi-cally developing children, this identification task was foundto highly correlate with a standardized measure of applied
mathematics at the beginning of the first grade (r = .65)and at the end of first grade (r = .63). In addition, Chardet al. (2005) found that letter naming fluency, rapid colornaming, and rapid picture naming measured in kindergartensignificantly predicted mathematics achievement assessed atthe beginning of first grade in a study designed to assess theeffectiveness of measures developed to screen students formathematics difficulties.
MD AND RD
The previously cited criticism that many studies have notcontrolled for reading ability is of particular importance be-cause research suggests that children with RD + MD may bemore similar to children with RD only than children with MDonly. Studies examining the response to mathematics-basedinterventions have shown that children with RD + MD re-spond more slowly to intervention efforts than children withMD only, RD only, or typically achieving children (Fuchset al., 2004; Jordan, Hanich, & Kaplan, 2003). While studieslike these indicate that children with RD + MD are differentfrom children with MD only and RD only, other studies sug-gest that MD and RD + MD represent different disabilitiesand that the difference between RD and RD + MD groupsis in severity and not in nature. Support for this suggestioncomes from Fletcher (2005) who outlines a series of studiesindicating that, while children with RD + MD evidenced sig-nificantly lower performance on measures of sustained atten-tion, concept formation, PA, rapid naming, vocabulary, andvisual-motor abilities than children with RD, the overall pat-tern of performance did not differ significantly between thetwo groups. The RD + MD group profile pattern, however,did differ significantly from the MD-only group. Results suchas these have led some to suggest that the math difficultiesassociated with MD and with RD + MD represent differentdisabilities and that RD + MD is a language-based learningdisability that shares a common etiology with RD rather thana disability with mathematics skills (Fletcher, 2005).
PURPOSES AND HYPOTHESES
Previous research has suggested that children with RD + MDdiffer from children with RD only in performance levels, butnot in performance patterns. Limited studies, however, haveinvestigated the role of PA and RAN speed in understandingthe linkages between reading and mathematics achievementin children with RD only and RD + MD. An objective ofthis study, therefore, was to investigate the role of PA andRAN in reading and math achievement in early elementaryschool-age students with RD and with RD who were at riskfor mathematics difficulties (MDR). Because we used morethan one cutoff level, and because we used a composite scoreon a standardized mathematics assessment that was adminis-tered at only one time point, we choose to use the term MDRrather than MD. While it is believed that the findings concern-ing the students in this study can be generalized to childrenwith a classification of MD, there is a possibility that theresearch definition of MDR used classified students into the

LEARNING DISABILITIES RESEARCH 127
RD + MDR group who did not evidence MD. The researchquestions that guided the first objective of the study were:(1) How was PA and RAN related to children’s mathematicsachievement? (2) How did these abilities impact mathemat-ics performance, as compared to reading, by children withRD and RD + MDR?
Because research concerning MD often utilizes variouscriteria to identify children with MD (Fuchs et al., 2004), an-other objective of this study was to examine the consequencesof employing different cutoff levels to classify children as atrisk for mathematical difficulties. Because classifications ofMD are not stable over time (Geary, 2004; Geary, Hamson,& Hoard, 2000), it has been argued that using higher cut-off levels will result in identifying children who are at riskfor developing more severe math difficulties and will yielda more inclusive group of children with mathematics diffi-culties (Gersten et al., 2005). Research concerning MD isstill in its infancy, however, and it is not clear whether chil-dren who demonstrate serious mathematics difficulties areconceptually and meaningfully different from children whomeet less stringent criteria. Children who meet more strin-gent criteria may represent a group of children who possessserious deficits in underlying mechanisms responsible formathematics operations. Children meeting less stringent cri-teria may represent groups of children who are strugglingto grasp mathematics skills because of educational expe-rience or performance issues on standardized tests relatedto test anxiety, inadequate test administration, or individualperformance fluctuations (e.g., exhaustion). Using less strin-gent criteria to classify children with MD consequently maycapture both groups of students, while more stringent criteriamay only identify those students who evidence actual deficitsassociated with MD. Examining these potentially fundamen-tally different children as a combined group could producemisleading results. Associated with the second objective ofthis study, therefore, were the research questions: (1) Doesusing a more stringent criterion for classification of MDR re-sult in differential relations between PA and RAN skills andreading and mathematics achievement? (2) Does classifyingchildren with MDR using a different cutoff criterion influ-ence interpretations concerning the relationship between RDonly and RD + MDR groups?
METHOD
Participants
Data presented here come from a larger study interested inexamining the effectiveness of different reading interven-tion programs with children with RD. The original studywas a 2 (ethnicity) × 2 (gender) × 2 (SES) × 4 (time point)mixed factorial design. For a complete description see Morriset al. (2007). Participants in the current study were 114 sec-ond and third-grade students from public elementary schoolsreferred by their teachers due to difficulties in learning toread. Referred students exhibited difficulty with decodingand word identification skills and did not evidence the fluentoral reading skills necessary to gain meaning from connectedtext. All students, therefore, exhibited difficulty with basic
decoding skills and had not made the developmental shift toeither fluent oral reading or reading for meaning.
Children were excluded if English was not their first lan-guage, they had repeated a grade, had a Kaufman-Brief Intel-ligence Test (K-BIT; Kaufman & Kaufman, 1990), Compos-ite Score below 70, and/or had a history of psychotic disorderor other serious psychiatric or neurological disease. Childrenwere independently evaluated for reading disabilities and in-cluded in a large, three-site (Atlanta, Boston, Toronto) treat-ment intervention program focused on the improvement ofreading skills. In order to meet the criteria for RD, studentsmet either low achievement (LA) and/or ability achievementregression corrected discrepancy (AA-D) definitions. Indi-viduals with a K-BIT IQ composite score greater than 70and whose reading skills were equal to, or less than, a stan-dard score of 85 on the Woodcock Reading Mastery Test-R(WRMT-R; Woodcock, 1987) were identified as meeting theLA criteria for RD. Participants whose actual reading perfor-mance was at least one standard error of the estimate belowtheir Expected Achievement Standard Score (EASS), calcu-lated based on an average correlation of .60 between mea-sures of reading performance and intellectual ability, wereincluded under the AA-D criteria. Participants’ mean age inmonths was 93.84 (SD = 6.36) and ranged from 81.25 to108.32 months. Sixty-seven (64 percent) of the participantswere male and 55 participants (53 percent) were of Africanheritage.
We first evaluated students with a performance below the25th percentile on a standardized achievement measure ofmathematics skill (i.e., the KeyMath-Revised Test; Connolly,1988) because to the 25th percentile has been cited frequentlyfor determining whether a child was at risk for a disability(Fuchs et al., 2004; Geary, 2004). Based on the 25th per-centile cutoff, 60 students (52.6 percent) evidenced RD only,while 54 children (47.4 percent) showed concurrent difficul-ties in both basic reading and math skills. The exact role ofIQ in MD is still unknown, and failing to account for IQ mayconfound results. For analytic purposes, therefore, studentsin the RD only and RD + MDR groups were matched onIQ scores. IQ matches were made with the constraint thatIQ scores did not differ by more than one standard score.Using this criterion, 68 (59.6 percent) of the 114 studentswere matched on IQ. The mean IQ score of the RD onlygroup (n = 34) was 87.32 and the mean IQ score of theRD + MDR group (n = 34) was 86.97. Demographic in-formation associated with this group of students is seen inTable 1.
In order to contrast the 25th percentile cutoff, a more con-servative cutoff point to determine RD + MDR also wasused in this study. Using the 15th percentile cutoff (a stan-dard score of 84.5), 75 children (66 percent) out of the 114participants evidenced RD only, while 39 children (34 per-cent) were identified as a comorbid group that demonstrateddifficulties attaining both basic reading and math skills. Withthis more conservative cutoff point, 60 (52.6 percent) of theoriginal 114 students were matched on IQ. The mean IQscore of the RD only group (n = 30) was 85.07 and themean IQ score of the RD + MDR (n = 30) group was 84.97.See Table 1 for the demographic breakdown of this group ofstudents.

128 WISE ET AL.: READING DISABILITIES AND MATH DIFFICULTIES
TABLE 1Demographic Breakdown of 25th and 15th Percentile
IQ-Matched Groups
Demographic IQ Match 25th IQ Match 15thVariables Percentile (n = 68) Percentile (n = 60)
Ethnicity African heritage 35 32Caucasian 33 28
Gender Female 28 23Male 40 37
Measures
IQ
The Kaufman Brief Intelligence Test (K-BIT; Kaufman &Kaufman, 1990) is an IQ screening measure of verbal (vo-cabulary) and nonverbal (matrices) abilities for children andadults aged 4 through 90. The K-BIT manual reports split-half reliability coefficients for the Vocabulary subtest as high,ranging from .89 to .98 (mean = .92), demonstrating highreliability for children and adolescents ages four through 19(mean = .91). Matrices split-half coefficients ranged from.74 to .95. Lower reliability coefficients occurred for theyoungest children in the sample, ages 4 to 6 years (mean =.78). For the age group of 5 through 12, test-retest reliabilitycoefficients for Vocabulary was .86, for Matrices .83, and forthe K-BIT Composite .92.
PA
This measure included the Elision and Blending Words sub-tests of the Comprehensive Test of Reading Related Phono-logical Processing (CTRRPP; Torgesen & Wagner, 1996).The CTRRPP is the experimental predecessor of the Com-prehensive Test of Phonological Processing (CTOPP; Torge-sen & Wagener, 1999). Internal consistency reliability amongitems within a subtest reached coefficients of .89 for Elisionand .84 for Blending Words. The test-retest reliability wasconstant over time for early grade children (Elision = .88;Blending Words = .78).
RAN Speed
The materials comprised the Letters, Numbers, and Objectssubtests of the RAN tasks (Denckla & Rudel, 1976; Wolf,Bally, & Morris, 1986), and Rapid Alternating Stimulus(RAS—a mixture of letters and numbers; Wolf, 1986) thatmeasured retrieval speed with set switching between numbersand letters.
Reading Performance
Reading measures were composed of the Word Identifica-tion, Word Attack, and Passage Comprehension subtests ofthe Woodcock Reading Mastery Test-Revised (WRMT-R;
Woodcock, 1987). Internal consistency reliability was ex-cellent across these subtests for grades 1 through 3, withreliability ranging from .94 to .99. When compared withindependent criterion reading measures, the WRMT-R evi-denced strong validity, with coefficients ranging .43 to .86.
Mathematics Performance
In order to measure different components of math skills, basicmathematics attributes were assessed using the KeyMath-Revised Test (Connolly, 1988), and included Numeration,Geometry, Addition, Subtraction, Measurement, and Time/Money subtests. The KeyMath test comprised basic concepts(numeration and geometry), operations (addition and sub-traction), and application (measurement and time/money).Numeration measured quantity, order, and place value, whileGeometry evaluated spatial and attribute relations, two-dimensional shapes and their relations, coordinate and trans-formational geometry, and three-dimensional shapes andtheir relations.
Addition focused on basic facts and models, algorithmsto add whole numbers, and adding rational numbers, whileSubtraction paralleled the coverage in the Addition. Mea-surement covered comparisons using nonstandard units andstandard units (e.g., length, area, weight, capacity), whereasTime and Money included identification of passage of time,use of clocks and clock units, and understanding of monetaryamounts from 1 dollar to 100 dollars and business transac-tions. Alternate-form reliability for each subtest of the Key-Math test ranged from .63 to .75, while split-half reliabilityfor grade 1 through 3 ranged from .52 to .89.
Procedure
Students identified by their teachers as evidencing difficultywith learning to read were referred to the project. These stu-dents were given a recruitment packet containing a descrip-tion of the study and a consent form to take home to theirparents. Those students who returned a signed consent formwere screened for entry into the study. After initial screen-ing for a reading disability, doctoral-level graduate studentsand psychologists administered all measures in a one-on-onesetting within the child’s typical school day.
All graduate students received several hours of trainingin test administration and were monitored by experiencedpsychologists before data collection was carried out inde-pendently. All reported assessments were conducted at thebeginning of the school year before students were exposedto any reading intervention efforts designed by the larger,original study.
RESULTS
Multivariate Analysis of Variance (NANOVA)
MANOVA techniques were used to test for differences be-tween groups on the subtests assessing PA skills, RAN skills,

LEARNING DISABILITIES RESEARCH 129
TABLE 2Descriptive Statistics of PA, RAN, Reading and Math Performance by Group (25th Percentile)
RD Only RD + MD
Mean SD Range F η2 Mean SD Range
PAa
Blending words 103.70 13.89 72–125 2.45 .04 97.77 16.50 72–138Elision 104.01 16.16 76–142 4.04∗ .06 96.64 13.99 67–129
RANb
Letters 70.48 23.15 25–109 1.83 .03 62.41 25.60 25–105Numbers 69.39 20.82 25–104 0.36 .01 66.29 21.36 25–104Objects 75.45 19.34 25–110 0.02 .00 76.06 20.03 28–108Alternating 70.99 24.37 25–108 0.78 .01 65.76 24.01 25–103
WRMTb
Word identification 77.68 7.82 54–90 5.19∗ .07 72.82 9.64 54–91Word attack 73.15 7.80 59–87 4.41∗ .06 68.71 9.55 41–88Passage comprehension 76.56 8.70 46–93 8.06∗∗ .11 68.32 14.50 33–87
KeyMathc
Addition 9.40 3.48 4–18 34.00∗∗∗ .34 5.62 1.58 1–10Geometry 8.97 2.49 1–13 32.52∗∗∗ .33 5.54 1.89 1–11Measurement 9.79 2.28 6–14 56.13∗∗∗ .46 5.49 1.83 3–11Numeration 8.49 2.74 4–19 26.30∗∗∗ .29 5.23 1.51 3–8Subtraction 7.92 2.76 3–14 23.49∗∗∗ .26 5.05 1.90 2–10Time/money 8.09 2.27 4–14 37.79∗∗∗ .36 5.13 2.00 2–9
aTransformed scores with a mean 100 and standard deviation of 15; bstandard scores; cscale scores.∗p < .05; ∗∗p < .01; ∗∗∗p < .001.Note. PA = phonological awareness; RD = reading disability; MD = mathematics disability; RAN = rapid automatized naming (Wolf, Bally, & Morris,
1986); WRMT = Woodcock reading mastery test-r (Woodcock, 1987); KeyMath = KeyMath-R: a diagnostic inventory of essential mathematics (Connolly,1988).
reading achievement, and math achievement. When a cut-off level of the 25th percentile was used, analyses indicatedthat the RD + MDR group evidenced significantly lowerscores than the RD only group on the Elision subtest assess-ing PA skills, and all subtests of reading and mathematicsachievement (see Table 2). The two groups did not evidencesignificantly different scores on any of the subtests assessingRAN skills. When a 15th percentile cutoff level was em-ployed, the RD + MDR group evidenced significantly lowerscores than the RD only group on the Elision subtest and onall subtests of math achievement (see Table 3). In contrast,there was no significant difference between the two groupson any of the subtests representing reading achievement orRAN skills.
Hierarchical Regression Analyses
In order to evaluate how PA and RAN skills predicted read-ing achievement and to compare the results with mathematicsoutcomes, a set of hierarchical regression analyses was per-formed. As a way of checking assumptions for the regressionmodel, correlation coefficients, multicollinearity diagnostics,and standardized residuals scatterplots were examined. In or-der to reduce redundancy in the analyses and to address theissue of mulitcolinearity among predictor variables, a com-posite score of PA skills (Blending Words and Elision) andRAN skills (Letter Naming, Number Naming, and Alternat-ing Naming) were created. The Object Naming subtest wasnot included in the composite score of RAN skills because of
its failure to evidence a significant relationship with readingor mathematics achievement subtests.
Analyses Conducted with the Combined Group
Two sets of hierarchical regression analyses were conducted.In the first set of analyses, real word reading, nonword read-ing, and passage comprehension skills were utilized as de-pendent variables. For each dependent variable, the compos-ite score of PA was entered in the first step and the RANcomposite score was entered in the second step (see Table 4).Analyses indicated that for each dependent variable, PA skillsaccounted for a significant amount of unique variance. In ad-dition, RAN performance accounted for a significant amountof unique variance after PA skills had been controlled for.
Included in this initial set of hierarchical regression anal-yses, the order of the predictors was reversed such that theRAN composite score was entered in the first step and thePA composite score was entered in the second step (seeTable 4). RAN skills accounted for a significant amountof unique variance in each dependent variable. PA skills,however, accounted for a significant amount of unique vari-ance only when word identification skills were utilized as adependent variable.
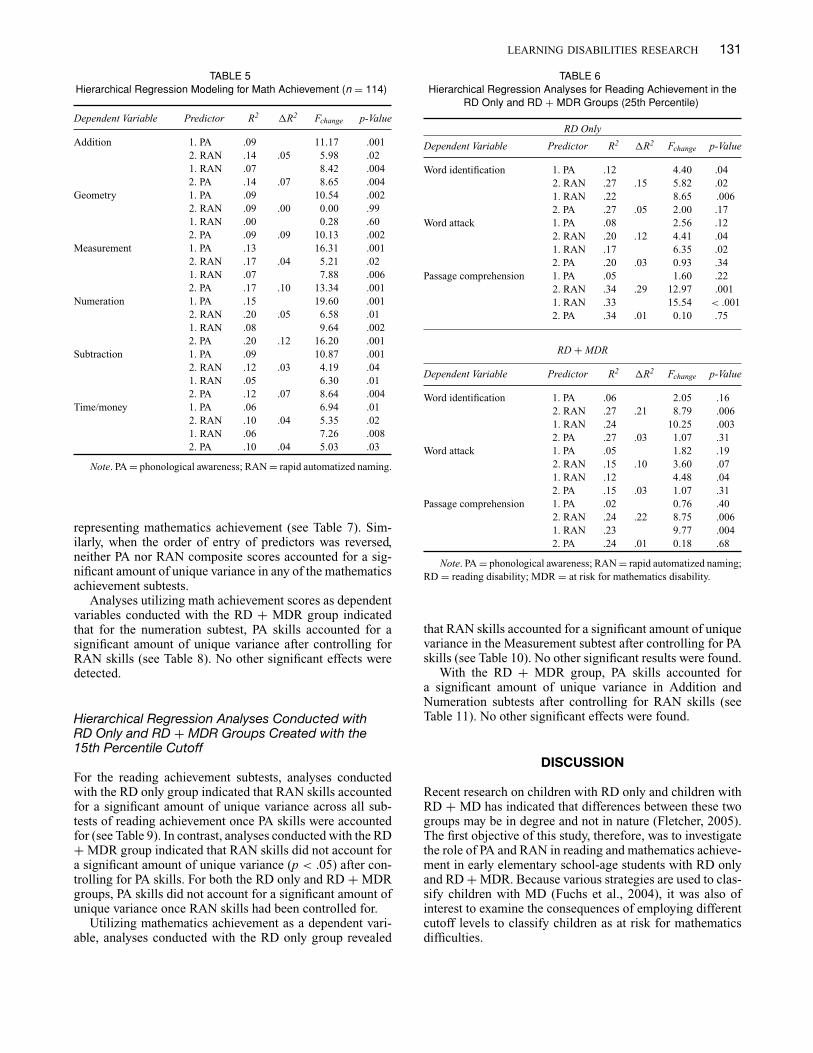
In the second set of hierarchical regression analyses,the subtests of mathematics achievement were used as de-pendent variables (i.e., Addition, Geometry, Measurement,Numeration, Subtraction, and Time/Money; see Table 5). Forthese analyses, PA scores accounted for a significant amount

130 WISE ET AL.: READING DISABILITIES AND MATH DIFFICULTIES
TABLE 3Descriptive Statistics of PA, RAN, Reading and Math Performance by Group (15th Percentile)
RD Only RD + MD
Mean SD Range F η2 Mean SD Range
PAa
Blending words 102.25 13.34 79–125 1.91 .03 96.75 17.24 72–138Elision 101.03 14.87 76–137 4.61∗ .07 93.26 13.08 67–129
RANb
Letters 70.59 27.61 25–108 1.17 .02 63.00 26.20 25–105Numbers 65.21 25.72 25–105 0.01 .00 64.50 22.63 25–104Objects 71.79 24.69 25–110 0.71 .01 76.77 20.67 26–108Alternating 70.24 28.88 25–109 0.29 .01 66.40 26.03 25–103
WRMTb
Word identification 76.20 9.97 54–88 1.65 .03 73.03 9.12 54–88Word attack 70.60 10.82 41–88 0.04 .00 70.13 7.76 54–88Passage comprehension 71.70 14.19 33–93 0.32 .01 69.83 11.16 43–85
KeyMathc
Addition 8.57 2.93 4–15 22.89∗∗∗ .28 5.60 1.71 1–9Geometry 8.53 1.80 5–12 42.99∗∗∗ .43 5.40 1.90 1–10Measurement 9.60 1.79 6–14 82.27∗∗∗ .59 5.47 1.74 1–9Numeration 7.87 2.13 4–13 32.18∗∗∗ .36 5.20 1.45 1–8Subtraction 7.73 2.45 3–13 19.34∗∗∗ .25 5.20 1.99 1–10Time/money 7.60 2.25 4–14 25.93∗∗∗ .31 4.87 1.89 2–9
aTransformed scores with a mean 100 and standard deviation of 15; bstandard scores; cscale scores.∗p < .05; ∗∗∗p < .001.Note. PA = phonological awareness; RD = reading disability; MD = mathematics disability; RAN = rapid automatized naming (Wolf, Bally, & Morris,
1986); WRMT = Woodcock reading mastery test-r (Woodcock, 1987); KeyMath = KeyMath-R: a diagnostic inventory of essential mathematics (Connolly,1988).
TABLE 4Hierarchical Regression Analyses for Reading Achievement
(n = 114)
RD Only
Dependent Variable Predictor R2 �R2 Fchange p-Value
Word identification 1. PA .10 12.27 .0012. RAN .33 .23 37.39 .0011. RAN .28 42.29 .0012. PA .33 .05 8.53 .004
Word attack 1. PA .03 3.55 .062. RAN .11 .08 9.18 .0031. RAN .09 10.95 .0012. PA .11 .02 1.96 .165
Passage comprehension 1. PA .05 5.53 .022. RAN .24 .19 28.05 .0011. RAN .22 31.64 .0012. PA .24 .02 2.78 .098
Note. PA = phonological awareness; RAN = rapid automatizednaming; RD = reading disability.
of unique variance for each dependent variable of mathachievement. RAN skills accounted for an additional sig-nificant amount of unique variance for all math domainsexcept for Geometry. When the order of predictor entrywas reversed, RAN skills accounted for a significant amountof unique variance for each dependent variable except Ge-ometry. When PA skills were entered in the second step, a
significant amount of unique variance was accounted for inall math domains.
Hierarchical Regression Analyses Conducted withRD Only and RD + MDR Groups Created with the25th Percentile Cutoff Criterion
In order to further explicate the relationships between PA andRAN skills and reading and math achievement, the same hi-erarchical regression analyses were conducted when the sam-ple was categorized into RD only and RD + MDR groupsbased on a 25th percentile cutoff criterion. For the RD group,analyses indicated that RAN skills accounted for a signif-icant amount of unique variance after controlling for PAskills for the Word Identification, Word Attack, and PassageComprehension subtests (see Table 6). In the RD + MDRgroup, a similar pattern of results was seen with the exceptionthat the amount of unique variance accounted for on the WordAttack subtest by RAN skills after controlling for PA skillsdid not reach conventional levels of statistical significance(p = .07). PA skills, however, did not account for a significantamount of unique variance in any of the subtests assessingreading achievement once RAN skills had been entered intothe regression equation. This pattern of results was seen inboth the RD only and RD + MDR groups.
When the composite score of PA was entered into the re-gression equation followed by the composite score of RANfor the RD only group, neither predictor accounted for asignificant amount of unique variance in any of the subtests
LEARNING DISABILITIES RESEARCH 131
TABLE 5Hierarchical Regression Modeling for Math Achievement (n = 114)
Dependent Variable Predictor R2 �R2 Fchange p-Value
Addition 1. PA .09 11.17 .0012. RAN .14 .05 5.98 .021. RAN .07 8.42 .0042. PA .14 .07 8.65 .004
Geometry 1. PA .09 10.54 .0022. RAN .09 .00 0.00 .991. RAN .00 0.28 .602. PA .09 .09 10.13 .002
Measurement 1. PA .13 16.31 .0012. RAN .17 .04 5.21 .021. RAN .07 7.88 .0062. PA .17 .10 13.34 .001
Numeration 1. PA .15 19.60 .0012. RAN .20 .05 6.58 .011. RAN .08 9.64 .0022. PA .20 .12 16.20 .001
Subtraction 1. PA .09 10.87 .0012. RAN .12 .03 4.19 .041. RAN .05 6.30 .012. PA .12 .07 8.64 .004
Time/money 1. PA .06 6.94 .012. RAN .10 .04 5.35 .021. RAN .06 7.26 .0082. PA .10 .04 5.03 .03
Note. PA = phonological awareness; RAN = rapid automatized naming.
representing mathematics achievement (see Table 7). Sim-ilarly, when the order of entry of predictors was reversed,neither PA nor RAN composite scores accounted for a sig-nificant amount of unique variance in any of the mathematicsachievement subtests.
Analyses utilizing math achievement scores as dependentvariables conducted with the RD + MDR group indicatedthat for the numeration subtest, PA skills accounted for asignificant amount of unique variance after controlling forRAN skills (see Table 8). No other significant effects weredetected.
Hierarchical Regression Analyses Conducted withRD Only and RD + MDR Groups Created with the15th Percentile Cutoff
For the reading achievement subtests, analyses conductedwith the RD only group indicated that RAN skills accountedfor a significant amount of unique variance across all sub-tests of reading achievement once PA skills were accountedfor (see Table 9). In contrast, analyses conducted with the RD+ MDR group indicated that RAN skills did not account fora significant amount of unique variance (p < .05) after con-trolling for PA skills. For both the RD only and RD + MDRgroups, PA skills did not account for a significant amount ofunique variance once RAN skills had been controlled for.
Utilizing mathematics achievement as a dependent vari-able, analyses conducted with the RD only group revealed
TABLE 6Hierarchical Regression Analyses for Reading Achievement in the
RD Only and RD + MDR Groups (25th Percentile)
RD Only
Dependent Variable Predictor R2 �R2 Fchange p-Value
Word identification 1. PA .12 4.40 .042. RAN .27 .15 5.82 .021. RAN .22 8.65 .0062. PA .27 .05 2.00 .17
Word attack 1. PA .08 2.56 .122. RAN .20 .12 4.41 .041. RAN .17 6.35 .022. PA .20 .03 0.93 .34
Passage comprehension 1. PA .05 1.60 .222. RAN .34 .29 12.97 .0011. RAN .33 15.54 < .0012. PA .34 .01 0.10 .75
RD + MDR
Dependent Variable Predictor R2 �R2 Fchange p-Value
Word identification 1. PA .06 2.05 .162. RAN .27 .21 8.79 .0061. RAN .24 10.25 .0032. PA .27 .03 1.07 .31
Word attack 1. PA .05 1.82 .192. RAN .15 .10 3.60 .071. RAN .12 4.48 .042. PA .15 .03 1.07 .31
Passage comprehension 1. PA .02 0.76 .402. RAN .24 .22 8.75 .0061. RAN .23 9.77 .0042. PA .24 .01 0.18 .68
Note. PA = phonological awareness; RAN = rapid automatized naming;RD = reading disability; MDR = at risk for mathematics disability.
that RAN skills accounted for a significant amount of uniquevariance in the Measurement subtest after controlling for PAskills (see Table 10). No other significant results were found.
With the RD + MDR group, PA skills accounted fora significant amount of unique variance in Addition andNumeration subtests after controlling for RAN skills (seeTable 11). No other significant effects were found.
DISCUSSION
Recent research on children with RD only and children withRD + MD has indicated that differences between these twogroups may be in degree and not in nature (Fletcher, 2005).The first objective of this study, therefore, was to investigatethe role of PA and RAN in reading and mathematics achieve-ment in early elementary school-age students with RD onlyand RD + MDR. Because various strategies are used to clas-sify children with MD (Fuchs et al., 2004), it was also ofinterest to examine the consequences of employing differentcutoff levels to classify children as at risk for mathematicsdifficulties.

132 WISE ET AL.: READING DISABILITIES AND MATH DIFFICULTIES
TABLE 7Hierarchical Regression Analyses for Math Achievement in the RD
Only Group (25th Percentile)
Dependent Variable Predictor R2 �R2 Fchange p-Value
Addition 1. PA .06 2.01 .172. RAN .06 .00 0.03 .871. RAN .01 0.33 .572. PA .06 .05 1.63 .21
Geometry 1. PA .01 0.31 .582. RAN .01 .00 0.00 .751. RAN .00 0.02 .892. PA .01 .01 0.39 .54
Measurement 1. PA .01 0.27 .612. RAN .04 .03 0.90 .351. RAN .04 1.16 .292. PA .04 .00 0.04 .84
Numeration 1. PA .02 0.71 .412. RAN .03 .01 0.13 .721. RAN .01 0.37 .552. PA .03 .02 0.47 .50
Subtraction 1. PA .03 0.79 .382. RAN .04 .01 0.61 .441. RAN .01 0.22 .642. PA .04 .03 1.17 .29
Time/money 1. PA .00 0.12 .732. RAN .01 .01 0.13 .721. RAN .00 0.06 .812. PA .01 .01 .019 .67
Note. PA = phonological awareness; RAN = rapid automatizednaming; RD = reading disability.
The results of this study have two primary implications.First, this study did not find support for previous researchthat has suggested children with RD only differ from chil-dren with RD + MD only in severity and not in their perfor-mance profile (e.g., Fletcher, 2005). In support of this, whenanalyzed as a combined sample, results indicated that RANskills were the best predictor of reading achievement, whilePA skills were the best predictor of math achievement. Withrespect to reading achievement, this pattern of results wasreplicated in both RD only and RD + MDR groups whenchildren in the sample were classified as RD + MDR usingthe 25th percentile as a cutoff level. When the 15th percentilewas used, however, this pattern of results was constrained tothe group of children classified as RD only. In the RD + MDRgroup classified with a 15th percentile cutoff level, neitherPA nor RAN skills were found to account for a significantamount of unique variance in any domain of reading achieve-ment that was assessed. This difference in results appearsto be a result of group dynamics defined by mathematicsclassification criteria rather than a loss in statistical powerdue to a reduction in sample size. This fact is evidencedby a considerable drop in r2 (range .10–.14) among sig-nificant findings evidenced with the MDR group classifiedwith the 25th percentile cutoff to the nonsignificant find-ings with the MDR group classified with the 15th percentilecutoff.
With respect to mathematics achievement, using a 25thpercentile cutoff, neither PA nor RAN was found to
TABLE 8Hierarchical Regression Analyses for Math Achievement in the
RD + MDR Group (25th Percentile)
Dependent Variable Predictor R2 �R2 Fchange p-Value
Addition 1. PA .03 0.95 .342. RAN .03 .00 .01 .921. RAN .00 0.01 .952. PA .03 .00 0.93 .34
Geometry 1. PA .01 0.19 .662. RAN .09 .08 2.80 .111. RAN .07 2.48 .132. PA .09 .02 0.56 .46
Measurement 1. PA .00 0.12 .732. RAN .02 .02 0.51 .481. RAN .01 0.42 .522. PA .02 .01 0.22 .65
Numeration 1. PA .15 5.82 .022. RAN .16 .01 0.15 .711. RAN .00 0.00 .962. PA .16 .16 5.80 .02
Subtraction 1. PA .02 0.58 .452. RAN .06 .04 1.21 .281. RAN .03 0.89 .352. PA .06 .03 0.91 .35
Time/money 1. PA .04 1.25 .272. RAN .04 .00 0.12 .731. RAN .01 0.29 .602. PA .04 .03 1.04 .32
Note. PA = phonological awareness; RAN = rapid automatized naming;RD = reading disability; MDR = at risk for mathematics disability.
significantly predict mathematics achievement with the RDonly group. In contrast, with the RD + MDR group, PA wasfound to account for a significant amount of unique variancein the Numeration subtest. When a 15th percentile cutoff levelwas implemented, RAN accounted for a significant amountof unique variance in the Measurement subtest by the RDonly group. With the RD + MDR group, PA was found toaccount for significant amounts of unique variance in theAddition and Numeration subtests.
All of these results taken together indicated that childrenwith RD only and children with RD + MDR evidenced differ-ent patterns of results concerning the relationships betweenPA and RAN skills and reading and math achievement. Thesedifferences in patterns of results were seen whether a RD +MDR classification was made using the 25th or the 15th per-centile cutoff. Thus, because many children with RD alsohave concomitant math difficulties, RD researchers shouldbe aware of the possibility the existence of an RD + MDsubtype that is conceptually and functionally different fromchildren with RD only.
A second implication of this study is that children demon-strating more severe math difficulties evidenced differentpatterns of skill relations than children who exhibited lesssevere math difficulties. Using a more stringent classifica-tion criterion, differential relations were found between PAand RAN skills and math and reading achievement domainsin the hierarchical regression analyses. For example, whena 25th percentile cutoff point was implemented, analyses

LEARNING DISABILITIES RESEARCH 133
TABLE 9Hierarchical Regression Analyses for Reading Achievement in the
RD Only and RD + MDR Groups (15th Percentile)
RD Only
Dependent Variable Predictor R2 �R2 Fchange p-Value
Word identification 1. PA .14 4.30 .052. RAN .42 .28 12.31 .0021. RAN .39 17.12 <.0012. PA .42 .03 1.19 .29
Word attack 1. PA .15 4.68 .042. RAN .32 .17 6.46 .021. RAN .27 10.02 .0042. PA .32 .05 1.78 .19
Passage comprehension 1. PA .10 3.14 .092. RAN .39 .29 12.28 .0021. RAN .38 16.43 <.0012. PA .39 .01 0.57 .50
RD + MDR
Dependent Variable Predictor R2 �R2 Fchange p-Value
Word identification 1. PA .10 3.27 .082. RAN .18 .08 2.57 .121. RAN .14 4.40 .052. PA .18 .04 1.53 .23
Word attack 1. PA .06 1.87 .182. RAN .06 .00 0.08 .781. RAN .02 0.50 .492. PA .07 .05 1.39 .25
Passage comprehension 1. PA .04 1.14 .302. RAN .12 .08 2.36 .141. RAN .11 3.35 .082. PA .12 .01 0.29 .60
Note. PA = phonological awareness; RAN = rapid automatized naming;RD = reading disability; MDR = at risk for mathematics disability.
conducted with the RD + MDR group indicated that RANskills accounted for a significant amount of unique variancein word identification, nonword identification, and passagecomprehension performances. Utilizing a 15th percentile cut-off level, however, RAN skills did not account for a signif-icant amount of unique variance in any measure of readingperformance.
Results concerning math performance indicated that whenusing a 25th percentile cutoff level, PA was found to accountfor a significant amount of unique variance in the Numerationsubtest. In contrast to these findings, when the 15th percentilecutoff level was utilized, PA skills accounted for a significantamount of unique variance in the Addition and Numerationsubtests.
In addition to these results, a differential pattern of signif-icant effects also was evidenced in the MANOVA analyses.Using the 25th percentile cutoff criterion, the students in theRD + MDR group demonstrated significantly lower readingachievement than students in the RD only group. When the15th percentile cutoff criterion was implemented, no signifi-cant differences in reading achievement were found betweenthe two groups. Researchers interested in the mechanisms
TABLE 10Hierarchical Regression Analyses for Math Achievement in the RD
Only Group (15th Percentile)
Dependent Variable Predictor R2 �R2 Fchange p-Value
Addition 1. PA .04 1.14 .302. RAN .11 .07 2.05 .161. RAN .10 3.04 .092. PA .11 .01 0.30 .61
Geometry 1. PA .05 1.29 .272. RAN .10 .05 1.64 .211. RAN .02 0.61 .442. PA .10 .08 2.32 .14
Measurement 1. PA .01 0.02 .902. RAN .16 .16 4.84 .041. RAN .13 4.08 .052. PA .16 .03 0.82 .38
Numeration 1. PA .04 1.17 .292. RAN .10 .06 1.82 .191. RAN .09 2.79 .112. PA .10 .01 0.31 .58
Subtraction 1. PA .07 2.07 .162. RAN .00 .00 0.09 .761. RAN .00 0.04 .842. PA .07 .07 2.05 .17
Time/money 1. PA .03 0.74 .402. RAN .08 .05 1.36 .251. RAN .02 0.61 .442. PA .08 .06 1.49 .23
Note. PA = phonological awareness; RAN = rapid automatizednaming; RD = reading disability.
underlying deficits associated with RD and MD, therefore,should remain cognizant of the classification issues.
LIMITATIONS AND FUTURE DIRECTIONS
It should be noted that classifying a student with math dif-ficulties based on a single measurement in time can beproblematic because children’s performance on mathematicachievement tests can be variable over time (Geary, 2004).Thus, it has been argued that only those children who consis-tently score low on mathematics achievement tests deserve aclassification of MD. Conclusions regarding the findings ofthis study, therefore, should be made with caution as some ofthe students examined may not be representative of childrenwho evidence consistent math difficulties over time.
A second difficulty associated with this study that couldinfluence interpretations was the lack of inclusion of an MDonly group for comparison. It would be of interest for fu-ture research to examine whether the use of different criteriato classify children with MD only would result in differen-tial findings as was seen in this study examining childrenwith RD + MDR. Because previous research has indicatedthat children with MD only evidence different mathemat-ics difficulties than children with RD + MD (Fuchs et al.,2004; Hanich, Jordan, Kaplan, & Dick, 2001; Jordan et al.,2003; Rourke & Finlayson, 1978), classification differencesobtained in this study may not be seen in children with MDonly.

134 WISE ET AL.: READING DISABILITIES AND MATH DIFFICULTIES
TABLE 11Hierarchical Regression Analyses for Math Achievement in the
RD + MDR Group (15th Percentile)
Dependent Variable Predictor R2 �R2 Fchange p-Value
Addition 1. PA .13 4.28 .052. RAN .16 .03 0.76 .391. RAN .00 0.22 .882. PA .16 .16 4.99 .03
Geometry 1. PA .01 0.16 .702. RAN .01 .00 0.23 .631. RAN .00 0.11 .742. PA .01 .01 0.28 .60
Measurement 1. PA .04 1.18 .292. RAN .07 .03 0.74 .401. RAN .01 0.21 .652. PA .07 .06 1.69 .20
Numeration 1. PA .17 5.89 .022. RAN .17 .00 0.2 .901. RAN .03 0.79 .412. PA .17 .14 4.90 .04
Subtraction 1. PA .01 0.16 .692. RAN .05 .04 1.12 .301. RAN .03 0.77 .392. PA .05 .02 .52 .48
Time/money 1. PA .05 1.54 .222. RAN .06 .01. 0.27 .611. RAN .03 0.79 .382. PA .06 .03 0.98 .33
Note. PA = phonological awareness; RAN = rapid automatized naming;RD = reading disability; MDR = at risk for mathematics disability.
CONCLUSIONS
Overall, the current study indicates that children with RDonly and children with RD + MDR differ in levels of PA andRAN in addition to the ways in which these two skills relate toreading and mathematics achievement. Further, results fromthis study provide evidence that using different classificationcutoff levels to classify students as at risk for mathemat-ics difficulties results in groups that show different patternswith respect to the relationships between PA and RAN skillsand reading and mathematics achievement. In light of thesefindings, research conducted with children with RD shouldcontrol for mathematics performance as combining samplesof children with RD only and children with RD + MD maybe unwarranted and may lead to misleading interpretationsof the underlying mechanisms operating in these two groupsof students. Further, careful attention should be directed tothe cutoff level used to classify children with difficulties inmathematics. Children falling under more stringent criteriamay be a conceptually different group than those who meetless stringent criteria.
Additionally, these findings have educational implicationsand suggest that teachers and those providing educationalsupport for children with RD and children with RD + MDshould remain aware of these differences. Instructional strate-gies may need to be structured differently for these twogroups of children. For example, results from this study sug-gest that for those students meeting RD + MDR criteria at the
15th percentile cutoff level may need instructional strategiesoutside of those focused on fostering PA and RAN skills, asthese skills did not relate significantly to reading achievementin this group of students.
Further, those individuals within the school setting thatare responsible for assessment and educational placementneed to account for potential group classification differencesand issues related to the stringency of the criteria used forplacement. Results of this study suggest that those studentsmeeting less stringent criteria may not fit into an educationalsetting designated for children who meet more stringent cri-teria. These students may only need additional instructionalassistance rather than services in a remedial classroom.
ACKNOWLEDGMENTS
The support for this research was provided by the NationalInstitute of Child Health and Human Development GrantHD30970 to Georgia State University, Tufts University, andthe Hospital for Sick Children/University of Toronto, and bythe Research Program Enhancement Fund of Georgia StateUniversity. We thank the participants and their families fortheir cooperation and support.
REFERENCES
Badian, N. A. (1983). Dyscalculia and non-verbal disorders of learning.In H. R. Myldebust (Ed.), Progress in learning disabilities (Vol. 5,pp. 235–264). New York: Grune & Stratton.
Bowers, P. O., & Swanson, L. B. (1991). Naming speed deficits in readingdisability: Multiple measures of a singular process. Journal of Experi-mental Child Psychology, 51, 195–219.
Bryant, P. E., MacLean, M., Bradley, L. L., & Crossland, J. (1990). Rhymeand alliteration, phoneme detection, and learning to read. Developmen-tal Psychology, 26, 429–438.
Catts, H. W., Gillispie, M., Leonard, L. B., Kail, R. V., & Miller, C. A.(2002). The role of speed of processing, rapid naming, and phonologicalawareness in reading achievement. Journal of Learning Disabilities, 6,509–524.
Catts, H. W., Fey, M. E., Tomblin, J. B., & Zhang, X. (2002). A longi-tudinal investigation of reading outcomes in children with languageimpairments. Journal of Speech, Language, and Hearing Research,45, 1142–1157.
Chard, D. J., Clarke, B., Baker, S., Otterstedt, J., Braun, D., & Katz, R.(2005). Using measures of number sense to screen for difficulties inmathematics: Preliminary findings. Assessment for Effective Interven-tion, 30, 3–14.
Clarke, B., & Shinn, M. R. (2004). A preliminary investigation into toidentification and development of early mathematics curriculum-basedmeasurement. School Psychology Review, 33, 234–248.
Connolly, A. J. (1988). KeyMath-R: A diagnostic inventory of essentialmathematics. Circle Pines, MN: American Guidance Service.
Denckla, M., & Rudel, R. G. (1976). Rapid “automatized” naming (RAN):Dyslexia differentiated from other learning disabilities. Neuropsy-chologia, 14, 471–479.
Elbro, C., & Peterson, D. K. (2004). Long-term effects of phoneme aware-ness and letter sound training: An intervention study with childrenat risk for dyslexia. Journal of Educational Psychology, 96, 660–670.
Fleischner, J. E., & Manheimer, M. A. (1997). Math interventions for stu-dents with learning disabilities: Myths and realities. School PsychologyReview, 26, 397–414.
Fletcher, J. M. (2005). Predicting math outcomes: Reading predictors andcomorbidity. Journal of Learning Disabilities, 38, 308–312.

LEARNING DISABILITIES RESEARCH 135
Fuchs, L. S., Fuchs, D., & Prentice, D. (2004). Responsiveness to mathemat-ical problem-solving instruction: Comparing students at risk of math-ematics disability with and without risk of reading disability. Journalof Learning Disabilities, 37, 293–306.
Geary, D. C. (2004). Mathematics and learning disabilities. Journal ofLearning Disabilities, 37, 4–15.
Geary, D. C., Hamson, C. O., & Hoard, M. K. (2000). Numerical andarithmetical cognition: A longitudinal study of process and conceptdeficits in children with learning disability. Journal of ExperimentalChild Psychology, 77, 236–263.
Gertsen, R., Jordan, N. C., & Flojo, J. R. (2005). Early identification for stu-dents with mathematics difficulties. Journal of Learning Disabilities,38, 293–304.
Hanich, L. B., Jordan, N. C., Kaplan, D., & Dick, J. (2001). Performanceacross different areas of mathematical cognition in children with learn-ing disabilities. Journal of Educational Psychology, 93, 615–626.
Hecht, S. A., Torgesen, J. K., Wagner, R. K., & Rashotte, C. A. (2001).The relations between phonological processing abilities and emergingindividual differences in mathematical computation skills: A longitu-dinal study from second to fifth grades. Journal of Experimental ChildPsychology, 79, 192–227.
Jordan, N. C., Hanich, L. B., & Kaplan, D. (2003). A longitudinal studyof mathematical competencies in children with specific mathematicsdifficulties versus children with comorbid mathematics and readingdifficulties. Child Development, 74, 834–850.
Kaufman, A. S., & Kaufman, N. L. (1990). Kaufman brief intelligence test.Circle Pines, MN: American Guidance Service.
Knopik, V. S., Alarcon, M., & DeFries, J. C. (1997). Comorbidity of mathe-matics and reading deficits: Evidence for a genetic etiology. BehaviorGenetics, 27, 447–453.
Manis, F., Doi, L., & Bhadha, B. (2000). Naming speed, phonological aware-ness and orthographic knowledge in second graders. Journal of Learn-ing Disabilities, 33, 325–333.
Morris, R. D., Steubing, K. K., Fletcher, J. M., Shaywitz, S. E., Lyon, R.,Shankweiler, D., et al. (1998). Subtypes of reading disability: Coherentvariability around a phonological core. Journal of Educational Psy-chology, 90, 347–373.
Morris, R. D., Lovett, M. W., Wolf, M., Sevcik, R. A., Steinbach, K. A., & Fri-jters, J. C. (2007). Multiple component remediation of developmental
reading disabilities: A controlled factorial evaluation of the influence ofIQ, socioeconomic status, and race on outcomes. Manuscript submittedfor publication.
Olsen, R., Wise, B., Conners, F., Rack, J., & Fulker, D. (1989). Spe-cific deficits in component reading and language skills. Genetic andenvironmental influences. Journal of Learning Disabilities, 22, 339–348.
Robinson, C. S., Menchetti, B. M., & Torgesen, J. K. (2002). Toward atwo-factor theory of one type of mathematics disabilities. LearningDisabilities Research & Practice, 17, 81–89.
Rourke, B. P., & Finlayson, M. A. (1978). Neuropsychological significanceof variations in patterns of academic performance: Verbal and visual-spatial abilities. Journal of Abnormal Child Psychology, 6, 121–133.g
Schatschneider, C., Fletcher, J., Francis, D. J., Carlson, C. D., & Foorman,B. R. (2004). Kindergarten prediction of reading skills: A longitudinalcomparative analysis. Journal of Educational Psychology, 96, 265–282.
Stanovich, K. (1988). Explaining the difference between the dyslexic and thegarden-variety poor reader: The phonological-core variable differencemodel. Journal of Learning Disabilities, 21, 590–604.
Torgesen, J. K., & Wagner, R. K. (1996). Comprehensive test of readingrelated phonological processes. Tallahassee, FL: Author.
Torgesen, J. K., & Wagner, R. K. (1999). The comprehensive test of phono-logical processing (CTOPP). Austin, TX: PRO-ED.
Vellutino, F. R., Scanlon, D. M., Sipay, E. R., Small, S. G., Pratt, A., Chen,R., et al. (1996). Cognitive profiles of difficult to remediate and readilyremediate poor readers: Toward distinguishing between constitution-ally and experimentally based causes of reading disability. Journal ofEducational Psychology, 88, 601–638.
Wolf, M. (1986). Rapid alternating stimulus naming in the developmentaldyslexias. Brain and Language, 27, 360–379.
Wolf, M., Bally, H., & Morris, R. (1986). Automaticity, retrieval processes,and reading: A longitudinal study in average and impaired readers.Child Development, 57, 988–1000.
Wolf, M., O’Rourke, A. G., Gidney, C., Lovett, M., Cirino, P., & Morris,R. (2002). The second deficit: An investigation of the independenceof phonological and naming-speed deficits in developmental dyslexia.Reading and Writing: An Interdisciplinary Journal, 15, 43–72.
Woodcock, R. W. (1987). Woodcock reading mastery tests-revised. CirclePines, MN: American Guidance Service.
About the Authors
Justin Wise, Ph.D. is a research scientist with the Center for Research on Atypical Development and Language at Georgia StateUniversity. He is interested in how children’s developing linguistic systems and cognitive capacities influence the developmentof key skills necessary for successful academic achievement.
Hye Kyeong Pae, Ph.D. is an adjunct faculty member in the Department of Applied Linguistics and research associate in theDepartment of Psychology at Georgia State University. She also teaches at Georgia Perimeter College. Her research interestsinclude reading disabilities, biliteracy development, and measurement challenges across cultures.
Christopher B. Wolfe, Ph.D. is an instructor at Georgia State University and is currently interested in cognitive and linguisticdevelopment.
Rose A. Sevcik, Ph.D. is a professor of psychology at Georgia State University. Her research interests center on the developmentof symbolic processes, specifically oral and written language development. Much of her work has been done in the context ofintervention research with a range of children and youth with, or at risk for, language and learning disabilities.
Robin D. Morris, Ph.D. is a Regents Professor of Psychology and the Vice President of Research at Georgia State University.His research explores reading development and reading disabilities, basic issues related to nervous system development, thedevelopment of higher cognitive abilities, and applied issues focused on developmental or acquired brain disorders in childrenand young adults.

136 WISE ET AL.: READING DISABILITIES AND MATH DIFFICULTIES
Maureen W. Lovett is a professor at the University of Toronto and the Hospital for Sick Children (HSC). She serves as thedirector of the Learning Disabilities Research Program at the HSC.
Maryanne Wolf is John DiBiaggio Professor of Citizenship and Public Service, Eliot−Pearson Department of Child Develop-ment, Director of the Center for Reading and Language Research, Tufts University, and author of Proust and the Squid: TheStory and Science of the Reading Brain, Harvard University.
Copyright © 2022 FDOKUMEN