Phenotypic and genotypic assessment of concomitant drug‐induced toxic effects in liver, kidney and...
14
Phenotypic and genotypic assessment of concomitant drug-induced toxic effects in liver, kidney and blood Shruta S. Dadarkar, a * Lyle C. Fonseca, a Prabha B. Mishra, a Aurelio S. Lobo, a Lalit S. Doshi, a Nilesh M. Dagia, a Ashok K. Rangasamy b and Muralidhara Padigaru a ABSTRACT: Several studies have characterized drug-induced toxicity in liver and kidney. However, the majority of these studies have been performed with ‘individual’ organs in isolation. Separately, little is known about the role of whole blood as a surrogate tissue in drug-induced toxicity. Accordingly, we investigated the‘concurrent’response of liver, kidney and whole blood during a toxic assault. Rats were acutely treated with therapeutics (acetaminophen, rosiglitazone, fluconazole, isoniazid, cyclophosphamide, amphotericin B, gentamicin and cisplatin) reported for their liver and/or kidney toxicity. Changes in clinical chemistry parameters (e.g. AST, urea) and/or observed microscopic tissue damage confirmed induced hepatotoxicity and/or nephrotoxicity by all drugs. Drug-induced toxicity was not confined to an ‘individual’ organ. Not all drugs elicited significant alterations in phenotypic parameters of toxicity (e.g. ALT, creatinine). Accordingly, the transcriptional profile of the organs was studied using a toxicity panel of 30 genes derived from literature. Each of the test drugs generated specific gene expression patterns which were unique for all three organs. Hierarchical cluster analyses of purported hepatotoxicants and nephrotoxicants each led to characteristic‘fingerprints’ (e.g. decrease in Cyp3a1 indicative of hepatotoxicity; increase in Spp1 and decrease in Gstp1 indicative of nephrotoxicity). In whole blood cells, a set of genes was derived which closely correlated with individual drug-induced concomitant changes in liver or kidney. Collectively, these data demonstrate drug-induced multi-organ toxicity. Furthermore, our findings underscore the importance of transcriptional profiling during inadequate phenotypic anchorage and suggest that whole blood may be judiciously used as a surrogate for drug-induced extra-hematological organ toxicity. Copyright © 2010 John Wiley & Sons, Ltd. Keywords: biomarkers; hepatotoxicity; nephrotoxicity; surrogate; toxicogenomics INTRODUCTION Low research and development productivity is not sustainable and, accordingly, needs to be aggressively addressed by the pharmaceutical industry (Blomme and Warder, 2008). Amongst the foremost reasons for high attrition level and drug with- drawal are pre-clinical toxicity and/or unforeseen clinical toxicity (Corey, 2007). Clearly, given these observations, early identifica- tion of compounds that are ultimately destined to fail would sig- nificantly reduce costs. This has led to the conception of the field of toxicogenomics (Castle et al., 2002; Luhe et al., 2005). Although primarily focused on pre-clinical toxicological investi- gation, it can also be employed to identify biomarkers linked to drug exposure and/or drug safety (Burczynski, 2009). Further- more, by generating a toxicological ‘fingerprint’ of specific genes for a particular class of compounds, one can develop quick screening assay(s) for impending toxicity (Vass et al., 2009). With this approach, measuring changes in specific gene expression can aid in prioritization of compounds before they are tested in more resource-intensive and time-consuming animal studies (Hirakawa et al., 2008). Indeed, global evaluation of cellular and tissue transcriptomes has provided a powerful approach to interrogate perturbations induced by toxicants (Blomme and Warder, 2008). Much of the published work in toxicogenomics has focused on liver and kidney due to the strategic and functional attributes of these organs. The liver is researched because it is located between the absorptive surface of the gastrointestinal tract and drug target(s) throughout the body and is central to the metabolism of most drugs (Lee, 2003). The kidney is studied as a ‘toxicological’ organ due to its high susceptibility to drug-induced cellular damage (primarily due to high blood flow), and its functional role in drug metabolism and clearance (Davis and Kramer, 2006). Importantly, hepatotoxicity and nephrotoxicity are the most frequently reported causes of adverse drug reactions clinically (Matthews et al., 2009). In the past, the majority of the toxicologi- cal investigations have been carried out in rodent model(s) using *Correspondence to: S. S. Dadarkar, Department of Pharmacology, Piramal Life Sciences Limited, 1, Nirlon Complex, Off. Western Express Highway, Goregaon (East), Mumbai – 400063, Maharashtra, India. E-mail: [email protected] a Department of Pharmacology, Piramal Life Sciences Limited, Mumbai-400063, Maharashtra, India b School of Bio Sciences and Technology, Vellore Institute of Technology University, Vellore-632014, Tamil Nadu, India Research Article Received: 17 April 2010, Revised: 27 May 2010, Accepted: 28 May 2010 Published online in Wiley Online Library: 9 July 2010 (wileyonlinelibrary.com) DOI 10.1002/jat.1562 117 J. Appl. Toxicol. 2011; 31: 117–130 Copyright © 2010 John Wiley & Sons, Ltd.
-
Upload
independent -
Category
Documents
-
view
2 -
download
0
Transcript of Phenotypic and genotypic assessment of concomitant drug‐induced toxic effects in liver, kidney and...

Phenotypic and genotypic assessment ofconcomitant drug-induced toxic effects inliver, kidney and bloodShruta S. Dadarkar,a* Lyle C. Fonseca,a Prabha B. Mishra,a Aurelio S. Lobo,a
Lalit S. Doshi,a Nilesh M. Dagia,a Ashok K. Rangasamyb andMuralidhara Padigarua
ABSTRACT: Several studies have characterized drug-induced toxicity in liver and kidney. However, the majority of thesestudies have been performed with ‘individual’ organs in isolation. Separately, little is known about the role of whole blood asa surrogate tissue in drug-induced toxicity. Accordingly, we investigated the ‘concurrent’ response of liver, kidney and wholeblood during a toxic assault. Rats were acutely treated with therapeutics (acetaminophen, rosiglitazone, fluconazole, isoniazid,cyclophosphamide, amphotericin B, gentamicin and cisplatin) reported for their liver and/or kidney toxicity. Changes in clinicalchemistry parameters (e.g. AST, urea) and/or observed microscopic tissue damage confirmed induced hepatotoxicity and/ornephrotoxicity by all drugs. Drug-induced toxicity was not confined to an ‘individual’ organ. Not all drugs elicited significantalterations in phenotypic parameters of toxicity (e.g. ALT, creatinine). Accordingly, the transcriptional profile of the organs wasstudied using a toxicity panel of 30 genes derived from literature. Each of the test drugs generated specific gene expressionpatterns which were unique for all three organs. Hierarchical cluster analyses of purported hepatotoxicants andnephrotoxicants each led to characteristic ‘fingerprints’ (e.g. decrease in Cyp3a1 indicative of hepatotoxicity; increase in Spp1and decrease in Gstp1 indicative of nephrotoxicity). In whole blood cells, a set of genes was derived which closely correlatedwith individual drug-induced concomitant changes in liver or kidney. Collectively, these data demonstrate drug-inducedmulti-organ toxicity. Furthermore, our findings underscore the importance of transcriptional profiling during inadequatephenotypic anchorage and suggest that whole blood may be judiciously used as a surrogate for drug-inducedextra-hematological organ toxicity. Copyright © 2010 John Wiley & Sons, Ltd.
Keywords: biomarkers; hepatotoxicity; nephrotoxicity; surrogate; toxicogenomics
INTRODUCTION
Low research and development productivity is not sustainableand, accordingly, needs to be aggressively addressed by thepharmaceutical industry (Blomme and Warder, 2008). Amongstthe foremost reasons for high attrition level and drug with-drawal are pre-clinical toxicity and/or unforeseen clinical toxicity(Corey, 2007). Clearly, given these observations, early identifica-tion of compounds that are ultimately destined to fail would sig-nificantly reduce costs. This has led to the conception of thefield of toxicogenomics (Castle et al., 2002; Luhe et al., 2005).Although primarily focused on pre-clinical toxicological investi-gation, it can also be employed to identify biomarkers linked todrug exposure and/or drug safety (Burczynski, 2009). Further-more, by generating a toxicological ‘fingerprint’ of specific genesfor a particular class of compounds, one can develop quickscreening assay(s) for impending toxicity (Vass et al., 2009). Withthis approach, measuring changes in specific gene expressioncan aid in prioritization of compounds before they are tested inmore resource-intensive and time-consuming animal studies(Hirakawa et al., 2008). Indeed, global evaluation of cellular andtissue transcriptomes has provided a powerful approach tointerrogate perturbations induced by toxicants (Blomme andWarder, 2008).
Much of the published work in toxicogenomics has focused onliver and kidney due to the strategic and functional attributes ofthese organs. The liver is researched because it is located betweenthe absorptive surface of the gastrointestinal tract and drugtarget(s) throughout the body and is central to the metabolism ofmost drugs (Lee, 2003). The kidney is studied as a ‘toxicological’organ due to its high susceptibility to drug-induced cellulardamage (primarily due to high blood flow), and its functional rolein drug metabolism and clearance (Davis and Kramer, 2006).Importantly, hepatotoxicity and nephrotoxicity are the mostfrequently reported causes of adverse drug reactions clinically(Matthews et al., 2009). In the past, the majority of the toxicologi-cal investigations have been carried out in rodent model(s) using
*Correspondence to: S. S. Dadarkar, Department of Pharmacology, Piramal LifeSciences Limited, 1, Nirlon Complex, Off. Western Express Highway, Goregaon(East), Mumbai – 400063, Maharashtra, India.E-mail: [email protected]
aDepartment of Pharmacology, Piramal Life Sciences Limited, Mumbai-400063,Maharashtra, India
bSchool of Bio Sciences and Technology, Vellore Institute of Technology University,Vellore-632014, Tamil Nadu, India
Research Article
Received: 17 April 2010, Revised: 27 May 2010, Accepted: 28 May 2010 Published online in Wiley Online Library: 9 July 2010
(wileyonlinelibrary.com) DOI 10.1002/jat.1562
117
J. Appl. Toxicol. 2011; 31: 117–130 Copyright © 2010 John Wiley & Sons, Ltd.
‘individual organs’ in isolation (Fielden et al., 2005; Heinloth et al.,2004; Morishita et al., 2006; Ozaki et al., 2009; Wang et al., 2008;Zidek et al., 2007). However, systemic administration of a drug islikely to pleiotropically affect multiple organs. It is, thus, not sur-prising that the majority of differentially expressed genesreported and validated in multiple organs are not mere statisticalartifacts but reflect drug-induced biological responses (Son et al.,2005). Moreover, it is well established that reactive metabolitesgenerated in one organ can also induce a similar biologicalresponse in neighboring or distant organs (Cohen, 1986). As such,it is imperative to study drug-induced toxicity in multiple organsat the same time. These studies can also add value in understand-ing the biological basis of drug-induced organ toxicity.
Separately, an emerging area of interest in toxicogeno-mics is studying drug-induced responses in whole blood cells(Burczynski and Dorner, 2006; Lavallie et al., 2008; Lobenhoferet al., 2008; Mohr and Liew, 2007). Recently, it has been shown thatperipheral blood cells have the ability to respond differentiallyto varying drug-induced perturbations (Mohr and Liew, 2007).However, relatively few studies have explored the utility of thisreadily available sample source by establishing whether bloodtranscript data could provide insights into the presence and sever-ity of injury within an extra-hematological organ upon toxicantexposure (Lobenhofer et al., 2008). Consequently, there is a needto experimentally ascertain whether whole blood cells can beused to generate minimally invasive surrogate markers andpredict extra-hematological organ-specific drug-induced toxicity.
Herein, we utilized eight drugs with established propensityto elicit hepatotoxicity and/or nephrotoxicity in a single-dose,short-term study performed at toxic concentrations (Table 1). Theobjective of our study was not to directly derive biomarkers oforgan specific toxicity but rather to generate a basis for furtherinvestigation. While toxicological investigations on ‘individual’organs of rodent species have been relatively commonplace, wehave focused on ‘concurrent’ toxic responses of liver, kidney andwhole blood cells and explored the possibility of using wholeblood as a surrogate indicator of extra-hematological organ tox-icity. Accordingly, clinically approved drugs were selected to elu-cidate the toxicological patterns so that these data will becometherapeutically relevant.
MATERIALS AND METHODS
Test Drugs
All drugs were obtained from Sigma Aldrich (St Louis, MO, USA)except for rosiglitazone, which was obtained from Cayman (Ann
Arbor, MI, USA). Test drugs [acetaminophen, rosiglitazone, flu-conazole and isoniazid (hepatotoxicants) and cyclophosphamide,amphotericin B, gentamicin and cisplatin (nephrotoxicants)]under consideration are conventional therapeutics across differ-ent disease areas (Table 1). However, even though some of thedrugs used in this study are classified as solely hepatotoxic ornephrotoxic, there is well established evidence of these drugsaffecting both liver and kidney (El-Sayyad et al., 2009; Ghani et al.,2009; Isik et al., 2006; Lavin and Koss, 1971).
Administration of Test Drugs and Assessmentof Organ Injury
Female Sprague–Dawley rats (8 weeks old, 130–150 g) wereobtained from Jackson Laboratories (Maine, USA) and housed ina controlled environment (temperature 23 � 1 °C, humidity 60 �5%, and 12 h light/12 h dark cycle) in the animal facility of PiramalLife Sciences Limited. The animals had access to commerciallyavailable feed pellets and chlorinated water ad libitum. They wereacclimatized for 1 week prior to experimentation. All animalexperiments were carried out in accordance with the guidelinesof Committee for the Purpose of Control and Supervision ofExperiments on Animals (CPCSEA). All animal experiments wereapproved by Institutional Animal Ethics Committee (IAEC) ofPiramal Life Sciences Limited. The maximum tolerated non-lethaldose of each drug which induced acute toxicity without lethalitywas determined in preliminary experiments (data not shown)and was used for all subsequent studies (Table 1). Of note, thisapproach has prior precedence (Huang et al., 2004). It wasexpected that the pre-selected maximum tolerated dose of testdrugs with similar organ toxicity would inflict comparable sever-ity of toxic effects in its target organ. A group of three rats(Heinloth et al., 2007; Ozaki et al., 2009) was administered intrap-eritoneal (i.p.) injection of test drugs suspended in 0.5% car-boxymethylcellulose (CMC). As a control, a group of three ratswas given i.p. injection of 0.5% CMC (vehicle control). Intraperi-toneal administration was preferred to ensure adequate expo-sure of drug for eliciting toxic responses. Twenty-four hours afterdrug administration blood was withdrawn retro-orbitally forevaluation of clinical chemistry parameters. The biochemicalmarkers indicative of hepatotoxicity [aspartate transaminase(AST), alanine transaminase (ALT), albumin and total bilirubin]and nephrotoxicity (urea and creatinine) were quantified using aHitachi Biochemistry Autoanalyser 902 (Tokyo, Japan). The drug-induced changes in these aforementioned parameters were com-pared with the vehicle control. Subsequent to blood withdrawal,the animals were humanely euthanized and the liver and kidney
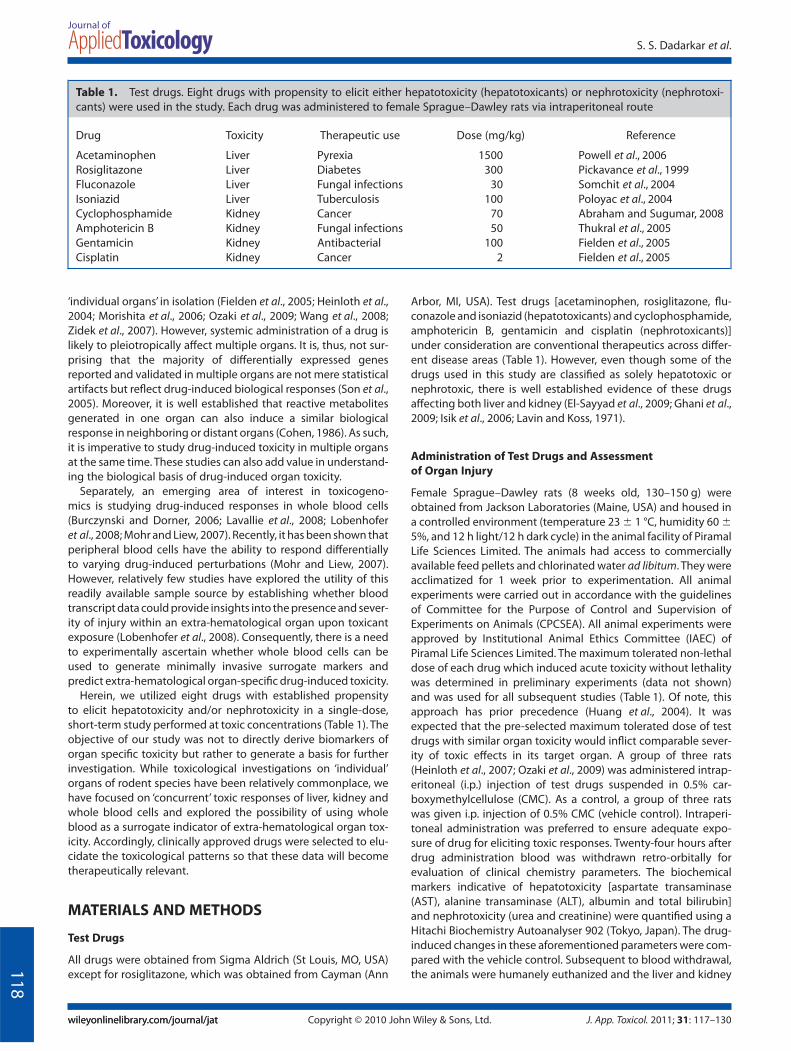
Table 1. Test drugs. Eight drugs with propensity to elicit either hepatotoxicity (hepatotoxicants) or nephrotoxicity (nephrotoxi-cants) were used in the study. Each drug was administered to female Sprague–Dawley rats via intraperitoneal route
Drug Toxicity Therapeutic use Dose (mg/kg) Reference
Acetaminophen Liver Pyrexia 1500 Powell et al., 2006Rosiglitazone Liver Diabetes 300 Pickavance et al., 1999Fluconazole Liver Fungal infections 30 Somchit et al., 2004Isoniazid Liver Tuberculosis 100 Poloyac et al., 2004Cyclophosphamide Kidney Cancer 70 Abraham and Sugumar, 2008Amphotericin B Kidney Fungal infections 50 Thukral et al., 2005Gentamicin Kidney Antibacterial 100 Fielden et al., 2005Cisplatin Kidney Cancer 2 Fielden et al., 2005
118
S. S. Dadarkar et al.
J. App. Toxicol. 2011; 31: 117–130wileyonlinelibrary.com/journal/jatwileyonlinelibrary.com/journal/jat Copyright © 2010 John Wiley & Sons, Ltd.
parenchyma excised. These organs were washed in normal saline,blotted dry and weighed to normalize as a percent (%) of livebody weight (termed as normalized liver/kidney weight). Subse-quently these tissues were utilized for histological analyses andgene expression studies.
Histological Evaluation
Liver and kidney tissues were fixed with 10% neutral bufferedformalin, dehydrated in ethanol and embedded in paraffin (Dagiaet al., 2010). Sections (5 mm) were stained with hematoxylin(Sigma Aldrich) and eosin (Loba Chemie, Mumbai, India). Histo-logical evaluation of tissue specimens was carried out using alight microscope (Nikon 80i with DXM1200 camera). Liver sec-tions were evaluated for presence of inflammatory cells, necrosis,vacuolation and hypertrophy. Kidney sections were evaluated forinflammatory cells, vacuolation, loss of tubules and presence oftubular casts (Huang et al., 2004; Wang et al., 2008). Each of theaforementioned parameters was graded on a score of 0–3 (0, nochanges; 1, mild changes; 2, moderate changes; and 3, severechanges; Jiang et al., 2007). The cumulative score of all the param-eters was used for microscopic assessment of drug-inducedorgan toxicity.
Selection of Genomic Markers of Toxicity and Quantificationby Real-time qPCR
A thorough literature search was conducted to facilitate the iden-tification of potential genomic markers of toxicity. This resulted inthe selection of a set of 30 genes implicated in prior rodentstudies as markers of organ toxicity (Ferguson et al., 2008; Huanget al., 2004; Minami et al., 2005; Vass et al., 2009; Wang et al.,2008). Real-time quantitative PCR (RT-qPCR) was used to studydrug-induced change in gene expression as described by others(Davis and Kramer, 2006; Sahu, 2008; Vass et al., 2009; Yuan et al.,2006). The procedure followed was similar to that described else-where (Dagia et al., 2009; Thakkar et al., 2010). Total cellular RNAwas extracted from liver and kidney using TRIzol (Invitrogen Cor-poration, CA, USA) and purified using RNeasy Mini kit (Qiagen,Valencia, CA, USA) according to the manufacturer’s recommen-dation. Total cellular RNA from whole blood cells was isolatedusing a QIAamp® RNA whole blood isolation kit (Qiagen). Theconcentration and purity of RNA samples were determined usinga NanoDrop ND-1000 spectrophotometer (NanoDrop products,DE, USA). For each sample, 2 mg of total RNA was reverse-transcribed in a total volume of 20 mL using 200 units SuperscriptII reverse transcriptase (Invitrogen), oligo (dT)20, 50 pmol ofrandom hexamer and 10 mM of deoxynucleotide triphosphates(Invitrogen). PCR amplification was performed on an Eppend-orf Mastercycler® realplex4 system (Eppendorf AG, Hamburg,Germany) using the QuantiFast SYBR Green PCR Kit (Qiagen).Briefly, each PCR reaction contained 1¥ master mix, 1 mL of thediluted cDNA, and 250 nM of forward and reverse primers. PCRwas carried out through 40 cycles (95 °C for 10 s, 60 °C for 30 s)following the initial 3 min enzyme activation at 95 °C. The primersused (Table 2) were designed using Primer 3 software and customsynthesized at Bioserve (Hyderabad, India). Melting curve analy-sis was performed at the end of PCR and changes in gene expres-sion were analyzed using the ‘Realplex’software (version 1.5). Therelative expression of each gene was calculated using a compara-tive Ct method with the formula: 2 - DDCt (where DDCt = DCt
sample - DCt reference), where Ct is the number of cyclesrequired to reach the threshold. Relative quantification of targetmRNA expression was calculated and normalized to Gapdhexpression. The results are presented as the log2 fold change ofmRNA expression as compared to the amount present in vehiclecontrol samples. Expression ratio less than -1 or greater than +1(at log2 scale) was considered as dysregulation.
Data Analysis
A cluster analysis of transcriptional data was performed to iden-tify the expression patterns of the test drugs. For transcriptomeanalysis, data were clustered using the expression ratio describedabove. Unsupervised hierarchical clustering was performedusing the program Cluster (Eisen et al., 1998) followed by Tree-View (version 1.6) to determine overall genotypic alterations indrug-treated samples. The conditions used for unsupervised hier-archical clustering were: data mode, log2 of ratio; weight, 1.0;similarity measure, correlation centered; and clustering algo-rithm, complete linkage.
Statistical Analysis
To analyze differences among test groups, a single factor ANOVAfollowed by Dunnett’s multiple comparison test was used. In caseof histopathological analyses, Kruskal–Wallis test followed byDunnett’s multiple comparison test were used to evaluate thestatistical difference. Unless stated otherwise, all error bars rep-resent the standard error of mean.
RESULTS
Each of the test drugs is known to induce hepatotoxicity and/ornephrotoxicity in susceptible subjects when used at higher con-centrations (Huang et al., 2004; Thukral et al., 2005; Wang et al.,2008).
Phenotypic Assessment of Drug-induced Organ Toxicity
Initially, we analyzed drug-induced toxicity in liver and kidneyusing conventional phenotypic parameters (clinical chemistry,organ weight and histological findings). For each of these param-eters drug-treated rats were compared with vehicle-treated rats.
Assessment of Hepatotoxicity
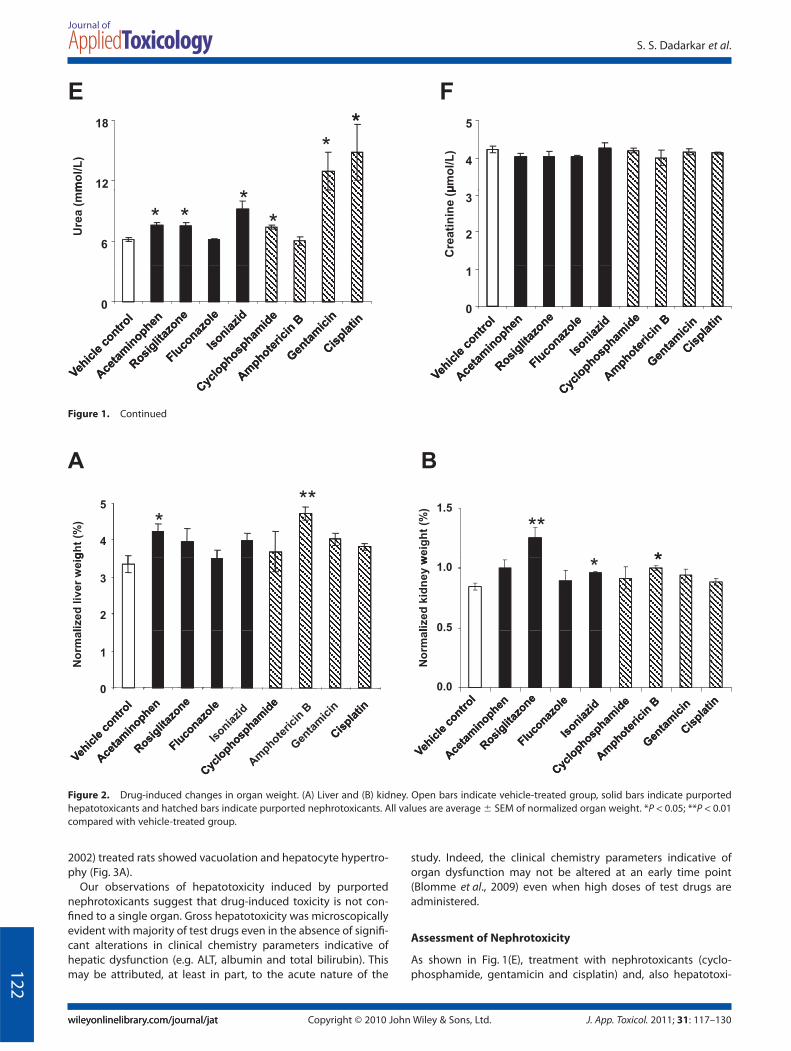
As shown in Fig. 1A, treatment with hepatotoxicants, and moreinterestingly nephrotoxicants, led to a significant increase inlevels of AST. However, few, if any, changes in ALT, albumin andtotal bilirubin were observed post treatment with the majorityof the test drugs (Fig. 1B–D). Only one known hepatotoxicant(acetaminophen) and two purported nephrotoxicants (gentami-cin and cisplatin) caused a significant increase in levels of ALT(Fig. 1B). Acetaminophen and fluconazole elicited an increase inalbumin (Fig. 1C) and total bilirubin (Fig. 1D); however, theincreases were not statistically significant. One hepatotoxicant(acetaminophen) (Gueguen et al., 2007) and one nephrotoxicant(amphotericin B) caused a significant increase in liver weight(Fig. 2A) indicating that changes in hepatic parenchyma were
119
Phenotypic and genotypic assessment of drug-induced toxicity
J. App. Toxicol. 2011; 31: 117–130 wileyonlinelibrary.com/journal/jatwileyonlinelibrary.com/journal/jatCopyright © 2010 John Wiley & Sons, Ltd.

Tab
le2.
Gen
ese
tfo
rmin
gto
xici
typ
anel
.Eac
hof
the
gene
sis
imp
licat
edin
prio
rro
dent
stud
ies
asm
arke
rof
eith
erhe
pat
otox
icit
yan
d/or
nep
hrot
oxic
ity.
The
prim
erse
quen
ces
used
inRT
-qPC
Rw
ere
desi
gned
usin
gPr
imer
3
Gen
en
ame
Gen
esy
mb
ol
Acc
essi
on
nu
mb
erFo
rwar
dp
rim
erRe
vers
ep
rim
er
ATP-
bin
din
gca
sset
te,m
emb
er1A
Ab
cb1
NM
_133
401
CG
GA
GA
GTG
AA
AA
GG
TCG
TCTC
AA
GTC
TGC
GTT
CTG
GAT
GB
-cel
lCLL
/lym
ph
om
a2
Bcl
2N
M_0
1699
3G
TGG
AC
AA
CAT
CG
CTC
TGTG
CAT
GC
TGG
GG
CC
ATAT
AG
TTB
CL2
-ass
oci
ated
Xp
rote
inB
axN
M_0
1705
9C
GA
GC
TGAT
CA
GA
AC
CAT
CA
GG
TCC
CG
AA
GTA
GG
AG
AG
GA
Cal
ciu
m-s
ensi
ng
rece
pto
rC
asr
NM
_016
966
TGG
AG
AG
AC
AG
ATG
CG
AG
TGG
TCC
AC
GC
CA
GA
AA
CTC
AAT
Cas
pas
e3
Cas
p3
NM
_012
922
TGA
CTG
GA
AA
GC
CG
AA
AC
TCG
CAT
GC
CAT
ATC
ATC
GTC
AG
Cas
pas
e8
Cas
p8
NM
_022
277
GG
AC
ATA
CC
CA
AA
CTC
AG
CA
AG
CTG
TGC
AAT
CA
CTG
AA
GG
AC
atal
ase
Cat
NM
_012
520
GA
AA
CG
CC
TGTG
TGA
GA
AC
AG
TAG
TCA
GG
GTG
GA
CG
TCA
GC
hem
oki
ne
(C-C
mo
tif)
ligan
d2
Ccl
2N
M_0
3153
0C
AAT
GA
GTC
GG
CTG
GA
GA
AC
TTC
CTT
ATTG
GG
GTC
AG
CA
CC
hem
oki
ne
(C-C
mo
tif)
rece
pto
r2
Ccr
2N
M_0
2186
6TT
GG
TGA
GA
AG
TTC
CG
AA
GG
TCG
GTC
TGC
TGTC
TCC
CTA
TC
lust
erin
Clu
NM
_053
021
CA
GC
TGG
CTA
AC
CTC
AC
AC
AA
AC
AG
CTT
CA
CC
AC
CA
CC
TCC
yto
chro
me
P450
,fam
ily3a
1C
yp3a
1N
M_0
1310
5G
GG
TCA
GTG
GTC
ATG
ATTC
CAT
CA
ATG
CTG
CC
CTT
GTT
CT
Glu
tath
ion
ep
erox
idas
e1
Gst
p1
NM
_030
826
TTC
GG
AC
ATC
AG
GA
GA
ATG
GC
AC
CTC
GC
AC
TTC
TCA
AA
CA
Glu
tath
ion
eS-
tran
sfer
ase
thet
a1
Gst
t1N
M_0
5329
3C
TGAT
GC
ATC
CTG
TAG
GTG
GT
GA
AG
AG
GTC
CTT
CC
CC
AC
AG
Glu
tath
ion
eS-
tran
sfer
ase,
mu
2G
stm
2N
M_1
7742
6C
CTT
CC
CA
AA
CC
TGA
AG
GA
CG
CA
AA
GAT
TGG
CTT
GG
AG
AG
Gro
wth
arre
stan
dD
NA
-dam
age-
ind
uci
ble
,alp
ha
Gad
d45
aN
M_0
2412
7G
CA
GA
GC
TGTT
GC
TAC
TGG
ATG
TGAT
GA
ATG
TGG
GTT
CG
TH
epat
ocy
teg
row
thfa
cto
rH
gf
NM
_017
017
GG
GC
TGA
AA
AG
ATTG
GAT
CA
CA
CG
AC
CA
GG
AA
CA
ATG
AC
AH
ypox
iain
du
cib
lefa
cto
r1
alp
ha
Hif1
aN
M_0
2435
9A
AC
AG
GAT
GG
AAT
GG
AG
CA
GTC
GTA
AC
TGG
TCA
GC
TGTG
GH
epat
itis
Avi
rus
cellu
lar
rece
pto
r1
Hav
cr1
NM
_173
149
TCG
TAA
CTG
GTC
AG
CTG
TGG
CA
AA
GC
TCA
GA
GA
GC
CC
ATC
Lip
oca
lin2
Lcn
2N
M_1
3074
1TC
AC
CC
TGTA
CG
GA
AG
AA
CC
GG
TGG
GA
AC
AG
AG
AA
AA
CG
AM
yelo
per
oxid
ase
Mp
oX
M_2
2083
0G
CC
TCAT
TGG
CA
CTC
AG
TTT
GTA
GC
CA
AG
GC
CTG
TCTC
TGPe
roxi
som
ep
rolif
erat
or-
acti
vate
dre
cep
tor
gam
ma
Ppar
gN
M_0
1312
4C
CC
TGG
CA
AA
GC
ATTT
GTA
TG
GTG
ATTT
GTC
TGTT
GTC
TTTC
CSe
cret
edp
ho
sph
op
rote
in1
Spp
1N
M_0
1288
1G
CA
AG
AA
AC
TCTT
CC
AA
GC
AA
AC
AG
AAT
CC
TCG
CTC
TCTG
CSe
len
ium
bin
din
gp
rote
in1
Sele
nb
p1
NM
_003
944
GC
CTG
GG
AC
AA
GC
AG
TTTT
AA
CC
AG
AA
AG
TTG
GG
GTT
CA
ASo
lute
carr
ier
fam
ily11
Slc1
1a1
NM
_001
0316
58TA
CTT
TGG
CC
TTG
TGG
CTC
TG
CTG
TGG
GTC
AG
AA
AC
TTG
GSu
per
oxid
ed
ism
uta
se1
Sod
1N
M_0
1705
0A
GA
GG
CAT
GTT
GG
AG
AC
CTG
GC
CA
ATG
ATG
GA
ATG
CTC
TCSu
per
oxid
ed
ism
uta
se2
Sod
2N
M_0
1705
0G
AA
CC
AC
AG
GC
CTT
ATTC
CA
CAT
TCC
AA
ATG
GC
TTTC
AG
ATh
ymo
ma
vira
lpro
to-o
nco
gen
e1A
kt1
NM
_033
230
AC
CTC
TGA
GA
CC
GA
CA
CC
AG
CTG
TCC
AC
AC
AC
TCC
ATG
CT
Tum
or
nec
rosi
sfa
cto
rTn
fN
M_0
1267
5TA
GC
AA
AC
CA
CC
AA
GC
AG
AG
AC
CA
CC
AG
TTG
GTT
GTC
TTTG
UD
Pg
lucu
ron
osy
ltra
nsf
eras
e1
fam
ily,p
oly
pep
tid
eA
9U
gt1
a9N
M_2
0142
5TT
TGG
AA
AA
CG
CC
CTT
AA
AA
CA
GG
TCC
AG
AG
GC
TCG
ATA
GV
imen
tin
Vim
NM
_031
140
TAC
AG
GA
AG
CTG
CTG
GA
AG
GA
GTG
GG
TGTC
AA
CC
AG
AG
GA
120
S. S. Dadarkar et al.
J. App. Toxicol. 2011; 31: 117–130wileyonlinelibrary.com/journal/jatwileyonlinelibrary.com/journal/jat Copyright © 2010 John Wiley & Sons, Ltd.

induced by these two test drugs. All other test drugs [exceptfluconazole (Somchit et al., 2004; Tully et al., 2006)] showed atrend towards eliciting an increase in liver weight (Fig. 2A);however, these increases were not statistically significant. Ourresults with acetaminophen are not entirely surprising giventhat it is known to elevate serum ALT and AST (Yuan et al., 2010)and elicit liver damage at high concentrations (Tarloff et al.,1996).
Histological analyses revealed that treatment with all hepato-toxicants elicited alterations in the liver (Fig. 3). As reported byothers (Tarloff et al., 1996), classical centrilobar necrosis was
observed in liver sections from acetaminophen-treated rats(Fig. 3A). Liver sections from rats treated with rosiglitazone, flu-conazole or isoniazid showed marked hepatocyte hypertrophywith narrowing of sinusoidal cords (Fig. 3A). The latter observa-tions are consistent with previous reports (El-Sayyad et al., 2009;Tully et al., 2006). Interestingly, treatment with all four nephro-toxicants also showed histological alterations in the liver (Fig. 3A).Indeed, severe necrosis was observed in liver sections fromcyclophosphamide-treated rats (Lavin and Koss, 1971) whereasliver sections from cisplatin (Ibrahim et al., 2009), gentamicin(Alkahtani et al., 2009) and amphotericin B (Inselmann et al.,
BA**250
**
**400
500
600
mo
l/L
)
**
150
200
mm
ol/
L)
**
****
** * *100
200
300
AS
T (
m
* *50
100ALT
(m
00
DC125
21
28
n (
g/L
)
75
100
125
ub
in (
µm
ol/L
)
7
14
Alb
um
in
25
50
75
To
tal
bil
ir
0 0
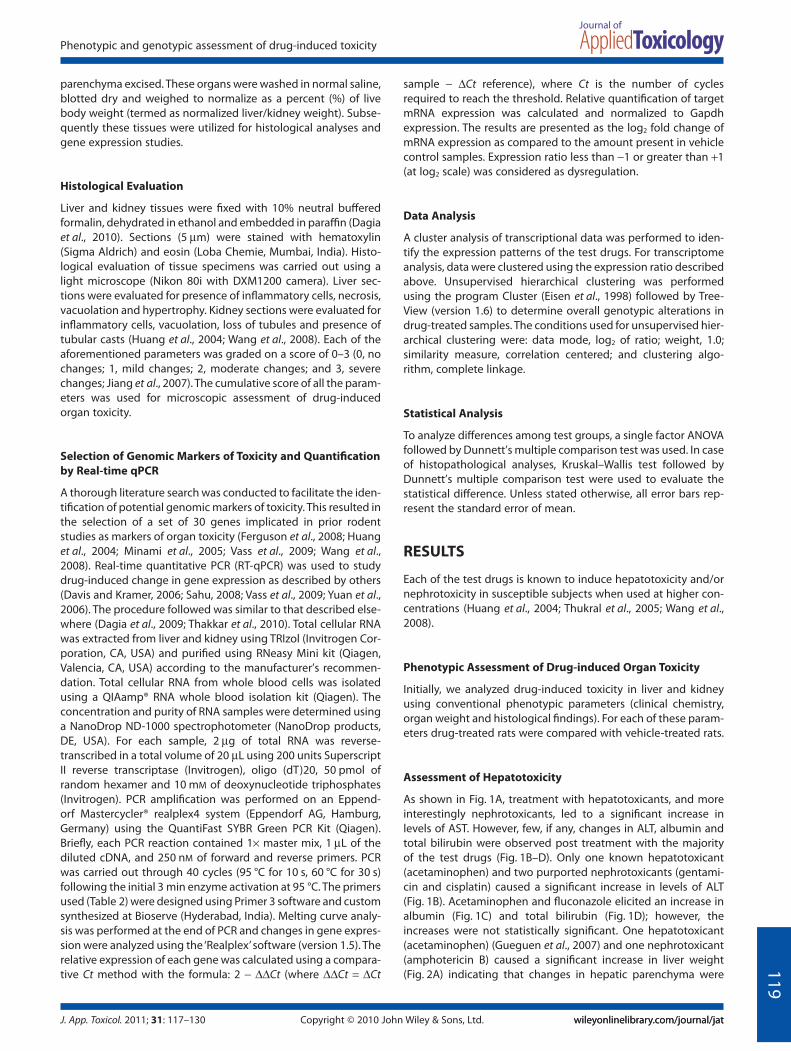
Figure 1. Drug-induced changes in clinical chemistry parameters indicative of hepatotoxicity or nephrotoxicity. (A) AST, aspartate transminase; (B) ALT,alanine transaminase; (C) albumin; (D) total bilirubin; (E) urea; and (F) creatinine. Open bars indicate vehicle-treated group, solid bars indicate purportedhepatotoxicants and hatched bars indicate purported nephrotoxicants. All values are average � SEM. *P < 0.05; **P < 0.01 compared with vehicle-treatedgroup.
121
Phenotypic and genotypic assessment of drug-induced toxicity
J. App. Toxicol. 2011; 31: 117–130 wileyonlinelibrary.com/journal/jatwileyonlinelibrary.com/journal/jatCopyright © 2010 John Wiley & Sons, Ltd.
2002) treated rats showed vacuolation and hepatocyte hypertro-phy (Fig. 3A).
Our observations of hepatotoxicity induced by purportednephrotoxicants suggest that drug-induced toxicity is not con-fined to a single organ. Gross hepatotoxicity was microscopicallyevident with majority of test drugs even in the absence of signifi-cant alterations in clinical chemistry parameters indicative ofhepatic dysfunction (e.g. ALT, albumin and total bilirubin). Thismay be attributed, at least in part, to the acute nature of the
study. Indeed, the clinical chemistry parameters indicative oforgan dysfunction may not be altered at an early time point(Blomme et al., 2009) even when high doses of test drugs areadministered.
Assessment of Nephrotoxicity
As shown in Fig. 1(E), treatment with nephrotoxicants (cyclo-phosphamide, gentamicin and cisplatin) and, also hepatotoxi-
E
*F
**
12
18
mo
l/L
) 4
5
µm
ol/
L)
***
*6
Ure
a (
mm
2
3
Cre
ati
nin
e (
µ
0 0
1
Figure 1. Continued
A B
4
5
gh
t (%
) ***
**
*
1.5
we
igh
t (%
)
2
3
lize
d liv
er
weig * *
0.5
1.0
lize
d k
idn
ey w
0
1
No
rmal
0.0
No
rmal
Figure 2. Drug-induced changes in organ weight. (A) Liver and (B) kidney. Open bars indicate vehicle-treated group, solid bars indicate purportedhepatotoxicants and hatched bars indicate purported nephrotoxicants. All values are average � SEM of normalized organ weight. *P < 0.05; **P < 0.01compared with vehicle-treated group.
122
S. S. Dadarkar et al.
J. App. Toxicol. 2011; 31: 117–130wileyonlinelibrary.com/journal/jatwileyonlinelibrary.com/journal/jat Copyright © 2010 John Wiley & Sons, Ltd.

cants (acetaminophen, rosiglitazone and isoniazid), caused asignificant increase in levels of urea. However, few, if any, changesin creatinine were observed post-treatment with all the testdrugs (Fig. 1F). One nephrotoxicant (amphotericin B) and twohepatotoxicants (rosiglitazone and isoniazid) caused a significantincrease in kidney weight (Fig. 2B), indicating that changes inkidney were induced by these test drugs. Our results with rosigli-tazone are not entirely surprising given that it is known to elicit
kidney damage at high concentrations (Ghani et al., 2009; Tarloffet al., 1996). Acetaminophen, cyclophosphamide and gentamicintrended towards increasing the kidney weight; however, theseincreases were not statistically significant (Fig. 2B).
Histological analyses revealed that treatment with all nephro-toxicants elicited alterations in the kidney (Fig. 4). As reported byothers (Tikoo et al., 2009), vacuolation and extensive loss oftubules was observed in kidney sections from cisplatin-treated
A
Vehicle control Acetaminophen Rosiglitazone
Fluconazole Isoniazid Cyclophosphamide
Amphotericin B Gentamicin Cisplatin
B
7
4
5
6
7
cal
sco
re **
*
1
2
3
His
tolo
gic
0
Figure 3. Drug-induced histological alterations in liver. (A) Microscopic evaluation of liver of test drug-treated rats was conducted on hematoxylin andeosin stained sections of formalin fixed, paraffin embedded hepatic tissue at 200¥. Thin arrows represent necrosis, thick arrows represent vacuolationand arrow heads represent narrowing of sinusoidal cords. (B) Histological score for drug-induced hepatotoxicity. Open bars indicate vehicle-treatedgroup, solid bars indicate purported hepatotoxicants and hatched bars indicate purported nephrotoxicants. All values are average � SEM. *P < 0.05;**P < 0.01 compared with vehicle-treated group.
123
Phenotypic and genotypic assessment of drug-induced toxicity
J. App. Toxicol. 2011; 31: 117–130 wileyonlinelibrary.com/journal/jatwileyonlinelibrary.com/journal/jatCopyright © 2010 John Wiley & Sons, Ltd.
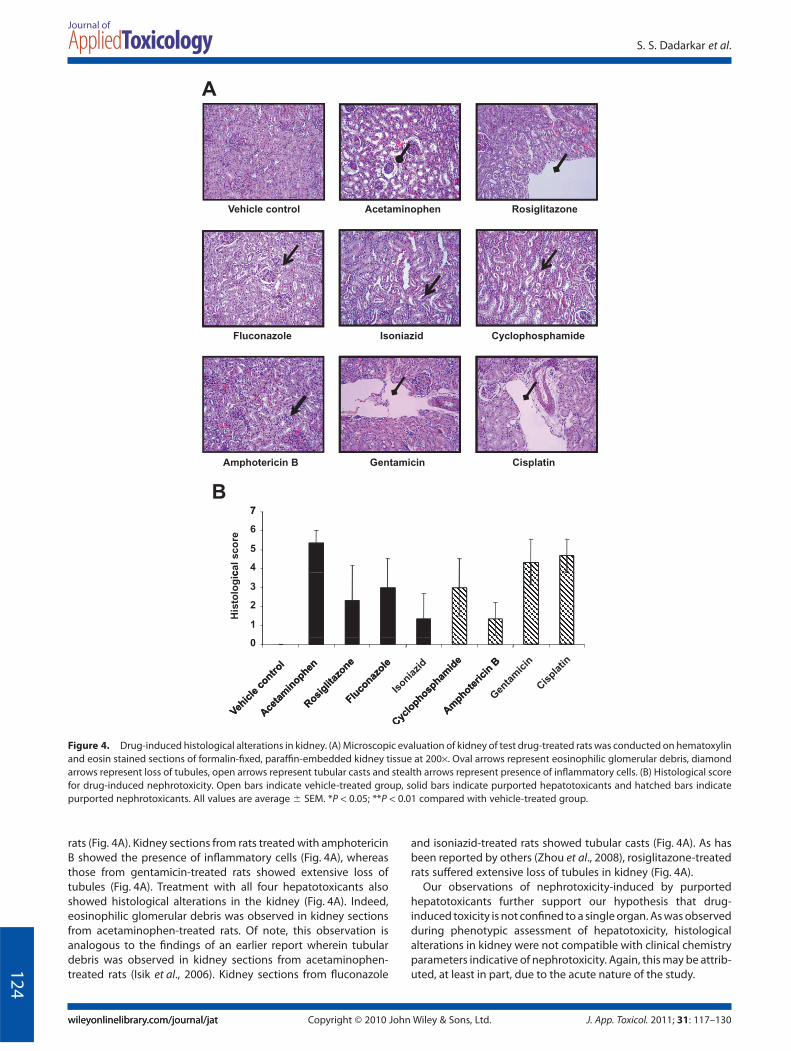
rats (Fig. 4A). Kidney sections from rats treated with amphotericinB showed the presence of inflammatory cells (Fig. 4A), whereasthose from gentamicin-treated rats showed extensive loss oftubules (Fig. 4A). Treatment with all four hepatotoxicants alsoshowed histological alterations in the kidney (Fig. 4A). Indeed,eosinophilic glomerular debris was observed in kidney sectionsfrom acetaminophen-treated rats. Of note, this observation isanalogous to the findings of an earlier report wherein tubulardebris was observed in kidney sections from acetaminophen-treated rats (Isik et al., 2006). Kidney sections from fluconazole
and isoniazid-treated rats showed tubular casts (Fig. 4A). As hasbeen reported by others (Zhou et al., 2008), rosiglitazone-treatedrats suffered extensive loss of tubules in kidney (Fig. 4A).
Our observations of nephrotoxicity-induced by purportedhepatotoxicants further support our hypothesis that drug-induced toxicity is not confined to a single organ. As was observedduring phenotypic assessment of hepatotoxicity, histologicalalterations in kidney were not compatible with clinical chemistryparameters indicative of nephrotoxicity. Again, this may be attrib-uted, at least in part, due to the acute nature of the study.
A
Vehicle control Acetaminophen Rosiglitazone
Fluconazole Isoniazid Cyclophosphamide
Amphotericin B Gentamicin Cisplatin
B7
4
5
6
7
cal
sco
re
1
2
3
His
tolo
gic
0
Figure 4. Drug-induced histological alterations in kidney. (A) Microscopic evaluation of kidney of test drug-treated rats was conducted on hematoxylinand eosin stained sections of formalin-fixed, paraffin-embedded kidney tissue at 200¥. Oval arrows represent eosinophilic glomerular debris, diamondarrows represent loss of tubules, open arrows represent tubular casts and stealth arrows represent presence of inflammatory cells. (B) Histological scorefor drug-induced nephrotoxicity. Open bars indicate vehicle-treated group, solid bars indicate purported hepatotoxicants and hatched bars indicatepurported nephrotoxicants. All values are average � SEM. *P < 0.05; **P < 0.01 compared with vehicle-treated group.
124
S. S. Dadarkar et al.
J. App. Toxicol. 2011; 31: 117–130wileyonlinelibrary.com/journal/jatwileyonlinelibrary.com/journal/jat Copyright © 2010 John Wiley & Sons, Ltd.

Genomic Assessment of Drug-induced Multi-organ Toxicity
An emerging method in organ toxicity research is applying genetranscript profiling to detect expression changes associated withtoxicity (Wang et al., 2008). This fact, combined with the inad-equate alterations in conventional phenotypic markers of toxicityin our analyses, led us to investigate the drug-induced changes intranscriptional profile of liver and kidney. Separately, we wantedto adopt a genomic approach to probe our hypothesis that wholeblood cells could be used as a surrogate for studying drug-induced toxicity in extra-hematological organs. To that end, athorough literature search was conducted to facilitate the iden-tification of potential genomic markers of toxicity to be evaluatedin our study. It is now well established that only a small subset ofgenes or ‘focused expression profiling design’ (Jiang et al., 2007)is necessary to monitor and/or predict toxicity without sacrificingsensitivity (Vass et al., 2009; Wang et al., 2008). Accordingly, wechose a set of 30 genes (Table 2) implicated in prior rodentstudies as markers of organ toxicity (Ferguson et al., 2008; Huanget al., 2004; Minami et al., 2005; Vass et al., 2009; Wang et al., 2008)and quantified the drug-induced changes of their expression inliver, kidney and whole blood cells. Of note, the selected genesare known to play a critical role in host immunity, drug resistance,apoptosis, cell death, tissue regeneration and remodeling. Ouranalyses revealed that each of the eight drugs had its own uniquegene expression pattern (Fig. 5). Furthermore, this gene expres-sion pattern was not similar across the three different organs(Fig. 5), clearly demonstrating a lack of organ fidelity of individualdrug-induced toxicity. However, it was noticeable that, within aparticular organ, few drugs showed a similarity in gene expres-sion patterns (Fig. 5). Indeed, in liver, cyclophosphamide inducedgene expression patterns similar to that induced by amphotericinB, whereas gentamicin and cisplatin induced similar gene expres-sion patterns (Fig. 5). In kidney, amphotericin B and gentamicininduced comparable changes in transcriptional profile (Fig. 5).In whole blood cells, rosiglitazone and fluconazole causedup-regulation of similar genes and gentamicin and isoniazidcaused down-regulation of similar genes (Fig. 5).
We next sought to identify a set of genes, which could beutilized as ‘fingerprints’ for drug-induced organ toxicity. Initially,we performed group analyses of the drug-induced changes ingene expression in kidney. It was observed that all test drugsknown to cause nephrotoxicity (cyclophosphamide, amphoteri-cin B, gentamicin and cisplatin; nephrotoxicants) caused anincrease in gene expression of Mpo (Myeloperoxidase), Spp1(secreted phosphoprotein 1) and Tnf (tumor necrosis factor) anda simultaneous decrease in gene expression of Gstp1 (glu-tathione S-transferase pi 1) and Gstt1 (Glutathione s transferasetheta 1) (Fig. 5B). Based on these findings, one could hypothesizethat the observed expression pattern of the aforementioned fivegenes could be a putative fingerprint for drug-induced nephro-toxicity. Histological analyses had revealed that all test drugsknown to cause hepatotoxicity (acetaminophen, rosiglitazone,fluconazole and isoniazid; hepatotoxicants) also induced kidneydamage. Accordingly, we probed the above hypothesis by ana-lyzing the hepatotoxicant-induced changes in the expression ofthese five genes in kidney. Remarkably, hepatotoxicant-inducedchanges in gene expression of Spp1 and Gstp1 followed a similarpattern to that of nephrotoxicant-induced changes (Fig. 5). Thus,it is reasonable to postulate that increase in Spp1 and concomi-tant decrease in Gstp1 could be markers for drug-induced neph-rotoxicity. We next sought to investigate whether whole blood
cells could be used as a surrogate for drug-induced nephrotoxic-ity. Accordingly, we analyzed the drug-induced changes in geneexpression of Spp1 and Gstp1 in whole blood cells and comparedtheir corresponding changes in expression in kidney. It wasobserved that six out of eight drugs caused a decrease in geneexpression of Spp1 in whole blood cells (Fig. 5). Although theobserved expression pattern of Spp1 in whole blood cells corre-sponds inversely to its expression pattern in kidney, these resultssuggest that changes in Spp1 expression in whole blood cellscould possibly be used as a surrogate for drug-induced nephro-toxicity. Drug-induced changes in Gstp1 expression in wholeblood cells did not correspond directly or inversely to its expres-sion pattern in kidney (Fig. 5).
A similar approach of group analyses led to the identificationof decrease in expression of Cyp3a1 (Cytochrome P450, family3a1) in liver as a marker for drug-induced hepatotoxicity (Fig. 5).Intriguingly, no correlation was observed with expression of thisgene in whole blood cells, suggesting that changes in the expres-sion of this gene in whole blood cells may not be used as asurrogate marker for hepatotoxicity.
Given that group analyses failed to convincingly demonstrate a‘fingerprint’ or gene expression pattern in whole blood cellswhich could effectively predict drug-induced toxicity in extra-hematological organs, we analyzed the data on an ‘individual’drug basis. There have been recent instances of adopting such anapproach (Lobenhofer et al., 2008; Umbright et al., 2010). Weobserved that in whole blood cells a set of genes could be utilizedas a ‘surrogate’ for drug-induced organ toxicity; however, this setof genes is drug-dependent and, moreover, is unique for eachorgan (Table 3). For example, in acetaminophen treated rats (i)changes in expression of Lcn2 (neutrophil gelatinase-associatedlipocalin 2), Clu (Clusterin) and Ccr2 [chemokine (C-C motif )receptor 2] in whole blood cells could be used as a surrogate foracetaminophen-induced hepatotoxicity (Table 3) and (ii) changein expression of Lcn2 in whole blood cells could be used as asurrogate for acetaminophen-induced nephrotoxicity (Table 3).
DISCUSSION
The majority of the studies in academic and industrial toxicologyhave focused on understanding the drug-induced ‘specific’ organtoxicity (Luhe et al., 2005). These studies have led to the identifi-cation of markers of toxicity in individual organs such as liver(Huang et al., 2004) and kidney (Wang et al., 2008). However, thereis little, if any, information on drug-induced concomitant multi-organ toxicity. This is surprising, particularly given that underphysiological and hemodynamic conditions any drug can haveaffinity to multiple tissues and thereby can induce responses inmultiple organs (Cohen, 1986). These responses can be eitherexpected (beneficial/efficacious) effects or, more often, unex-pected (adverse/toxic) effects. Accordingly, we investigated themulti-organ toxicity induced by eight known hepatotoxicantsand/or nephrotoxicants. In our study, an acute and severe toxicresponse was induced in female rats (the more sensitive gender;Ramaiah and Rittling, 2007) by administering the test drugs for24 h. Maximum tolerated dose of test drugs was utilized to inflict arelatively intense toxic response which may otherwise have beensubtle with lower doses at such an early time-point. Intriguingly,rats treated with test drugs did not exhibit any clinical signs oftoxicity. Furthermore, the overall body weight of these rats alsodid not deviate significantly from pre-treatment (data not shown). 125
Phenotypic and genotypic assessment of drug-induced toxicity
J. App. Toxicol. 2011; 31: 117–130 wileyonlinelibrary.com/journal/jatwileyonlinelibrary.com/journal/jatCopyright © 2010 John Wiley & Sons, Ltd.

en
eA
Aceta
min
op
hen
F Iso
nia
zid
Ro
sig
lita
zo
ne
Aceta
min
op
hen
Flu
co
nazo
le
Iso
nia
zid
Ro
sig
lita
zo
ne
Aceta
min
op
he
Flu
co
nazo
le
Iso
nia
zid
Ro
sig
lita
zo
neA
Li
Li
Flu
co
na
zo
le
Li
I
Li
Ki
Ki
Ki
Ki
Bl A
Bl
Bl
Bl
Sod1Gstt1Slc11a1H 1Havcr1Abcb1Spp1VimBcl2Ccr2Akt1BaxBaxTnfHif1aGadd45aCcl2Ugt1a9MpoCasrCasrCasp8Casp3PpargLcn2CluSod2Selenbp1Selenbp1CatGstp1Gstm2Cyp3a1Hgf
Color range
-2 0 2
am
ide
B am
ide
B am
ide
BB
Cyclo
ph
osp
ha
Am
ph
ote
ricin
Ge
nta
mic
in
Cis
pla
tin
Cyc
lop
ho
sp
ha
Am
ph
ote
ricin
Ge
nta
mic
in
Cis
pla
tin
Cyc
lop
ho
sp
ha
Am
ph
ote
ricin
Ge
nta
mic
in
Cis
pla
tin
B
Li
C
Li A
Li
G
Li
C
Ki C
Ki A
Ki G
Ki C
Bl C
Bl A
Bl G
Bl C
Ugt1a9Cyp3a1PpargG t 2
gGstm2Akt1Ccr2Casp8CasrSod1Abcb1Selenbp1Selenbp1CatGstp1Bcl2BaxGstt1HgfTnfTnfSlc11a1Lcn2CluCasp3MpoHif1aGadd45aGadd45aSod2Havcr1Spp1VimCcl2
Color range
-2 0 2
Figure 5. Clustered heat map of toxicant-induced changes in gene expression in liver, kidney and whole blood cells. (A) Hepatotoxicants; (B)nephrotoxicants. Individual genes are represented in rows while drug treatments are in columns. Black represents no change in expression relative tovehicle control. Augmented and diminished expression is represented by increasing intensity of red and green, respectively. Expression values depictedare averages of three rats per drug treatment. Gapdh was used as internal control. Li, liver; Ki, kidney; and Bl, whole blood cells.126
S. S. Dadarkar et al.
J. App. Toxicol. 2011; 31: 117–130wileyonlinelibrary.com/journal/jatwileyonlinelibrary.com/journal/jat Copyright © 2010 John Wiley & Sons, Ltd.
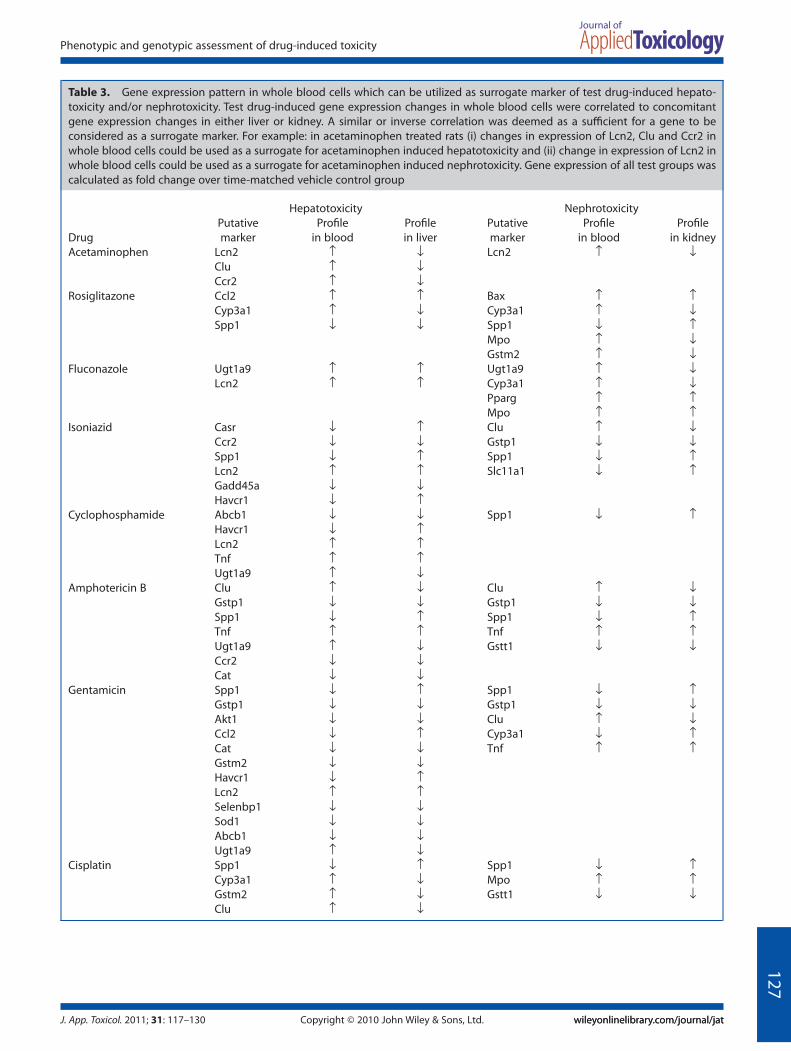
Table 3. Gene expression pattern in whole blood cells which can be utilized as surrogate marker of test drug-induced hepato-toxicity and/or nephrotoxicity. Test drug-induced gene expression changes in whole blood cells were correlated to concomitantgene expression changes in either liver or kidney. A similar or inverse correlation was deemed as a sufficient for a gene to beconsidered as a surrogate marker. For example: in acetaminophen treated rats (i) changes in expression of Lcn2, Clu and Ccr2 inwhole blood cells could be used as a surrogate for acetaminophen induced hepatotoxicity and (ii) change in expression of Lcn2 inwhole blood cells could be used as a surrogate for acetaminophen induced nephrotoxicity. Gene expression of all test groups wascalculated as fold change over time-matched vehicle control group
Drug
Hepatotoxicity NephrotoxicityPutativemarker
Profilein blood
Profilein liver
Putativemarker
Profilein blood
Profilein kidney
Acetaminophen Lcn2 ↑ ↓ Lcn2 ↑ ↓Clu ↑ ↓Ccr2 ↑ ↓
Rosiglitazone Ccl2 ↑ ↑ Bax ↑ ↑Cyp3a1 ↑ ↓ Cyp3a1 ↑ ↓Spp1 ↓ ↓ Spp1 ↓ ↑
Mpo ↑ ↓Gstm2 ↑ ↓
Fluconazole Ugt1a9 ↑ ↑ Ugt1a9 ↑ ↓Lcn2 ↑ ↑ Cyp3a1 ↑ ↓
Pparg ↑ ↑Mpo ↑ ↑
Isoniazid Casr ↓ ↑ Clu ↑ ↓Ccr2 ↓ ↓ Gstp1 ↓ ↓Spp1 ↓ ↑ Spp1 ↓ ↑Lcn2 ↑ ↑ Slc11a1 ↓ ↑Gadd45a ↓ ↓Havcr1 ↓ ↑
Cyclophosphamide Abcb1 ↓ ↓ Spp1 ↓ ↑Havcr1 ↓ ↑Lcn2 ↑ ↑Tnf ↑ ↑Ugt1a9 ↑ ↓
Amphotericin B Clu ↑ ↓ Clu ↑ ↓Gstp1 ↓ ↓ Gstp1 ↓ ↓Spp1 ↓ ↑ Spp1 ↓ ↑Tnf ↑ ↑ Tnf ↑ ↑Ugt1a9 ↑ ↓ Gstt1 ↓ ↓Ccr2 ↓ ↓Cat ↓ ↓
Gentamicin Spp1 ↓ ↑ Spp1 ↓ ↑Gstp1 ↓ ↓ Gstp1 ↓ ↓Akt1 ↓ ↓ Clu ↑ ↓Ccl2 ↓ ↑ Cyp3a1 ↓ ↑Cat ↓ ↓ Tnf ↑ ↑Gstm2 ↓ ↓Havcr1 ↓ ↑Lcn2 ↑ ↑Selenbp1 ↓ ↓Sod1 ↓ ↓Abcb1 ↓ ↓Ugt1a9 ↑ ↓
Cisplatin Spp1 ↓ ↑ Spp1 ↓ ↑Cyp3a1 ↑ ↓ Mpo ↑ ↑Gstm2 ↑ ↓ Gstt1 ↓ ↓Clu ↑ ↓
127
Phenotypic and genotypic assessment of drug-induced toxicity
J. App. Toxicol. 2011; 31: 117–130 wileyonlinelibrary.com/journal/jatwileyonlinelibrary.com/journal/jatCopyright © 2010 John Wiley & Sons, Ltd.
It is suggested in the literature that increasing doses leads togreater perturbations in gene expression which eventually resultin gross tissue damage as detected by conventional markers oftoxicity (Heinloth et al., 2004). However, the chronic effect of suchhigh doses needs further investigation so as to capture theireffects on the genome.
At the onset, drug-induced toxicity was assessed both in liverand kidney using phenotypic parameters (clinical chemistry,organ weight and histology). These analyses revealed that theselected test drugs instigated toxicity either in liver or kidney orboth (Figs 1–4). The histopathological findings of our study are inagreement with prior reported observations (El-Sayyad et al.,2009; Fielden et al., 2005; Heinloth et al., 2007). We found thatfluconazole and amphotericin B caused toxicological damage inkidney (as assessed by histological alterations) even in theabsence of significant changes in pertinent clinical chemistryparameters. The observed lack of significant changes in certainphenotypic indicators of toxicity (e.g. creatinine; Fig. 1F) may beattributed, at least in part, to the short duration of our study.Indeed, consistent changes in all clinical chemistry parametersmay occur only after prolonged periods of dosing and may besubtle to interpret in short-term studies (Blomme et al., 2009; Ishiiet al., 2007). Interestingly, we observed that cisplatin and gen-tamicin induced significant alterations in levels of urea (Fig. 1E).These observations are in contrast to earlier reports (Wang et al.,2008) wherein the drug-induced increases in levels of urea areobserved after 48–72 h of drug treatment. These differentialobservations could be due to differences in strains of rats (Kacew,2001) and/or increased susceptibility of the younger rats utilizedin our study. Irrespectively, histological analyses confirmed thatboth cisplatin and gentamicin elicited renal injury as evidencedby microscopic alterations in kidney (Fig. 4).
It has been well recognized that phenotypic toxicological data(e.g. clinical chemistry parameters) when integrated with geneexpression profiling, especially during inadequate phenotypicanchorage, may provide a holistic picture of drug induced toxic-ity (Auman et al., 2007; Beyer et al., 2007; Davis and Kramer, 2006).Accordingly, gene expression profiling of drug-treated liver andkidney was carried out. It has been reported that even a smallnumber (i.e. n < 100) of randomly selected subset of genes canapproximately reproduce the biological relevance of hierarchicalclustering tree of the full data set (Son et al., 2005). In the presentstudy, we evaluated 30 genes that were indicated in literature tobe dysregulated during drug-induced toxicity (Bartosiewicz et al.,2001). This methodology of adopting a ‘toxicity gene panel’ hasprior precedence (Bartosiewicz et al., 2001).
We observed that multivariate transcriptional patterns definehepatotoxicity and/or nephrotoxicity associated with the phar-macological agents utilized in our study. Interestingly, each drugelicited unique and organ-specific gene expression pattern withlimited similarity across liver and kidney (Fig. 5). These latter find-ings are in line with earlier studies demonstrating remarkableheterogeneity at the transcript level between different tissues(Son et al., 2005; Sorlie et al., 2006). A detailed analyses of ourdata identified a considerable number of genes which were dys-regulated in liver and kidney upon toxicant exposure. Clusteranalyses of data led to the identification of changes in geneexpression of Spp1 and Gstp1 in kidney as a possible ‘fingerprint’of drug-induced nephrotoxicity. Spp1, also known as osteopon-tin, is implicated in hepatic inflammation (Ramaiah and Rittling,2008) and renal failure (Verstrepen et al., 2001). Of note, nephro-toxicant induced-heightened expression of Spp1 in kidney has
been reported by others (Wang et al., 2008). Gstp1, an importantmember of the glutathione family involved in drug metabolism(Wang et al., 1999), has also been previously implicated (clini-cally) in renal disease (Agrawal et al., 2007). Cluster analyses alsoled to the identification of changes in gene expression of Cyp3a1in liver as a possible ‘fingerprint’ of drug-induced hepatotoxicity.Our findings with Cyp3a1, a cytochrome P450 isozyme respon-sible for metabolizing drugs, are not entirely surprising. Indeed,prior studies have shown that (i) ischemia/reperfusion-inducedhepatotoxicity is associated with a decrease in expression ofCyp3a1 (Wang et al., 2009), (ii) hepatotoxicants such as acetami-nophen inhibit Cyp3a1 in centrilobar region in liver (Debri et al.,1995) and (iii) expression of cytochrome P450 isozymes changesas part of drug induced liver damage (Wang et al., 1999).
Our approach thus indicates that the transcriptional responseof multiple organs to perturbations in normal physiologicalhomeostasis may yield ‘fingerprints’ for drug-induced hepatotox-icity and/or nephrotoxicity. These organ-specific markers may besubtle indicators of drug-induced toxicity in acute studies whichmay be difficult to capture by conventional phenotypic param-eters. However, it remains to be elucidated whether the toxico-logical ‘fingerprints’ obtained in our study are specific to thegroup of test drugs (utilized in our study) and/or the degree oftoxicity elicited by the test drugs. Clearly, a thorough character-ization and validation of these ‘fingerprints’ requires genera-tion of additional data using multiple therapeutically relevantcompounds at various doses and time points. Furthermore, it isplausible that genes apart from the panel considered in ourstudy may be critical, and possibly serve as better indicatorsof test drug-induced hepatotoxicity and/or nephrotoxicity.Future studies including thorough investigations utilizing globalmicroarray are warranted.
Biopsies of visceral tissues like liver and kidney are seldomavailable to ascertain the drug-related toxicity in patients. Con-sequently, specific genes indicative of hepatotoxicity and/ornephrotoxicity remain poorly defined (Wang et al., 2008). In con-trast, whole blood is the most easily accessible human biologicalmaterial (Burczynski and Dorner, 2006) and its use to serve assurrogate of vital organ toxicity is slowly gaining popularity.Accordingly, it would be advantageous to study changes in geneexpression of whole blood cells which could indicate toxicity ofextra-hematological organs (Mendrick, 2008). Indeed, somestudies have already explored the promise of this concept(Lobenhofer et al., 2008; Umbright et al., 2010). Even though theprecise involvement of target organs to the altered blood geneexpression is currently not well defined, the possibility that thealterations in gene expression in the blood is as a result of directinteraction of the toxicant with blood rather than being medi-ated through a target organ has been addressed by others(Umbright et al., 2010). In this study, we utilized a genomicapproach and correlated the test drug-induced gene expressionchanges in whole blood cells to concomitant gene expressionchanges in either liver or kidney. Our approach is analogous tothat of a recent study (Umbright et al., 2010) wherein the authorsutilized a hepatotoxicant and a neurotoxicant for deriving bloodgene expression markers as non-invasive surrogates for targetorgan toxicity. In our study, we found that changes in geneexpression of Spp1 in whole blood cells could possibly be used asa surrogate for drug-induced nephrotoxicity. We observed thatthe expression pattern of Spp1 in whole blood cells corre-sponded inversely to its expression pattern in kidney. One of theplausible explanations for this inverse correlation could be mobi-
128
S. S. Dadarkar et al.
J. App. Toxicol. 2011; 31: 117–130wileyonlinelibrary.com/journal/jatwileyonlinelibrary.com/journal/jat Copyright © 2010 John Wiley & Sons, Ltd.

lization of Spp1-expressing monocytes/macrophages from bloodto kidney to facilitate kidney regeneration (Iguchi et al., 2004) ascounter-response to toxic injury. Of note, changes in Spp1expression may provide a clue to early detection of inflammatoryresponse due to its role in leukocyte infiltration during organtoxicity (Ramaiah and Rittling, 2008) which may be difficult toestablish histomorphologically in an acute study. A prior studyhas suggested that Spp1 levels in whole blood cells have thepotential to serve as a prognostic or diagnostic marker in varioushuman cancers (Rittling and Chambers, 2004). Clearly, futurein-depth studies investigating the role of drug-induced changesin gene expression of Spp1 in whole blood cells as a surrogatemarker for drug-induced nephrotoxicity are warranted. In thiscontext, it would be essential to note that whole blood is a com-plicated biological system (Decristofaro and Daniels, 2008),which manifests high degree of variability in profiling processes(Mohr and Liew, 2007). Our results also reveal a relatively variablecorrelation between the levels of gene expression produced bythe various drugs concomitantly in liver and kidney comparedwith whole blood cells. Hence, judicious use of drug-inducedchanges in whole blood cells may serve as surrogate markers ofextra-hematological organ toxicity.
In conclusion, we have studied the ‘concurrent’ responseof liver, kidney and whole blood cells during a toxic assault ofestablished therapeutics in a rodent model. We show that drug-induced toxicity is not confined to a particular organ. Further-more, our findings reveal that each drug generates unique andorgan specific gene expression patterns. The cluster analyses of aparticular class of drugs (either hepatotoxic or nephrotoxic) leadsto characteristic ‘fingerprints’ indicative of corresponding organtoxicity (liver or kidney, respectively). In whole blood cells, a set ofgenes entirely different from these ‘fingerprints’ is closely associ-ated with individual drug-induced specific extra-hematologicalorgan toxicity. Nevertheless, establishment of unique transcriptprofiles in experimental set-up like the current study gears ustowards the ultimate understanding of specific as well as multi-organ toxicity caused by therapeutics.
Acknowledgments
We thank Arvind Thakkar for expert technical assistance anduseful discussions.
REFERENCES
Abraham P, Sugumar E. 2008. Enhanced PON1 activity in the kidneys ofcyclophosphamide treated rats may play a protective role as an anti-oxidant against cyclophosphamide induced oxidative stress. Arch.Toxicol. 82(4): 237–238.
Agrawal S, Tripathi G, Khan F, Sharma R, Baburaj VP. 2007. Relationshipbetween GSTs gene polymorphism and susceptibility to end stagerenal disease among North Indians. Renal Failure 29(8): 947–953.
Alkahtani S, Alarifi S, Al-Doaiss A. 2009. Detection of apoptotsis inducedby gentamicin in rat hepatocytes. Int. J. Zool. Res. 5(4): 161–170.
Auman JT, Boorman GA, Wilson RE, Travlos GS, Paules RS. 2007. Heat mapvisualization of high-density clinical chemistry data. Physiol. Genom.31(2): 352–356.
Bartosiewicz MJ, Jenkins D, Penn S, Emery J, Buckpitt A. 2001. Uniquegene expression patterns in liver and kidney associated with expo-sure to chemical toxicants. J. Pharmacol. Exp. Ther. 297(3): 895–905.
Beyer RP, Fry RC, Lasarev MR, McConnachie LA, Meira LB, PalmerVS, Powell CL, Ross PK, Bammler TK, Bradford BU, Cranson AB,Cunningham ML, Fannin RD, Higgins GM, Hurban P, Kayton RJ, KerrKF, Kosyk O, Lobenhofer EK, Sieber SO, Vliet PA, Weis BK, Wolfinger R,Woods CG, Freedman JH, Linney E, Kaufmann WK, Kavanagh TJ,
Paules RS, Rusyn I, Samson LD, Spencer PS, Suk W, Tennant RJ, Zarbl H.2007. Multicenter study of acetaminophen hepatotoxicity reveals theimportance of biological endpoints in genomic analyses. Toxicol. Sci.99(1): 326–337.
Blomme EA, Warder SE. 2008. Methods in Pharmacology and Toxicology:Biomarker Methods in Drug Discovery and Development, Wang F (ed.).Humana Press: Totowa, NJ.
Blomme EA, Yang Y, Waring JF. 2009. Use of toxicogenomics to under-stand mechanisms of drug-induced hepatotoxicity during drug dis-covery and development. Toxicol. Lett. 186(1): 22–31.
Burczynski ME. 2009. Pharmacogenomic approaches in clinical studies toidentify biomarkers of safety and efficacy. Toxicol. Lett. 186(1): 18–21.
Burczynski ME, Dorner AJ. 2006. Transcriptional profiling of peripheralblood cells in clinical pharmacogenomic studies. Pharmacogenomics7(2): 187–202.
Castle AL, Carver MP, Mendrick DL. 2002. Toxicogenomics: a new revolu-tion in drug safety. Drug Discov. Today 7(13): 728–736.
Cohen GM. 1986. Target Organ Toxicity. CRC Press: Boca Raton, FL.Corey DR. 2007. Chemical modification: the key to clinical application of
RNA interference? J. Clin. Invest. 117(12): 3615–3622.Dagia NM, Kamath DV, Bhatt P, Gupte RD, Dadarkar SS, Fonseca L,
Agarwal G, Chetrapal-Kunwar A, Balachandran S, Srinivasan S, Bose J,Pari K, Rao CB, Parkale SS, Gadekar PK, Rodge AH, Mandrekar N,Vishwakarma RA, Sharma S. 2009. A fluorinated analog of ISO-1 blocksthe recognition and biological function of MIF and is orally efficaciousin a murine model of colitis. Eur. J. Pharmacol. 607(1–3): 201–212.
Dagia NM, Agarwal G, Kamath DV, Chetrapal-Kunwar A, Gupte RD, JadhavMG, Dadarkar SS, Trivedi J, Kulkarni-Almeida AA, Kharas F, Fonseca LC,Kumar S, Bhonde MR. 2010. A preferential p110a/g PI3K inhibitorattenuates experimental inflammation by suppressing the produc-tion of proinflammatory mediators in NF-kB dependent manner. Am.J. Physiol. Cell Physiol. 298: 929–941.
Davis JW, Kramer JA. 2006. Genomic-based biomarkers of drug-inducednephrotoxicity. Expert. Opin. Drug Metab. Toxicol. 2(1): 95–101.
Debri K, Boobis AR, Davies DS, Edwards RJ. 1995. Distribution and induc-tion of CYP3A1 and CYP3A2 in rat liver and extrahepatic tissues.Biochem. Pharmacol. 50(12): 2047–2056.
Decristofaro MF, Daniels KK. 2008. Toxicogenomics in biomarker discov-ery. Meth. Mol. Biol. 460: 185–194.
Eisen MB, Spellman PT, Brown PO, Botstein D. 1998. Cluster analysis anddisplay of genome-wide expression patterns. Proc. Natl Acad. Sci. USA95(25): 14863–14868.
El-Sayyad HI, Ismail MF, Shalaby FM, Abou-El-Magd RF, Gaur RL, FernandoA, Raj MH, Ouhtit A. 2009. Histopathological effects of cisplatin, doxo-rubicin and 5-flurouracil (5-FU) on the liver of male albino rats. Int. J.Biol. Sci. 5(5): 466–473.
Ferguson MA, Vaidya VS, Bonventre JV. 2008. Biomarkers of nephrotoxicacute kidney injury. Toxicology 245(3): 182–193.
Fielden MR, Eynon BP, Natsoulis G, Jarnagin K, Banas D, Kolaja KL. 2005. Agene expression signature that predicts the future onset of drug-induced renal tubular toxicity. Toxicol. Pathol. 33(6): 675–683.
Ghani AR, Zainudin S, Kamaruddin NA, Kong NC. 2009. Acute renal failurefollowing the use of rosiglitazone in a chronic kidney disease patient.Singapore Med. J. 50: 32–34.
Gueguen Y, Grandcolas L, Baudelin C, Grison S, Tissandie E, Jourdain JR,Paquet F, Voisin P, Aigueperse J, Gourmelon P, Souidi M. 2007. Effectof acetaminophen administration to rats chronically exposed todepleted uranium. Toxicology 229(1–2): 62–72.
Heinloth AN, Irwin RD, Boorman GA, Nettesheim P, Fannin RD, Sieber SO,Snell ML, Tucker CJ, Li L, Travlos GS, Vansant G, Blackshear PE, TennantRW, Cunningham ML, Paules RS. 2004. Gene expression profiling of ratlivers reveals indicators of potential adverse effects. Toxicol. Sci. 80(1):193–202.
Heinloth AN, Boorman GA, Foley JF, Flagler ND, Paules RS. 2007. Geneexpression analysis offers unique advantages to histopathology inliver biopsy evaluations. Toxicol. Pathol. 35(2): 276–283.
Hirakawa B, Jessen BA, Illanes O, Peyster AD, McDermott T, Stevens GJ.2008. Toxicogenomic analysis of cardiototxicity in rats. GenomicsInsights 1: 3–13.
Huang Q, Jin X, Gaillard ET, Knight BL, Pack FD, Stoltz JH, Jayadev S,Blanchard KT. 2004. Gene expression profiling reveals multiple toxicityendpoints induced by hepatotoxicants. Mutat. Res. 549(1–2): 147–167.
Ibrahim MY, Abdul AB, Wahab SI, Elhassan MM, Alzubairi AS, Syam MM.2009. Attenuation of cisplatin-induced hepatotoxicity in rats usingzerumbone. Res. J. Biol. Sci. 4(7): 777–784. 129
Phenotypic and genotypic assessment of drug-induced toxicity
J. App. Toxicol. 2011; 31: 117–130 wileyonlinelibrary.com/journal/jatwileyonlinelibrary.com/journal/jatCopyright © 2010 John Wiley & Sons, Ltd.

Iguchi S, Nishi S, Ikegame M, Hoshi K, Yoshizawa T, Kawashima H, ArakawaM, Ozawa H, Gejyo F. 2004. Expression of osteopontin in cisplatin-induced tubular injury. Nephron Exp. Nephrol. 97(3): e96–105.
Inselmann G, Inselmann U, Heidemann HT. 2002. Amphotericin B andliver function. Eur. J. Intern. Med. 13(5): 288–292.
Ishii A, Sakai Y, Nakamura A. 2007. Molecular pathological evaluation ofclusterin in a rat model of unilateral ureteral obstruction as a possiblebiomarker of nephrotoxicity. Toxicol. Pathol. 35(3): 376–382.
Isik B, Bayrak R, Akcay A, Sogut S. 2006. Erdosteine against acetami-nophen induced renal toxicity. Mol. Cell Biochem. 287(1–2): 185–191.
Jiang Y, Gerhold DL, Holder DJ, Figueroa DJ, Bailey WJ, Guan P, Skopek TR,Sistare FD, Sina JF. 2007. Diagnosis of drug-induced renal tubulartoxicity using global gene expression profiles. J. Transl. Med. 5: 47.
Kacew S. 2001. Confounding factors in toxicity testing. Toxicology 160(1–3): 87–96.
Lavallie ER, Dorner AJ, Burczynski ME. 2008. Use of ex vivo systems forbiomarker discovery. Curr. Opin. Pharmacol. 8(5): 647–653.
Lavin P, Koss LG. 1971. Effects of a single dose of cyclophosphamide onvarious organs in the rat. 3. Electron microscopic study of the liver.Am. J. Pathol. 62(2): 159–168.
Lee WM. 2003. Drug-induced hepatotoxicity. New Engl. J. Med. 349(5):474–485.
Lobenhofer EK, Auman JT, Blackshear PE, Boorman GA, Bushel PR,Cunningham ML, Fostel JM, Gerrish K, Heinloth AN, Irwin RD, MalarkeyDE, Merrick BA, Sieber SO, Tucker CJ, Ward SM, Wilson RE, Hurban P,Tennant RW, Paules RS. 2008. Gene expression response in targetorgan and whole blood varies as a function of target organ injuryphenotype. Genome Biol. 9(6): R100.
Luhe A, Suter L, Ruepp S, Singer T, Weiser T, Albertini S. 2005. Toxicoge-nomics in the pharmaceutical industry: hollow promises or realbenefit? Mutat. Res. 575(1–2): 102–115.
Matthews EJ, Kruhlak NL, Benz RD, Aragones Sabate D, Marchant CA,Contrera JF. 2009. Identification of structure–activity relationships foradverse effects of pharmaceuticals in humans: Part C: use of QSARand an expert system for the estimation of the mechanism of actionof drug-induced hepatobiliary and urinary tract toxicities. Regul.Toxicol. Pharmacol. 54(1): 43–65.
Mendrick DL. 2008. Genomic and genetic biomarkers of toxicity. Toxicol-ogy 245(3): 175–181.
Minami K, Saito T, Narahara M, Tomita H, Kato H, Sugiyama H, Katoh M,Nakajima M, Yokoi T. 2005. Relationship between hepatic geneexpression profiles and hepatotoxicity in five typical hepatotoxicant-administered rats. Toxicol. Sci. 87(1): 296–305.
Mohr S, Liew CC. 2007. The peripheral-blood transcriptome: new insightsinto disease and risk assessment. Trends. Mol. Med. 13(10): 422–432.
Morishita K, Mizukawa Y, Kasahara T, Okuyama M, Takashima K, ToritsukaN, Miyagishima T, Nagao T, Urushidani T. 2006. Gene expressionprofile in liver of differing ages of rats after single oral administrationof acetaminophen. J. Toxicol. Sci. 31(5): 491–507.
Ozaki N, Matheis KA, Gamber M, Feidl T, Nolte T, Kalkuhl A, Deschl U. 2009.Identification of genes involved in gentamicin-induced nephrotoxic-ity in rats – a toxicogenomic investigation. Exp. Toxicol. Pathol.DOI:10.1016/j.etp.2009.07.004.
Pickavance LC, Tadayyon M, Widdowson PS, Buckingham RE, Wilding JP.1999. Therapeutic index for rosiglitazone in dietary obese rats: sepa-ration of efficacy and haemodilution. Br. J. Pharmacol. 128(7): 1570–1576.
Poloyac SM, Tortorici MA, Przychodzin DI, Reynolds RB, Xie W, Frye RF,Zemaitis MA. 2004. The effect of isoniazid on CYP2E1- and CYP4A-mediated hydroxylation of arachidonic acid in the rat liver and kidney.Drug Metab. Dispos. 32(7): 727–733.
Powell CL, Kosyk O, Ross PK, Schoonhoven R, Boysen G, Swenberg JA,Heinloth AN, Boorman GA, Cunningham ML, Paules RS, Rusyn I. 2006.Phenotypic anchoring of acetaminophen-induced oxidative stresswith gene expression profiles in rat liver. Toxicol. Sci. 93(1): 213–222.
Ramaiah SK, Rittling S. 2007. Role of osteopontin in regulating hepaticinflammatory responses and toxic liver injury. Expert. Opin. Drug.Metab. Toxicol. 3(4): 519–526.
Ramaiah SK, Rittling S. 2008. Pathophysiological role of osteopontin inhepatic inflammation, toxicity, and cancer. Toxicol. Sci. 103(1): 4–13.
Rittling SR, Chambers AF. 2004. Role of osteopontin in tumour progres-sion. Br. J. Cancer 90(10): 1877–1881.
Sahu SC. 2008. Toxicogenomics: a Powerful Tool for Toxicity Assessment.John Wiley & Sons: Chichester.
Somchit N, Norshahida AR, Hasiah AH, Zuraini A, Sulaiman MR, NoordinMM. 2004. Hepatotoxicity induced by antifungal drugs itraconazoleand fluconazole in rats: a comparative in vivo study. Hum. Exp. Toxicol.23(11): 519–525.
Son CG, Bilke S, Davis S, Greer BT, Wei JS, Whiteford CC, Chen QR, CenacchiN, Khan J. 2005. Database of mRNA gene expression profiles of mul-tiple human organs. Genome Res. 15(3): 443–450.
Sorlie T, Perou CM, Fan C, Geisler S, Aas T, Nobel A, Anker G, Akslen LA,Botstein D, Borresen-Dale AL, Lonning PE. 2006. Gene expression pro-files do not consistently predict the clinical treatment response inlocally advanced breast cancer. Mol. Cancer Ther. 5(11): 2914–2918.
Tarloff JB, Khairallah EA, Cohen SD, Goldstein RS. 1996. Sex- and age-dependent acetaminophen hepato- and nephrotoxicity in Sprague–Dawley rats: role of tissue accumulation, nonprotein sulfhydryldepletion, and covalent binding. Fundam. Appl. Toxicol. 30(1): 13–22.
Thakkar AD, Raj H, Chakrabarti D, Ravishankar P, Saravanan N,Muthuvelan B, Balakrishnan A, Padigaru M. 2010. Identification ofgene expression signature in estrogen receptor positive breastcarcinoma. Biomark. Cancer 2: 1–15.
Thukral SK, Nordone PJ, Hu R, Sullivan L, Galambos E, Fitzpatrick VD, HealyL, Bass MB, Cosenza ME, Afshari CA. 2005. Prediction of nephrotoxi-cant action and identification of candidate toxicity-related biomark-ers. Toxicol. Pathol. 33(3): 343–355.
Tikoo K, Kumar P, Gupta J. 2009. Rosiglitazone synergizes anticanceractivity of cisplatin and reduces its nephrotoxicity in 7, 12-dimethylbenz{a}anthracene (DMBA) induced breast cancer rats. BMC Cancer 9:107.
Tully DB, Bao W, Goetz AK, Blystone CR, Ren H, Schmid JE, Strader LF,Wood CR, Best DS, Narotsky MG, Wolf DC, Rockett JC, Dix DJ. 2006.Gene expression profiling in liver and testis of rats to characterize thetoxicity of triazole fungicides. Toxicol. Appl. Pharmacol. 215(3): 260–273.
Umbright C, Sellamuthu R, Li S, Kashon M, Luster M, Joseph P. 2010. Bloodgene expression markers to detect and distinguish target organ tox-icity. Mol. Cell Biochem. 335(1–2): 223–234.
Vass L, Kelemen JZ, Feher LZ, Lorincz Z, Kulin S, Cseh S, Dorman G, PuskasLG. 2009. Toxicogenomics screening of small molecules using high-density, nanocapillary real-time PCR. Int. J. Mol. Med. 23(1): 65–74.
Verstrepen WA, Persy VP, Verhulst A, Dauwe S, De Broe ME. 2001. Renalosteopontin protein and mRNA upregulation during acute nephro-toxicity in the rat. Nephrol. Dial. Transplant. 16(4): 712–724.
Wang BY, Li QX, Li J, Xie XF, Ao Y, Ai YX. 2009. Hepatotoxicity and geneexpression down-regulation of CYP isozymes caused by renalischemia/reperfusion in the rat. Exp. Toxicol. Pathol. 61(2): 169–176.
Wang EJ, Snyder RD, Fielden MR, Smith RJ, Gu YZ. 2008. Validation ofputative genomic biomarkers of nephrotoxicity in rats. Toxicology246(2–3): 91–100.
Wang RS, Nakajima T, Honma T. 1999. Different change patterns of theisozymes of cytochrome P450 and glutathione S-transferases inchemically induced liver damage in rat. Ind. Health 37(4): 440–448.
Yuan HD, Jin GZ, Piao GC. 2010. Hepatoprotective effects of an active partfrom Artemisia sacrorum Ledeb. against acetaminophen-induced tox-icity in mice. J. Ethnopharmacol. 127(2): 528–533.
Yuan JS, Reed A, Chen F, Stewart CN, Jr. 2006. Statistical analysis of real-time PCR data. BMC. Bioinformatics 7: 85.
Zhou Y, Vaidya VS, Brown RP, Zhang J, Rosenzweig BA, Thompson KL,Miller TJ, Bonventre JV, Goering PL. 2008. Comparison of kidney injurymolecule-1 and other nephrotoxicity biomarkers in urine and kidneyfollowing acute exposure to gentamicin, mercury, and chromium.Toxicol. Sci. 101(1): 159–170.
Zidek N, Hellmann J, Kramer PJ, Hewitt PG. 2007. Acute hepatotoxicity: apredictive model based on focused illumina microarrays. Toxicol. Sci.99(1): 289–302.
130
S. S. Dadarkar et al.
J. App. Toxicol. 2011; 31: 117–130wileyonlinelibrary.com/journal/jatwileyonlinelibrary.com/journal/jat Copyright © 2010 John Wiley & Sons, Ltd.