Melittopalynological studies of Apis dorsata honey samples ...
Upload
quaideazamCategory
view
0download
0
STUDY OF WOUND HEALING AND ANTIBACTERIAL ACTIVITY OF BIOACTIVE COMPOUNDS FOUND IN HONEY FROM DIFFERENT FLORA
OF PAKISTAN
Farida Iftikhar
(05-arid-313)
Thesis submitted in partial fulfillment of the requirement for the degree of
Doctor of Philosophy
in
Biochemistry
Department of Biochemistry Faculty of Sciences
Pir Mehr Ali Shah Arid Agriculture University Rawalpindi, Pakistan
2010
ii
CERTIFICATION
I hereby undertake that this research is an original one and no part of this thesis falls
under plagiarism. If found otherwise, at any stage, I will be responsible for the consequences.
Name: Farida Iftikhar Signature:
Registration No: 05-arid-313 Date: 26-05-2010
Certified that the contents and form of thesis entitled “Study Of Wound Healing
and Antibacterial Activity of Bioactive Compounds Found in Honey from Different
Flora of Pakistan.” submitted by “Farida Iftikhar” has been found satisfactory for
requirement of the degree.
Supervisor (Dr. Muhammad Gulfraz)
Member (Dr. Ghazala Kaukab Raja)
Member (Dr. Muhammad Arshad)
Chairman:
Dean:
Director Advanced Studies:

iii
D E D ICA TE DD E D ICA TE DD E D ICA TE DD E D ICA TE D
TOTOTOTO
M y P arentsM y P arentsM y P arentsM y P arents
A ndA ndA ndA nd
M yM yM yM y KKKK idsidsidsids
A yeshA yeshA yeshA yeshaaaa B utt B utt B utt B utt & U sm an B uttU sm an B uttU sm an B uttU sm an B utt
iv
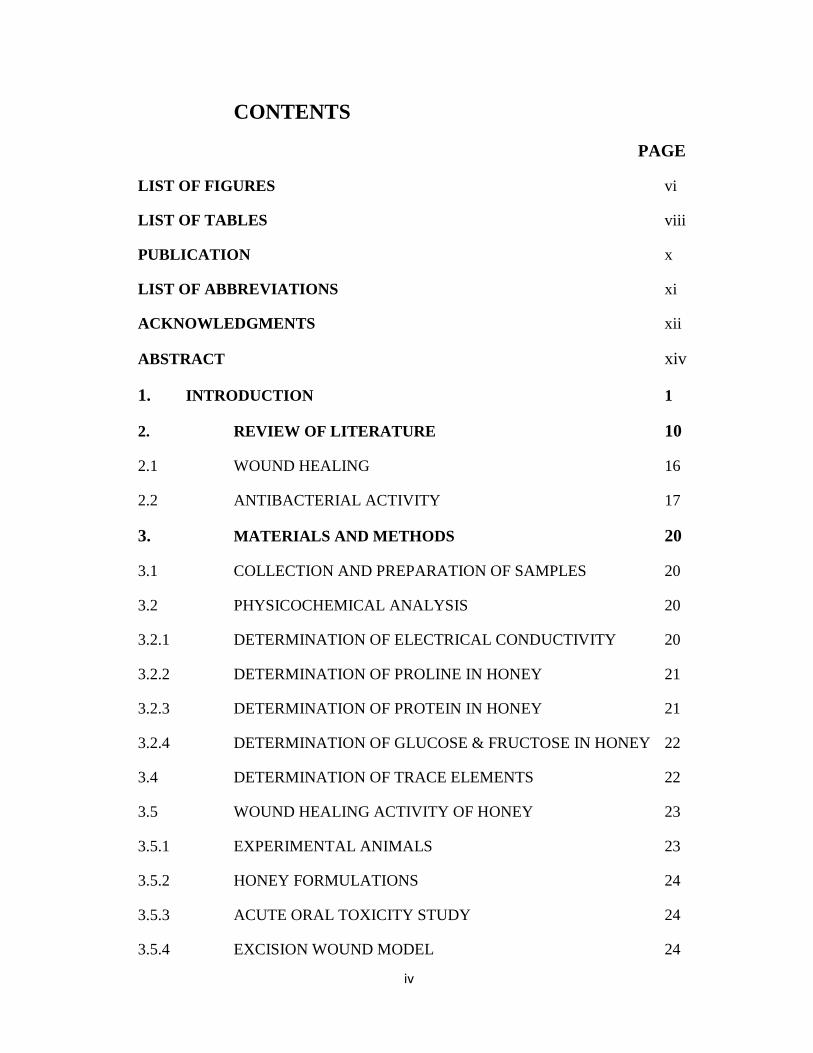
CONTENTS
PAGE
LIST OF FIGURES vi
LIST OF TABLES viii
PUBLICATION x
LIST OF ABBREVIATIONS xi
ACKNOWLEDGMENTS xii
ABSTRACT xiv
1. INTRODUCTION 1
2. REVIEW OF LITERATURE 10
2.1 WOUND HEALING 16
2.2 ANTIBACTERIAL ACTIVITY 17
3. MATERIALS AND METHODS 20
3.1 COLLECTION AND PREPARATION OF SAMPLES 20
3.2 PHYSICOCHEMICAL ANALYSIS 20
3.2.1 DETERMINATION OF ELECTRICAL CONDUCTIVITY 20
3.2.2 DETERMINATION OF PROLINE IN HONEY 21
3.2.3 DETERMINATION OF PROTEIN IN HONEY 21
3.2.4 DETERMINATION OF GLUCOSE & FRUCTOSE IN HONEY 22
3.4 DETERMINATION OF TRACE ELEMENTS 22
3.5 WOUND HEALING ACTIVITY OF HONEY 23
3.5.1 EXPERIMENTAL ANIMALS 23
3.5.2 HONEY FORMULATIONS 24
3.5.3 ACUTE ORAL TOXICITY STUDY 24
3.5.4 EXCISION WOUND MODEL 24
v
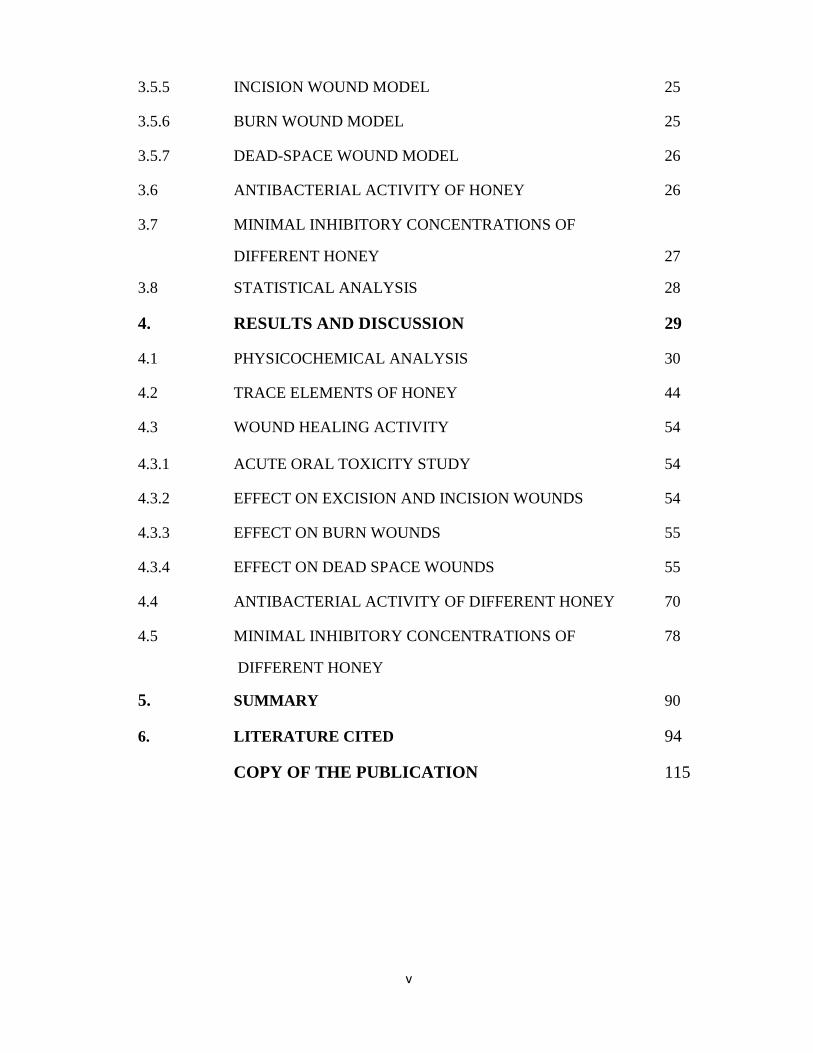
3.5.5 INCISION WOUND MODEL 25
3.5.6 BURN WOUND MODEL 25
3.5.7 DEAD-SPACE WOUND MODEL 26
3.6 ANTIBACTERIAL ACTIVITY OF HONEY 26
3.7 MINIMAL INHIBITORY CONCENTRATIONS OF
DIFFERENT HONEY 27
3.8 STATISTICAL ANALYSIS 28
4. RESULTS AND DISCUSSION 29
4.1 PHYSICOCHEMICAL ANALYSIS 30
4.2 TRACE ELEMENTS OF HONEY 44
4.3 WOUND HEALING ACTIVITY 54
4.3.1 ACUTE ORAL TOXICITY STUDY 54
4.3.2 EFFECT ON EXCISION AND INCISION WOUNDS 54
4.3.3 EFFECT ON BURN WOUNDS 55
4.3.4 EFFECT ON DEAD SPACE WOUNDS 55
4.4 ANTIBACTERIAL ACTIVITY OF DIFFERENT HONEY 70
4.5 MINIMAL INHIBITORY CONCENTRATIONS OF 78
DIFFERENT HONEY
5. SUMMARY 90
6. LITERATURE CITED 94
COPY OF THE PUBLICATION 115

vi
LIST OF FIGURES
Fig. No. PAGE
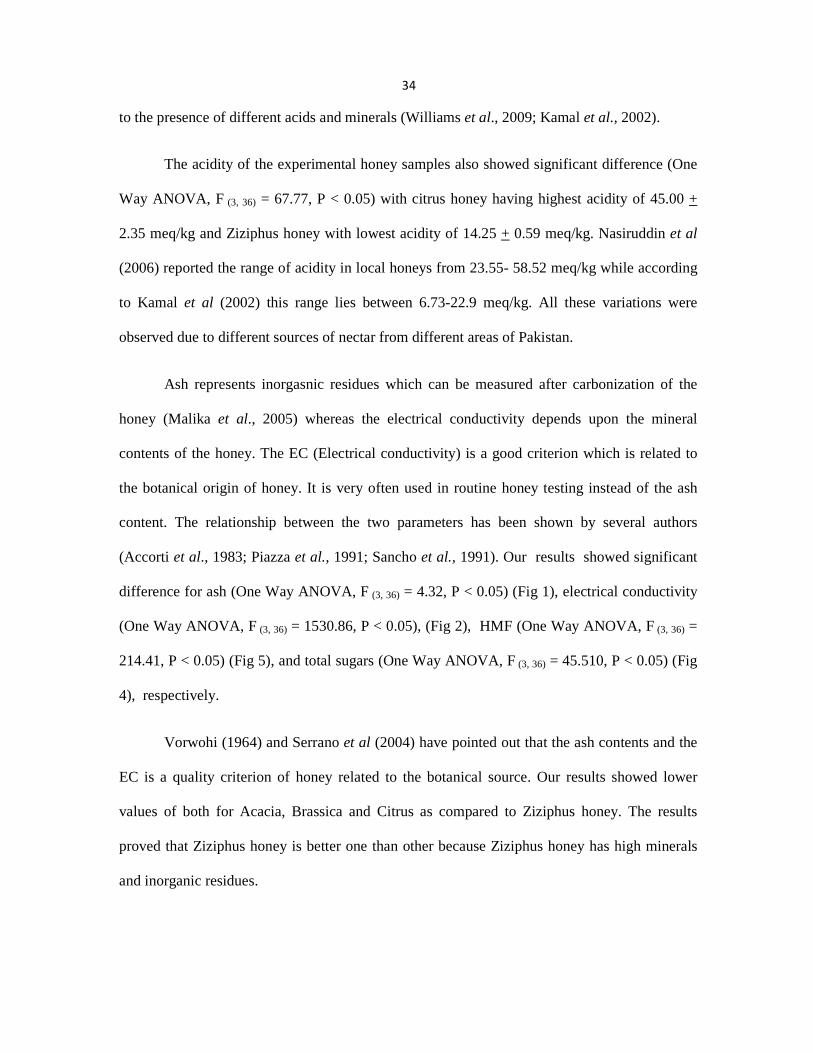
1 Comparison of Ash content of different honey samples 35
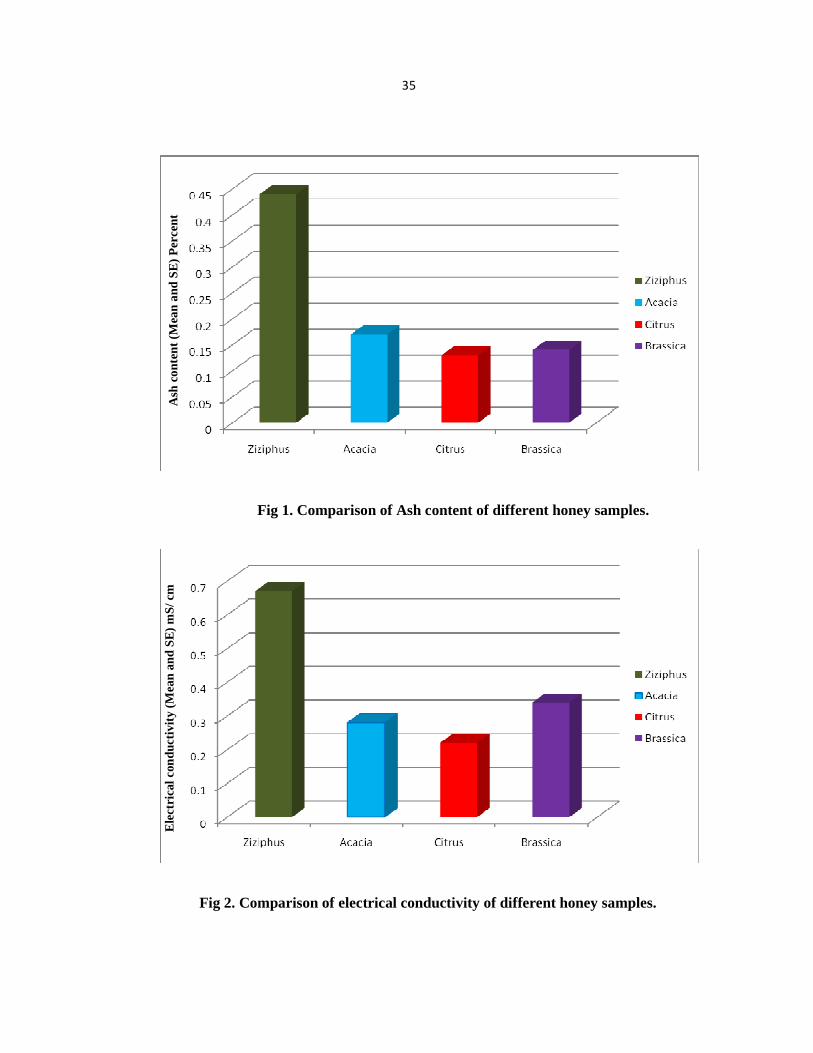
2 Comparison of electrical conductivity of different honey samples 35
3 Showing relationship between ash and EC 36
4 Comparison of different sugars for various types of honey 42
5 Comparison of HMF of different honey samples 43
6 Comparison of diastase no for different honey samples 43
7 Comparison of iron found in different types of honey 51
8 Comparison of zinc found in different types of honey 51
9 Comparison of lead found in different types of honey 53
10 Comparison of calcium found in different types of honey 53
11 Male albino rats individually housed and maintained in the 56
wound healing experiments
12 Incision wound model showing healing of the wound (Day 10) 58
13 Incision wound model showing healing of the wound (Day 15) 59
14 Excision wound model (Day 3) 60
15 Excision wound model (Day 15) 61
16 Burned wound model (Day 3) 63
17 Burned wound model (Day 18) 64
18 Dead space wound model (Day 01) 66
19 Dead space wound model (Day 17) 67
20 Antibacterial activity of honey: Inhibition zone diameter (mm) 76
of different honey samples
21 Antibacterial activity of different honey samples 80
22 Minimum Inhibitory Concentration of Acacia honey showing 86
three strains are sensitive (H, I, J)
vii
23 Minimum Inhibitory Concentration: Control plate without honey 87
showing normal growth of all the Isolates
24 Mean MIC recorded from different honey samples 88
viii
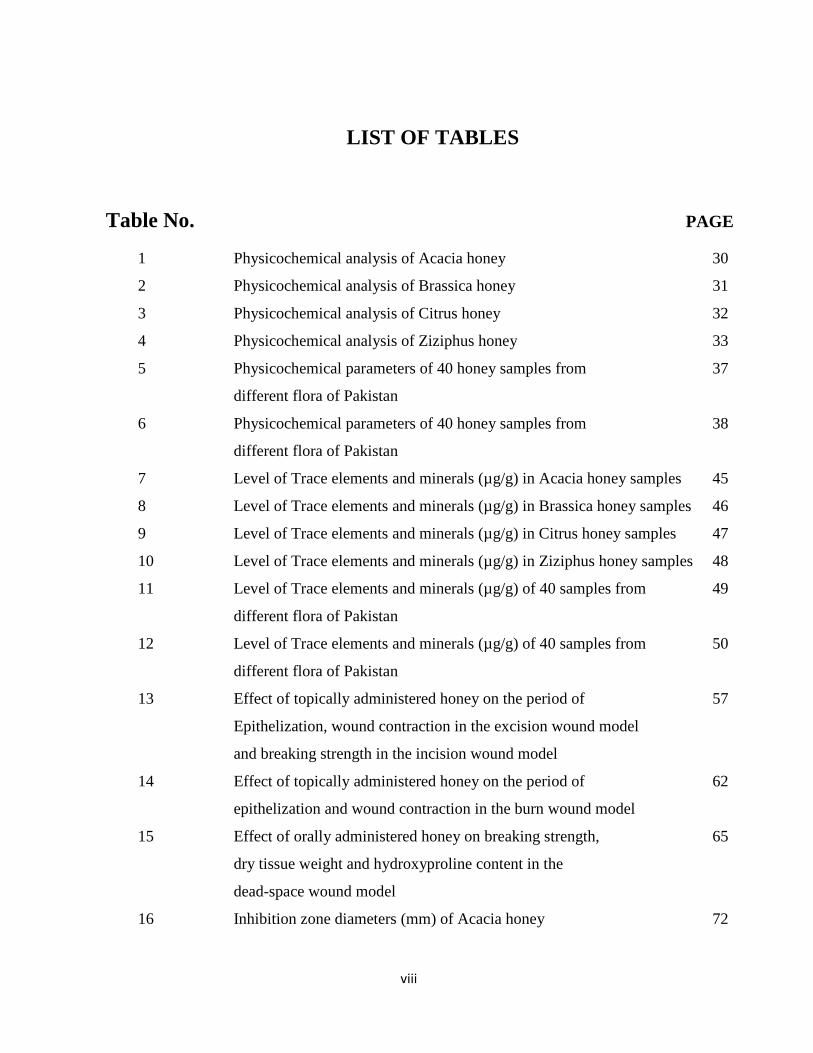
LIST OF TABLES
Table No. PAGE
1 Physicochemical analysis of Acacia honey 30
2 Physicochemical analysis of Brassica honey 31
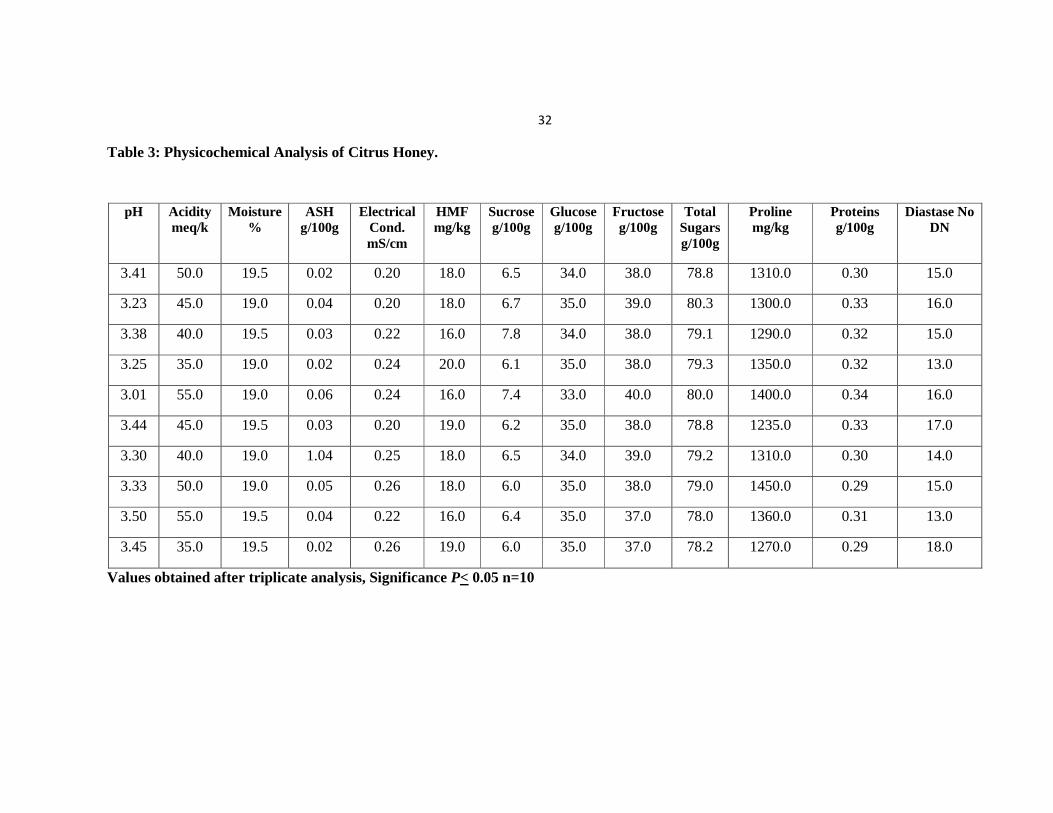
3 Physicochemical analysis of Citrus honey 32
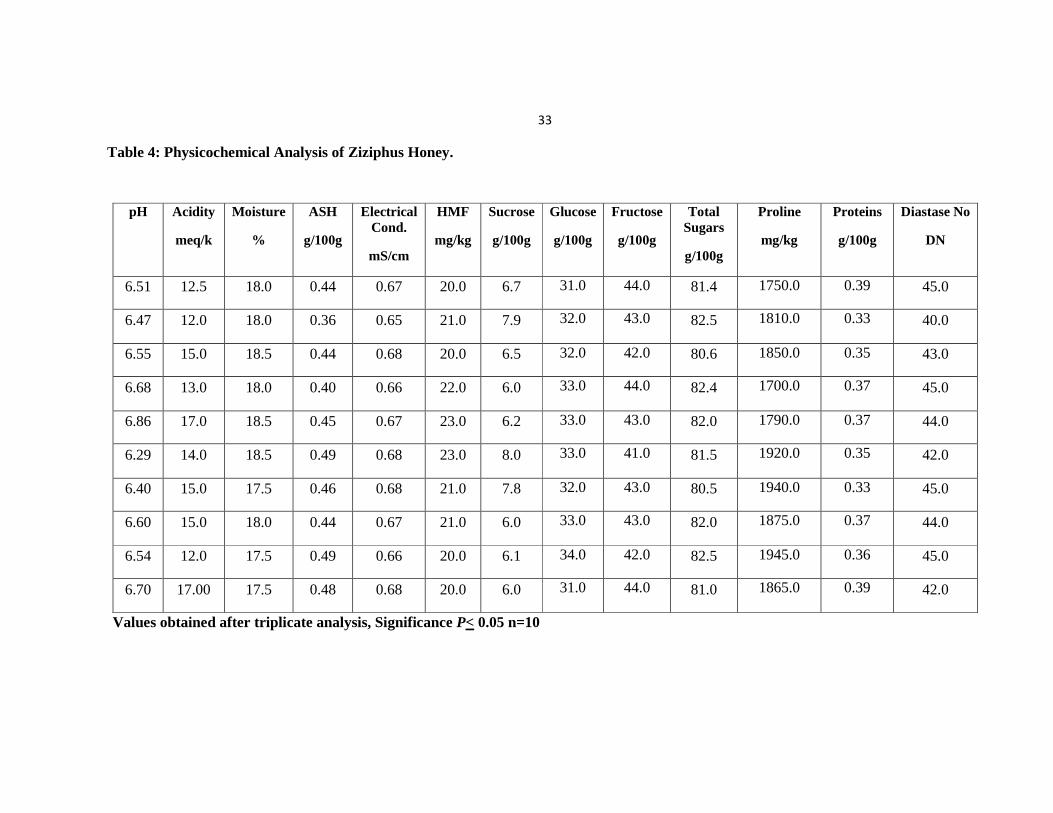
4 Physicochemical analysis of Ziziphus honey 33
5 Physicochemical parameters of 40 honey samples from 37
different flora of Pakistan
6 Physicochemical parameters of 40 honey samples from 38
different flora of Pakistan
7 Level of Trace elements and minerals (µg/g) in Acacia honey samples 45
8 Level of Trace elements and minerals (µg/g) in Brassica honey samples 46
9 Level of Trace elements and minerals (µg/g) in Citrus honey samples 47
10 Level of Trace elements and minerals (µg/g) in Ziziphus honey samples 48
11 Level of Trace elements and minerals (µg/g) of 40 samples from 49
different flora of Pakistan
12 Level of Trace elements and minerals (µg/g) of 40 samples from 50
different flora of Pakistan
13 Effect of topically administered honey on the period of 57
Epithelization, wound contraction in the excision wound model
and breaking strength in the incision wound model
14 Effect of topically administered honey on the period of 62
epithelization and wound contraction in the burn wound model
15 Effect of orally administered honey on breaking strength, 65
dry tissue weight and hydroxyproline content in the
dead-space wound model
16 Inhibition zone diameters (mm) of Acacia honey 72
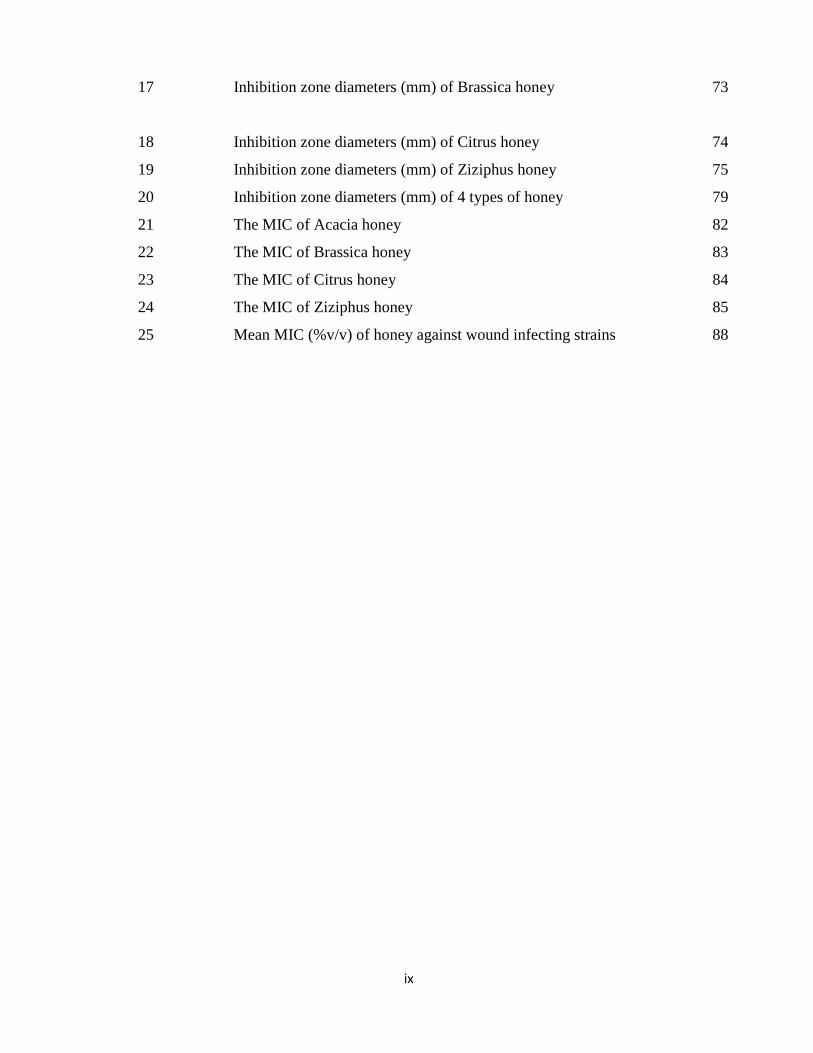
ix
17 Inhibition zone diameters (mm) of Brassica honey 73
18 Inhibition zone diameters (mm) of Citrus honey 74
19 Inhibition zone diameters (mm) of Ziziphus honey 75
20 Inhibition zone diameters (mm) of 4 types of honey 79
21 The MIC of Acacia honey 82
22 The MIC of Brassica honey 83
23 The MIC of Citrus honey 84
24 The MIC of Ziziphus honey 85
25 Mean MIC (%v/v) of honey against wound infecting strains 88
x
PUBLICATION
Farida Iftikhar, M. Arshad, F. Rashid, D. Amraiz, P. Anwar and M. Gulfraz.
(2009). Effects of Acacia Honey on Wound Healing in Various Rat models.
Phytotherapy Research Journal, 10, 1002/ptr.2990.
xi
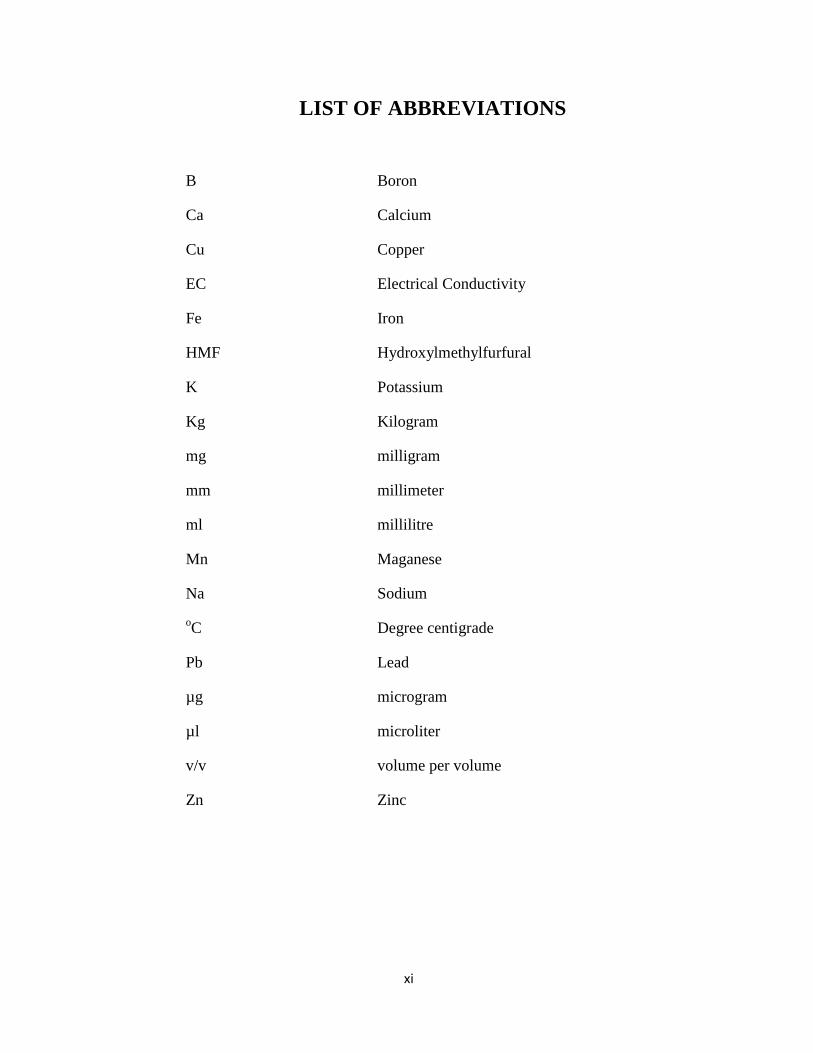
LIST OF ABBREVIATIONS
B Boron
Ca Calcium
Cu Copper
EC Electrical Conductivity
Fe Iron
HMF Hydroxylmethylfurfural
K Potassium
Kg Kilogram
mg milligram
mm millimeter
ml millilitre
Mn Maganese
Na Sodium
oC Degree centigrade
Pb Lead
µg microgram
µl microliter
v/v volume per volume
Zn Zinc

xii
ACKNOWLEDGMENTS
First of all, I thank Almighty Allah, the Compassionate and Most Merciful, who
bestowed on me the potential and ability to complete the research Project. Glory and praise to
our Last Prophet Hazrat Muhammad (Peace be upon Him), who is forever a symbol of
direction and knowledge for whole humanity. I pay my regards to my parents (Late) whose
love for learning was one of the motives that brought me in research.
I feel great honour and indebtedness in expressing my incessant gratitude to my
eminent supervisor Dr. Muhammad Gulfraz, Associate Professor, for his benevolence,
constant guidance and keen interest throughout my study period, which enabled me to
accomplish the assigned research task. I also express my heartfelt thanks to Professor Dr. S.
M. Saqlain Naqvi, Chairman, Department of Biochemistry, for his very kind guidance.
I pay my thanks to my teachers Dr. Muhammad Arshad, Associate Professor,
Department of Botany, Dr. Ghazala Kaukab, Associate Professor, Department of
Biochemistry, Dr. Javed Asad, Assistant Professor, Department of Biochemistry who
enlightened my life with knowledge and understanding.
I am also thankful to Professor Dr. Azra Khanum, Department of Biochemistry, for
her helpful discussion and encouragements on every step in my research work.
I am thankful to Dr. Nemat Ullah, Dean, Faculty of Animal Sciences, Dr. Qurban Ali,
Director General, National Veterinary Laboratories (NVL), Dr. Imam Shah, Senior Scientific
Officer (NVL) for providing me the animals / laboratory facilities for my experimental work.
xiii
I am also thankful to Dr. Ehsan Akhtar, Director INRES, Mr. Tauseef Tabassum (SO),
Mr. Zulfiqar and Mr. Hayat (INRES) for providing me the facilities to do work on Flame
Emission Spectrophotometry and Atomic Absorption Spectrophotometry.
My special thanks and gratitude to my colleague Dr. Shazia Raja, Scientific Officer,
HBRI for her help in statistical analyses of the results of my research work and moral support
throughout my Ph. D thesis work. I am also thankful to my colleagues, Mr. M.S. Munawar,
SSO, Mr. Rashid Mahmood, SSO, Mr. Gulam Sarwar, SO, HBRI for their moral support.
I earnestly believe that the success of my present research Assignment has become
possible only due to the cordial, helpful and deep interest of my kids Ayesha Butt and
M. Usman Butt who allowed me the time (which was their right) to spare for my studies. I
am also thankful to my sisters Sajida Iftikhar and Sadiqa Iftikhar for their co-operation
during my examinations.
I am also thankful to all of my Lab. fellows especially Safoora Shaukat for her prayers
and moral support.
I am also thankful to Mr. Mehboob Ellahi, Mr. Irshad Ahmad, Mr. M. Riaz, Anwar
Sadaat, Imran Chattha and Kamran Baig for their assistance and help. I am also thankful to all
of my staff in HBRI for their Prayers and moral support.
FFFF aaaarida Iftikharrida Iftikharrida Iftikharrida Iftikhar
xiv
ABSTRACT
Honey is naturally sweet substance produced by honeybees from the nectar of plants
or from secretions of living parts of plant. The composition and flavor of honey varies with
the plant source of the nectar. A study was designed to explore the medicinal values of
commercially available raw honey of different flora of Pakistan. Samples of honey from
Acacia, Ziziphus, Citrus and Brassica were collected from different areas of Pakistan and
evaluated for physicochemical properties including pH, acidity, moisture, HMF, diastase,
sucrose, glucose, fructose and total sugars by using Official Methods of Analysis (AOAC).
The trace elements and minerals (macro and micronutrients) were evaluated by using
Atomic absorption spectrophotometer and Flame Emission spectrophotometer respectively.
The levels of these nutrient were significantly different in all honey types. The pH of honey
samples used in our study ranged from 3.30 – 6.56. It was observed that ash contents and
electrical conductivity was higher for Ziziphus honey. The highest levels of K, Na, Fe and
Ca were found whereas very low concentration of B was found in honey samples i.e. 0.11-
2.53µg/g. For the assessment of Bioactivity wound healing activity of honey was tested.
The doses of different concentrations of honey on the basis of body weight of animals were
applied locally against incision, excision, dead space and burn model of rats. All topical
treatments produced a significant reduced in the period of epithelization and an increase in
wound contraction in the excision model compared to the control while in the incision
wound model there was a significant increase in the breaking strength of the wound. The
antibacterial activity of honey was assessed against selected microorganisms causing wound
infection. Quantification of microbial growth inhibition was determined by measuring the
diameter of zones clear of microbial growth around the wells in the agar (including the
xv
well). The mean inhibition zone diameter (mm) for Acacia, Ziziphus, Brassica and Citrus
were 30.02 + 0.21, 29.35 + 0.26, 16.50 + 0.12 and 15.67 + 0.14 respectively. Agar dilution
method was used to assess the minimum inhibitory concentration (MIC). The MIC for
different honeys was found to be significantly different from each other. The minimal
inhibitory concentration of different honey samples of Acacia, Ziziphus, Brassica and
Citrus were recorded as 7.65 + 0.47 % v/v, 7.66 + 0.46 % v/v, 9.21 + 0.42 % v/v and 9.02 +
0.66 % v/v respectively. Finally medicinal and economical values of honey were compared
with other tradition medicines available in the market for the suitability of this natural
product for the health purposes.
1
Chapter 1
INTRODUCTION
Honey is a sweet and viscous fluid produced by honeybee from the nectar of
flowers. Nectar is a thin, easily spoiled sweet liquid that is changed (ripened) by the
honey bee to a stable, dense and high-energy food. Honey was defined as "the sweets
substance produced by honeybees from the nectar of blossoms or from secretions on
living plants, which the bees collect, transform and store in honey combs” (Codex
Alimentarius 2001).
Honey was also defined as a pure natural product which does not include any
other substances, like water or sweeteners. This definition has been widely accepted
by the food regulations of most countries, including Pakistan. Honey has also been
cited in the Holy book of Muslims (Quran) (Section 16 Verse 68-69) and indicated its
medicinal properties many centuries ago.
Honey produced by Apis mellifera (honeybees) has been traditionally
recognized as valuable source of energy which contains antimicrobial and antioxidant
characteristics. It is a concentrated aqueous solution of invert sugar that contains a
mixture of other carbohydrates, amino and organic acids, minerals, aromatic
substances, pigments, waxes and pollen grains to make it complex (Speer and Montag,
1987; Bogdanov et al., 1998; Qiu et al., 1999; Sanz et al., 2004). There are many
reports on the presence of unstable compounds e.g enzymes, substances of hormonal
character, some vitamins and a few minor compounds (Coco et al., 1996; Crews et al.,
1997).

2
Honey can be characterized according to its geographical origin. Many
scientists reported regional variation in the physicochemical properties of the honey
samples, such as the ash contents, enzymes activities, hydroxylmethylfurfural (HMF),
electrical conductivity and pH (Sabatini et al., 1995; Serra and Ventura, 1995; Singh
and Bath, 1997; Golob and Plestenjak, 1999; Terrab et al., 2003).
Honey is essentially a highly concentrated water solution of dextrose and
laevulose, including 22 other sugars. Many substances are found in honey, but the
sugars are major components of honey. The physical characteristics of honey are due
to its sugars, but other constituents – like flavoring materials, acids, and minerals are
largely responsible for the differences among individual honey types (White and
Doner, 1980).
Colors of honey form a continuous range from very pale yellow through
amber to a darkish red to black. The variations are entirely due to the plant source of
the honey, although heat may modify the color of honey by darkening action (Atrouse
et al, 2004).
The flavor and aroma of honey vary even more than the color. There seems to
be a characteristic "honey flavor," but infinite number of flavor variations can be
observed. These variations depend upon the floral source. Light-colored honey is mild
in flavor and a darker honey has a more pronounced flavor. Exceptions to the rule
sometimes endow a light honey with very definite specific flavors. Since flavor and
aroma judgments are personal, as the tremendous variety of honey is available,
everyone should be able to get a favourite honey (Crane, 1976).
3
The largest portion of the dry matter in honey consists of the sugars a very
concentrated solution of several sugars results in physical properties of honey like
high viscosity, high density, tendency to absorb moisture from the air and immunity
from some types of spoilage. The granulation tendency of honey is very high. Due to
this unique character of honey and difference from other sweeteners, chemists have
long been interested in its composition. Limitations of methods available to earlier
researchers made their results only approximate in regard to the true sugar
composition of honey. Although recent research has greatly improved the analytical
methods for sugars testing, even then some compromises are there to make accurate
analysis of sugars from large numbers of honey samples (Cizmarik et al., 2004; Lawal
et al., 2009; White and Doner, 1980).
The composition of honey varies season to season and crop to crop. The same
was true for the same type of honey from various locations. As previously known,
dark honey is higher in ash (mineral) contents and nitrogen than light honey.
Averaging results by regions showed that southern and eastern honeys were darker
than average, while with intermountain and north-central honeys were lighter in
colour. The north-central honey was with higher moisture then average. Honey from
the South Atlantic States showed the least granulation tendency, whereas the
intermountain honey had the high tendency to granulate (Riethop et al., 1962).
Most of the honey constituents are expressed in percent. The acidity is
reported differently. In earlier times, acidity was reported as percent formic acid. We
now know that there are many acids in honey, with formic acid being one of the least
important. Since a sugar acid, gluconic acid, has been found to be the principal one in
4
honey, these results could be expressed as "percent gluconic acid" by multiplying the
numbers by 0.0196. Actually there are many acids in honey so the term
"milliequivalents per kilogram" is used to avoid implying that honey contains only
one acid (Schmidt, 1996; White, 1975).
The natural moisture of honey in the comb is that which remains after the
ripening of the nectar. The amount of moisture is important function of the factors of
ripening, including weather conditions and original moisture of the nectar. After
extraction of the honey, depending on conditions of storage, moisture contents may be
changed. The moisture is one of the most important characteristics of honey that
influence its quality and granulation property. Beekeepers and honey buyers know
that the water content of honey varies greatly and it may range between 16 - 25
percent (Lochhead, 1933).
Honey is above all a carbohydrate material, with 85 – 90.0 percent of the
solids being sugars, and the identity of these sugars has been studied for many years.
Dextrose (glucose) and laevulose (fructose) are the main sugars in honey. These are
the building blocks for the more complex honey sugars and account for about 85
percent of the solids present in honey (Doner, 1977; Siddiqui, 1970).
Dextrose and laevulose are the major sugars in honey, but 22 others have also
been found. All of these sugars are more complex than the monosaccharides, dextrose
and levulose. Ten disaccharides have been identified. These are sucrose, maltose,
isomaltose, maltulose, nigerose, turanose, kojibiose, laminaribiose, a, B-trehalose, and
gentiobiose. Ten trisaccharides are also present which are melezitose, 3-a-
5
isomaltosylglucose, maltotriose, l-kestose, panose, isomaltotriose, erlose, theanderose,
centose, and isopanose. Two more complex sugars have also been identified. Most of
the above mentioned sugars are present in very small quantities (Bogdanove et al.,
2004; Bogdanove et al., 1997; Doner, 1977; Siddqui, 1970).
The flavor of honey results from the blending of many constituents not the
least being a slight acidity. The acids of honey account for less than 0.5 percent of the
solids. The acidity level contributes not only to the flavor, but is also responsible for
the stability of honey against different microorganisms. Several acids have been found
in honey. The gluconic acid being the major one. It arises from the action of an
enzyme glucose oxidase on the dextrose. Other acids present in the honey are formic,
acetic, butyric, lactic, oxalic, tartaric, maleic, succinic, pyruvic, pyroglutamic, a-
ketoglutaric G- 6-Phosphate, glycollic, citric, malic, acid etc. (Echigo and Takenaka,
1974; Mato et al., 2003).
When honey is dried and burned, a small residue of ash remains, which is the
mineral content. It varies from 0.02 to slightly over 1 percent for a floral honey.
Honeydew honey is richer in minerals and due to its mineral content is said to be less
suitable for storage in the winter (Bogdanov, 2007; Feller – Demaesy et al., 1989;
Gonzalez et al., 2005; Sevlimli et al, 1992; White et al., 1975).
One of the characteristics that honey shows from all other sweetening agents is
the presence of enzymes. These enzymes arise from the bee, pollen, nectar, or even
yeasts and micro-organisms present in the honey. The most prominent enzymes are
added by the bee during the conversion of nectar to honey. Enzymes are complex

6
protein materials that under mild conditions bring about chemical changes. These
chemical changes may be very difficult to accomplish in a chemical laboratory
without their aid. The changes that enzymes bring about throughout nature are
essential to life. Some of the most important honey enzymes are invertase, diastase,
and glucose oxidase. Other enzymes are reported present in honey are including
catalase and an acid phosphatase. As other enzymes all the honey enzymes can be
destroyed or weakened by heating the honey directly (White and Doner, 1980).
Honey is generally evaluated by a physicochemical analysis of its constituents.
Several of these constituents are of great importance to the honey industry. These
constituents influence the storage quality, granulation, texture, flavor and the
nutritional quality of the honey. These are also responsible for the medicinal quality
of honey. The International Honey Commission (IHC) has therefore proposed certain
constituents as quality criteria for honey. These constituents include: moisture
content, electrical conductivity, reducing sugars, sucrose content, minerals, free
acidity and HMF as reported by Bogdanov et al (1999).
Honey has been used to treat wounds for thousands of years. It was displaced
from use after the advent of antibiotics. Now the antibiotic era is coming to an end
and honey is being rediscovered. But those using it without awareness of ancient
wisdom and without using the right honey may consider it a myth as they may not get
good results. On the other had those using it appropriately will get good results which
seem to be miraculous. Honey is good for healing where modern pharmaceutical
products are not working (Thomason, 2007).
7
Honey varies in antibacterial activity up to 100-fold in potency. This activity
is primarily due to hydrogen peroxide produce enzymically. But honey from manuka
(and some other Leptospermum) trees has a non-peroxide activity which is effective
in a wound dressing. The antibacterial activity of honey is very important for
preventing hospital-acquired infections by allowing the optimum moist healing
conditions of honey dressings. It can be obtained without risk of bacterial growth. The
autolytic debridement obtained with the antibacterial activity removes the bacterial
burden. It can prevent a wound healing or cause it to deteriorate by stimulating an
inflammatory response. Inflammation gives rise to proteolytic activity. The
proteolytic activity digests the wound bed matrix and growth factors which are
essential for wound healing and tissue repair. Honey also has a potent direct anti-
inflammatory activity in cases where inflammation is not due to infection. Honey
accelerates healing by stimulating the growth of cells involved in tissue repair and
stimulating the production of different components of matrix. It provides topical
nitrification of these cells as well as those of phagocytes (Allen et al., 1991; Jeddar et
al., 1985; Oka et al., 1987; Willix et al., 1992).
To get these many beneficial effects it is essential to keep honey in contact
with the wound bed. Secondary dressings can be used to do this on non-exudative
wounds. But when there is exudate, honey impregnated absorbent dressings are
needed. The frequent changes of these are important when there is copious exudate
flushing the honey out of the dressing. Honey-impregnated alginate fiber dressings,
which convert to a soft gel, are better, but have limited exudate-absorbing capacity. A
new form of gelled honey dressing, has a very large capacity for absorbing exudate
8
keeping the honey in contact with the wound bed. It is like a hydrocolloid (Bergman
et al., 1983; Efem, 1988; Willix et al., 1992).
Honey was found to possess antibacterial activity where antibiotics were
ineffective. Some chronic conductions resulting from pressure sores, infected wounds,
burns and gangrene have been found to respond favourably to honey treatment. This
antibacterial activity is due to the presence of specific chemicals in honey. The nature
of these chemicals and the mechanisms of action are not fully understood. Thin layer
chromatography (TLC), polyacrylamide gel electrophoresis (PAGE) or high
performance liquid chromatography (HPLC) have shown that honey contains seven
tetracycline derivatives, some fatty acids and lipids. Amylases and ascorbic acid are
also present (Al Somal et al., 1994; Efem, 1993; Kapoulas et al., 1977; Molan, 1992;
Rahmanian et al., 1970; Subrahmanyam, 1991).
Allen showed that there are many types of honey with and without
antibacterial activity. The type of the flower that was the source of the nectar
determines the nature of the antibacterial activity of the honey. The application of
honey on open wounds and burns show that it stops the growth of many
microorganisms (Allen et al., 1991; Efem, 1993, Efem, 1988).
Therefore, keeping in view the important facts given above, the present study
was under taken with following aims and objectives:
� To assess the physicochemical characteristics of honey collected from different
flora.
9
� To evaluate the level of different trace metals and minerals of honey from
different flora.
� To investigate the wound healing activity of honey from different flora against
three types of wound (incision, excision and dead wound space) in rats.
� To evaluate the antibacterial activity of different kinds of honey against wound
infecting bacteria.
� To evaluate the minimal inhibitory concentration of honey against wound
infecting bacteria.
10
Chapter 2
REVIEW OF LITERATURE
Stone Age paintings in several locations dating to 6000 BC or earlier depict
honey hunting, documenting human use of honey for at least 8000 years. References
to honey as a medicine are found in ancient scrolls, tablets and books. Sumarian clay
tablets estimated to be 6200 BC, Egyptian papyri dated from 1900-1250 BC, Veda
(Hindu scripture) about 5000 years old the Holy Quran, the Talmud, both the old and
new testaments of the Bible, sacred books of India, China, Persia and Egypt (Beck
and Smedley, 1997) and Hippocrates 460-357 BC. Therefore, honey has been
universally used by ancestors for its medicinal purposes. Honey was used for a
number of problems including baldness, contraception and for wound treatment.
Honey was mixed with different herbs, grains and many other botanicals from the
different geographic area. The use of honey continued into modern folk medicine
include treatment for coughs and sore throats, use of lotus honey for eye diseases in
India, for infected leg ulcers in Ghana, topical treatment of measles in the eyes to
prevent corneal scarring, gastric ulcers and constipation are in common (Molan,
2001).
Much of the literature in the early part of the 20th Century contains reports of
antimicrobial and wound healing properties of honey. It was reported that
antibacterial activity increased in diluted honey. Russian soldiers during World War I
used honey to prevent infections in wounds. Germans used honey and cod liver oil for
ulcerations, burns, fistulas, boils and sores (Zumla and Lulat, 1989). Many medical
11
journal reports the effectiveness of honey in clearing bacterial infection in wounds.
The laboratory studies for the treatment of infections became available in the mid-
1940s with the interest of medical professionals.
However, the introduction of antibiotics shifted the focus to synthetic and
mass-produced treatments. From 1930s to 1950s, researchers were documenting. The
past two decades have brought a resurgence of interest in learning more about
antimicrobial.
The carbohydrate absorption from a commercial brand of honey in Greece was
studied in 20 normal, white subjects. The results of a breath hydrogen test, reports of
loose stools within 10 hours of consumption of the test doses of honey vs. glucose and
fructose mixture demonstrated carbohydrate malabsorption. The researchers
suggested that fructose was the malabsorbed carbohydrate leading to the laxative
effect of honey. This study provides scientific support for the common Greek practice
of treating constipation with honey. In recent years, research expanded to include the
health promoting aspects of honey. A number of reports on the phytochemical and
antioxidant content of honey, its effect on gastrointestinal health and metabolism have
identified potential roles of honey (Ladas et al., 1995; Ladas and Rapetis, 1999).
Chandler et al. (1974) performed chemical analysis of over 100 honeys from
authenticated floral sources. Most samples were commercially available Australian
honeys which came from all major honey-producing districts. These samples were of
60 different floral sources. The composition of both pure single floral species honeys
and blended honeys were observed.
12
The levels of acids contribute to honey flavour and its stability towards micro-
organisms. Gluconic acid produced by the action of an enzyme on the glucose, is
present in a higher amount than all other acids. Many of the acids are intermediates in
the Krebs cycle of biological oxidation and may be present already in the nectar. To
measure the total amount of the various acids in honey titration with alkali to a fading
endpoint is done. Gluconic acid exists in solution in equilibrium with its lactone, or
internal ester, which does not have an acid function (White et al., 1963). Standards for
ash content are designed to reject honeys that have become contaminated by metal
pickup from containers. There is a direct relationship between ash contents and pH,
with Eucalypts generally having higher ash contents and higher acidities (ie lower pH
values). Lowest pHs have been recorded for South Australian blue gum, spotted gum,
mugga and bloodwood, with highest pHs for white stringybark, jarrah, kurri/mauri,
greybox and stoney mallee (Chandler, 1974). A 100 g serve of honey supplies 1320
kilojoules of energy compared to 100g of table sugar (sucrose) which contains 1600
kilojoules of energy. Total carbohydrates vary with 82.1g/100g for honey and
100g/100g for table sugar sucrose.
In recent years, research has identified a number of phytochemicals in various
foods, including honey. Phytochemicals are substances in plants. Many
phytochemicals have health-promoting activities. Antioxidants, a major group of
phytochemicals, reduce the risk of tissue oxidative damage. Honey is rich in both
enzymatic and non-enzymatic antioxidants, including catalase, ascorbic acid,
flavonoids and alkaloids. The flavonoids found in honey are pinobanksin, chrysin,
galangin, quercetin, luteolin and kaempferol. Depending on the floral source for the
13
nectar different honeys have different flavonoid profiles the floral source for the
nectar. The ascorbic acid content of honey ranges from an average of 2.4 mg/100g to
5mg/ml. Some specific varieties of honey contain as much as 75-150 mg ascorbic acid
per 100 g (Salah et al., 1995). In vitro experiments on the inhibition of oxidation in a
model system using various honeys demonstrated a wide variation in the antioxidant
capacity among floral sources. Honey made by bees fed herbal extracts exhibited
greater antioxidant activity than normal honey. In general, higher antioxidant content
was found in darker honeys and in honeys with higher water content. Some honeys,
such as buckwheat honey, are comparable to fruits and vegetables, such as orange
pulp, broccoli and sweet peppers, in their antioxidant content on a weight basis.
Honey contains a number of enzymes including glucose oxidase, invertase, diastase
(amylase), catalase and acid phosphatase. The glucose oxidase reaction produces
glutamic acid and hydrogen peroxide from glucose. It also produces glucolactone that
equilibrates with gluconic acid. The hydrogen peroxide contributes to the
antimicrobial properties of honey. Invertase converts sucrose to fructose and glucose.
It is added to the nectar by the bees as either gluco-invertase or fructo-invertase.
Some invertase is found in honey and may continue its activity in extracted honey.
However, high temperatures will inactivate it. Diastase (α- and β- amylases) is
another predominant enzyme and is frequently used to measure honey quality. It is
used as a predictor to determine if honey has undergone any heat treatment.
Additionally, glucose oxidase is found in honey and is responsible for the conversion
of glucose to gluconolactone, which in turn forms gluconic acid which is the
dominant acid in honey (Darcy et al., 1999). Diastase amylase splits starch chains to
14
randomly produce dextrins and maltose. Originating from bees and pollen, it is added
during the ripening of nectar. The diastase content varies according to floral source.
Long storage periods and exposure to high temperatures for a prolonged period of
time inactivate diastase. Researchers recommend 85 °C for 5 minutes to denature
diastase in honey; also a pH outside the optimum range of 5.3-5.6 will decrease
diastase activity. Catalase found in small amounts in honey, produces oxygen and
water from hydrogen peroxide. The inverse relationship between catalase activity and
hydrogen peroxide content has been used to determine the hydrogen peroxide level of
honey, formerly called the “inhibine number”.
The nitrogen content of honey is quite low, on average 0.4%, though it may
range to 1% of the total solids. Only 40-65% of the total nitrogen in honey is protein
in nature. The remainder of the nitrogen is derived from the free amino acids found
only in trace amounts. The most predominant of these are: proline, glutamic acid,
alanine, phenylalanine, tyrosine, leucine and isoleucine (Darcy et al., 1999).
Honey contains small amounts of minerals and vitamins. Many minerals have
been identified, including potassium, sodium, calcium, magnesium, iron, copper,
chlorine, phosphorous and sulphur. Invertase is the most significant enzyme in honey
since invertase added by the honeybee splits the sucrose into constituent sugars and
produces other more complex sugars in small percentages during the process. The
substrate for invertase is sucrose which is hydrolysed to give glucose and fructose
(Kunst et al., 1984). The moisture content of honey can vary from as low as 12% to as
high as 27% w/w basis with Australian honeys usually 16-18%. The low moisture
content together with a high osmotic pressure of honey prevents the growth of
15
bacteria. The water activity of honey is low, 0.5 – 0.6 which is at a level where most
bacteria and fungi do not grow.
Glucose monohydrate spontaneously crystallizes from honeys that are a
supersaturated solution under ordinary storage conditions. Therefore granulation is the
result of the crystallization of glucose caused by a change in the supersaturated state
and, in theory, whether a honey will granulate or not will depend on the proportion of
glucose to other components of the mixture. Several formulae using the glucose,
water and fructose contents of a honey have been suggested for predicting its’
susceptibility to crystallization. None of these formulae are reliable indicators of
crystallization (Chandler et al., 1974).
In one study the composition of sugars in honey were analyzed by a high
pressure liquid Chromatographic (HPLC) Technique and Glucose, fructose, sucrose
and maltose were analyzed. Organic acids (oxalic,malic, succinic, lactic, acetic,
propionic, citric and butyric acids) were also analyzed by using a standard HPLC
technique (AOAC, 2000). This study was conducted using internationally recognized
glycemic index methodology, which has been validated by small experimental studies
and large multi-centre research trials. The experimental procedures used in this study
were in accordance with international standards for conducting ethical research with
humans and were approved by the Medical Ethics Review Committee of Sydney
University. For each study participant, the concentration of glucose in the plasma
component in each of their seven blood samples was analyzed in duplicate using the
glucose hexokinase enzymatic method and an automatic centrifugal
spectrophotometric analyzer using internal 1 5 controls. The glucose concentrations in
16
the seven blood samples were then used to graph a two-hour blood glucose response
curve, which represents the total two-hour glycemic response to that food (i.e. total
rise in blood sugar induced by the digested food). The area under this two-hour blood
plasma glucose response curve (AUC) was calculated using the trapezoidal rule, in
order to obtain a single number, which indicates the magnitude of the total blood
glucose response during the two-hour period. A glycemic index (GI) value for the test
food was then calculated by dividing the two-hour blood glucose AUC value for this
test food by the subject’s average two-hour blood glucose AUC value for the
reference food and multiplying by 100 to obtain a percentage score.
2.1 Wound Healing:
The antimicrobial activity in honey that prevents and treats infections is
fundamental to its wound healing properties. However, scientific evidence points to a
more diverse role for honey in the process. Observed therapeutic effects attributed to
using honey as a wound dressing include rapid healing, stimulation of the healing
process, clearance of infection, cleansing action on wounds, stimulation of tissue
regeneration, reduction of inflammation, and the comfort of the dressings due to lack
of adhesion to the tissues. Healing is a complex, dynamic process that involves many
systems and cell types. Molecular and cellular components are responsible for the
degradation and repair of tissues that occur during healing. While the exact
mechanisms for all the observed effects of honey when applied to wounds, burns and
skin ulcers are yet to be defined. Recent research clarifies and elucidates some
possible explanations about properties of honey, clinical outcomes and possible
mechanisms based on in vitro studies on animal models (Zumla and Lulat, 1989).
17
When honey is applied to wounds no adverse affects have been reported and allergy
to honey is rare. In theory, wound botulism from naturally occurring Clostridium
botulinum spores is possible but in practice, this has never been reported. Since high
heat is known to inactivate the antimicrobial factors in honey, pasteurization or other
heat treatments are not sterilization options. However, treatment with gamma-
irradiation will kill the spores while leaving the components responsible for
antimicrobial activity intact. Much of the literature on the use of honey in wound
healing does not give the type of honey used. All honey is not equal in its
effectiveness and care must be taken to ensure that the type used has adequate
antimicrobial activity. Commercial standardized and sterilized versions of manuka or
other Leptospermum honey in squeeze-out tubes, syringes and impregnated dressings
are available from several manufacturers. In recent years, honey has been
rediscovered as a treatment for wound healing. Laboratory research has verified its
efficacy against many of the common pathogens that infect wounds, including some
of the antibiotic resistant bacteria such as MRSA (Methicillanresistant Staphylococcus
aureus) and VRE (Vancomycinresistant enterococci). In these studies, an artificial
honey, a supersaturated sugar solution that mimics the composition and osmolarity of
honey, is used as the control to demonstrate the antimicrobial components in honey
that are not related to its osmotic pressure.
2.2 Antibacterial Activity:
A study conducted by Molan (1992) pointed out that number of characteristics
of honey contribute to its antimicrobial activity. The glucose oxidation reaction and
some of its physical properties are the major factors. High osmotic pressure/low water
18
activity (Aw), low pH/acidic environment, low protein content, high carbon to
nitrogen ratio, high content of sugars, viscosity and hydrogenperoxide are responsible
for antibacterial activity of honey.
Honey is a supersaturated sugar solution with a low water activity, which
means that there is little water available to support the growth of bacteria and yeast.
Many species of bacteria need 0.94-0.99 Aw while ripened honey has 0.56-0.62 AW.
The natural acidity of honey inhibit many pathogens. The minimum pH value for
some species that commonly infect wounds ranges from 4.0-4.5. Dilution of honey,
especially with body fluids, raise the pH and lessen the antibacterial effectiveness that
results from its acidity.
Molan (1992) has further mentioned that glucose oxidase is an enzyme added
by bees which converts glucose, in the presence of water and oxygen, to gluconic acid
and hydrogen peroxide. The resulting acidity and hydrogen peroxide preserve and
sterilize the honey during the ripening process. Full-strength honey has negligible
amounts of hydrogen peroxide and active glucose oxidase. Transition ions and
ascorbic acids rapidly decompose hydrogen peroxide to oxygen and water while the
low pH inactivates the enzyme. However, dilution of honey results in a 2,500-50,000
increase in enzyme activity and a “slow-release” antiseptic that does not damage
tissue.
An analytical survey of U.S. honey is reported in Composition of American
Honeys, Technical Bulletin 1261, published by the U.S. Department of Agriculture in
1962. In this survey, effort was made to obtain honey samples from all over the

19
United States including commercially significant floral types. In addition to providing
tables of composition of U.S. honeys, some general conclusions were reported
regarding various factors affecting honey composition.
20
Chapter 3
MATERIALS AND METHODS
3.1 Collection and preparation of samples:
The Apis mellifera colonies were domesticated by the beekeepers and
maintained on different floras periodically. A total number of 40 honey samples of
acacia, Ziziphus, Brassica and Citrus (10 each) were collected from the local
beekeepers of different areas of Pakistan. The samples were stored in half liter plastic
containers at 4oC. Unwanted was material such as wax sticks, dead bees and particles
of comb were removed by straining the samples through cheesecloth before analyzing
their physicochemical properties.
3.2 Physicochemical Analysis:
Honey samples were analyzed for pH, moisture, total acidity, ash, electrical
conductivity, total sugars, sucrose, Hydroxymethylfurfural (HMF) and diastase. All
of these analyses were done following AOAC Method (2000).
3.2.1 Determination of Electrical Conductivity:
Conductivity was determined by conductivity meter (CM-40S, TOA Japan).
Conductometer was first calibrated with water and then conductance cell was dipped
into Honey (10%) solution and reading was noted after the stabilization of the
Instrument as reported by Winkler (1955).
21
3.2.2 Determination of Proline in honey:
Honey solution (0.50 ml of 2.5 g/ 50 ml) was taken in three borosilicate
reaction tubes separately. Formic acid (0.25 ml) and ninhydrin solution (1.0 ml of 3%
w/v ethylene glycol monoethylether) were added into it. The tubes were tightly
capped, shaked well and placed in boiling water bath for 15 minutes and cooled for 5
minutes at room temperature. Caps were removed and 5 ml aqueous isopropyl alcohol
(50 % aq. IPA) was added into each reaction tubes. The content of the tubes were
mixed well and absorbance was determined at 520 nm, using the Shimadzu
Spectrophotometer UV-1201. Absorbance of all samples was noted within 35 minutes
of cooling. Colour of honey was corrected by determining absorbance of the solution
containing 0.5 ml honey solution, 1.25 ml water and 5.0 ml aq. IPA (50%).
Calibration curve was plotted with standard solution of proline against absorbance.
Proline in honey was calculated from the standard curve.
3.2.3 Determination of Protein in Honey:
The total protein content of honey was estimated as described by Bradford
(1976). Bovine Serum Albumin (BSA) at different concentrations of 0, 0.05, 0.10,
0.15, 0.20, 0.25 and 0.30 mg/ml were used for the standard curve. Honey samples
were serially diluted. A sample of 5.0 ml was mixed with 50.0 ml of Bradford
solution and incubated at room temperature for five minutes. The absorbance was
measured at 595nm. Assays were performed in triplicate. The protein contents were
calculated from the standard curve.
22
3.2.4 Determination of Glucose and Fructose in honey:
Honey (1.0 gm) was weighed, dissolved in water and made up to 100 ml.
Diluted 5.0 ml of this solution to 100 ml. Aliquots of 2.0 ml diluted honey solution
were placed in three 18 mm test tubes with 2 such test tubes containing 2.0 ml of the
standard solution into a boiling water bath for two minutes. Allowed to cool to a room
temperature. Added 5.0 ml of glucose oxidase reagent (at room temperature) to the
tubes. Left for 60 minutes and 0.1 ml of 4 M HCl was added. Left for 60 minutes to
develop the colour. The absorbance was read at 500 mm in 1 cm cells. Colour was
stable after 1 hour (JAOAC, 1969).
The fructose was calculated by subtracting glucose from the total reducing
sugars.
3.4 Determination of Trace Elements:
5.0 gm accurately weighed sample was taken in porcelain crucible and ashed
in a muffle furnace at 500-600 o C until free from carbon. The ash was cooled and
dissolved in 5 ml HCI+HNO3 (9:1 v/v) for 15 minutes to complete solution. After
cooling the solution was diluted with distilled water and filtered into a 50 ml
volumetric flask. The filter paper was washed with hot water and the solution in the
flask was diluted to volume. A blank solution was also prepared by diluting 5ml
HC1+HNO3 solution to 50ml. the standard solutions of the elements were prepared by
dissolving a pure salts of the elements in distilled water and diluting the stock
solutions to the desired range. The sample and standard solution were stored into
polyethylene bottles.
23
The samples were analyzed for sodium and potassium by flame photometry.
Acid digestion was used to prepare honey samples for chemical analysis of Fe, Cu,
Zn, Pb, Mn and Ca. These levels were determined using Atomic Absorption
spectrophotometry (Perkins Elmer Analyst 800, USA). The air-acetylene gas mixture
was used as fuel for flame production. For each element, a specific hollow lamp was
used. The properly diluted sample solution and the standard solutions were
individually aspirated in the burner of the spectrophotometer and the atomic
absorption of the sample and standard solution were measured. Atomic absorption of
blank was also determined for each element and corrections were make in the sample
standard solution absorptions. The concentrations of the elements (in µg/g) in the
sample was determined by comparison of the atomic absorptions with that of the
standards. The results are presented in table.
3.5 Wound Healing Activity of Honey:
3.5.1 Experimental Animals:
Healthy inbred male albino rats weighing (250 - 300 g) were used for the
study. They were individually housed and maintained on normal food and water ad
labium. Animals were periodically weighed before and after the experiment. The rats
were anaesthetized prior to and during infliction of the experimental wounds. The
surgical interventions were carried out under sterile conditions using ketamine
anesthesia (120 mg/kg body weight). Animals were closely observed for any infection
and if they showed signs of infection were separated, excluded from the study and
replaced.
24
3.5.2 Honey formulations:
For topical administration, a 2% w/w gel sodium alginate gel was made, to
which honey was added at a concentration of 5 or 10%. For oral administration, a
suspension of either 50 or 100 mg/ml of honey in 1% gum tragacanth was prepared.
3.5.3 Acute oral toxicity study:
An acute toxicity study of the honey was conducted by feeding the rats
increasing doses (1, 3, 6 g/kg body weight) of honey dissolved in water, for 2 weeks.
3.5.4 Excision wound model:
The rats were anesthetized with intravenous ketamine hydrochloride (140
mg/kg body weight) prior to and during production of the excision wound, which was
carried out as reported by Morton and Malone (1972). Briefly, a depression was made
on the dorsal thoracic region, 1 cm from vertebral column and 5 cm from the ear of
the anaesthetized rat. The skin area had been shaved one day prior to the experiment.
The skin of the depressed area was excised to its full thickness to produce a wound
area of about 500 mm2. The animals were randomly divided into four groups of five
each. The negative (vehicle) control (Group 1) animals were topically provided 1%
sodium alginate gel. Animals in Group 2 were treated topically with aloe vera gel
(90% in water) as a positive control for comparison. Animals from treatment Groups
3 and 4 were treated topically with the formulations of 5% or 10 % honey gel.
Treatment continued until epithelization was complete, and the end point of
epithelization was taken as the sloughing of the scar leaving no raw wound behind.
The period of epithelization was the number of days taken to this point. The wound

25
area was measured by tracing the outline of the wound onto millimeterscale graph
paper and the percentage of wound healing was calculated as the change in the
original wound size for each animal on predetermined (2, 4, 8, 10, 12, 14, 16, 18, 20)
days post-wounding.
3.5.5 Incision wound model:
A paravertebral straight incision of 6 cm was made through the entire
thickness of the skin, on either side of the vertebral column, with a sharp scalpel. The
wound was closed by means of interrupted sutures placed at equidistance points about
1 cm apart. Animals were divided into four groups of five each and treated daily as
described above for the excision wound model, from day 0 to day 9 post-wounding.
The formulations were applied once daily. The wound breaking strength was
estimated on day 10 day by the continuous, constant, water flow technique as
described by Kandil et al. (1987).
3.5.6 Burn wound model:
Partial thickness burn wounds were inflicted on overnight-starved animals
under pentobarbitone (20 mg/kg, i.p.) anesthesia by pouring hot molten wax at 70ºC
onto the shaven back of the animal through a cylinder of 400 mm2 circular opening.
The wax was allowed to remain on the skin until solidified (Kaufman et al., 1985).
After the injury, the aloe vera gel, the honey gels or the vehicle were applied topically
as described for the excision wound model.

26
3.5.7 Dead-space wound model:
Under light ether anesthesia, dead space wounds were created by
subcutaneous implantation of a shallow metallic ring (2.5 cm diameter × 0.3 cm
depth) on each side of the dorsal paravertebral skin surface (Patil and Kulkarni,
1984). Animals were divided into three groups. Group 1 control received 1 ml of
vehicle (1% gum tragacanth per kg) whereas animals in treatment Groups 2 and 3
received 50 and 100 mg/ml of honey in gel (2 ml doses), administered orally each day
via gavage. Granulation tissue formed on both the outside and inside of the pith and
was excised on day 10 post-wounding. The granulation tissue was carefully dissected
out along with the implanted tube. The tubular tissue was cut along its length to
obtain a sheet of granulation tissue. The breaking strength was measured by the
continuous, constant, water flow technique (Kandil et al., 1987). In order to assess the
extent of collagen formation, pieces of granulation tissue were collected and dried at
60ºC for 24 h to constant weight and the hydroxyproline was estimated
colorimetrically (Asif et al., 2007).
3.6 Antibacterial activity of honey:
The agar well diffusion method (Sommeijer et al., 1995) was employed to test
the antimicrobial activity of honey of different types collected from the different
regions. The larger end of a cooled, flamed Pasteur pipette was used to make four
wells (6 mm diameter) in Mueller Hinton (HM) agar media plates onto which 10 µl of
a suspension of a 18 hour culture of either one of nine bacteria and one of three
standard ATCC strains has been spread. One aliquot (0.6 ml each) of acacia, ziziphus,
27
brassica or citrus honey (undiluted) from the different regions was deposited into each
of two of the four wells on the Petri dish. Three replicates of each plate were made to
test each honey with each of the nine microbes. The plates were incubated aerobically
at 37 oC for 18 hours. The diameter of zones clear of microbial growth around the
well were measured. All the forty honey samples were tested for nine wound
infecting bacteria as well as three ATCC strains.
3.7 Minimal Inhibitory Concentrations of Different Honey:
The agar dilution method (Daniel and John, 1991) was used to determine the
minimal inhibitory concentrations (MIC) of different honey for each of the isolates.
Assuming that the density of honey samples is 1.37 g ml-1, honey was weighed out
and dissolved in sterile deionized water to prepare a stock solution of 20% (v/v) and
50% (v/v) immediately before use. (Cooper et al.,2002). Further 1% incremental
dilutions were prepared ranging between 1-20% of honey in order to get final
concentration required in a final volume of 20 ml of double strength Mueller Hinton
(MH) agar (Oxoid Ltd, UK). Since honey is very viscous liquid, therefore it was kept
at 50oC before mixing to achieve uniform homogenization. After 20% solution of
honey, however was used at 5% incremental dilutions from 20%-60%.
Mixing of honey solutions with autoclaved MH agar were performed at 50oC,
vigorously vortexed and dispensed into Pyrex dishes Iwaki having 90mm diameter.
The poured plates were allowed to dry at 45oC for about 10 to 15 minutes. Four to
five well separated colonies from overnight blood agar were emulsified in 5 ml of
sterile distilled water, adjusting to 0.5 McFarland’s standard. The honey incorporated
28
plated were inoculated with multipoint inoculators (Mast Diagnostic, UK). The plates
were incubated at 37oC for 18 hours and observed for growth.
Three co0ntrol plated were also set up in parallel; one of MH agar inoculated
with all strains to confirm the viability of the cultures. Second control plate contained
medium only and third medium with honey to check the sterility of medium and the
honey. The MIC was recorded as the lowest concentration of honey at which visible
bacterial growth was completely inhibited. This experiment was performed in
triplicate to ensure the reproducibility of the results.
3.8 Statistical analysis:
Results are expressed as mean ± SD. The differences between experimental
groups were compared by one-way analysis of variance (ANOVA). The results were
considered statistically significant when P < 0.05.

29
Chapter 4
RESULTS AND DISCUSSION
4.1 Physicochemical Analysis:
The parameters like pH, moisture, total acidity, ash, electrical conductivity,
total sugars, sucrose, glucose, fructose, proline, proteins, diastase, Hydroxymethyl
furfural (HMF), minerals and trace elements were analyzed from various honey
samples and results are shown in Table 1-12 and Fig 1-10.
The results were analyzed using SPSS statistical programme version fourteen.
Comparisons between means were made using the least significant difference (LSD)
at 0.05 probabilities (SPSS). For statistical data, standard descriptive statistics were
performed for each of the quantitative parameters.
The different quality parameters of honey are very important compositional
requirement for its use as food or as medicine (Williams et al., 2009). These quality
parameters include ash contents, color, sugar content, moisture, electrical
conductivity, acidity and HMF contents. All of these were determined in presents
study. The pH of different honeys was found to be significantly different from each
other (One Way ANOVA, F (3, 36) = 357.23, P < 0.05). The pH of the honey samples
used in our study ranged from 3.30 - 6.56. The highest pH of Ziziphus honey was the
observed 6.56 + 0.05 as compared to the Acacia, Citrus and Brassica honey. The
results found in this study were within relevant ranges reported by EU Council (2002)
and in the Codex Alimentarius (2001). The highest pH of Ziziphus honey may be due
30
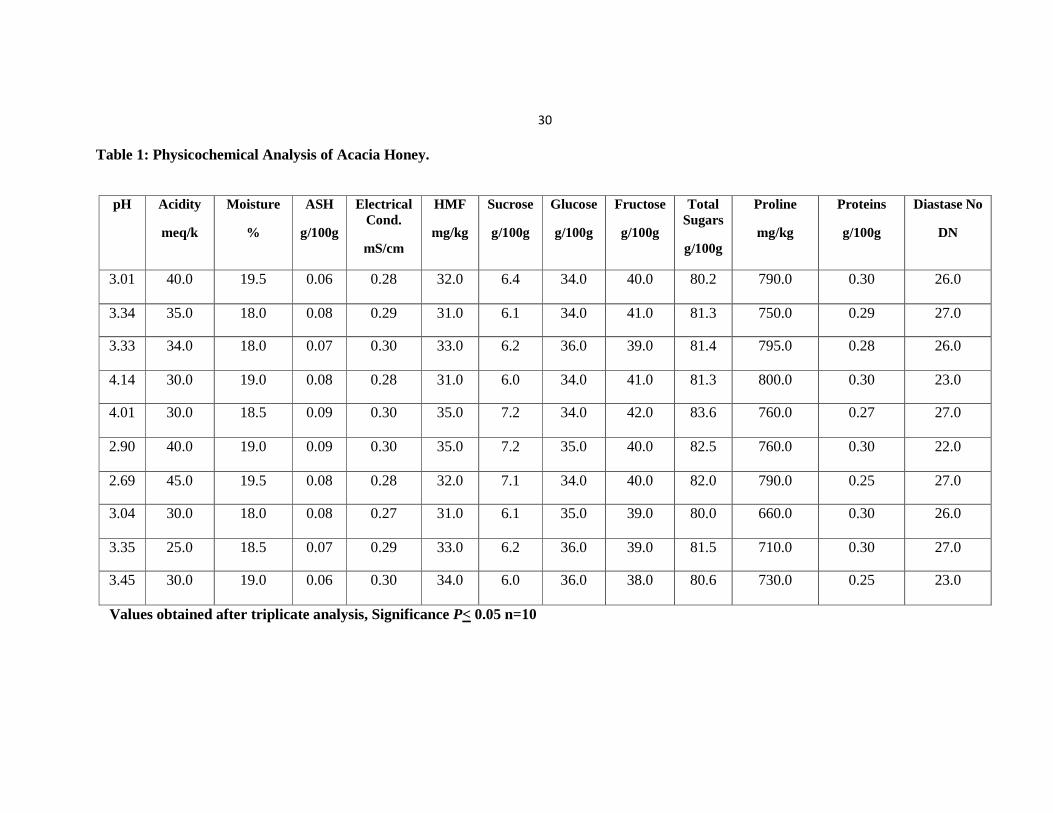
Table 1: Physicochemical Analysis of Acacia Honey.
pH
Acidity
meq/k
Moisture
%
ASH
g/100g
Electrical Cond.
mS/cm
HMF
mg/kg
Sucrose
g/100g
Glucose
g/100g
Fructose
g/100g
Total Sugars
g/100g
Proline
mg/kg
Proteins
g/100g
Diastase No
DN
3.01 40.0 19.5 0.06 0.28 32.0 6.4 34.0 40.0 80.2 790.0 0.30 26.0
3.34 35.0 18.0 0.08 0.29 31.0 6.1 34.0 41.0 81.3 750.0 0.29 27.0
3.33 34.0 18.0 0.07 0.30 33.0 6.2 36.0 39.0 81.4 795.0 0.28 26.0
4.14 30.0 19.0 0.08 0.28 31.0 6.0 34.0 41.0 81.3 800.0 0.30 23.0
4.01 30.0 18.5 0.09 0.30 35.0 7.2 34.0 42.0 83.6 760.0 0.27 27.0
2.90 40.0 19.0 0.09 0.30 35.0 7.2 35.0 40.0 82.5 760.0 0.30 22.0
2.69 45.0 19.5 0.08 0.28 32.0 7.1 34.0 40.0 82.0 790.0 0.25 27.0
3.04 30.0 18.0 0.08 0.27 31.0 6.1 35.0 39.0 80.0 660.0 0.30 26.0
3.35 25.0 18.5 0.07 0.29 33.0 6.2 36.0 39.0 81.5 710.0 0.30 27.0
3.45 30.0 19.0 0.06 0.30 34.0 6.0 36.0 38.0 80.6 730.0 0.25 23.0
Values obtained after triplicate analysis, Significance P< 0.05 n=10
31
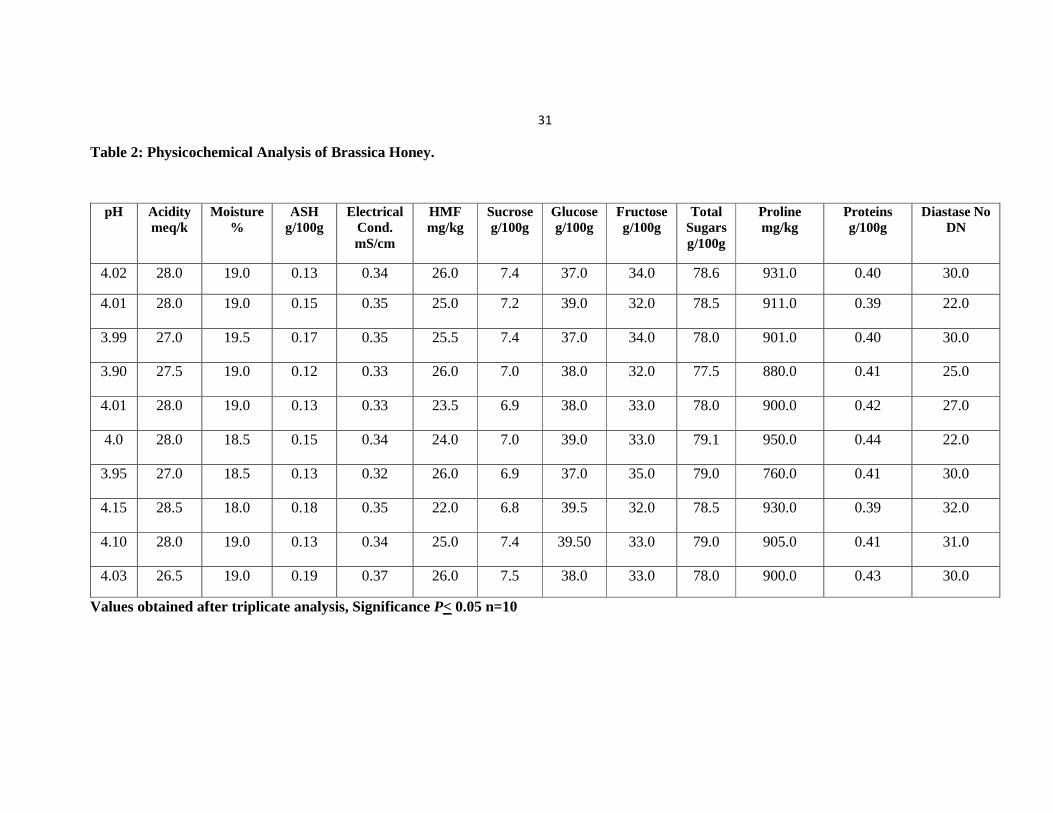
Table 2: Physicochemical Analysis of Brassica Honey.
pH Aciditymeq/k
Moisture%
ASH g/100g
Electrical Cond. mS/cm
HMF mg/kg
Sucroseg/100g
Glucoseg/100g
Fructoseg/100g
Total Sugarsg/100g
Proline mg/kg
Proteins g/100g
Diastase No DN
4.02 28.0 19.0 0.13 0.34 26.0 7.4 37.0 34.0 78.6 931.0 0.40 30.0
4.01 28.0 19.0 0.15 0.35 25.0 7.2 39.0 32.0 78.5 911.0 0.39 22.0
3.99 27.0 19.5 0.17 0.35 25.5 7.4 37.0 34.0 78.0 901.0 0.40 30.0
3.90 27.5 19.0 0.12 0.33 26.0 7.0 38.0 32.0 77.5 880.0 0.41 25.0
4.01 28.0 19.0 0.13 0.33 23.5 6.9 38.0 33.0 78.0 900.0 0.42 27.0
4.0 28.0 18.5 0.15 0.34 24.0 7.0 39.0 33.0 79.1 950.0 0.44 22.0
3.95 27.0 18.5 0.13 0.32 26.0 6.9 37.0 35.0 79.0 760.0 0.41 30.0
4.15 28.5 18.0 0.18 0.35 22.0 6.8 39.5 32.0 78.5 930.0 0.39 32.0
4.10 28.0 19.0 0.13 0.34 25.0 7.4 39.50 33.0 79.0 905.0 0.41 31.0
4.03 26.5 19.0 0.19 0.37 26.0 7.5 38.0 33.0 78.0 900.0 0.43 30.0
Values obtained after triplicate analysis, Significance P< 0.05 n=10
32
Table 3: Physicochemical Analysis of Citrus Honey.
pH Aciditymeq/k
Moisture%
ASH g/100g
Electrical Cond. mS/cm
HMFmg/kg
Sucroseg/100g
Glucoseg/100g
Fructoseg/100g
Total Sugarsg/100g
Proline mg/kg
Proteins g/100g
Diastase No DN
3.41 50.0 19.5 0.02 0.20 18.0 6.5 34.0 38.0 78.8 1310.0 0.30 15.0
3.23 45.0 19.0 0.04 0.20 18.0 6.7 35.0 39.0 80.3 1300.0 0.33 16.0
3.38 40.0 19.5 0.03 0.22 16.0 7.8 34.0 38.0 79.1 1290.0 0.32 15.0
3.25 35.0 19.0 0.02 0.24 20.0 6.1 35.0 38.0 79.3 1350.0 0.32 13.0
3.01 55.0 19.0 0.06 0.24 16.0 7.4 33.0 40.0 80.0 1400.0 0.34 16.0
3.44 45.0 19.5 0.03 0.20 19.0 6.2 35.0 38.0 78.8 1235.0 0.33 17.0
3.30 40.0 19.0 1.04 0.25 18.0 6.5 34.0 39.0 79.2 1310.0 0.30 14.0
3.33 50.0 19.0 0.05 0.26 18.0 6.0 35.0 38.0 79.0 1450.0 0.29 15.0
3.50 55.0 19.5 0.04 0.22 16.0 6.4 35.0 37.0 78.0 1360.0 0.31 13.0
3.45 35.0 19.5 0.02 0.26 19.0 6.0 35.0 37.0 78.2 1270.0 0.29 18.0
Values obtained after triplicate analysis, Significance P< 0.05 n=10
33
Table 4: Physicochemical Analysis of Ziziphus Honey.
pH
Acidity
meq/k
Moisture
%
ASH
g/100g
Electrical Cond.
mS/cm
HMF
mg/kg
Sucrose
g/100g
Glucose
g/100g
Fructose
g/100g
Total Sugars
g/100g
Proline
mg/kg
Proteins
g/100g
Diastase No
DN
6.51 12.5 18.0 0.44 0.67 20.0 6.7 31.0 44.0 81.4 1750.0 0.39 45.0
6.47 12.0 18.0 0.36 0.65 21.0 7.9 32.0 43.0 82.5 1810.0 0.33 40.0
6.55 15.0 18.5 0.44 0.68 20.0 6.5 32.0 42.0 80.6 1850.0 0.35 43.0
6.68 13.0 18.0 0.40 0.66 22.0 6.0 33.0 44.0 82.4 1700.0 0.37 45.0
6.86 17.0 18.5 0.45 0.67 23.0 6.2 33.0 43.0 82.0 1790.0 0.37 44.0
6.29 14.0 18.5 0.49 0.68 23.0 8.0 33.0 41.0 81.5 1920.0 0.35 42.0
6.40 15.0 17.5 0.46 0.68 21.0 7.8 32.0 43.0 80.5 1940.0 0.33 45.0
6.60 15.0 18.0 0.44 0.67 21.0 6.0 33.0 43.0 82.0 1875.0 0.37 44.0
6.54 12.0 17.5 0.49 0.66 20.0 6.1 34.0 42.0 82.5 1945.0 0.36 45.0
6.70 17.00 17.5 0.48 0.68 20.0 6.0 31.0 44.0 81.0 1865.0 0.39 42.0
Values obtained after triplicate analysis, Significance P< 0.05 n=10
34
to the presence of different acids and minerals (Williams et al., 2009; Kamal et al., 2002).
The acidity of the experimental honey samples also showed significant difference (One
Way ANOVA, F (3, 36) = 67.77, P < 0.05) with citrus honey having highest acidity of 45.00 +
2.35 meq/kg and Ziziphus honey with lowest acidity of 14.25 + 0.59 meq/kg. Nasiruddin et al
(2006) reported the range of acidity in local honeys from 23.55- 58.52 meq/kg while according
to Kamal et al (2002) this range lies between 6.73-22.9 meq/kg. All these variations were
observed due to different sources of nectar from different areas of Pakistan.
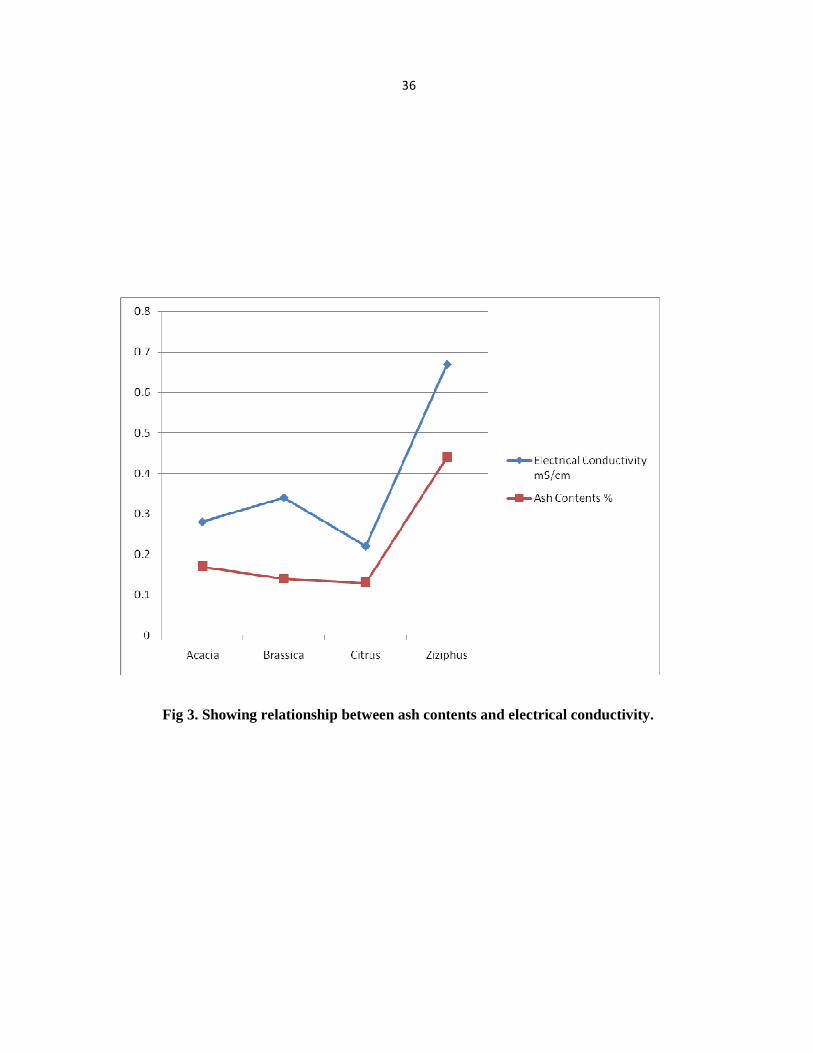
Ash represents inorgasnic residues which can be measured after carbonization of the
honey (Malika et al., 2005) whereas the electrical conductivity depends upon the mineral
contents of the honey. The EC (Electrical conductivity) is a good criterion which is related to
the botanical origin of honey. It is very often used in routine honey testing instead of the ash
content. The relationship between the two parameters has been shown by several authors
(Accorti et al., 1983; Piazza et al., 1991; Sancho et al., 1991). Our results showed significant
difference for ash (One Way ANOVA, F (3, 36) = 4.32, P < 0.05) (Fig 1), electrical conductivity
(One Way ANOVA, F (3, 36) = 1530.86, P < 0.05), (Fig 2), HMF (One Way ANOVA, F (3, 36) =
214.41, P < 0.05) (Fig 5), and total sugars (One Way ANOVA, F (3, 36) = 45.510, P < 0.05) (Fig
4), respectively.
Vorwohi (1964) and Serrano et al (2004) have pointed out that the ash contents and the
EC is a quality criterion of honey related to the botanical source. Our results showed lower
values of both for Acacia, Brassica and Citrus as compared to Ziziphus honey. The results
proved that Ziziphus honey is better one than other because Ziziphus honey has high minerals
and inorganic residues.
35
Fig 1. Comparison of Ash content of different honey samples.
Fig 2. Comparison of electrical conductivity of different honey samples.
Ash
con
tent
(Mea
n an
d S
E)
Per
cent
E
lect
rical
con
duct
ivity
(M
ean
and
SE
) m
S/ c
m
36
Fig 3. Showing relationship between ash contents and electrical conductivity.
37
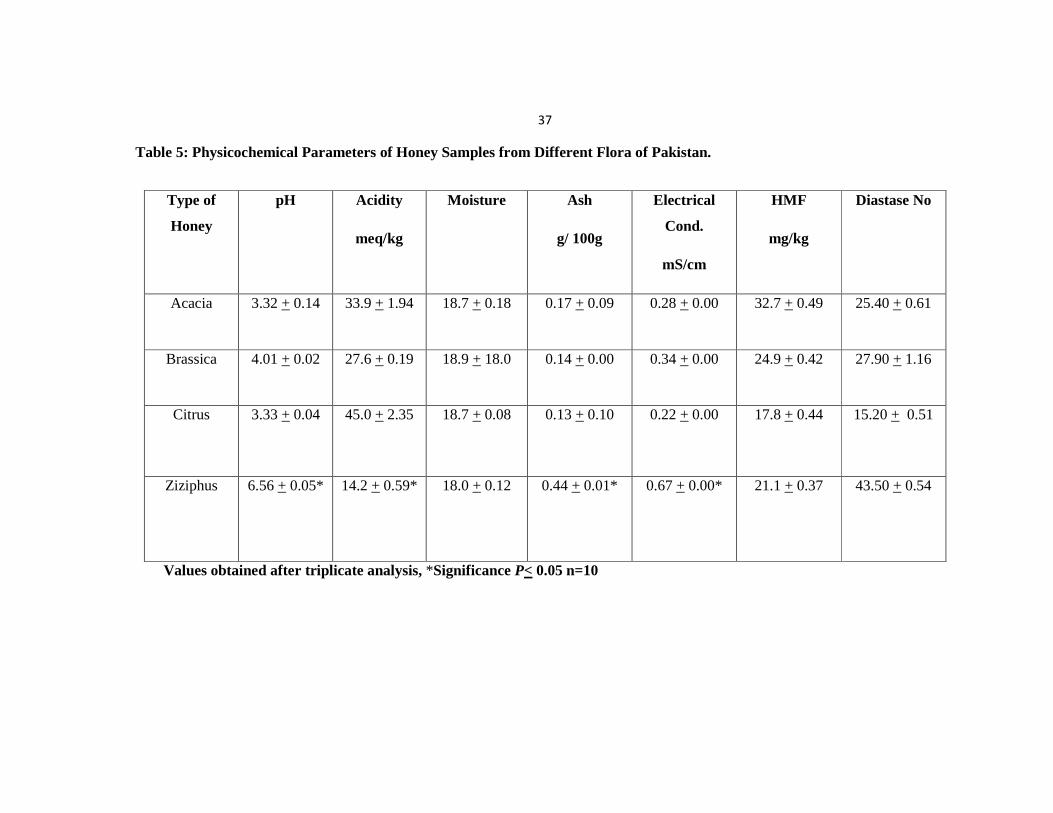
Table 5: Physicochemical Parameters of Honey Samples from Different Flora of Pakistan.
Type of
Honey
pH Acidity
meq/kg
Moisture
Ash
g/ 100g
Electrical
Cond.
mS/cm
HMF
mg/kg
Diastase No
Acacia 3.32 + 0.14 33.9 + 1.94 18.7 + 0.18 0.17 + 0.09 0.28 + 0.00 32.7 + 0.49 25.40 + 0.61
Brassica 4.01 + 0.02 27.6 + 0.19 18.9 + 18.0 0.14 + 0.00 0.34 + 0.00 24.9 + 0.42 27.90 + 1.16
Citrus 3.33 + 0.04 45.0 + 2.35 18.7 + 0.08 0.13 + 0.10 0.22 + 0.00 17.8 + 0.44 15.20 + 0.51
Ziziphus 6.56 + 0.05* 14.2 + 0.59* 18.0 + 0.12 0.44 + 0.01* 0.67 + 0.00* 21.1 + 0.37 43.50 + 0.54
Values obtained after triplicate analysis, *Significance P< 0.05 n=10
38
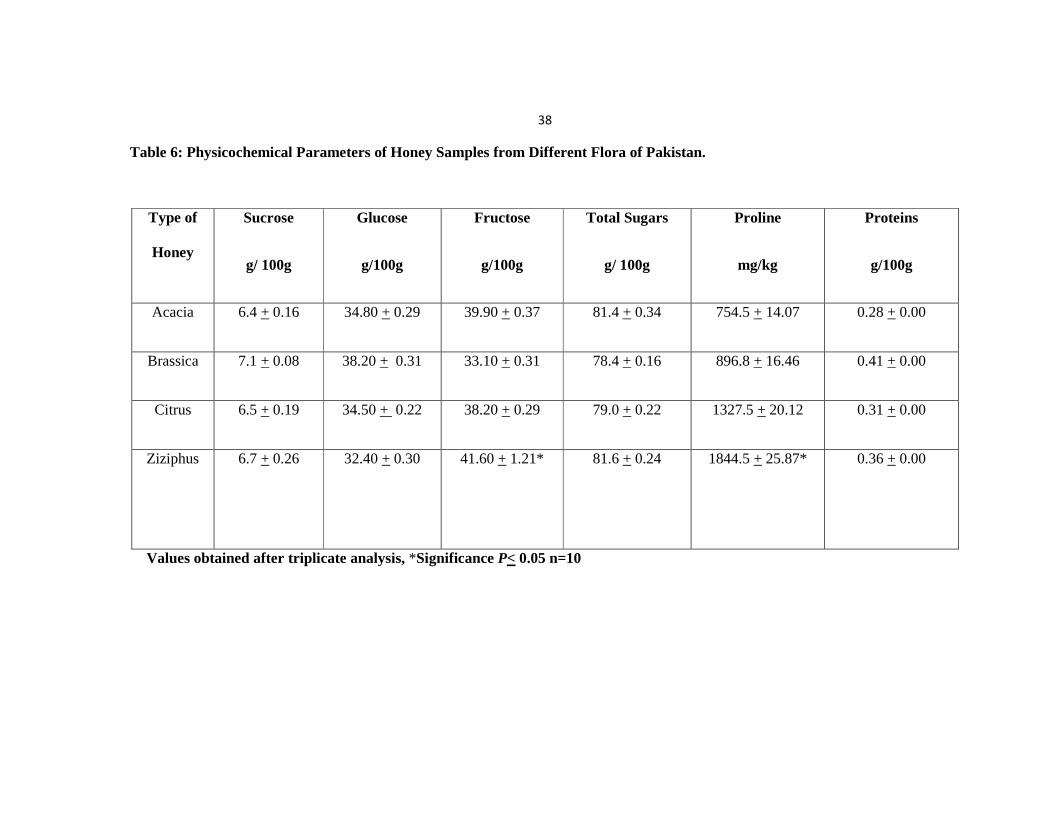
Table 6: Physicochemical Parameters of Honey Samples from Different Flora of Pakistan.
Type of
Honey
Sucrose
g/ 100g
Glucose
g/100g
Fructose
g/100g
Total Sugars
g/ 100g
Proline
mg/kg
Proteins
g/100g
Acacia 6.4 + 0.16 34.80 + 0.29 39.90 + 0.37 81.4 + 0.34 754.5 + 14.07 0.28 + 0.00
Brassica 7.1 + 0.08 38.20 + 0.31 33.10 + 0.31 78.4 + 0.16 896.8 + 16.46 0.41 + 0.00
Citrus 6.5 + 0.19 34.50 + 0.22 38.20 + 0.29 79.0 + 0.22 1327.5 + 20.12 0.31 + 0.00
Ziziphus 6.7 + 0.26 32.40 + 0.30 41.60 + 1.21* 81.6 + 0.24 1844.5 + 25.87* 0.36 + 0.00
Values obtained after triplicate analysis, *Significance P< 0.05 n=10
39
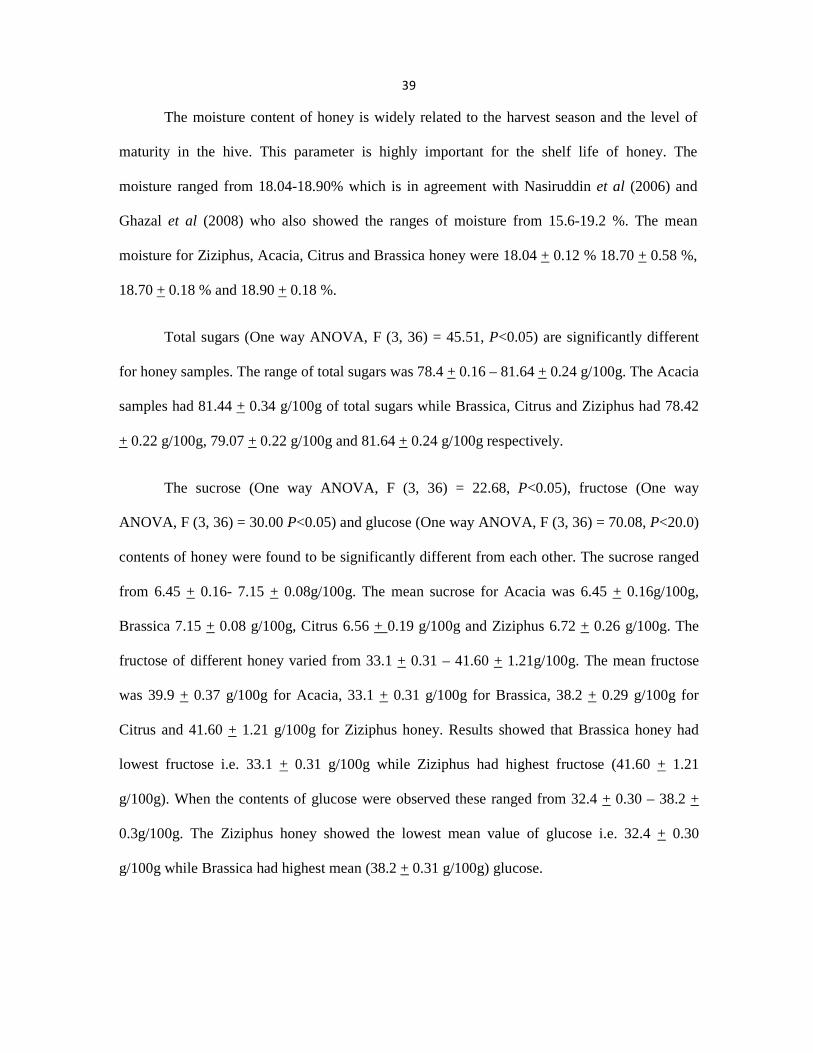
The moisture content of honey is widely related to the harvest season and the level of
maturity in the hive. This parameter is highly important for the shelf life of honey. The
moisture ranged from 18.04-18.90% which is in agreement with Nasiruddin et al (2006) and
Ghazal et al (2008) who also showed the ranges of moisture from 15.6-19.2 %. The mean
moisture for Ziziphus, Acacia, Citrus and Brassica honey were 18.04 + 0.12 % 18.70 + 0.58 %,
18.70 + 0.18 % and 18.90 + 0.18 %.
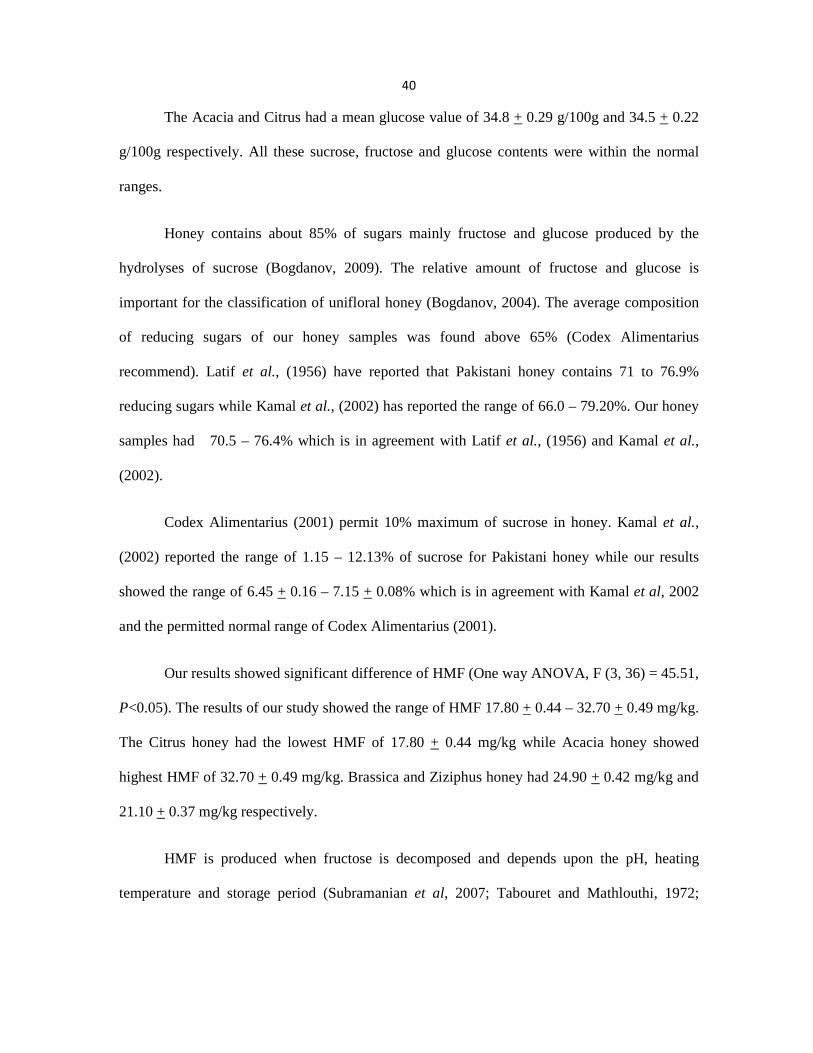
Total sugars (One way ANOVA, F (3, 36) = 45.51, P<0.05) are significantly different
for honey samples. The range of total sugars was 78.4 + 0.16 – 81.64 + 0.24 g/100g. The Acacia
samples had 81.44 + 0.34 g/100g of total sugars while Brassica, Citrus and Ziziphus had 78.42
+ 0.22 g/100g, 79.07 + 0.22 g/100g and 81.64 + 0.24 g/100g respectively.
The sucrose (One way ANOVA, F (3, 36) = 22.68, P<0.05), fructose (One way
ANOVA, F (3, 36) = 30.00 P<0.05) and glucose (One way ANOVA, F (3, 36) = 70.08, P<20.0)
contents of honey were found to be significantly different from each other. The sucrose ranged
from 6.45 + 0.16- 7.15 + 0.08g/100g. The mean sucrose for Acacia was 6.45 + 0.16g/100g,
Brassica 7.15 + 0.08 g/100g, Citrus 6.56 + 0.19 g/100g and Ziziphus 6.72 + 0.26 g/100g. The
fructose of different honey varied from 33.1 + 0.31 – 41.60 + 1.21g/100g. The mean fructose
was 39.9 + 0.37 g/100g for Acacia, 33.1 + 0.31 g/100g for Brassica, 38.2 + 0.29 g/100g for
Citrus and 41.60 + 1.21 g/100g for Ziziphus honey. Results showed that Brassica honey had
lowest fructose i.e. 33.1 + 0.31 g/100g while Ziziphus had highest fructose (41.60 + 1.21
g/100g). When the contents of glucose were observed these ranged from 32.4 + 0.30 – 38.2 +
0.3g/100g. The Ziziphus honey showed the lowest mean value of glucose i.e. 32.4 + 0.30
g/100g while Brassica had highest mean (38.2 + 0.31 g/100g) glucose.
40
The Acacia and Citrus had a mean glucose value of 34.8 + 0.29 g/100g and 34.5 + 0.22
g/100g respectively. All these sucrose, fructose and glucose contents were within the normal
ranges.
Honey contains about 85% of sugars mainly fructose and glucose produced by the
hydrolyses of sucrose (Bogdanov, 2009). The relative amount of fructose and glucose is
important for the classification of unifloral honey (Bogdanov, 2004). The average composition
of reducing sugars of our honey samples was found above 65% (Codex Alimentarius
recommend). Latif et al., (1956) have reported that Pakistani honey contains 71 to 76.9%
reducing sugars while Kamal et al., (2002) has reported the range of 66.0 – 79.20%. Our honey
samples had 70.5 – 76.4% which is in agreement with Latif et al., (1956) and Kamal et al.,
(2002).
Codex Alimentarius (2001) permit 10% maximum of sucrose in honey. Kamal et al.,
(2002) reported the range of 1.15 – 12.13% of sucrose for Pakistani honey while our results
showed the range of 6.45 + 0.16 – 7.15 + 0.08% which is in agreement with Kamal et al, 2002
and the permitted normal range of Codex Alimentarius (2001).
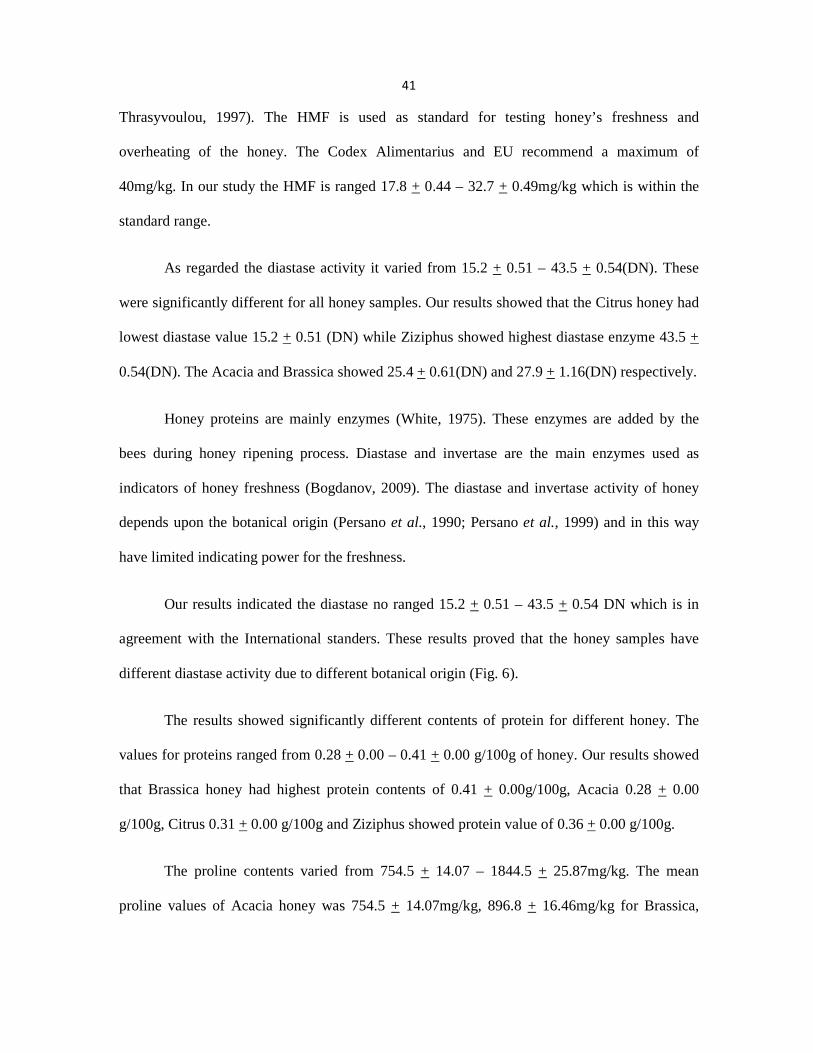
Our results showed significant difference of HMF (One way ANOVA, F (3, 36) = 45.51,
P<0.05). The results of our study showed the range of HMF 17.80 + 0.44 – 32.70 + 0.49 mg/kg.
The Citrus honey had the lowest HMF of 17.80 + 0.44 mg/kg while Acacia honey showed
highest HMF of 32.70 + 0.49 mg/kg. Brassica and Ziziphus honey had 24.90 + 0.42 mg/kg and
21.10 + 0.37 mg/kg respectively.
HMF is produced when fructose is decomposed and depends upon the pH, heating
temperature and storage period (Subramanian et al, 2007; Tabouret and Mathlouthi, 1972;
41
Thrasyvoulou, 1997). The HMF is used as standard for testing honey’s freshness and
overheating of the honey. The Codex Alimentarius and EU recommend a maximum of
40mg/kg. In our study the HMF is ranged 17.8 + 0.44 – 32.7 + 0.49mg/kg which is within the
standard range.
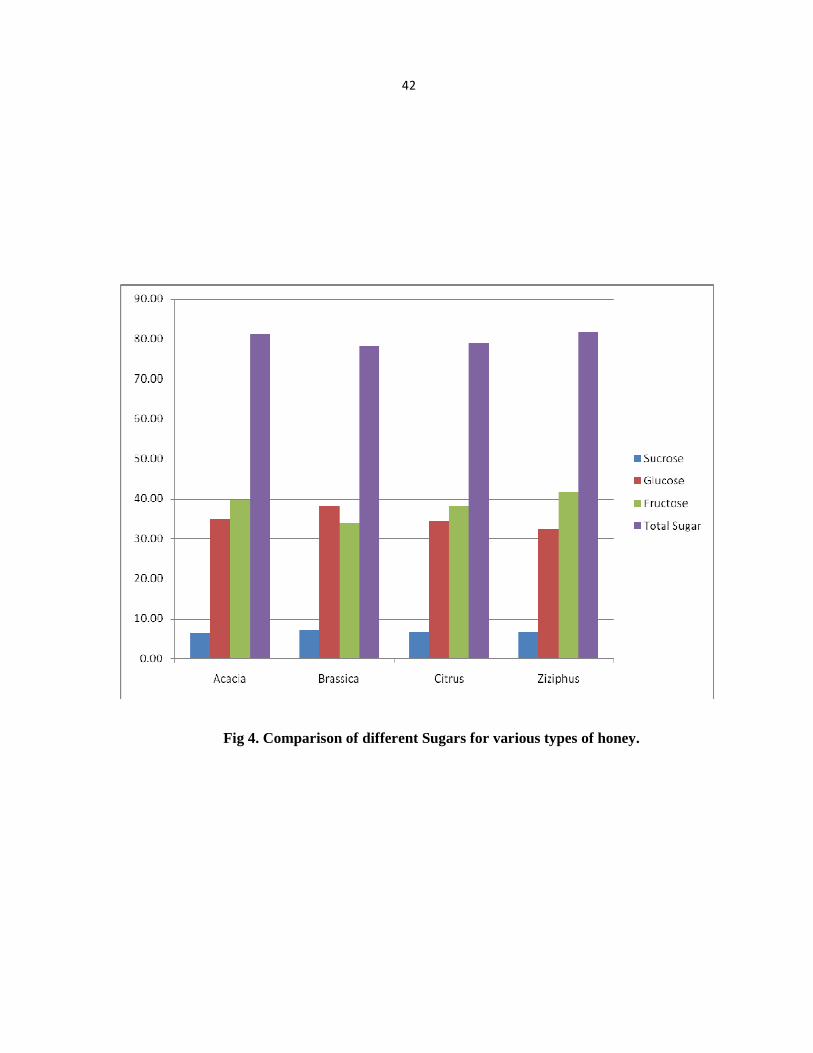
As regarded the diastase activity it varied from 15.2 + 0.51 – 43.5 + 0.54(DN). These
were significantly different for all honey samples. Our results showed that the Citrus honey had
lowest diastase value 15.2 + 0.51 (DN) while Ziziphus showed highest diastase enzyme 43.5 +
0.54(DN). The Acacia and Brassica showed 25.4 + 0.61(DN) and 27.9 + 1.16(DN) respectively.
Honey proteins are mainly enzymes (White, 1975). These enzymes are added by the
bees during honey ripening process. Diastase and invertase are the main enzymes used as
indicators of honey freshness (Bogdanov, 2009). The diastase and invertase activity of honey
depends upon the botanical origin (Persano et al., 1990; Persano et al., 1999) and in this way
have limited indicating power for the freshness.
Our results indicated the diastase no ranged 15.2 + 0.51 – 43.5 + 0.54 DN which is in
agreement with the International standers. These results proved that the honey samples have
different diastase activity due to different botanical origin (Fig. 6).
The results showed significantly different contents of protein for different honey. The
values for proteins ranged from 0.28 + 0.00 – 0.41 + 0.00 g/100g of honey. Our results showed
that Brassica honey had highest protein contents of 0.41 + 0.00g/100g, Acacia 0.28 + 0.00
g/100g, Citrus 0.31 + 0.00 g/100g and Ziziphus showed protein value of 0.36 + 0.00 g/100g.
The proline contents varied from 754.5 + 14.07 – 1844.5 + 25.87mg/kg. The mean
proline values of Acacia honey was 754.5 + 14.07mg/kg, 896.8 + 16.46mg/kg for Brassica,
42
Fig 4. Comparison of different Sugars for various types of honey.
43
Fig 5. Comparison of HMF for different honey samples.
Fig 6. Comparison of Diastase No for different honey samples.
HM
F (
Mea
n an
d S
E)
mg/
kg
Dia
stas
e N
o (M
ean
and
SE
)
44
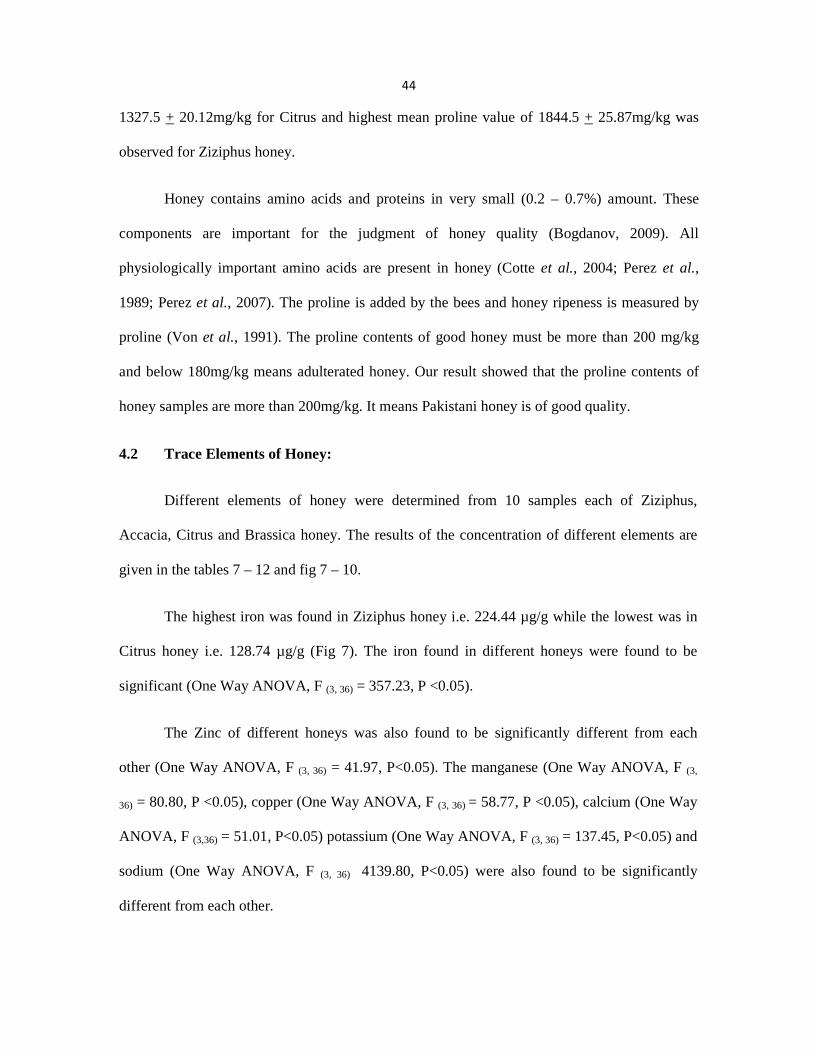
1327.5 + 20.12mg/kg for Citrus and highest mean proline value of 1844.5 + 25.87mg/kg was
observed for Ziziphus honey.
Honey contains amino acids and proteins in very small (0.2 – 0.7%) amount. These
components are important for the judgment of honey quality (Bogdanov, 2009). All
physiologically important amino acids are present in honey (Cotte et al., 2004; Perez et al.,
1989; Perez et al., 2007). The proline is added by the bees and honey ripeness is measured by
proline (Von et al., 1991). The proline contents of good honey must be more than 200 mg/kg
and below 180mg/kg means adulterated honey. Our result showed that the proline contents of
honey samples are more than 200mg/kg. It means Pakistani honey is of good quality.
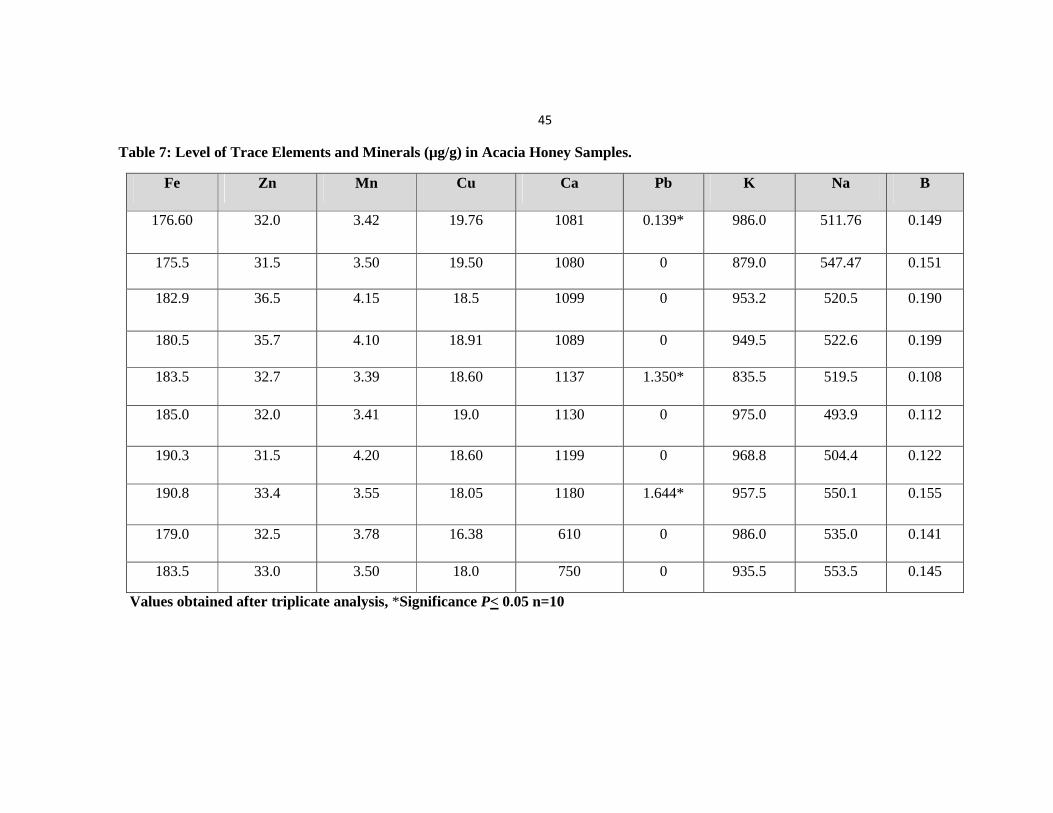
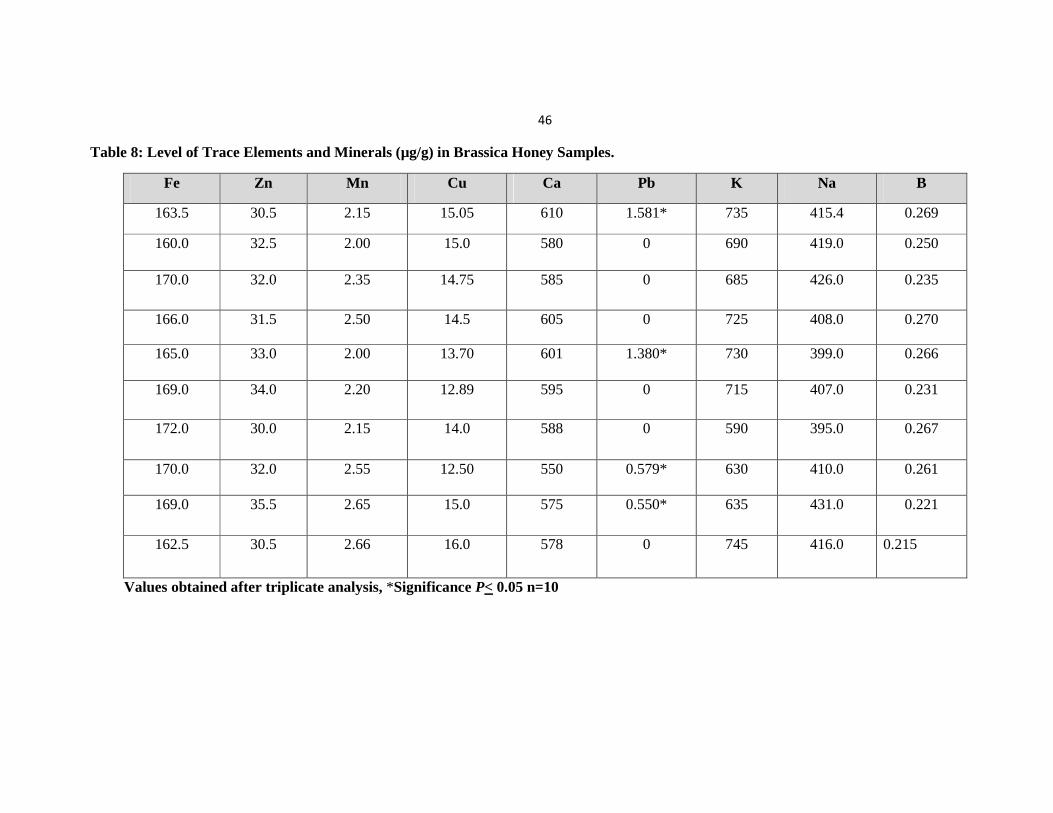
4.2 Trace Elements of Honey:
Different elements of honey were determined from 10 samples each of Ziziphus,
Accacia, Citrus and Brassica honey. The results of the concentration of different elements are
given in the tables 7 – 12 and fig 7 – 10.
The highest iron was found in Ziziphus honey i.e. 224.44 µg/g while the lowest was in
Citrus honey i.e. 128.74 µg/g (Fig 7). The iron found in different honeys were found to be
significant (One Way ANOVA, F (3, 36) = 357.23, P <0.05).
The Zinc of different honeys was also found to be significantly different from each
other (One Way ANOVA, F (3, 36) = 41.97, P<0.05). The manganese (One Way ANOVA, F (3,
36) = 80.80, P <0.05), copper (One Way ANOVA, F (3, 36) = 58.77, P <0.05), calcium (One Way
ANOVA, F (3,36) = 51.01, P<0.05) potassium (One Way ANOVA, F (3, 36) = 137.45, P<0.05) and
sodium (One Way ANOVA, F (3, 36) 4139.80, P<0.05) were also found to be significantly
different from each other.
45
Table 7: Level of Trace Elements and Minerals (µg/g) in Acacia Honey Samples.
Fe Zn Mn Cu Ca Pb K Na B
176.60 32.0 3.42 19.76 1081 0.139* 986.0 511.76 0.149
175.5 31.5 3.50 19.50 1080 0 879.0 547.47 0.151
182.9 36.5 4.15 18.5 1099 0 953.2 520.5 0.190
180.5 35.7 4.10 18.91 1089 0 949.5 522.6 0.199
183.5 32.7 3.39 18.60 1137 1.350* 835.5 519.5 0.108
185.0 32.0 3.41 19.0 1130 0 975.0 493.9 0.112
190.3 31.5 4.20 18.60 1199 0 968.8 504.4 0.122
190.8 33.4 3.55 18.05 1180 1.644* 957.5 550.1 0.155
179.0 32.5 3.78 16.38 610 0 986.0 535.0 0.141
183.5 33.0 3.50 18.0 750 0 935.5 553.5 0.145
Values obtained after triplicate analysis, *Significance P< 0.05 n=10
46
Table 8: Level of Trace Elements and Minerals (µg/g) in Brassica Honey Samples.
Fe Zn Mn Cu Ca Pb K Na B
163.5 30.5 2.15 15.05 610 1.581* 735 415.4 0.269
160.0 32.5 2.00 15.0 580 0 690 419.0 0.250
170.0 32.0 2.35 14.75 585 0 685 426.0 0.235
166.0 31.5 2.50 14.5 605 0 725 408.0 0.270
165.0 33.0 2.00 13.70 601 1.380* 730 399.0 0.266
169.0 34.0 2.20 12.89 595 0 715 407.0 0.231
172.0 30.0 2.15 14.0 588 0 590 395.0 0.267
170.0 32.0 2.55 12.50 550 0.579* 630 410.0 0.261
169.0 35.5 2.65 15.0 575 0.550* 635 431.0 0.221
162.5 30.5 2.66 16.0 578 0 745 416.0 0.215
Values obtained after triplicate analysis, *Significance P< 0.05 n=10
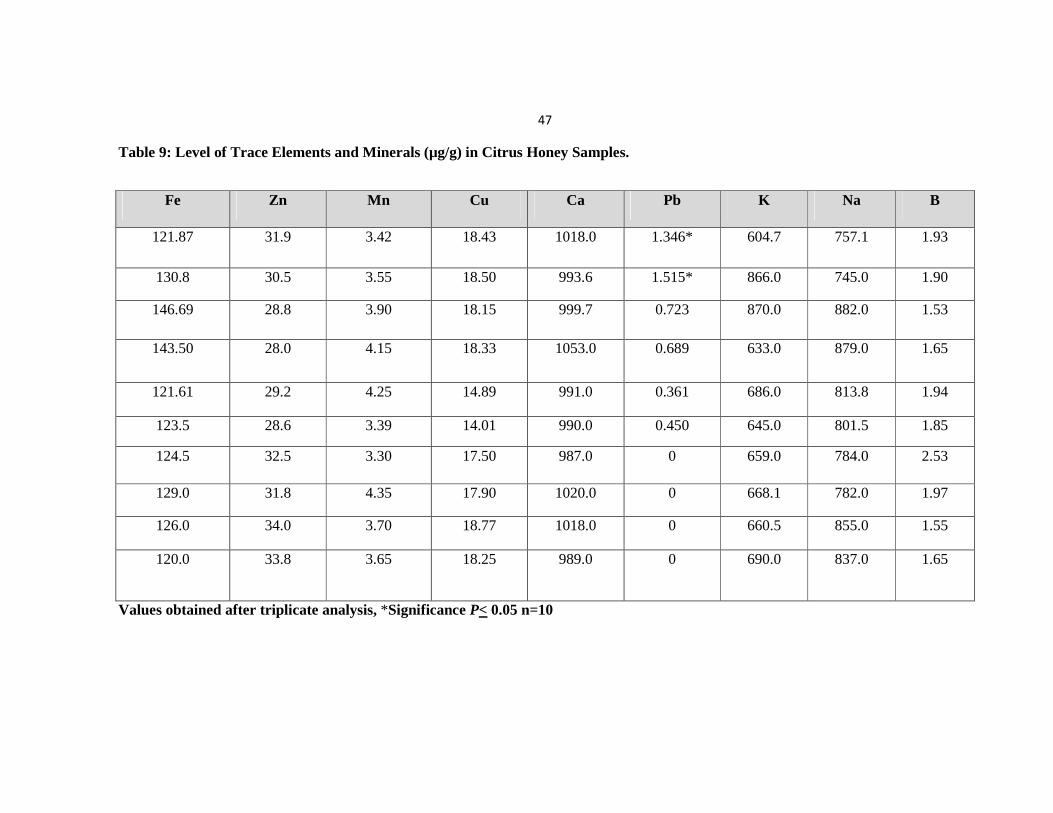
47
Table 9: Level of Trace Elements and Minerals (µg/g) in Citrus Honey Samples.
Fe Zn Mn Cu Ca Pb K Na B
121.87 31.9 3.42 18.43 1018.0 1.346* 604.7 757.1 1.93
130.8 30.5 3.55 18.50 993.6 1.515* 866.0 745.0 1.90
146.69 28.8 3.90 18.15 999.7 0.723 870.0 882.0 1.53
143.50 28.0 4.15 18.33 1053.0 0.689 633.0 879.0 1.65
121.61 29.2 4.25 14.89 991.0 0.361 686.0 813.8 1.94
123.5 28.6 3.39 14.01 990.0 0.450 645.0 801.5 1.85
124.5 32.5 3.30 17.50 987.0 0 659.0 784.0 2.53
129.0 31.8 4.35 17.90 1020.0 0 668.1 782.0 1.97
126.0 34.0 3.70 18.77 1018.0 0 660.5 855.0 1.55
120.0 33.8 3.65 18.25 989.0 0 690.0 837.0 1.65
Values obtained after triplicate analysis, *Significance P< 0.05 n=10
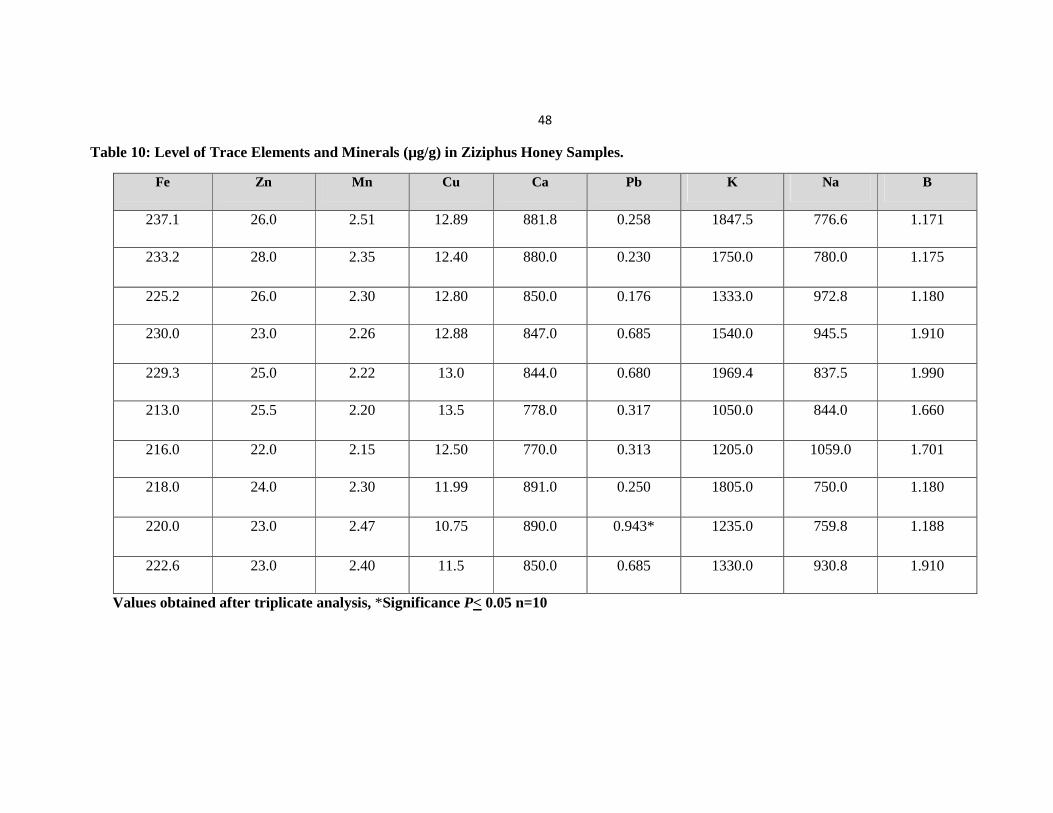
48
Table 10: Level of Trace Elements and Minerals (µg/g) in Ziziphus Honey Samples.
Fe Zn Mn Cu Ca Pb K Na B
237.1 26.0 2.51 12.89 881.8 0.258 1847.5 776.6 1.171
233.2 28.0 2.35 12.40 880.0 0.230 1750.0 780.0 1.175
225.2 26.0 2.30 12.80 850.0 0.176 1333.0 972.8 1.180
230.0 23.0 2.26 12.88 847.0 0.685 1540.0 945.5 1.910
229.3 25.0 2.22 13.0 844.0 0.680 1969.4 837.5 1.990
213.0 25.5 2.20 13.5 778.0 0.317 1050.0 844.0 1.660
216.0 22.0 2.15 12.50 770.0 0.313 1205.0 1059.0 1.701
218.0 24.0 2.30 11.99 891.0 0.250 1805.0 750.0 1.180
220.0 23.0 2.47 10.75 890.0 0.943* 1235.0 759.8 1.188
222.6 23.0 2.40 11.5 850.0 0.685 1330.0 930.8 1.910
Values obtained after triplicate analysis, *Significance P< 0.05 n=10
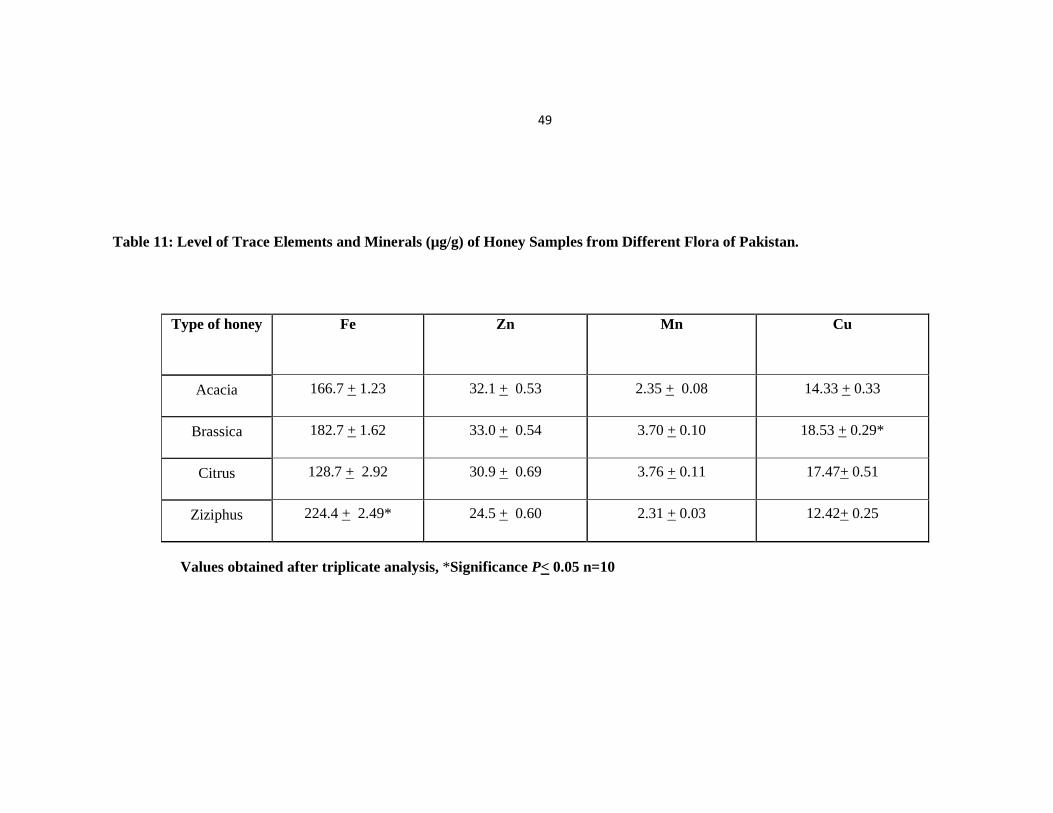
49
Table 11: Level of Trace Elements and Minerals (µg/g) of Honey Samples from Different Flora of Pakistan.
Values obtained after triplicate analysis, *Significance P< 0.05 n=10
Type of honey Fe
Zn
Mn
Cu
Acacia 166.7 + 1.23 32.1 + 0.53 2.35 + 0.08 14.33 + 0.33
Brassica 182.7 + 1.62 33.0 + 0.54 3.70 + 0.10 18.53 + 0.29*
Citrus 128.7 + 2.92 30.9 + 0.69 3.76 + 0.11 17.47+ 0.51
Ziziphus 224.4 + 2.49* 24.5 + 0.60 2.31 + 0.03 12.42+ 0.25
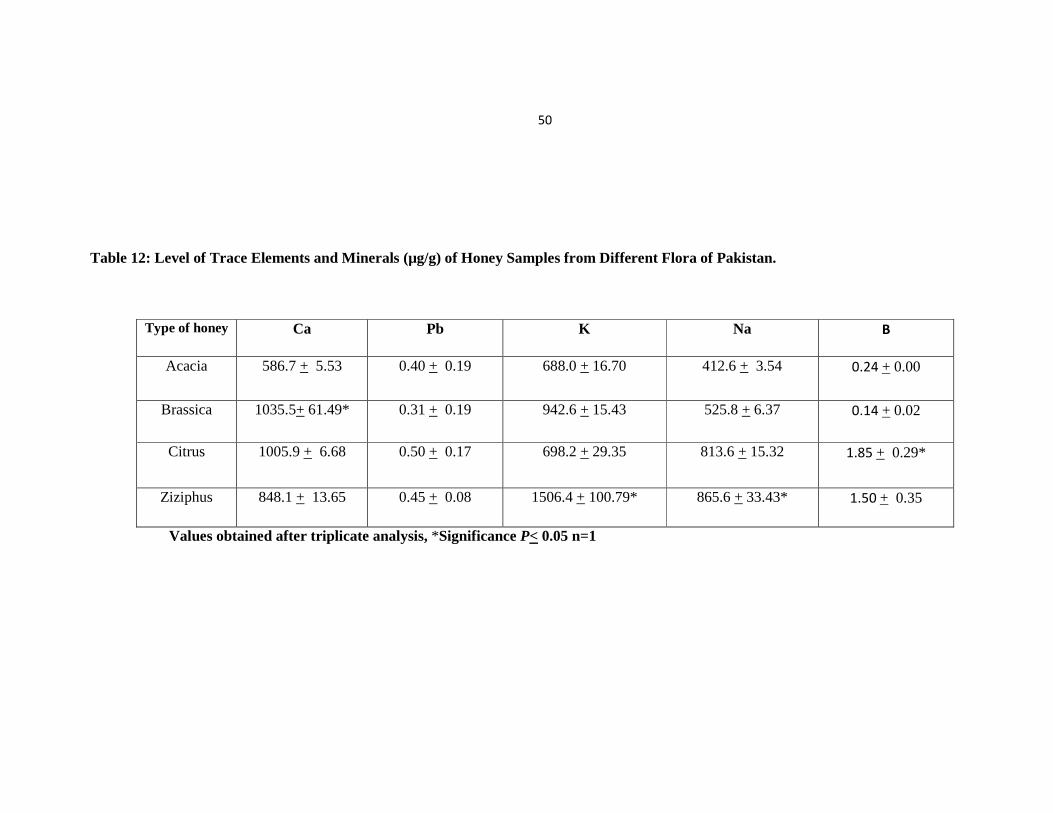
50
Table 12: Level of Trace Elements and Minerals (µg/g) of Honey Samples from Different Flora of Pakistan.
Type of honey Ca Pb K Na B
Acacia 586.7 + 5.53 0.40 + 0.19 688.0 + 16.70 412.6 + 3.54 0.24 + 0.00
Brassica 1035.5+ 61.49* 0.31 + 0.19 942.6 + 15.43 525.8 + 6.37 0.14 + 0.02
Citrus 1005.9 + 6.68 0.50 + 0.17 698.2 + 29.35 813.6 + 15.32 1.85 + 0.29*
Ziziphus 848.1 + 13.65 0.45 + 0.08 1506.4 + 100.79* 865.6 + 33.43* 1.50 + 0.35
Values obtained after triplicate analysis, *Significance P< 0.05 n=1
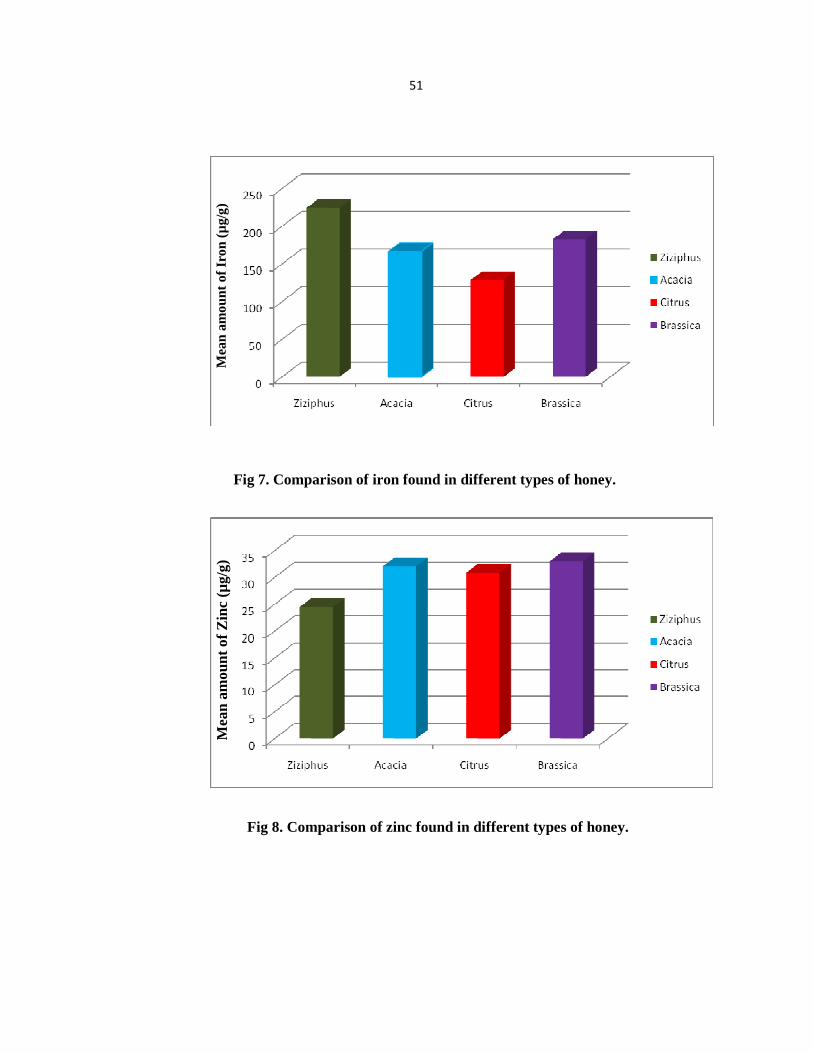
51
Fig 7. Comparison of iron found in different types of honey.
Fig 8. Comparison of zinc found in different types of honey.
Mea
n am
ount
of I
ron
(µg/
g)
Mea
n am
ount
of Z
inc
(µg/
g)
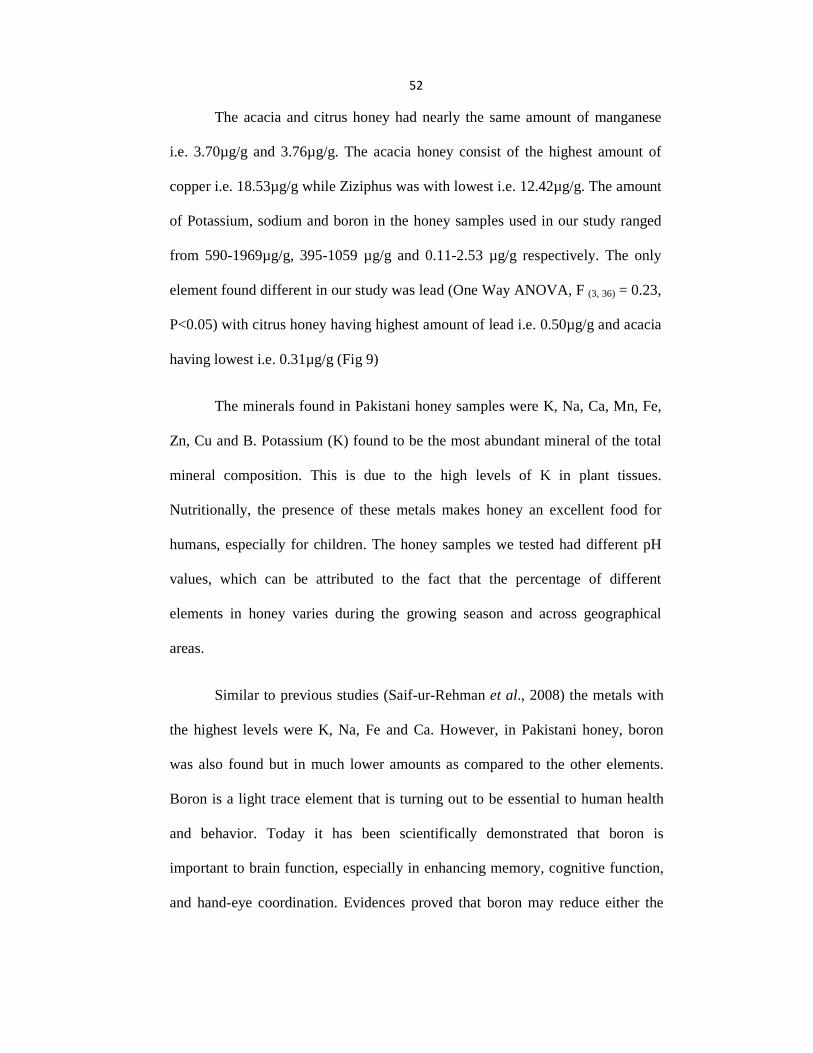
52
The acacia and citrus honey had nearly the same amount of manganese
i.e. 3.70µg/g and 3.76µg/g. The acacia honey consist of the highest amount of
copper i.e. 18.53µg/g while Ziziphus was with lowest i.e. 12.42µg/g. The amount
of Potassium, sodium and boron in the honey samples used in our study ranged
from 590-1969µg/g, 395-1059 µg/g and 0.11-2.53 µg/g respectively. The only
element found different in our study was lead (One Way ANOVA, F (3, 36) = 0.23,
P<0.05) with citrus honey having highest amount of lead i.e. 0.50µg/g and acacia
having lowest i.e. 0.31µg/g (Fig 9)
The minerals found in Pakistani honey samples were K, Na, Ca, Mn, Fe,
Zn, Cu and B. Potassium (K) found to be the most abundant mineral of the total
mineral composition. This is due to the high levels of K in plant tissues.
Nutritionally, the presence of these metals makes honey an excellent food for
humans, especially for children. The honey samples we tested had different pH
values, which can be attributed to the fact that the percentage of different
elements in honey varies during the growing season and across geographical
areas.
Similar to previous studies (Saif-ur-Rehman et al., 2008) the metals with
the highest levels were K, Na, Fe and Ca. However, in Pakistani honey, boron
was also found but in much lower amounts as compared to the other elements.
Boron is a light trace element that is turning out to be essential to human health
and behavior. Today it has been scientifically demonstrated that boron is
important to brain function, especially in enhancing memory, cognitive function,
and hand-eye coordination. Evidences proved that boron may reduce either the
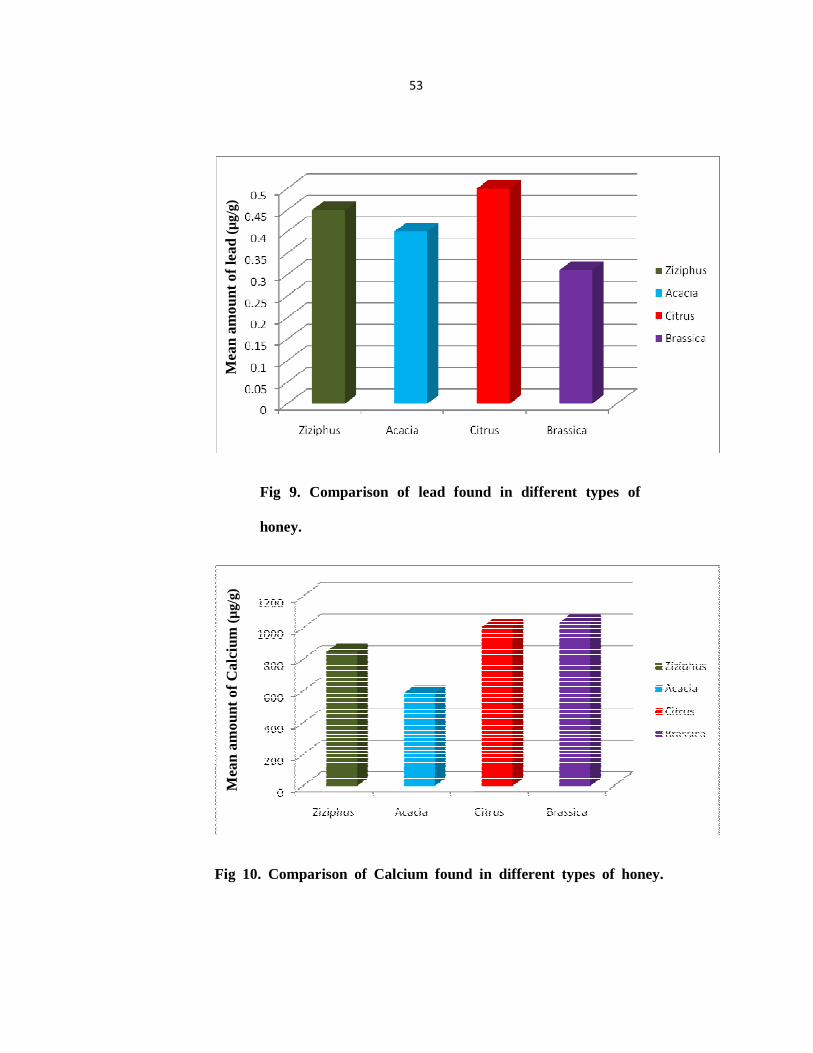
53
Fig 9. Comparison of lead found in different types of
honey.
Fig 10. Comparison of Calcium found in different types of honey.
Mea
n am
ount
of l
ead (
µg/
g)
Mea
n am
ount
of C
alci
um (µ
g/g)
54
symptoms or incidence of arthritis (Schauss et al., 1996). Dark coloured honeys
contained higher levels of microelements compared to light coloured honeys. On
the basis of our results and considering previously reported findings (Pisani et al.,
2008), it is possible to conclude that the elemental composition of honey depends
on soil composition, the type of plant, season of honey flow, and environmental
conditions. Also based on the results obtained, the quality of most natural raw
honey from Pakistan meets international standards.
4.3 Wound healing activity:
4.3.1 Acute oral toxicity study:
No effect on the behavior of animals was observed after feeding of 50 and
100 mg/ml of honey suspension along with standard and honey gel. Doses up to
6 g/kg body weight did not produce any change and all animals remained
physically active.
4.3.2 Effect on excision and incision wounds:
All topical treatments produced a significant reduced the period of
epithelization and an increase in wound contraction in the excision model
compared to the vehicle control. In the incision wound model, all three
treatments also produced a significant increase (p < 0.05) in the breaking strength
of the wound. In all cases, the greatest effects were shown in the animals treated
with honey gel (p < 0.05) as shown in Table 13.
55
4.3.3 Effect on burn wounds:
Topical application of both the honey formulations and the aloe vera gel
shortened the period of epithelization significantly (p < 0.05) and produced a
significant increase (p < 0.05) in wound contraction, when compared to the
vehicle control (Table 14). The effect of honey was greater than that of the aloe -
vera gel positive control.
4.3.4 Effect on dead space wounds:
The dry tissue weight and the breaking strength of the granulation tissue
at day 10 were both significantly increased (p < 0.05) by oral administration of
50 mg/ml and 100 mg/ml honey, when compared with control. The
hydroxyproline content was also significantly increased (p < 0.05) by the higher
dose of honey (Table 15).
A number of quantitative methods for measuring the repair of a surgical
excision can be found in the literature. All these methods rely on parameters of
dermal healing e.g. gain in tensile strength and hydroxyproline content to reflect
collagen synthesis. Granulating tissue consists of a combination of cellular
elements, including fibroblasts and inflammatory cells, new capillaries embedded
in a loose extra cellular matrix of collagen and fibronectin.
In one report wound healing was evaluated by quantitative measurement
of collagen, DNA, hexosamine and uronic acid content of the granulation tissues,
in addition to the measurements of wound contraction and epithelialization. The
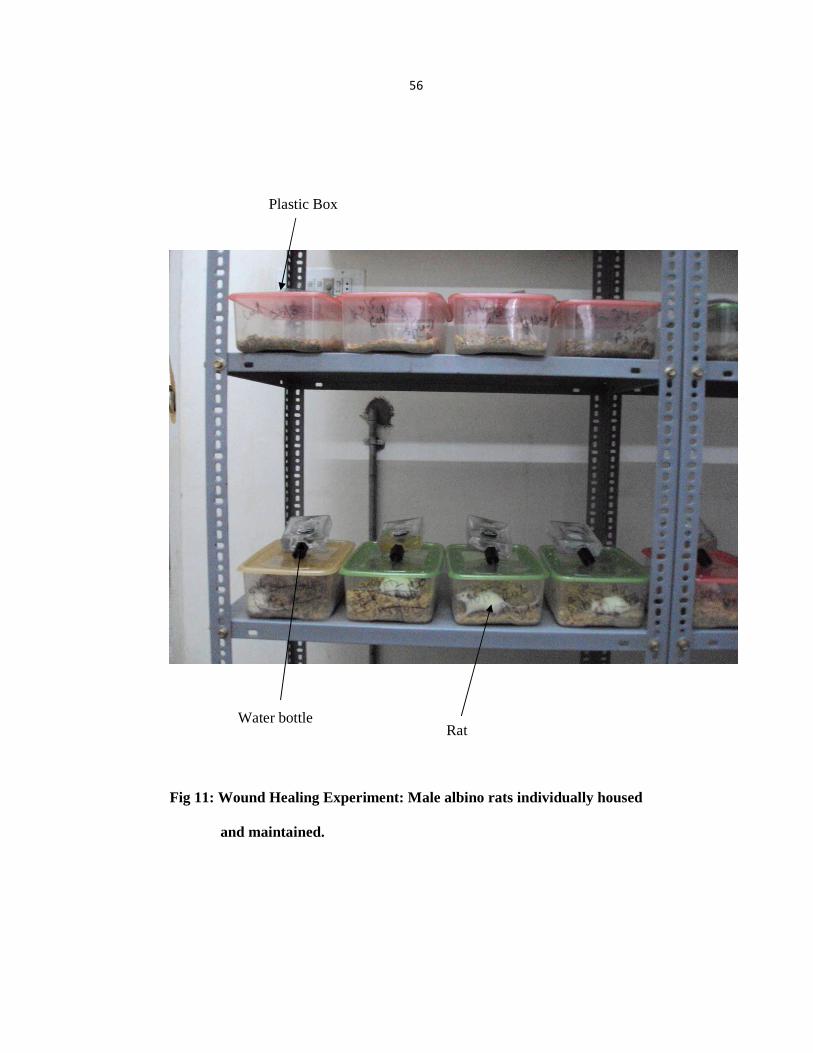
56
Fig 11: Wound Healing Experiment: Male albino rats individually housed
and maintained.
Plastic Box
Water bottle Rat
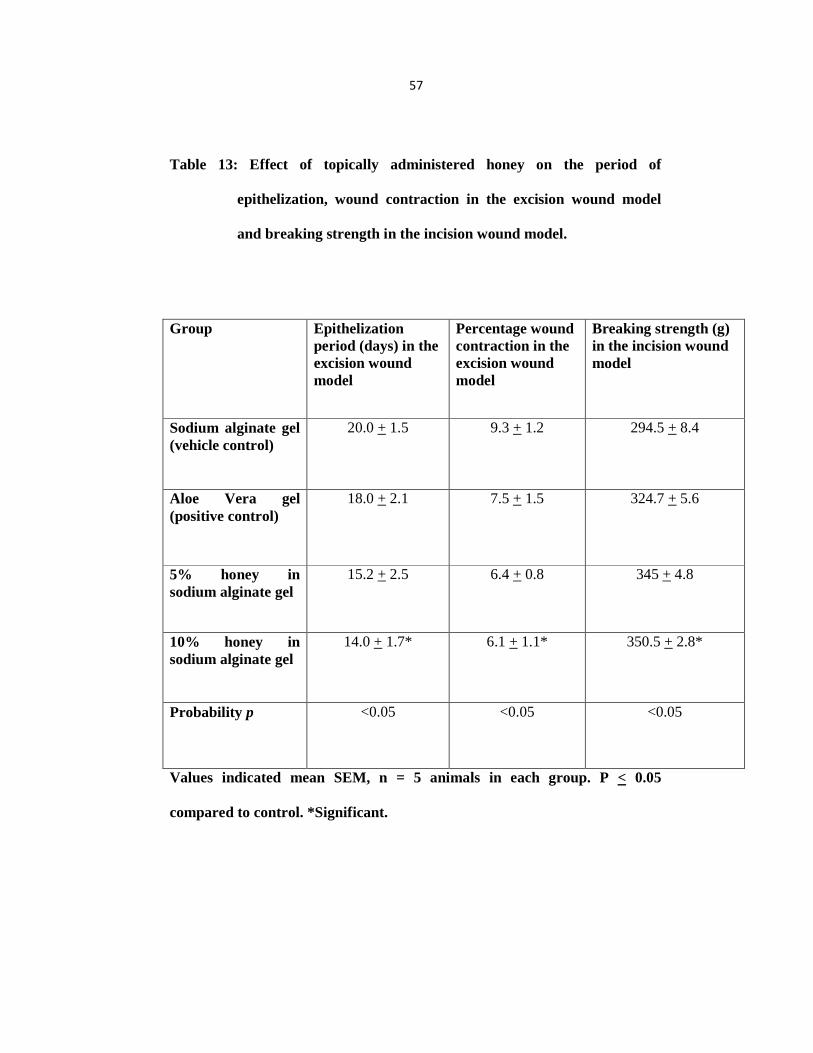
57
Table 13: Effect of topically administered honey on the period of
epithelization, wound contraction in the excision wound model
and breaking strength in the incision wound model.
Group Epithelization period (days) in the excision wound model
Percentage wound contraction in the excision wound model
Breaking strength (g) in the incision wound model
Sodium alginate gel (vehicle control)
20.0 + 1.5 9.3 + 1.2 294.5 + 8.4
Aloe Vera gel (positive control)
18.0 + 2.1 7.5 + 1.5 324.7 + 5.6
5% honey in sodium alginate gel
15.2 + 2.5 6.4 + 0.8 345 + 4.8
10% honey in sodium alginate gel
14.0 + 1.7* 6.1 + 1.1* 350.5 + 2.8*
Probability p <0.05 <0.05 <0.05
Values indicated mean SEM, n = 5 animals in each group. P < 0.05
compared to control. *Significant.
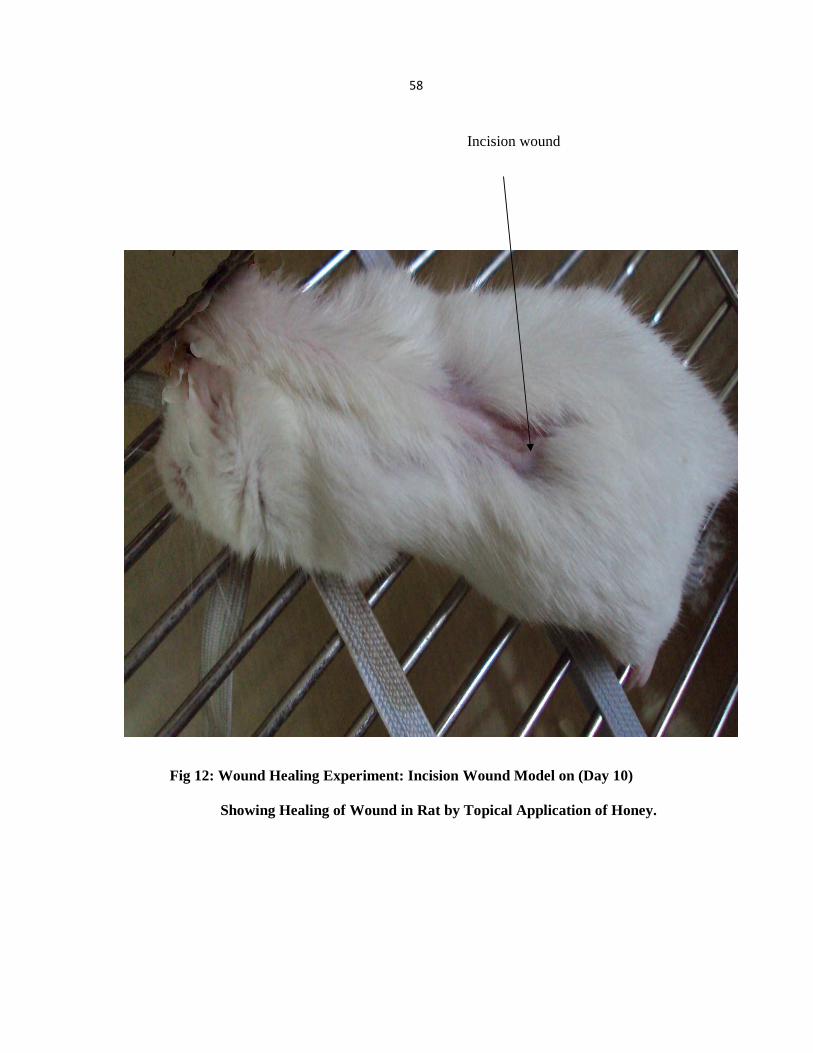
58
Fig 12: Wound Healing Experiment: Incision Wound Model on (Day 10)
Showing Healing of Wound in Rat by Topical Application of Honey.
Incision wound

59
Fig 13: Wound Healing Experiment: Incision Wound Model on (Day 15)
Showing Healing of Wound in Rat by Topical Application of Honey.
Incision wound
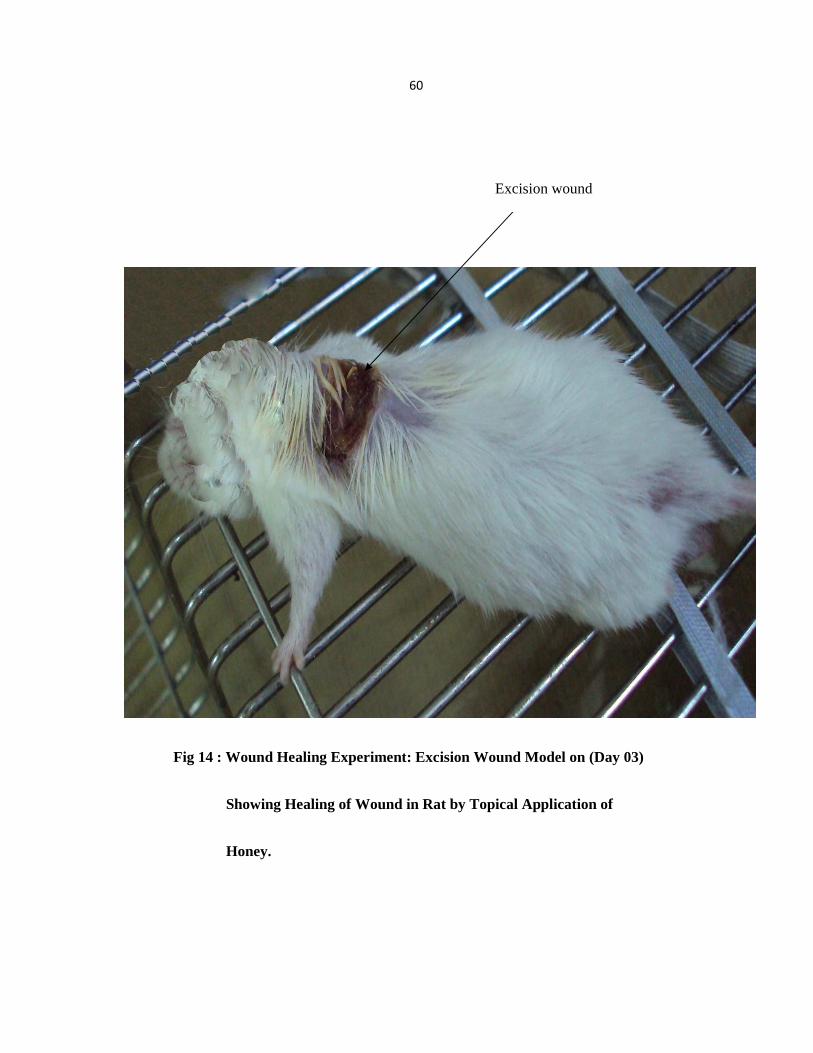
60
Fig 14 : Wound Healing Experiment: Excision Wound Model on (Day 03)
Showing Healing of Wound in Rat by Topical Application of
Honey.
Excision wound
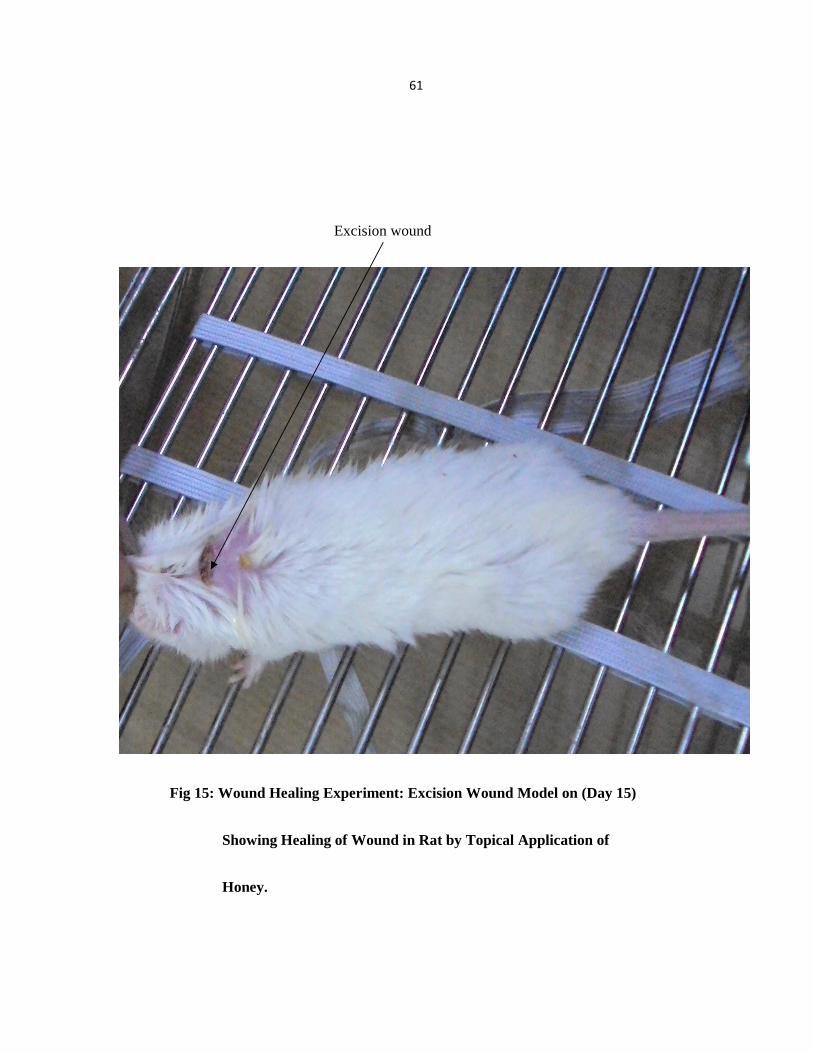
61
Fig 15: Wound Healing Experiment: Excision Wound Model on (Day 15)
Showing Healing of Wound in Rat by Topical Application of
Honey.
Excision wound
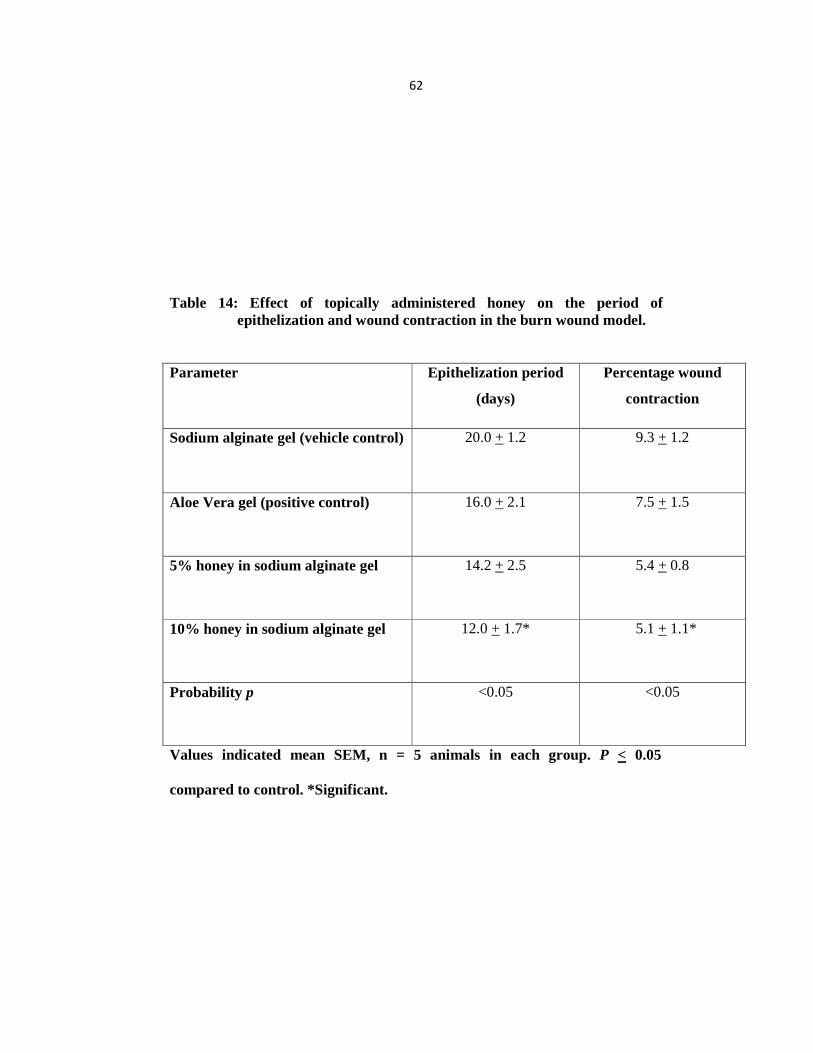
62
Table 14: Effect of topically administered honey on the period of
epithelization and wound contraction in the burn wound model. Parameter Epithelization period
(days)
Percentage wound
contraction
Sodium alginate gel (vehicle control) 20.0 + 1.2 9.3 + 1.2
Aloe Vera gel (positive control) 16.0 + 2.1 7.5 + 1.5
5% honey in sodium alginate gel 14.2 + 2.5 5.4 + 0.8
10% honey in sodium alginate gel 12.0 + 1.7* 5.1 + 1.1*
Probability p <0.05 <0.05
Values indicated mean SEM, n = 5 animals in each group. P < 0.05
compared to control. *Significant.
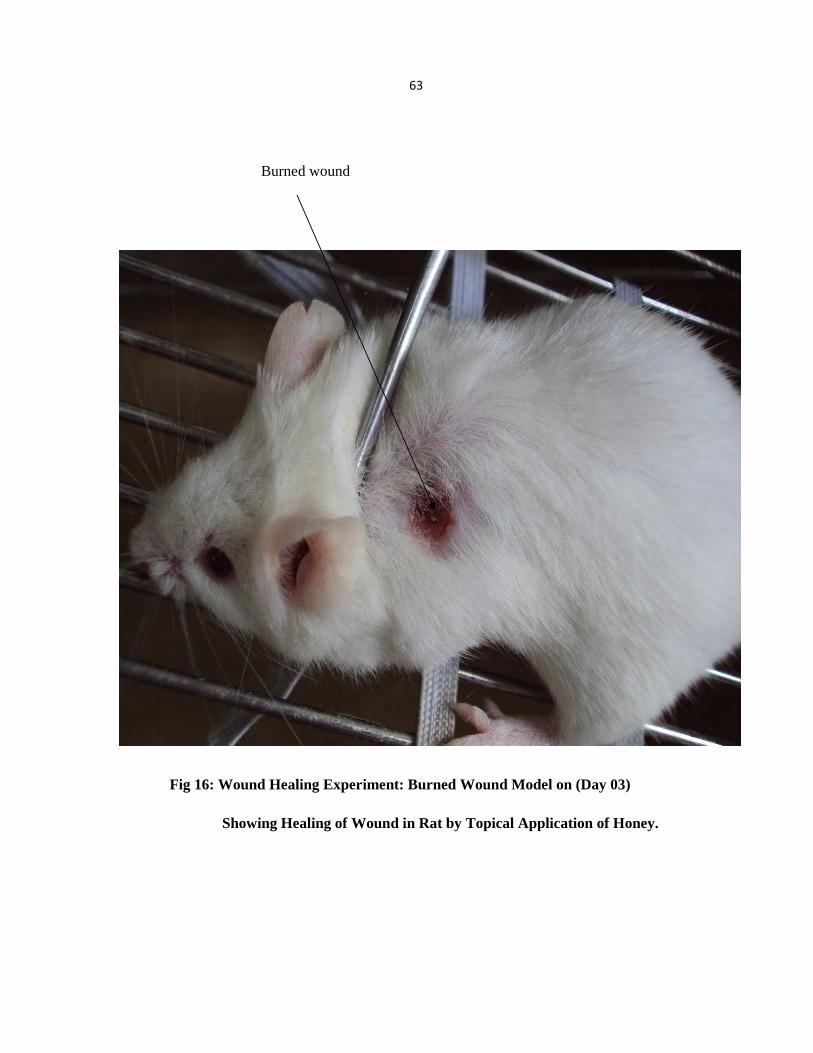
63
Fig 16: Wound Healing Experiment: Burned Wound Model on (Day 03)
Showing Healing of Wound in Rat by Topical Application of Honey.
Burned wound
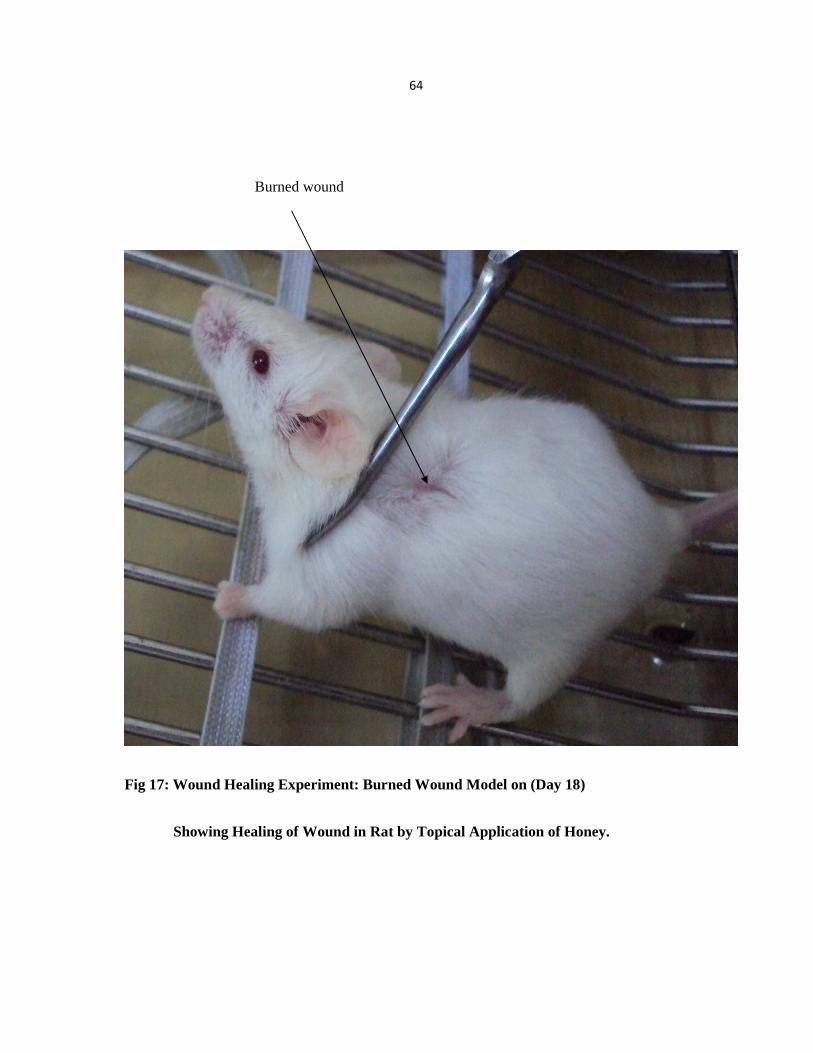
64
Fig 17: Wound Healing Experiment: Burned Wound Model on (Day 18)
Showing Healing of Wound in Rat by Topical Application of Honey.
Burned wound
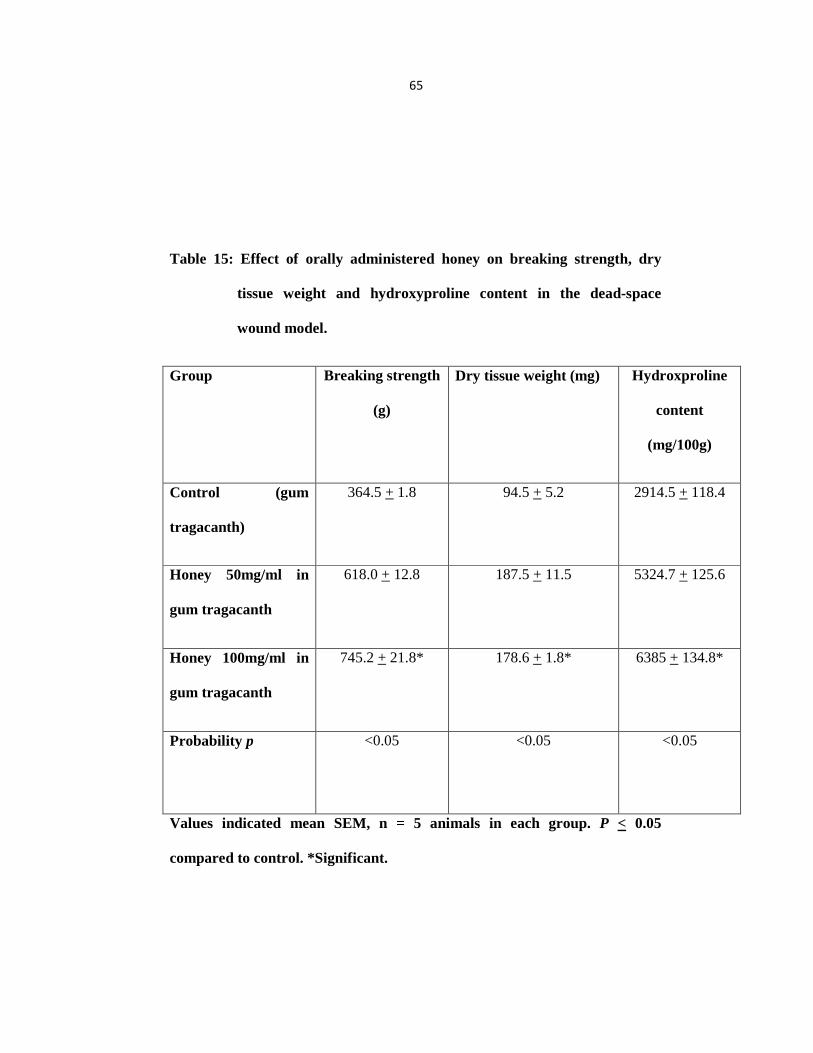
65
Table 15: Effect of orally administered honey on breaking strength, dry
tissue weight and hydroxyproline content in the dead-space
wound model.
Group Breaking strength
(g)
Dry tissue weight (mg) Hydroxproline
content
(mg/100g)
Control (gum
tragacanth)
364.5 + 1.8 94.5 + 5.2 2914.5 + 118.4
Honey 50mg/ml in
gum tragacanth
618.0 + 12.8 187.5 + 11.5 5324.7 + 125.6
Honey 100mg/ml in
gum tragacanth
745.2 + 21.8* 178.6 + 1.8* 6385 + 134.8*
Probability p <0.05 <0.05 <0.05
Values indicated mean SEM, n = 5 animals in each group. P < 0.05
compared to control. *Significant.
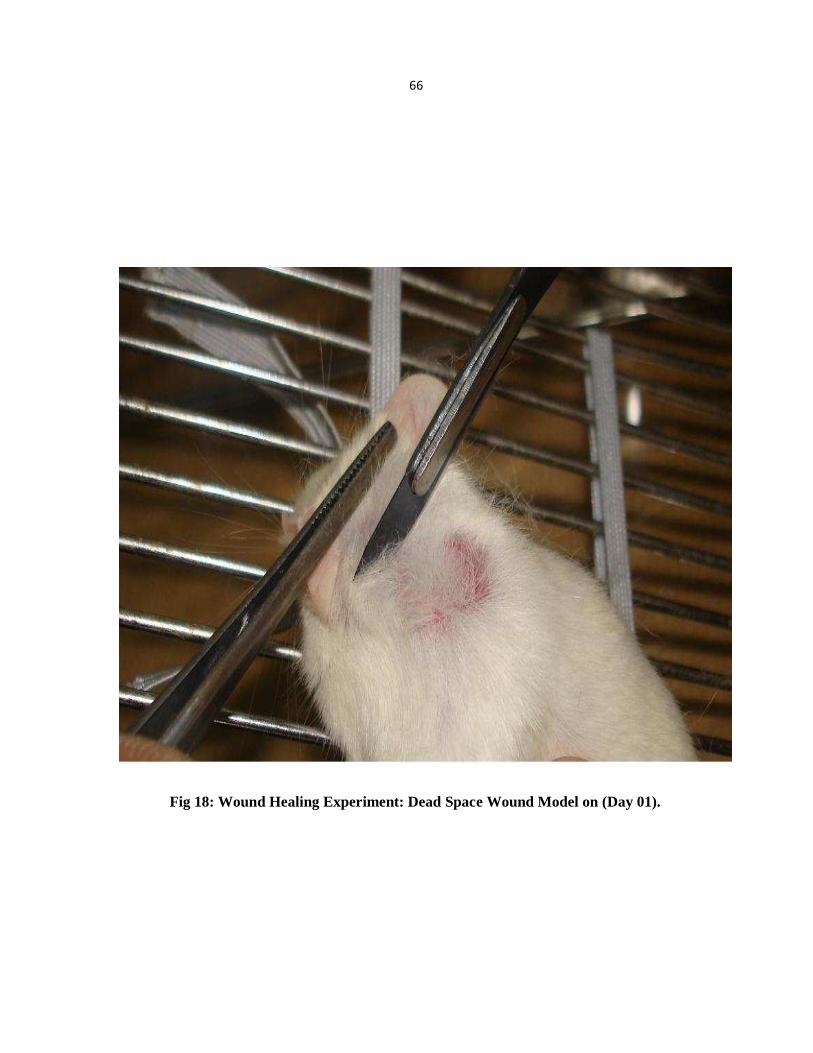
66
Fig 18: Wound Healing Experiment: Dead Space Wound Model on (Day 01).
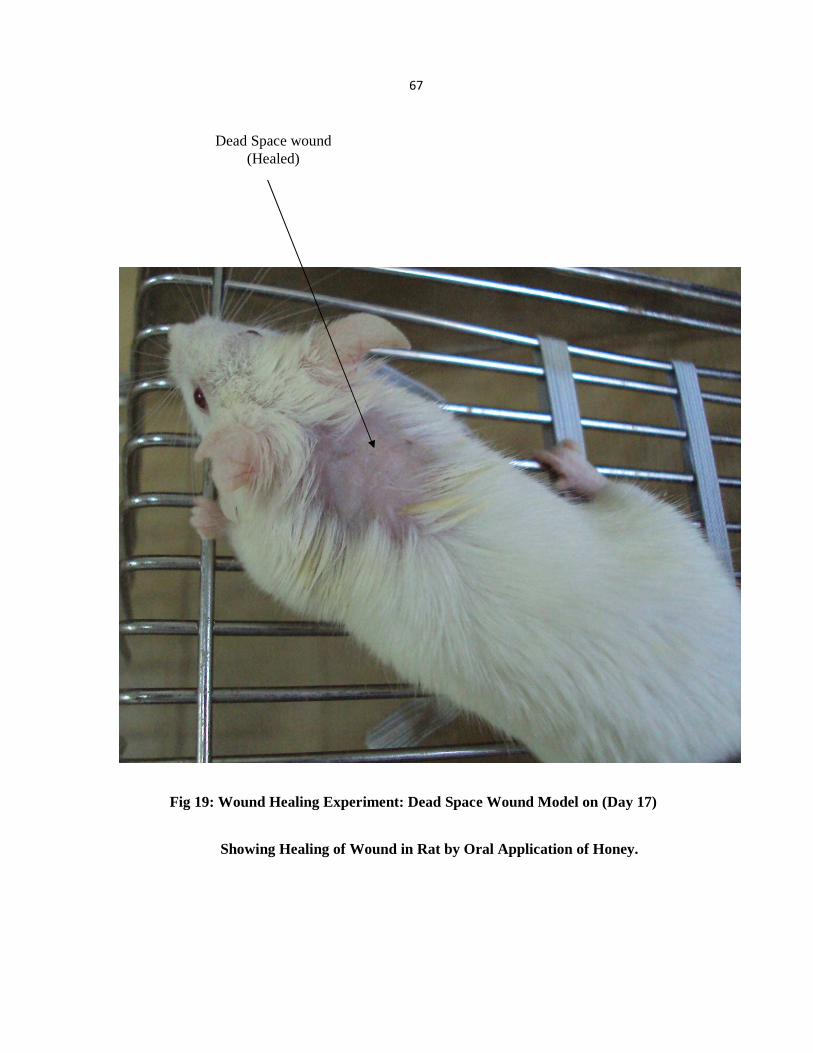
67
Fig 19: Wound Healing Experiment: Dead Space Wound Model on (Day 17)
Showing Healing of Wound in Rat by Oral Application of Honey.
Dead Space wound (Healed)
68
nutritional state of the animals was also examined by measuring the serum
albumin of experimental animals (Aljady et al., 2000).
The efficiency of the local application of honey on wounds and burns has
been reported by many researchers (Subrahmanyam, 1998; Vardi et al., 1998;
Suguna et al., 1993). However some of them showed that systemic administration
of honey (El- Banby et al., 1989; Suguna et al, 1993) especially the
intraperitoneal may give better results than the local treatment. Intraperitoneal
treatment with honey may not be convenient for the daily treatment of patients.
Moreover, the effectiveness of the oral or intraperitoneal treatment against
infected wound still needs to be evaluated (Suguna, 1993).
In the present study it was decided to investigate the influence of a
combination of oral and topical treatment on wound healing using Pakistani
honeys, which has not been assessed before. It was found that there was a
significant reduce in the period of epithelialization and an increase in wound
contraction in the excision model when honey is applied topically.
Honey contains sugars, amino acids, minerals and vitamins. These were
shown to be very important to enhance cell proliferation and hydroxyproline
synthesis. These amino acids, minerals and vitamins are important for the
formation of granulative tissue (Niinikoski, 1977). Honey contains hydrogen –
peroxide which was found to be important for stimulation of fibroblast
proliferation (Schmidt et al., 1996). In our study the hydroxyproline content was
also significantly increased by the higher dose of honey i.e. 100 mg/ml as
compared to 50 mg/ml. As reflected by hydroxyproline level, collagen content of
69
the granulation tissue increased significantly in honey treated animals as
compared to the controls. Since fibroblasts are responsible for the synthesis of
collagen in the newly formed granulation tissue, one would expect that any
increase in fibroblasts proliferation would more or less results in an increase in
collagen deposition. Honey contains high level of different amino acids including
glycine, methionine, arginine, and proline which are very important for the
formation and deposition of collagen (Gupta et al., 1992).
The use of honey in the treatment of burns in human and animal studies
has provided ample evidences. These evidences proved the effectiveness of
honey in promoting healing of burns (Subrabmanyam, 1991; Burlando, 1978).
In our experiment of effect of honey on burn wound models the topical
application of honey shortened the period of epithelialization significantly and
produced a significant increase in wound contraction, when compared to the
control. These results are in accordance with the previous reports.
Many surgeons believe that nutritional state is very important factor
which effect wound healing (Irvin, 1981). Honey treatment, especially the
combined form, significantly improved the nutritional state of the treated
animals. In addition to sugars, important source of energy, honey contains amino
acids, a number of vitamin B and C. Honey also contain minerals such as iron,
copper and zinc and potassium (White, 1975). These elements (Fe, Zn, Cu, K etc)
are cofactors for some of the enzymes which are involved in tissue repair e.g
proline hydroxylase, DNA- polymerase and lysyl oxidase (Mazzotta, 1994).
These nutritional elements present in honey are absorbed more readily through

70
the intestine than through the wound cells. So the importance of combined
treatment is more as compared to the topical treatment (Aljady et al., 2000).
4.4 Antibacterial activity of different honey:
Tables 16,17,18,19 show the inhibition zone diameters (mm) of Acacia,
Ziziphus, Brassica, and Citrus honey against nine wound infecting
microorganisms and three ATCC reference strains respectively. Quantification of
microbial growth inhibition was determined by measuring the diameter of zones
clear of microbial growth around the wells in the agar (including the well). We
used SPSS statistical programme version fourteen to analyze our data.
Comparisons between means were made using the least significant difference
(LSD) at 0.05 probabilities. The mean inhibition zone diameters (mm) for
Acacia, Ziziphus, Brassica and Citrus were 30.02 + 0.21 (Mean+ SE), 29.35 +
0.26 (Mean+ SE), 16.50 + 0.12 (Mean+ SE) and 15.67 + 0.14 (Mean+ SE)
respectively.
Beekeepers and honey users have long reported the medicinal qualities of
honey (Ransome, 1986; Rudnay, 1987; Crane 1990; Molan, 1997). Much
“folklore” has been attached to the putative medicinal effects of honey
(Ransome, 1986; Crane, 1990) and different studies have been conducted to
confirm the medicinal effects of honey produced by A. mellifera (Molan, 1997;
Bogdanove, 1997). The purpose of the present study was to investigate and
compare variation in antimicrobial activity of honey produced by A. mellifera
kept on different flora in different areas of Pakistan. Several factors may
influence the antimicrobial activity of honey.
71
They include its physicochemical properties, botanical origin,
entomological origin, and symbioses with beneficial bacteria (Demera and Esther,
2004). Honey from different phytogeopraphic regions varied in its ability to
inhibit the growth of bacteria and yeasts. It has been reported that the botanical
origin plays an important role in influencing antimicrobial activity of different
honey (Molan, 1997 a and b).
The antimicrobial effect of honey has been reported by a number of
workers (Armon, 1981; Cavanagh et al; 1968; Haffeejee and Moosa, 1985;
Hamid and Saeed, 1991; Reynold, 1989 and White et al., 1963).
In a report to determine the antimicrobial effects of Pakistani honey ten
samples of crude and processed honey were used to determine antimicrobial
activity against twenty five species of pathogenic and non-pathogenic bacteria of
human infections. Most of the samples of honey showed broad spectrum
antibacterial activity. The zone of inhibition of crude honey samples were 5-
50mm for gram positive and gram negative bacteria (Sheikh et al., 1995). In our
study the zone of inhibition of different honey samples were in the range of 15-
30mm which is in accordance with the range reported by Sheikh et al (1995).
It appears that the honey from certain plants has better antibacterial
activity than that from others. Our data justifies the same as the acacia and
ziziphus honeys are showing better antibacterial activity (greater zones of
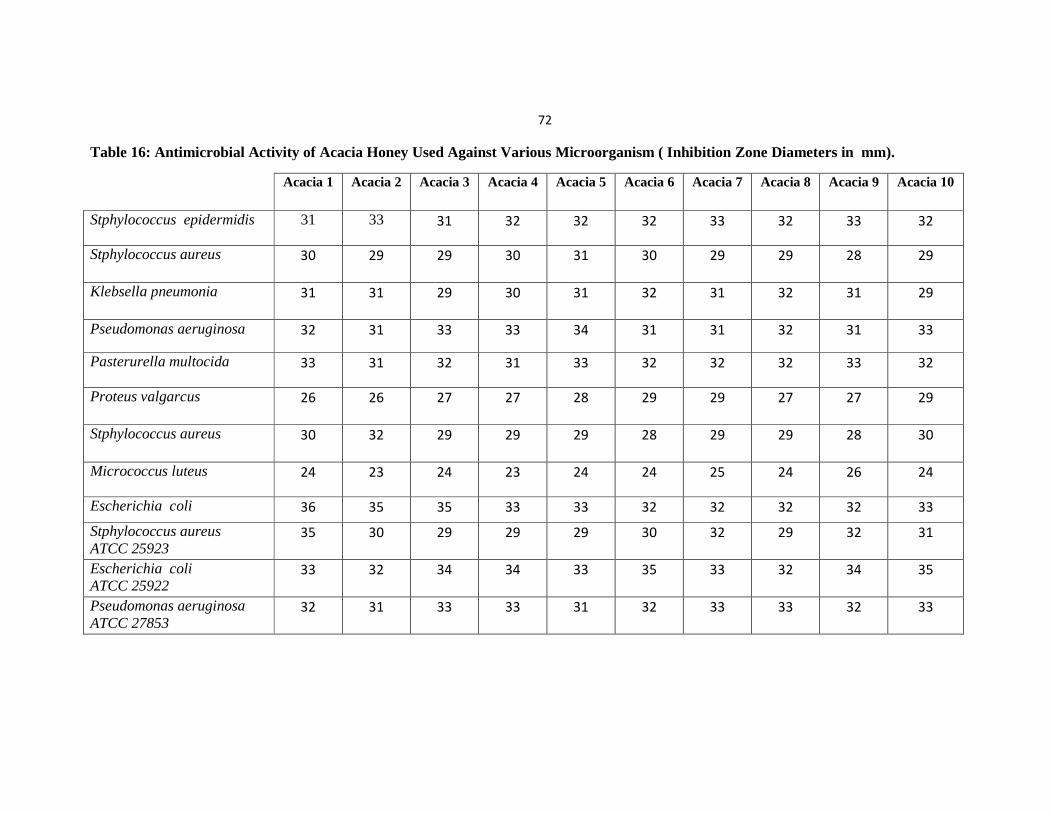
72
Table 16: Antimicrobial Activity of Acacia Honey Used Against Various Microorganism ( Inhibition Zone Diameters in mm).
Acacia 1
Acacia 2
Acacia 3
Acacia 4
Acacia 5
Acacia 6
Acacia 7
Acacia 8
Acacia 9
Acacia 10
Stphylococcus epidermidis 31 33 31 32 32 32 33 32 33 32
Stphylococcus aureus 30 29 29 30 31 30 29 29 28 29
Klebsella pneumonia 31 31 29 30 31 32 31 32 31 29
Pseudomonas aeruginosa 32 31 33 33 34 31 31 32 31 33
Pasterurella multocida 33 31 32 31 33 32 32 32 33 32
Proteus valgarcus 26 26 27 27 28 29 29 27 27 29
Stphylococcus aureus 30 32 29 29 29 28 29 29 28 30
Micrococcus luteus 24 23 24 23 24 24 25 24 26 24
Escherichia coli 36 35 35 33 33 32 32 32 32 33
Stphylococcus aureus ATCC 25923
35 30 29 29 29 30 32 29 32 31
Escherichia coli ATCC 25922
33 32 34 34 33 35 33 32 34 35
Pseudomonas aeruginosa ATCC 27853
32 31 33 33 31 32 33 33 32 33
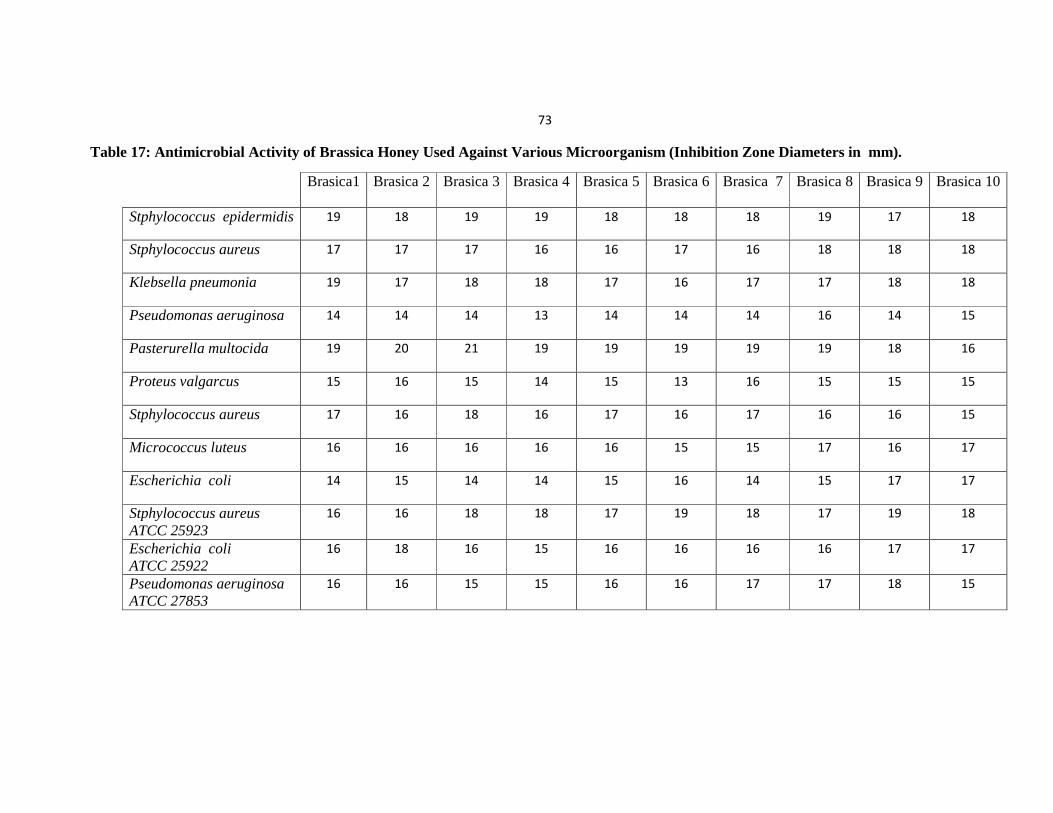
73
Table 17: Antimicrobial Activity of Brassica Honey Used Against Various Microorganism (Inhibition Zone Diameters in mm).
Brasica1
Brasica 2 Brasica 3
Brasica 4
Brasica 5
Brasica 6
Brasica 7
Brasica 8
Brasica 9
Brasica 10
Stphylococcus epidermidis 19 18 19 19 18 18 18 19 17 18
Stphylococcus aureus 17 17 17 16 16 17 16 18 18 18
Klebsella pneumonia 19 17 18 18 17 16 17 17 18 18
Pseudomonas aeruginosa 14 14 14 13 14 14 14 16 14 15
Pasterurella multocida 19 20 21 19 19 19 19 19 18 16
Proteus valgarcus 15 16 15 14 15 13 16 15 15 15
Stphylococcus aureus 17 16 18 16 17 16 17 16 16 15
Micrococcus luteus 16 16 16 16 16 15 15 17 16 17
Escherichia coli 14 15 14 14 15 16 14 15 17 17
Stphylococcus aureus ATCC 25923
16 16 18 18 17 19 18 17 19 18
Escherichia coli ATCC 25922
16 18 16 15 16 16 16 16 17 17
Pseudomonas aeruginosa ATCC 27853
16 16 15 15 16 16 17 17 18 15
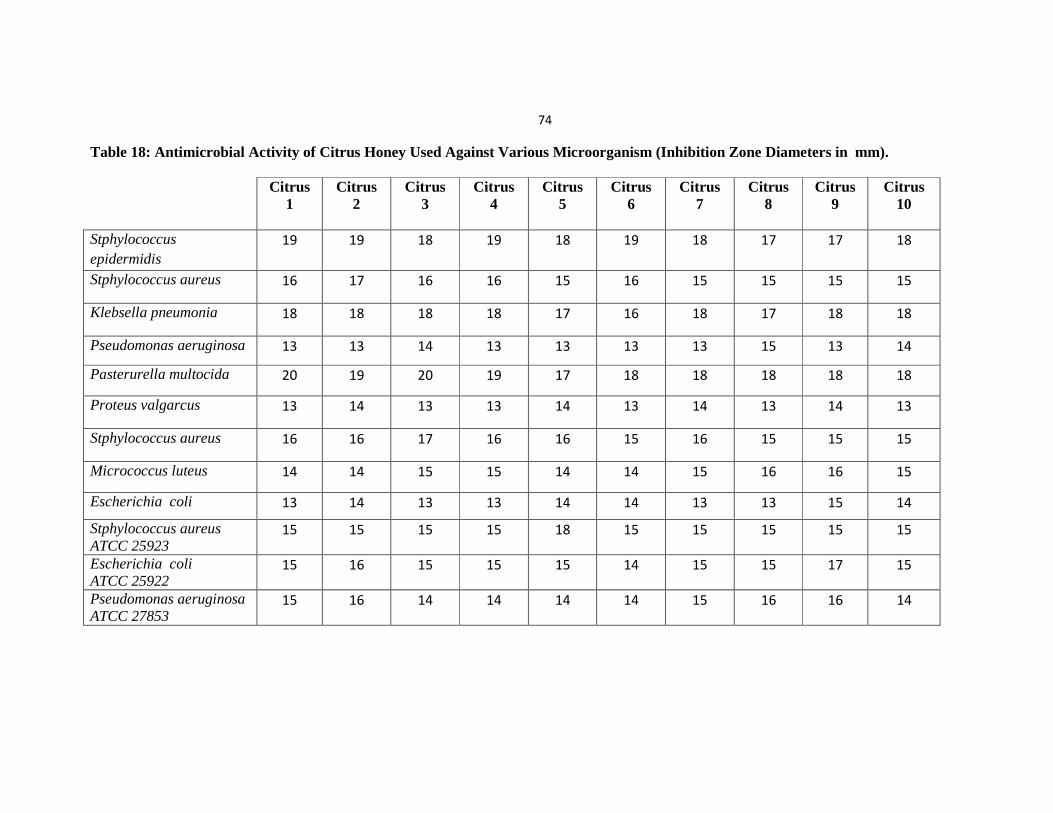
74
Table 18: Antimicrobial Activity of Citrus Honey Used Against Various Microorganism (Inhibition Zone Diameters in mm).
Citrus 1
Citrus 2
Citrus 3
Citrus 4
Citrus 5
Citrus 6
Citrus 7
Citrus 8
Citrus 9
Citrus 10
Stphylococcus epidermidis
19 19 18 19 18 19 18 17 17 18
Stphylococcus aureus 16 17 16 16 15 16 15 15 15 15
Klebsella pneumonia 18 18 18 18 17 16 18 17 18 18
Pseudomonas aeruginosa 13 13 14 13 13 13 13 15 13 14
Pasterurella multocida 20 19 20 19 17 18 18 18 18 18
Proteus valgarcus 13 14 13 13 14 13 14 13 14 13
Stphylococcus aureus 16 16 17 16 16 15 16 15 15 15
Micrococcus luteus 14 14 15 15 14 14 15 16 16 15
Escherichia coli 13 14 13 13 14 14 13 13 15 14
Stphylococcus aureus ATCC 25923
15 15 15 15 18 15 15 15 15 15
Escherichia coli ATCC 25922
15 16 15 15 15 14 15 15 17 15
Pseudomonas aeruginosa ATCC 27853
15 16 14 14 14 14 15 16 16 14
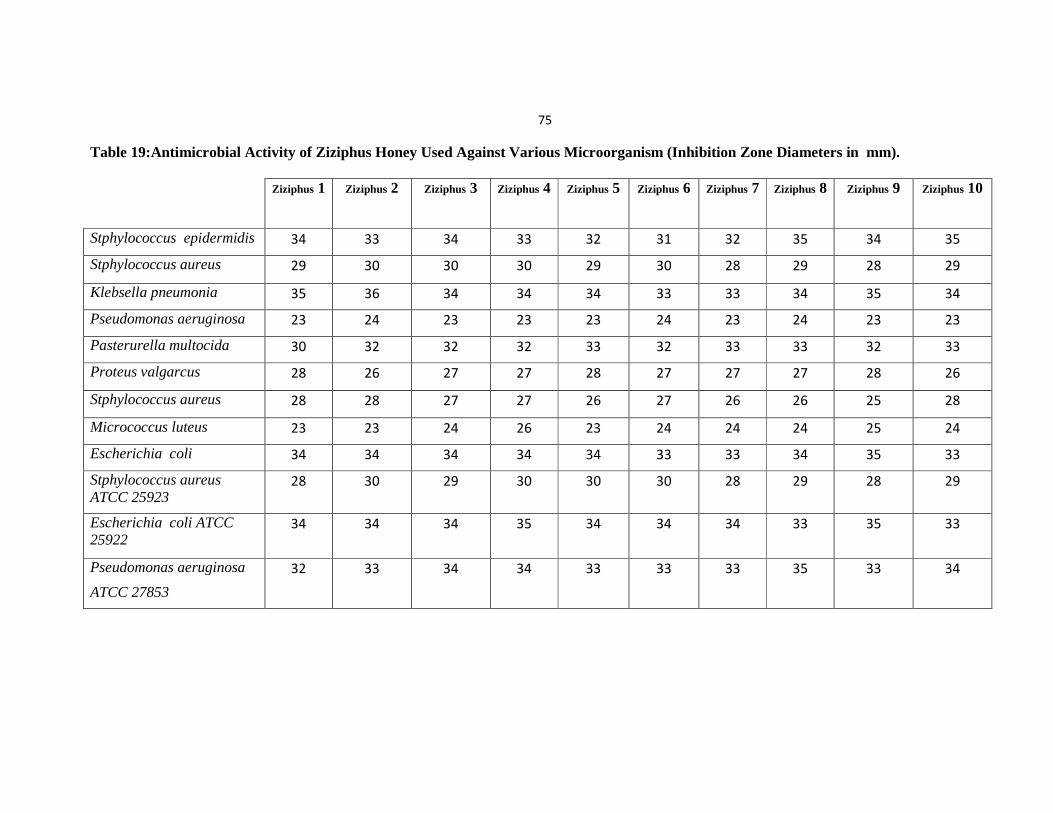
75
Table 19:Antimicrobial Activity of Ziziphus Honey Used Against Various Microorganism (Inhibition Zone Diameters in mm).
Ziziphus 1 Ziziphus 2
Ziziphus 3
Ziziphus 4
Ziziphus 5
Ziziphus 6
Ziziphus 7
Ziziphus 8
Ziziphus 9
Ziziphus 10
Stphylococcus epidermidis 34 33 34 33 32 31 32 35 34 35
Stphylococcus aureus 29 30 30 30 29 30 28 29 28 29
Klebsella pneumonia 35 36 34 34 34 33 33 34 35 34
Pseudomonas aeruginosa 23 24 23 23 23 24 23 24 23 23
Pasterurella multocida 30 32 32 32 33 32 33 33 32 33
Proteus valgarcus 28 26 27 27 28 27 27 27 28 26
Stphylococcus aureus 28 28 27 27 26 27 26 26 25 28
Micrococcus luteus 23 23 24 26 23 24 24 24 25 24
Escherichia coli 34 34 34 34 34 33 33 34 35 33
Stphylococcus aureus ATCC 25923
28 30 29 30 30 30 28 29 28 29
Escherichia coli ATCC 25922
34 34 34 35 34 34 34 33 35 33
Pseudomonas aeruginosa
ATCC 27853
32 33 34 34 33 33 33 35 33 34
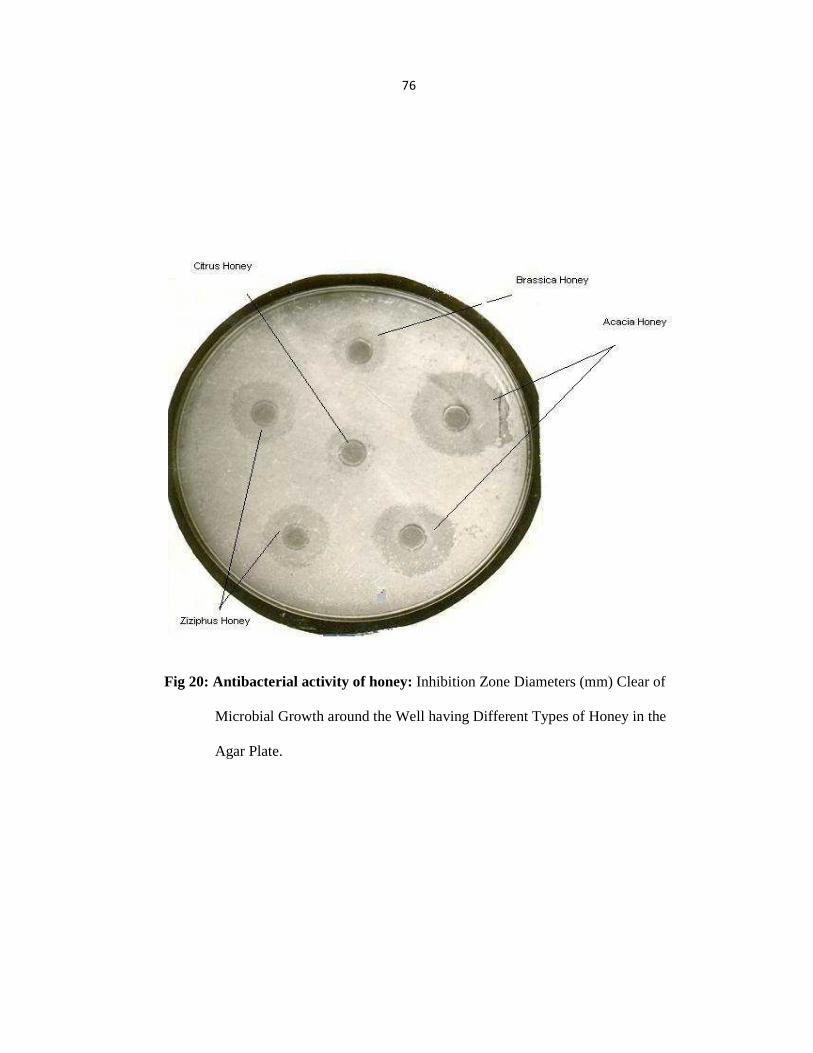
76
Fig 20: Antibacterial activity of honey: Inhibition Zone Diameters (mm) Clear of
Microbial Growth around the Well having Different Types of Honey in the
Agar Plate.
77
inhibition) as compared to the brassica and citrus honey. However, honeys from same sources
have been studied in large enough numbers or have been included in enough different studies
for some trends to be noted. Honeydew honey from the conifer forests of the mountainous
regions of central Europe has been found to have particularly high antibacterial activity. Also
honey from manuka (Leptospermum scoparium) in New Zealand has been found to show high
antibacterial activity (Allen et al., 1991).
It has been shown in our study that acacia and ziziphus honey inhibited all wound
infecting strains more effectively having greater zone of inhibition (30.02+ 0.21 for acacia and
29.35 + 0.26 for ziziphus) as compared to brassica and citrus honey (16.50 + 0.12 for brassica
and 15.67 + 0.14 for citrus). These results indicate the effectiveness of honey particularly acacia
and ziziphus honey against wound infecting bacterial strains and confirmation of variation in
antibacterial activity of honey from different floral sources. The reason for such remarkable
degree of variation between different floral sources and within the same floral source is
attributed to multiple factors. These factors included age, storage, processing procedure,
concentration of hydrogen peroxide and non peroxide factors derived from the plants (Molan,
1992). Plant derived factors are unique to each plant species. So these contribute significantly in
the variation of antibacterial activity between honeys from different plant sources (Allen et al.,
1991). The difference within the same floral source is not yet fully elucidated. Some studies
indicated the effect of climate, handling, processing of honey, the propolis content, and soil
composition are important contributing factors (Allen et al., 1991).
This underlies the importance of screening wide range of honey samples of different
floral origin from different geographical regions in order to select a honey with greater
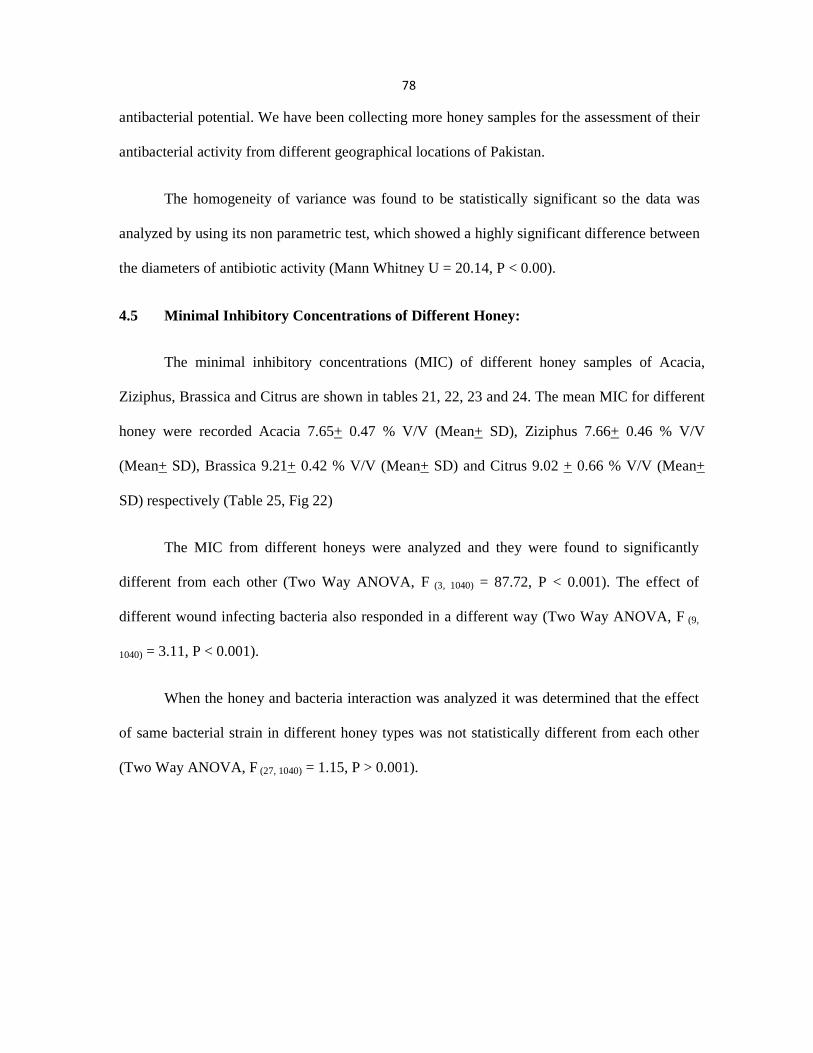
78
antibacterial potential. We have been collecting more honey samples for the assessment of their
antibacterial activity from different geographical locations of Pakistan.
The homogeneity of variance was found to be statistically significant so the data was
analyzed by using its non parametric test, which showed a highly significant difference between
the diameters of antibiotic activity (Mann Whitney U = 20.14, P < 0.00).
4.5 Minimal Inhibitory Concentrations of Different Honey:
The minimal inhibitory concentrations (MIC) of different honey samples of Acacia,
Ziziphus, Brassica and Citrus are shown in tables 21, 22, 23 and 24. The mean MIC for different
honey were recorded Acacia 7.65+ 0.47 % V/V (Mean+ SD), Ziziphus 7.66+ 0.46 % V/V
(Mean+ SD), Brassica 9.21+ 0.42 % V/V (Mean+ SD) and Citrus 9.02 + 0.66 % V/V (Mean+
SD) respectively (Table 25, Fig 22)
The MIC from different honeys were analyzed and they were found to significantly
different from each other (Two Way ANOVA, F (3, 1040) = 87.72, P < 0.001). The effect of
different wound infecting bacteria also responded in a different way (Two Way ANOVA, F (9,
1040) = 3.11, P < 0.001).
When the honey and bacteria interaction was analyzed it was determined that the effect
of same bacterial strain in different honey types was not statistically different from each other
(Two Way ANOVA, F (27, 1040) = 1.15, P > 0.001).
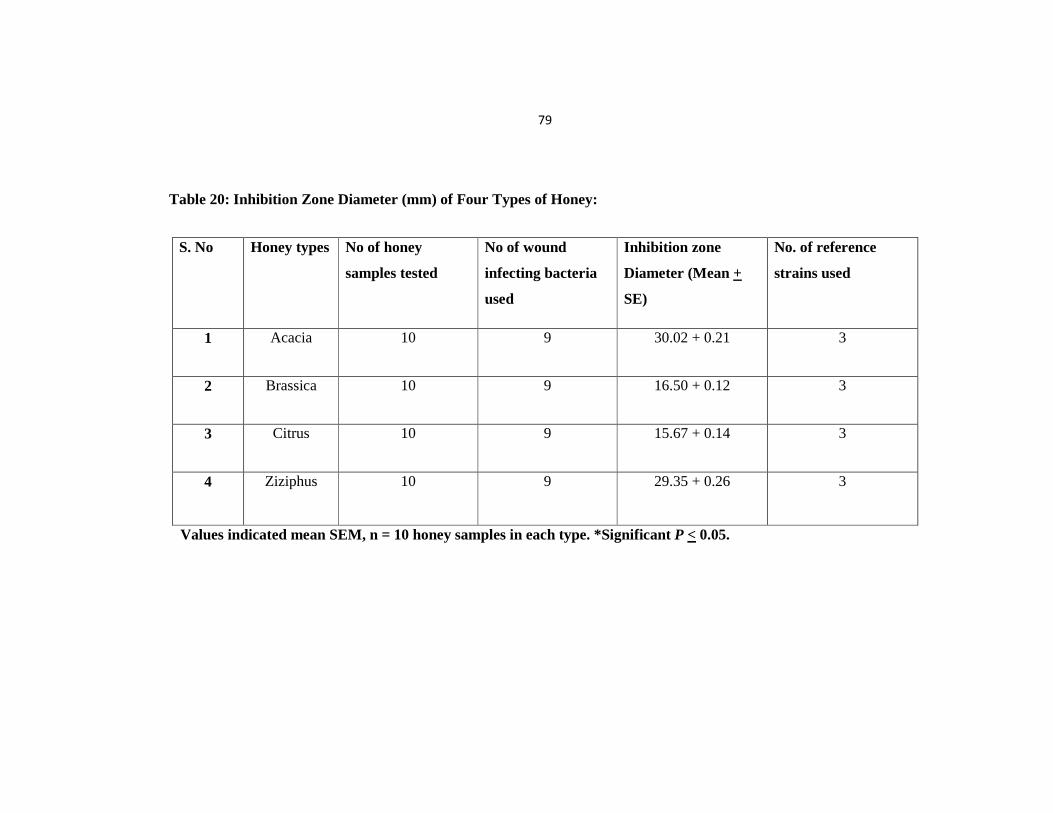
79
Table 20: Inhibition Zone Diameter (mm) of Four Types of Honey:
S. No Honey types No of honey
samples tested
No of wound
infecting bacteria
used
Inhibition zone
Diameter (Mean +
SE)
No. of reference
strains used
1 Acacia 10 9 30.02 + 0.21 3
2 Brassica 10 9 16.50 + 0.12 3
3 Citrus 10 9 15.67 + 0.14 3
4 Ziziphus 10 9 29.35 + 0.26 3
Values indicated mean SEM, n = 10 honey samples in each type. *Significant P < 0.05.
80
Fig 21: Antibacterial activity of different honey samples.
Inh
ibit
ion
zo
ne
dia
met
ers
(mm
)
81
The control MH agar plate without honey inoculated with bacterial strains exhibited the
growth of all isolates tested indicating their viability. No growth was observed in other control
plates comprising only agar and agar mixes with honey after 18 hrs of incubation at 37o C.
To the best of our knowledge, this is the first study regarding antibacterial activity of
Pakistani Acacia, Ziziphus, Brassica and Citrus honey against wound infecting strains.
Moreover, according to our knowledge, no data is available regarding efficacy of honey against
MDR wound infecting strains.
One study has shown the antibacterial activity of honey against clinical isolates of
typhoidal salmonellae (Hannan et al., 2009) showing antibiotic activity of black seed and shain
honey. It has been shown in our study that Acacia and Ziziphus honey inhibited all bacterial
strains at quite low concentrations that is 7.65 + 0.47 %v/v and 7.66 + 0.46 %v/v while Brassica
and Citrus inhibited at 9.21 + 0.42 %v/v and 9.02 + 0.66 %v/v.
Many researchers have reported the antibacterial activity of honey against S.aureus, P.
aeuruginosa, E.coli, P. mirabilis, S. pyogenus, S. flexneri and S. typhi. (Molan, 1992; Nzeako
and Hamdi, 2000; Kingsley, 2001). It has been documented that honey has a bacteriostatic and
bactericidal effect. Honey has been tested for its antibacterial activity against various species of
both gram positive and gram negative bacteria. The anti-fungal effect of honey has also been
tested (Molan, 2000). In another study conducted in Jimma University, Ethopia different human
pathogens including S. aureus, P. aeruginosa and E. coli were used. The MIC of honey against
S. aureus was 6.25%v/v, P. aeruginosa 7.5%v/v and for E.coli 6.25%v/v (Mulu et al.,
2004) Cooper et al (1999) used two New Zealand honeys and found their activity against wound
infecting strains between 2 – 3% for the manuka honey and 3 – 4% for the pasture honey.

82
Table 21:Minimum Inhibitory Concentration (% v/v) o f Acacia Honey Used Against Various Microorganism.
Acacia 1 %
Acacia 2 %
Acacia 3 %
Acacia 4 %
Acacia 5 %
Acacia 6 %
Acacia 7 %
Acacia 8 %
Acacia 9 %
Acacia 10 %
Stphylococcus epidermidis 6.0 6.0 6.0 6.0 7.0 6.0 6.0 6.0 6.0 6.0
Stphylococcus aureus 8.0 8.0 7.0 8.0 9.0 7.0 8.0 8.0 8.0 8.0
Klebsella pneumonia 8.0 8.0 8.0 8.0 9.0 8.0 8.0 8.0 8.0 8.0
Pseudomonas aeruginosa 8.0 8.0 7.0 8.0 9.0 7.0 8.0 8.0 8.0 8.0
Pasterurella multocida 6.0 6.0 6.0 6.0 7.0 6.0 6.0 6.0 6.0 6.0
Proteus valgarcus 8.0 8.0 7.0 8.0 9.0 7.0 8.0 8.0 8.0 8.0
Stphylococcus aureus 8.0 8.0 7.0 8.0 9.0 7.0 8.0 8.0 8.0 8.0
Micrococcus luteus 10.0 10.0 10.0 10.0 11.0 10.0 10.0 10.0 10.0 10.0
Escherichia coli 7.0 7.0 6.0 7.0 8.0 6.0 7.0 7.0 7.0 7.0
Stphylococcus aureus ATCC 95923
8.0 8.0 7.0 8.0 9.0 7.0 8.0 8.0 8.0 8.0
Escherichia coli ATCC 25922
7.0 7.0 7.0 7.0 8.0 7.0 7.0 7.0 7.0 7.0
Pseudomonas aeruginosa ATCC 27853
6.0 6.0 6.0 6.0 10.0 6.0 6.0 6.0 6.0 6.0
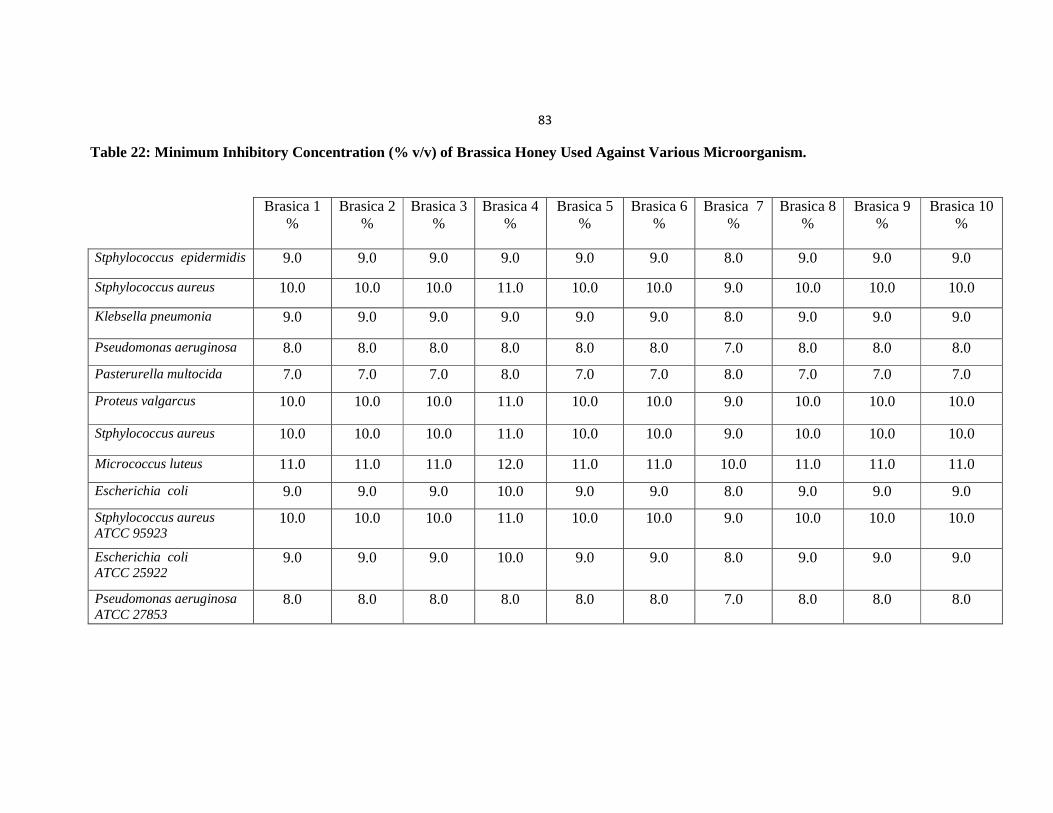
83
Table 22: Minimum Inhibitory Concentration (% v/v) of Brassica Honey Used Against Various Microorganism.
Brasica 1 %
Brasica 2 %
Brasica 3 %
Brasica 4 %
Brasica 5 %
Brasica 6 %
Brasica 7 %
Brasica 8 %
Brasica 9 %
Brasica 10 %
Stphylococcus epidermidis 9.0 9.0 9.0 9.0 9.0 9.0 8.0 9.0 9.0 9.0
Stphylococcus aureus 10.0 10.0 10.0 11.0 10.0 10.0 9.0 10.0 10.0 10.0
Klebsella pneumonia 9.0 9.0 9.0 9.0 9.0 9.0 8.0 9.0 9.0 9.0
Pseudomonas aeruginosa 8.0 8.0 8.0 8.0 8.0 8.0 7.0 8.0 8.0 8.0
Pasterurella multocida 7.0 7.0 7.0 8.0 7.0 7.0 8.0 7.0 7.0 7.0
Proteus valgarcus 10.0 10.0 10.0 11.0 10.0 10.0 9.0 10.0 10.0 10.0
Stphylococcus aureus 10.0 10.0 10.0 11.0 10.0 10.0 9.0 10.0 10.0 10.0
Micrococcus luteus 11.0 11.0 11.0 12.0 11.0 11.0 10.0 11.0 11.0 11.0
Escherichia coli 9.0 9.0 9.0 10.0 9.0 9.0 8.0 9.0 9.0 9.0
Stphylococcus aureus ATCC 95923
10.0 10.0 10.0 11.0 10.0 10.0 9.0 10.0 10.0 10.0
Escherichia coli ATCC 25922
9.0 9.0 9.0 10.0 9.0 9.0 8.0 9.0 9.0 9.0
Pseudomonas aeruginosa ATCC 27853
8.0 8.0 8.0 8.0 8.0 8.0 7.0 8.0 8.0 8.0
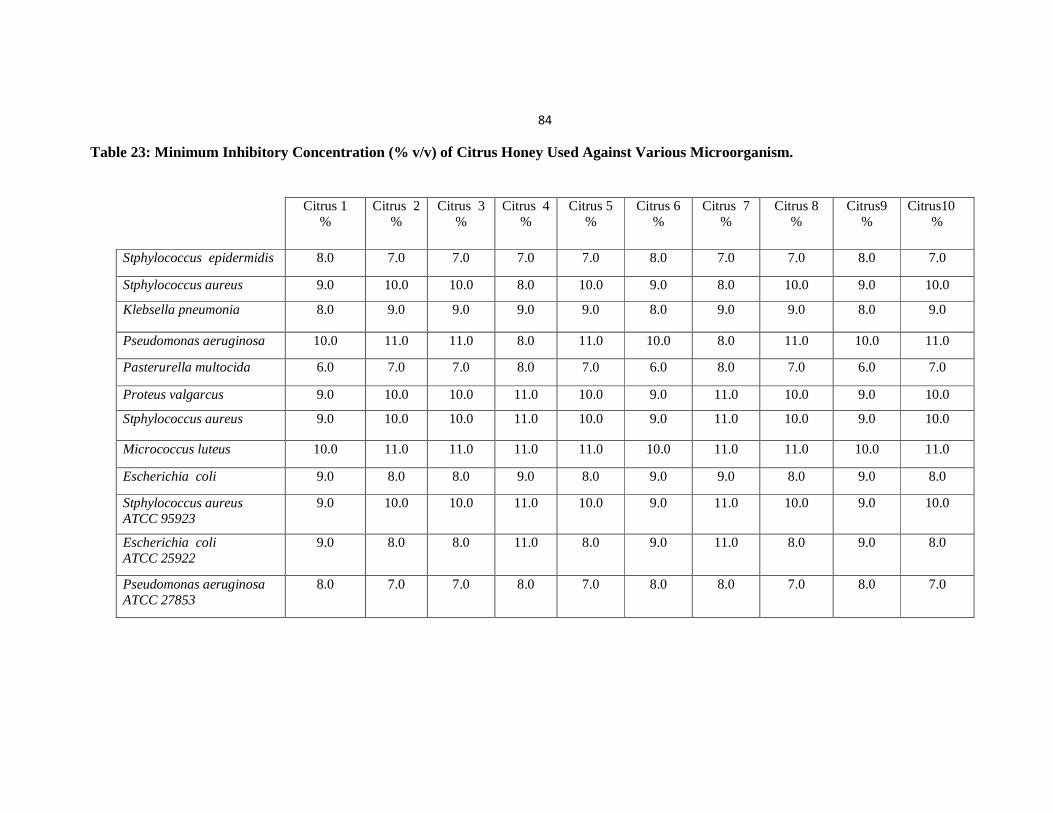
84
Table 23: Minimum Inhibitory Concentration (% v/v) of Citrus Honey Used Against Various Microorganism.
Citrus 1 %
Citrus 2 %
Citrus 3 %
Citrus 4 %
Citrus 5 %
Citrus 6 %
Citrus 7 %
Citrus 8 %
Citrus9 %
Citrus10 %
Stphylococcus epidermidis 8.0 7.0 7.0 7.0 7.0 8.0 7.0 7.0 8.0 7.0
Stphylococcus aureus 9.0 10.0 10.0 8.0 10.0 9.0 8.0 10.0 9.0 10.0
Klebsella pneumonia 8.0 9.0 9.0 9.0 9.0 8.0 9.0 9.0 8.0 9.0
Pseudomonas aeruginosa 10.0 11.0 11.0 8.0 11.0 10.0 8.0 11.0 10.0 11.0
Pasterurella multocida 6.0 7.0 7.0 8.0 7.0 6.0 8.0 7.0 6.0 7.0
Proteus valgarcus 9.0 10.0 10.0 11.0 10.0 9.0 11.0 10.0 9.0 10.0
Stphylococcus aureus 9.0 10.0 10.0 11.0 10.0 9.0 11.0 10.0 9.0 10.0
Micrococcus luteus 10.0 11.0 11.0 11.0 11.0 10.0 11.0 11.0 10.0 11.0
Escherichia coli 9.0 8.0 8.0 9.0 8.0 9.0 9.0 8.0 9.0 8.0
Stphylococcus aureus ATCC 95923
9.0 10.0 10.0 11.0 10.0 9.0 11.0 10.0 9.0 10.0
Escherichia coli ATCC 25922
9.0 8.0 8.0 11.0 8.0 9.0 11.0 8.0 9.0 8.0
Pseudomonas aeruginosa ATCC 27853
8.0 7.0 7.0 8.0 7.0 8.0 8.0 7.0 8.0 7.0
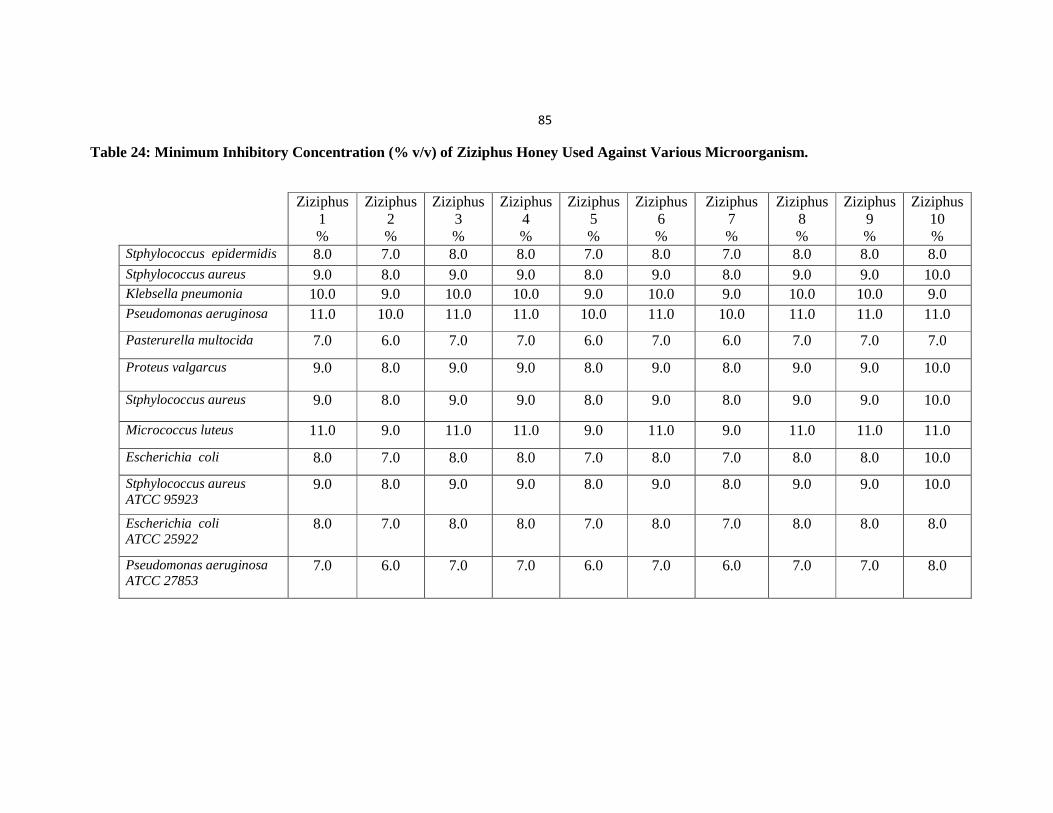
85
Table 24: Minimum Inhibitory Concentration (% v/v) of Ziziphus Honey Used Against Various Microorganism.
Ziziphus 1 %
Ziziphus 2 %
Ziziphus 3 %
Ziziphus 4 %
Ziziphus 5 %
Ziziphus 6 %
Ziziphus 7 %
Ziziphus 8 %
Ziziphus 9 %
Ziziphus 10 %
Stphylococcus epidermidis 8.0 7.0 8.0 8.0 7.0 8.0 7.0 8.0 8.0 8.0 Stphylococcus aureus 9.0 8.0 9.0 9.0 8.0 9.0 8.0 9.0 9.0 10.0 Klebsella pneumonia 10.0 9.0 10.0 10.0 9.0 10.0 9.0 10.0 10.0 9.0 Pseudomonas aeruginosa 11.0 10.0 11.0 11.0 10.0 11.0 10.0 11.0 11.0 11.0
Pasterurella multocida 7.0 6.0 7.0 7.0 6.0 7.0 6.0 7.0 7.0 7.0
Proteus valgarcus 9.0 8.0 9.0 9.0 8.0 9.0 8.0 9.0 9.0 10.0
Stphylococcus aureus 9.0 8.0 9.0 9.0 8.0 9.0 8.0 9.0 9.0 10.0
Micrococcus luteus 11.0 9.0 11.0 11.0 9.0 11.0 9.0 11.0 11.0 11.0
Escherichia coli 8.0 7.0 8.0 8.0 7.0 8.0 7.0 8.0 8.0 10.0
Stphylococcus aureus ATCC 95923
9.0 8.0 9.0 9.0 8.0 9.0 8.0 9.0 9.0 10.0
Escherichia coli ATCC 25922
8.0 7.0 8.0 8.0 7.0 8.0 7.0 8.0 8.0 8.0
Pseudomonas aeruginosa ATCC 27853
7.0 6.0 7.0 7.0 6.0 7.0 6.0 7.0 7.0 8.0
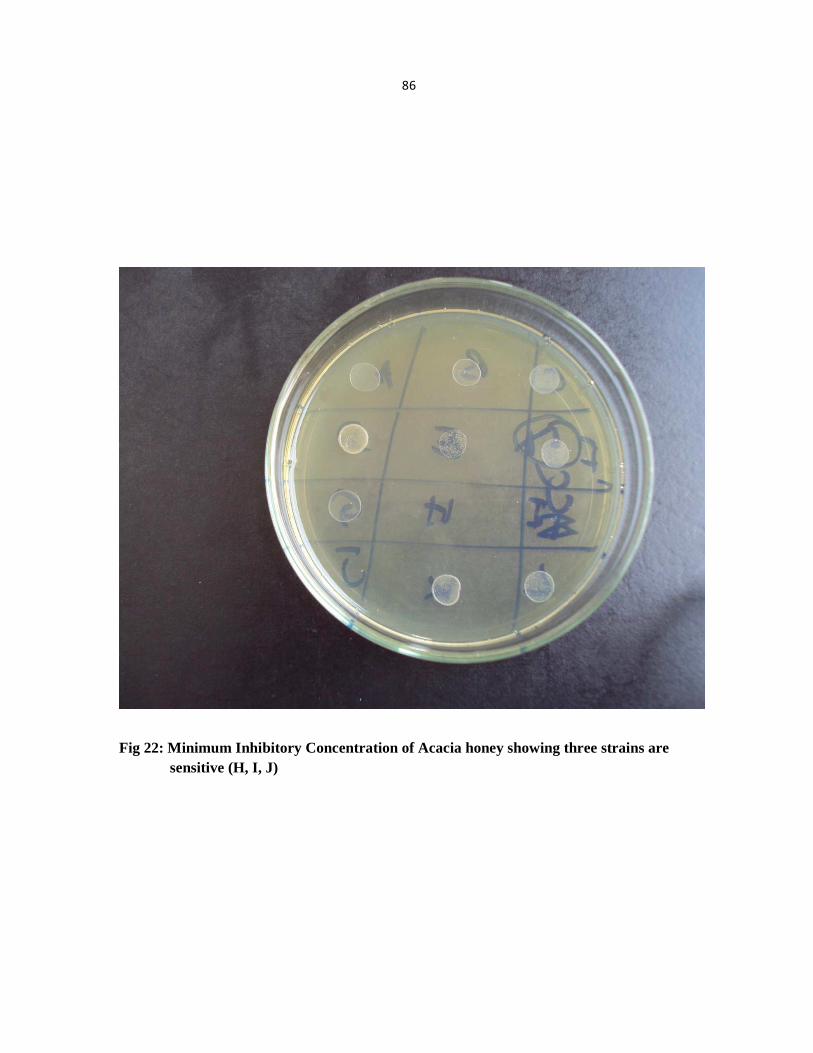
86
Fig 22: Minimum Inhibitory Concentration of Acacia honey showing three strains are sensitive (H, I, J)
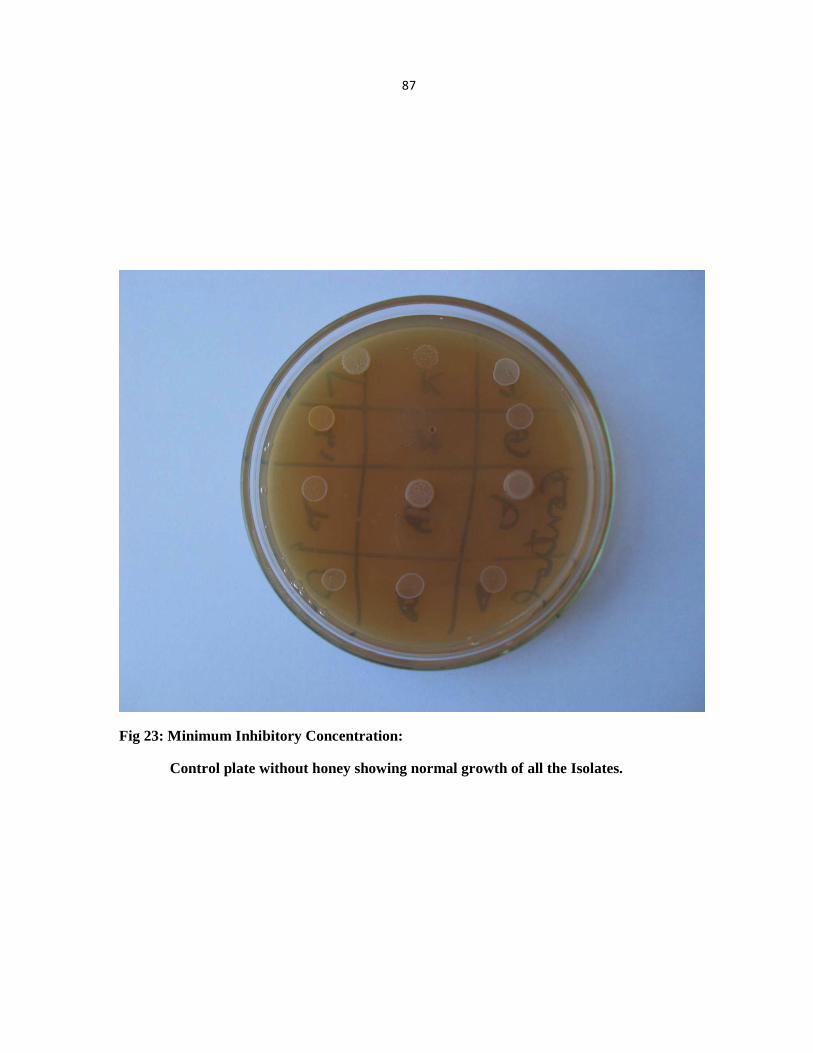
87
Fig 23: Minimum Inhibitory Concentration:
Control plate without honey showing normal growth of all the Isolates.
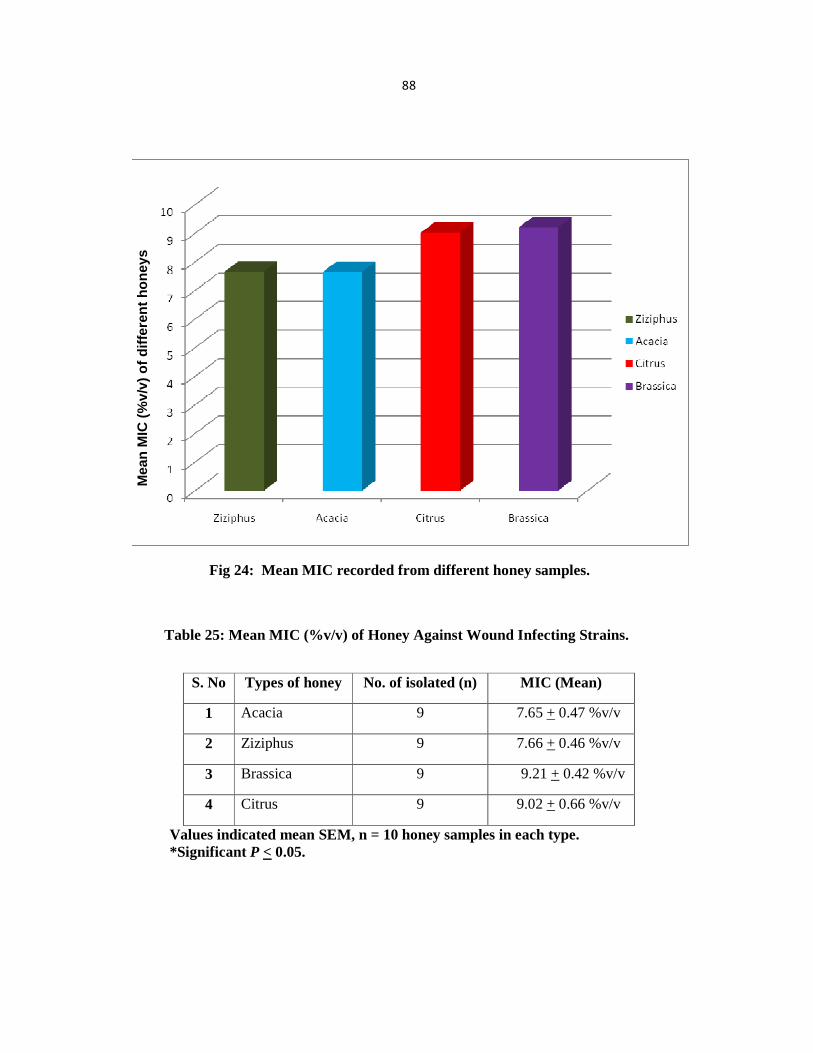
88
Fig 24: Mean MIC recorded from different honey samples.
Table 25: Mean MIC (%v/v) of Honey Against Wound Infecting Strains.
S. No Types of honey No. of isolated (n) MIC (Mean)
1 Acacia 9 7.65 + 0.47 %v/v
2 Ziziphus 9 7.66 + 0.46 %v/v
3 Brassica 9 9.21 + 0.42 %v/v
4 Citrus 9 9.02 + 0.66 %v/v
Values indicated mean SEM, n = 10 honey samples in each type. *Significant P < 0.05.
Mea
n M
IC (
%v/
v) o
f d
iffe
ren
t h
on
eys
89
Mullai and Menon (2007) have reported that manuka honey from Australia, heather
honey from the United Kingdom and local Indian honey were used to test the MIC against P.
aeruginosa. They have reported that all of these honeys showed MIC at 20% while Khadikraft
honey had 11% MIC.
P. aeruginosa is a one of the important cause of wound infections in the wounds (Janda
and Bottone 1981). In our study the clinical P. aeruginosa found to be completely inhibited at
7.9%v/v of Acacia, 10.70%v/v of Ziziphus, 7.9%v/v of Brassica and 10.1%v/v of Citrus honey
while ATCC P. aeruginosa was inhibited at 6.40%v/v, 6.8%v/v, 7.9%v/v and 7.9%v/v
respectively. It shows Pakistani honeys are effective at low concentration against P. aeruginosa
as compared to the honey of other countries reported by Mullai and Menon (2007).
90
Chapter 5
SUMMARY
Honey is generally evaluated by physicochemical analyses of its constituents. The
International honey commission (IHC) has proposed these constituents as quality criteria for
honey. These constituents include moisture, electrical conductivity, sucrose, fructose, glucose,
total sugars, pH, free acidity, hydroxylmethylfurfural (HMF), diastase and proline contents.
In the present study various honey samples from different flora of Pakistan including
Acacia, Brassica, Citrus and Ziziphus were collected and analyzed for the physicochemical
constituents by using international methods (AOAC, 2000). These constituents were pH,
acidity, moisture, ash, electrical conductivity, sucrose, fructose, glucose, total sugars, HMF,
diastase, proline and total protein. Results indicate significant difference in pH, acidity, ash,
electrical conductivity, HMF, sucrose, fructose, glucose, total sugar, diastase, proteins and
proline contents of various honey samples.
Both HMF and diastase are used as index of heat treatment and prolonged shelf life of
honey. The excessive heat treatment during processing of honey or prolonged storage above
27oC lowers the diastase and increases the HMF. HMF and diastase analyses of our honey
samples revealed that these are within the normal limits prescribed by the Codex Alimentarius
(2001). All samples showed good diastase activity and normal HMF. It means the samples were
fresh and not over heated during processing.
Different trace metals and minerals were present in these honey samples. High ash and
electrical conductivity as well as higher level of essential macro and micro elements were
found. The metal ions found in the honey samples are very important as they act as cofactor for
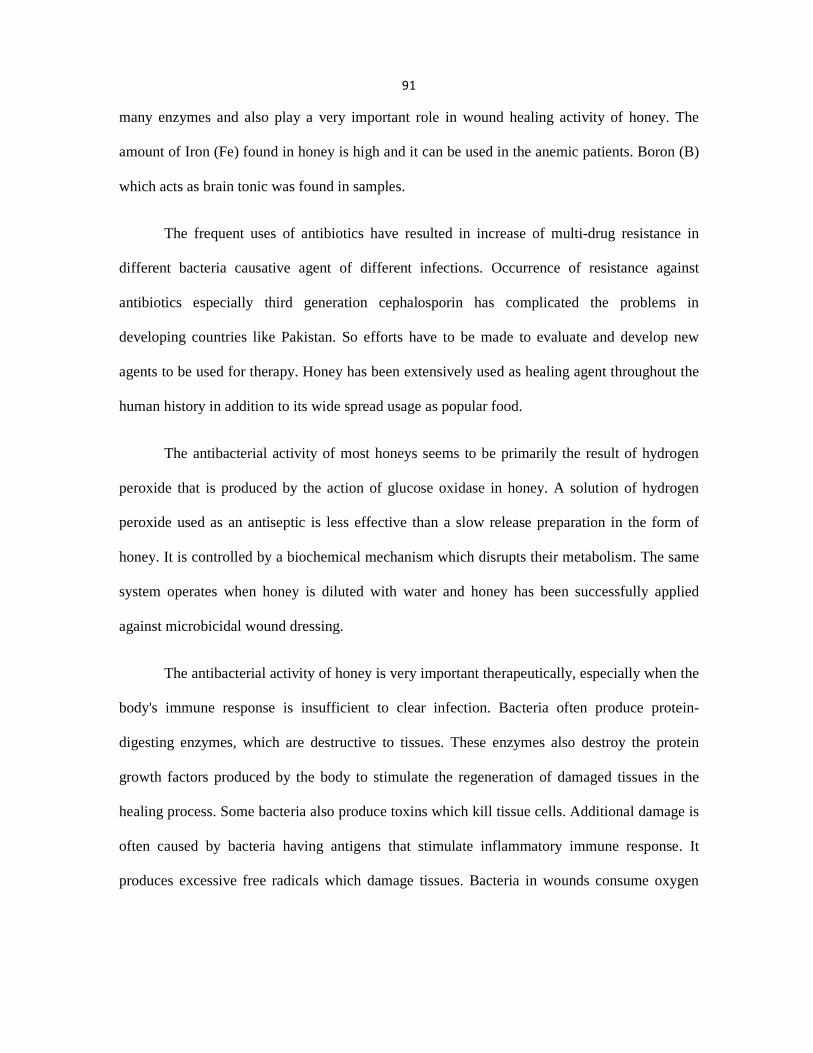
91
many enzymes and also play a very important role in wound healing activity of honey. The
amount of Iron (Fe) found in honey is high and it can be used in the anemic patients. Boron (B)
which acts as brain tonic was found in samples.
The frequent uses of antibiotics have resulted in increase of multi-drug resistance in
different bacteria causative agent of different infections. Occurrence of resistance against
antibiotics especially third generation cephalosporin has complicated the problems in
developing countries like Pakistan. So efforts have to be made to evaluate and develop new
agents to be used for therapy. Honey has been extensively used as healing agent throughout the
human history in addition to its wide spread usage as popular food.
The antibacterial activity of most honeys seems to be primarily the result of hydrogen
peroxide that is produced by the action of glucose oxidase in honey. A solution of hydrogen
peroxide used as an antiseptic is less effective than a slow release preparation in the form of
honey. It is controlled by a biochemical mechanism which disrupts their metabolism. The same
system operates when honey is diluted with water and honey has been successfully applied
against microbicidal wound dressing.
The antibacterial activity of honey is very important therapeutically, especially when the
body's immune response is insufficient to clear infection. Bacteria often produce protein-
digesting enzymes, which are destructive to tissues. These enzymes also destroy the protein
growth factors produced by the body to stimulate the regeneration of damaged tissues in the
healing process. Some bacteria also produce toxins which kill tissue cells. Additional damage is
often caused by bacteria having antigens that stimulate inflammatory immune response. It
produces excessive free radicals which damage tissues. Bacteria in wounds consume oxygen

92
and level of oxygen available to the wound tissues drop to a point where tissue growth is
impaired.
It was found that Acacia, Brassica, Citrus and Ziziphus have shown antibacterial
activity. The most effective was Acacia (30.0 mm inhibition zone diameter) Ziziphus (29.0 mm
inhibition zone diameter) Brassica and Citrus (16.5 and 15.6).
When honey is applied to wounds it reduces inflammation, oedema around wounds and
exudation from wounds. Pain is another feature of inflammation. Honey has been observed to
be soothing. The leucocytes are associated with inflammation present in the wound tissues. The
anti-inflammatory effects of honey have been demonstrated in histological studies of wounds in
animals. Although inflammation is a vital part of the normal response to infection or injury, but
when prolonged it prevent healing or even cause further damage.
The free radicals are involved in stimulating the activity of the fibroblasts, the basis of
the body's repair process. These cells are responsible for producing the connective tissue,
including the collagen fibres of scar tissue. The prolonged inflammation lead to fibrosis, an
excessive production of collagen fibres.
It was observed that honey promotes the formation of granulation tissue, and fibroblasts
around new capillary the regenerating connective tissue. Honey accelerates epithelization for
the wound coverage. This growth- stimulating property of honey has been confirmed
histologically in animals. In the present study it was decided to investigate the influence of a
combination of oral and topical treatment on wound healing using Pakistani honeys, which has
not been assessed before. It was found that there was a significant reduction in the period of
epithelialization and an increase in wound contraction in the excision model when honey is
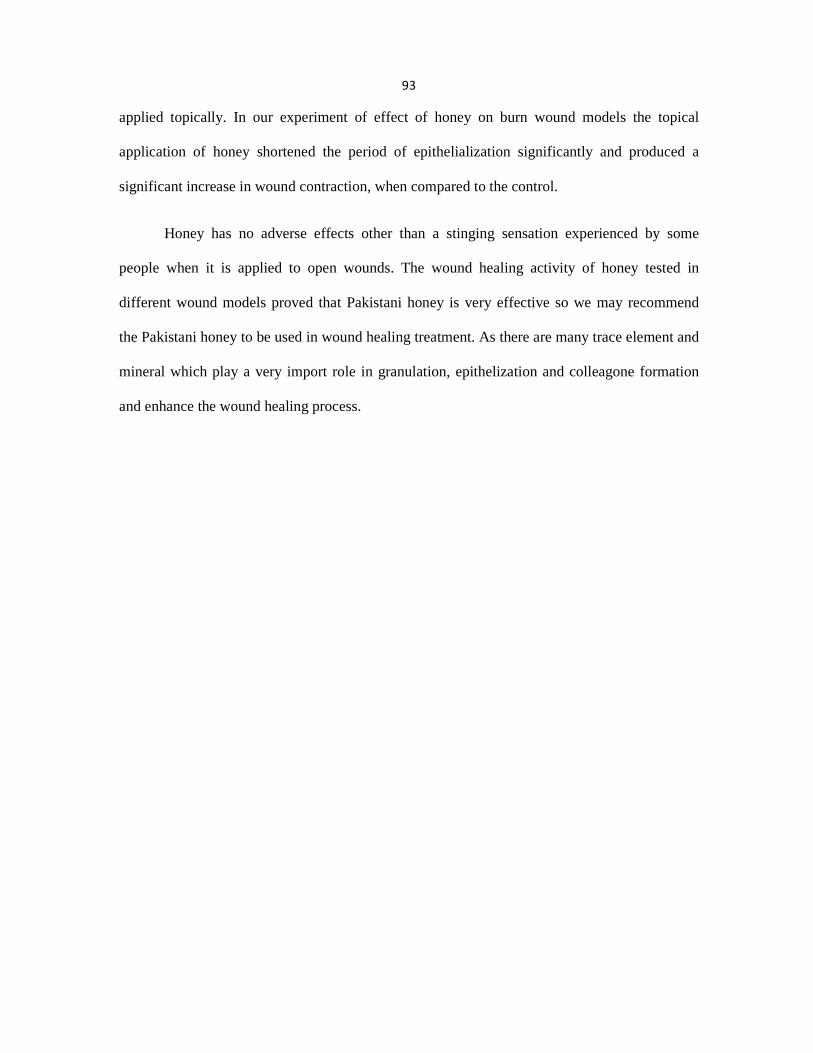
93
applied topically. In our experiment of effect of honey on burn wound models the topical
application of honey shortened the period of epithelialization significantly and produced a
significant increase in wound contraction, when compared to the control.
Honey has no adverse effects other than a stinging sensation experienced by some
people when it is applied to open wounds. The wound healing activity of honey tested in
different wound models proved that Pakistani honey is very effective so we may recommend
the Pakistani honey to be used in wound healing treatment. As there are many trace element and
mineral which play a very import role in granulation, epithelization and colleagone formation
and enhance the wound healing process.
94
Chapter 6
LITERATURE CITED
Accorti, M., M.G. Piazza and L. Persano Oddo.1983. La conductivity electrique et le contenu
en cendre du miel. Apiacta., XXII: 19-20.
Aljady M, MY, Kamaruddin , A.M Jamal M.Y Mohd Yassim, 2000. Biochemical study
on the efficacy of Maloysian Honey of inflicted wounds: An animal model.
Allen KL, Molan PC, Reid GM. 1991. A survey of the antibacterial activity of some new
Zealand honeys. J Pharm Pharmacol., 43, 817-22.
Al Somal N, Coley KE, Molan PC, Hancock BM. 1994. Succeptibility of Helicobacter pylori to
the antibacterial activity of manuka honey. J R Soc Med., 87, 9-12.
AOAC 2000. Sugars and sugar products. In: Official Methods of Analysis of The Association
of Official Analytical Chemists, 17th Ed (edited by W. Horowitz). pp. 22-33.
Gaithersburg, MD: AOAC International.
Armon P.J. (1981). Honey: a cheap antibiotic. World Health Forum., 2: 363.
95
Asif, A., G. Kakub, S. Mehmood, R. Khanum and M. Gulfraz. 2007. Wound healing activity of
root extracts of Berberis lyceum Royle in rats.Phytother Res., 21:589-591.
Atrouse, O.M., S.A. Oran and S.Y. AI Abbadi, 2004. Chemical analysis and identification of
pollen grains from different Jordanian honey samples. International J. Food Sci. and
Tech., 39:413-417.
Beck, D.F. and D. Smedley. 1997. “Honey and Your Health: A Nutrimental, Medicinal and
Historical Commentary.” Health resources, Inc., Silver Springs, MD.
Bergman A, Yanai J, Wiess J, Bell D, David MP. 1983. Acceleration of wound healing by
topical application of honey: an animal model. Am J Surg., 145, 374-6.
Bogdanov, S; Martin, P; Lullmann, C (1997) Harmonised methods of the European honey
commission. Apidologie., (extra issue): 1-59.
Bogdanov S. (1997). Nature and origin of the antibacterial substances in honey, Lebensm. Wiss.
Technol., 30, 748 – 753.
96
Bogdanov, S., V. Kilchenmann and P. Fluri. 1998. Influence of organic acids and components
of essential oils on honey tastes. Am. Bee. J., 139: 61-63.
Bogdnov, S., C Lullman, P.Martin, W. Von der ohe and Ho Russmann et al., 1999. Honey
Quality, methods of analysis and international regulatory standards: review of the work
of the International Honey Commision., Mitt Leb.
Bogdanov, S; Rouff, K; Persano Oddo, L, 2004. Physico-chemical methods for the
characterization of unifloral honey: a review. Apidologie., 35 (4): 275-282.
Bogdanov, S; Haldimann, M; Luginbuhl,W; Gallmann, P (2007) Minerals in honey:
environmental, geographical and botanical aspects. Journal of Apicultural Research and
Bee World., 46 (4): 269-275.
Bogdanov Stefan, 2009. Bood of honey. Bee product Science., Chapter 5.
Bradford MM. 1976. A rapid and sensitive method for the qualitatively of microgram quantities
of protein utilizing the principle of protein –bye binding. Anal Biochem., 72: 248-254.

97
Burlando F, Sull, 1978. Azion terapeutica del miele nelle ustion. Minerva Dermatologica.,
113:699-706.
Cavanagh D., Beaziey J. and Ostapowicz F. (1968). Radical operation for carcinoma of the
vulva: a new approach to wound healing Journal of Obstestritics and Gynaecology of
the British Commonwealth., 77: 1037 – 1040.
Chandler, B.V., D.O. Fenwick, T. Hara and T. Reynolds. 1974. Composition of Australian
Honeys. CSIRO AUST.Div. Fd. Res.Tech., Pap no.1-39.
Coco, F.L., C. Valentini, V.Sapra and L. Ceccon. 1996. High performance liquid
chromatographic determination of 2-furaldehyde and 5-hydroxymethyl-2-furaldehyde in
honey. J. of Chromatography A., 749: 95-102.
Codex Alimentarius. 2001. Draft revised standard for standard for honey (at step 10 of the
codex procedure). Alinorm., 01/25: 19-26.
Cooper RA, Molan PC, Harding KG.1999.Antibacterial activity of honey against strains of
Staphylococcus aureus from infected wounds. J Roy Soc Med., 92: 283-285.
98
Cooper, R. 2001. How does honey heal wounds? In “Honey and Healing,” ed. P. Munn and R.
Jones. International Bee Research Association, Cardiff ., UK.
Cooper, R.A., Molan,P. and Harding, K.G., 2002. The sensitivity to honey of gram positive
cooci of clinical significance isolated from wounds. J. appl. Microbial., 93: 857 – 863.
Cotte, JF; Casabianca, H; Giroud, B; Albert, M; Lhertier, J; Grenier-Loustalot, MF, 2004.
Characterization of honey amino acid profiles using high-pressure liquid
chromatography to control authenticity. Analytical and Bioanalytical Chemistry., 378
(5): 1342-1350.
Crane, E. 1976. “Honey: A Comprehensive Survey,” Corrected edition. International Bee
Research, London.
Crane E. (1990). Bees and beekeeping: science, practice and world resources, Heinemann
Newnes, Oxford., 614 p.
Crews, C., J. R Startin and P. A. Clarke. 1997. Determination of pyrrolizidine alkaloids in honey
from selected sites by solid phase extraction and HPLC-MS. Food Addition
Contamination., 14: 419-428.
99
Daniel, F.S. and A.W. John. 1991 Antibacterial susceptibility tests: dilution methods. In Manual
of Clinical Microbiology, 5th edn (eds A Balows, WJ Hausler Jr, KL Harrmann, HD
Isenberg & HJ Shadomy), American Society for Microbiology, Washington DC.,
pp.1105–1116.
Darcy, B., N. Caffin, B. Bhandari, N. Squires, P. Fedorow and D. Mackay. 1999. Australian
Liquid honey in commercial bakery products. RIRDC., publication No 99/145.
Demera H.J. and Esther R. A. (2004). Comparison of the antimicrobial activity of honey
produced by tetragonisca angustula (Meliponinae) and A. mellifera from different
phytogeographic region of Costa Rica. Apidologie., 35, 411 – 417.
Doner, L W (1977). The sugars of honey – a review. Journal of the Science of Food and
Agriculture., 28: 443-456.
Echigo, T; Takenaka, T (1974). Production of organic acids in honey by honeybees. Journal of
Agriculture. Chem. Soc., Japan 48(4): 225-230.
Efem SE. 1988. Clinical observation on the wound healing properties of honey. Br J Surg., 75,
679-81.
100
Efem SE, Udoh KT, lwara Cl. 1992. The antibacterial spectrum of honey and its clinical
significance. Infect., 20, 227-9.
Efem SE. 1993. Recent advances in the management of fournier’s gangrence: Preliminary
observations. Surgery., 113, 200-4.
El-Banby M, Kandil A. Abou Sehly G et al, 1989. Heation effect of gloral honey and honey
from suygar fed bees on surgical wounds (animal model) Fourth international conference on
apiculture in tropical climate. Cairo, Egypt.
EU Council. 2002. Council Directive 2001/110/EC of 20 December 2001 relating to honey.
Off. J. of Eu commun., 10: 47-52.
Feller-Demalsy, M J; Vincent, B; Beaulieu, F (1989) Mineral content and geographical origin
of Canadian honeys. Apidologie., 20 (1): 77-91.
Ghazal, Mairaj., S.Akhtar, A.R. Khan, Z.Ullah, S.Bibi and S.Ali. 2008 Quality Evaluation of
Different Honey Samples Produced in Peshawar Valley. Pak. J. of Biol. Sci., 5: 797-
800.

101
Golob, T. and A. Plestenjak. 1999. Quality of Slovene honey. Food Tech. and Biotech., 37: 195-
201.
Gonzales-Miret, M L; Terrab, A; Hernanz, D; Fernandez-Recamales, M A; Heredia, F J (2005).
Multivariate correlation between color and mineral composition of honeys and by their
botanical origin. Journal of agricultural and food chemistry., 53 97): 2574-2580.
Gupta SK, Singh, Varshiney AC, Prakash P, 1992. Therapeutic efficacy honey in infected
wounds in buffales Ind J Anim Sci., 62:521-523.
Haffeejee I.E. and Moosa A. (1985). Honey in the treatment of infantile gastroenteritis. British
Medical Journal., 290: 1866-1867.
Hamid S. and Saeed MA. (1991). Bee keeping. Hamdard Medical., 34 (3): 94 – 95.
Irvin TT, 1981. The heating wound in wound healing principles and Practice first Ed. Chapman
and Hall, London, PP2-15.
102
Janda JM, Bottone EJ. 1981. Pseudomonas aeruginosa enzyme profiling: Predictor of potential
invesiveness and use as an epidemiological tool. J clin microbial., 14: 55 – 60.
JAOAC, 1969. 47, 488- 499.
Jeddar A, Kharsan YA, Ramsaroop UG, Bhamjee A, Haffejee E, Moosa A. 1985. The
antibacterial action of honey: an in vitro study. S Afr Med J., 67, 257-8.
Kamal, A., S.Raza, N.Rashid, T.G. Hammed, M. Lami, M.A. Gureshin and K. Nasim. 2002.
Comparative study of Honey collected from flora of Pakistan. On Line J. Biol. Sci.,
23(9): 626-627.
Kandil A, El-Banby M, Abdel- Wahed K, Abou – sehly G, Ezzat N. 1987. Healing effect of true
floral and false non-floral honey on medical wounds. J Drug Res., (Cairo) 17: 71 – 75.
Kapoulas VM, Mastronicolis SK, Galanos DS. 1977. Identification of the lipid components of
honey. Z Lebensm Unters Forsch., 163, 96-9.
103
Kaufman T; Eichenlaub Eh, Angel MF, Levin M, Futrell JW. 1985. Topical acidification
promotes healing of experimental deep partial thickness skin burns: a randomized
doubleblind preliminary study. Burns., 12: 84 – 90.
Kingsley A, 2001. Supplements. The use of honey in treatment of infected wounds.,10 (22) Sup
13 Sup 20.
Kump, P., Neemer, M. & Najder, J. (1996). Determination of trace elements in bee honey,
pollen and tissue by total reflection and radioisotope X-ray fluorescence spectrometry.
Spectrochimica Acta Part B. Atomic Spectroscopy., 51, 499 – 507.
Kunst, A., B. Draeger and A. Ziegenhoen. 1984. Methods of Enzymatic analysis. Weinheim
Germany., 6:178-185.
Ladas, S.D., D.N. Haritos and S.A. Raptis. 1995. Honey may have a laxative effect on normal
subjects because of incomplete fructose absorbtion. Am. J. clin. Nutr., 62:1212-1215.
Ladas, S.D. and S.A. Raptis. 1999. Honey, fructose absorption and the laxative effect.
Nutrition., 15(7-8): 591-592.
104
Latif, A., H.A. Qayyum and M. Haq, 1956. Researches on the composition of native honey. Pak.
J. Sci. Res., 8: 163.
Lawal, R.A, A.K. Lawal and J.B. Adekalu (2009). Physico-chemical Studies on Adulteration of
Honey in Nigeria. Pakistan Journal of Biological Sciences., 12 (15): 1080-1084.
Lochhead, A G, 1933. Factors concerned with the fermentation of honey. Zent.Bakt.
Paras.u.Infect., II 88: 296-302.
Lohr GW, Waller HD. 1974. Glucose-6-phosphate dehydrogenase. In methods of enzymatic
analysis, Bergmeyer HU (ed.). verlag chemie weinheim, Germany., 636 – 643.
Malika N., F. Mohamed and E.L. Adlouni Chakib. 2005. Microbiological and Physico-
Chemical Properties of Moroccan Honey. Int. J. of Agri. And Biol., 773-776.
Mato, I; Huidobro, J F; Simal-Lozano, J; Sancho, M. T. 2003. Significance of no- aromatic
organic acids in honey. Journal of Food Protection., 66 (12): 2371-2376.
105
Mazzatto, Mary Y, 1994. Nutrition and wound healing J. Amr Pedictric Med Assoc., 84:456-
462.
Mogessie A. 1994;The in vitro Antibacterial activity of ‘Tazma mar’ honey produced by sting
less bee. Ethiopian Journal of Health Development., 8(1):109-117.
Molan, P.C. 1992. The antibacterial activity of honey. 1. The nature of antibacterial activity. Bee
World., 73: 5-28.
Molan, P.C. 1992. The antibacterial activity of honey. 2. Variation in the potency of the
antibacterial activity. Bee World., 73:59-76.
Molan, P.C. 2001. Why honey is effective as a medicine. 1. Its use in modern medicine. In
“Honey and Healing,” ed. P. intl. bee research association, Cardiff, USA.
Molan, P.C. 2002. Selection of honey as a wound dressing. Waikato Honey Research Unit,
University of Waikato.
Morton JJ, Malone MH. 1972. Evaluation of vulnerary activity of by an open wound procedure in rats. Arch int pharmacodyn., 196: 117 – 126.
106
Mullai V. And Menon T, 2007. Bactericial activity of different types of honey against Clinical
and Environmental islolates of Pseudomonas aeruginosa. J. Alt and Comp. Medi.,
pp.439-441.
Mulu A. Tessema B. Derbie F, 2004. In vitro assessment of the antimirobial potential of honey
on common human pahtgens. Ehtiop.J.Health Dev., 18(2):107-111.
Nasiruddin Khan., M. Qaiser, S. M. Raza and M. Rehman. 2006. Physicochemical properties
and pollen spectrum of imported and local samples of blossom honey from the Pakistani
market. Int. J. of Food Sci. Tech., 41: 775-781.
Ninikoshi J, Kivisaari J, Viljanto J. 1977. Local hyperalimention of experimental granulation
tissure. Acti chir scand., 143:201.
Nzeako and Hamdi, 2000. Antimicrobial potential of honey. Medical Science.,2: 75-79.
Oka H, lhai Y, Kawamura N, Una K, Yamada M, Harda, Suzuki M. 1987. Improvement of
chemical analysis of antibiotics: simultaneous analysis of seven tetracyclines in honey. J
Chromatogr., 400, 253-61.
107
Patil PA, Kulkarni DR. 1984. Effect of anti-proliferation agents on the healing dead space
wound in rats. Indian Drugs., 79: 445 – 447.
Perez, C; Conchello, P; Arino, A; Yanguela, J; Herrera, A, 1989. Dosage des acides amines des
proteins de different miels espagnols. Sciences des Aliments., 9: 203-207.
Perez, R A; Iglesias, M T; Pueyo, E; Gonzales, M; Delorenzo, C, 2007. Amino acid composition
and antioxidant capacity of Spanish honeys. J. of agricultural and food chemistry., 55
(2): 360-365.
Persano Oddo, L; Baldi, E; Accorti, M, 1990. Diastatic activity in some unifloral honeys. Apidologie., 21 (1): 17-24.
Persano Oddo, L; Piazza, MG; Pulcini, P. 1999. Invertase activity in honey. Apidologie., 30 (1):
57-65.
Piazza, M.G., M. Accorti and L. Persano Oddo. 1991. Electrical conductivity, ash, color and
specific rotatory power in Italian unifloral honeys. Apicoltura., 7: 51-63.
108
Pisani, A., G. Protano, and F. Riccobono. 2008. Minor and trace elements in different honey
types produced in Siena Country (Italy). Food Chemistry., 107:1553-1560.
Qiu, P. Y., H. B. Ding, Y. K. Tang and R. J. Xu. 1999. Determination of chemical composition
of commercial honey by near infrared spectroscopy. J. of Agri. Food Chem., 47: 2760-
2765.
Radwan S, El-Essawy A, Sarhan MM. Experimental evidence for the occurrence in honey of
specific substances active against microorganisms. Zentral Mikrobiol .,1984,139, 249-55.
Rahmanian M, Khouhestani A, Ghavifekr H, Ter-Sarkiswsian N, lonoso G, Marzys AO. 1970.
High ascorbic acid content in some Iranian honeys: chemical and biological assays. J
Nutr Metab., 12, 131-5.
Ransome H.M. (1986). The sacred bee in ancient times and folkler, Burrowbridge Somerset,
England., 308 p.
Reynold E.F. (1989). Martindale – the Extract Pharmacopoeia. London, p. 1266.
Riethop M. L., M. H. Subers, and Kushnir, (1962). Composition of American honeys. 124 p.
U.S. Department of Agriculture Technical Bulletin., 1261.
109
Rotaim, F.H. 1976. Colour and Chemical Composition of Honeys from Known Floral sources.
Ph. D. Thesis. UNSW.
Rudnay J. (1987). A book of honey: it’s history and use, Budapest, Corvina, 114 p.
Sabatini, A.G., G.L. Marcazzan, R. Colombo and P. Arculeo. 1995. Loquat honey produced in
Sicily. Apicoltura., 10: 59-69.
Saif-ur-Rehman, Zia Farooq Khan, and Tahir Maqbool. 2008. Physical and spectroscopic
characterization of Pakistani honey. Cien. Inv. Agr., 35, (2): 199-204.
Salah, W., N.J. Miller, G. Pagauaga, P. Tijburg, G.P. Bowell and E.C.E. Rice. 1995.
Polyphenolic flavonals as scavenger of aqueous phase radicals as chain-breaking
antioxidants. Arch Biochem., 2:239-3460.
Sancho, M.T., S. Muniategui, M.P. Sanchez, J.F. Huidobro and J. Simal. 1991. Relationships
between electrical conductivity and total and sulphated ash contents in Basque honeys.
Apidologie., 22: 487-94.
110
Sanz, M.L., J. Sanz and C.l. Martinez. 2004. Presence of some cyclitols in honey. Food Chem.,
84: 133-135.
Schauss, A.G. 1996. Minerals, trace elements and in human health. Life sciences press,
Tacoma, (WA).
Schmidt, J.O., (1996). Bee Products: Chemical Composition and Application. In: Published as a
Chapter in Bee Products, Mizrahi, A. and Y. Lensky (Eds.) Plenum Press, New York,
pp:25-26.
Serra, B.J. and C.F. Ventura. 1995. Characterization of citrus honey (Citrus spp.) produced in
Spain. J. of Agri. and Food Chem., 43: 2053-2057.
Serrano, S., M. Villarejo, R. Espejo and M. Jodral. 2004. Chemical and physical parameters of
Andalusian honey: classification of Citrus and Eucalyptus honeys by discriminant
analysis. Food chem., 87: 619-623.
Sevlimli, H; Bayulgen, N; Varinioglu (1992). Determination of trace elements in honey by
INAA in Turkey. J.Radioanal. Nucl. Chem., Letters., 165 (56): 319-325.
111
Shambaugh, P., V. Worthington and J.H. Herbert. 1990. Differential effects of honey, sucrose
and fructose on blood sugar levels. J. Manipulative and Physiol.,13 (6):322-325.
Sheikh Dilnawaz, Shams-uz-Zaman, M. Rafi and Ghulam Ali, 1995. Studies on the
antimicrobial activity of honey. Pak. J. Phar. Sc., P.51-62.
Siddiqui, I R (1970). The sugars of honey. Advances in Carbohydrate Chemistry and
Biochemistry., 25: 285-309.
Singh, N. and P.K. Bath. 1997. Quality evaluation of different types of Indian honey. Food
Chem., 58: 129-133.
Sommeijer M.J., Beetsma J., Boot WJ., Roberts E.J ., de vries R, 1995. Persective for honey
production in the Tropics, Proc. Symp. organized by the Natherland Expertise centre for
Tropical Agriculture Research (nectar), Natherlands, Dec.18.
Speer, K. and A. Montage. 1987. Decomposition products of phenylalanine as aroma
components of honey. Deut. Leb. Rund., 83: 103-107.
112
Subrahmanyam M. 1991. Topical application of honey in treatment of burns. Br J Surg., 78,497-
8.
Subrahmanyam M, 1998. A prospective randomized clinical and histological study of superficial
burn wound healing with honey and silver sulfadiazine. Burns., 24: 157-161.
Subramanian, R; Hebbar, H U; Rastogi, N K, 2007. Processing of honey: A review. International
J. of food properties., 10 (1): 127-143.
Suguna,. Chandrakasan G, Ramamoorthy U, Joseph KT, 1993. Influence of honey on
biochemical and biophysical parameters of wounds in rats. Clin Biochem Nutr., 14:91-
99.
Tabouret, T; Mathlouthi, M, 1972. Essai de pasteurization de miel. Rev. Apic., 299: 258-261.
Terrab, A., A.G. Gonzalez, M.J. Diez and J.H. Francisco. 2003. Characterization of Moroccan
unifloral honeys using multivariate analysis. Eu Food Res. Tech., 218: 88-95.
Thomason Carmel, (2007). Manchester Evening News, UK.
113
Thrasyvoulou, A, 1997. Heating times for Greek honeys. Melissokomiki Epitheorisi., 11 (2)
79-80.
Toporak, J., Legath, J. & Kulkova, J. (1992). Levels of mercury in samples of bees and honey
from areas with and without industry contamination. Veterinary Medicine Czech., 37,
405-415.
Von der ohe, W; Dustmann, J H; Von der ohe, K, 1991. Prokin als Kriterium der Reife des
Honigs. Deutsche Lebensmittel- Rundschau., 87 (12): 383-386.
Vorwohi, G. 1964. Die Beziehung Zwischen der elektrischen Leitfahigkeit der Honige und ihrer
trachtmassigen Herkunft. In: Ann. De Abeille.,7: 301-309.
White, J.W., M.L. Riethof, M.H. Subers and I. Kushnir. 1962. Composition of American
Honeys. Tech. Bull. U.S Dept. Agri. No., 1261: 124pp.
White, J.W. and J.C. Underwood. 1974. Maple syrup and honey. In Symposium Sweeteners
GEAVI publishing Co., Westpoint. USA.
114
White, J W, 1975. Composition of honey., In Crane, E(ed.) Honey A Comprehensive survey,
Heinemann Edition; London., pp 157-239.
White J. W. and L. W. Doner. 1980. Honey Composition and properties. Bee keeping in the
United States Agriculture Hand Book., No. 335.
Williams, E.T., J. Jeffrey, J. T. Barminas and I. Toma. 2009. Studies on the effects of the honey
of two floral types on organism associated with burn wound infections. Afri. J. of Pure
and App. Chem., Vol.3(5), pp. 098-101.
Willix DJ. Molan PC. Harfoot CG. 1992. A comparison of the sensitivity of wound infecting
species of bacteria to the antibacterial activity of manuka honey and other honey. J Appl
Bacteriol., 73, 388-94.
Winkler O, 1955. Beitrage zum Nachweis und zur Bestimmung von Oxymethylfurfural in
Honig und Kunsthonig. Z.Lebensm. Forsch., 102,160-167.
Zumla, A. and A. Lulat. 1989. Honey -a remedy rediscovered. J. R. Soc. Med., 83:384-3.
Copyright © 2022 FDOKUMEN