
Pharmaceutical Experimental Design and Interpretation
32
-
Upload
khangminh22 -
Category
Documents
-
view
4 -
download
0
Transcript of Pharmaceutical Experimental Design and Interpretation


PHARMACEUTICAL EXPERIMENTAL DESIGN AND INTERPRETATION
Second Edition

TF1589_C000.fm Page ii Monday, December 5, 2005 8:37 PM
PHARMACEUTICAL EXPERIMENTAL DESIGN AND INTERPRETATION
Second Edition
N. Anthony ArmstrongUniversity of Cardiff
UK
Published in 2006 byCRC PressTaylor & Francis Group 6000 Broken Sound Parkway NW, Suite 300Boca Raton, FL 33487-2742
© 2006 by Taylor & Francis Group, LLCCRC Press is an imprint of Taylor & Francis Group
No claim to original U.S. Government worksPrinted in the United States of America on acid-free paper10 9 8 7 6 5 4 3 2 1
International Standard Book Number-10: 0-415-29901-2 (Hardcover) International Standard Book Number-13: 978-0-415-29901-5 (Hardcover) Library of Congress Card Number 2005024462
This book contains information obtained from authentic and highly regarded sources. Reprinted material isquoted with permission, and sources are indicated. A wide variety of references are listed. Reasonable effortshave been made to publish reliable data and information, but the author and the publisher cannot assumeresponsibility for the validity of all materials or for the consequences of their use.
No part of this book may be reprinted, reproduced, transmitted, or utilized in any form by any electronic,mechanical, or other means, now known or hereafter invented, including photocopying, microfilming, andrecording, or in any information storage or retrieval system, without written permission from the publishers.
For permission to photocopy or use material electronically from this work, please access www.copyright.com(http://www.copyright.com/) or contact the Copyright Clearance Center, Inc. (CCC) 222 Rosewood Drive,Danvers, MA 01923, 978-750-8400. CCC is a not-for-profit organization that provides licenses and registrationfor a variety of users. For organizations that have been granted a photocopy license by the CCC, a separatesystem of payment has been arranged.
Trademark Notice: Product or corporate names may be trademarks or registered trademarks, and are used onlyfor identification and explanation without intent to infringe.
Library of Congress Cataloging-in-Publication Data
Armstrong, N. A. (N. Anthony)Pharmaceutical experimental design and interpretation / N. Anthony Armstrong. -- 2nd ed.
p. ; cm.Includes bibliographical references and index.ISBN-10: 0-415-29901-2 (Hardcover : alk. paper)ISBN-13: 978-0-415-29901-5 (Hardcover : alk. paper)1. Drugs--Research--Methodology. 2. Experimental design. I. Title.[DNLM: 1. Drug Design. 2. Data Interpretation, Statistical. 3. Re-search Design. QV 744 A737p 2006]
RM301.25.A76 2006615'.19'072--dc22 2005024462
Visit the Taylor & Francis Web site at http://www.taylorandfrancis.com
and the CRC Press Web site at http://www.crcpress.com
Taylor & Francis Group is the Academic Division of T&F Informa plc.
TF1589_Discl.fm Page 1 Wednesday, August 31, 2005 2:50 PM

Author
Norman Anthony Armstrong graduated B.Pharm. and Ph.D. from LondonUniversity. After some years in the pharmaceutical industry, Dr. Armstrong joinedthe Welsh School of Pharmacy, Cardiff University, U.K., where he became seniorlecturer in pharmaceutical technology. He retired from that position in 2002.
Dr. Armstrong is a fellow of the Royal Pharmaceutical Society of Great Britainand is the author of over 150 scientific papers, reviews, and books.
TF1589_C000.fm Page v Monday, December 5, 2005 8:37 PM

TF1589_C000.fm Page vi Monday, December 5, 2005 8:37 PM

Table of Contents
Chapter 1 Introduction to Experimental Design
1.1 The Experimental Process ................................................................................ 1 1.2 Computers and Experimental Design............................................................... 2 1.3 Overview of Experimental Design and Interpretation ..................................... 4
Chapter 2 Comparison of Mean Values
2.1 Introduction....................................................................................................... 9 2.2 Comparison of Means when the Variance of the Whole
Population is Known....................................................................................... 10 2.3 Comparison of Two Means when the Variance of the Whole
Population is Not Known ............................................................................... 12 2.3.1 Treatment of Outlying Data Points .................................................... 15
2.4 Comparison of Means between More Than Two Groups of Data............................................................................................................. 18 2.4.1 Analysis of Variance (ANOVA) ......................................................... 192.4.2 The Least Significant Difference........................................................ 21 2.4.3 Two-Way Analysis of Variance .......................................................... 22
Chapter 3 Nonparametric Methods
3.1 Introduction..................................................................................................... 25 3.2 Nonparametric Tests for Paired Data ............................................................. 25
3.2.1 The Sign Test ...................................................................................... 25 3.2.2 The Wilcoxon Signed Rank Test ........................................................ 27
3.3 Nonparametric Tests for Unpaired Data ........................................................ 29 3.3.1 The Wilcoxon Two-Sample Test ........................................................ 29
Chapter 4 Regression and Correlation
4.1 Introduction..................................................................................................... 33 4.2 Linear Regression ........................................................................................... 33
4.2.1 The Number of Degrees of Freedom (Cell B11 in Table 4.4) .......... 37 4.2.2 The Coefficient of Determination (r2) (Cell A10
in Table 4.4) ........................................................................................ 384.2.3 The Standard Errors of the Coefficients (Cells A9
and B9 in Table 4.4) ........................................................................... 40 4.2.4 The F Value or Variance Ratio (Cell A11 in Table 4.4) ................... 40 4.2.5 The Two Regression Lines ................................................................. 41
TF1589_C000.fm Page vii Monday, December 5, 2005 8:37 PM
viii Table of Contents
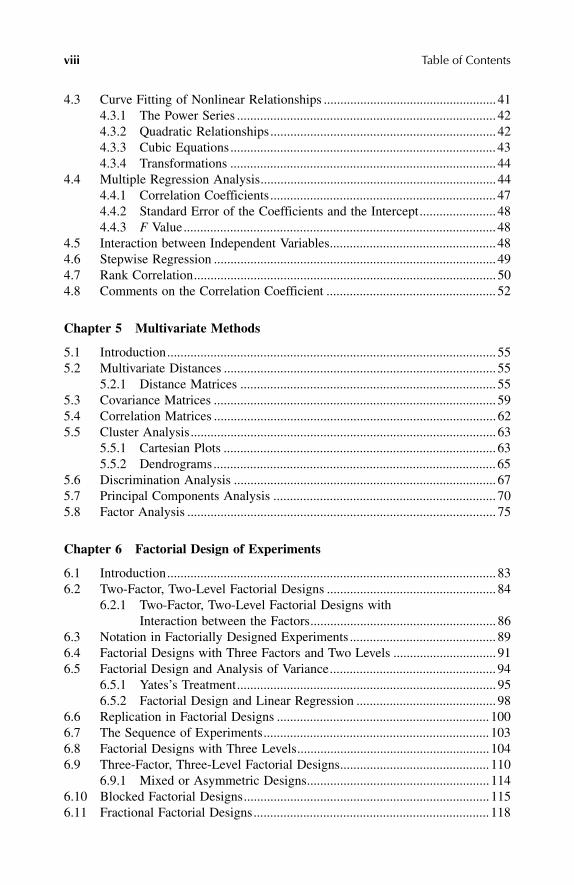
4.3 Curve Fitting of Nonlinear Relationships .................................................... 41 4.3.1 The Power Series .............................................................................. 42 4.3.2 Quadratic Relationships.................................................................... 42 4.3.3 Cubic Equations................................................................................ 43 4.3.4 Transformations ................................................................................ 44
4.4 Multiple Regression Analysis....................................................................... 44 4.4.1 Correlation Coefficients.................................................................... 47 4.4.2 Standard Error of the Coefficients and the Intercept....................... 48 4.4.3 F Value.............................................................................................. 48
4.5 Interaction between Independent Variables.................................................. 48 4.6 Stepwise Regression ..................................................................................... 49 4.7 Rank Correlation........................................................................................... 50 4.8 Comments on the Correlation Coefficient ................................................... 52
Chapter 5 Multivariate Methods
5.1 Introduction................................................................................................... 55 5.2 Multivariate Distances .................................................................................. 55
5.2.1 Distance Matrices ............................................................................. 55 5.3 Covariance Matrices ..................................................................................... 59 5.4 Correlation Matrices ..................................................................................... 62 5.5 Cluster Analysis............................................................................................ 63
5.5.1 Cartesian Plots .................................................................................. 63 5.5.2 Dendrograms..................................................................................... 65
5.6 Discrimination Analysis ............................................................................... 67 5.7 Principal Components Analysis ................................................................... 70 5.8 Factor Analysis ............................................................................................. 75
Chapter 6 Factorial Design of Experiments
6.1 Introduction................................................................................................... 83 6.2 Two-Factor, Two-Level Factorial Designs ................................................... 84
6.2.1 Two-Factor, Two-Level Factorial Designs with Interaction between the Factors........................................................ 86
6.3 Notation in Factorially Designed Experiments ............................................ 89 6.4 Factorial Designs with Three Factors and Two Levels ............................... 91 6.5 Factorial Design and Analysis of Variance.................................................. 94
6.5.1 Yates’s Treatment.............................................................................. 95 6.5.2 Factorial Design and Linear Regression .......................................... 98
6.6 Replication in Factorial Designs ................................................................ 100 6.7 The Sequence of Experiments.................................................................... 103 6.8 Factorial Designs with Three Levels.......................................................... 104 6.9 Three-Factor, Three-Level Factorial Designs............................................. 110
6.9.1 Mixed or Asymmetric Designs....................................................... 114 6.10 Blocked Factorial Designs.......................................................................... 115 6.11 Fractional Factorial Designs....................................................................... 118
TF1589_C000.fm Page viii Monday, December 5, 2005 8:37 PM
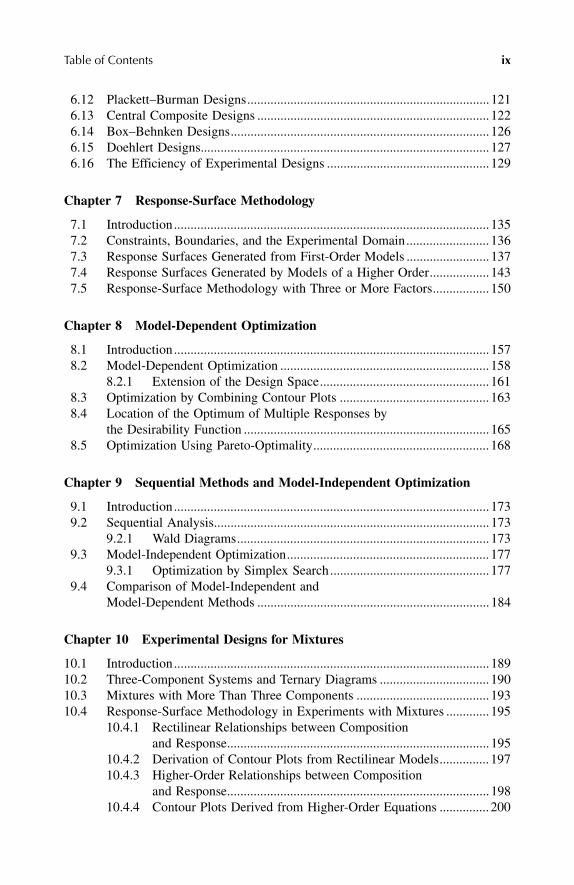
Table of Contents ix
6.12 Plackett–Burman Designs......................................................................... 1216.13 Central Composite Designs ...................................................................... 122 6.14 Box–Behnken Designs.............................................................................. 126 6.15 Doehlert Designs....................................................................................... 127 6.16 The Efficiency of Experimental Designs ................................................. 129
Chapter 7 Response-Surface Methodology
7.1 Introduction............................................................................................... 135 7.2 Constraints, Boundaries, and the Experimental Domain......................... 136 7.3 Response Surfaces Generated from First-Order Models ......................... 137 7.4 Response Surfaces Generated by Models of a Higher Order.................. 143 7.5 Response-Surface Methodology with Three or More Factors................. 150
Chapter 8 Model-Dependent Optimization
8.1 Introduction............................................................................................... 157 8.2 Model-Dependent Optimization ............................................................... 158
8.2.1 Extension of the Design Space................................................... 161 8.3 Optimization by Combining Contour Plots ............................................. 163 8.4 Location of the Optimum of Multiple Responses by
the Desirability Function .......................................................................... 165 8.5 Optimization Using Pareto-Optimality..................................................... 168
Chapter 9 Sequential Methods and Model-Independent Optimization
9.1 Introduction............................................................................................... 173 9.2 Sequential Analysis................................................................................... 173
9.2.1 Wald Diagrams............................................................................ 173 9.3 Model-Independent Optimization............................................................. 177
9.3.1 Optimization by Simplex Search................................................ 177 9.4 Comparison of Model-Independent and
Model-Dependent Methods ...................................................................... 184
Chapter 10 Experimental Designs for Mixtures
10.1 Introduction............................................................................................... 189 10.2 Three-Component Systems and Ternary Diagrams ................................. 190 10.3 Mixtures with More Than Three Components ........................................ 193 10.4 Response-Surface Methodology in Experiments with Mixtures ............. 195
10.4.1 Rectilinear Relationships between Composition and Response............................................................................... 195
10.4.2 Derivation of Contour Plots from Rectilinear Models............... 197 10.4.3 Higher-Order Relationships between Composition
and Response............................................................................... 198 10.4.4 Contour Plots Derived from Higher-Order Equations ............... 200
TF1589_C000.fm Page ix Monday, December 5, 2005 8:37 PM
x Table of Contents
10.5 The Optimization of Mixtures................................................................... 202 10.6 Pareto-Optimality and Mixtures ................................................................ 203 10.7 Process Variables in Mixture Experiments ............................................... 205
Chapter 11 Artificial Neural Networks and Experimental Design
11.1 Introduction................................................................................................ 209 11.1.1 Pharmaceutical Applications of ANNs ...................................... 212
Appendix 1 Statistical Tables
A1.1 The Cumulative Normal Distribution (Gaussian Distribution)................. 219 A1.2 Student’s t Distribution.............................................................................. 219 A1.3 Analysis of Variance.................................................................................. 221
Appendix 2 Matrices
A2.1 Introduction................................................................................................ 223 A2.2 Addition and Subtraction of Matrices....................................................... 225 A2.3 Multiplication of Matrices ......................................................................... 226
A2.3.1 Multiplying a Matrix by a Constant ........................................... 226 A2.3.2 Multiplication of One Matrix by Another.................................. 226 A2.3.3 Multiplication by a Unit Matrix ................................................. 227 A2.3.4 Multiplication by a Null Matrix ................................................. 228 A2.3.5 Transposition of Matrices ........................................................... 228 A2.3.6 Inversion of Matrices .................................................................. 229
A2.4 Determinants .............................................................................................. 229
Index...................................................................................................................... 233
TF1589_C000.fm Page x Monday, December 5, 2005 8:37 PM

Dedication
for Kenneth Charles James, 1926–1997
The first two editions of this book were written in collaboration with Dr. KennethCharles James, reader in pharmaceutics at the Welsh School of Pharmacy, CardiffUniversity. Sadly, just as the second edition was being completed, Ken’s healthdeteriorated and he died shortly after its publication.
This edition is therefore dedicated to the memory of Ken James, mentor,colleague, and friend.
TF1589_C000.fm Page xi Monday, December 5, 2005 8:37 PM

TF1589_C000.fm Page xii Monday, December 5, 2005 8:37 PM
1
1 Introduction to Experimental Design
1.1 THE EXPERIMENTAL PROCESS
Experimentation is expensive in terms of time, work force, and resources. It istherefore reasonable to ask whether experimentation can be made more efficient,thereby reducing expenditure of time and money.
Scientific principles of experimental design have been available for some time now.Much of the work originated with Sir Ronald Fisher and Professor Frank Yates, whoworked together at Rothamsted Agricultural Research, U.K.1 The principles that theyand others devised have found application in many areas, but it is surprising how littlethese principles have been used in pharmaceutical systems. The reasons for this neglectare a matter of speculation, but there is no doubt that principles of experimental designdo have a widespread applicability to the solution of pharmaceutical problems.
Experimentation may be defined as the investigation of a defined area witha firm objective, using appropriate tools and drawing conclusions that are justifiedby the experimental data so obtained. Most experiments consist of measuring theeffect that one or more factors have on the outcome of the experiment. The factorsare the independent variables, and the outcome is the response or dependentvariable.
The overall experimental process may be divided into the following stages:
1. Statement of the problem. What is the experiment supposed to achieve?What is its objective?
2. Choice of factors to be investigated, and the levels of those factors thatare to be used.
3. Selection of a suitable response. This may be defined in Stage 1, statementof the problem. If so, then we must be sure that the measurement of thechosen response contributes to achieving the objective. The proposedmethods of measuring the response and their accuracy must also beconsidered at this stage.
4. Choice of the experimental design. This is often a balance between costand statistical validity. The more an experiment is replicated, the greaterthe reliability of the results. However, replication increases cost, and theexperimenter must therefore consider what is an acceptable degree ofuncertainty. This in turn is governed by the number of replicates that canbe afforded. Inextricably linked with this stage is selection of the methodto be used to analyze data.
TF1589_C001.fm Page 1 Monday, December 5, 2005 8:43 PM

2 Pharmaceutical Experimental Design and Interpretation
5. Performance of the experiment: the data collection process. 6. Data analysis. 7. Drawing conclusions.
The steps in the process may be illustrated using a simple example that is developedfurther in Chapter 4. Gebre-Mariam et al.2 investigated the relationship between thecomposition of mixtures of glycerol and water and the viscosity of those mixtures,as part of a study of diffusion through gels.
Thus, the objective (Stage 1) was to establish the dependence of the viscosityof glycerol–water mixtures on their composition. The factor to be investigated(Stage 2) was composition of the mixture up to a maximum of about 40% w/wglycerol. The response (Stage 3) was the viscosity of the liquids, measured by anappropriately accurate method, in this case a U-tube viscometer. Because onlyone factor was to be investigated, any other factor that might influence the responsehad to be eliminated or kept constant. Temperature was an obvious example inthis case.
At the outset, it was not known whether the relationship would be rectilinearor curvilinear. Furthermore, results were to be fitted to a model equation, andfor both these reasons, an adequate number of data points had to be obtained.Five concentrations of glycerol were selected, covering the desired range (Stage 4).This was expected to be the minimum number that would enable a valid regressionanalysis to be performed. Many data points could have been used, therebyimproving the reliability of any relationship, but of course this would haveinvolved additional work.
The experiments were then carried out (Stage 5), the data was subjected toregression analysis (Stage 6), and the relationship between composition and viscositywas established (Stage 7).
Thus, the experimental design and the method to be used to analyze the dataare selected before the experiment is carried out. Conclusions that can be drawnfrom the data depend, to a large extent, on the manner in which the data werecollected. Oftentimes, the objective of the experiment is imperfectly defined, theexperiment is then carried out, and only after these are methods of data analysisconsidered. It is then discovered that the experimental design is deficient and hasprovided insufficient or inappropriate data for the most effective form of analysisto be carried out. Thus, the term experimental design must include not only theproposed experimental methodology, but also the methods whereby the data fromthe experiments is to be analyzed. The importance of considering both parts of thisdefinition together cannot be overemphasized.
1.2 COMPUTERS AND EXPERIMENTAL DESIGN
A point that must be considered at this stage is the availability of computing facilitiessuch as mainframes, personal computers (PCs), and even a pocket calculator. Theadvantages of the computer are obvious. The chore of repetitive calculation has beenremoved as well as an undeniable disincentive to use statistical methods. However,
TF1589_C001.fm Page 2 Monday, December 5, 2005 8:43 PM

Introduction to Experimental Design 3
using a computer can cause two related problems. The first is absolute reliance onthe computer — if the computer says so, it must be so. The second is the assumptionthat the computer can take unreliable data or data from a badly designed experimentand somehow transform them into a result which can be relied upon. The computerjargon GIGO — garbage in, garbage out — is just as appropriate to problems ofexperimental design as to other areas in which computers are used.
It is undeniable that access to a computer is invaluable. Many readers will haveaccess to a mainframe computer equipped with comprehensive statistical packagesincluding SPSS® (McGraw-Hill, New York, NY, USA), SAS® (SAS Institute, Cary,NC, USA), and MINITAB® (Minitab, State College, PA, USA). Bohidar3 has describedthe application of SAS to problems of pharmaceutical formulation.
MINITAB contains many features that are relevant to experimental design. Inaddition to useful statistical techniques, it includes programs for determinant analysisand principal component analysis (Chapter 5). The commands FFDESIGN andPBDESIGN generate fractional factorial designs and Plackett–Burman designsrespectively for a specified number of experimental factors (Chapter 6). Random-ization of the order in which the experiments are to be performed can also be carriedout. The command FFACTORIAL analyzes data from experiments based on thesedesigns, and facilities for drawing contour plots from the data are also available(Chapters 7 and 8). Details are given in Ryan and Joiner.4
However, a desktop computer will suffice for many of the calculations describedin this book, because many statistical packages for PCs are now commercially available.Spreadsheet packages such as Lotus 1-2-3® (Lotus Development Corporation,Cambridge, MA, USA) and Excel® (Microsoft Corporation, Redmond, WA, USA)are of great value for these calculations.5 The latter is used extensively in this book.
Several software packages specifically intended for experimental design andoptimization purposes are also available. One example is the RS/Discover® suiteof programs from BBN Software Products Corporation (Cambridge, MA, USA).The menu-driven program in this package prompts the user to specify the independentvariables, together with their units, the ranges of values for the variables, and therequired degree of precision and to indicate whether the value of a given variablecan be easily altered. The program then produces a worksheet that gives the designof the experiment (full factorial, central composite, etc.) and the values of theindependent variables for each experiment. The experiments are usually given inrandom order, except in those cases where a particular experimental variable cannotbe easily altered in value. In such cases, the experiments are grouped so that thetime taken to alter that variable is minimized. After the experiments are carried out,the responses are added to the worksheet. Data can then be analyzed and fitted tomodels and contour plots, and response surfaces can be produced. Applications ofthis package have been reported by McGurk et al.6
The Design-Ease® and Design-Expert® packages offered by Stat-Ease(Minneapolis, MN, USA) provide facilities for the design and analysis of factorialexperiments. The programs generate worksheets of experiments in random order orin blocks for experiments involving process variables or mixtures and, from theresults, can produce a statistical analysis and three-dimensional response surfaceand contour graphs.
TF1589_C001.fm Page 3 Monday, December 5, 2005 8:43 PM
4 Pharmaceutical Experimental Design and Interpretation
Similar programs include ECHIP® (Expert on a Chip, Hockessin, DE, USA),which has been reviewed by Dobberstein et al.,7 CHEOPS® (Chemical Operationsby Simplex, Elsevier Scientific Software, Amsterdam, The Netherlands), StatgraphicsPlus® (Statgraphics, Rockville, MD, USA), and CODEX® (Chemometrical Optimi-sation and Design for Experimenters, AP Scientific Services, Stockholm, Sweden).
1.3 OVERVIEW OF EXPERIMENTAL DESIGN AND INTERPRETATION
This is not a textbook on statistics. However, some statistical knowledge is essentialif the full power of techniques in experimental design is to be appreciated. Neitheris this a compendium of methods of experimental design. Rather, it discusses methodsthat are of value in the design of experiments and in the interpretation of resultsobtained from them.
The literature in this area is considerable, and for readers wishing to developtheir knowledge of a particular technique, references to further reading are given atthe end of each chapter. Moreover, statistical textbooks and some general texts onexperimental design are given at the end of this chapter.
Many experiments consist in acquiring groups of data points, each group havingbeen subjected to a different treatment, and methods for evaluating data from suchexperiments are included in Chapter 2. Essentially, these methods are based onestablishing whether the mean values of the various groups differ significantly. Whenthere are only two groups of data, Student’s t-test is usually applied, but for threeor more groups, analysis of variance is the method of choice. The latter also formsthe basis of many of the methods of experimental design described in later chapters.
For Student’s t-test and analysis of variance to be applicable, the data should,strictly speaking, be normally distributed about the mean and must have truenumerical values. Such tests cannot be applied to adjectival information or whendata have been assigned to numbered but arbitrarily designated categories. In suchcases, nonparametric methods come into their own. These methods do not dependfor their validity on a normal or Gaussian distribution, and “adjectival” data canbe assessed using them. However, such methods depend on the presence of anadequate number of data points to facilitate comparison, and hence the degree ofreplication in the experiment must be appropriate if such methods are to be used.Nonparametric methods involve either paired data, where each subject acts as itsown control, or unpaired data. Both are discussed in Chapter 3.
Having obtained raw data from the experiment, one has to decide on how bestto use them. The decision may be simple; for example, all that is required is a meanvalue and standard deviation or the plot of one value against another, which givesa perfect straight line. Usually, more is required, in which case the statistical methodthat is most appropriate to the problem must be chosen.
An obvious example involves a series of pairs of results where it is required toknow whether they are related, and if so how. A simple example could be the variationof the weights of a collection of laboratory animals with their heights. A plot ofheight (h) against weight (w) drawn on a graph paper may not give a definite answer,
TF1589_C001.fm Page 4 Monday, December 5, 2005 8:43 PM

Introduction to Experimental Design 5
because the points could be such that it is not clear whether or not the results arescattered around a straight line. The probability that the results are so related is givenby regression analysis, together with the value of the line in predicting unknownresults. Alternatively, the relationship may be curved but fits a quadratic equation.
If the results are not related, a third property, for example, age (A), may makean important contribution. It is not possible to plot a graph in this situation, althoughone could construct a three-dimensional model.
It is not possible to visually represent equations with more than three variables,but such higher relationships can be expressed by an equation. Thus, for example, ifthe variation of animals’ weights (w) with height, age (A), and waist circumference (c)is examined, a relationship of the form shown in (1.1) can be devised:
w = b0 + b1h + b2A + b3c (1.1)
in which b0, b1, b2, and b3 are constants and can be derived by regression analysis.A minimum of four sets of data (because there are four variables) would be requiredto derive such an equation, and a perfect relationship would result. For a reliablerelationship, a minimum of five sets of data for each unknown, giving a minimumof 20 sets of results, are necessary.
Other relationships can be detected, either by trial and error or by suspected rela-tionships, derived theoretically or found for similar systems in the literature; for example,logarithmic (1.2), ternary (1.3), or square root (1.4). Some examples are given in thebook, and methods for calculating them and evaluating their reliability are described.
y = b0+ b1log x (1.2)
y = b0+ b1+ b2x2 + b3x3 (1.3)
y = b0 + b1x1/2 (1.4)
Regression analysis looks for relationships between a dependent variable and oneor more independent variables. This method of analysis is called a univariate method.Multivariate methods look for relationships between several variables, consideringthem collectively. These data are often presented in the form of a matrix, an exampleof which follows:
(1.5)
Each column represents a property of the materials under examination. For example,1 could represent tablet weight, 2 disintegration time, 3 crushing strength, and4 moisture content. Each row represents a combination of the properties of oneexample, in this case the properties of a different tablet formulation. To work
a a a a
b b b b
c c c c
d d d d
1 2 3 4
1 2 3 4
1 2 3 4
1 2 3 4
TF1589_C001.fm Page 5 Monday, December 5, 2005 8:43 PM

6 Pharmaceutical Experimental Design and Interpretation
with these, one must have a knowledge of matrices and their manipulation, whichdiffers from basic algebraic methods. The basic matrix algebra necessary to under-stand this section is given in Appendix 2, followed by examples of their use.
When a series of results is presented, the individual results can frequently bearranged into unrelated groups, within which the results are related. This is calledcluster analysis. Alternatively, the validity of preconceived classifications can beexamined by discrimination analysis.
Relationships within sets of results can often be detected and used to simplifydata. Thus, the number of rows shown in (1.5) could possibly be reduced to threeor even less by principal components analysis and the columns reduced in a similarmanner by factor analysis. Cluster, discrimination, principal components, and factoranalysis are all described in Chapter 5.
Experimental programs can, if not efficiently designed, consume much time,materials, and labor, and hence, it is essential that programs be designed in the mostcost-effective manner. In Chapter 6, the principles of factorial design are discussed.Factorial design, when allied to statistical techniques such as analysis of variance,is a powerful tool for gaining the maximum amount of information from a limitednumber of experiments.
Factorial design involves the variation of two or more experimental variablesor factors in a planned manner, and the factors are investigated at two or more levels.The technique establishes the relative order of importance of the factors and canalso indicate whether factors interact and whether such interactions are significant.
Even so, full factorial designs involving several factors at three or even morelevels can demand considerable resources. Therefore, methods by which the numberof experiments can be reduced in factorial designs are also explored. The potentialhazards of using such limited designs are also discussed.
Having determined which factors and interactions make a significant contribu-tion to the response, one can use the same experiments to predict the response forcombinations of factors that have not been studied experimentally. The predictionis carried out by deriving a mathematical model relating the factors to the response.The construction of the model equation and establishing its validity draw heavilyon correlation and regression techniques described in Chapter 4.
Once the model is established, it can be used to construct contour plots. Theseplots are diagrams of the value of the response in terms of the values of theexperimental variables. The model can also be used to derive the response surface.This is usually a three-dimensional diagram, with the response plotted on the verticalaxis and two factors forming the horizontal axes. Such diagrams are invaluable invisualizing relationships between independent and dependent variables and also inassessing the robustness of the response. Both are described in Chapter 7.
Many pharmaceutical formulations and processes lend themselves to optimizationprocedures, whereby the best possible result is sought, given a series of limits orconstraints. Thus, the best possible solution is not necessarily a maximum (or minimum)value, but is rather a compromise, taking many factors into account. There are twoprincipal methods of optimization. One is model-dependent optimization, in whicha group of experiments is carried out and the results are then fitted to an equation(the model). Such techniques are discussed in Chapter 8.
TF1589_C001.fm Page 6 Monday, December 5, 2005 8:43 PM

Introduction to Experimental Design 7
Model-dependent methods require that a series of experiments should be carriedout and the results assessed only when the whole series has been completed. Methodsby which the results of only a few experiments govern the conditions of furtherexperiments are sequential or model independent, and the results are examinedcontinuously as they become available. No attempt is made to express results ina model equation. Such methods are described in Chapter 9, which also includesa comparison between model-dependent and model-independent techniques.
Many pharmaceutical formulations involve mixtures of several ingredients, thetotal mass or volume of which is fixed. The composition of a fixed-volume injectionor the contents of a hard-shell capsule are good examples. Here, if the proportionof one ingredient is changed, then the proportion of at least one of the others mustalso change. Such mixtures are amenable to the principles of experimental design,the applications of which are described in Chapter 10.
In the final chapter, the use of artificial neural networks in pharmaceutical exper-imental design is considered (Chapter 11). Artificial neural networks are machinesthat learn from experience, in a similar manner to the brain. Their underlying functionis to identify patterns, that is, to recognize the relationship between input data and thecorresponding response. These relationships are then applied in a predictive manner.
Each chapter is illustrated by a number of worked examples. Their selection hassometimes caused problems. Inevitably the author has tended to select exampleswhich he has found of value, and which are therefore in fields in which he ispersonally interested. However he accepts that there are many other areas ofpharmaceutical science that could have been explored. Therefore, many of the chaptersend with a bibliography that indicates those areas where a particular technique hasbeen used, and the reader is referred to the original articles.
The appendices of the book contain material to which reference may be required,but which would be intrusive if it was contained in the main body itself. Tabulatedstatistical data (e.g., values of Student’s t-test, F-test, and correlation coefficients atgiven significance levels) has been reduced to a minimum and only includes materialthat is needed in the worked examples used in the book. Complete tables are readilyavailable elsewhere.
USEFUL STATISTICAL TEXTS
Bolton, S. and Bon, C., Pharmaceutical Statistics: Practical and Clinical Applications, 4thed., Marcel Dekker, New York, 2004.
Clarke, G. M. and Cooke, D. A., A Basic Course in Statistics, 4th ed., Arnold, London, 1998. Jones, D. S., Pharmaceutical Statistics, Pharmaceutical Press, London, 2002.
USEFUL GENERAL TEXTS ON EXPERIMENTAL DESIGN
Anderson, V. L. and McLean, R. A., Design of Experiments: A Realistic Approach, MarcelDekker, New York, 1974.
Box, G. E. P., Hunter, W. G., and Hunter, J. S., Statistics for Experimenters: Introduction toDesign, Data Analysis and Model Building, Wiley, New York, 1978.
Cornell, J. A., Experiments with Mixtures, 3rd ed., Wiley, New York, 2002. Fisher, R. A. and Yates, F., The Design of Experiments, 8th ed., Oliver & Boyd, Edinburgh, 1966.
TF1589_C001.fm Page 7 Monday, December 5, 2005 8:43 PM
8 Pharmaceutical Experimental Design and Interpretation
Hicks, C. R. and Turner, K. V., Fundamental Concepts in the Design of Experiments, 5thed., Oxford University Press, Oxford, 1999.
Montgomery, D. C., Design and Analysis of Experiments, 5th ed., Wiley, New York, 2001. Strange, R. S., Introduction to experiment design for chemists, J. Chem. Educ., 67, 113, 1990.
REFERENCES
1. Fisher, R. A., The Design of Experiments, Oliver & Boyd, London, 1926. 2. Gebre-Mariam, T. et al., The use of electron spin resonance to measure microviscosity,
J. Pharm. Pharmacol., 43, 510, 1991. 3. Bohidar, N. R., Pharmaceutical formulation optimization using SAS, Drug Dev. Ind.
Pharm., 17, 421, 1991. 4. Ryan, B. F. and Joiner, B. L., Minitab Handbook, 4th ed., Duxbury Press, Pacific
Grove, 2001. 5. Dranchuk, J., Excel for Windows Spreadsheet Databases, Wiley, New York, 1994. 6. McGurk, J. G., Storey, R., and Lendrem, D. W., Computer-aided process optimisation,
J. Pharm. Pharmacol., 41, 128P, 1989. 7. Dobberstein, R. H. et al., Computer-assisted experimental design in pharmaceutical
formulation, Pharm. Technol., 3, 84, 1994.
TF1589_C001.fm Page 8 Monday, December 5, 2005 8:43 PM

References
1 Introduction to Experimental Design
1. Fisher, R. A., The Design of Experiments, Oliver & Boyd,London, 1926.
2. Gebre-Mariam, T. et al., The use of electron spinresonance to measure microviscosity, J. Pharm. Pharmacol.,43, 510, 1991.
3. Bohidar, N. R., Pharmaceutical formulation optimizationusing SAS, Drug Dev. Ind. Pharm., 17, 421, 1991.
4. Ryan, B. F. and Joiner, B. L., Minitab Handbook, 4thed., Duxbury Press, Pacific Grove, 2001.
5. Dranchuk, J., Excel for Windows Spreadsheet Databases,Wiley, New York, 1994.
6. McGurk, J. G., Storey, R., and Lendrem, D. W.,Computer-aided process optimisation, J. Pharm. Pharmacol.,41, 128P, 1989.
7. Dobberstein, R. H. et al., Computer-assistedexperimental design in pharmaceutical formulation, Pharm.Technol., 3, 84, 1994.

4 Regression and Correlation
1. Clarke, G. M. and Cooke, D., A Basic Course inStatistics, 4th ed., Arnold, London, 1998.
2. Edwards, A. L., An Introduction to Linear Regression andCorrelation, 2nd ed., Freeman, San Francisco, 1984.
3. Gebre-Mariam, T. et al., The use of electron spinresonance to measure microviscosity, J. Pharm. Pharmacol.,43, 510, 1991.
4. Evans, B. K., James, K. C., and Luscombe, D. K.,Quantitative structure–activity relationships andcarminative activity, J. Pharm. Sci., 67, 277, 1978.
5. Wehrle, P. et al., Response surface methodology:interesting statistical tool for process optimisation andvalidation: example of wet granulation in a high shearmixer, Drug Dev. Ind. Pharm., 19, 1637, 1993.
6. Bohidar, N. R., Restaino, F. A., and Schwartz, J. B.,Selecting key pharmaceutical formulation factors byregression analysis. Drug Dev. Ind. Pharm., 5, 175, 1979.
7. Tattawasart, A. and Armstrong, N. A., The formation oflactose plugs for hard shell capsule fills, Pharm. Dev.Technol., 2, 335, 1997.

5 Multivariate Methods
1. Manly, B. F., Multivariate Statistical Methods – APrimer, 2nd ed., Chapman & Hall, London, 1994.
2. Lindberg, N.-O. and Lundstedt, T., Application ofmultivariate analysis in pharmaceutical development work,Drug Dev. Ind. Pharm., 21, 987, 1995.
3. James, K. C., Nicholls, P. J., and Richards, G. T.,Correlation of androgenic activities of the lowertestosterone esters in rat with R m values and hydrolysisrates, Eur. J. Med. Chem., 10, 55, 1975.
4. Bate-Smith, E. C. and Westall, R. G., Chromatographicbehaviour and chemical structure. 1. Some naturallyoccurring phenolic substances, Biochim. Biophys. Acta, 4,427, 1950.
5. Newman, M. S., Ed., Steric Effects in Organic Chemistry,Wiley, New York, 1956.
6. McFarland, J. W. and Gans, D. J., The significance ofclusters in the graphical display of structure–activityrelationships, J. Med. Chem., 29, 505, 1986.
8. Rushton, D. H., Chemical and Morphological Properties ofScalp Hair, Ph.D. thesis, University of Wales, 1988.
9. Benkerrour, L. et al., Granule and tablet formulae studyby principal components analysis, Int. J. Pharm., 19, 27,1984.
10. Hogan, J. et al., Investigations into the relationshipbetween drug properties, filling and release of drugs fromhard gelatin capsules using multivariate statisticalanalysis, Pharm. Res., 13, 944, 1996.
11. Spearman, C., “General intelligence,” objectivelydetermined and measured, Am. J. Psychol., 15, 201, 1904.
6 Factorial Design of Experiments
1. Fisher, R. A., The Design of Experiments, Oliver & Boyd,Edinburgh, 1926.
2. Armstrong, N. A. and Cartwright, R. G., Thediscoloration on storage of tablets containing spray-driedlactose, J. Pharm. Pharmacol., 36, 5P, 1984.
3. Yates, F., The Design and Analysis of FactorialExperiments, Commonwealth Agricultural Bureaux, FarnhamRoyal, 1959.
4. Strange, R. S., Introduction to experiment design forchemists, J. Chem. Educ., 67, 113, 1990.
5. Gonzalez, A. G., Optimization of pharmaceuticalformulations based on responsesurface methodology, Int. J.Pharm., 97, 149, 1993.
6. Plazier-Vercammen, J. A. and De Neve, R. E., Evaluationof complex formation by factorial analysis, J. Pharm. Sci.,69, 1403, 1980.
7. Sanderson, I. M., Kennerley, J. W., and Parr, G. D., Anevaluation of the relative importance of formulation andprocess variables using factorial design, J. Pharm.Pharmacol., 36, 789, 1984.
8. Plackett, R. L. and Burman, J. P., The design of optimummultifactorial experiments, Biometrika, 33, 305, 1946.
9. Durig, T. and Fassihi, A. R., Identification ofstabilising and destabilising effects of excipient–druginteractions in solid dosage form design, Int. J. Pharm.,97, 161, 1993.
10. Sastry, D. V. et al., Atenolol gastrointestinaltherapeutic system: 1. Screening of formulation variables,Drug Dev. Ind. Pharm., 23, 157, 1997.
11. Box, G. P. E and Wilson, K. B., On the experimentalattainment of optimum conditions, J. Royal Stat. Soc. Ser.B, 13, 1, 1951.
12. Podczeck, F. and Wenzel, U., Development of solid oraldosage forms by means of multivariate analysis: Part 3,Pharm. Ind., 52, 496, 1990.
13. Box, G. E. P. and Behnken, D. W., Some new three level

designs for the study of quantitative variables,Technometrics, 30, 95, 1960.
14. Doehlert, D. H., Uniform shell designs, Appl. Stat.,19, 231, 1970.
15. Box, N. J. and Draper, N. R., Factorial designs, the |X ′ X | criteria and some related matters, Technometrics,13, 731, 1971.

7 Response-Surface Methodology
1. Tattawasart, A. and Armstrong, N. A., The formation oflactose plugs for hard shell capsule fills, Pharm. Dev.Technol., 2, 335, 1997.
2. Pourkavoos, N. and Peck, G. E., Effect of aqueous filmcoating conditions on water removal efficiency and physicalproperties of coated tablet cores containingsuperdisintegrants, Drug Dev. Ind. Pharm., 20, 1535, 1994.methodology, Drug Dev. Ind. Pharm., 19, 2089, 1993.
4. Schwartz, J. B., Flamholz, J. R., and Press, R. H.,Computer optimisation of pharmaceutical formulations. 1.General procedure. J. Pharm. Sci., 62, 1168, 1973.

8 Model-Dependent Optimization
1. Myers, R. H. and Montgomery, D. C., Response SurfaceMethodology: Process and Product Optimisation usingDesigned Experiments, 2nd ed., Wiley, New York, 2002.
2. Derringer, G. and Suich, R., Simultaneous optimisationof several response variables, J. Qual. Tech., 12, 214,1980.
3. Cohon, J. L., Multiobjective Programming and Planning,Academic Press, New York, 1978.
4. De Boer, J. H., Smilde, A. K., and Doornbos, D. A.,Introduction of multi-criteria decision making inoptimization procedures for pharmaceutical formulations,Acta Pharm. Technol., 34, 140, 1988.

9 Sequential Methods andModel-Independent Optimization
1. Whitehead, J., The Design and Analysis of SequentialClinical Trials, 2nd ed., Ellis Horwood, Chichester, 1997.
2. Brown, A. et al., Value of a large dose of antitoxin inclinical tetanus, Lancet, 2, 227, 1960.
3. Wald, A., Sequential Analysis, Wiley, New York, 1948.
4. Spendley, W., Hext, G. R., and Himsworth, F. R.,Sequential application of simplex designs in optimisationand evolutionary operations, Technometrics, 4, 441, 1962.
5. Gould, P. L. and Goodman, M., Simplex search in theoptimisation of the solubility of caffeine in parenteralcosolvent systems, J. Pharm. Pharmacol., 35, 3P, 1983.
6. Shek, E., Ghani, M., and Jones, R. E., Simplex search inoptimization of capsule formulation, J. Pharm. Sci., 69,1135, 1980.

10 Experimental Designs for Mixtures
1. Findlay, A., The Phase Rule and its Applications, 9thed., Dover, New York, 1951.
2. Scheffé, H., Experiments with mixtures, J. R. Stat.Soc., Ser. B, 20, 344, 1958.
3. Stephens, D. et al., A statistical experimental approachto co-solvent formulation of a water soluble drug, DrugDev. Ind. Pharm., 25, 961, 1999.
4. Huisman, R. et al., Development and optimization ofpharmaceutical formulations using a simplex lattice design,Pharmaceutisch Weekblad. Scientific Edition, 6, 185, 1984.
5. Smilde, A. K., Knevelman, A., and Coenegracht, P. M. J.,Introduction of multicriteria decision making inoptimization procedures for high-performance liquidchromatographic separations, J. Chromatogr., 369, 1, 1986.
6. De Boer, J. H., Bolhuis, G. K., and Doornbos, D. A.,Comparative evaluation of multi-criteria decision makingand combined contour plots in optimization of directlycompressed tablets, Eur. J. Pharm. Biopharm., 37, 159,1991.
7. Cornell, J. A., Experiments with Mixtures, 3rd ed.,Wiley, New York, 2002.
8. Duineveld, C. A. A., Smilde, A. K., and Doornbos, D. A.,Designs for mixture and process variables applied in tabletformulations, Anal. Chim. Acta, 277, 455, 1993.
11 Artificial Neural Networks andExperimental Design
1. Rowe, R. C., Expert systems, in Encyclopaedia ofPharmaceutical Technology, 2nd ed., Swarbrick, J. andBoylan, J. C., Eds., Marcel Dekker, New York, vol. 2, 2002,p. 1188.
2. Lai, S., Podczeck, F., Newton, J. M., and Daumesnil, R.,Expert system to aid the development of capsuleformulations. Pharm. Technol. Eur., 8, 60, 62–64, 66, 68,1996.
3. Aleksander, I. and Morton, H., An Introduction to NeuralComputing, 2nd ed., Chapman & Hall, London, 1995.
4. Picton, P., Neural Networks, 2nd ed., Palgrave, London,2000.
5. Russell, S. and Norvig, P., Artificial Intelligence: aModern Approach, 2nd ed., Prentice-Hall, London, 2003.
6. Achanta, A. S., Kowalski, J. G., and Rhodes, C. T.,Artificial neural networks: implications for thepharmaceutical sciences, Drug Dev. Ind. Pharm., 21, 119,1995.
7. Murtoniemi, E. et al., The advantages by the use ofneural networks in modelling the fluidised bed granulationprocess, Int. J. Pharm., 108, 15, 1994. 3 factorialdesign and multilinear stepwise Biopharm., 39, 75, 1993.
9. Chen, Y. X., et al., Comparison of four artificialneural network software programs used to predict in vitrodissolution of controlled release tablets, Pharm. Dev.Technol., 7, 373, 2002.
10. Plumb, A. P. et al., The effect of experimental designon the modelling of a tablet coating formulation usingartificial neural networks, Eur. J. Pharm. Sci., 16, 281,2002.
11. Bourquin, J. et al., Pitfalls of artificial neuralnetwork (ANN) modelling technique for data sets containingoutlier measurements using a study on mixture properties ofa direct compressed dosage form, Eur. J. Pharm. Sci., 7,17, 1998.
12. Derringer, G. and Suich, R., Simultaneous optimisationof several response variables, J. Qual. Tech., 12, 214,

1980.
13. Takayama, K., Fujikawa, M., and Nagai, T., Artificialneural network as a novel method to optimise pharmaceuticalformulations, Pharm. Res., 16, 1, 1999.