Pharma rebates, pharmacy benefit managers and employer outcomes
14
Pharma rebates, pharmacy benefit managers and employer outcomes Özden Gür Ali & Murali Mantrala Received: 5 January 2010 / Accepted: 5 May 2010 / Published online: 28 May 2010 # Springer Science+Business Media, LLC 2010 Abstract Corporate employers contract with pharmacy benefit managers (PBMs) with the goals of lowering their employee prescription drug coverage costs while maintain- ing health care quality. However, little is known about how employer-PBM contract elements and brand drugmakers’ rebates combine to influence a profit-maximizing PBM’ s actions, and the impact of those actions on the employer ’ s outcomes. To shed more light on these issues, the authors build and analyze a mathematical simulation model of a competitive pharmaceutical market comprised of one generic and two branded drugs, and involving a PBM contracted by a corporate employer to help it lower prescription drug costs while achieving a minimum desired quality of health care for its employees. The brand drug- makers’ rebate offers, the PBM’ s assignment of drugs to formulary tiers, and the resulting employer outcomes under varying contracts and pharma brand marketing mix environmental scenarios are analyzed to provide insights. The findings include that the pharma brands offer rebates for the PBM’ s ability to move prescription share away from the unpreferred brand, but reduce these offers when the PBM’ s contract requires it to proactively influence physicians to prescribe the generic drug alternative. Further, Pareto optimal contracts that provide the highest health benefit for a given employer cost budget for the employer are analyzed to provide managerial implica- tions. They are found to involve strong PBM influence on physician prescribing to discourage unpreferred brands, as well as high patient copayment requirements for unpreferred brands to align the patient prescription fill probability with the formulary, while other copay- ment requirements provide an instrument to determine the level of desired health benefit—cost tradeoff. Keywords Pharmacy benefit manager . Rebates . Employer cost . Competition . Prescription drug marketing . Health benefit . Pareto optimal . Contract 1 Introduction Pharmacy benefit managers (PBMs) play an important role in the United States (U.S.) pharmaceutical industry. According to Atlantic Information Services, Inc. (AIS) they manage the prescription drug benefits for 57% of the population [1], and process a large majority of the prescriptions written in the U.S. 1 Corporate employers contract with PBMs with the goals of lowering their employee prescription drug coverage costs while maintaining health care quality. PBMs control the large prescription volume they impact via tiered drug formularies that specify preferred and unpreferred drugs with different patient copayment levels, and by influencing physicians to prescribe in compliance with these formular- 1 PBMs processed 3.9B Rxs annually for the 2009 Q1 [2], compared with a total of 3.8B Rxs for 2008 according to IMS Health [3]. Ö. Gür Ali (*) College of Administrative Sciences and Economics, Koç University, Istanbul, Turkey e-mail: [email protected] M. Mantrala Trulaske College of Business, University of Missouri, Columbia, MO, USA e-mail: [email protected] Health Care Manag Sci (2010) 13:281–293 DOI 10.1007/s10729-010-9129-4
-
Upload
independent -
Category
Documents
-
view
0 -
download
0
Transcript of Pharma rebates, pharmacy benefit managers and employer outcomes
Pharma rebates, pharmacy benefit managersand employer outcomes
Özden Gür Ali & Murali Mantrala
Received: 5 January 2010 /Accepted: 5 May 2010 /Published online: 28 May 2010# Springer Science+Business Media, LLC 2010
Abstract Corporate employers contract with pharmacybenefit managers (PBMs) with the goals of lowering theiremployee prescription drug coverage costs while maintain-ing health care quality. However, little is known about howemployer-PBM contract elements and brand drugmakers’rebates combine to influence a profit-maximizing PBM’sactions, and the impact of those actions on the employer’soutcomes. To shed more light on these issues, the authorsbuild and analyze a mathematical simulation model of acompetitive pharmaceutical market comprised of onegeneric and two branded drugs, and involving a PBMcontracted by a corporate employer to help it lowerprescription drug costs while achieving a minimum desiredquality of health care for its employees. The brand drug-makers’ rebate offers, the PBM’s assignment of drugs toformulary tiers, and the resulting employer outcomesunder varying contracts and pharma brand marketing mixenvironmental scenarios are analyzed to provide insights.The findings include that the pharma brands offer rebatesfor the PBM’s ability to move prescription share awayfrom the unpreferred brand, but reduce these offers whenthe PBM’s contract requires it to proactively influencephysicians to prescribe the generic drug alternative.
Further, Pareto optimal contracts that provide the highesthealth benefit for a given employer cost budget for theemployer are analyzed to provide managerial implica-tions. They are found to involve strong PBM influenceon physician prescribing to discourage unpreferredbrands, as well as high patient copayment requirementsfor unpreferred brands to align the patient prescriptionfill probability with the formulary, while other copay-ment requirements provide an instrument to determinethe level of desired health benefit—cost tradeoff.
Keywords Pharmacy benefit manager . Rebates .
Employer cost . Competition . Prescription drug marketing .
Health benefit . Pareto optimal . Contract
1 Introduction
Pharmacy benefit managers (PBMs) play an important rolein the United States (U.S.) pharmaceutical industry.According to Atlantic Information Services, Inc. (AIS) theymanage the prescription drug benefits for 57% of thepopulation [1], and process a large majority of theprescriptions written in the U.S.1
Corporate employers contract with PBMs with the goalsof lowering their employee prescription drug coverage costswhile maintaining health care quality. PBMs control thelarge prescription volume they impact via tiered drugformularies that specify preferred and unpreferred drugswith different patient copayment levels, and by influencingphysicians to prescribe in compliance with these formular-
1 PBMs processed 3.9B Rxs annually for the 2009 Q1 [2], comparedwith a total of 3.8B Rxs for 2008 according to IMS Health [3].
Ö. Gür Ali (*)College of Administrative Sciences and Economics,Koç University,Istanbul, Turkeye-mail: [email protected]
M. MantralaTrulaske College of Business, University of Missouri,Columbia, MO, USAe-mail: [email protected]
Health Care Manag Sci (2010) 13:281–293DOI 10.1007/s10729-010-9129-4

ies. Drug utilization review and medication therapymanagement activities, prior authorization requirementsfor off-formulary drugs, and clinical consultants calling onphysicians and providing information about treatmentprotocols are some examples of PBMs’ efforts to influencephysicians to prescribe cheaper drugs [4, 5]. PBMs leveragethis ability and power to affect demand to negotiatefavorable prices—via price rebates—from drugmakersseeking inclusion and/or preferred status for their productsin the PBM’s formulary. According to Tenaglia andAngelastro [6], for many pharma companies, the dollarsthey have rebated back to managed care organizations,PBMs and national insurers represent a cash outflow that isnow greater than all their direct-selling expenses combined,and may be as much as 20% of gross sales.
In recent years, the growth of highly profitable PBMseven as health care costs continue to rise has been ofconcern to employers as well as consumer coalition groupsand legislators, e.g., the Consumer Federation of America,the U.S. Public Interest Research Group (PIRG),theNational Legislative Association on Prescription DrugPrices, etc. This has led to a variety of moves at the stateor federal level to pass laws requiring greater transparencywith respect to PBMs’ revenue sources, especially therebates they receive from drugmakers. However, pastCongressional Budget Office analyses of such legislativeproposals have indicated that greater transparency couldresult in drugmakers offering smaller discounts to PBMs,which could ultimately lead to higher drug costs forinsurers and consumers [7]. More research and under-standing of how interactions between drugmakers, PBMsand employers impact patient and employer outcomesis clearly needed to inform policymakers, health caremanagers, and scholars concerned about PBM transparencyand prescription drug costs.
This paper’s goal is to shed light on how employer-PBMcontract elements and pharmaceutical company rebatescombine to influence a profit-maximizing PBM’s actions,and the impact of those actions on the employer’s out-comes. As it is almost impossible for independent analyststo obtain information on actual costs and rebates fromPBMs and drugmakers due to their sensitivity, we employ asimulation analysis research approach. More specifically,we build a comprehensive mathematical simulation modelof a competitive pharmaceutical market involving a PBMcontracted by a corporate employer to help it lowerprescription drug costs while achieving a minimum desiredquality of health care for its employees. The drugmakers’actions with respect to rebate offers, the PBM’s assign-ments of drugs to formulary tiers, and the resultingemployer outcomes under varying contract structures and
competitive pharmaceutical marketing mix environmentalscenarios are analyzed to provide insights.
To our knowledge, this is the first paper in the healthcare management science literature that investigates aPBM’s incentives and actions in a model-based simulationstudy. The insights we obtain regarding profit-maximizingPBM behavior as well as the nature of pareto optimalcontracts should be useful for employers in their contractnegotiations with PBMs. Further, our model-based simula-tion tool can serve as a platform for examining the effectsof specific contract element modifications of interest topolicymakers and analysts.
The rest of the paper is organized as follows: Section 2develops the simulation model while Section 3 describesthe simulation experimental design employed in this study.Section 4 describes and explains how the competitivesequential game between the two brands and the PBM issolved. Key insights from the simulation analysis resultsrelating contract elements to employer cost and healthbenefits are presented in Section 5. We conclude with asummary of our insights into pharma brand rebating andPBM behaviors, implications for employers contractingwith PBMs, and future research directions. The fixed modelparameter values used in the simulation study and theirsources in extant empirical research are listed in theAppendix.
2 The model
To accomplish our research objective, we construct asimulation model of the employer cost and health benefitresulting from PBM management under specific contractsand competitive pharma marketing mix environmentalscenarios (hereafter simply called Scenarios). As explainedbelow, in this model the pharmaceutical brands makestrategic rebate offer decisions by considering the incre-mental profit potential that they can realize - taking intoaccount the other brand’s rebate offer and profit-maximizing PBM’s response in terms of formulary tierassignment, which is subject to its contract with theemployer and prevailing Scenario. The impact of all actors’decisions on employer outcomes under the specific contractand Scenario is reported. We begin our model developmentwith a description of the simulated market structure.
2.1 The market structure
We consider a market where the prescription drug benefitsof all patients are managed by one PBM using a three-tierformulary and focus on one therapeutic drug market
282 Health Care Manag Sci (2010) 13:281–293

comprised of three alternative medications that can treat thesame problem (e.g., high cholesterol): two branded drugs(still under patent) with differing molecular structures (e.g.,two newer statins), and a generic version of an oldermolecule that has gone off-patent (e.g., an older statin). Thedrugs differ in terms of their quality (efficacy-safetyprofiles), prices and pull marketing efforts aimed atphysicians (detailing) and patients (direct-to-consumerads, i.e., DTC advertising).
In the model, the subscript i=1,2,3 is used for drugs,denoting Brand 1, Brand 2, and the Generic drugrespectively, while j=1,2,3 is used for the PBM’s formularytiers, where Tier 1 is for the Generic drug, Tier 2 forpreferred drug brand/s, and Tier 3 for unpreferred drugbrand/s.
2.2 The rebate competition
In the specified market setting, we analyze the brands’competition for formulary position as a three-stage sequentialgame with perfect information, where Brand 2 is viewed asthe leader and Brand 1 as the follower. The sequence ofactions is as follows:
1. Brand 2 makes its rebate (i.e., volume discount) offer tothe PBM
2. Brand 1 then makes a competitive rebate offer to thePBM taking into account Brand 2’s rebate offer.
3. Given the rebate offers, the PBM assigns the brands toformulary tiers.
Under any given employer-PBM contract structureand pharma brand marketing Scenario, the pharmacompanies and the PBM choose their respective actionsto maximize own profits, with full knowledge of thedecisions of other actors who moved before them, andaccounting for the best responses of the actors whofollow. In game theory terminology, this is a three-stagenon-cooperative sequential game with perfect informa-tion, and the resulting decisions are called equilibriumdecisions [8].
All actors are assumed to use the same model ofpharmaceutical product sales and resulting profits. Due tothe complexity of the model we determine the equilibriumdecisions numerically, and calculate the corresponding out-comes for the PBM and employer. We obtain and examinethese results under varying combinations of the exogenousemployer-PBM contract elements and Scenarios in a largenumerical experiment which is described in Section 3.
2.3 The model of pharmaceutical product sales
The number of patients who are (ultimately) treated withDrug i, ni, is modeled as:
ni ¼ N pvispi pfilli; for i ¼ 1; 2; 3 ð1Þwhere:
N the total number of patients suffering from acondition (health problem)
pvis probability of a sufferer making a visit (presentingthe condition) to a physician
pi probability of a physician prescribing Drug i to apresenting patient
pfilli the probability of a patient with a prescription forDrug i actually filling the prescription
The detailed specifications of these three components ofdemand are as follows: The probability of a sufferer visiting aphysician (pvis) increases with his/her awareness thatdepends on DTC advertising efforts in the category [9]. Thus
pvis ¼ P0vis þ gvisDTCAware DTC1 þ DTC2ð Þ ð2ÞHere, P0vis denotes the probability of a patient presenting thecondition independent of DTC advertising efforts, andγvisDTC>0 is the coefficient for category awareness due toDTC effort. DTCi is the advertising effort by drug i. Further,we assume that awareness increases with DTC advertising ata decreasing rate, i.e.,
Aware DTCð Þ ¼ aquadDTCDTC2 þ alinDTCDTC;
aquadDTC < 0 and alinDTC > 0:
ð3Þ
Pharmaceutical demand functions A number of recentstudies have found that detailing affects drug prescriptionchoice response behavior in a positive and significantmanner, with decreasing returns as detailing is increased[10–12]. Following recommendations in the literature, weposit that the probability of a presenting patient receiving aprescription for Drug i from the physician, pi, is given bythe ratio of Drug i’s attraction to the sum of the attractionsof the three alternatives. The attraction of Drug i is a linearfunction of its intrinsic quality, Qi, pharmaceutical companydetailing effort on its behalf, Deti, moderated by PBMInfi,the PBM influence multiplier with respect to Drug i. Thatis, PBMInfi shrinks or boosts Drug i’s attraction.
Thus, for Drug i=1, 2, 3:
pi ¼ bq Qi þ bdet Deti� �
PBMInfi�
bq Q1 þ bdetDet1� �
PBMInf1 þ bq Q2 þ bdet Det2� �
PBMInf2 þ bq Q3
� �PBMInf3
� � ð4Þ
Health Care Manag Sci (2010) 13:281–293 283

Here βq, and βdet, are nonnegative coefficients for drugquality and detailing, respectively. Next, the prescriptionfill probability (pfilli) is modeled as follows:
pfilli ¼ P0fill � gfillcostOOPi þ gfillDTC Aware DTCið Þ; for i ¼ 1; 2; 3:
ð5ÞThus, the prescription fill probability decreases with
the patient’s related out-of-pocket (OOP) expenditure forDrug i, OOPi, and increases with the awareness level dueto DTC advertising by Drug i [13]. The constant (P0fill)captures the baseline probability to fill prescriptions,based on the perceived severity of the disease and/orinertia. The sensitivities of prescription fill probability toOOP spending, and to awareness of DTC by Drug i, arerepresented by γfillcost>0 and γfillDTC>0, respectively.
For the sake of analytical simplicity, we assume, withoutloss of generality, that every patient who visits a physicianreceives medication therapy. We also assume that theconsumers are homogeneous in their sensitivity to OOPand response to DTC advertising, while physicians arehomogeneous in their response to the intrinsic quality ofdrugs, detailing, and PBM influence.
2.4 The brands’ objective function and decisions
The objective of the pharmaceutical companies is tomaximize their net profits from the PBM segment givenby the gross profit less the rebate dollar amount (Rebatei)paid to the PBM. Thus, denoting gross profit margin by GP,
BrandProfiti ¼ ni Pricei GP � Rebatei for i ¼ 1; 2: ð6Þ
Pharmaceutical manufacturers typically tie rebates to thedemonstrated increase in their market share [5], and whilethey announce their rebate offer (expressed as the discountfraction off the price, denoted DiscOffer) to the PBM at thebeginning of the period, the actual rebate amount paid outis realized only at the end of the period. To reflect thispractice, we model the rebate percentage as proportional tothe achieved market share, which is multiplied by thenominal cost of goods sold to provide the dollar rebateamount paid out by brand i as follows.
Rebatei ¼ ni PriceiDiscOfferi ni= n1 þ n2 þ n3ð Þ½ �for i ¼ 1; 2
ð7Þ
The maximum discount rate offer to the PBM, Dis-cOfferi, applies if Brand i achieves 100% share of the PBMprescription drug sales. In this simulation, each brandchooses its DiscOfferi from a set of discrete values. Thisassumption facilitates the analysis and is also consistentwith practice.
2.5 PBM’s objective function and decision problem
The PBM’s profit ΠPBM is derived from three components:1) the retained portion, after pass-through to the employer,of the rebate dollar amount received from the pharma brandmanufacturers; 2) the transaction fees received from theemployer; and 3) the ‘spread’ the PBM is able to negotiatefrom the pharmacies [14]. Thus,
ΠPBM ¼ Σi Rebatei 1� Passð Þ þ Spreadi þ Ctð Þnif g ð8Þwhere:
Ct is the transaction fee per filled prescription thatthe PBM charges to the payer
Spreadi are other volume-based discounts that the PBM isable to obtain from the supply chain, includingthe pharmacies
Pass is the proportion of rebate dollars passed throughto the employer by the PBM.
(Note that the generic drug does not offer discounts tothe PBM. Rather, it relies on its low price and pharmacydiscounts that are passed on to the PBM in the form ofhigher spreads than those for brands.)
The PBM operating the 3-tier formulary specified by thecontract decides the brands’ tier assignments. With thegeneric drug always assigned to Tier 1, the PBM choosesone of four possible combinations for brand-to-tier assign-ments: either both brands assigned to Tier 2; both brandsassigned to Tier 3; assignment of first brand to Tier 2 andthe second to Tier 3, or vice versa. The PBM decisions arethus represented by Tij, for i=1,2; j=2,3
Tij ¼ 1 if Drug i is assigned to Tier j;¼ 0 otherwise:
ð9Þ
Table 1 summarizes the decision makers and theirdecision variables in each stage of the game that wasoutlined in section 2.2.
2.6 The elements of the PBM—employer contract
In our model, the PBM and the employer agree on acontract containing (A) plan design and (B) PBM incentive-related elements. We do not model the mechanics of howthe PBM and the employer would agree on a contract, but
Table 1 Decision makers and variables at each stage of the rebatecompetition game
Stage Decision maker Decision variable(s)
1 Brand 2 DiscOffer22 Brand 1 DiscOffer13 PBM {Tij}
284 Health Care Manag Sci (2010) 13:281–293

demonstrate the consequences of any given contractstructure for the employer. Our contribution is to helpthe employer to determine which contract elements itshould try to move, and in which direction, beforenegotiating with the PBM.
A. Plan design elements
These elements have two components in our model:
a) The PBM influence on the physician prescription choicedecision for a drug in Tier j, TierInfj. As already noted,PBM influence moderates the attraction of the drug(s)that are assigned to Tier j in Eq. (4), and enters theequation as a multiplier, PBMInfi, for Drug i, specifiedas follows:
PBMInfi ¼X
jTierInfj Tij for i ¼ 1; 2; 3 ð10Þ
More specifically, we take the PBM influence with respectto a drug assigned to Tier 2 as ‘neutral’ ( represented in ournumerical experiment by TierInf2=1). Then, the level ofPBM’s encouragement of physicians to prescribe the Tier 1generic drug is expressed by TierInf1 (TierInf1≥1), whilethe level of the PBM’s dissuasion of physicians fromprescribing unpreferred Tier 3 brand/s is expressed byTierInf3, (0< TierInf3 ≤1).
b) The required patient co-payment for drugs in formularyTier j, Copayj. Given a drug’s formulary tier assign-ment, the patient’s out-of-pocket costs for Drug i isdetermined as follows:
OOPi ¼X
jTij Copayj; for i ¼ 1; 2; 3: ð11Þ
B. PBM incentive elements
The PBM incentive elements of the contract are as follows:
a) the proportion of the rebate dollars that are to be passedthrough to the employer, denoted Pass;
b) the fee per transaction paid by the employer to thePBM, Ct.
2.7 The employer outcomes
The employer would like to minimize the pharmacy benefitcost, comprised of the cost of the prescribed drugs and thetransaction fees paid to the PBM, less the portion of thepharmaceutical companies’ rebates passed through by the PBMand the patient co-payment amounts. That is,
Employer Cost ¼ Σi ni Pricei þ Ct � OOPið Þ� Pass Rebateið Þ ð12Þ
The employer is also concerned with the patient out-comes, namely, the total health benefit from the pharma-ceutical drugs it pays for, and the average out-of-pocketexpense. Low health benefits have the potential of causinglarger medical costs for the employer in the long run, whilehigh OOP can cause employee dissatisfaction. We specifythe Health Benefit to the patient body as proportional to thenumber of sufferers who receive medication therapy and thequality of the drugs they use, i.e.,
Health Benefit ¼ Σi ni Qi=N ð13Þ
3 The numerical experiment design
To understand the impact of the contract elements on theemployer outcomes as given by (12), and (13), weconduct a full factorial designed experiment varying thecontract elements with four pharma marketing mixenvironmental Scenarios as blocks, resulting in 3,456(=233342) runs.
The pharma marketing mix blocks (Scenarios) and theirlevels are listed in Table 2.
Specifically, we use four Scenarios differing in drugquality, price and pull marketing efforts, as depicted inTable 2. The pull marketing efforts are indicated asfractions of maximum possible efforts. In the first twoscenarios the brands are symmetric, i.e., have equal quality,price, and pull marketing levels. The pull marketing levelsare high in the first Scenario, called ‘Symmetric BrandsHigh Pull’, and low in the second one, called ‘SymmetricBrands Low Pull’. In the third Scenario which is called‘Asymmetric Brands’, the second brand has higher quality,price and pull marketing levels. In the first three Scenarios,the generic drug, an older technology product, has 75% ofthe efficacy and safety levels of the highest quality of twobranded drugs. The last ‘Strong Generic’ scenario, however,depicts a situation where the newer brands do not offer anadvantage over the older generic drug. Lastly, guided by thetypical range of prescription drug prices in the anti-cholesterol category, the price per prescription is set at$100 for the brands when they are equal in quality and, inthe asymmetric brand scenario, the price of the lowerquality brand prescription is set at $80. The generic drugprice is set at $50 in all Scenarios, based on typicallyobserved intra-molecular generic to branded drug priceratios [15].
The contract elements varied in the simulation exper-iment and their levels are displayed in Table 3. TheCopayj amounts in Table 3 are based on the most commonco-payment amounts reported by benefit design surveys(Verispan, 2004) and encompass a range of commonly
Health Care Manag Sci (2010) 13:281–293 285
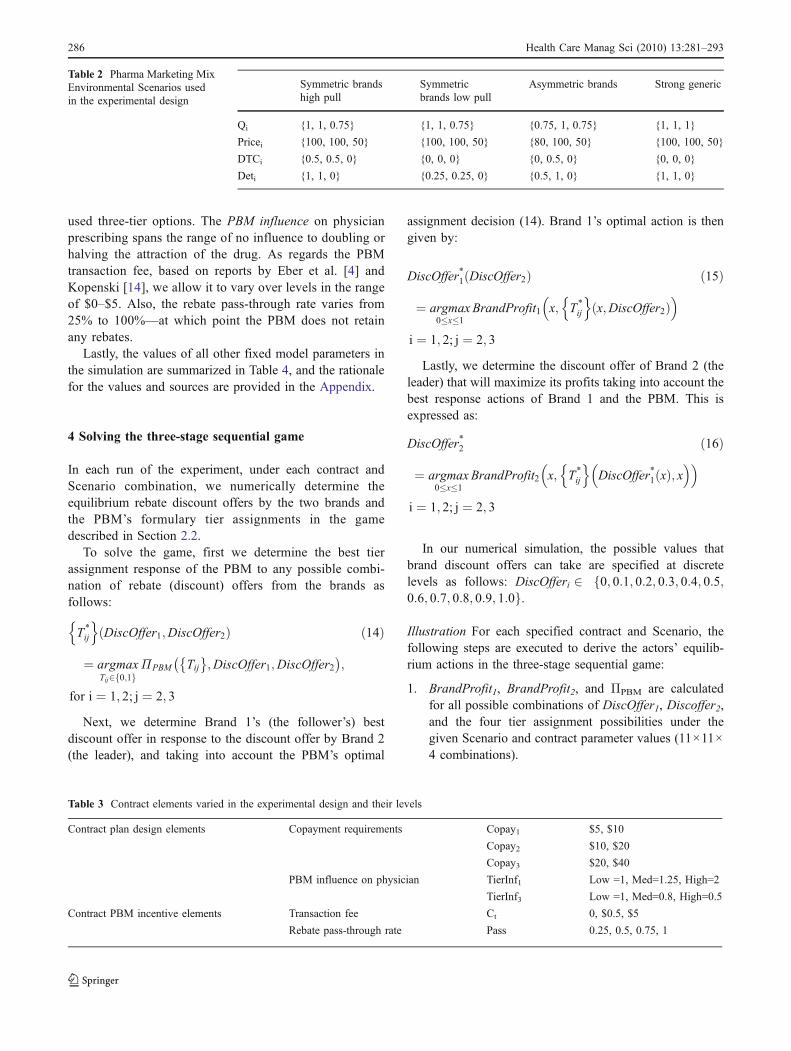
used three-tier options. The PBM influence on physicianprescribing spans the range of no influence to doubling orhalving the attraction of the drug. As regards the PBMtransaction fee, based on reports by Eber et al. [4] andKopenski [14], we allow it to vary over levels in the rangeof $0–$5. Also, the rebate pass-through rate varies from25% to 100%—at which point the PBM does not retainany rebates.
Lastly, the values of all other fixed model parameters inthe simulation are summarized in Table 4, and the rationalefor the values and sources are provided in the Appendix.
4 Solving the three-stage sequential game
In each run of the experiment, under each contract andScenario combination, we numerically determine theequilibrium rebate discount offers by the two brands andthe PBM’s formulary tier assignments in the gamedescribed in Section 2.2.
To solve the game, first we determine the best tierassignment response of the PBM to any possible combi-nation of rebate (discount) offers from the brands asfollows:
T»
ij
n oDiscOffer1;DiscOffer2ð Þ
¼ argmaxTij2 0;1f g
ΠPBM Tij� �
;DiscOffer1;DiscOffer2� �
;
for i ¼ 1; 2; j ¼ 2; 3
ð14Þ
Next, we determine Brand 1’s (the follower’s) bestdiscount offer in response to the discount offer by Brand 2(the leader), and taking into account the PBM’s optimal
assignment decision (14). Brand 1’s optimal action is thengiven by:
DiscOffer»
1 DiscOffer2ð Þ
¼ argmax0�x�1
BrandProfit1 x; T»
ij
n ox;DiscOffer2ð Þ
i ¼ 1; 2; j ¼ 2; 3
ð15Þ
Lastly, we determine the discount offer of Brand 2 (theleader) that will maximize its profits taking into account thebest response actions of Brand 1 and the PBM. This isexpressed as:
DiscOffer»
2
¼ argmax0�x�1
BrandProfit2 x; T»
ij
n oDiscOffer
»
1ðxÞ; x
i ¼ 1; 2; j ¼ 2; 3
ð16Þ
In our numerical simulation, the possible values thatbrand discount offers can take are specified at discretelevels as follows: DiscOfferi 2 0; 0:1; 0:2; 0:3; 0:4; 0:5;f0:6; 0:7; 0:8; 0:9; 1:0g.
Illustration For each specified contract and Scenario, thefollowing steps are executed to derive the actors’ equilib-rium actions in the three-stage sequential game:
1. BrandProfit1, BrandProfit2, and ΠPBM are calculatedfor all possible combinations of DiscOffer1, Discoffer2,and the four tier assignment possibilities under thegiven Scenario and contract parameter values (11×11×4 combinations).
Table 3 Contract elements varied in the experimental design and their levels
Contract plan design elements Copayment requirements Copay1 $5, $10
Copay2 $10, $20
Copay3 $20, $40
PBM influence on physician TierInf1 Low =1, Med=1.25, High=2
TierInf3 Low =1, Med=0.8, High=0.5
Contract PBM incentive elements Transaction fee Ct 0, $0.5, $5
Rebate pass-through rate Pass 0.25, 0.5, 0.75, 1
Symmetric brandshigh pull
Symmetricbrands low pull
Asymmetric brands Strong generic
Qi {1, 1, 0.75} {1, 1, 0.75} {0.75, 1, 0.75} {1, 1, 1}
Pricei {100, 100, 50} {100, 100, 50} {80, 100, 50} {100, 100, 50}
DTCi {0.5, 0.5, 0} {0, 0, 0} {0, 0.5, 0} {0, 0, 0}
Deti {1, 1, 0} {0.25, 0.25, 0} {0.5, 1, 0} {1, 1, 0}
Table 2 Pharma Marketing MixEnvironmental Scenarios usedin the experimental design
286 Health Care Manag Sci (2010) 13:281–293

2. For each DiscOffer1 and Discoffer2 combination thetier assignment that maximizes the ΠPBM, i.e. T
»ij
n o
DiscOffer1;DiscOffer2ð Þ is found.3. For each Discoffer2, the DiscOffer1 that maximizes the
BrandProfit1, i.e., DiscOffer»1 DiscOffer2ð Þ is deter-
mined, taking into account that the PBM will actaccording to the optimal tier assignment rule.
4. Finally the DiscOffer2 that provides the maximumBrandProfit2 among the remaining combinations isdetermined as DiscOffer
»2.
Table 5 illustrates part of the solution by backwardinduction of the three-stage game solution process in the caseof a contract with Copayment requirements {5, 10, 20};‘medium’ settings for TierInf1, TierInf3, Ct, and Pass=50%,
under the High Pull Symmetric Brands Scenario. In thisillustration, Brand 2’s discount offer is set at 0.1. Then, foreach possible pair of the brands’ discount offers shown in arow of Table 5, the PBM evaluates its profits from each of itsfour possible options for tier assignments (shown in columns3–6 in Table 5) and chooses its profit –maximizing option(shown in column 7). Brand 1 knows and accounts for thisprofit-maximizing behavior by the PBM, and, consideringthat Brand 2’s offers DiscOffer2=0.1, chooses 0.2 as its ownprofit-maximizing discount offer.
Moving backwards to the first stage of the 3-stagenoncooperative game, Table 6 illustrates how the leader(Brand 2) decides its discount offer. Specifically, Brand 2conjectures the PBM’s and Brand 1’s best response to adiscount offer by Brand 2 from its feasible set {0, 0.1, 0.2,0.3, 0.4, 0.5, 0.6, 0.7, 0.8, 0.9, 1.0} Based on theseconjectures, Brand 2 as the leader chooses its own profit-maximizing discount offer. It turns out that the equilibriumdecisions under this illustrative contract and Scenario thenare DiscOffer2*=0.1, DiscOffer
»1 ¼ 0, and PBM exclusively
assigns Brand 2 to the preferred brand tier.
5 Analysis of the experiment results
We analyzed the experiment results, specifically the brandrebates, the PBM’s formulary tier assignments, the EmployerCost and the health benefit outcomes, under differentcombinations of the contract elements and the environmentalScenarios, using ANOVA with main effects and two-wayinteractions. (All the results can be made available uponrequest.) Here, due to space constraints, we report only thoseeffects that are statistically significant as well as large in
Table 4 Fixed model parameter values in the simulation
Parameter Value
αquadDTC −0.7αlinDTC 1.24
P0vis 0.5
γvisDTC 0.153
γfillDTC 0.05
γfillcost −0.006βq 100
βdet 75
GP 80%
Spread1 $3
Spread2 $4
Spread3 $11
Table 5 Illustration of PBM’s and Follower Brand’s Decisions in Sequential Game
Brand rebate offers Normalized PBM profitwith preferred status given to
PBM’s profit maximizingchoice for preferred status
NormalizedBrandProfit1
Disc offer1 Disc offer2 Brand 2 Neither brand Both brands Brand 1
0 0.1 0.67 0.66 0.65 0.63 Brand 2 1.20
0.1 0.1 0.71 0.70 0.71 0.71 Brand 2 1.15
0.2 0.1 0.75 0.75 0.77 0.78 Brand 1 1.48
0.3 0.1 0.79 0.80 0.84 0.86 Brand 1 1.40
0.4 0.1 0.83 0.85 0.90 0.93 Brand 1 1.31
0.5 0.1 0.87 0.90 0.96 1.01 Brand 1 1.22
0.6 0.1 0.92 0.95 1.02 1.08 Brand 1 1.13
0.7 0.1 0.96 1.00 1.09 1.16 Brand 1 1.05
0.8 0.1 1.00 1.05 1.15 1.23 Brand 1 0.96
0.9 0.1 1.04 1.10 1.21 1.31 Brand 1 0.87
1 0.1 1.08 1.15 1.28 1.38 Brand 1 0.78
Health Care Manag Sci (2010) 13:281–293 287

magnitude. In the following tables and charts all outputvariables are reported as normalized to average 1 over thecomplete experiment of 3,456 runs.
5.1 Brand rebate and PBM tier assignment decisions
Insight 1 When Pass=1, i.e., the PBM is required topassthrough 100% of any rebate dollars it receives, thebrands never offer rebates. This is because, under thisconstraint, the PBM acts simply to maximize its transactionfees and spread incentives by maximizing the volume oftransactions, particularly the volume of the generic drugdue to its higher spread (supply chain discounts). What ismore interesting, however, is the next insight.
Insight 2 The PBM can assign preferred status to one orboth brands even when Pass=1 and the brands offer nodiscounts. This is indicated in Table 7 which shows thedistributions of the PBM’s optimal tier assignments withoutany rebate incentive for All runs (second column), andunder particular Copay3-Copay2, TierInf3 and TierInf1
levels (third, fourth and fifth blocks of columns). Note thatin nearly 38% of All runs in column 2 of Table 7, the profit-maximizing PBM assigns preferred status to both brands.This occurs when the PBM applies (or has) no influence todissuade physicians from prescribing brands if they wereplaced in the unpreferred tier. On the other hand, asindicated in the tier influence blocks of Table 7, theproportions of runs in which PBM assigns unpreferredstatus to both brands increases as its influence on physicians’prescribing increases (higher TierInf3 or TierInf1). Also, wesee in Table 7 that the proportion of runs in which the PBMassigns both brands to preferred status increases as theCopay3-Copay2 difference increases. This is because ifbrands are kept unpreferred then the higher associatedcopayments will reduce patients’ prescription taking, therebylowering the PBM’s transaction revenues. Consequently, thePBM gains more by assigning the brands to preferred statusthat will increase patient prescription fill rates due to thelower associated copayments.
Insight 3 If the PBM retains some portion of the rebatedollars it receives from the brand drugmakers i.e., Pass<1,then the brands’ rebate dollars increase as the PBM’sinfluence against unpreferred brands’prescribing (TierInf3)increases; and decrease as the PBM influence in favor ofgeneric drug prescribing (TierInf1) increases. The support-ing results are shown in Table 8 and imply that the brandspay for the PBM’s ability to move prescription sharebetween brands, but reduce rebates when the PBM at thesame time influences physicians to prescribe more of thegeneric drug. Table 8 does not show all the combinations ofTierInf3 and TierInf1 levels as the combinations do notshow significant interaction effects.
Insight 4 When brands are symmetric in quality and pullmarketing efforts, the PBM is more likely to assign bothbrands to the preferred drug tier (when Pass<1). Thussymmetric brands end up paying rebates for access to theemployer’s pool of patients but do not gain an advantagerelative to each other. When brands are asymmetric, the
Table 6 Determination of the Leader Brand’s decision in theillustrative example
DiscOffer2 BrandProfit1maximizingDiscOffer1
PBM Profitmaximizingtier decision
NormalizedBrandProfit2
0 0 None 0.95
0.1 0 Brand 2 1.23
0.2 0 Brand 2 1.12
0.3 0 Brand 2 1.00
0.4 0 Brand 2 0.88
0.5 0 Brand 2 0.76
0.6 0 Brand 2 0.64
0.7 0 Brand 2 0.52
0.8 0 Brand 2 0.41
0.9 0.6 Both 0.30
1 0.7 Both 0.20
Table 7 PBM’s assignment of brands to preferred tier when Pass=1 as copayment differentials and tier influence levels are varied
Without rebateincentive
Copay3-Copay2 TierInf3 TierInf1
Preferred All 0 10 20 30 Lo Med Hi Lo Med Hi
Brand 2 0.5% 0.0% 0.0% 0.9% 0.9% 0.0% 0.7% 0.7% 1.0% 0.3% 0.0%
None 61.7% 100% 61% 50% 36% 25% 62% 98% 57% 61% 67%
Both 37.8% 0% 39% 49% 63% 75% 38% 1% 42% 39% 33%
Brand 1 0% 0% 0% 0% 0% 0% 0% 0% 0% 0% 0%
# runs 864 216 216 216 216 288 288 288 288 288 288
288 Health Care Manag Sci (2010) 13:281–293

PBM is more likely to assign only the brand superior inquality to the preferred tier. These results are shown inTable 9.
5.2 Employer outcomes and Pareto optimal contracts
As Table 10 indicates, we find in our numerical experimentsthat the Employer Cost and Health Benefits are highlypositively correlated, while the Average OOP is negativelycorrelated with both. Rebates, on the other hand, exhibit asmall negative correlation with the Employer Cost.
Further, based on our ANOVA analyses of the experimentresults, Scenario and Copay2 are the largest contributors tothe Health Benefit, Employer Cost, and the Average OOPpaid by patients. Higher copayment requirement reduces thefill rate of prescriptions and, consequently, the Health Benefitand Employer Cost that follow. Higher copayment require-ments also increase the share of the cost that the patients pay,thereby further reducing the Employer Cost. This is shown inTable 11: Higher Copay2 is associated with lower EmployerCost and Health Benefit, but higher OOP for the patients.(The ANOVA analyses can be provided upon request.)
Next, the average patient and employer outcomes byScenario are shown in Table 12, along with the averagerebate amounts. Comparing the two symmetric brandscenarios which only differ with respect to the level ofpull marketing (detailing and DTC), we see that greaterpull marketing increases the Employer Cost and the HealthBenefits in three ways: by increasing the percent ofpatients who present their condition to the physician, byincreasing the physician’s demand for the newer genera-tion branded drugs, and by increasing the fill rate for thosedrugs. On the other hand, the Strong Generic scenario
provides the lowest Employer Cost, and second-highestHealth Benefits.
Figure 1 shows the Health Benefit versus Employer Costresulting from all contract combinations under the fourScenarios. The large effects of the competitive Scenario onthese two employer outcomes, as well as the positivecorrelation between them are evident from the plot.
5.2.1 Pareto optimal contracts
The desirable contracts for the employer are those thatmaximize Health Benefits for a given Employer Costbudget. Consistent with the multi-criteria optimizationliterature [16], we define a Pareto Optimal Contract for aScenario from the employer’s point of view as a contractthat provides the highest Health Benefit among contractswith same or higher Employer Cost within the Scenario.Figure 2 displays the Efficient Frontier of Pareto optimalcontracts under each Scenario.
The contract at the top right corner of the EfficientFrontier for each Scenario in Fig. 2 provides the maximumHealth Benefit for the Scenario, and there is no contract thatcan provide this level of Health Benefit for a lowerEmployer Cost. Similarly, at the bottom-left corner of theEfficient Frontier, the contract for each Scenario representsthe minimum Employer Cost for the Scenario, and there isno contract that provides higher Health Benefit for thatbudget. There are 83 contract—Scenario combinations thatrepresent Pareto optimal contracts for the Scenario out ofthe 3,456 total.
In Fig. 2 we observe that the Strong Generic scenariocan provide ten to twenty percent higher Health Benefitsthan the Low Pull Symmetric Brands scenario for anybudget level, because the generic drug is of high quality. On
Table 8 Average normalized rebate amount by tier influence copayment differentials
With rebate ıncentive TierInf3 TierInf1 Copay3-Copay2
Lo Med Hi Lo Med Hi 0 10 20 30
Avg normalized rebate amount – 0.82 3.18 1.48 1.43 1.09 0.90 1.23 0.99 0.89
# runs 864 864 864 864 864 864 648 648 648 648
Table 9 PBM’s assignment of Brands to Preferred tier when Pass<1, as pharma marketing Scenario is varied
Preferred High pull symmetric brands Low pull symmetric brands Asymmetric brands Strong generic
Brand 2 8% 5% 18% 5%
None 10% 11% 11% 11%
Both 75% 80% 67% 81%
Brand 1 8% 4% 4% 2%
Average normalized rebate 1.6 1.3 1.3 1.2
Health Care Manag Sci (2010) 13:281–293 289

the other hand, the high Health Benefit in the SymmetricBrands-High Pull marketing scenario cannot be achievedunder the other Scenarios (Notice that this scenario has thesame product quality and pricing as Low Pull- SymmetricBrands scenario, yet it yields a much higher Health Benefitfor the patient population.) This increase is achieved byhigher patient pull marketing contributing to increasedpatient presentation of the problem to the physician andhigh prescription fill rates. Similarly, high physician pullmarketing increase the physician demand for the highquality products, again increasing the Health Benefits.
Insight 5 The employer outcomes are highly dependent onthe marketing mix of the pharmaceutical brands and theirquality relative to the older generation generics. While theemployer cannot control the environmental conditions(Scenario), it is important to recognize that the relativequality and price of the drugs, as well as their pullmarketing levels are large drivers of employer outcomes.Hence, comparative analyses of contract outcomes shouldaccount for these environmental conditions. Further, theappropriate contract may depend on these conditions.
5.2.2 Common elements of Pareto optimal contracts
Now we look closer at the Pareto optimal contracts that weidentified in the previous section. In Table 13 we list theEmployer Cost minimizing and Health Benefit maximizingcontracts that constitute the two ends of the efficientfrontier as well as the generic share maximizing and rebatemaximizing (as a percent of Employer Cost) contracts, sincethey are commonly expressed employer strategies inmanaging pharmacy benefits. We observe that the Pareto
optimal contracts that maximize/ minimize these objec-tives do exist in all scenarios, and that they are orderedas follows in the Employer Cost increasing, HealthBenefit decreasing order under all scenarios: 1) EmployerCost minimizing, 2) generic share maximizing, 3) rebatemaximizing, 4) Health Benefit maximizing. There aretypically multiple contracts that maximize an objective,e.g. rebate maximization but only one of them is alsoPareto optimal.
The Employer Cost minimizing contracts are the sameunder each scenario. Maximum encouragement of genericprescribing (high TierInf1), and maximum discouragementof unpreferred brand prescribing (high TierInf3) increasethe generic’s share of physician prescriptions, while highcopayment requirements (Copay1=10, Copay3=40) ensurethat a) fewer prescriptions are filled, and b) the patient paysfor a higher portion of the filled prescriptions costs. Theincentive compensation components are designed to focusthe PBM on the lower-priced generic by making the “nopreferred brand” assignment attractive for the PBM. Fullpass-through of rebates prevents the PBM from making thebrands preferred in exchange for rebates. There is notransaction fee which reduces the PBM’s volume maximi-zation incentive, which could result in highly prescribedbrands to be put into Tier 2 even without rebates.
The generic share maximizing Pareto optimal contractsare similar to the Employer Cost minimizing contracts, butthey differ by requiring a low copayment for the genericdrug (Copay1). Therefore, the fill rate of the genericprescriptions is higher and consequently the Health Benefitand Employer Cost are higher.
The rebate maximizing Pareto optimal contracts, con-sistent with the previous section, have maximum discour-agement of unpreferred brand prescribing, and noencouragement of generic prescribing which maximize thePBM’s ability to move brand share. There are notransaction fees to divert PBM’s attention to volumemaximization. An optimal rebate pass-through rate focusesthe PBM on the rebate elicitation task.
The Health Benefit maximizing Pareto optimal contractsdiffer by scenario but have the following commonelements: 1) encouragement to physicians to prescribe thegeneric drug at maximum when the generic is of highquality, and at minimum when it is of lower quality; 2)maximum discouragement of unpreferred brand prescribingso that physicians do not write prescriptions that will face alow fill rate; 3) low copayment requirements to ensurehigher fill rates; 4) high rebate pass-through rate that stillprovides incentive for the PBM to obtain rebates; 5)transaction fees only used when the brands offer higherquality than the generic but do not have enough demand tobecome preferred without transaction fees, as in the LowPull Symmetric Brands scenario.
Table 10 The Pearson correlation coefficients between employeroutcomes, N=3,456
Correlations Rebates Employer cost Avg OOP
Health benefit 0.17 0.78 −0.43Rebates −0.10 −0.13Employer cost −0.61
Table 11 The average normalized Employer Cost , Health Benefit,and Patient OOP by Tier 2 copayment requirement (N=3,456)
Copay2=10 Copay2=20 All
Average of employer cost 1.07 0.93 1.00
Average of health benefit 1.03 0.97 1.00
Average of Avg OOP 0.77 1.23 1.00
290 Health Care Manag Sci (2010) 13:281–293

Notice that the generic share or rebate maximizing contractsare not the same as Employer Cost minimizing contracts.
To guide employer contracting with PBMs, we summa-rize some common characteristics of Pareto optimal con-tracts that we observe across all scenarios and runs in ournumerical experiment.
a) All Pareto optimal contracts observed require the PBMto exert influence to dissuade physicians from prescrib-ing unpreferred brands in the formulary.
b) Most Pareto optimal contracts involve high patientcopayment requirement for unpreferred brand(s). Thisfeature induces the pharma brands to offer higherrebates (to obtain preferred status), while reducingpatient fill rates for unpreferred brands, therebydecreasing the employer’s overall cost.
c) Very few Pareto optimal contracts use transaction fees.d) Low Employer Cost -focused Pareto optimal contracts
typically are those that allow no rebate incentive for thePBM (i.e., Pass=1); while high Health Benefit-focusedcontracts allow the PBM to retain a proportion of therebate dollars and motivate it to act more favorablytowards the higher quality brands.
e) Contracts with higher copayment requirements for thegeneric and preferred brand tend to lower the EmployerCost but also the Health Benefit.
6 Conclusions
This paper models a very important player in USpharmaceutical markets, namely, the Pharmacy BenefitManager, for the first time in the health care managementliterature. It provides insights into how a profit maximizingPBM’s behavior can be directed, using the contractconditions, in the presence of rebates from competingpharma brands. The proposed modeling framework permitsvaluable simulation analyses of the effect of a policy on theoutcomes of a very complex system comprised of actorswho zealously guard against the release any of their actualdata for analysis by outside researchers. While thisframework employs simple representations of employer,PBM, and pharmaceutical company objective functions thataccount for physician and patient behaviors, it is capable ofcapturing very complex interactions among these actors inthe system.
The analysis of the model generated insights into brandrebate and PBM tier assignment behaviors.
& First, the brands do not offer rebates unless someportion of these rebate dollars are kept by the PBM andcontribute to its own profits.
& Second, the brands pay for the PBM’s ability to moveprescription share between brands but reduce rebates
Table 12 The average normalized Employer Cost, Health Benefit and OOP by Scenario
High pull symmetric brands Low pull symmetric brands Asymmetric brands Strong generic Grand total
Average of employer cost 1.15 0.93 1.01 0.91 1.00
Average of Health Benefit 1.11 0.91 0.98 1.00 1.00
Average of Avg OOP 1.03 0.99 1.02 0.97 1.00
Fig. 1 Normalized HealthBenefit versus Employer Costof all contracts by Scenario
Health Care Manag Sci (2010) 13:281–293 291

when the PBM’s policy is aimed at channeling physcians’prescriptions towards the competing generic drug.
& However, even when rebates from the pharma brandsdo not contribute to its profits, the PBM can assign abrand to preferred status provided (a) there is enoughdemand for this brand as a result of its quality and pullmarketing efforts; and (b) the PBM’s influence againstphysician prescribing of unpreferred brands is weak.
& Also, symmetric brands in rebate competition end uppaying for access to the employer’s pool of patientswithout gaining an advantage relative to each other.
The analysis of the employer outcomes has pointed outthat the environmental conditions play a large role indetermining the Employer Cost and the Health Benefit, andthat higher Health Benefits tend to come with higherEmployer Cost. Examining the Pareto optimal contractsthat provide the highest Health Benefit for a givenEmployer Cost budget for the employer, the following
managerial implications were identified for the employercontracting with a PBM:
& Ensure maximum discouragement of physician prescrib-ing of unpreferred brands, and keep the patient copaymentrequirement for the unpreferred brands high. Based on theseverity of the health condition treated with the drugs inthis therapeutic area, determine the desired position on theefficient frontier of the Employer Cost—Health Benefittradeoff.
○ For life-style categories eliminate the rebate incen-tive for the PBM, and maximally encourage physiciansto prescribe the generic drug, and keep the copaymentrequirements high.○ For categories providing significant Health Benefits,provide a share of the rebates to the PBM that will beenough to give incentive to pursue rebates over transac-tion volume and spread income, and keep the copaymentrequirements for the preferred brand and generic low.Lastly, encourage physicians to prescribe generics if theyhave high efficacy and low side effects, but not otherwise.
Another managerial implication is that the performancemeasures of employer and patient outcomes should accountfor the relative quality and pull marketing of the drugs inthe therapeutic market as they can have a very large impacton the employer outcomes.
Our analysis has several limitations that suggest interestingdirections for future research. First, we have had to rely onsimulation analyses using several plausible fixed values ofparameters of our model due to the lack of availability ofactual financial data on PBM contracts, revenues, and pharmacompany rebate offers. It would obviously be beneficial toreestimate and reexamine our results using actual data fromthese organizations as and when that becomes available.Second, while rebate decisions and data are difficult to obtain
Fig. 2 The efficient frontier consisting of Pareto optimal contracts byScenario
Table 13 Pareto optimal contracts that represent the four common employer strategies
Plan design PBM incentive
Strategy Scenario specific TierInf1 TierInf3 Copays Pass Trans_Fee
Employer Cost minimizing All High High 10, *,40 100% 0
Generic share maximizing All High High 5, 20, 40 100% 0
Rebate maximizing(% of Employer Cost)
High pull symmetric Medium High 10, 20, 40 75% 0
Low pull symmetric Low High 10, 20, 40 75% 0
Asymmetric brands Low High 10, 20, 40 75% 0
Strong generic Low High 5,10,20 75% 0
Health Benefit maximizing High pull symmetric Low High 5,10,40 75% 0
Low pull symmetric Low High 5,10,20 75% 5
Asymmetric brands Low High 5,10,20 75% 0
Strong generic High High 5,10,20 75% 0
292 Health Care Manag Sci (2010) 13:281–293

by external analysts such as ourselves, our implicit assumptionin our model is that actors within the system, e.g., the pharmacompanies’ salespeople who negotiate with the buyers andmanagers of PBMs, do pick up knowledge of their rivals’offers to the PBM as well as the latter’s contractual obligationsto employers from their day-to-day contacts. Allowing forpartial information or uncertainty among the players is notwithin the scope of this study but would be a worthwhiledirection for future research. Third, we have assumed a PBMoperating a three-tier formulary, and a three-drug market in thisresearch. However, other types of formularies and morecompetitive market structures exist. Therefore, an interestingfuture research area is comparison of different formularystructures or number of drugs in the market in terms of theimpact on brand and PBM behaviors and employer outcomes.Lastly we have kept employer-PBM contract elements andpharma brand marketing mix scenarios as exogenous factors inour three-stage sequential game. Future research may makethese choice variables, e.g., allow optimization of pharmacompanies’ marketing mix including the rebates and the pullmarketing elements.
Acknowledgements We thank Burak Çavdaroğlu for programmingthe simulator.
Appendix—Fixed model parameter values
We consider the PBM to be located in a geographic areaequal to that of the average U.S. state containing 1/50th ofthe US population displaying the average prevalence forhigh cholesterol levels [17], i.e. N=6 million.
For setting patient response parameters, we rely on twosecondary data sources: the surveys conducted and publishedby the Prevention Magazine for six consecutive years [18]and the research by Goldman et al. [19] estimating copaymentimpact on prescription drug utilization. We fit a quadraticregression to the total DTC spend and DTC awarenessfigures over years 1997–2001, provided by PreventionMagazine surveys, and accordingly set αquadDTC=−0.7 andαlinDTC=1.24. Survey results on high cholesterol suffererswho talked about their condition to their physician for thefirst time because of the ads they have seen, and theirawareness of the corresponding ads are used to set P0vis=0.5and γvisDTC=0.153. DTC sensitivity of patient probability tofill the prescription is estimated based on the net proportionof patients indicating that seeing a DTC ad makes it morelikely that they will fill a prescription for a medicine that theyare currently taking, hence γfillDTC=0.05.
We approximate the constant elasticity relationshipbetween drug utilization and OOP spending in the lipidlowering market estimated by Goldman et al. [19] with apiecewise linear function in the OOP range of $5–$40, anduse the trend to set γfillcost=−0.006.
The coefficient for quality in the physician choice model,βq, is set at 100. The detailing effect coefficient, is set byassuming that the top quality brand with 1/3 of the maximumdetailing would have the same chance of being prescribed as abrand with maximum detailing and half the quality, βdet=75.
Based on 2005 average gross profit (GP) margins ofbranded and generic manufacturer pharmaceutical companies,the brands are assumed to have a GP margin of 80% [20].Lastly, we use $3 for the spread from brands, and $11 fromthe generic drug, based on the reports that spread, may runup to 10–16% for brands and 40–65% for the generics [14].
References
1. A Guide to Drug Cost Management Strategies. Atlantic InformationServices (2004)
2. http://www.pbmi.com/PBMmarketshare2.asp, accessed 02.01.20103. http://www.imshealth.com/deployedfiles/imshealth/Global/Content/
StaticFile/Top_Line_Data/2008_Channel_Distribution_by_U.S._RXs.pdf, accessed 02.01.2010
4. Eber B, Taylor B. I, Kirman C, Sanders J, Etheredge L (2001)Pharmacy benefit managers: a model for medicare? Issue Brief—National Health Policy Forum, No 765
5. Cook A, Kornfield T, Gold M (2000) The role of PBMs in managingdrug costs: implications for a medicare drug benefit, Kaiser FamilyFoundation, Publication No: 1543, http://www.kff.org
6. Tenaglia M, Angelastro P (2005) No margin for error. Pharm Exec25(9):90–98
7. Zhang J (2009) Battle erupts over disclosure on drug prices. WallStreet J, August 19
8. Lilien G, Kotler P, Moorthy KS (1992) Marketing models.Prentice-Hall, NJ
9. Wosinska M (2005) Direct-to-consumer advertising and drugtherapy compliance. J Mark Res 42(3):323–332
10. Gönül F, Franklin C, Elina P, Kannan S (2001) Promotion ofprescription drugs and its impact on physicians’ choice behavior. JMark 65(3):79–90
11. Narayanan S, Desiraju R, Chintagunta PK (2004) ROI implica-tions for pharmaceutical promotional expenditures: the role ofmarketing mix interactions. J Mark 68(4):90–105
12. Manchanda P, Honka E (2005) The effects and role of direct-to-physician marketing in the pharmaceutical industry: an integrativereview. Yale J Health Policy Law Ethics 2:785–822
13. Roebuck M, Lieberman JN (2009) Impact of pharmacy benefitdesign on prescription drug utilization: a fixed effects analysis ofplan sponsor data. Health Serv Res 44(3):988–1009
14. Kopenski F (2008) Prescription drug benefit design. Benefits Q 7–11, Fall
15. Drugstore.com http://www.drugstore.com/pharmacy/, accessedMarch 2006
16. Zeleny M (1982) Multiple criteria decision making. Mc GrawHill, NY
17. American Heart Association (2005) Heart disease and strokestatistics—2005 update. Dallas, TX
18. Prevention Magazine Report (2004) Fifth Annual Survey:consumer reaction to DTC advertising of prescription medicines.Emmaus, PA
19. Goldman D, Joyce G, Jose E, Pace J, Solomon M, Laouri M,Landsman P, Teutsch SM (2004) Pharmacy benefits and the use ofdrugs by the chronically ill. J Am Med Assoc 291(19):2344–2350
20. http://finance.google.com, accessed April 2006
Health Care Manag Sci (2010) 13:281–293 293

Reproduced with permission of the copyright owner. Further reproduction prohibited without permission.