
Sustainability of Consumer's Brand Loyalty through ... - IEOM
Upload
khangminh22Category
view
0download
0
Proceedings of the International Conference on Industrial Engineering and Operations Management
Bandung, Indonesia, March 6-8, 2018
© IEOM Society International
PERT-Type System Application on Food Industry to Reduce
CIP Cycle Time
Rianita Puspa Sari, Razan Nayif Hasanain, Ade Momon Subagyo
Department of Industrial Engineering
State University Of Singaperbangsa Karawang
Karawang, Jawa Barat, Indonesia
[email protected], [email protected], [email protected]
Abstract
Clean in place (CIP) is in site cleaning activity with a purpose to eliminate soils, preventing cross
contamination and food decomposition by bacteria. Hence, CIP activity is a critical step in food processing industry. Unfortunately such activity is considered non-productive because it does not produce
any finished goods, so CIP needs to be done in minimum time. This study aimed to describe and analyze
implementation of PERT-type system model in order to reduce CIP cycle time in food industry. Research
data is obtained from historical data of related party in production situation, with a focus of CIP cycle activity. Observations were also conducted directly on the object of study. Methodology approach began
with non-productive dominant factor sorting, CIP activity elements identification, standard time data
acquisition based on secondary data then followed by time reduction using a PERT-type system in heuristic manner. The results showed that CIP cycle time reduction could be achieved from the initial
state of 330 minutes to 180 minutes per cycle.
Keywords network model, PERT, heuristic
1. Introduction
Network modelling is one of most used form of modelling in operation research because of its wide application and
flexibility in practical situations. The width of its application often is implemented in business situation to increase productivity (Beer, 1967). Critical path map (CPM) as well as program review and evaluation technique (PERT) are
special network model algorithm that is used as decision support system (DSS) (Trietsch & Baker, 2012). CPM is
implemented to sequence a network of activities in deterministic time environment, while PERT model deals with
activities in stochastic condition (Frederick & Lieberman, 2010; Supranto, 2006). More recently, the PERT and
CPM systems have been combined into PERT-type system (Leitch, 1989). This system uses the fundamental
network diagram to graphically depict sequential nature of activities. Such system rises in uses as one of important
tools in industrial situation (Mazlum & Guneri, 2015; Puvanasvaran, 2013). Hence, in a production system, PERT-
type system can be implemented to map activities network. In a cyclic production operation, each type of activity
involved will repeat in a similar manner in term of times and sequence. These characteristics fulfill the requirements
of using PERT-type system model to map the network, provided each activity is interdependent, running in
sequential manner with known duration so the critical path could be identified (Turner, 1993).
Based on observation in food processing industry, there is a machinery and equipment cleaning phase known as CIP (clean in place). CIP is a necessary yet non-productive task of cleaning and sanitizing process equipment to prevent
soils and bacterial contamination due to food processing in a long run, or to prevent cross contamination in different
product processing (Fryer, 2005; Ryther, 2014). This activity is cyclic and comprised of several element of
interdependent activities with certain duration of time to finish the task. These elements build a sequence of activity
with a certain order of execution, and must be done is such sequential order to be finished. Since CIP solely
concentrates on process cleaning, it does not produce any value added goods and must be done in as minimum time
as possible. Moreover based on observation, the total duration of one CIP cycle is 330 minutes. Such cycle repeats
in average of 14 times a month. This total average monthly time of 4620 minutes became Pareto dominant factor of
1158

Proceedings of the International Conference on Industrial Engineering and Operations Management
Bandung, Indonesia, March 6-8, 2018
© IEOM Society International
downtime loss and should be reduced and conversed to productive time, by means of reducing the total elapsed time
per CIP cycle. The unrestricted time then can be used to produce value added goods.
A study of process setup reduction had been done by Puvanasvaran (2013) using CPM/PERT method. Specifically,
Puvanasvaran (2013) used CPM/PERT analysis to reduce process setup time by identifying critical path and
balancing time duration range on each path. This article will show an application of PERT-type system to reduce a cyclic operational condition of CIP activity.
2. Experimental Details
In this study, primary data was obtained based on observation in CIP condition. Secondary data was extracted from
historical data in latest 6 month of running CIP. Data population was cycle time of CIP activity and each individual
activity involved in CIP. Duration (elapsed time) for each element of activity in CIP is a secondary standard time. In one cycle of CIP there are several interdependent activities taking place. Observation was done to determine the
initial sequence of CIP until end point of the cycle. See table 1 below for detailed data of the activities and its
associated duration at initial state.
Table 1. Detailed Activity Data on Initial State
Activity Identity Predecessor Duration
(minutes) Critical Path
1 16 60
2 1 15
3 2 15
4 3 30
5 - 45
6 5 45
7 15 45 Yes
8 7 90 Yes
9 6,21 45
10 9 45
11 - 75
12 1,11 15
13 12 90
14 15 75
15 4,13,19,20,26 60 Yes
16 - 75 Yes
17 16 60 Yes
18 17 60 Yes
19 11,25 90
20 18 75 Yes
21 15 15 Yes
22 21 45 Yes
23 22 75 Yes
24 8,10,14,23 30 Yes
25 1 0
26 25 30
27 15 45
For each activity element, there’s a human operator (resource) involved in getting the task done. Hence, an operator
is resource constraint that determines activity sequencing. A network of PERT-type system was made to represent
the connection between activities with operators performing them at any given time. Two entirely different activities
in nature (location, equipment and movement) cannot be done in parallel by same operator. Though otherwise, two operators can do same activity together at the same time to reduce activity duration, provided it is practically
possible. Time validation was done in one cycle of CIP, with initial cycle time of 330 minutes. This cycle time was
1159
Proceedings of the International Conference on Industrial Engineering and Operations Management
Bandung, Indonesia, March 6-8, 2018
© IEOM Society International
recorded and preserved in historian database. The initial condition critical path was either in activities line 16-17-18-
20-15-7-8-24 or in activities line 16-17-18-20-15-21-22-23-24.
Time reduction was implemented on one or more activity element in CIP activity network. The implementation took
a form of equipment reengineering, administrative change like resource reallocation, procedural improvement, or
activity resequencing. The later was demonstrated by Koo (2007) in his study of resequencing activity in CPM model. Desired CIP cycle time was determined by external party. Improvement iteration was continually done until
desired CIP cycle time achieved. Heuristic approach to reduce setup time was used in this study. Hence, although an
actual time reduction was taking place, optimality is not guaranteed on solving CPM problem in heuristic manner
(Leu and Yang, 1999; Leu et. al. 1999). There was no time/cost trade-off being considered on reducing the path line,
since it is impractical to estimate the probable cost incurred on implementing process improvement on each
activities.
3. Results and Discussion
Observation result indicated there were 27 individual and interdependent activities forming a network of CIP
sequence. Each activity is done by at least one operator, with two different activities cannot be completed under the
same time by one operator, e.g. parallel. These operators are spread on three different production zones; operator A
occupies zone 1, operator B occupies zone 2, and the rest occupies zone 3. At initial condition (fig. 1) there were a
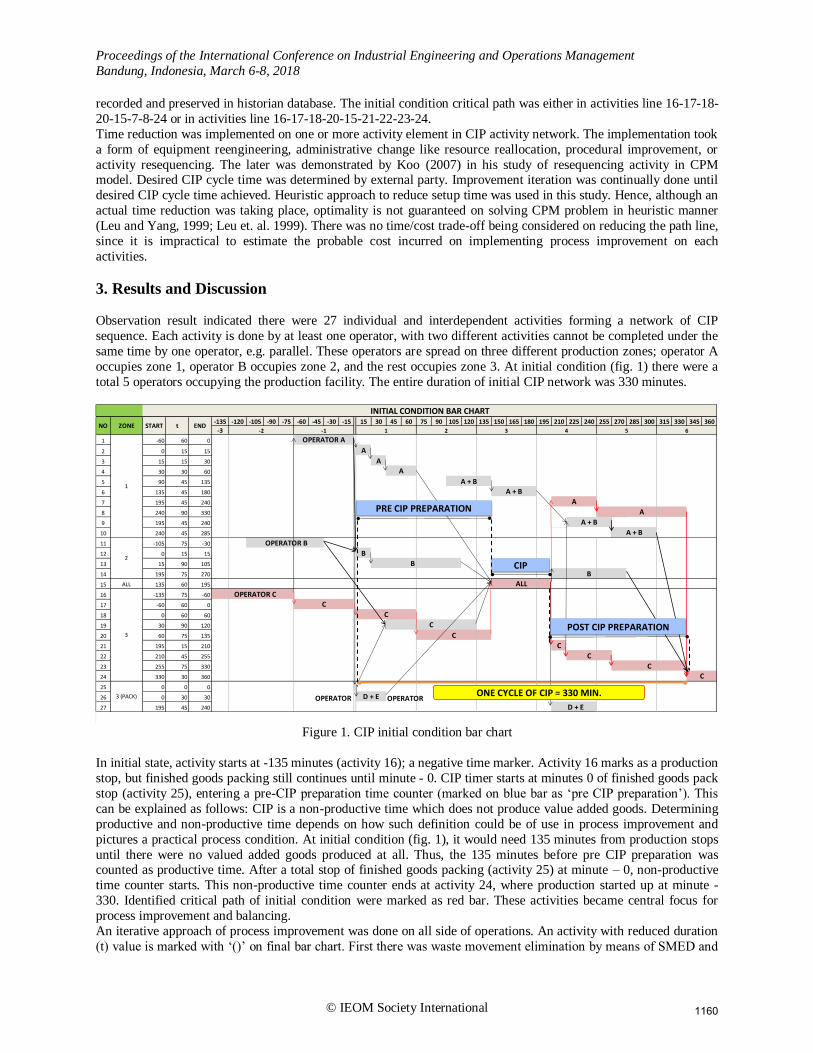
total 5 operators occupying the production facility. The entire duration of initial CIP network was 330 minutes.
Figure 1. CIP initial condition bar chart
In initial state, activity starts at -135 minutes (activity 16); a negative time marker. Activity 16 marks as a production
stop, but finished goods packing still continues until minute - 0. CIP timer starts at minutes 0 of finished goods pack
stop (activity 25), entering a pre-CIP preparation time counter (marked on blue bar as ‘pre CIP preparation’). This
can be explained as follows: CIP is a non-productive time which does not produce value added goods. Determining
productive and non-productive time depends on how such definition could be of use in process improvement and
pictures a practical process condition. At initial condition (fig. 1), it would need 135 minutes from production stops
until there were no valued added goods produced at all. Thus, the 135 minutes before pre CIP preparation was counted as productive time. After a total stop of finished goods packing (activity 25) at minute – 0, non-productive
time counter starts. This non-productive time counter ends at activity 24, where production started up at minute -
330. Identified critical path of initial condition were marked as red bar. These activities became central focus for
process improvement and balancing.
An iterative approach of process improvement was done on all side of operations. An activity with reduced duration
(t) value is marked with ‘()’ on final bar chart. First there was waste movement elimination by means of SMED and
-135 -120 -105 -90 -75 -60 -45 -30 -15 15 30 45 60 75 90 105 120 135 150 165 180 195 210 225 240 255 270 285 300 315 330 345 360
-3
1 -60 60 0
2 0 15 15 A
3 15 15 30 A
4 30 30 60
5 90 45 135 A + B
6 135 45 180
7 195 45 240
8 240 90 330
9 195 45 240
10 240 45 285
11 -105 75 -30 OPERATOR B
12 0 15 15 B
13 15 90 105 B
14 195 75 270 B
15 ALL 135 60 195
16 -135 75 -60 OPERATOR C
17 -60 60 0
18 0 60 60
19 30 90 120
20 60 75 135 C
21 195 15 210 C
22 210 45 255 C
23 255 75 330 C
24 330 30 360
25 0 0 0
26 0 30 30
27 195 45 240 D + E
NO ZONE START t END-1
INITIAL CONDITION BAR CHART
2 3 4 5 6
1
3
3 (PACK)
A + B
2
C
C
-2
OPERATOR A
A
1
A
A
C
ALL
A + B
A + B
D + E
C
PRE CIP PREPARATION
CIP
OPERATOR OPERATORONE CYCLE OF CIP = 330 MIN.
POST CIP PREPARATION
1160

Proceedings of the International Conference on Industrial Engineering and Operations Management
Bandung, Indonesia, March 6-8, 2018
© IEOM Society International
resequencing on activity 17 and 18. Activity 21 was eliminated. Work specialization was implemented for all
operators on all zones by means of work division and work load distribution. Standard operational procedure (SOP)
change allows resequencing of activity 5 and its successors, activity 2 and 12. An additional human resource further
allows resequencing of activity 18, 19, 20, 22 and 23. A reengineering approach on equipment was done allowing an
elimination of activity 21 and simplifying predecessor for activity 9. These changes in all successfully reduced CIP cycle time from 330 minutes to 180 minutes (fig. 2).
Figure 2. CIP final condition bar chart
A comparison of activity duration on initial state against final state is presented in table 2.
Table 2. Detailed Activity Comparison
Activity
Identity
Initial State
Predecessor
Intital State
Duration
(minutes)
Critical
Path
Final State
Predecessor
Final State
Duration
(minutes)
Critical
Path
1 16 60 16 60 Yes
2 1 15 4 15
3 2 15 1 10 Yes
4 3 30 3 20 Yes
5 - 45 - 45
6 5 45 5 45
7 15 45 Yes 15 30 Yes
8 7 90 Yes 7 60 Yes
9 6,21 45 6 45
10 9 45 9 45
11 - 75 - 75
12 1,11 15 13 15
13 12 90 1 30 Yes
14 15 75 15 60
15 4,13,19,20,26 60 Yes 4,13,18,19,20,26 60 Yes
16 - 75 Yes - 75 Yes
17 16 60 Yes 16 45 Yes
-135 -120 -110 -90 -75 -60 -45 -30 -15 15 30 45 60 75 90 105 120 135 150 165 180 195 210 225 240
-3
1 -60 60 0
(2) 30 15 45 A
(3) 0 10 10 A
(4) 10 20 30 A
5 -60 45 -15
6 -15 45 30 A + B
(7) 90 30 120
(8) 120 60 180
(9) 30 45 75 A + B
(10) 75 45 120 A + B
11 -135 75 -60 OPERATOR B
12 30 15 45 B
(13) 0 30 30
(14) 90 60 150 B + F
15 30 60 90 ALL
16 -135 75 -60 OPERATOR C
(17) -60 45 -15 C
(18) -60 45 -15 OPERATOR D
19 -60 60 0
(20) -15 45 30 C
22 90 45 135 C
(23) 90 60 150 D
24 180 30 210
25 0 0 0
26 0 30 30
(27) 90 30 120
1
C
E
-2
FINAL CONDITION BAR CHART
D
A
OPERATOR A
A + B
A
B
E + F
2 3 4No START t END -1
CIP
POST CIP PREPARATION
PRE CIP PREPARATION
ONE CYCLE OF CIP = 180 MIN.OPERATOR
1161
Proceedings of the International Conference on Industrial Engineering and Operations Management
Bandung, Indonesia, March 6-8, 2018
© IEOM Society International
Table 2. Detailed Activity Comparison (continued)
Activity
Identity
Initial State
Predecessor
Intital State
Duration
(minutes)
Critical
Path
Final State
Predecessor
Final State
Duration
(minutes)
Critical
Path
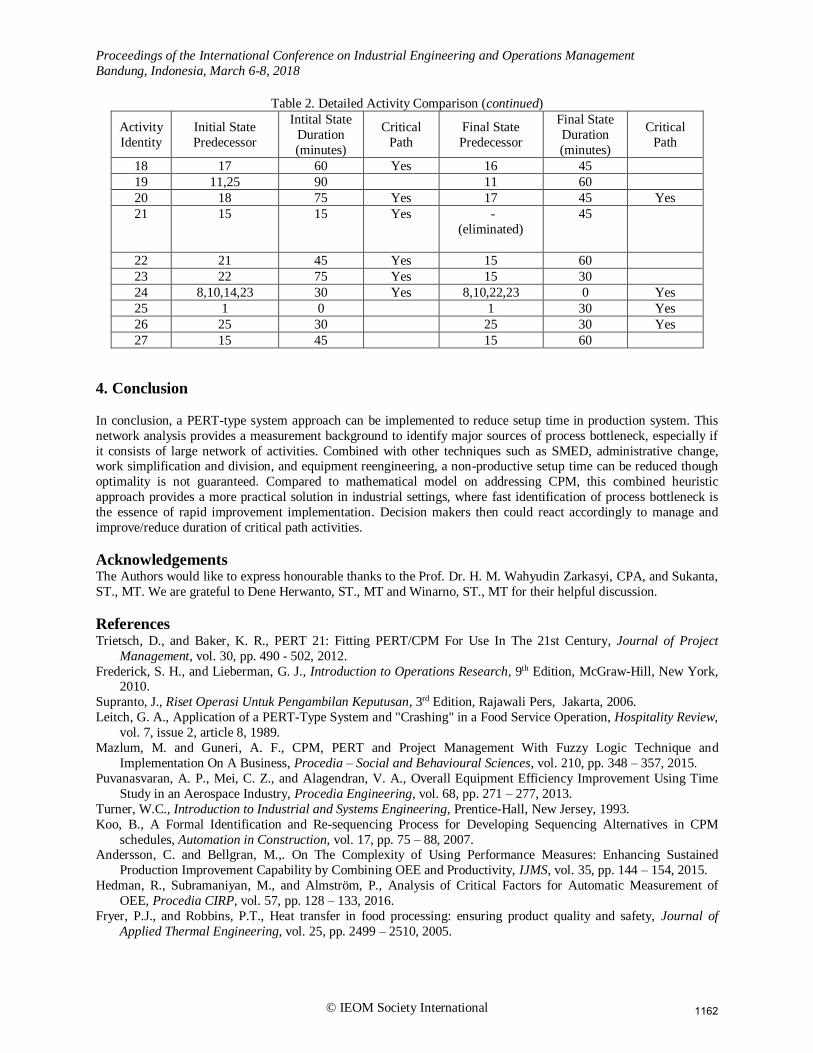
18 17 60 Yes 16 45
19 11,25 90 11 60
20 18 75 Yes 17 45 Yes
21 15 15 Yes - (eliminated)
45
22 21 45 Yes 15 60
23 22 75 Yes 15 30
24 8,10,14,23 30 Yes 8,10,22,23 0 Yes
25 1 0 1 30 Yes
26 25 30 25 30 Yes
27 15 45 15 60
4. Conclusion
In conclusion, a PERT-type system approach can be implemented to reduce setup time in production system. This
network analysis provides a measurement background to identify major sources of process bottleneck, especially if
it consists of large network of activities. Combined with other techniques such as SMED, administrative change, work simplification and division, and equipment reengineering, a non-productive setup time can be reduced though
optimality is not guaranteed. Compared to mathematical model on addressing CPM, this combined heuristic
approach provides a more practical solution in industrial settings, where fast identification of process bottleneck is
the essence of rapid improvement implementation. Decision makers then could react accordingly to manage and
improve/reduce duration of critical path activities.
Acknowledgements The Authors would like to express honourable thanks to the Prof. Dr. H. M. Wahyudin Zarkasyi, CPA, and Sukanta,
ST., MT. We are grateful to Dene Herwanto, ST., MT and Winarno, ST., MT for their helpful discussion.
References Trietsch, D., and Baker, K. R., PERT 21: Fitting PERT/CPM For Use In The 21st Century, Journal of Project
Management, vol. 30, pp. 490 - 502, 2012.
Frederick, S. H., and Lieberman, G. J., Introduction to Operations Research, 9th Edition, McGraw-Hill, New York, 2010.
Supranto, J., Riset Operasi Untuk Pengambilan Keputusan, 3rd Edition, Rajawali Pers, Jakarta, 2006.
Leitch, G. A., Application of a PERT-Type System and "Crashing" in a Food Service Operation, Hospitality Review,
vol. 7, issue 2, article 8, 1989.
Mazlum, M. and Guneri, A. F., CPM, PERT and Project Management With Fuzzy Logic Technique and
Implementation On A Business, Procedia – Social and Behavioural Sciences, vol. 210, pp. 348 – 357, 2015.
Puvanasvaran, A. P., Mei, C. Z., and Alagendran, V. A., Overall Equipment Efficiency Improvement Using Time
Study in an Aerospace Industry, Procedia Engineering, vol. 68, pp. 271 – 277, 2013.
Turner, W.C., Introduction to Industrial and Systems Engineering, Prentice-Hall, New Jersey, 1993.
Koo, B., A Formal Identification and Re-sequencing Process for Developing Sequencing Alternatives in CPM
schedules, Automation in Construction, vol. 17, pp. 75 – 88, 2007. Andersson, C. and Bellgran, M.,. On The Complexity of Using Performance Measures: Enhancing Sustained
Production Improvement Capability by Combining OEE and Productivity, IJMS, vol. 35, pp. 144 – 154, 2015.
Hedman, R., Subramaniyan, M., and Almström, P., Analysis of Critical Factors for Automatic Measurement of
OEE, Procedia CIRP, vol. 57, pp. 128 – 133, 2016.
Fryer, P.J., and Robbins, P.T., Heat transfer in food processing: ensuring product quality and safety, Journal of
Applied Thermal Engineering, vol. 25, pp. 2499 – 2510, 2005.
1162
Proceedings of the International Conference on Industrial Engineering and Operations Management
Bandung, Indonesia, March 6-8, 2018
© IEOM Society International
Ryther, R., Food Technologies: Cleaning and Desinfection Technologies (Clean-In-Place, Clean-Out-of-Place),
Encyclopedia of Food Safety, vol. 3, pp. 149 – 155, 2014.
Leu, S-S., and Yang, C-H., GA-Based Multicriteria Optimal Model For Construction Scheduling, Journal of
Construction Engineering and Management, vol. 125, pp. 420-427, 1999.
Leu, S-S., Chen, A-T., and Yang, C-H., Fuzzy Optimal Model For Resource-Constraint Construction Scheduling, Journal of Computing in Civil Engineering, vol. 13, pp. 207-216, 1999.
Biographies
Rianita Puspa Sari is currently lecturer in Department of Industrial Engineering at State University of
Singaperbangsa Karawang majoring in Industrial Engineering field. She had graduated master degree program from
Bandung Institute of Technology in industrial engineering and management focusing on industry management,
bringing her experience on industry management, corporation strategy, performance management, customer relation,
multivariate analysis and operation research.
Razan Nayif Hasanain is currently a student in Department of Engineering at State Univesity of Singaperbangsa
Karawang majoring in Industrial Engineering field. He also has been working in special chemical company for five
years bringing his experience on production commissioning, project phase transition to operational phase, lean six
sigma and operational excellence.
Ade Momon Subagyo is a lecturer in Departement of Industrial Engineering at State University of Singaperbangsa
Karawang majoring in transportation field. He had graduated with master degree program form Bandung Institute of
Technology in transportation and currently taking doctoral degree program in transportation. His research specialty
including logistics, transportation system, enterprise and organization system design and system modelling.
1163
Copyright © 2022 FDOKUMEN


![PERT]NTHALATVAR KAMARAJAR ARTS COLLEGE](https://static.fdokumen.com/doc/165x107/631b5c8a0255356abc090e7a/pertnthalatvar-kamarajar-arts-college.jpg)
