Personalized medicine in psoriasis: developing a genomic classifier to predict histological response...
8
RESEARCH ARTICLE Open Access Personalized medicine in psoriasis: developing a genomic classifier to predict histological response to Alefacept Mayte Suárez-Fariñas 1,2 , Kejal R Shah 1 , Asifa S Haider 1 , James G Krueger 1 , Michelle A Lowes 1* Abstract Background: Alefacept treatment is highly effective in a select group patients with moderate-to-severe psoriasis, and is an ideal candidate to develop systems to predict who will respond to therapy. A clinical trial of 22 patients with moderate to severe psoriasis treated with alefacept was conducted in 2002-2003, as a mechanism of action study. Patients were classified as responders or non-responders to alefacept based on histological criteria. Results of the original mechanism of action study have been published. Peripheral blood was collected at the start of this clinical trial, and a prior analysis demonstrated that gene expression in PBMCs differed between responders and non-responders, however, the analysis performed could not be used to predict response. Methods: Microarray data from PBMCs of 16 of these patients was analyzed to generate a treatment response classifier. We used a discriminant analysis method that performs sample classification from gene expression data, via “nearest shrunken centroid method”. Centroids are the average gene expression for each gene in each class divided by the within-class standard deviation for that gene. Results: A disease response classifier using 23 genes was created to accurately predict response to alefacept (12.3% error rate). While the genes in this classifier should be considered as a group, some of the individual genes are of great interest, for example, cAMP response element modulator (CREM), v-MAF avian musculoaponeurotic fibrosarcoma oncogene family (MAFF), chloride intracellular channel protein 1 (CLIC1, also called NCC27), NLR family, pyrin domain-containing 1 (NLRP1), and CCL5 (chemokine, cc motif, ligand 5, also called regulated upon activation, normally T expressed, and presumably secreted/RANTES). Conclusions: Although this study is small, and based on analysis of existing microarray data, we demonstrate that a treatment response classifier for alefacept can be created using gene expression of PBMCs in psoriasis. This preliminary study may provide a useful tool to predict response of psoriatic patients to alefacept. Background Developing biomarkers that predict response to therapy is an ambitious goal of modern medicine. This is an aspect of personalized medicine that could transform our ability to treat patients successfully with a particular therapy in a cost-effective manner. Alefacept, an anti- CD2 fusion protein (Amevive, Astellas Pharma), is a bio- logic agent that often induces a remarkably durable remission [1]. However, it produces a PASI 75 response (Psoriasis Area and Severity Index [PASI] response of greater than 75% improvement from baseline) in only approximately 30-50% of patients. Thus alefacept is an excellent example of a treatment that would benefit from being able to predict which patients with psoriasis would respond to this agent, and which patients might not respond. The results of our original mechanism of action study of alefacept have already been published [2,3]. In brief, patients were classified as histologic responders or non- responders, as described in the Methods section. Patients that responded to alefacept showed reductions in tissue gene expression of IFNg, signal transducer and activator of transcription 1 (STAT-1), monokine induced by IFNg (MIG), inducible NO synthase (iNOS), * Correspondence: [email protected] 1 Laboratory for Investigative Dermatology, The Rockefeller University 1230 York Ave, New York, NY, 10065, USA Suárez-Fariñas et al. BMC Dermatology 2010, 10:1 http://www.biomedcentral.com/1471-5945/10/1 © 2010 Suárez-Fariñas et al; licensee BioMed Central Ltd. This is an Open Access article distributed under the terms of the Creative Commons Attribution License (http://creativecommons.org/licenses/by/2.0), which permits unrestricted use, distribution, and reproduction in any medium, provided the original work is properly cited.
-
Upload
rockefeller -
Category
Documents
-
view
0 -
download
0
Transcript of Personalized medicine in psoriasis: developing a genomic classifier to predict histological response...
RESEARCH ARTICLE Open Access
Personalized medicine in psoriasis: developing agenomic classifier to predict histological responseto AlefaceptMayte Suárez-Fariñas1,2, Kejal R Shah1, Asifa S Haider1, James G Krueger1, Michelle A Lowes1*
Abstract
Background: Alefacept treatment is highly effective in a select group patients with moderate-to-severe psoriasis,and is an ideal candidate to develop systems to predict who will respond to therapy. A clinical trial of 22 patientswith moderate to severe psoriasis treated with alefacept was conducted in 2002-2003, as a mechanism of actionstudy. Patients were classified as responders or non-responders to alefacept based on histological criteria. Results ofthe original mechanism of action study have been published. Peripheral blood was collected at the start of thisclinical trial, and a prior analysis demonstrated that gene expression in PBMCs differed between responders andnon-responders, however, the analysis performed could not be used to predict response.
Methods: Microarray data from PBMCs of 16 of these patients was analyzed to generate a treatment responseclassifier. We used a discriminant analysis method that performs sample classification from gene expression data,via “nearest shrunken centroid method”. Centroids are the average gene expression for each gene in each classdivided by the within-class standard deviation for that gene.
Results: A disease response classifier using 23 genes was created to accurately predict response to alefacept(12.3% error rate). While the genes in this classifier should be considered as a group, some of the individual genesare of great interest, for example, cAMP response element modulator (CREM), v-MAF avian musculoaponeuroticfibrosarcoma oncogene family (MAFF), chloride intracellular channel protein 1 (CLIC1, also called NCC27), NLRfamily, pyrin domain-containing 1 (NLRP1), and CCL5 (chemokine, cc motif, ligand 5, also called regulated uponactivation, normally T expressed, and presumably secreted/RANTES).
Conclusions: Although this study is small, and based on analysis of existing microarray data, we demonstrate thata treatment response classifier for alefacept can be created using gene expression of PBMCs in psoriasis. Thispreliminary study may provide a useful tool to predict response of psoriatic patients to alefacept.
BackgroundDeveloping biomarkers that predict response to therapyis an ambitious goal of modern medicine. This is anaspect of personalized medicine that could transformour ability to treat patients successfully with a particulartherapy in a cost-effective manner. Alefacept, an anti-CD2 fusion protein (Amevive, Astellas Pharma), is a bio-logic agent that often induces a remarkably durableremission [1]. However, it produces a PASI 75 response(Psoriasis Area and Severity Index [PASI] response of
greater than 75% improvement from baseline) in onlyapproximately 30-50% of patients. Thus alefacept is anexcellent example of a treatment that would benefitfrom being able to predict which patients with psoriasiswould respond to this agent, and which patients mightnot respond.The results of our original mechanism of action study
of alefacept have already been published [2,3]. In brief,patients were classified as histologic responders or non-responders, as described in the Methods section.Patients that responded to alefacept showed reductionsin tissue gene expression of IFNg, signal transducer andactivator of transcription 1 (STAT-1), monokineinduced by IFNg (MIG), inducible NO synthase (iNOS),
* Correspondence: [email protected] for Investigative Dermatology, The Rockefeller University 1230York Ave, New York, NY, 10065, USA
Suárez-Fariñas et al. BMC Dermatology 2010, 10:1http://www.biomedcentral.com/1471-5945/10/1
© 2010 Suárez-Fariñas et al; licensee BioMed Central Ltd. This is an Open Access article distributed under the terms of the CreativeCommons Attribution License (http://creativecommons.org/licenses/by/2.0), which permits unrestricted use, distribution, andreproduction in any medium, provided the original work is properly cited.
IL-8, and IL-23, as well as myeloid DCs (measured byimmunohistochemistry for CD11c+ and CD83+ cells). Asalefacept bound primarily to T cells and not DCs, wesuggested that T cells were the primary target for ther-apy, but that DCs and a spectrum of type 1 inflamma-tory genes were coordinately suppressed. Furthermore,we demonstrated by FACS of PBMCs that in allpatients, alefacept treatment caused a preferentialdecrease in effector memory T cells (CCR7- CD45RA-)for both CD4+ and CD8+ T effector memory cells. Incontrast, central memory T cells (CCR7+CD45RA-) wereless affected, and naïve T cells (CCR7+CD45RA+) wererelatively spared. Circulating CD8+ effector T cells andType 1 T cells (IFN-g-producing) were also significantlyreduced [2,3].The primary mechanism of action of alefacept is consid-
ered to be by killing CD2+ T cells by a cytotoxic mechan-ism (involving NK cell bridging), or by blocking CD2signaling [4,5]. In a previous study [6], our group estab-lished a new therapeutic mechanism for alefacept in psor-iasis, as it also serves as an agonist for CD2 and inducespositive T cell signaling responses. In this study, we ana-lyzed genomic expression of circulating PBMCs, compar-ing baseline versus 24 hour time-point. During the firstday of treatment in PBMCs, there was suppression ofinflammatory genes, but perhaps surprisingly, a markedinduction of mRNAs for STAT1, IL-8, and MIG. Theseagonistic effects of alefacept in PBMC were confirmed invitro. These data demonstrated that alefacept activatesgene expression in leukocytes and suggested that its thera-peutic action may be as a mixed agonist/antagonist.These findings suggested that differential activation of
genes may categorize clinical responders to alefacept,and gave the first indication of differences in the pre-treatment circulating leukocytes in responders and non-responders. Thus these results led us to ask whetherbaseline gene expression in PBMCs might be used toclassify responders versus non-responders and predict apriori who would respond to alefacept. This would havea dual benefit, allowing those responders to receivetreatment with confidence, and sparing those whowould not respond the cost, potential serious immuno-suppressive effects and inconvenience of a course oftherapy. The aim of this study was to mine our existinggenomic data using alternative, previously developedanalytic methods to generate a “genomic classifier” [7], aset of genes that could specifically predict response toalefacept. This “genomic classifier” could then be testedin a prospective clinical trial of alefacept in psoriasis.Genomic expression profiles have been successfully
used for disease classification and to predict response totreatment. In a seminal paper in 1999, Golub et aldemonstrated that the type of haematological malig-nancy could be determined by class prediction using
microarray data [8]. Since then, other investigators haveshown that genomic patterns of expression could beused to predict the progression and prognosis of cancer[9]. Gene expression profiling of neoplastic tissue hasbeen performed to develop a genomic classifier forresponse to a chemotherapy regimen for patients withadvance colorectal cancer [10], or doxorubicin sensitivityin gastric cancers [11]. Genomic classifiers have alsobeen developed in breast cancer to predict tamoxifen-resistance [12], and docetaxel response [13]. In chronicinflammation such as rheumatoid arthritis, response toetanercept (Enbrel, TNF-inhibitor) could be predictedby a genomic classifier consisting of specific combina-tions of gene doublets and triplets [14].
MethodsClinical trialAn IRB-approved clinical trial was conducted at Rocke-feller University in 2002-2003, treating 22 patients withmoderate-to-severe psoriasis with alefacept (7.5-mgweekly i.v. ×12 weeks). The initial aim of the clinicaltrial was to conduct a mechanism of action study, andthe study was powered to produce groups of at least sixpatients that could be designated as responders versusnon-responders (as defined below) to alefacept. Patientswere recruited from local dermatologists, and by IRB-approved radio and print advertisements. 19 males and3 females, (ages 29-68 years, median 49 years) wereenrolled. Major inclusion criteria were: involvement ofpsoriasis vulgaris of >10% body surface area, no systemictreatment for at least 4 weeks before entering the study,no significant infections or immunosuppression, and nosignificant renal, hepatic, or other medical disease.Informed consent was obtained. The results of tissueanalysis and peripheral blood analysis describing themechanism of action of this biologic agent have alreadybeen published [2,3], and are discussed in the Back-ground section.Tissue samples were collected before and during the
trial at baseline (non-lesional and lesional), week 2,week 6 and week 13. The patients were categorized asresponders or non-responders based on histologicalchanges in their skin biopsies over the course of theclinical trial (Figure 1) [2]. Histological response of psor-iatic lesions was defined as normalization of keratin 16(K16) expression, reduction of epidermal hyperplasia,restoration of a granular layer, and orthokeratosis inweek-13 biopsies. Overall, 22 patients were enrolled, 2dropped out due to non-response. 12 patients were clas-sified as responders, and 10 as non-responders (8patients were categorized as non-responders based onhistological analysis, 10 patients were non-respondersbased on intent-to-treat). High quality microarray datawere available on 9 responders and 7 non-responders.
Suárez-Fariñas et al. BMC Dermatology 2010, 10:1http://www.biomedcentral.com/1471-5945/10/1
Page 2 of 8
Processing of specimens for microarrayInitial microarray data from PBMCs of these patientshas been published [6]. Briefly, peripheral blood drawswere taken before alefacept administration. PBMCs wereisolated and stored at -80°C, until required. Pre-treat-ment RNA was extracted, and hybridized to HGU95Av2Affymetrix Gene Chip containing probe sets represent-ing 12,000 genes, using standard methods.
Quality Control, Pre-processing and FilteringGene Chip CEL files were scrutinized for spatial arte-facts using Harshlight package https://mustat.rockefeller.edu/harshlight[15]. Intensity values (CEL files) were pre-processed to obtained expression values using GCRMAalgorithm. Expression values were filtered to eliminateprobe sets with low variation or low intensity. Probesets with standard deviation greater than 0.3, andexpression values greater than 3 in at least 1 sample,were kept for further analysis, leaving a total of 5218probe sets. Genes were annotated using up-to dateannotation from of HGU95av2 chips available at Bio-conductor. The data discussed in this publication havebeen deposited in NCBI’s Gene Expression Omnibusand are accessible through GEO Series accession num-ber (GSE18948).
Discriminant AnalysisWe used a discriminant analysis method that performssample classification from gene expression data, via“nearest shrunken centroid method” [7]. This method isa modification of the conventional nearest centroid
method [16], where centroids for each gene (averagegene expression for the gene in each class) are dividedby the within-class standard deviation in order to givemore weight to genes with smaller variations acrosssamples in the same class. Then, for prediction, everynew sample is classified based on the gene expressionprofile of the sample by the following prediction rule:The class whose centroid is closest (by euclidean dis-tance) to the gene expression profile of the sample isthe predicted class for that new sample.Nearest shrunken centroid classification makes one
important modification to conventional nearest centroidclassification. It “shrinks” each of the class centroidstoward the overall centroid for all classes by an amountcalled the “threshold”. This shrinkage consists of movingthe centroid towards zero by threshold, setting it equalto zero if it hits zero: i.e if threshold = 2, a centroid of3.2 would be shrunk to 1.2 and a centroid of 1.2 wouldbe shrunk to zero. After shrinking the centroids, thenew sample is classified by the prediction rule of thenearest centroid method (see above), but using theshrunken class centroids. This method has two advan-tages: it can make the classifier more accurate by redu-cing the effect of noisy genes, and it performs automaticgene selection. If a gene is shrunk to zero for all classes,then it is eliminated from the classifier. Alternatively, itmay be set to zero for all classes except one, indicatingthat high or low expression for that gene characterizesthat class.The value of the threshold (which determines the
number of genes in the final classifier) is set by the user
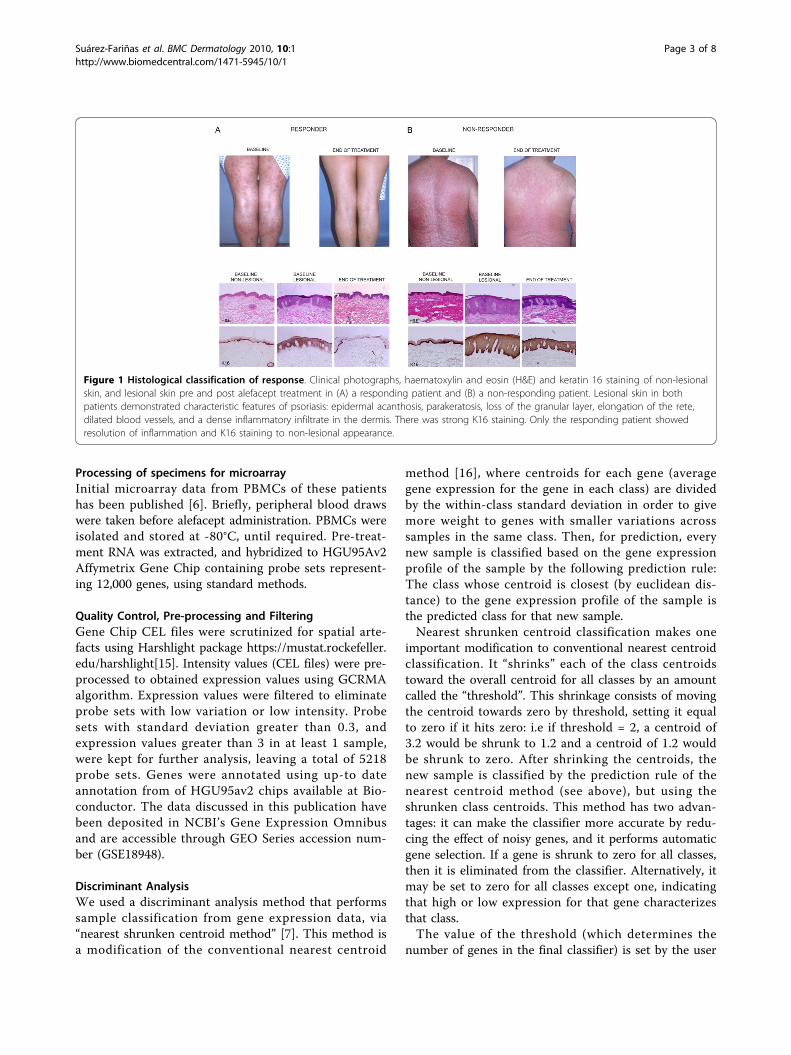
Figure 1 Histological classification of response. Clinical photographs, haematoxylin and eosin (H&E) and keratin 16 staining of non-lesionalskin, and lesional skin pre and post alefacept treatment in (A) a responding patient and (B) a non-responding patient. Lesional skin in bothpatients demonstrated characteristic features of psoriasis: epidermal acanthosis, parakeratosis, loss of the granular layer, elongation of the rete,dilated blood vessels, and a dense inflammatory infiltrate in the dermis. There was strong K16 staining. Only the responding patient showedresolution of inflammation and K16 staining to non-lesional appearance.
Suárez-Fariñas et al. BMC Dermatology 2010, 10:1http://www.biomedcentral.com/1471-5945/10/1
Page 3 of 8
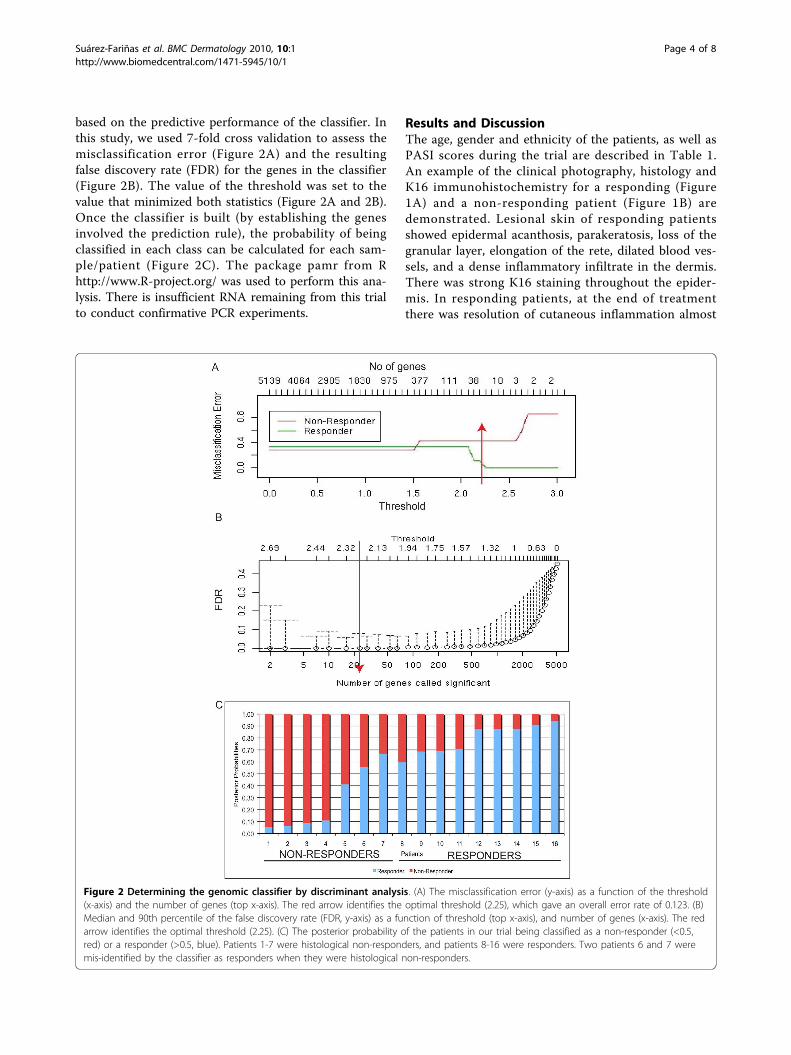
based on the predictive performance of the classifier. Inthis study, we used 7-fold cross validation to assess themisclassification error (Figure 2A) and the resultingfalse discovery rate (FDR) for the genes in the classifier(Figure 2B). The value of the threshold was set to thevalue that minimized both statistics (Figure 2A and 2B).Once the classifier is built (by establishing the genesinvolved the prediction rule), the probability of beingclassified in each class can be calculated for each sam-ple/patient (Figure 2C). The package pamr from Rhttp://www.R-project.org/ was used to perform this ana-lysis. There is insufficient RNA remaining from this trialto conduct confirmative PCR experiments.
Results and DiscussionThe age, gender and ethnicity of the patients, as well asPASI scores during the trial are described in Table 1.An example of the clinical photography, histology andK16 immunohistochemistry for a responding (Figure1A) and a non-responding patient (Figure 1B) aredemonstrated. Lesional skin of responding patientsshowed epidermal acanthosis, parakeratosis, loss of thegranular layer, elongation of the rete, dilated blood ves-sels, and a dense inflammatory infiltrate in the dermis.There was strong K16 staining throughout the epider-mis. In responding patients, at the end of treatmentthere was resolution of cutaneous inflammation almost
Figure 2 Determining the genomic classifier by discriminant analysis. (A) The misclassification error (y-axis) as a function of the threshold(x-axis) and the number of genes (top x-axis). The red arrow identifies the optimal threshold (2.25), which gave an overall error rate of 0.123. (B)Median and 90th percentile of the false discovery rate (FDR, y-axis) as a function of threshold (top x-axis), and number of genes (x-axis). The redarrow identifies the optimal threshold (2.25). (C) The posterior probability of the patients in our trial being classified as a non-responder (<0.5,red) or a responder (>0.5, blue). Patients 1-7 were histological non-responders, and patients 8-16 were responders. Two patients 6 and 7 weremis-identified by the classifier as responders when they were histological non-responders.
Suárez-Fariñas et al. BMC Dermatology 2010, 10:1http://www.biomedcentral.com/1471-5945/10/1
Page 4 of 8
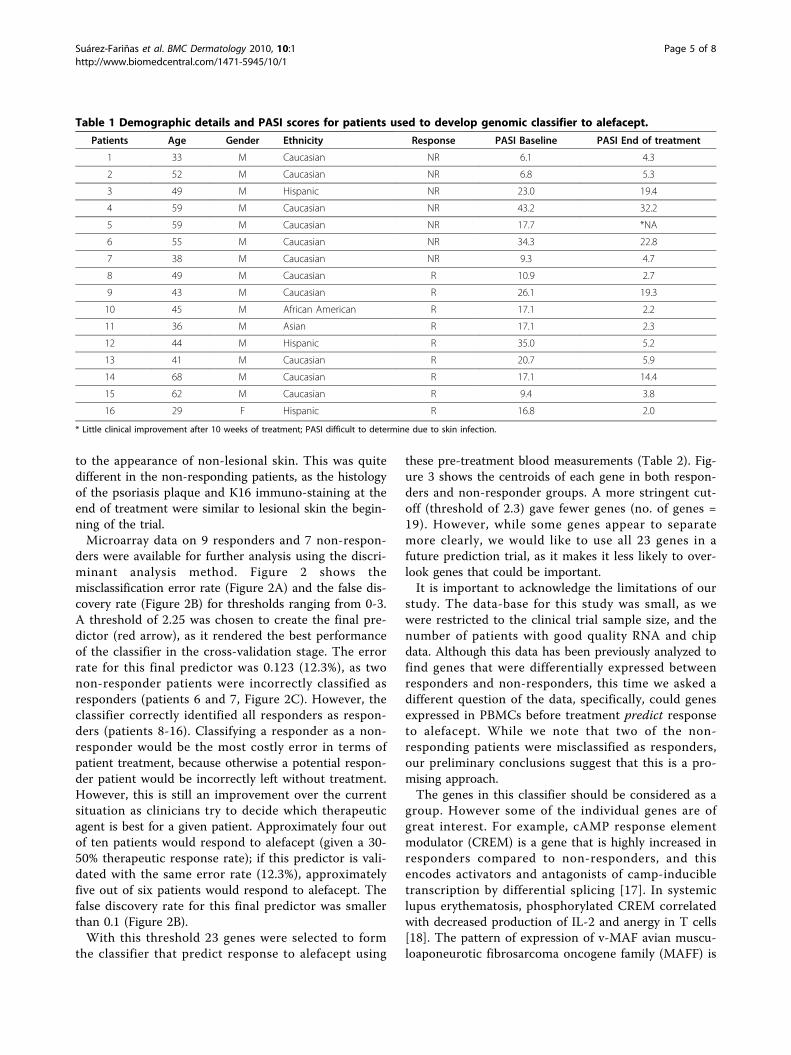
to the appearance of non-lesional skin. This was quitedifferent in the non-responding patients, as the histologyof the psoriasis plaque and K16 immuno-staining at theend of treatment were similar to lesional skin the begin-ning of the trial.Microarray data on 9 responders and 7 non-respon-
ders were available for further analysis using the discri-minant analysis method. Figure 2 shows themisclassification error rate (Figure 2A) and the false dis-covery rate (Figure 2B) for thresholds ranging from 0-3.A threshold of 2.25 was chosen to create the final pre-dictor (red arrow), as it rendered the best performanceof the classifier in the cross-validation stage. The errorrate for this final predictor was 0.123 (12.3%), as twonon-responder patients were incorrectly classified asresponders (patients 6 and 7, Figure 2C). However, theclassifier correctly identified all responders as respon-ders (patients 8-16). Classifying a responder as a non-responder would be the most costly error in terms ofpatient treatment, because otherwise a potential respon-der patient would be incorrectly left without treatment.However, this is still an improvement over the currentsituation as clinicians try to decide which therapeuticagent is best for a given patient. Approximately four outof ten patients would respond to alefacept (given a 30-50% therapeutic response rate); if this predictor is vali-dated with the same error rate (12.3%), approximatelyfive out of six patients would respond to alefacept. Thefalse discovery rate for this final predictor was smallerthan 0.1 (Figure 2B).With this threshold 23 genes were selected to form
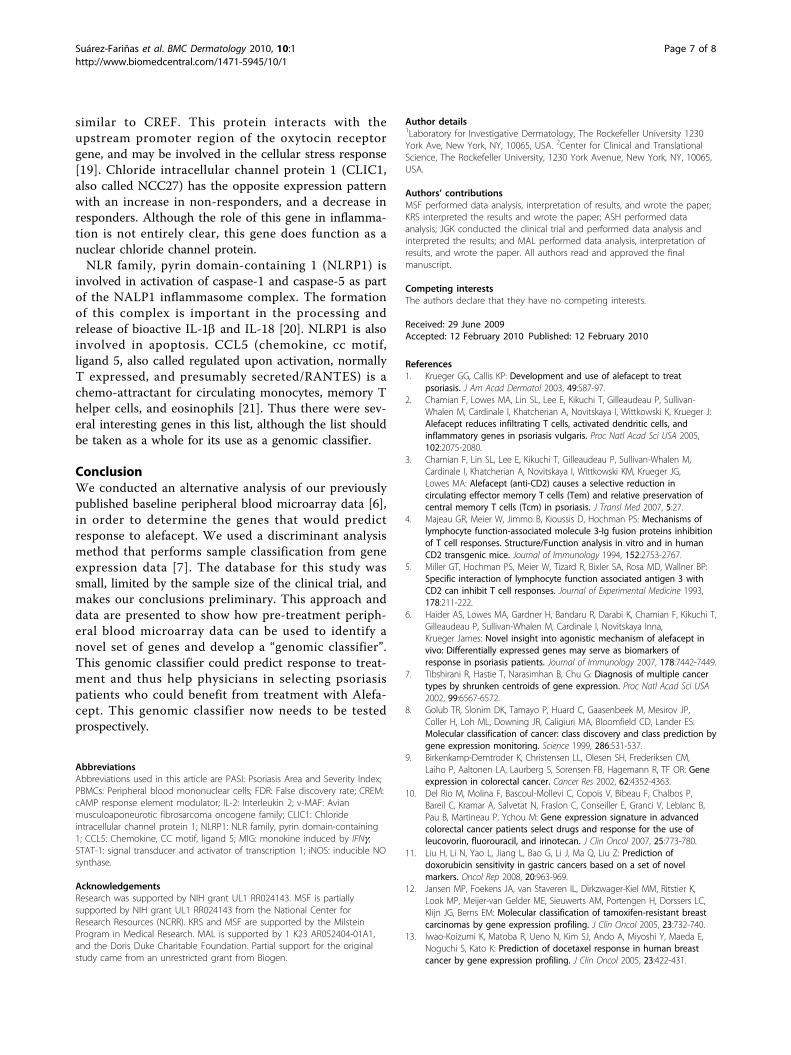
the classifier that predict response to alefacept using
these pre-treatment blood measurements (Table 2). Fig-ure 3 shows the centroids of each gene in both respon-ders and non-responder groups. A more stringent cut-off (threshold of 2.3) gave fewer genes (no. of genes =19). However, while some genes appear to separatemore clearly, we would like to use all 23 genes in afuture prediction trial, as it makes it less likely to over-look genes that could be important.It is important to acknowledge the limitations of our
study. The data-base for this study was small, as wewere restricted to the clinical trial sample size, and thenumber of patients with good quality RNA and chipdata. Although this data has been previously analyzed tofind genes that were differentially expressed betweenresponders and non-responders, this time we asked adifferent question of the data, specifically, could genesexpressed in PBMCs before treatment predict responseto alefacept. While we note that two of the non-responding patients were misclassified as responders,our preliminary conclusions suggest that this is a pro-mising approach.The genes in this classifier should be considered as a
group. However some of the individual genes are ofgreat interest. For example, cAMP response elementmodulator (CREM) is a gene that is highly increased inresponders compared to non-responders, and thisencodes activators and antagonists of camp-inducibletranscription by differential splicing [17]. In systemiclupus erythematosis, phosphorylated CREM correlatedwith decreased production of IL-2 and anergy in T cells[18]. The pattern of expression of v-MAF avian muscu-loaponeurotic fibrosarcoma oncogene family (MAFF) is
Table 1 Demographic details and PASI scores for patients used to develop genomic classifier to alefacept.
Patients Age Gender Ethnicity Response PASI Baseline PASI End of treatment
1 33 M Caucasian NR 6.1 4.3
2 52 M Caucasian NR 6.8 5.3
3 49 M Hispanic NR 23.0 19.4
4 59 M Caucasian NR 43.2 32.2
5 59 M Caucasian NR 17.7 *NA
6 55 M Caucasian NR 34.3 22.8
7 38 M Caucasian NR 9.3 4.7
8 49 M Caucasian R 10.9 2.7
9 43 M Caucasian R 26.1 19.3
10 45 M African American R 17.1 2.2
11 36 M Asian R 17.1 2.3
12 44 M Hispanic R 35.0 5.2
13 41 M Caucasian R 20.7 5.9
14 68 M Caucasian R 17.1 14.4
15 62 M Caucasian R 9.4 3.8
16 29 F Hispanic R 16.8 2.0
* Little clinical improvement after 10 weeks of treatment; PASI difficult to determine due to skin infection.
Suárez-Fariñas et al. BMC Dermatology 2010, 10:1http://www.biomedcentral.com/1471-5945/10/1
Page 5 of 8
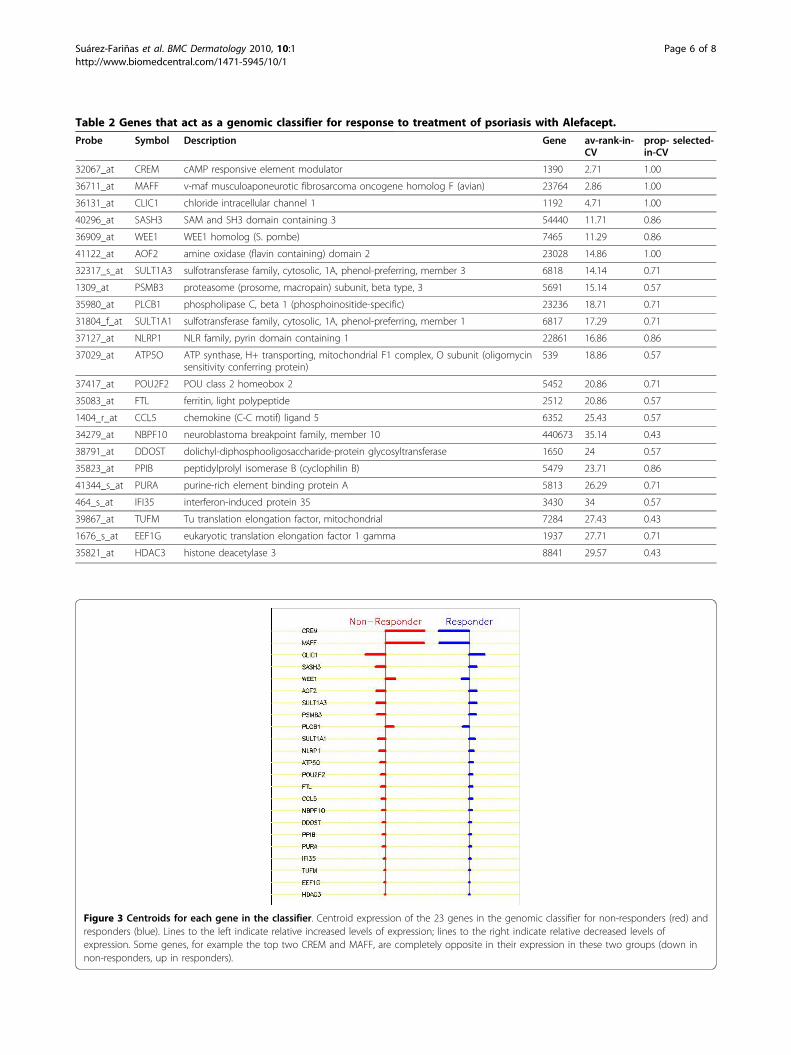
Table 2 Genes that act as a genomic classifier for response to treatment of psoriasis with Alefacept.
Probe Symbol Description Gene av-rank-in-CV
prop- selected-in-CV
32067_at CREM cAMP responsive element modulator 1390 2.71 1.00
36711_at MAFF v-maf musculoaponeurotic fibrosarcoma oncogene homolog F (avian) 23764 2.86 1.00
36131_at CLIC1 chloride intracellular channel 1 1192 4.71 1.00
40296_at SASH3 SAM and SH3 domain containing 3 54440 11.71 0.86
36909_at WEE1 WEE1 homolog (S. pombe) 7465 11.29 0.86
41122_at AOF2 amine oxidase (flavin containing) domain 2 23028 14.86 1.00
32317_s_at SULT1A3 sulfotransferase family, cytosolic, 1A, phenol-preferring, member 3 6818 14.14 0.71
1309_at PSMB3 proteasome (prosome, macropain) subunit, beta type, 3 5691 15.14 0.57
35980_at PLCB1 phospholipase C, beta 1 (phosphoinositide-specific) 23236 18.71 0.71
31804_f_at SULT1A1 sulfotransferase family, cytosolic, 1A, phenol-preferring, member 1 6817 17.29 0.71
37127_at NLRP1 NLR family, pyrin domain containing 1 22861 16.86 0.86
37029_at ATP5O ATP synthase, H+ transporting, mitochondrial F1 complex, O subunit (oligomycinsensitivity conferring protein)
539 18.86 0.57
37417_at POU2F2 POU class 2 homeobox 2 5452 20.86 0.71
35083_at FTL ferritin, light polypeptide 2512 20.86 0.57
1404_r_at CCL5 chemokine (C-C motif) ligand 5 6352 25.43 0.57
34279_at NBPF10 neuroblastoma breakpoint family, member 10 440673 35.14 0.43
38791_at DDOST dolichyl-diphosphooligosaccharide-protein glycosyltransferase 1650 24 0.57
35823_at PPIB peptidylprolyl isomerase B (cyclophilin B) 5479 23.71 0.86
41344_s_at PURA purine-rich element binding protein A 5813 26.29 0.71
464_s_at IFI35 interferon-induced protein 35 3430 34 0.57
39867_at TUFM Tu translation elongation factor, mitochondrial 7284 27.43 0.43
1676_s_at EEF1G eukaryotic translation elongation factor 1 gamma 1937 27.71 0.71
35821_at HDAC3 histone deacetylase 3 8841 29.57 0.43
Figure 3 Centroids for each gene in the classifier. Centroid expression of the 23 genes in the genomic classifier for non-responders (red) andresponders (blue). Lines to the left indicate relative increased levels of expression; lines to the right indicate relative decreased levels ofexpression. Some genes, for example the top two CREM and MAFF, are completely opposite in their expression in these two groups (down innon-responders, up in responders).
Suárez-Fariñas et al. BMC Dermatology 2010, 10:1http://www.biomedcentral.com/1471-5945/10/1
Page 6 of 8
similar to CREF. This protein interacts with theupstream promoter region of the oxytocin receptorgene, and may be involved in the cellular stress response[19]. Chloride intracellular channel protein 1 (CLIC1,also called NCC27) has the opposite expression patternwith an increase in non-responders, and a decrease inresponders. Although the role of this gene in inflamma-tion is not entirely clear, this gene does function as anuclear chloride channel protein.NLR family, pyrin domain-containing 1 (NLRP1) is
involved in activation of caspase-1 and caspase-5 as partof the NALP1 inflammasome complex. The formationof this complex is important in the processing andrelease of bioactive IL-1b and IL-18 [20]. NLRP1 is alsoinvolved in apoptosis. CCL5 (chemokine, cc motif,ligand 5, also called regulated upon activation, normallyT expressed, and presumably secreted/RANTES) is achemo-attractant for circulating monocytes, memory Thelper cells, and eosinophils [21]. Thus there were sev-eral interesting genes in this list, although the list shouldbe taken as a whole for its use as a genomic classifier.
ConclusionWe conducted an alternative analysis of our previouslypublished baseline peripheral blood microarray data [6],in order to determine the genes that would predictresponse to alefacept. We used a discriminant analysismethod that performs sample classification from geneexpression data [7]. The database for this study wassmall, limited by the sample size of the clinical trial, andmakes our conclusions preliminary. This approach anddata are presented to show how pre-treatment periph-eral blood microarray data can be used to identify anovel set of genes and develop a “genomic classifier”.This genomic classifier could predict response to treat-ment and thus help physicians in selecting psoriasispatients who could benefit from treatment with Alefa-cept. This genomic classifier now needs to be testedprospectively.
AbbreviationsAbbreviations used in this article are PASI: Psoriasis Area and Severity Index;PBMCs: Peripheral blood mononuclear cells; FDR: False discovery rate; CREM:cAMP response element modulator; IL-2: Interleukin 2; v-MAF: Avianmusculoaponeurotic fibrosarcoma oncogene family; CLIC1: Chlorideintracellular channel protein 1; NLRP1: NLR family, pyrin domain-containing1; CCL5: Chemokine, CC motif, ligand 5; MIG: monokine induced by IFNg;STAT-1: signal transducer and activator of transcription 1; iNOS: inducible NOsynthase.
AcknowledgementsResearch was supported by NIH grant UL1 RR024143. MSF is partiallysupported by NIH grant UL1 RR024143 from the National Center forResearch Resources (NCRR). KRS and MSF are supported by the MilsteinProgram in Medical Research. MAL is supported by 1 K23 AR052404-01A1,and the Doris Duke Charitable Foundation. Partial support for the originalstudy came from an unrestricted grant from Biogen.
Author details1Laboratory for Investigative Dermatology, The Rockefeller University 1230York Ave, New York, NY, 10065, USA. 2Center for Clinical and TranslationalScience, The Rockefeller University, 1230 York Avenue, New York, NY, 10065,USA.
Authors’ contributionsMSF performed data analysis, interpretation of results, and wrote the paper;KRS interpreted the results and wrote the paper; ASH performed dataanalysis; JGK conducted the clinical trial and performed data analysis andinterpreted the results; and MAL performed data analysis, interpretation ofresults, and wrote the paper. All authors read and approved the finalmanuscript.
Competing interestsThe authors declare that they have no competing interests.
Received: 29 June 2009Accepted: 12 February 2010 Published: 12 February 2010
References1. Krueger GG, Callis KP: Development and use of alefacept to treat
psoriasis. J Am Acad Dermatol 2003, 49:S87-97.2. Chamian F, Lowes MA, Lin SL, Lee E, Kikuchi T, Gilleaudeau P, Sullivan-
Whalen M, Cardinale I, Khatcherian A, Novitskaya I, Wittkowski K, Krueger J:Alefacept reduces infiltrating T cells, activated dendritic cells, andinflammatory genes in psoriasis vulgaris. Proc Natl Acad Sci USA 2005,102:2075-2080.
3. Chamian F, Lin SL, Lee E, Kikuchi T, Gilleaudeau P, Sullivan-Whalen M,Cardinale I, Khatcherian A, Novitskaya I, Wittkowski KM, Krueger JG,Lowes MA: Alefacept (anti-CD2) causes a selective reduction incirculating effector memory T cells (Tem) and relative preservation ofcentral memory T cells (Tcm) in psoriasis. J Transl Med 2007, 5:27.
4. Majeau GR, Meier W, Jimmo B, Kioussis D, Hochman PS: Mechanisms oflymphocyte function-associated molecule 3-Ig fusion proteins inhibitionof T cell responses. Structure/Function analysis in vitro and in humanCD2 transgenic mice. Journal of Immunology 1994, 152:2753-2767.
5. Miller GT, Hochman PS, Meier W, Tizard R, Bixler SA, Rosa MD, Wallner BP:Specific interaction of lymphocyte function associated antigen 3 withCD2 can inhibit T cell responses. Journal of Experimental Medicine 1993,178:211-222.
6. Haider AS, Lowes MA, Gardner H, Bandaru R, Darabi K, Chamian F, Kikuchi T,Gilleaudeau P, Sullivan-Whalen M, Cardinale I, Novitskaya Inna,Krueger James: Novel insight into agonistic mechanism of alefacept invivo: Differentially expressed genes may serve as biomarkers ofresponse in psoriasis patients. Journal of Immunology 2007, 178:7442-7449.
7. Tibshirani R, Hastie T, Narasimhan B, Chu G: Diagnosis of multiple cancertypes by shrunken centroids of gene expression. Proc Natl Acad Sci USA2002, 99:6567-6572.
8. Golub TR, Slonim DK, Tamayo P, Huard C, Gaasenbeek M, Mesirov JP,Coller H, Loh ML, Downing JR, Caligiuri MA, Bloomfield CD, Lander ES:Molecular classification of cancer: class discovery and class prediction bygene expression monitoring. Science 1999, 286:531-537.
9. Birkenkamp-Demtroder K, Christensen LL, Olesen SH, Frederiksen CM,Laiho P, Aaltonen LA, Laurberg S, Sorensen FB, Hagemann R, TF OR: Geneexpression in colorectal cancer. Cancer Res 2002, 62:4352-4363.
10. Del Rio M, Molina F, Bascoul-Mollevi C, Copois V, Bibeau F, Chalbos P,Bareil C, Kramar A, Salvetat N, Fraslon C, Conseiller E, Granci V, Leblanc B,Pau B, Martineau P, Ychou M: Gene expression signature in advancedcolorectal cancer patients select drugs and response for the use ofleucovorin, fluorouracil, and irinotecan. J Clin Oncol 2007, 25:773-780.
11. Liu H, Li N, Yao L, Jiang L, Bao G, Li J, Ma Q, Liu Z: Prediction ofdoxorubicin sensitivity in gastric cancers based on a set of novelmarkers. Oncol Rep 2008, 20:963-969.
12. Jansen MP, Foekens JA, van Staveren IL, Dirkzwager-Kiel MM, Ritstier K,Look MP, Meijer-van Gelder ME, Sieuwerts AM, Portengen H, Dorssers LC,Klijn JG, Berns EM: Molecular classification of tamoxifen-resistant breastcarcinomas by gene expression profiling. J Clin Oncol 2005, 23:732-740.
13. Iwao-Koizumi K, Matoba R, Ueno N, Kim SJ, Ando A, Miyoshi Y, Maeda E,Noguchi S, Kato K: Prediction of docetaxel response in human breastcancer by gene expression profiling. J Clin Oncol 2005, 23:422-431.
Suárez-Fariñas et al. BMC Dermatology 2010, 10:1http://www.biomedcentral.com/1471-5945/10/1
Page 7 of 8
14. Koczan D, Drynda S, Hecker M, Drynda A, Guthke R, Kekow J, Thiesen HJ:Molecular discrimination of responders and nonresponders to anti-TNFalpha therapy in rheumatoid arthritis by etanercept. Arthritis Res Ther2008, 10:R50.
15. Suarez-Farinas M, Pellegrino M, Wittkowski KM, Magnasco MO: Harshlight: a“corrective make-up” program for microarray chips. BMC Bioinformatics2005, 6:294.
16. Hastie T, Tibshirani R, Friedman J: The Elements of Statistical Learning: DataMining, Inference, and Prediction New York: Springer-Verlag, Second 2009.
17. Molina CA, Foulkes NS, Lalli E, Sassone-Corsi P: Inducibility and negativeautoregulation of CREM: an alternative promoter directs the expressionof ICER, an early response repressor. Cell 1993, 75:875-886.
18. Solomou EE, Juang YT, Gourley MF, Kammer GM, Tsokos GC: Molecularbasis of deficient IL-2 production in T cells from patients with systemiclupus erythematosus. J Immunol 2001, 166:4216-4222.
19. Inoue T, Kimura T, Azuma C, Inazawa J, Takemura M, Kikuchi T, Kubota Y,Ogita K, Saji F: Structural organization of the human oxytocin receptorgene. J Biol Chem 1994, 269:32451-32456.
20. Ye Z, Ting JP: NLR, the nucleotide-binding domain leucine-rich repeatcontaining gene family. Curr Opin Immunol 2008, 20:3-9.
21. Yoshie O, Imai T, Nomiyama H: Chemokines in immunity. Adv Immunol2001, 78:57-110.
Pre-publication historyThe pre-publication history for this paper can be accessed here:http://www.biomedcentral.com/1471-5945/10/1/prepub
doi:10.1186/1471-5945-10-1Cite this article as: Suárez-Fariñas et al.: Personalized medicine inpsoriasis: developing a genomic classifier to predict histologicalresponse to Alefacept. BMC Dermatology 2010 10:1.
Submit your next manuscript to BioMed Centraland take full advantage of:
• Convenient online submission
• Thorough peer review
• No space constraints or color figure charges
• Immediate publication on acceptance
• Inclusion in PubMed, CAS, Scopus and Google Scholar
• Research which is freely available for redistribution
Submit your manuscript at www.biomedcentral.com/submit
Suárez-Fariñas et al. BMC Dermatology 2010, 10:1http://www.biomedcentral.com/1471-5945/10/1
Page 8 of 8