Personal Profiles, Family Environment, Patterns of ... - MDPI
19
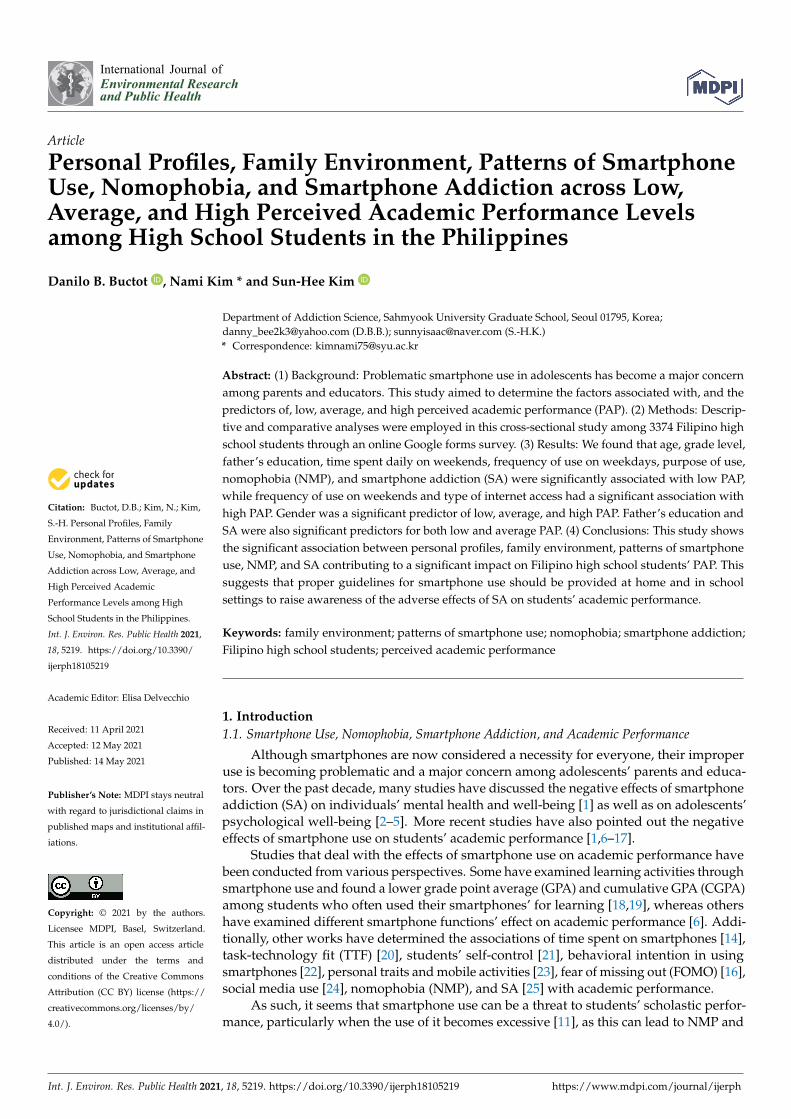
International Journal of Environmental Research and Public Health Article Personal Profiles, Family Environment, Patterns of Smartphone Use, Nomophobia, and Smartphone Addiction across Low, Average, and High Perceived Academic Performance Levels among High School Students in the Philippines Danilo B. Buctot , Nami Kim * and Sun-Hee Kim Citation: Buctot, D.B.; Kim, N.; Kim, S.-H. Personal Profiles, Family Environment, Patterns of Smartphone Use, Nomophobia, and Smartphone Addiction across Low, Average, and High Perceived Academic Performance Levels among High School Students in the Philippines. Int. J. Environ. Res. Public Health 2021, 18, 5219. https://doi.org/10.3390/ ijerph18105219 Academic Editor: Elisa Delvecchio Received: 11 April 2021 Accepted: 12 May 2021 Published: 14 May 2021 Publisher’s Note: MDPI stays neutral with regard to jurisdictional claims in published maps and institutional affil- iations. Copyright: © 2021 by the authors. Licensee MDPI, Basel, Switzerland. This article is an open access article distributed under the terms and conditions of the Creative Commons Attribution (CC BY) license (https:// creativecommons.org/licenses/by/ 4.0/). Department of Addiction Science, Sahmyook University Graduate School, Seoul 01795, Korea; [email protected] (D.B.B.); [email protected] (S.-H.K.) * Correspondence: [email protected] Abstract: (1) Background: Problematic smartphone use in adolescents has become a major concern among parents and educators. This study aimed to determine the factors associated with, and the predictors of, low, average, and high perceived academic performance (PAP). (2) Methods: Descrip- tive and comparative analyses were employed in this cross-sectional study among 3374 Filipino high school students through an online Google forms survey. (3) Results: We found that age, grade level, father’s education, time spent daily on weekends, frequency of use on weekdays, purpose of use, nomophobia (NMP), and smartphone addiction (SA) were significantly associated with low PAP, while frequency of use on weekends and type of internet access had a significant association with high PAP. Gender was a significant predictor of low, average, and high PAP. Father’s education and SA were also significant predictors for both low and average PAP. (4) Conclusions: This study shows the significant association between personal profiles, family environment, patterns of smartphone use, NMP, and SA contributing to a significant impact on Filipino high school students’ PAP. This suggests that proper guidelines for smartphone use should be provided at home and in school settings to raise awareness of the adverse effects of SA on students’ academic performance. Keywords: family environment; patterns of smartphone use; nomophobia; smartphone addiction; Filipino high school students; perceived academic performance 1. Introduction 1.1. Smartphone Use, Nomophobia, Smartphone Addiction, and Academic Performance Although smartphones are now considered a necessity for everyone, their improper use is becoming problematic and a major concern among adolescents’ parents and educa- tors. Over the past decade, many studies have discussed the negative effects of smartphone addiction (SA) on individuals’ mental health and well-being [1] as well as on adolescents’ psychological well-being [2–5]. More recent studies have also pointed out the negative effects of smartphone use on students’ academic performance [1,6–17]. Studies that deal with the effects of smartphone use on academic performance have been conducted from various perspectives. Some have examined learning activities through smartphone use and found a lower grade point average (GPA) and cumulative GPA (CGPA) among students who often used their smartphones’ for learning [18,19], whereas others have examined different smartphone functions’ effect on academic performance [6]. Addi- tionally, other works have determined the associations of time spent on smartphones [14], task-technology fit (TTF) [20], students’ self-control [21], behavioral intention in using smartphones [22], personal traits and mobile activities [23], fear of missing out (FOMO) [16], social media use [24], nomophobia (NMP), and SA [25] with academic performance. As such, it seems that smartphone use can be a threat to students’ scholastic perfor- mance, particularly when the use of it becomes excessive [11], as this can lead to NMP and Int. J. Environ. Res. Public Health 2021, 18, 5219. https://doi.org/10.3390/ijerph18105219 https://www.mdpi.com/journal/ijerph
-
Upload
khangminh22 -
Category
Documents
-
view
0 -
download
0
Transcript of Personal Profiles, Family Environment, Patterns of ... - MDPI
International Journal of
Environmental Research
and Public Health
Article
Personal Profiles, Family Environment, Patterns of SmartphoneUse, Nomophobia, and Smartphone Addiction across Low,Average, and High Perceived Academic Performance Levelsamong High School Students in the Philippines
Danilo B. Buctot , Nami Kim * and Sun-Hee Kim
�����������������
Citation: Buctot, D.B.; Kim, N.; Kim,
S.-H. Personal Profiles, Family
Environment, Patterns of Smartphone
Use, Nomophobia, and Smartphone
Addiction across Low, Average, and
High Perceived Academic
Performance Levels among High
School Students in the Philippines.
Int. J. Environ. Res. Public Health 2021,
18, 5219. https://doi.org/10.3390/
ijerph18105219
Academic Editor: Elisa Delvecchio
Received: 11 April 2021
Accepted: 12 May 2021
Published: 14 May 2021
Publisher’s Note: MDPI stays neutral
with regard to jurisdictional claims in
published maps and institutional affil-
iations.
Copyright: © 2021 by the authors.
Licensee MDPI, Basel, Switzerland.
This article is an open access article
distributed under the terms and
conditions of the Creative Commons
Attribution (CC BY) license (https://
creativecommons.org/licenses/by/
4.0/).
Department of Addiction Science, Sahmyook University Graduate School, Seoul 01795, Korea;[email protected] (D.B.B.); [email protected] (S.-H.K.)* Correspondence: [email protected]
Abstract: (1) Background: Problematic smartphone use in adolescents has become a major concernamong parents and educators. This study aimed to determine the factors associated with, and thepredictors of, low, average, and high perceived academic performance (PAP). (2) Methods: Descrip-tive and comparative analyses were employed in this cross-sectional study among 3374 Filipino highschool students through an online Google forms survey. (3) Results: We found that age, grade level,father’s education, time spent daily on weekends, frequency of use on weekdays, purpose of use,nomophobia (NMP), and smartphone addiction (SA) were significantly associated with low PAP,while frequency of use on weekends and type of internet access had a significant association withhigh PAP. Gender was a significant predictor of low, average, and high PAP. Father’s education andSA were also significant predictors for both low and average PAP. (4) Conclusions: This study showsthe significant association between personal profiles, family environment, patterns of smartphoneuse, NMP, and SA contributing to a significant impact on Filipino high school students’ PAP. Thissuggests that proper guidelines for smartphone use should be provided at home and in schoolsettings to raise awareness of the adverse effects of SA on students’ academic performance.
Keywords: family environment; patterns of smartphone use; nomophobia; smartphone addiction;Filipino high school students; perceived academic performance
1. Introduction1.1. Smartphone Use, Nomophobia, Smartphone Addiction, and Academic Performance
Although smartphones are now considered a necessity for everyone, their improperuse is becoming problematic and a major concern among adolescents’ parents and educa-tors. Over the past decade, many studies have discussed the negative effects of smartphoneaddiction (SA) on individuals’ mental health and well-being [1] as well as on adolescents’psychological well-being [2–5]. More recent studies have also pointed out the negativeeffects of smartphone use on students’ academic performance [1,6–17].
Studies that deal with the effects of smartphone use on academic performance havebeen conducted from various perspectives. Some have examined learning activities throughsmartphone use and found a lower grade point average (GPA) and cumulative GPA (CGPA)among students who often used their smartphones’ for learning [18,19], whereas othershave examined different smartphone functions’ effect on academic performance [6]. Addi-tionally, other works have determined the associations of time spent on smartphones [14],task-technology fit (TTF) [20], students’ self-control [21], behavioral intention in usingsmartphones [22], personal traits and mobile activities [23], fear of missing out (FOMO) [16],social media use [24], nomophobia (NMP), and SA [25] with academic performance.
As such, it seems that smartphone use can be a threat to students’ scholastic perfor-mance, particularly when the use of it becomes excessive [11], as this can lead to NMP and
Int. J. Environ. Res. Public Health 2021, 18, 5219. https://doi.org/10.3390/ijerph18105219 https://www.mdpi.com/journal/ijerph
Int. J. Environ. Res. Public Health 2021, 18, 5219 2 of 19
SA, which have impulsive, uncontrollable desires to use a smartphone as their commonattribute. If someone becomes anxious when he/she is away from his/her smartphone,or if they fear losing it or not being able to access it, they are likely to be experiencingNMP [26–29]. On the other hand, when an individual manifest a strong urge to use a smart-phone despite its negative effect (i.e., negligence of other aspects in life due to constantcravings and excessive use) [30–33], he or she is likely to be suffering from SA. NMP andSA are two modern behaviors that are highly prevalent in high school students [34], andthis addictive tendency often manifests [35] as problematic use of smartphones [36].
1.2. Nomophobia and Smartphone Addiction in the Philippines
Smartphone use has become a trend among Filipino adolescents over the past fewyears. In fact, adolescents and young adults (16–24 years old) have the largest smartphoneownership percentage in the country [37]. According to Statista (The Statistics Portal), inthe second and third quarter of 2018, Filipinos spent an average of 10.3 h a day online ontheir smartphones [38]. In 2020, a study reported an SA prevalence rate of 62.6% amongFilipino adolescents [39]. Similarly, NMP among Filipino adolescents is also evident, asa local newspaper (Philippine Daily Inquirer) recently stated that 33.3% (i.e., one out ofthree) of Filipinos reported not being able to survive without their smartphones [40].
By 2003, cellphone use was already common among Filipino children and adolescents.The Department of Education Culture and Sports (DECS), which is currently referred to asthe Department of Education (DepEd), was so concerned about students’ misguided andproblematic activities that it issued orders (DECS orders Nos. 26 s. 2000 and 70 s. 1999–30November 2003) prohibiting students of elementary and secondary schools from usingcellphones during class. When smartphone use continued to dominate over the next fewyears, the DepEd reiterated the same orders (DepEd order No. 83 s. 2003) to remind schooleducators about the policy [41].
1.3. Personal Profiles, Family Environment, Patterns of Smartphone Use, Nomophobia,Smartphone Addiction, and Academic Performance
Patterns of smartphone use were found to be associated with NMP and SA, andthese associations differed depending on demographics such as age, gender, and familyenvironment. For instance, a previous study found age to be negatively associated withaddictive behavior in smartphone use [42]. Furthermore, females manifested a greaterlikelihood of spending more time on their phones than males [43]. Additionally, peoplewith lower education levels [3] or in lower age brackets [44] were more likely to manifestsymptoms of SA.
Previous studies also claimed that NMP and SA are closely associated with eachother [25,45,46], signifying that factors associated with NMP can also be factors of SA.For instance, [25] observed that adolescents with SA also showed nomophobic behaviors,and later found a positive correlation between nomophobic behaviors and social mediaaddiction. Adolescents’ family environments also play a very important role in shapingtheir behaviors towards smartphone use [47]. A study among Korean adolescents foundthat SA is significantly associated with two-parent and double-income households aswell as dysfunctional families exposed to domestic violence and parental addiction [47].Additionally, family environments where adults frequently use their mobile devices couldalso lead to increased smartphone use among youngsters [48].
With regards to academic performance, it was found that having a strong familybackground and good education facilities could help enhance students’ performance [49].Furthermore, parents’ educational background was also found to be associated with stu-dents’ academic performance [50], and broken families were significantly associated withlower academic achievement; these findings suggest that family structure is a significantfactor in adolescents’ perceived academic performance (PAP) [51]. In addition, family sizewas found to be associated with low academic performance among students and withparents from low income households who struggle to pay school fees [49].
Int. J. Environ. Res. Public Health 2021, 18, 5219 3 of 19
In a study on high school students, [52] determined the duration of smartphoneownership to be one of the influencing factors for NMP. In addition, [53] found a significantassociation of NMP with age, gender, duration, and frequency of smartphone use, socialnetwork sites (SNS) use, checking smartphones for no reason, and checking smartphonesdirectly after waking up in the morning. Similarly, [25] identified gender, parents’ educationlevels, information and communication technology (ICT) use levels, duration and frequencyof smartphone use, purpose, smartphone experience, and academic achievement as beingsignificant predictors of both NMP and SA. Additionally, previous studies found highfrequency and duration of smartphone use akin to SA severity [54,55], and the durationof SNS use and frequency of phone calls and text messages were found to be predictorsof mobile phone addiction [43]. Other studies pointed out mental factors such as self-esteem, extraversion, conscientiousness, and emotional stability as significant predictors ofNMP [56].
Thus, most previous studies agree with the notion that demographics (i.e., personalprofiles and family environment) and patterns of smartphone use are significantly as-sociated with NMP and SA and can negatively affect students’ academic performance.However, most previous studies have examined the adverse effects of the above-mentionedvariables on academic performance based on students’ GPAs, while studies determiningstudents’ self-PAP in relation to these factors remain scarce. To address these gaps, thisstudy employed a sample of Filipino adolescents (i.e., junior and senior high school stu-dents) to investigate the association and the predictive capacity of personal profiles, familyenvironment, patterns of smartphone use, NMP, and SA on students’ PAP.
1.4. Academic Performance and Perceived Academic Performance
Academic performance is measured by evaluating how much has been achieved overa certain period of time [57]. The most common and easy way to evaluate a student’sacademic performance is by simply determining their GPA, whereby a higher GPA scoreindicates higher academic performance [58]. Previous studies note that GPA is a significantpredictor of academic achievement [59,60]. However, GPA is a representation of academicachievement on a single unidimensional scale and is constructed entirely from coursegrade information; therefore, it is non-inclusive [61]. In contrast, PAP is a self-evaluationof academic performance that helps us understand how students view their academicachievement (i.e., high, average, low) and how they perceive themselves (i.e., positively ornegatively), which relates to their self-esteem [62]. In this study, we asked participants toevaluate their academic performance based on how they perceive the effect of smartphoneuse on their academic grades.
1.5. Conceptual Framework
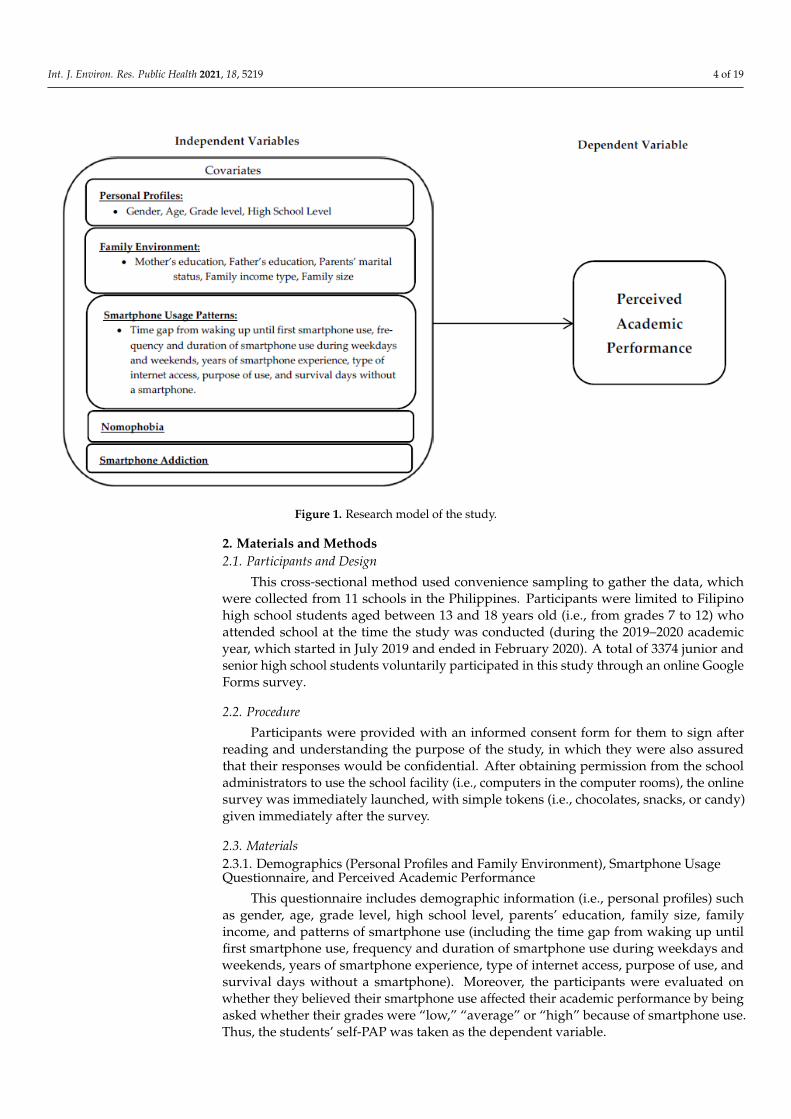
The concept of social cognitive theory is the basis of this study’s framework. Socialcognitive theory points out that the mutual interaction of one’s personal factors, behavior,and environment influences future behavioral performance [63]. This, in turn, relates tobehaviorism and the psychodynamic theory [25], in which people with smartphone usedisorder believe they can escape negative emotions [25] such as loneliness and shyness [26]through smartphone use. Thus, according to [64], problematic smartphone use combinespersonal, cultural, environmental, and emotional factors. As the purpose of this study is toexamine whether personal profiles (i.e., demographics), family environment (environmen-tal), patterns of smartphone use, NMP, and SA (behavioral) are associated with PAP, wehypothesize that gender, age, grade level, high school level, parents’ education and maritalstatus, family income, family size, duration of time from waking up until first smartphoneuse, duration and frequency of smartphone use on weekdays and weekends, years ofsmartphone experience, type of internet access, purpose of use, survival days without asmartphone, NMP, and SA significantly predict low, average, and high PAP. Figure 1 showsthe research model of this study including the variables details.
Int. J. Environ. Res. Public Health 2021, 18, 5219 4 of 19
Int. J. Environ. Res. Public Health 2021, 18, x 4 of 20
combines personal, cultural, environmental, and emotional factors. As the purpose of this study is to examine whether personal profiles (i.e., demographics), family environment (environmental), patterns of smartphone use, NMP, and SA (behavioral) are associated with PAP, we hypothesize that gender, age, grade level, high school level, parents’ education and marital status, family income, family size, duration of time from waking up until first smartphone use, duration and frequency of smartphone use on weekdays and weekends, years of smartphone experience, type of internet access, purpose of use, survival days without a smartphone, NMP, and SA significantly predict low, average, and high PAP. Figure 1 shows the research model of this study including the variables details.
Figure 1. Research model of the study.
2. Materials and Methods 2.1. Participants and Design
This cross-sectional method used convenience sampling to gather the data, which were collected from 11 schools in the Philippines. Participants were limited to Filipino high school students aged between 13 and 18 years old (i.e., from grades 7 to 12) who attended school at the time the study was conducted (during the 2019–2020 academic year, which started in July 2019 and ended in February 2020). A total of 3374 junior and senior high school students voluntarily participated in this study through an online Google Forms survey.
2.2. Procedure Participants were provided with an informed consent form for them to sign after
reading and understanding the purpose of the study, in which they were also assured that their responses would be confidential. After obtaining permission from the school administrators to use the school facility (i.e., computers in the computer rooms), the online survey was immediately launched, with simple tokens (i.e., chocolates, snacks, or candy) given immediately after the survey.
Figure 1. Research model of the study.
2. Materials and Methods2.1. Participants and Design
This cross-sectional method used convenience sampling to gather the data, whichwere collected from 11 schools in the Philippines. Participants were limited to Filipinohigh school students aged between 13 and 18 years old (i.e., from grades 7 to 12) whoattended school at the time the study was conducted (during the 2019–2020 academicyear, which started in July 2019 and ended in February 2020). A total of 3374 junior andsenior high school students voluntarily participated in this study through an online GoogleForms survey.
2.2. Procedure
Participants were provided with an informed consent form for them to sign afterreading and understanding the purpose of the study, in which they were also assuredthat their responses would be confidential. After obtaining permission from the schooladministrators to use the school facility (i.e., computers in the computer rooms), the onlinesurvey was immediately launched, with simple tokens (i.e., chocolates, snacks, or candy)given immediately after the survey.
2.3. Materials2.3.1. Demographics (Personal Profiles and Family Environment), Smartphone UsageQuestionnaire, and Perceived Academic Performance
This questionnaire includes demographic information (i.e., personal profiles) suchas gender, age, grade level, high school level, parents’ education, family size, familyincome, and patterns of smartphone use (including the time gap from waking up untilfirst smartphone use, frequency and duration of smartphone use during weekdays andweekends, years of smartphone experience, type of internet access, purpose of use, andsurvival days without a smartphone). Moreover, the participants were evaluated onwhether they believed their smartphone use affected their academic performance by beingasked whether their grades were “low,” “average” or “high” because of smartphone use.Thus, the students’ self-PAP was taken as the dependent variable.
Int. J. Environ. Res. Public Health 2021, 18, 5219 5 of 19
2.3.2. Nomophobia (NMP-Q Scale)
Developed in 2015, the NMP-Q scale consists of 20 questions pertaining to the fol-lowing four dimensions: not being able to communicate (6 items), not being able to accessinformation (4 items), losing connectedness (5 items), and giving up convenience (5 items).Responses to each item were recorded on a 7-point Likert scale that ranged from 1 (stronglydisagree) to 7 (strongly agree) [29]. Total scores were computed and classified as follows:absence of NMP (20), mild level of NMP (21–59), moderate level of NMP (60–99), andsevere level of NMP (100–140). In this study, Cronbach’s alpha was 0.916, and the fol-lowing coefficients emerged for its subscales: not being able to communicate = 0.857,losing connectedness = 0.838, not being able to access information = 0.697, and giving upconvenience = 0.743.
2.3.3. Smartphone Addiction Scale-Short Version
The short version of the SA scale (SAS-SV) [3,65] was used to measure participants’SA. Measured on a 6-point Likert scale, the answers of this 10-item questionnaire rangedfrom 1 (strongly disagree) to 6 (strongly agree) [3,65]; the cut-off scores were 31 and 33 forboys and girls, respectively [65]. The reliability score for this scale was a Cronbach’s alphaof 0.831.
2.4. Statistical Analyses
All analyses in this study were conducted using SPSS version 23 (SPSS Inc., Chicago,IL, USA) for Windows [66]. The main statistical method used in this study was a multiplelinear regression analysis in which the PAP groups (i.e., low, average, and high) were thedependent variables, and the variables for personal profiles (i.e., age, gender, grade level,and high school level), family environment (i.e., parents’ education and marital status,family income type, and family size), and patterns of smartphone use (i.e., the time gapfrom waking up until first smartphone use, frequency and duration of smartphone use onweekdays and weekends, years of smartphone experience, type of internet access, purposeof use, and survival days without a smartphone) were the covariates. Additionally, aPearson correlation analysis was used to explore the relationships between the variables,and a chi-square and one-way ANOVA were used to explore the differences betweenstudents across low, average, and high PAP groups.
Preliminary tests were conducted to ascertain that a multiple linear regression anal-ysis was a good fit for this study and to ensure the validity of the data. The minimumnumber of cases per independent variable (20 cases) [67] was satisfied. Tests for normality(i.e., kurtosis and skewness) were not applied, as this study consisted of a very largesample [68]. With regards to multicollinearity issues, no scores close to zero and 10 weremanifested for tolerance or variance inflation factor (VIF), which implied that there wereno multicollinearity issues [69] in this study.
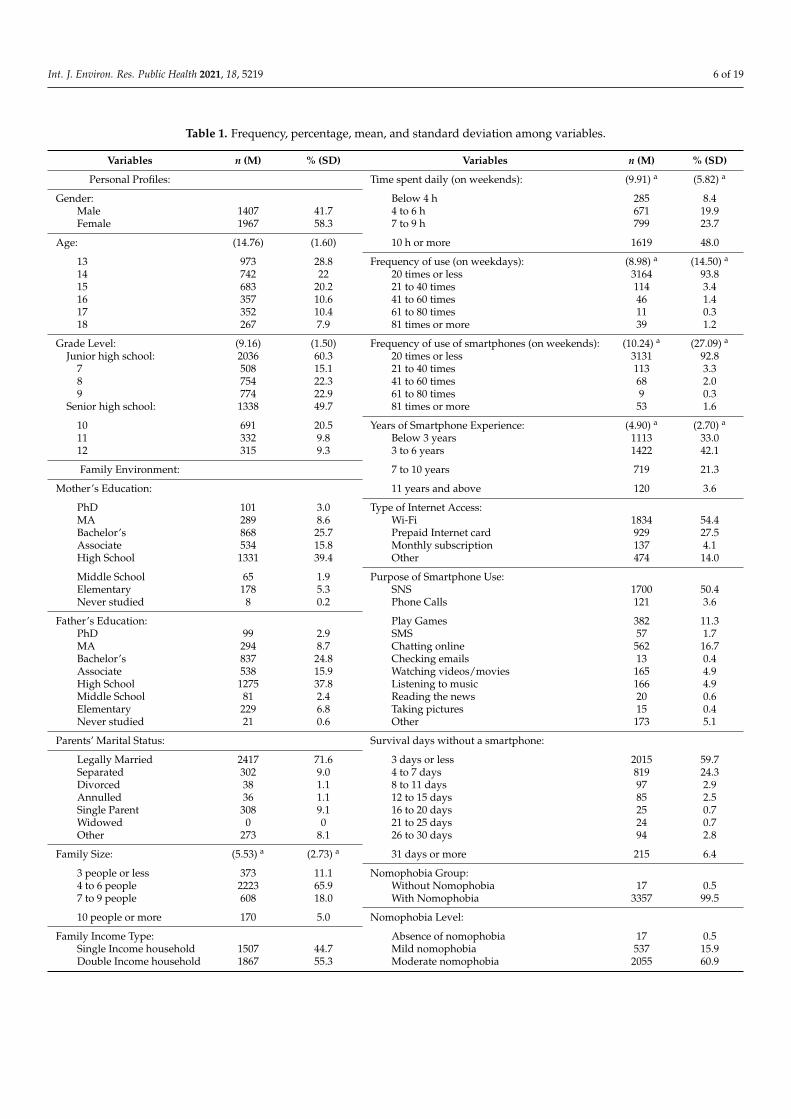
3. Results3.1. General Characteristics of Variables
Table 1 shows the frequency, percentage, mean, and standard deviation of all thevariables included in this study. The majority of participants were female (n = 1967, 58.3%)and around 60% (n = 2036, 60.3%) were junior high school students. The mean age ofparticipants was 14 (M = 14.76, SD = 1.60) years old and the mean grade level was ninthgrade (M = 9.16, SD = 1.50). Less than 1% (n = 17, 0.5%) did not have NMP. However,15.9% (n = 537), 60.9% (n = 2055), and 22.7% (n = 765) had mild, moderate, and severeNMP, respectively. Thus, 95.5% (n = 3357) of the participants were classified as havingNMP to some degree [(41.6% (n = 1395) males; 58.4% (n = 1962) females; (60.4% (n = 2026)juniors; (39.6% (n = 1331) seniors)], and 0.5% (n = 17) were classified as not having NMP.Moreover, 62.4% (n = 2105) of participants had SA ((42.3% (n = 890) males; 57.7% (n = 1215)females; (60.8% (n =1279) juniors; (39.2% (n =826) seniors)), and 37.6% (n = 1269) werenormal smartphone users who did not have SA.
Int. J. Environ. Res. Public Health 2021, 18, 5219 6 of 19
Table 1. Frequency, percentage, mean, and standard deviation among variables.
Variables n (M) % (SD) Variables n (M) % (SD)
Personal Profiles: Time spent daily (on weekends): (9.91) a (5.82) a
Gender: Below 4 h 285 8.4Male 1407 41.7 4 to 6 h 671 19.9Female 1967 58.3 7 to 9 h 799 23.7
Age: (14.76) (1.60) 10 h or more 1619 48.0
13 973 28.8 Frequency of use (on weekdays): (8.98) a (14.50) a
14 742 22 20 times or less 3164 93.815 683 20.2 21 to 40 times 114 3.416 357 10.6 41 to 60 times 46 1.417 352 10.4 61 to 80 times 11 0.318 267 7.9 81 times or more 39 1.2
Grade Level: (9.16) (1.50) Frequency of use of smartphones (on weekends): (10.24) a (27.09) a
Junior high school: 2036 60.3 20 times or less 3131 92.87 508 15.1 21 to 40 times 113 3.38 754 22.3 41 to 60 times 68 2.09 774 22.9 61 to 80 times 9 0.3
Senior high school: 1338 49.7 81 times or more 53 1.6
10 691 20.5 Years of Smartphone Experience: (4.90) a (2.70) a
11 332 9.8 Below 3 years 1113 33.012 315 9.3 3 to 6 years 1422 42.1
Family Environment: 7 to 10 years 719 21.3
Mother’s Education: 11 years and above 120 3.6
PhD 101 3.0 Type of Internet Access:MA 289 8.6 Wi-Fi 1834 54.4Bachelor’s 868 25.7 Prepaid Internet card 929 27.5Associate 534 15.8 Monthly subscription 137 4.1High School 1331 39.4 Other 474 14.0
Middle School 65 1.9 Purpose of Smartphone Use:Elementary 178 5.3 SNS 1700 50.4Never studied 8 0.2 Phone Calls 121 3.6
Father’s Education: Play Games 382 11.3PhD 99 2.9 SMS 57 1.7MA 294 8.7 Chatting online 562 16.7Bachelor’s 837 24.8 Checking emails 13 0.4Associate 538 15.9 Watching videos/movies 165 4.9High School 1275 37.8 Listening to music 166 4.9Middle School 81 2.4 Reading the news 20 0.6Elementary 229 6.8 Taking pictures 15 0.4Never studied 21 0.6 Other 173 5.1
Parents’ Marital Status: Survival days without a smartphone:
Legally Married 2417 71.6 3 days or less 2015 59.7Separated 302 9.0 4 to 7 days 819 24.3Divorced 38 1.1 8 to 11 days 97 2.9Annulled 36 1.1 12 to 15 days 85 2.5Single Parent 308 9.1 16 to 20 days 25 0.7Widowed 0 0 21 to 25 days 24 0.7Other 273 8.1 26 to 30 days 94 2.8
Family Size: (5.53) a (2.73) a 31 days or more 215 6.4
3 people or less 373 11.1 Nomophobia Group:4 to 6 people 2223 65.9 Without Nomophobia 17 0.57 to 9 people 608 18.0 With Nomophobia 3357 99.5
10 people or more 170 5.0 Nomophobia Level:
Family Income Type: Absence of nomophobia 17 0.5Single Income household 1507 44.7 Mild nomophobia 537 15.9Double Income household 1867 55.3 Moderate nomophobia 2055 60.9
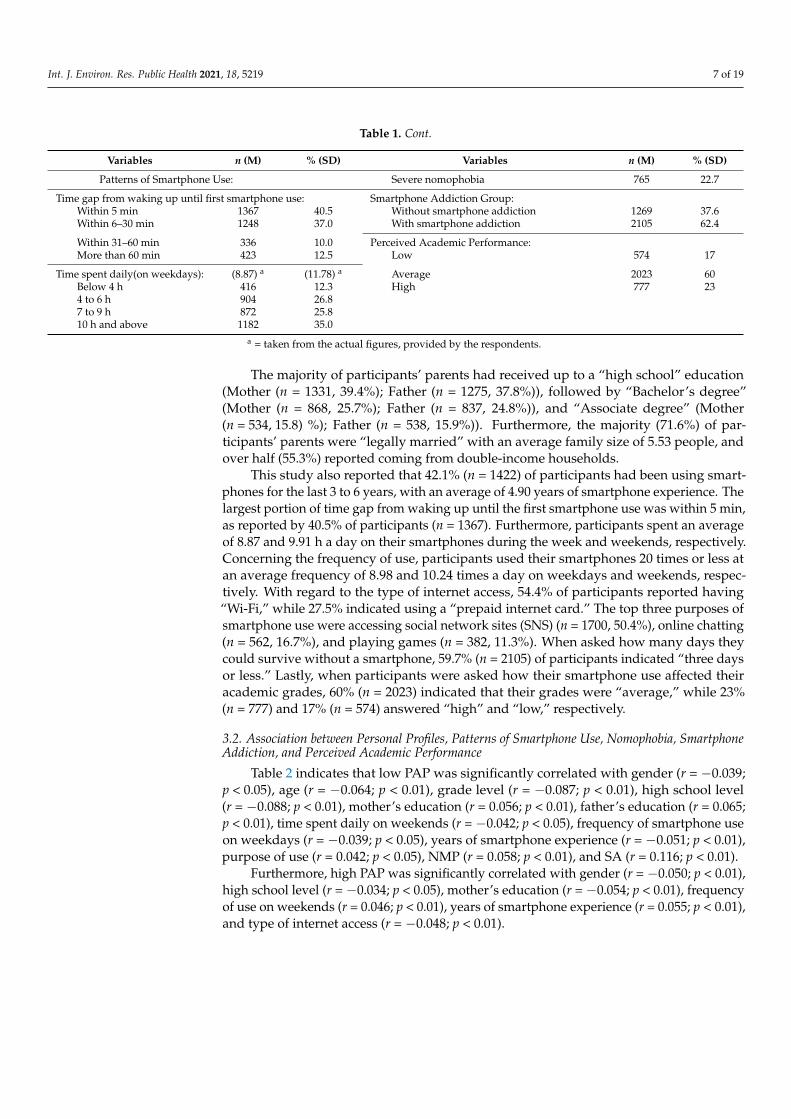
Int. J. Environ. Res. Public Health 2021, 18, 5219 7 of 19
Table 1. Cont.
Variables n (M) % (SD) Variables n (M) % (SD)
Patterns of Smartphone Use: Severe nomophobia 765 22.7
Time gap from waking up until first smartphone use: Smartphone Addiction Group:Within 5 min 1367 40.5 Without smartphone addiction 1269 37.6Within 6–30 min 1248 37.0 With smartphone addiction 2105 62.4
Within 31–60 min 336 10.0 Perceived Academic Performance:More than 60 min 423 12.5 Low 574 17
Time spent daily(on weekdays): (8.87) a (11.78) a Average 2023 60Below 4 h 416 12.3 High 777 234 to 6 h 904 26.87 to 9 h 872 25.810 h and above 1182 35.0
a = taken from the actual figures, provided by the respondents.
The majority of participants’ parents had received up to a “high school” education(Mother (n = 1331, 39.4%); Father (n = 1275, 37.8%)), followed by “Bachelor’s degree”(Mother (n = 868, 25.7%); Father (n = 837, 24.8%)), and “Associate degree” (Mother(n = 534, 15.8) %); Father (n = 538, 15.9%)). Furthermore, the majority (71.6%) of par-ticipants’ parents were “legally married” with an average family size of 5.53 people, andover half (55.3%) reported coming from double-income households.
This study also reported that 42.1% (n = 1422) of participants had been using smart-phones for the last 3 to 6 years, with an average of 4.90 years of smartphone experience. Thelargest portion of time gap from waking up until the first smartphone use was within 5 min,as reported by 40.5% of participants (n = 1367). Furthermore, participants spent an averageof 8.87 and 9.91 h a day on their smartphones during the week and weekends, respectively.Concerning the frequency of use, participants used their smartphones 20 times or less atan average frequency of 8.98 and 10.24 times a day on weekdays and weekends, respec-tively. With regard to the type of internet access, 54.4% of participants reported having“Wi-Fi,” while 27.5% indicated using a “prepaid internet card.” The top three purposes ofsmartphone use were accessing social network sites (SNS) (n = 1700, 50.4%), online chatting(n = 562, 16.7%), and playing games (n = 382, 11.3%). When asked how many days theycould survive without a smartphone, 59.7% (n = 2105) of participants indicated “three daysor less.” Lastly, when participants were asked how their smartphone use affected theiracademic grades, 60% (n = 2023) indicated that their grades were “average,” while 23%(n = 777) and 17% (n = 574) answered “high” and “low,” respectively.
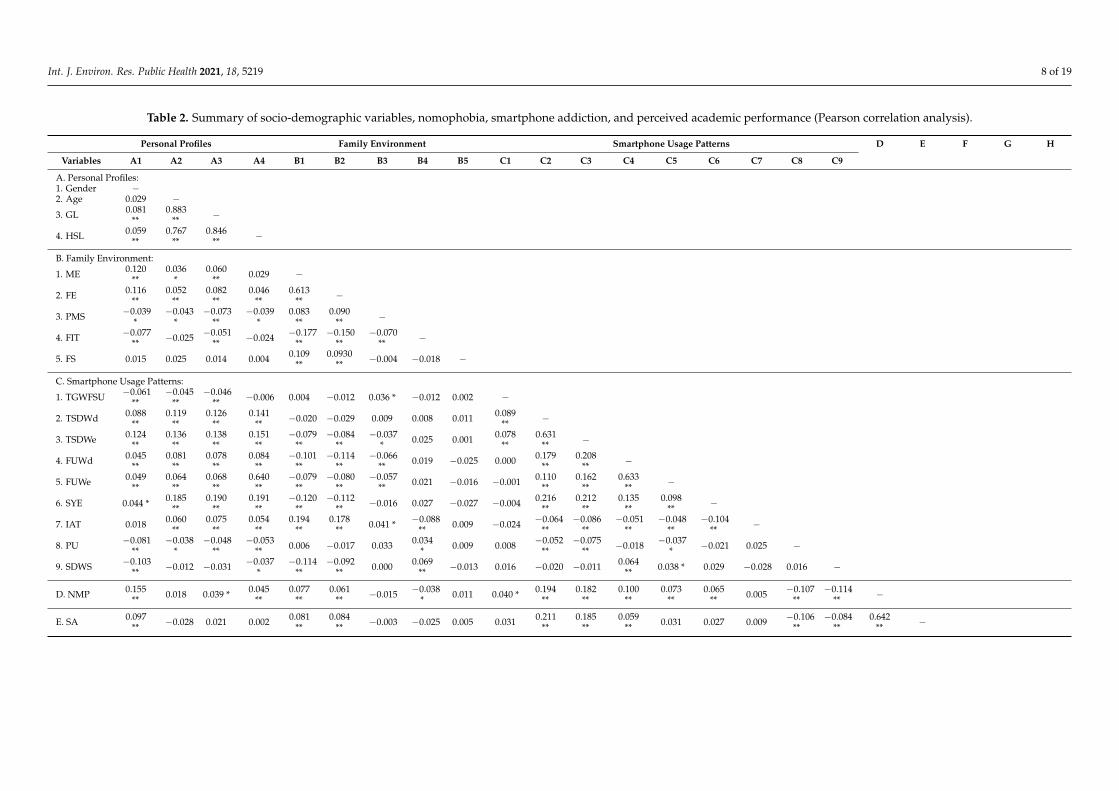
3.2. Association between Personal Profiles, Patterns of Smartphone Use, Nomophobia, SmartphoneAddiction, and Perceived Academic Performance
Table 2 indicates that low PAP was significantly correlated with gender (r = −0.039;p < 0.05), age (r = −0.064; p < 0.01), grade level (r = −0.087; p < 0.01), high school level(r = −0.088; p < 0.01), mother’s education (r = 0.056; p < 0.01), father’s education (r = 0.065;p < 0.01), time spent daily on weekends (r = −0.042; p < 0.05), frequency of smartphone useon weekdays (r = −0.039; p < 0.05), years of smartphone experience (r = −0.051; p < 0.01),purpose of use (r = 0.042; p < 0.05), NMP (r = 0.058; p < 0.01), and SA (r = 0.116; p < 0.01).
Furthermore, high PAP was significantly correlated with gender (r = −0.050; p < 0.01),high school level (r = −0.034; p < 0.05), mother’s education (r = −0.054; p < 0.01), frequencyof use on weekends (r = 0.046; p < 0.01), years of smartphone experience (r = 0.055; p < 0.01),and type of internet access (r = −0.048; p < 0.01).
Int. J. Environ. Res. Public Health 2021, 18, 5219 8 of 19
Table 2. Summary of socio-demographic variables, nomophobia, smartphone addiction, and perceived academic performance (Pearson correlation analysis).
Personal Profiles Family Environment Smartphone Usage Patterns D E F G H
Variables A1 A2 A3 A4 B1 B2 B3 B4 B5 C1 C2 C3 C4 C5 C6 C7 C8 C9
A. Personal Profiles:1. Gender −2. Age 0.029 −3. GL 0.081
**0.883
** −
4. HSL 0.059**
0.767**
0.846** −
B. Family Environment:
1. ME 0.120**
0.036*
0.060** 0.029 −
2. FE 0.116**
0.052**
0.082**
0.046**
0.613** −
3. PMS −0.039*
−0.043*
−0.073**
−0.039*
0.083**
0.090** −
4. FIT −0.077** −0.025 −0.051
** −0.024 −0.177**
−0.150**
−0.070** −
5. FS 0.015 0.025 0.014 0.004 0.109**
0.0930** −0.004 −0.018 −
C. Smartphone Usage Patterns:
1. TGWFSU −0.061**
−0.045**
−0.046** −0.006 0.004 −0.012 0.036 * −0.012 0.002 −
2. TSDWd 0.088**
0.119**
0.126**
0.141** −0.020 −0.029 0.009 0.008 0.011 0.089
** −
3. TSDWe 0.124**
0.136**
0.138**
0.151**
−0.079**
−0.084**
−0.037* 0.025 0.001 0.078
**0.631
** −
4. FUWd 0.045**
0.081**
0.078**
0.084**
−0.101**
−0.114**
−0.066** 0.019 −0.025 0.000 0.179
**0.208
** −
5. FUWe 0.049**
0.064**
0.068**
0.640**
−0.079**
−0.080**
−0.057** 0.021 −0.016 −0.001 0.110
**0.162
**0.633
** −
6. SYE 0.044 * 0.185**
0.190**
0.191**
−0.120**
−0.112** −0.016 0.027 −0.027 −0.004 0.216
**0.212
**0.135
**0.098
** −
7. IAT 0.018 0.060**
0.075**
0.054**
0.194**
0.178** 0.041 * −0.088
** 0.009 −0.024 −0.064**
−0.086**
−0.051**
−0.048**
−0.104** −
8. PU −0.081**
−0.038*
−0.048**
−0.053** 0.006 −0.017 0.033 0.034
* 0.009 0.008 −0.052**
−0.075** −0.018 −0.037
* −0.021 0.025 −
9. SDWS −0.103** −0.012 −0.031 −0.037
*−0.114
**−0.092
** 0.000 0.069** −0.013 0.016 −0.020 −0.011 0.064
** 0.038 * 0.029 −0.028 0.016 −
D. NMP 0.155** 0.018 0.039 * 0.045
**0.077
**0.061
** −0.015 −0.038* 0.011 0.040 * 0.194
**0.182
**0.100
**0.073
**0.065
** 0.005 −0.107**
−0.114** −
E. SA 0.097** −0.028 0.021 0.002 0.081
**0.084
** −0.003 −0.025 0.005 0.031 0.211**
0.185**
0.059** 0.031 0.027 0.009 −0.106
**−0.084
**0.642
** −

Int. J. Environ. Res. Public Health 2021, 18, 5219 9 of 19
Table 2. Cont.
Personal Profiles Family Environment Smartphone Usage Patterns D E F G H
Variables A1 A2 A3 A4 B1 B2 B3 B4 B5 C1 C2 C3 C4 C5 C6 C7 C8 C9
F. Low PAP −0.039*
−0.064**
−0.087**
−0.088**
0.056**
0.065** 0.014 −0.033 0.006 −0.011 0.002 −0.042
*−0.039
* −0.015 −0.051** 0.014 0.042
* 0.021 0.058**
0.116** −
G. AveragePAP
0.073** 0.024 0.039 * 0.038 * 0.003 −0.028 0.007 0.001 0.001 −0.009 −0.015 0.014 −0.010 −0.015 −0.008 0.052
** −0.0015 −0.005 −1.025 −0.078**
−0.554** −
H. HighPAP
−0.050** 0.030 0.032 0.034 * −0.054
** −0.026 −0.020 0.028 −0.007 0.021 0.016 0.021 0.025 0.046**
0.055**
−0.048** −0.020 −0.014 −0.022 −0.013 −0.248
**−0.669
** −
Note. GL = Grade Level; HSL = High School Level; ME = Mother’s Education; FE = Father’s Education; PMS = Parents’ Marital Status; FIT = Family Income Type; FS = Family Size; TGWFSU = Time Gap fromWaking up until first smartphone use; TSDWd = Time Spent Daily on Weekdays; TSDWe = Time Spent Daily on Weekends; FUWd = Frequency of Use on Weekdays; FUWe = Frequency of Use on Weekends;SYE = Years of Smartphone Experience; PU = Purpose of Use; IAT = Type of Internet Access; SDWS = Survival Days Without a Smartphone; NMP = Nomopobia; SA = Smartphone Addition; PAP = PerceivedAcademic Performance; * p < 0.05, ** p < 0.01.
Int. J. Environ. Res. Public Health 2021, 18, 5219 10 of 19
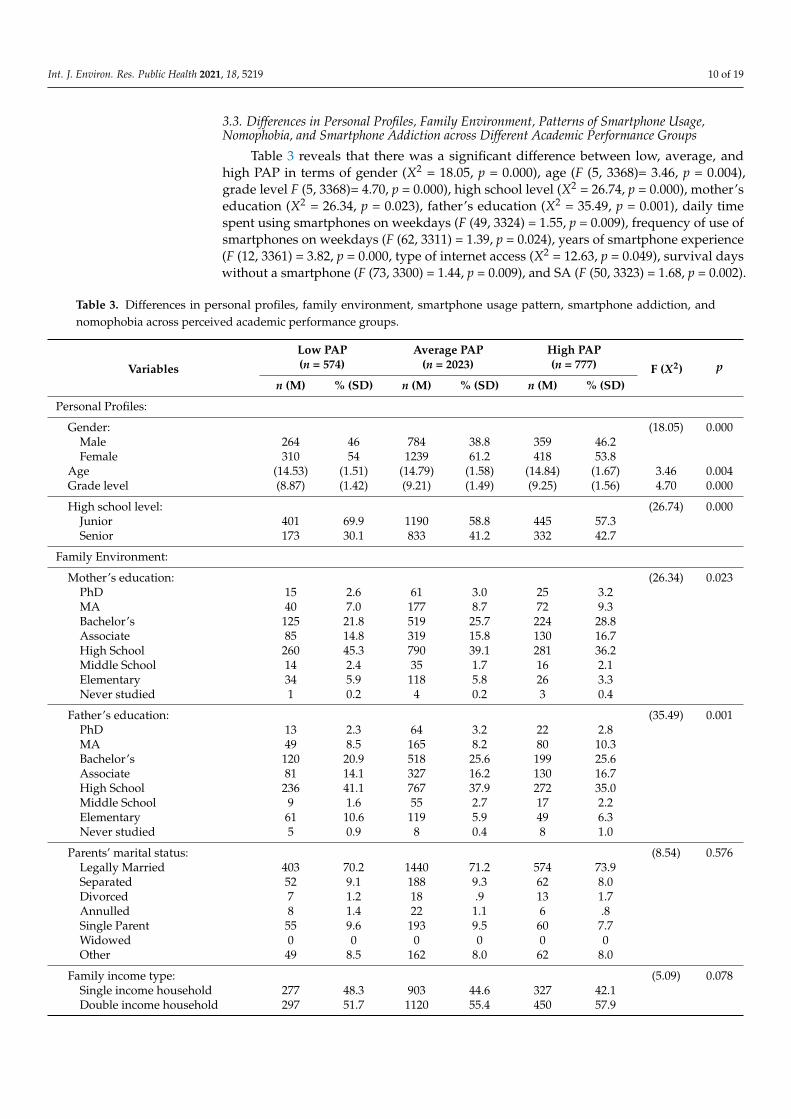
3.3. Differences in Personal Profiles, Family Environment, Patterns of Smartphone Usage,Nomophobia, and Smartphone Addiction across Different Academic Performance Groups
Table 3 reveals that there was a significant difference between low, average, andhigh PAP in terms of gender (X2 = 18.05, p = 0.000), age (F (5, 3368)= 3.46, p = 0.004),grade level F (5, 3368)= 4.70, p = 0.000), high school level (X2 = 26.74, p = 0.000), mother’seducation (X2 = 26.34, p = 0.023), father’s education (X2 = 35.49, p = 0.001), daily timespent using smartphones on weekdays (F (49, 3324) = 1.55, p = 0.009), frequency of use ofsmartphones on weekdays (F (62, 3311) = 1.39, p = 0.024), years of smartphone experience(F (12, 3361) = 3.82, p = 0.000, type of internet access (X2 = 12.63, p = 0.049), survival dayswithout a smartphone (F (73, 3300) = 1.44, p = 0.009), and SA (F (50, 3323) = 1.68, p = 0.002).
Table 3. Differences in personal profiles, family environment, smartphone usage pattern, smartphone addiction, andnomophobia across perceived academic performance groups.
Variables
Low PAP(n = 574)
Average PAP(n = 2023)
High PAP(n = 777) F (X2) p
n (M) % (SD) n (M) % (SD) n (M) % (SD)
Personal Profiles:
Gender: (18.05) 0.000Male 264 46 784 38.8 359 46.2Female 310 54 1239 61.2 418 53.8
Age (14.53) (1.51) (14.79) (1.58) (14.84) (1.67) 3.46 0.004Grade level (8.87) (1.42) (9.21) (1.49) (9.25) (1.56) 4.70 0.000
High school level: (26.74) 0.000Junior 401 69.9 1190 58.8 445 57.3Senior 173 30.1 833 41.2 332 42.7
Family Environment:
Mother’s education: (26.34) 0.023PhD 15 2.6 61 3.0 25 3.2MA 40 7.0 177 8.7 72 9.3Bachelor’s 125 21.8 519 25.7 224 28.8Associate 85 14.8 319 15.8 130 16.7High School 260 45.3 790 39.1 281 36.2Middle School 14 2.4 35 1.7 16 2.1Elementary 34 5.9 118 5.8 26 3.3Never studied 1 0.2 4 0.2 3 0.4
Father’s education: (35.49) 0.001PhD 13 2.3 64 3.2 22 2.8MA 49 8.5 165 8.2 80 10.3Bachelor’s 120 20.9 518 25.6 199 25.6Associate 81 14.1 327 16.2 130 16.7High School 236 41.1 767 37.9 272 35.0Middle School 9 1.6 55 2.7 17 2.2Elementary 61 10.6 119 5.9 49 6.3Never studied 5 0.9 8 0.4 8 1.0
Parents’ marital status: (8.54) 0.576Legally Married 403 70.2 1440 71.2 574 73.9Separated 52 9.1 188 9.3 62 8.0Divorced 7 1.2 18 .9 13 1.7Annulled 8 1.4 22 1.1 6 .8Single Parent 55 9.6 193 9.5 60 7.7Widowed 0 0 0 0 0 0Other 49 8.5 162 8.0 62 8.0
Family income type: (5.09) 0.078Single income household 277 48.3 903 44.6 327 42.1Double income household 297 51.7 1120 55.4 450 57.9
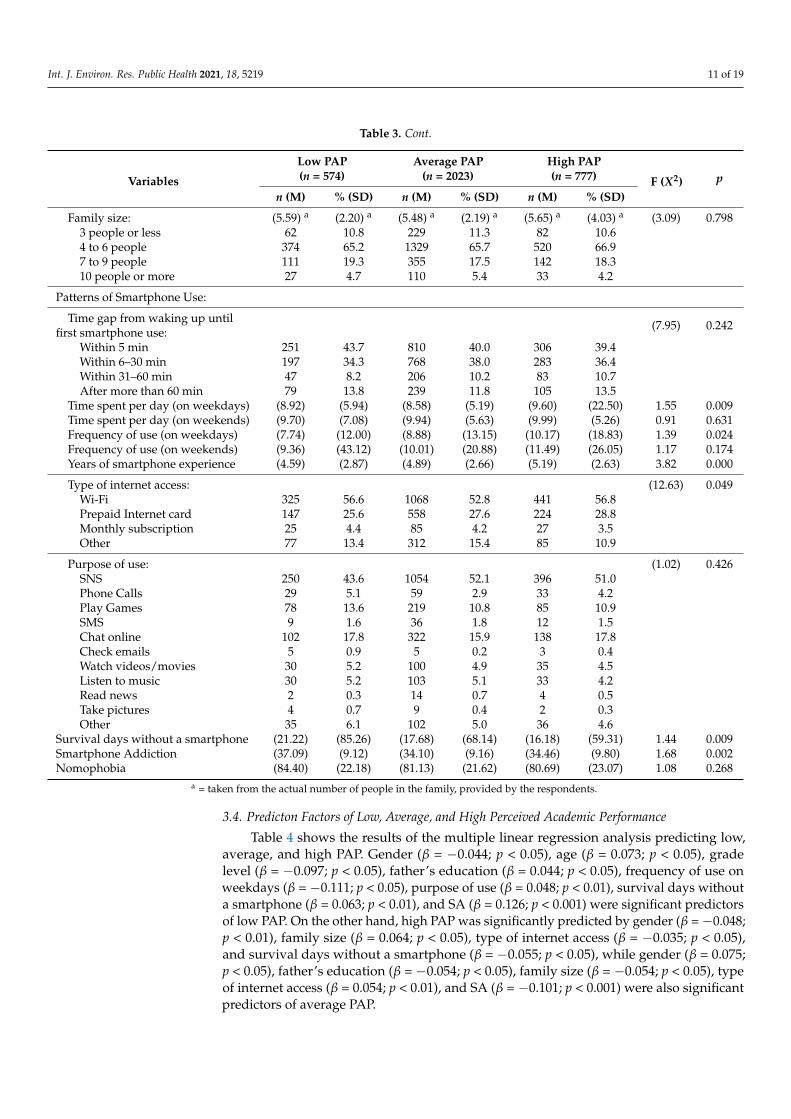
Int. J. Environ. Res. Public Health 2021, 18, 5219 11 of 19
Table 3. Cont.
Variables
Low PAP(n = 574)
Average PAP(n = 2023)
High PAP(n = 777) F (X2) p
n (M) % (SD) n (M) % (SD) n (M) % (SD)
Family size: (5.59) a (2.20) a (5.48) a (2.19) a (5.65) a (4.03) a (3.09) 0.7983 people or less 62 10.8 229 11.3 82 10.64 to 6 people 374 65.2 1329 65.7 520 66.97 to 9 people 111 19.3 355 17.5 142 18.310 people or more 27 4.7 110 5.4 33 4.2
Patterns of Smartphone Use:
Time gap from waking up untilfirst smartphone use: (7.95) 0.242
Within 5 min 251 43.7 810 40.0 306 39.4Within 6–30 min 197 34.3 768 38.0 283 36.4Within 31–60 min 47 8.2 206 10.2 83 10.7After more than 60 min 79 13.8 239 11.8 105 13.5
Time spent per day (on weekdays) (8.92) (5.94) (8.58) (5.19) (9.60) (22.50) 1.55 0.009Time spent per day (on weekends) (9.70) (7.08) (9.94) (5.63) (9.99) (5.26) 0.91 0.631Frequency of use (on weekdays) (7.74) (12.00) (8.88) (13.15) (10.17) (18.83) 1.39 0.024Frequency of use (on weekends) (9.36) (43.12) (10.01) (20.88) (11.49) (26.05) 1.17 0.174Years of smartphone experience (4.59) (2.87) (4.89) (2.66) (5.19) (2.63) 3.82 0.000
Type of internet access: (12.63) 0.049Wi-Fi 325 56.6 1068 52.8 441 56.8Prepaid Internet card 147 25.6 558 27.6 224 28.8Monthly subscription 25 4.4 85 4.2 27 3.5Other 77 13.4 312 15.4 85 10.9
Purpose of use: (1.02) 0.426SNS 250 43.6 1054 52.1 396 51.0Phone Calls 29 5.1 59 2.9 33 4.2Play Games 78 13.6 219 10.8 85 10.9SMS 9 1.6 36 1.8 12 1.5Chat online 102 17.8 322 15.9 138 17.8Check emails 5 0.9 5 0.2 3 0.4Watch videos/movies 30 5.2 100 4.9 35 4.5Listen to music 30 5.2 103 5.1 33 4.2Read news 2 0.3 14 0.7 4 0.5Take pictures 4 0.7 9 0.4 2 0.3Other 35 6.1 102 5.0 36 4.6
Survival days without a smartphone (21.22) (85.26) (17.68) (68.14) (16.18) (59.31) 1.44 0.009Smartphone Addiction (37.09) (9.12) (34.10) (9.16) (34.46) (9.80) 1.68 0.002Nomophobia (84.40) (22.18) (81.13) (21.62) (80.69) (23.07) 1.08 0.268
a = taken from the actual number of people in the family, provided by the respondents.
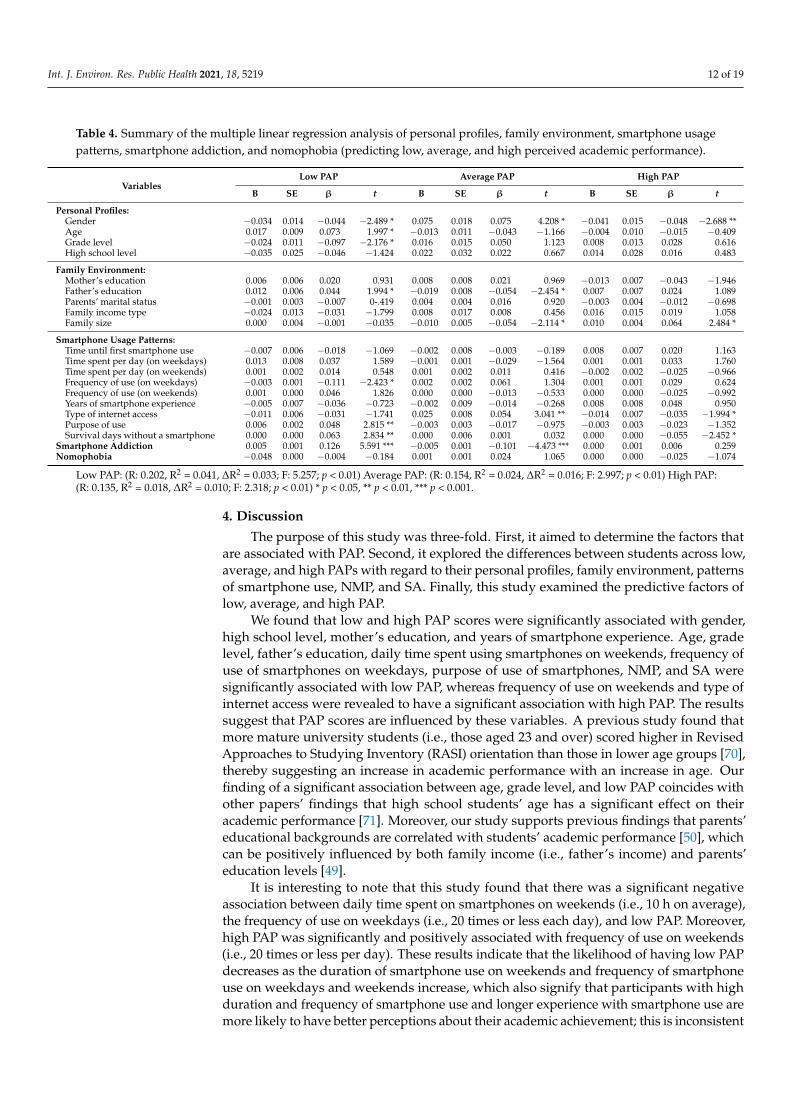
3.4. Predicton Factors of Low, Average, and High Perceived Academic Performance
Table 4 shows the results of the multiple linear regression analysis predicting low,average, and high PAP. Gender (β = −0.044; p < 0.05), age (β = 0.073; p < 0.05), gradelevel (β = −0.097; p < 0.05), father’s education (β = 0.044; p < 0.05), frequency of use onweekdays (β = −0.111; p < 0.05), purpose of use (β = 0.048; p < 0.01), survival days withouta smartphone (β = 0.063; p < 0.01), and SA (β = 0.126; p < 0.001) were significant predictorsof low PAP. On the other hand, high PAP was significantly predicted by gender (β = −0.048;p < 0.01), family size (β = 0.064; p < 0.05), type of internet access (β = −0.035; p < 0.05),and survival days without a smartphone (β = −0.055; p < 0.05), while gender (β = 0.075;p < 0.05), father’s education (β = −0.054; p < 0.05), family size (β = −0.054; p < 0.05), typeof internet access (β = 0.054; p < 0.01), and SA (β = −0.101; p < 0.001) were also significantpredictors of average PAP.
Int. J. Environ. Res. Public Health 2021, 18, 5219 12 of 19
Table 4. Summary of the multiple linear regression analysis of personal profiles, family environment, smartphone usagepatterns, smartphone addiction, and nomophobia (predicting low, average, and high perceived academic performance).
VariablesLow PAP Average PAP High PAP
B SE β t B SE β t B SE β t
Personal Profiles:Gender −0.034 0.014 −0.044 −2.489 * 0.075 0.018 0.075 4.208 * −0.041 0.015 −0.048 −2.688 **Age 0.017 0.009 0.073 1.997 * −0.013 0.011 −0.043 −1.166 −0.004 0.010 −0.015 −0.409Grade level −0.024 0.011 −0.097 −2.176 * 0.016 0.015 0.050 1.123 0.008 0.013 0.028 0.616High school level −0.035 0.025 −0.046 −1.424 0.022 0.032 0.022 0.667 0.014 0.028 0.016 0.483
Family Environment:Mother’s education 0.006 0.006 0.020 0.931 0.008 0.008 0.021 0.969 −0.013 0.007 −0.043 −1.946Father’s education 0.012 0.006 0.044 1.994 * −0.019 0.008 −0.054 −2.454 * 0.007 0.007 0.024 1.089Parents’ marital status −0.001 0.003 −0.007 0-.419 0.004 0.004 0.016 0.920 −0.003 0.004 −0.012 −0.698Family income type −0.024 0.013 −0.031 −1.799 0.008 0.017 0.008 0.456 0.016 0.015 0.019 1.058Family size 0.000 0.004 −0.001 −0.035 −0.010 0.005 −0.054 −2.114 * 0.010 0.004 0.064 2.484 *
Smartphone Usage Patterns:Time until first smartphone use −0.007 0.006 −0.018 −1.069 −0.002 0.008 −0.003 −0.189 0.008 0.007 0.020 1.163Time spent per day (on weekdays) 0.013 0.008 0.037 1.589 −0.001 0.001 −0.029 −1.564 0.001 0.001 0.033 1.760Time spent per day (on weekends) 0.001 0.002 0.014 0.548 0.001 0.002 0.011 0.416 −0.002 0.002 −0.025 −0.966Frequency of use (on weekdays) −0.003 0.001 −0.111 −2.423 * 0.002 0.002 0.061 1.304 0.001 0.001 0.029 0.624Frequency of use (on weekends) 0.001 0.000 0.046 1.826 0.000 0.000 −0.013 −0.533 0.000 0.000 −0.025 −0.992Years of smartphone experience −0.005 0.007 −0.036 −0.723 −0.002 0.009 −0.014 −0.268 0.008 0.008 0.048 0.950Type of internet access −0.011 0.006 −0.031 −1.741 0.025 0.008 0.054 3.041 ** −0.014 0.007 −0.035 −1.994 *Purpose of use 0.006 0.002 0.048 2.815 ** −0.003 0.003 −0.017 −0.975 −0.003 0.003 −0.023 −1.352Survival days without a smartphone 0.000 0.000 0.063 2.834 ** 0.000 0.006 0.001 0.032 0.000 0.000 −0.055 −2.452 *
Smartphone Addiction 0.005 0.001 0.126 5.591 *** −0.005 0.001 −0.101 −4.473 *** 0.000 0.001 0.006 0.259Nomophobia −0.048 0.000 −0.004 −0.184 0.001 0.001 0.024 1.065 0.000 0.000 −0.025 −1.074
Low PAP: (R: 0.202, R2 = 0.041, ∆R2 = 0.033; F: 5.257; p < 0.01) Average PAP: (R: 0.154, R2 = 0.024, ∆R2 = 0.016; F: 2.997; p < 0.01) High PAP:(R: 0.135, R2 = 0.018, ∆R2 = 0.010; F: 2.318; p < 0.01) * p < 0.05, ** p < 0.01, *** p < 0.001.
4. Discussion
The purpose of this study was three-fold. First, it aimed to determine the factors thatare associated with PAP. Second, it explored the differences between students across low,average, and high PAPs with regard to their personal profiles, family environment, patternsof smartphone use, NMP, and SA. Finally, this study examined the predictive factors oflow, average, and high PAP.
We found that low and high PAP scores were significantly associated with gender,high school level, mother’s education, and years of smartphone experience. Age, gradelevel, father’s education, daily time spent using smartphones on weekends, frequency ofuse of smartphones on weekdays, purpose of use of smartphones, NMP, and SA weresignificantly associated with low PAP, whereas frequency of use on weekends and type ofinternet access were revealed to have a significant association with high PAP. The resultssuggest that PAP scores are influenced by these variables. A previous study found thatmore mature university students (i.e., those aged 23 and over) scored higher in RevisedApproaches to Studying Inventory (RASI) orientation than those in lower age groups [70],thereby suggesting an increase in academic performance with an increase in age. Ourfinding of a significant association between age, grade level, and low PAP coincides withother papers’ findings that high school students’ age has a significant effect on theiracademic performance [71]. Moreover, our study supports previous findings that parents’educational backgrounds are correlated with students’ academic performance [50], whichcan be positively influenced by both family income (i.e., father’s income) and parents’education levels [49].
It is interesting to note that this study found that there was a significant negativeassociation between daily time spent on smartphones on weekends (i.e., 10 h on average),the frequency of use on weekdays (i.e., 20 times or less each day), and low PAP. Moreover,high PAP was significantly and positively associated with frequency of use on weekends(i.e., 20 times or less per day). These results indicate that the likelihood of having low PAPdecreases as the duration of smartphone use on weekends and frequency of smartphoneuse on weekdays and weekends increase, which also signify that participants with highduration and frequency of smartphone use and longer experience with smartphone use aremore likely to have better perceptions about their academic achievement; this is inconsistent
Int. J. Environ. Res. Public Health 2021, 18, 5219 13 of 19
with findings from a recent study on Chinese adolescents’ poor academic performance dueto prolonged smartphone use [72].
It seems that for Filipino high school students, smartphone use gives them the confi-dence to perform well in their studies. For example, perhaps they used smartphone appsfor learning, which could effectively enhance productivity and academic performance [73],as well as increase the likelihood of positively perceiving their academic improvement [22].Applying the same logic, Singaporean university students who used smartphones forlearning purposes reported having higher GPA scores [74]. In this study, accessing SNS orsocial media was the most common purpose of smartphone use. According to studies onSNSs [75,76], Twitter gave students more freedom to ask questions and have discussionsthat are helpful for enhancing students’ engagement and academic achievement [75]. Simi-larly, Facebook use helped promote co-curricular activities, which can lead to academicsuccess and boost individual well-being [76].
Our findings also suggested that having more years of smartphone experience (i.e.,5 years on average) was positively associated with high PAP. This indicates the possibilityof students with more years of smartphone experience or ownership having more positiveperceptions about their academic performance. To the best of our knowledge, no studyhas examined this relationship so far. However, a study among Turkish high schoolstudents found a positive correlation between duration of smartphone ownership andFOMO [77]. As mentioned earlier, students these days use smartphones for academiclearning purpose [73], thus the longer they own a smartphone, the more academic learningenhancement they benefit from; this, in turn, goes some way to explaining why they feelanxious when smartphones are inaccessible. Furthermore, we found that the purpose of use(i.e., SNS) was associated with low PAP. This suggests that the use of SNS as the purpose ofsmartphone use is associated with students’ poor perceptions of academic performance.This is in line with previous findings stating that the addictive use of social media leadsto low self-esteem or negative self-evaluation [78]. Additionally, studies in the past notedthat SNS use distracts students’ cognition and affects academic performance [79,80].
Furthermore, NMP and SA were found to be positively associated with low PAP,thereby suggesting that students perceive their academic performance to be poorer as theirlevels of NMP and SA increase. These findings are consistent with the results of a systematicreview about the adverse effects of NMP on academic performance [81] and a study amongnomophobic university students that demonstrated weak academic performance [82];similarly, a study among Turkish undergraduate students and other selected universitystudents found that there was a negative relationship between academic performance andSA [1,16], as well as between students’ in-class smartphone use and academic grades [83].As for adolescents and children, a study of screen-based activities (i.e., social media use)also found it to be negatively associated with academic performance [84].
We also found a significant difference between low, average, and high PAP in termsof gender, age, grade level, high school level, mother’s education, father’s education,time spent daily using smartphones on weekdays, frequency of use of smartphones onweekdays, years of smartphone experience, type of internet access, survival days without asmartphone, and SA. Surprisingly, participants in the high PAP group spent a significantlylonger time using their smartphones during weekdays, and had higher frequency ofsmartphone use on weekdays, and longer years of smartphone use experience than thosein the average and low PAP groups. Again, these findings indicate a better PAP whenhigh school students consistently use smartphones for learning purposes, as discussedearlier [22,72–76]. In addition, participants in the low PAP group had significantly higherlevels of smartphone addiction, which again confirms the positive association between SAand low PAP [1,16,83].
Participants in the high PAP group reported significantly lower survival days withouta smartphone than those in low and average groups. The majority (60%) of the participantsin this study indicated being able to survive for up to 3 days without their smartphones.This supports a recent survey in the Philippines, which reported that one out of three
Int. J. Environ. Res. Public Health 2021, 18, 5219 14 of 19
Filipinos could not survive without a smartphone [40]; Similar results were also found inthe Australian context [85], which indicated that not being able to use a smartphone maylead to NMP [26–29] and FOMO [86].
Furthermore, we found that gender was a significant predictor of low, average, andhigh PAP, which is in line with previous findings that suggested that gender is an impor-tant factor in academic grades (whereby women are more motivated in terms of academicachievements than men) [87]. The education level of fathers and SA were also signifi-cant predictors for both low and average PAP. These are consistent with previous studiesthat found a significant relationship between parental educational levels and academicperformance of students [88], as well as the possibility of fathers’ academic efficacy en-hancing academic performance, especially for girls [89]. Other studies have also concludedthat SA is a predictive factor for academic performance [16], and there is a significantassociation between problematic smartphone use and lower GPAs or worse academicperformances [12].
In addition, family size and type of internet access were significant predictors ofaverage and high PAP levels. This indicates that family size (i.e., average size of 5.53) andthe way students access the internet influence their PAP. A study among Nigerian studentsfound a significant relationship between family size and academic performance [88]. Astudy conducted among postsecondary level students also found that those who haveaccess to websites at school (regardless of the type of access) and made use of the tools fore-learning performed better in their examinations [90]. Furthermore, age, grade, frequencyof smartphone use on weekdays, and purpose of use were significant predictors of low PAP.In other words, high school students’ (who were at an average age and grade level of 14.76and 9.16, respectively) perceptions of academic performance are significantly impactedwhen they use their smartphones at least 20 times a day on weekdays and primarilyfor SNS.
Another study was conducted examining the effect of TTF of smartphones on PAPand smartphone use among Korean college students [20], and it was found that the TTFof smartphones directly influenced the impact of students’ PAP and indirectly influencedtheir attitude toward smartphone use [20]. To the best of our knowledge, no studieshave examined the impact of frequency and purpose of smartphone use on students’ PAP.Nonetheless, in a study among Turkish adolescents, school achievement was found to be asignificant factor for problematic smartphone use or SA [25], suggesting that smartphoneuse impacts students’ academic performance. This confirms previous findings that there aresignificant associations between smartphone use and students’ exam results [9], frequencyof smartphone use and academic success [7], and higher smartphone use and poor academicperformance [14].
The purpose of smartphone use (i.e., SNS) significantly predicted low PAP in thesense that they were positively associated with each other, which is again consistent withprevious findings that there was a negative association between social media use andacademic performance [24,84]. Moreover, in a study among undergraduate students inSingapore, mobile phone activity (i.e., improper use of smartphones) was found to be acritical predictive factor that mediated the relationship between smartphone dependencyand GPA scores [23]. However, [23] pointed out that the effect of social media use onstudents’ GPAs was not as bad as the effect of playing video games. Thus, personal traits(i.e., self-control and self-efficacy) help students to effectively handle smartphone use inorder to achieve better academic performance [21] and to enhance their positive perceptionsof their own academic performance [22].
5. Conclusions
This study clearly revealed the significant association between personal profiles,family environment, patterns of smartphone use, NMP, and SA, and students’ low andhigh PAP. Our findings suggest that Filipino high school students with high smartphoneuse perceived their academic performance to be better. However, given that frequency of
Int. J. Environ. Res. Public Health 2021, 18, 5219 15 of 19
smartphone use on weekdays, purpose of use, and SA significantly predict low PAP, weconclude that problematic use of smartphones impacts how Filipino high school studentsperceived their academic performance.
5.1. Implications
This study found a high percentage of NMP and SA rates among participants, whichindicate a high level of smartphone dependence. Despite the likelihood of high PAPwhen smartphone use increases, proper guidelines on smartphone use should be pro-vided at home and in school to raise awareness of the adverse effects of SA on students’academic performance.
5.2. Limitations and Future Directions
Despite its contributions, this study has some limitations: first, as this is a cross-sectional study, it is difficult to determine the cause and effect relationship. To address thisissue, it is recommended that a longitudinal research design should be employed. Second,this study uses a non-probability convenience sampling method in which we cannot gener-alize the results to the entire population. To ensure that the sample is representative of theoverall population, a probability sampling method should be used. Third, our participantsconsisted of high school students. Future research should include a comparative studybetween NMP, SA, and PAP among participants with different levels of education (i.e.,elementary, undergraduate, and graduate school students). Furthermore, data on patternsof smartphone use, such as duration and frequency of smartphone use on weekdays andweekends, were collected through self-reports. This raises the issue of sincerity and accu-racy of the reported hours and frequency. To avoid this in future studies, a smartphone appshould be used to keep record of the actual daily duration and frequency of smartphoneuse in order to obtain accurate smartphone usage data. Finally, PAP focuses more onhow the participants evaluate their scholastic performance, which also paves the way forexamining their self-esteem, and thus results cannot be compared with previous studieswhich used GPA to evaluate participants’ academic performance. Thus, in future studies itis recommended to use both PAP and overall GPA to evaluate the impact of demographics,patterns of smartphone use, NMP, and SA on students’ academic performance.
Author Contributions: Conceptualization, D.B.B., N.K. and S.-H.K.; methodology, D.B.B. and N.K.;software, D.B.B.; formal analysis, D.B.B. and S.-H.K.; investigation, D.B.B.; resources, D.B.B.; datacuration, D.B.B. and S.-H.K.; writing—original draft preparation, D.B.B.; writing—review and editing,N.K. and S.-H.K.; visualization, D.B.B., N.K. and S.-H.K.; supervision, N.K.; project administration,D.B.B.; funding acquisition, N.K. and S.-H.K. All authors have read and agreed to the publishedversion of the manuscript.
Funding: This paper was supported by the Sahmyook University Research Fund in 2020 (RI12020004).
Institutional Review Board Statement: The study was conducted according to the guidelines of theDeclaration of Helsinki, and approved by the Institutional Review Board of Sahmyook University(2-7001793-AB-N-012019035HR 17 October 2019).
Informed Consent Statement: Informed consent was obtained from all subjects involved in the study.
Data Availability Statement: The data presented in this study are available on request from thecorresponding author. The data are not publicly available due to confidentiality.
Acknowledgments: The authors would like to thank the anonymous reviewers for their insightfulfeedback and suggestions for the revision of the manuscript and the respondents who completed theonline survey.
Conflicts of Interest: The authors declare no conflict of interest. The funders had no role in the designof the study; in the collection, analyses, or interpretation of data; in the writing of the manuscript, orin the decision to publish the results.
Int. J. Environ. Res. Public Health 2021, 18, 5219 16 of 19
References1. Samaha, M.; Hawi, N.S. Relationships among smartphone addiction, stress, academic performance, and satisfaction with life.
Comput. Hum. Behav. 2016, 57, 321–325. [CrossRef]2. Haug, S.; Castro, R.P.; Kwon, M.; Filler, A.; Kowatsch, T.; Schaub, M.P. Smartphone use and smartphone addiction among young
people in Switzerland. J. Behav. Addict. 2015, 4, 299–307. [CrossRef] [PubMed]3. Kwon, M.; Lee, J.Y.; Won, W.Y.; Park, J.W.; Min, J.A.; Hahn, C.; Gu, X.; Choi, J.H.; Kim, D.J. Development and validation of a
Smartphone Addiction Scale (SAS). PLoS ONE 2013, 8, e56936. [CrossRef] [PubMed]4. Lemola, S.; Perkinson-Gloor, N.; Brand, S.; Dewald-Kaufmann, J.F.; Grob, A. Adolescents’ electronic media use at night, sleep
disturbance, and depressive symptoms in the smartphone age. J. Youth Adolesc. 2015, 44, 405–418. [CrossRef]5. Tamura, H.; Nishida, T.; Tsuji, A.; Sakakibara, H. Association between excessive use of mobile phone and insomnia and depression
among Japanese adolescents. Int. J. Environ. Res. Public Health 2017, 14, 701. [CrossRef]6. Ahmed, R.R.; Salman, F.; Malik, S.A.; Streimikiene, D.; Soomro, R.H.; Pahi, M.H. Smartphone use and academic performance of
university students: A mediation and moderation analysis. Sustainability 2020, 12, 439. [CrossRef]7. Amez, S.; Vujic, S.; De Marez, L.; Baert, S. Smartphone Use and Academic Performance: First Evidence from Longitudinal Data.
IZA Discussion Paper No. 12862. Available online: https://ssrn.com/abstract=3521679 (accessed on 15 August 2020).8. Amez, S.; Baert, S. Smartphone use and academic performance: A literature review. Int. J. Educ. Res. 2020, 103, 101618. [CrossRef]9. Baert, S.; Vujic, S.; Amez, S.; Claeskens, M.; Daman, T.; Maeckelberghe, A.; Omey, E.; De Marez, L. Smartphone use and academic
performance: Correlation or causal relationship? Kyklos 2020, 73, 22–46. [CrossRef]10. Chaudhury, P.; Tripathy, H.K. A study on impact of smartphone addiction on academic performance. Int. J. Eng. Technol. 2018, 7,
50–53. [CrossRef]11. Felisoni, D.D.; Godoi, A.S. Cell phone usage and academic performance: An experiment. Comput. Educ. 2018, 117, 175–187.
[CrossRef]12. Grant, J.E.; Lust, K.; Chamberlain, S.R. Problematic smartphone use associated with greater alcohol consumption, mental health
issues, poorer academic performance, and impulsivity. J. Behav. Addict. 2019, 8, 335–342. [CrossRef]13. Hawi, N.S.; Samaha, M. To excel or not to excel: Strong evidence on the adverse effect of smartphone addiction on academic
performance. Comput. Educ. 2016, 98, 81–89. [CrossRef]14. Kim, M.H.; Min, S.; Ahn, J.S.; An, C.; Lee, J. Association between high adolescent smartphone use and academic impairment,
conflicts with family members or friends, and suicide attempts. PLoS ONE 2019, 14, e0219831. [CrossRef]15. Nayak, J.K. Relationship among smartphone usage, addiction, academic performance and the moderating role of gender: A
study of higher education students in India. Comput. Educ. 2018, 123, 164–173. [CrossRef]16. Omer, O.Z.E.R. Smartphone addiction and fear of missing out: Does smartphone use matter for students’ academic performance?
J. Comput. Educ. Res. 2020, 8, 344–355. [CrossRef]17. Yildiz Durak, H.Y. Investigation of nomophobia and smartphone addiction predictors among adolescents in Turkey: Demographic
variables and academic performance. Soc. Sc. J. 2019, 56, 492–517. [CrossRef]18. Ng, S.F.; Hassan, N.S.I.C.; Nor, N.H.M.; Malek, N.A.A. The relationship between smartphone use and academic performance: A
case of students in a Malaysian tertiary institution. Malays. Online J. Educ. Technol. 2017, 5, 58–70.19. Kibona, L.; Mgaya, G. Smartphones’ effects on academic performance of higher learning students. J. Multidiscip. Eng. Sci. Technol.
2015, 2, 777–784.20. Yi, Y.J.; You, S.; Bae, B.J. The influence of smartphones on academic performance: The development of the technology-to-
performance chain model. Library Hi Tech 2016, 34, 480–499. [CrossRef]21. Troll, E.S.; Friese, M.; Loschelder, D.D. How students’ self-control and smartphone-use explain their academic performance.
Comput. Hum. Behav. 2020, 106624. [CrossRef]22. Han, S.; Yi, Y.J. How does the smartphone usage of college students affect academic performance? J. Comput. Assist. Learn. 2019,
35, 13–22. [CrossRef]23. Lin, T.T.; Chiang, Y.H. Investigating predictors of smartphone dependency symptoms and effects on academic performance,
improper phone use and perceived sociability. Int. J. Mob. Commun. 2017, 15, 655–676. [CrossRef]24. Giunchiglia, F.; Zeni, M.; Gobbi, E.; Bignotti, E.; Bison, I. Mobile social media usage and academic performance. Comput. Hum.
Behav. 2018, 82, 177–185. [CrossRef]25. Yıldız Durak, H.Y. What would you do without your smartphone? Adolescents’ social media usage, locus of control, and
loneliness as a predictor of nomophobia. Addicta Turk. J. Addict. 2019, 5, 1–15.26. Bian, M.; Leung, L. Linking loneliness, shyness, smartphone addiction symptoms, and patterns of smartphone use to social
capital. Soc. Sci. Comput. Rev. 2015, 33, 61–79. [CrossRef]27. Emanuel, R.; Bell, R.; Cotton, C.; Craig, J.; Drummond, D.; Gibson, S.; Harris, A.; Harris, M.; Hatcher-Vance, C.; Jones, S.; et al.
The truth about smartphone addiction. Coll. Stud. J. 2015, 49, 291–299.28. SecurEnvoy. 66% of the Population Suffer from Nomophobia the Fear of Being without Their Phone. Available online:
http://www.securenvoy.com/blog/2012/02/16/66-of-the-population-suffer-fromnomophobia-the-fear-of-being-without-their-phone/ (accessed on 26 June 2018).
29. Yildirim, C. Exploring the Dimensions of Nomophobia: Developing and Validating a Questionnaire Using Mixed MethodsResearch. Master’s Thesis, Iowa State University, Ames, IA, USA, 2014.
Int. J. Environ. Res. Public Health 2021, 18, 5219 17 of 19
30. Buctot, D.B.; Kim, N.; Park, K.E. Development and evaluation of smartphone detox program for university students. Int. J.Contents 2018, 14, 1–9. [CrossRef]
31. Byeon, H.S. The review of needs and benefits of digital detox. Kor. Man. Consult. Rev. 2017, 17, 71–78.32. Griffiths, M.D. A components model of addiction within a biopsychosocial framework. J. Subst. Use 2005, 10, 191–197. [CrossRef]33. Goswami, V.; Singh, D.R. Impact of mobile phone addiction on adolescent’s life: A literature review. Int. J. Home Sci. 2016, 2,
69–74.34. Gurbuz, I.B.; Ozkan, G. What is your level of nomophobia? An investigation of prevalence and level of nomophobia among
young people in Turkey. Commun. Ment. Health J. 2020, 56, 814–822. [CrossRef] [PubMed]35. Güzel, S. Fear of the age: Nomophobia (No-Mobile-Phone). J. Acad. Perspect. Soc. Stud. 2018, 1, 20–24. [CrossRef]36. Gezgin, D.M.; Sumuer, E.; Arslan, O.; Yildirim, S. Nomophobia prevalence among pre-service teachers: A case of Trakya
University. Trakya Üniversitesi Egitim Fakültesi Dergisi 2017, 7, 86–95.37. Lucas, D.L. Using Smartphones among Filipinos’ Top Daily Activities. Available online: http://business.inquirer.net/183389
/using-smartphones-Among-filipinos-top-daily-activities#ixzz5JLd1GHex/ (accessed on 25 June 2018).38. Sanchez, M.J. Smartphone Users in the Philippines 2017. Available online: https://www.statista.com/statistics/467186/forecast-
of-smartphone-users-in-the-philippines/ (accessed on 10 April 2021).39. Buctot, D.B.; Kim, N.; Kim, J.J. Factors associated with smartphone addiction prevalence and its predictive capacity for health-
related quality of life among Filipino adolescents. Child. Youth Serv. Rev. 2020, 104758. [CrossRef]40. Roa, A. One of 3 Filipinos Can’t Live without Cell Phones—Survey. Available online: http://technology.inquirer.net/18168/one-
of-3-filipinos-cant-live-without-cell-phones-survey#ixzz5JLeeJKWO (accessed on 25 June 2018).41. DepEd News. DepEd Order Prohibits the Use of Cell Phones during Class Hours. Available online: https://www.depedclick.cf/
2019/04/deped-order-prohibits-use-of-cell.html (accessed on 6 December 2020).42. Van Deursen, A.J.; Bolle, C.L.; Hegner, S.M.; Kommers, P.A. Modeling habitual and addictive smartphone behavior: The role of
smartphone usage types, emotional intelligence, social stress, self-regulation, age, and gender. Comput. Hum. Behav. 2015, 45,411–420. [CrossRef]
43. Roberts, J.A.; Yaya, L.H.; Manolis, C. The invisible addiction: Cell-phone activities and addiction among male and female collegestudents. J. Behav. Addict. 2014, 3, 254–265. [CrossRef]
44. Smetaniuk, P. A preliminary investigation into the prevalence and prediction of problematic cell phone use. J. Behav. Addict. 2014,3, 41–53. [CrossRef]
45. Buctot, D.B.; Kim, N.; Kim, S.H. The role of nomophobia and smartphone addiction in the lifestyle profiles of junior and seniorhigh school students in the Philippines. Soc. Sci. Humanit. Open 2020, 2, 100035.
46. Tran, D. Classifying nomophobia as smart-phone addiction disorder. UC Merced Undergrad. Res. J. 2016, 9, 1–22.47. Kim, H.J.; Min, J.Y.; Min, K.B.; Lee, T.J.; Yoo, S. Relationship among family environment, self-control, friendship quality, and
adolescents’ smartphone addiction in South Korea: Findings from nationwide data. PLoS ONE 2018, 13, e0190896. [CrossRef]48. Dinc, M. Technology dependence and youth. J. Youth Stud. 2015, 3, 31–65.49. Soharwardi, M.A.; Fatima, A.; Nazir, R.; Firdous, A. Impact of parental socioeconomic status on academic performance of
students: A case study of Bahawalpur, Pakistan. J. Econ. Econ. Educ. Res. 2020, 21, 1–8.50. Boateng, S.; Asare, D.; Manu, P.T.; Sefah, E.A.; Adomako, J. Relationship between students’ home background and their academic
performance: A case of some selected senior high school students in rural districts in Ashanti Region, Ghana. J. Educ. 2020.[CrossRef]
51. Park, H.; Lee, K.S. The association of family structure with health behavior, mental health, and perceived academic achievementamong adolescents: A 2018 Korean nationally representative survey. BMC Public Health 2020, 20, 510. [CrossRef]
52. Gezgin, D.M.; Cakir, O.; Yildirim, S. The relationship between levels of nomophobia prevalence and internet addiction amonghigh school students: The factors influencing nomophobia. Int. J. Res. Educ. Sci. 2018, 4, 215–225. [CrossRef]
53. Jilisha, G.; Venkatachalam, J.; Menon, V.; Olickal, J.J. Nomophobia: A mixed-methods study on prevalence, associated factors,and perception among college students in Puducherry, India. Indian J. Psychol. Med. 2019, 41, 541–548. [CrossRef]
54. Lee, H.; Ahn, H.; Choi, S.; Choi, W. The SAMS: Smartphone Addiction Management System and verification. J. Med. Syst. 2014,38, 1. [CrossRef]
55. Lin, Y.H.; Lin, Y.C.; Lee, Y.H.; Lin, P.H.; Lin, S.H.; Chang, L.R.; Tseng, H.W.; Yen, L.Y.; Yang, C.C.; Kuo, T.B. Time distortionassociated with smartphone addiction: Identifying smartphone addiction via a mobile application (App). J. Psychiatr. Res. 2015,65, 139–145. [CrossRef]
56. Argumosa-Villar, L.; Boada-Grau, J.; Vigil-Colet, A. Exploratory investigation of theoretical predictors of nomophobia using theMobile Phone Involvement Questionnaire (MPIQ). J. Adolesc. 2017, 56, 127–135. [CrossRef]
57. Von Stumm, S.; Hell, B.; Premuzic, T. The hungry mind: Intellectual curiosity is the third pillar of academic performance. Perspect.Psychol. Sci. 2011, 6, 574–588. [CrossRef]
58. Jayanthi, S.V.; Balakrishnan, S.; Ching, A.L.S.; Latiff, N.A.A.; Nasirudeen, A.M.A. Factors contributing to academic performanceof students in a tertiary institution in Singapore. Am. J. Educ. Res. 2014, 2, 752–758. [CrossRef]
59. Garton, B.L.; Ball, A.L.; Dyer, J.E. The academic performance and retention of college of agriculture students. J. Agric. Educ. 2002,43, 46–56. [CrossRef]
Int. J. Environ. Res. Public Health 2021, 18, 5219 18 of 19
60. Kennett, D.J.; Reed, M.J. Factors influencing academic success and retention following a 1st-year post-secondary success course.Educ. Res. Eval. 2009, 15, 153–166. [CrossRef]
61. Lei, P.W.; Bassiri, D.; Schultz, E.M. Alternatives to the Grade Point Average as a Measure of Academic Achievement in College; ACTResearch Report Series; American Coll. Testing Program: Iowa City, IA, USA, 2001. Available online: https://eric.ed.gov/?id=ED462407 (accessed on 7 June 2020).
62. Clarkson, R.K. Effect of Gratitude on Life Satisfaction and Perceived Academic Performance in Psychology Students. Master’sThesis, The University of Waikato, Hamilton, New Zealand. Available online: https://hdl.handle.net/10289/13867 (accessed on10 December 2020).
63. Bandura, A. Human agency in social cognitive theory. Am. Psychol. 1989, 44, 1175–1184. [CrossRef] [PubMed]64. Davis, R.A. A cognitive-behavioral model of pathological internet use. Comput. Hum. Behav. 2001, 17, 187–195. [CrossRef]65. Kwon, M.; Kim, D.J.; Cho, H.; Yang, S. The Smartphone Addiction Scale: Development and validation of a short version for
adolescents. PLoS ONE 2013, 8, e83558. [CrossRef]66. IBM. SPSS Statistics for Windows, Version 23.0; IBM Corp.: Armonk, NY, USA, 2015.67. Schreiber-Gregory, D. Logistic and linear regression assumptions: Violation recognition and control. In Proceedings of the 26th
SESUG Conference, St. Pete Beach, FL, USA, 14–17 October 2018; p. 247.68. Ghasemi, A.; Zahediasi, S. Normality tests for statistical analysis: A guide for non-statisticians. Int. J. Endocrinol. Metab. 2012, 10,
486–489. [CrossRef]69. Coakes, S.J. SPSS: Analysis without Anguish: Version 12.0 for Windows; Wiley: Queensland, Australia, 2005.70. Sadler-Smith, E. Approaches to studying: Age, gender and academic performance. Educ. Stud. 1996, 22, 367–379. [CrossRef]71. Momanyi, J.M.; Too, J.; Simiyu, C. Effect of students’ age on academic motivation and academic performance among high school
students in Kenya. Asian J. Educ. E-learn. 2015, 3, 337–342.72. Liu, X.; Luo, Y.; Liu, Z.Z.; Yang, Y.; Liu, J.; Jia, C.X. Prolonged mobile phone use is associated with poor academic performance in
adolescents. Cyberpsychol. Behav. Soc. Netw. 2020, 23, 303–311. [CrossRef]73. Woodcock, B.; Middleton, A.; Nortcliffe, A. Considering the Smartphone Learner: An investigation into student interest in the
use of personal technology to enhance their learning. Stud. Engagem. Exp. J. 2012, 1, 1–15. [CrossRef]74. Zhao, J.; Yuping, W.; Maideen, I.; Moe, Z.K.; Nasirudeen, A.M.A. The relationship between smartphone use and academic
performance in a sample of tertiary students in Singapore: A cross-sectional study. J. Educ. Technol. 2018, 14, 28–35.75. Junco, R.; Heiberger, G.; Loken, E. The effect of twitter on college student engagement and grades. J. Comput. Assist. Learn. 2011,
27, 119–132. [CrossRef]76. Junco, R. The relationship between frequency of Facebook use, participation in Facebook activities, and student engagement.
Comput. Educ. 2012, 58, 162–171. [CrossRef]77. Gezgin, D.M. Understanding patterns for smartphone addiction: Age, sleep duration, social network use and fear of missing out.
Cypriot J. Educ. Sci. 2018, 13, 166–177. [CrossRef]78. Andreassen, C.S.; Pallesen, S.; Griffiths, M.D. The relationship between addictive use of social media, narcissism, and self-esteem:
Findings from a large national survey. Addict. Behav. 2017, 64, 287–293. [CrossRef]79. Masood, A.; Luqman, A.; Feng, Y.; Ali, A. Adverse consequences of excessive social networking site use on academic performance:
Explaining underlying mechanism from stress perspective. Comput. Hum. Behav. 2020, 113, 106476. [CrossRef]80. Liu, D.; Kirschner, P.A.; Karpinski, A.C. A meta-analysis of the relationship of academic performance and Social Network Site use
among adolescents and young adults. Comput. Hum. Behav. 2017, 77, 148–157. [CrossRef]81. Rodríguez-García, A.M.; Moreno-Guerrero, A.J.; López Belmonte, J. Nomophobia: An individual’s growing fear of being without
a smartphone—A systematic literature review. Int. J. Environ. Res. Public Health 2020, 17, 580. [CrossRef]82. Qutishat, M.; Lazarus, E.R.; Razmy, M.; Packianathan, S. University students’ nomophobia prevalence, sociodemographic factors
and relationship with academic performance at a university in Oman. Int. J. Africa Nurs. Sci. 2020, 100206. [CrossRef]83. Bjerre-Nielsen, A.; Andersen, A.; Minor, K.; Lassen, D.D. The negative effect of smartphone use on academic performance may be
overestimated: Evidence from a 2-year panel study. Psychol. Sci. 2020, 31, 1351–1362. [CrossRef] [PubMed]84. Adelantado-Renau, M.; Moliner-Urdiales, D.; Cavero-Redondo, I.; Beltran-Valls, M.R.; Martínez-Vizcaíno, V.; Álvarez-Bueno, C.
Association between screen media use and academic performance among children and adolescents: A systematic review andmeta-analysis. JAMA Pediatr. 2019, 173, 1058–1067. [CrossRef] [PubMed]
85. Wajcman, J.; Bittman, M.; Jones, P.; Johnstone, L.; Brown, J. The Impact of the Mobile Phone on Work/Life Balance. Survey Report;Australian Mobile Telecommunications Association & Australian National University: Canberra, Australia, 2007.
86. Rozgonjuk, D.; Sindermann, C.; Elhai, J.D.; Montag, C. Fear of missing out (FOMO) and social media’s impact on daily-life andproductivity at work: Do WhatsApp, Facebook, Instagram, and Snapchat use disorders mediate that association? Addict. Behav.2020, 110, 106487. [CrossRef] [PubMed]
87. Kusnierz, C.; Rogowska, A.M.; Pavlova, I. Examining gender differences, personality traits, academic performance, andmotivation in Ukrainian and Polish students of physical education: A cross-cultural study. Int. J. Environ. Res. Public Health 2020,17, 5729. [CrossRef]
88. Amoo, T.B.; Adeyinka, O.P.; Aderibigbe, A.D. Perceived effects of parental socio-economic status on students’ academicperformance among teachers in Odeda Local Government, Ogun State, Nigeria. Int. J. Acad. Res. Bus. Soc. Sci. 2018, 8. [CrossRef]
Int. J. Environ. Res. Public Health 2021, 18, 5219 19 of 19
89. Tam, V.C. A comparison of fathers’ and mothers’ contributions in the prediction of academic performance of school-age childrenin Hong Kong. Int. J. Psychol. 2009, 44, 147–156. [CrossRef]
90. Nora, A.; Snyder, B.P. Technology and higher education: The impact of e-learning approaches on student academic achievement,perceptions and persistence. J. Coll. Stud. Ret. 2008, 10, 3–19. [CrossRef]