Permanent Functional Reorganization of Retinal Circuits Induced by Early Long-Term Visual...
11
Development/Plasticity/Repair Permanent Functional Reorganization of Retinal Circuits Induced by Early Long-Term Visual Deprivation Stefano Di Marco, 1,2,3 Vincent A. Nguyen, 2,3 Silvia Bisti, 1 and Dario A. Protti 2,3 1 Department of Science and Biomedical Technology, University of L’Aquila, L’Aquila 67100, Italy, and 2 Discipline of Physiology and 3 Bosch Institute, The University of Sydney, New South Wales 2006, Australia Early sensory experience shapes the functional and anatomical connectivity of neuronal networks. Light deprivation alters synaptic transmission and modifies light response properties in the visual system, from retinal circuits to higher visual centers. These effects are more pronounced during a critical period in juvenile life and are mostly reversed by restoring normal light conditions. Here we show that complete light deprivation, from birth to periods beyond the critical period, permanently modifies the receptive field properties of retinal ganglion cells. Visual deprivation reduced both the strength of light responses in ganglion cells and their receptive field size. Light deprivation produced an imbalance in the ratio of inhibitory to excitatory inputs, with a shift toward larger inhibitory conductances. Ganglion cell receptive fields in visually deprived animals showed a spatial mismatch of inhibitory and excitatory inputs and inhibitory inputs were highly scattered over the receptive field. These results indicate that visual experience early in life is critical for the refinement of retinal circuits and for appropriate signaling of the spatiotemporal properties of visual stimuli, thus influencing the response proper- ties of neurons in higher visual centers and their processing of visual information. Introduction In mammals, visual experience is critical for the normal develop- ment of the neural circuitry of the visual pathways (for review see Grubb and Thompson, 2004; Huberman et al., 2008). Visual de- privation in early development leads to a loss of responsiveness and orientation selectivity in cortical cells, reduced visual acuity and convergent strabismus (Cynader et al., 1976; Mitchell, 1988). These effects are mostly reversible if normal visual experience is allowed before the end of a developmental critical period. Al- though initial evidence suggested that deprivation affects princi- pally the circuitry of the visual cortex (Wiesel and Hubel, 1963; Baro et al., 1990), recent evidence demonstrates changes at sev- eral levels of the visual pathways. The development and maturation of individual retinal gan- glion cells (RGCs) have been described in terms of both their morphology (Maslim and Stone, 1988; Bodnarenko et al., 1999; Diao et al., 2004; Mehta and Sernagor, 2006a,b; Coombs et al., 2007) and functional responsiveness and receptive field (RF) or- ganization (Masland, 1977; Tootle, 1993). Pioneering experi- ments showed that short-term blockage of input from ON depolarizing bipolar cells reversibly delays the stratification of RGC dendritic trees (Bodnarenko and Chalupa, 1993; Bodnarenko et al., 1995). Later studies showed that dark rearing prevents and delays the developmental pruning of RGC dendritic trees (Tian and Copenhagen, 2003; Landi et al., 2007; Liu et al., 2007b). Visual experience also determines the proportion of bistratified ON-OFF ganglion cells, and the rate of spontaneous synaptic activity (Tian and Copenhagen, 2001, 2003; Landi et al., 2007; Liu et al., 2007a). Although the mechanisms of these envi- ronmental influences on RGC development are unknown, it is likely that activity-driven refinement modulates genetically pro- grammed circuits (Wang et al., 2001; Mumm et al., 2005). Changes in synaptic activity occur in parallel with the segregation of RGC dendrites. Tian et al. (2001) reported a surge in the fre- quency of spontaneous synaptic events in mice RGCs at postnatal days 22–27 (P22-P27), which is reversibly suppressed by dark rearing (Tian and Copenhagen, 2001). More recently, it was shown that early visual deprivation produces permanent changes in the spontaneous synaptic activity recorded from rat RGCs (Giovannelli et al., 2008). Early in development, GABA-mediated currents in amacrine cells and RGCs are depolarizing and then, due to a developmental shift in the chloride equilibrium potential, become hyperpolariz- ing (Zhang et al., 2006). Depolarizing GABAergic activity plays a crucial role in modulating the bursting activity of RGCs (Fischer et al., 1998) and the spatial and temporal properties of retinal waves (Sernagor et al., 2003; Leitch et al., 2005; Wang et al., 2007). It is not known, however, whether the development of retinal circuits involves changes in the strength and/or spatial distribu- tion of light-evoked inhibitory and excitatory inputs onto RGCs. We have examined RF organization and response strength in RGCs in normal controls and in rats born and raised in complete Received Aug. 7, 2009; accepted Sept. 19, 2009. This work was supported by Australian National Health and Medical Research Council of Australia Grant 307622 and Australian Research Council Grant DP0988227 to D.A.P., Programmi di ricerca di Rilevante Interesse Nazionale 2006, and From Molecules to Man (Agenzia Spaziale Italiana project) to S.B., and Association for Research between Italy and Australia and Programmi Operativi Regionali (Abruzzo) awards to S.D.M. We thank Drs. Bogdan Dreher, Krishna Ghosh, Cathy Leamey, Atomu Sawatari, Samuel Solomon, and Jonathan Stone for critical input and comments on this manuscript. S.B. and D.A.P. conceived the experiments. S.D.M., V.A.N., S.B., and D.A.P. designed the experiments. S.D.M., V.A.N., and D.A.P. performed the experiments. S.D.M. and D.A.P. analyzed the data. D.A.P. wrote the analysis software, and S.B. and D.A.P. wrote the paper. Correspondence should be addressed to Dr. Dario A. Protti, Anderson Stuart Building (F13), Discipline of Physi- ology and Bosch Institute, The University of Sydney, NSW 2006, Australia. E-mail: [email protected]. DOI:10.1523/JNEUROSCI.3854-09.2009 Copyright © 2009 Society for Neuroscience 0270-6474/09/2913691-11$15.00/0 The Journal of Neuroscience, October 28, 2009 • 29(43):13691–13701 • 13691
Transcript of Permanent Functional Reorganization of Retinal Circuits Induced by Early Long-Term Visual...
Development/Plasticity/Repair
Permanent Functional Reorganization of Retinal CircuitsInduced by Early Long-Term Visual Deprivation
Stefano Di Marco,1,2,3 Vincent A. Nguyen,2,3 Silvia Bisti,1 and Dario A. Protti2,3
1Department of Science and Biomedical Technology, University of L’Aquila, L’Aquila 67100, Italy, and 2Discipline of Physiology and 3Bosch Institute, TheUniversity of Sydney, New South Wales 2006, Australia
Early sensory experience shapes the functional and anatomical connectivity of neuronal networks. Light deprivation alters synaptictransmission and modifies light response properties in the visual system, from retinal circuits to higher visual centers. These effects aremore pronounced during a critical period in juvenile life and are mostly reversed by restoring normal light conditions. Here we show thatcomplete light deprivation, from birth to periods beyond the critical period, permanently modifies the receptive field properties of retinalganglion cells. Visual deprivation reduced both the strength of light responses in ganglion cells and their receptive field size. Lightdeprivation produced an imbalance in the ratio of inhibitory to excitatory inputs, with a shift toward larger inhibitory conductances.Ganglion cell receptive fields in visually deprived animals showed a spatial mismatch of inhibitory and excitatory inputs and inhibitoryinputs were highly scattered over the receptive field. These results indicate that visual experience early in life is critical for the refinementof retinal circuits and for appropriate signaling of the spatiotemporal properties of visual stimuli, thus influencing the response proper-ties of neurons in higher visual centers and their processing of visual information.
IntroductionIn mammals, visual experience is critical for the normal develop-ment of the neural circuitry of the visual pathways (for review seeGrubb and Thompson, 2004; Huberman et al., 2008). Visual de-privation in early development leads to a loss of responsivenessand orientation selectivity in cortical cells, reduced visual acuityand convergent strabismus (Cynader et al., 1976; Mitchell, 1988).These effects are mostly reversible if normal visual experience isallowed before the end of a developmental critical period. Al-though initial evidence suggested that deprivation affects princi-pally the circuitry of the visual cortex (Wiesel and Hubel, 1963;Baro et al., 1990), recent evidence demonstrates changes at sev-eral levels of the visual pathways.
The development and maturation of individual retinal gan-glion cells (RGCs) have been described in terms of both theirmorphology (Maslim and Stone, 1988; Bodnarenko et al., 1999;Diao et al., 2004; Mehta and Sernagor, 2006a,b; Coombs et al.,2007) and functional responsiveness and receptive field (RF) or-ganization (Masland, 1977; Tootle, 1993). Pioneering experi-ments showed that short-term blockage of input from ON
depolarizing bipolar cells reversibly delays the stratification ofRGC dendritic trees (Bodnarenko and Chalupa, 1993;Bodnarenko et al., 1995). Later studies showed that dark rearingprevents and delays the developmental pruning of RGC dendritictrees (Tian and Copenhagen, 2003; Landi et al., 2007; Liu et al.,2007b). Visual experience also determines the proportion ofbistratified ON-OFF ganglion cells, and the rate of spontaneoussynaptic activity (Tian and Copenhagen, 2001, 2003; Landi et al.,2007; Liu et al., 2007a). Although the mechanisms of these envi-ronmental influences on RGC development are unknown, it islikely that activity-driven refinement modulates genetically pro-grammed circuits (Wang et al., 2001; Mumm et al., 2005).Changes in synaptic activity occur in parallel with the segregationof RGC dendrites. Tian et al. (2001) reported a surge in the fre-quency of spontaneous synaptic events in mice RGCs at postnataldays 22–27 (P22-P27), which is reversibly suppressed by darkrearing (Tian and Copenhagen, 2001). More recently, it wasshown that early visual deprivation produces permanent changesin the spontaneous synaptic activity recorded from rat RGCs(Giovannelli et al., 2008).
Early in development, GABA-mediated currents in amacrinecells and RGCs are depolarizing and then, due to a developmentalshift in the chloride equilibrium potential, become hyperpolariz-ing (Zhang et al., 2006). Depolarizing GABAergic activity plays acrucial role in modulating the bursting activity of RGCs (Fischeret al., 1998) and the spatial and temporal properties of retinalwaves (Sernagor et al., 2003; Leitch et al., 2005; Wang et al., 2007).It is not known, however, whether the development of retinalcircuits involves changes in the strength and/or spatial distribu-tion of light-evoked inhibitory and excitatory inputs onto RGCs.
We have examined RF organization and response strength inRGCs in normal controls and in rats born and raised in complete
Received Aug. 7, 2009; accepted Sept. 19, 2009.This work was supported by Australian National Health and Medical Research Council of Australia Grant
307622 and Australian Research Council Grant DP0988227 to D.A.P., Programmi di ricerca di Rilevante InteresseNazionale 2006, and From Molecules to Man (Agenzia Spaziale Italiana project) to S.B., and Association for Researchbetween Italy and Australia and Programmi Operativi Regionali (Abruzzo) awards to S.D.M. We thank Drs. BogdanDreher, Krishna Ghosh, Cathy Leamey, Atomu Sawatari, Samuel Solomon, and Jonathan Stone for critical input andcomments on this manuscript. S.B. and D.A.P. conceived the experiments. S.D.M., V.A.N., S.B., and D.A.P. designedthe experiments. S.D.M., V.A.N., and D.A.P. performed the experiments. S.D.M. and D.A.P. analyzed the data. D.A.P.wrote the analysis software, and S.B. and D.A.P. wrote the paper.
Correspondence should be addressed to Dr. Dario A. Protti, Anderson Stuart Building (F13), Discipline of Physi-ology and Bosch Institute, The University of Sydney, NSW 2006, Australia. E-mail: [email protected].
DOI:10.1523/JNEUROSCI.3854-09.2009Copyright © 2009 Society for Neuroscience 0270-6474/09/2913691-11$15.00/0
The Journal of Neuroscience, October 28, 2009 • 29(43):13691–13701 • 13691
darkness during the critical period and then returned to normalenvironment. We quantified the contributions of inhibitory andexcitatory inputs onto morphologically identified RGCs. The RFstructure of RGCs was investigated by mapping the spatial distri-bution of inhibitory and excitatory inputs. We found that visualdeprivation induced permanent functional changes in RGC respon-siveness due to an increase in inhibitory input and a spatial mis-match of inhibitory and excitatory inputs. These results show thatearly visual experience is critical for the refinement of retinal circuits,and suggest that abnormal visual experience during the early post-natal period impacts on the properties of neurons in higher visualcenters and consequently on vision and visually guided behaviors.
Materials and MethodsPreparation of the animals. Long–Evans rats were born and reared incomplete darkness for different time periods: 6 rats for �4 months (post-natal day 119, P119), 2 rats until P77 and 12 rats until P62. To ensure thatanimals were completely light deprived, the animal facility for dark-rearing had a double door and infrared goggles were used to inspect andfeed the animals. Animals were then exposed to normal light/dark cycles(12 h/12 h) until experiments commenced with this recovery periodranging from 2 to 8 months, therefore we call them dark-reared/recov-ered, DR/R. Long–Evans rats of matching ages reared in normal light/dark cycles were used as controls.
Experimental procedures. Animals were dark-adapted for at least 2 h,anesthetized with isofluorane and killed by intraperitoneal injection withpentobarbitone (120 mg/kg). The dissection procedures were performedin the dark under infrared illumination with only occasional exposure todim red light. Eyes were enucleated and transferred to a Petri dish con-taining carboxygenated Ames medium. The cornea, iris, lens, and vitre-ous were subsequently removed and the retina detached from the sclera.A hemiretina was placed photoreceptor side down in the recordingchamber and transferred to the microscope stage, where it was continu-ously perfused with carboxygenated Ames medium heated to �35°C.Cells were viewed on a video monitor coupled to a CCD camera mountedon an Axioskop microscope (Carl Zeiss) illuminated with infrared light.All animal procedures followed the guidelines for animal experimentsissued by the University of Sydney and the Australian Code of Practice forthe Care and Use of Animals for Scientific Purposes and in agreementwith the European Directive 86/609/EEC requirements.
Electrophysiological recordings. Whole-cell recordings were obtainedfrom RGCs in whole-mount retinas in current- and voltage-clamp modeusing an EPC10 patch-clamp amplifier (HEKA Elektronik). For current-clamp recordings, patch electrodes were filled with an intracellular solu-tion containing K � as the main cation and gluconate as the main anion(K-Glu: 140, HEPES: 10, EGTA: 10, MgCl2: 4.6, CaCl2: 1, ATP-Na: 4,GTP-Na: 0.5, in mM). For voltage-clamp recordings Cs � and methane-sulphonate were used as the main cation and anion, respectively (in mM:110 CsMeth, 5 tetrabutylammonium, 20 HEPES, 10 EGTA, 4.6 MgCl2, 4ATP-Na, 0.5 GTP-Na, 20 creatine phosphate, and 250 U/ml creatinephosphokinase). In voltage-clamp experiments, voltage-gated so-dium currents were blocked by adding 5 mM QX-314 in the intracel-lular solution. Intracellular solutions contained 2% Lucifer yellow(LY) for cell identification. Ames medium was perfused at �3 ml/min. When Cs � or K � intracellular solutions were used, liquid junc-tion potentials of �10 and �5 mV, respectively, were subtracted fromvoltage values. Patch pipettes of 6 – 8 M� were used; series resistanceusually ranged between 25 and 35 M� and was left uncompensated.The chloride reversal potential [ECl
�] for these solutions was calculatedto be approximately �55 mV.
Visual stimuli. Achromatic stimuli were displayed via a DLP projector(refresh rate 60 Hz) through the microscope optics and focused onto thephotoreceptors. Stimuli consisted of spots of different diameters (vary-ing from 30 to 1200 �m) and annuli; ON responses were elicited withbright stimuli on a dark background, whereas OFF responses wereevoked with dark stimuli on an illuminated background. Stimuli weregenerated using EXPO, courtesy of Dr Peter Lennie (University of Roch-ester, Rochester, NY). Most of the experiments were done with a back-
ground luminance of 0.0005 cd/m 2, whereas stimulus intensity was0.25 cd/m 2.
Analysis. Area response functions were estimated from the spike rate oflight responses recorded in current-clamp mode. Spikes were detectedusing an off-line routine to detect the location of maxima by calculatingthe smooth first and second derivative of the membrane potential signaland comparing it to a threshold. If the amplitude at that point was abovethreshold (usually �0 mV), it was considered to be a spike. Area responsefunctions were also estimated from the amplitude of light-evokedpostsynaptic potentials, in which spikes were removed by linear interpo-lation of the membrane potential signal 4 ms before each spike and �10ms after each spike (Demb et al., 1999). Mean amplitude of light-evokedresponses was calculated for depolarizing responses (EPSPs), and hyper-polarizing responses (IPSPs) when present, in response to stimuli ofpreferred contrast. Peak responses (EPSPs or IPSPs) were detected andtheir amplitude measured as the difference between a baseline averaging200 ms before stimulus delivery and the average membrane potentialacross 40 ms following peak responses. Thus, these values represent theearly phase of the light-evoked response.
To quantify the extent of similarity between RFs of RGCs measured atdifferent stimulation frequencies, a similarity index (SI) was used. Thiswas defined as the Pearson correlation coefficient between vectors de-rived from the RF maps obtained at the two different frequencies, similarto the analysis for pairs of neurons used by DeAngelis et al. (1999). SI wasestimated for both spatial and spatiotemporal RF maps and an SI close to1 denotes maps that have very similar shapes, whereas �1 representsmaps with opposite polarities and intermediate values indicate differentdegrees of similarity.
We defined the pair-pulse index (PPI) as the ratio of the magnitude ofa light-evoked response to a second stimulus to the magnitude of re-sponse to a first stimulus. Responses were elicited with the same stimulussize and paired stimuli were spaced in time by intervals between 2.5 and11 s. Similar PPI values were obtained when either the amplitude or spikecount of the light-evoked responses were used.
Conductance analysis. Light-evoked synaptic inputs were analyzed interms of the magnitude of the excitatory and inhibitory conductances,using similar techniques to those described by Borg-Graham (2001) andTaylor and Vaney (2002) as well as by their ratios. To dissect excitatory(Gexc) and inhibitory (Ginh) conductances, the total synaptic conduc-tance (GT) and reversal potentials (Erev) of light-evoked synaptic currentswere first calculated. For this purpose, light-evoked synaptic currentswere elicited by displaying spots of different diameters (or annuli) atdifferent holding potentials, from �90 to �40 mV stepped every 10 mV.The mean amplitude of 10 ms segments of light-evoked synaptic currentswith respect to baseline (current amplitude averaged for 200 ms beforestimulus presentation) was used to plot current–voltage plots. Fromthese, reversal potential (Erev) and total conductance (GT) were estimatedfrom the crossing at current 0 pA and the slope of the linear fit of the I–Vrelation, respectively. Gexc and Ginh were derived according to the follow-ing formulas:
G inh�t� �GT�t� * �Erev�t� � Eexc�
Einh � Eexc(1)
Gexc�t� �GT�t� * �Erevr �t� � Einh�
Eexc � Einh(2)
where Eexc, the reversal potential of excitatory currents, was consideredto be 0 mV, and Einh, the reversal potential of chloride, was estimated tobe �55 mV. When Erev was more positive than 0 mV, Eexc was consideredto be just exceeding the most positive value of Erev and when Erev wasmore negative than �55 mV, Einh was considered to be just below themost negative value of Erev.
Receptive field mapping. The location of excitatory and inhibitory in-puts within the RF of an RGC was investigated by flashing a bright spoton a dark background or a dark spot on a bright background for 400 msin a square grid of 49 equidistant locations following a fixed sequence,with the center of the grid aligned with the RGC under recording. Nor-mally, at this position the center produced the maximum excitatory in-
13692 • J. Neurosci., October 28, 2009 • 29(43):13691–13701 Di Marco et al. • Dark Rearing Permanently Alters Retinal Circuits
put but occasionally it had to be realigned to meet this condition. Toincrease signal-to-noise, spots were displayed twice at each location ofthe grid. Although presentation in a fixed sequence at high frequencycould introduce artifacts in RF maps if frequency-dependent compo-nents are involved in generating synaptic responses, as shown to occurfor a subset of cells, results from the presentation of the second sequencewere highly consistent with the first presentation. Spot sizes of minimumdiameter to elicit both direct excitatory and inhibitory input were usedand the central stimulus coordinate was selected as the location thatelicited the largest excitatory current, which in general coincided with thelocation of the ganglion cell somata. In most of the cells, we used spotsizes as small as 30 or 50 �m and separation between spots was either 30,50 or 80 �m. Recordings were performed at the reversal potential ofexcitatory and inhibitory currents (0 and �55 mV, respectively) with thesame stimulus, which allowed us to isolate the light-evoked inhibitoryand excitatory input. The magnitude of light-evoked excitatory and in-hibitory currents was quantified as the area of the inward and outwardcurrents, respectively, by integrating the signal (i.e., the light-evokedcharge transfer).
The location of the largest values of direct excitatory and inhibitorycurrents (and the second largest value, when it was at least 80% of themaximum response) was extracted for each cell from the RF maps andplotted as distance from the center.
In addition, we used a measure to quantify and compare the RF mapsof excitatory and inhibitory inputs from DR/R and control cells, similarto that used by Akerman et al. (2002) for the quantification of ON andOFF inputs in the dorsal lateral geniculate nucleus (dLGN). This wasquantified as the RF scatter, which gives an average measure of the degreeof spatial separation of the pixels that generate excitatory and inhibitoryinputs above a certain threshold.
RF scatter � dist(i,j)i,jExc�Inh�T, where dist(i,j) represents the dis-
tance between positions i and j, and dist(i,j)i,jExc�Inh�T denotes the
mean distance between all unique pairs of excitatory positions i,j withrespect to all inhibitory positions i,j in which the magnitude of the lightevoked response (excitatory or inhibitory) exceeds a threshold T, set at80% of the maximal response. The number of excitatory and inhibitorysubunits that fulfill this criterion was also estimated. RF scatter is maxi-mized when the excitatory and inhibitory subfields are individually scat-tered across visual space and minimized when they are each localized intosingle subfields within a small area.
Spatial tuning of excitatory inputs was assessed by quantitative estima-tion of the center-surround receptive field parameters by fitting the nor-malized amplitudes of the light-evoked charge transfer (LEC) in responseto spots of different diameter in RGCs voltage-clamped at �55 mV witha difference of Gaussians (DOG) model (Rodieck and Stone, 1965). TheDOG model assumes the representation of the receptive field center as anarrow, large amplitude Gaussian and of the surround as a broader,smaller amplitude Gaussian of opposite polarity. The fit provided fourparameters, namely the strength and radius of the center and surroundGaussians which were obtained from the equation:
LEC r � �c exp��(r/rc�2� � �s exp��(r/rs�
2� , (3)
where �c and rc represent the strength and radius of the center, and �s andrs represent the strength and radius of the surround. The ratio of theintegrated volume of the surround to center was calculated to provide anestimate of the degree of surround suppression in response to large spotstimulation.
Data analysis was performed using custom written routines in Igor Pro(Wavemetrics). Data are presented as mean SE and their statisticalsignificance was evaluated with the Student’s t test, except when other-wise indicated.
ResultsReceptive field properties of RGCs in DR/R animals areprofoundly alteredWe first investigated whether early visual experience affects thebasic RF properties of RGCs. In control animals, RGCs displayednormal area response functions characteristic of cells with classi-
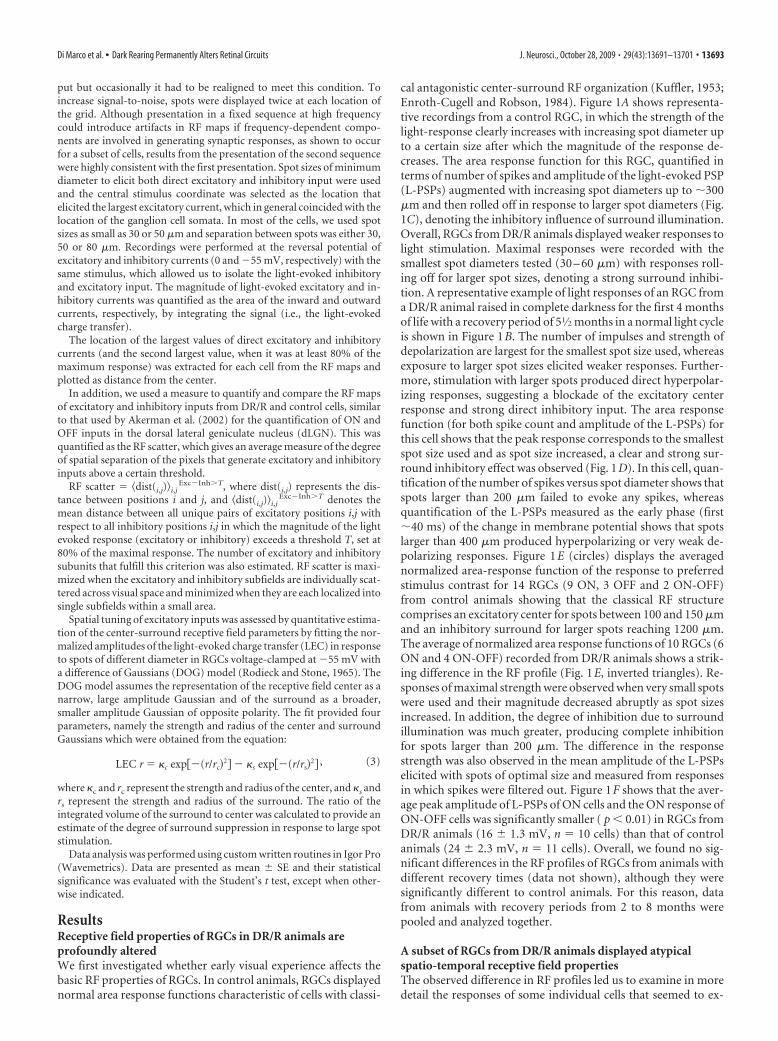
cal antagonistic center-surround RF organization (Kuffler, 1953;Enroth-Cugell and Robson, 1984). Figure 1A shows representa-tive recordings from a control RGC, in which the strength of thelight-response clearly increases with increasing spot diameter upto a certain size after which the magnitude of the response de-creases. The area response function for this RGC, quantified interms of number of spikes and amplitude of the light-evoked PSP(L-PSPs) augmented with increasing spot diameters up to �300�m and then rolled off in response to larger spot diameters (Fig.1C), denoting the inhibitory influence of surround illumination.Overall, RGCs from DR/R animals displayed weaker responses tolight stimulation. Maximal responses were recorded with thesmallest spot diameters tested (30 – 60 �m) with responses roll-ing off for larger spot sizes, denoting a strong surround inhibi-tion. A representative example of light responses of an RGC froma DR/R animal raised in complete darkness for the first 4 monthsof life with a recovery period of 51⁄2 months in a normal light cycleis shown in Figure 1B. The number of impulses and strength ofdepolarization are largest for the smallest spot size used, whereasexposure to larger spot sizes elicited weaker responses. Further-more, stimulation with larger spots produced direct hyperpolar-izing responses, suggesting a blockade of the excitatory centerresponse and strong direct inhibitory input. The area responsefunction (for both spike count and amplitude of the L-PSPs) forthis cell shows that the peak response corresponds to the smallestspot size used and as spot size increased, a clear and strong sur-round inhibitory effect was observed (Fig. 1D). In this cell, quan-tification of the number of spikes versus spot diameter shows thatspots larger than 200 �m failed to evoke any spikes, whereasquantification of the L-PSPs measured as the early phase (first�40 ms) of the change in membrane potential shows that spotslarger than 400 �m produced hyperpolarizing or very weak de-polarizing responses. Figure 1E (circles) displays the averagednormalized area-response function of the response to preferredstimulus contrast for 14 RGCs (9 ON, 3 OFF and 2 ON-OFF)from control animals showing that the classical RF structurecomprises an excitatory center for spots between 100 and 150 �mand an inhibitory surround for larger spots reaching 1200 �m.The average of normalized area response functions of 10 RGCs (6ON and 4 ON-OFF) recorded from DR/R animals shows a strik-ing difference in the RF profile (Fig. 1E, inverted triangles). Re-sponses of maximal strength were observed when very small spotswere used and their magnitude decreased abruptly as spot sizesincreased. In addition, the degree of inhibition due to surroundillumination was much greater, producing complete inhibitionfor spots larger than 200 �m. The difference in the responsestrength was also observed in the mean amplitude of the L-PSPselicited with spots of optimal size and measured from responsesin which spikes were filtered out. Figure 1F shows that the aver-age peak amplitude of L-PSPs of ON cells and the ON response ofON-OFF cells was significantly smaller ( p � 0.01) in RGCs fromDR/R animals (16 1.3 mV, n � 10 cells) than that of controlanimals (24 2.3 mV, n � 11 cells). Overall, we found no sig-nificant differences in the RF profiles of RGCs from animals withdifferent recovery times (data not shown), although they weresignificantly different to control animals. For this reason, datafrom animals with recovery periods from 2 to 8 months werepooled and analyzed together.
A subset of RGCs from DR/R animals displayed atypicalspatio-temporal receptive field propertiesThe observed difference in RF profiles led us to examine in moredetail the responses of some individual cells that seemed to ex-
Di Marco et al. • Dark Rearing Permanently Alters Retinal Circuits J. Neurosci., October 28, 2009 • 29(43):13691–13701 • 13693
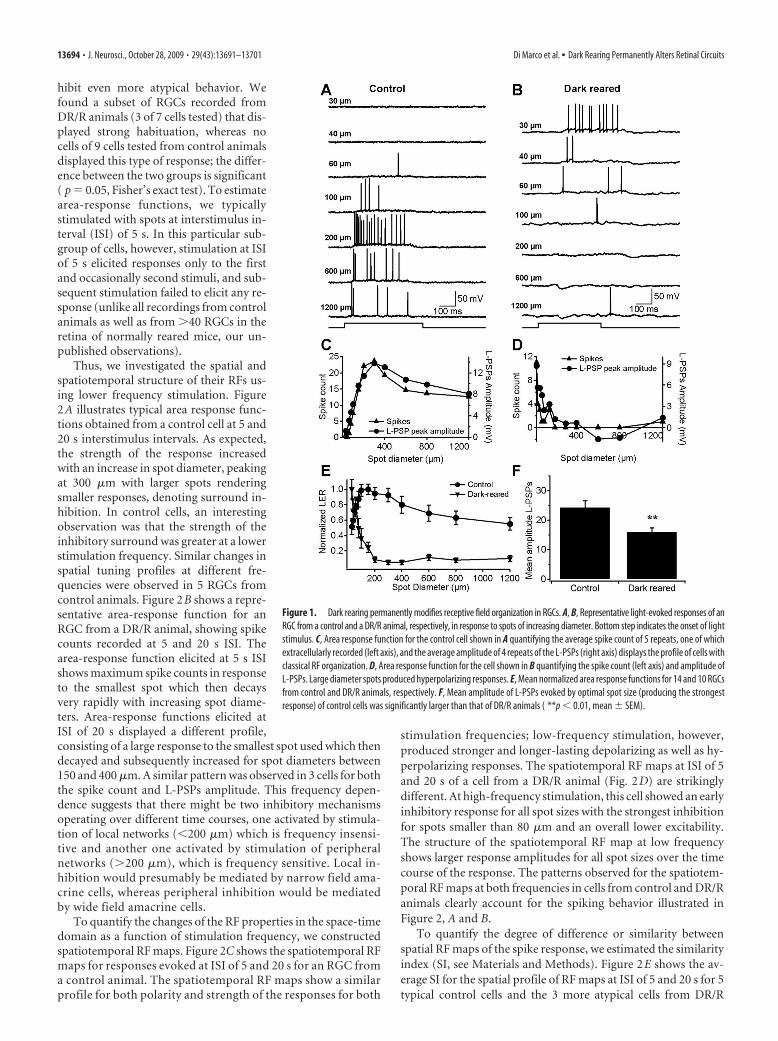
hibit even more atypical behavior. Wefound a subset of RGCs recorded fromDR/R animals (3 of 7 cells tested) that dis-played strong habituation, whereas nocells of 9 cells tested from control animalsdisplayed this type of response; the differ-ence between the two groups is significant( p � 0.05, Fisher’s exact test). To estimatearea-response functions, we typicallystimulated with spots at interstimulus in-terval (ISI) of 5 s. In this particular sub-group of cells, however, stimulation at ISIof 5 s elicited responses only to the firstand occasionally second stimuli, and sub-sequent stimulation failed to elicit any re-sponse (unlike all recordings from controlanimals as well as from �40 RGCs in theretina of normally reared mice, our un-published observations).
Thus, we investigated the spatial andspatiotemporal structure of their RFs us-ing lower frequency stimulation. Figure2A illustrates typical area response func-tions obtained from a control cell at 5 and20 s interstimulus intervals. As expected,the strength of the response increasedwith an increase in spot diameter, peakingat 300 �m with larger spots renderingsmaller responses, denoting surround in-hibition. In control cells, an interestingobservation was that the strength of theinhibitory surround was greater at a lowerstimulation frequency. Similar changes inspatial tuning profiles at different fre-quencies were observed in 5 RGCs fromcontrol animals. Figure 2B shows a repre-sentative area-response function for anRGC from a DR/R animal, showing spikecounts recorded at 5 and 20 s ISI. Thearea-response function elicited at 5 s ISIshows maximum spike counts in responseto the smallest spot which then decaysvery rapidly with increasing spot diame-ters. Area-response functions elicited atISI of 20 s displayed a different profile,consisting of a large response to the smallest spot used which thendecayed and subsequently increased for spot diameters between150 and 400 �m. A similar pattern was observed in 3 cells for boththe spike count and L-PSPs amplitude. This frequency depen-dence suggests that there might be two inhibitory mechanismsoperating over different time courses, one activated by stimula-tion of local networks (�200 �m) which is frequency insensi-tive and another one activated by stimulation of peripheralnetworks (�200 �m), which is frequency sensitive. Local in-hibition would presumably be mediated by narrow field ama-crine cells, whereas peripheral inhibition would be mediatedby wide field amacrine cells.
To quantify the changes of the RF properties in the space-timedomain as a function of stimulation frequency, we constructedspatiotemporal RF maps. Figure 2C shows the spatiotemporal RFmaps for responses evoked at ISI of 5 and 20 s for an RGC froma control animal. The spatiotemporal RF maps show a similarprofile for both polarity and strength of the responses for both
stimulation frequencies; low-frequency stimulation, however,produced stronger and longer-lasting depolarizing as well as hy-perpolarizing responses. The spatiotemporal RF maps at ISI of 5and 20 s of a cell from a DR/R animal (Fig. 2D) are strikinglydifferent. At high-frequency stimulation, this cell showed an earlyinhibitory response for all spot sizes with the strongest inhibitionfor spots smaller than 80 �m and an overall lower excitability.The structure of the spatiotemporal RF map at low frequencyshows larger response amplitudes for all spot sizes over the timecourse of the response. The patterns observed for the spatiotem-poral RF maps at both frequencies in cells from control and DR/Ranimals clearly account for the spiking behavior illustrated inFigure 2, A and B.
To quantify the degree of difference or similarity betweenspatial RF maps of the spike response, we estimated the similarityindex (SI, see Materials and Methods). Figure 2E shows the av-erage SI for the spatial profile of RF maps at ISI of 5 and 20 s for 5typical control cells and the 3 more atypical cells from DR/R
Figure 1. Dark rearing permanently modifies receptive field organization in RGCs. A, B, Representative light-evoked responses of anRGC from a control and a DR/R animal, respectively, in response to spots of increasing diameter. Bottom step indicates the onset of lightstimulus. C, Area response function for the control cell shown in A quantifying the average spike count of 5 repeats, one of whichextracellularly recorded (left axis), and the average amplitude of 4 repeats of the L-PSPs (right axis) displays the profile of cells withclassical RF organization. D, Area response function for the cell shown in B quantifying the spike count (left axis) and amplitude ofL-PSPs. Large diameter spots produced hyperpolarizing responses. E, Mean normalized area response functions for 14 and 10 RGCsfrom control and DR/R animals, respectively. F, Mean amplitude of L-PSPs evoked by optimal spot size (producing the strongestresponse) of control cells was significantly larger than that of DR/R animals ( **p � 0.01, mean SEM).
13694 • J. Neurosci., October 28, 2009 • 29(43):13691–13701 Di Marco et al. • Dark Rearing Permanently Alters Retinal Circuits
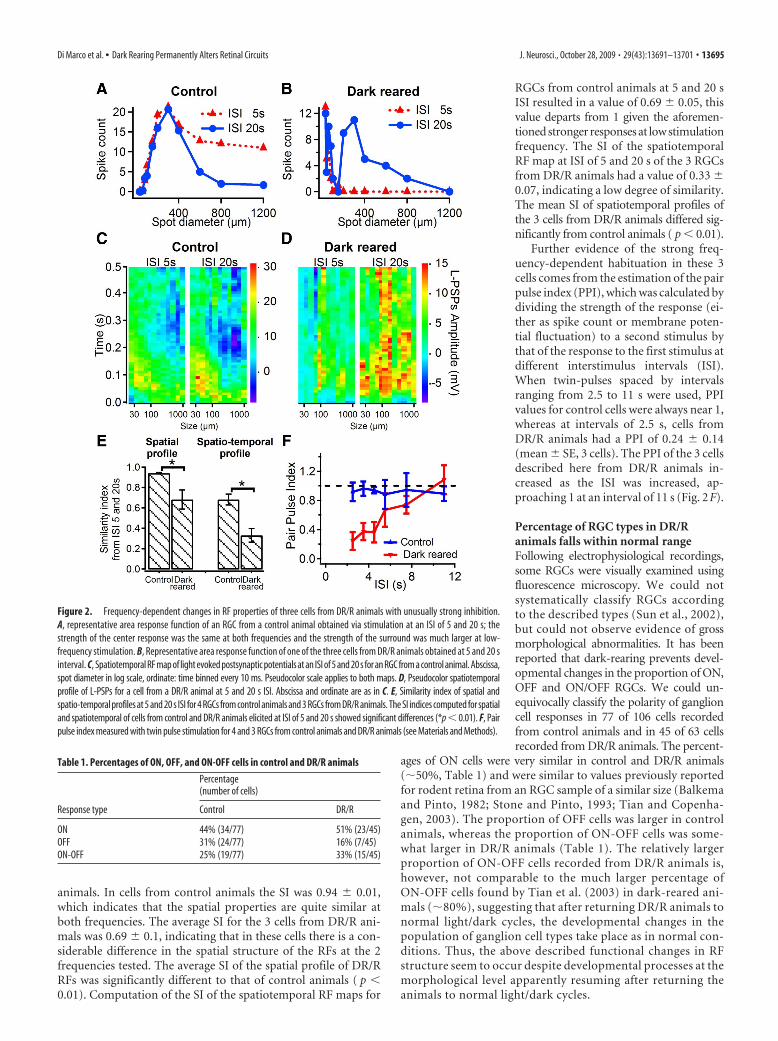
animals. In cells from control animals the SI was 0.94 0.01,which indicates that the spatial properties are quite similar atboth frequencies. The average SI for the 3 cells from DR/R ani-mals was 0.69 0.1, indicating that in these cells there is a con-siderable difference in the spatial structure of the RFs at the 2frequencies tested. The average SI of the spatial profile of DR/RRFs was significantly different to that of control animals ( p �0.01). Computation of the SI of the spatiotemporal RF maps for
RGCs from control animals at 5 and 20 sISI resulted in a value of 0.69 0.05, thisvalue departs from 1 given the aforemen-tioned stronger responses at low stimulationfrequency. The SI of the spatiotemporalRF map at ISI of 5 and 20 s of the 3 RGCsfrom DR/R animals had a value of 0.33 0.07, indicating a low degree of similarity.The mean SI of spatiotemporal profiles ofthe 3 cells from DR/R animals differed sig-nificantly from control animals ( p � 0.01).
Further evidence of the strong freq-uency-dependent habituation in these 3cells comes from the estimation of the pairpulse index (PPI), which was calculated bydividing the strength of the response (ei-ther as spike count or membrane poten-tial fluctuation) to a second stimulus bythat of the response to the first stimulus atdifferent interstimulus intervals (ISI).When twin-pulses spaced by intervalsranging from 2.5 to 11 s were used, PPIvalues for control cells were always near 1,whereas at intervals of 2.5 s, cells fromDR/R animals had a PPI of 0.24 0.14(mean SE, 3 cells). The PPI of the 3 cellsdescribed here from DR/R animals in-creased as the ISI was increased, ap-proaching 1 at an interval of 11 s (Fig. 2F).
Percentage of RGC types in DR/Ranimals falls within normal rangeFollowing electrophysiological recordings,some RGCs were visually examined usingfluorescence microscopy. We could notsystematically classify RGCs accordingto the described types (Sun et al., 2002),but could not observe evidence of grossmorphological abnormalities. It has beenreported that dark-rearing prevents devel-opmental changes in the proportion of ON,OFF and ON/OFF RGCs. We could un-equivocally classify the polarity of ganglioncell responses in 77 of 106 cells recordedfrom control animals and in 45 of 63 cellsrecorded from DR/R animals. The percent-
ages of ON cells were very similar in control and DR/R animals(�50%, Table 1) and were similar to values previously reportedfor rodent retina from an RGC sample of a similar size (Balkemaand Pinto, 1982; Stone and Pinto, 1993; Tian and Copenha-gen, 2003). The proportion of OFF cells was larger in controlanimals, whereas the proportion of ON-OFF cells was some-what larger in DR/R animals (Table 1). The relatively largerproportion of ON-OFF cells recorded from DR/R animals is,however, not comparable to the much larger percentage ofON-OFF cells found by Tian et al. (2003) in dark-reared ani-mals (�80%), suggesting that after returning DR/R animals tonormal light/dark cycles, the developmental changes in thepopulation of ganglion cell types take place as in normal con-ditions. Thus, the above described functional changes in RFstructure seem to occur despite developmental processes at themorphological level apparently resuming after returning theanimals to normal light/dark cycles.
Figure 2. Frequency-dependent changes in RF properties of three cells from DR/R animals with unusually strong inhibition.A, representative area response function of an RGC from a control animal obtained via stimulation at an ISI of 5 and 20 s; thestrength of the center response was the same at both frequencies and the strength of the surround was much larger at low-frequency stimulation. B, Representative area response function of one of the three cells from DR/R animals obtained at 5 and 20 sinterval. C, Spatiotemporal RF map of light evoked postsynaptic potentials at an ISI of 5 and 20 s for an RGC from a control animal. Abscissa,spot diameter in log scale, ordinate: time binned every 10 ms. Pseudocolor scale applies to both maps. D, Pseudocolor spatiotemporalprofile of L-PSPs for a cell from a DR/R animal at 5 and 20 s ISI. Abscissa and ordinate are as in C. E, Similarity index of spatial andspatio-temporal profiles at 5 and 20 s ISI for 4 RGCs from control animals and 3 RGCs from DR/R animals. The SI indices computed for spatialand spatiotemporal of cells from control and DR/R animals elicited at ISI of 5 and 20 s showed significant differences (*p � 0.01). F, Pairpulse index measured with twin pulse stimulation for 4 and 3 RGCs from control animals and DR/R animals (see Materials and Methods).
Table 1. Percentages of ON, OFF, and ON-OFF cells in control and DR/R animals
Response type
Percentage(number of cells)
Control DR/R
ON 44% (34/77) 51% (23/45)OFF 31% (24/77) 16% (7/45)ON-OFF 25% (19/77) 33% (15/45)
Di Marco et al. • Dark Rearing Permanently Alters Retinal Circuits J. Neurosci., October 28, 2009 • 29(43):13691–13701 • 13695
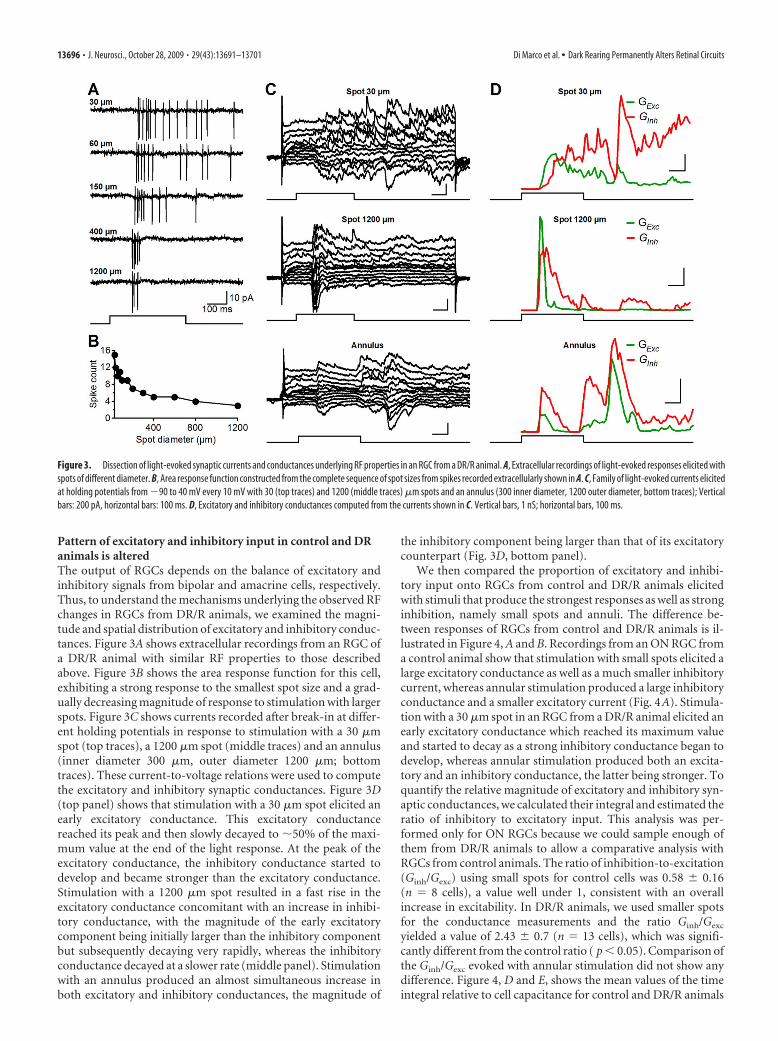
Pattern of excitatory and inhibitory input in control and DRanimals is alteredThe output of RGCs depends on the balance of excitatory andinhibitory signals from bipolar and amacrine cells, respectively.Thus, to understand the mechanisms underlying the observed RFchanges in RGCs from DR/R animals, we examined the magni-tude and spatial distribution of excitatory and inhibitory conduc-tances. Figure 3A shows extracellular recordings from an RGC ofa DR/R animal with similar RF properties to those describedabove. Figure 3B shows the area response function for this cell,exhibiting a strong response to the smallest spot size and a grad-ually decreasing magnitude of response to stimulation with largerspots. Figure 3C shows currents recorded after break-in at differ-ent holding potentials in response to stimulation with a 30 �mspot (top traces), a 1200 �m spot (middle traces) and an annulus(inner diameter 300 �m, outer diameter 1200 �m; bottomtraces). These current-to-voltage relations were used to computethe excitatory and inhibitory synaptic conductances. Figure 3D(top panel) shows that stimulation with a 30 �m spot elicited anearly excitatory conductance. This excitatory conductancereached its peak and then slowly decayed to �50% of the maxi-mum value at the end of the light response. At the peak of theexcitatory conductance, the inhibitory conductance started todevelop and became stronger than the excitatory conductance.Stimulation with a 1200 �m spot resulted in a fast rise in theexcitatory conductance concomitant with an increase in inhibi-tory conductance, with the magnitude of the early excitatorycomponent being initially larger than the inhibitory componentbut subsequently decaying very rapidly, whereas the inhibitoryconductance decayed at a slower rate (middle panel). Stimulationwith an annulus produced an almost simultaneous increase inboth excitatory and inhibitory conductances, the magnitude of
the inhibitory component being larger than that of its excitatorycounterpart (Fig. 3D, bottom panel).
We then compared the proportion of excitatory and inhibi-tory input onto RGCs from control and DR/R animals elicitedwith stimuli that produce the strongest responses as well as stronginhibition, namely small spots and annuli. The difference be-tween responses of RGCs from control and DR/R animals is il-lustrated in Figure 4, A and B. Recordings from an ON RGC froma control animal show that stimulation with small spots elicited alarge excitatory conductance as well as a much smaller inhibitorycurrent, whereas annular stimulation produced a large inhibitoryconductance and a smaller excitatory current (Fig. 4A). Stimula-tion with a 30 �m spot in an RGC from a DR/R animal elicited anearly excitatory conductance which reached its maximum valueand started to decay as a strong inhibitory conductance began todevelop, whereas annular stimulation produced both an excita-tory and an inhibitory conductance, the latter being stronger. Toquantify the relative magnitude of excitatory and inhibitory syn-aptic conductances, we calculated their integral and estimated theratio of inhibitory to excitatory input. This analysis was per-formed only for ON RGCs because we could sample enough ofthem from DR/R animals to allow a comparative analysis withRGCs from control animals. The ratio of inhibition-to-excitation(Ginh/Gexc) using small spots for control cells was 0.58 0.16(n � 8 cells), a value well under 1, consistent with an overallincrease in excitability. In DR/R animals, we used smaller spotsfor the conductance measurements and the ratio Ginh/Gexc
yielded a value of 2.43 0.7 (n � 13 cells), which was signifi-cantly different from the control ratio ( p � 0.05). Comparison ofthe Ginh/Gexc evoked with annular stimulation did not show anydifference. Figure 4, D and E, shows the mean values of the timeintegral relative to cell capacitance for control and DR/R animals
Figure 3. Dissection of light-evoked synaptic currents and conductances underlying RF properties in an RGC from a DR/R animal. A, Extracellular recordings of light-evoked responses elicited withspots of different diameter. B, Area response function constructed from the complete sequence of spot sizes from spikes recorded extracellularly shown in A. C, Family of light-evoked currents elicitedat holding potentials from �90 to 40 mV every 10 mV with 30 (top traces) and 1200 (middle traces) �m spots and an annulus (300 inner diameter, 1200 outer diameter, bottom traces); Verticalbars: 200 pA, horizontal bars: 100 ms. D, Excitatory and inhibitory conductances computed from the currents shown in C. Vertical bars, 1 nS; horizontal bars, 100 ms.
13696 • J. Neurosci., October 28, 2009 • 29(43):13691–13701 Di Marco et al. • Dark Rearing Permanently Alters Retinal Circuits
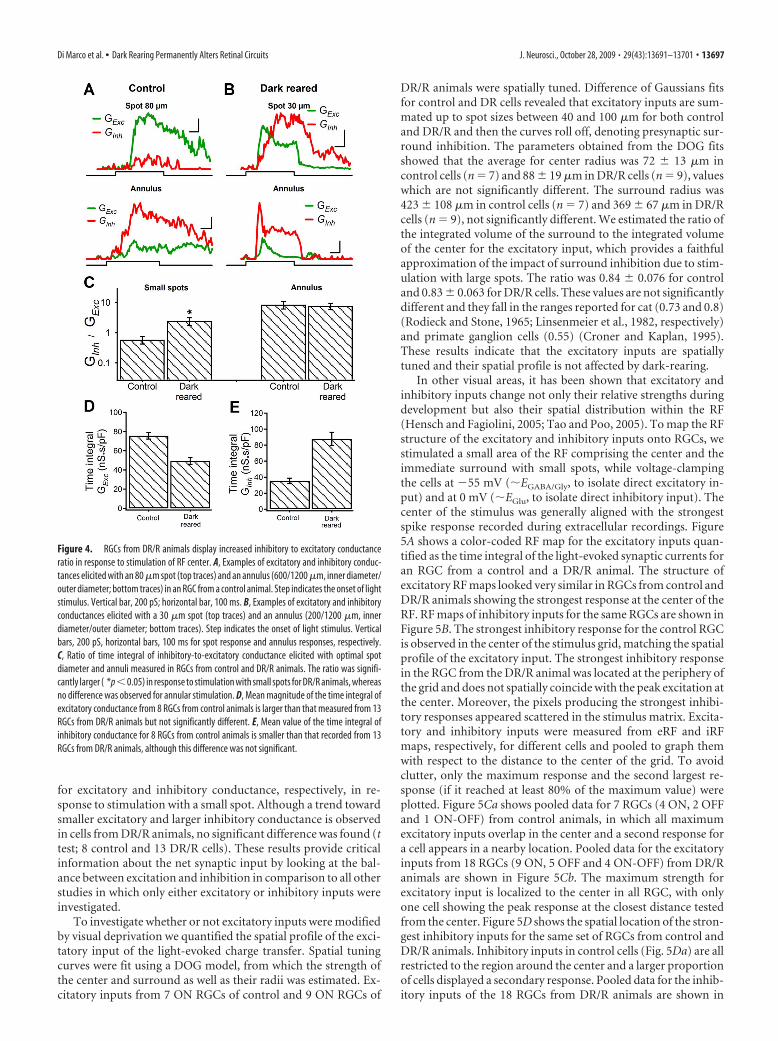
for excitatory and inhibitory conductance, respectively, in re-sponse to stimulation with a small spot. Although a trend towardsmaller excitatory and larger inhibitory conductance is observedin cells from DR/R animals, no significant difference was found (ttest; 8 control and 13 DR/R cells). These results provide criticalinformation about the net synaptic input by looking at the bal-ance between excitation and inhibition in comparison to all otherstudies in which only either excitatory or inhibitory inputs wereinvestigated.
To investigate whether or not excitatory inputs were modifiedby visual deprivation we quantified the spatial profile of the exci-tatory input of the light-evoked charge transfer. Spatial tuningcurves were fit using a DOG model, from which the strength ofthe center and surround as well as their radii was estimated. Ex-citatory inputs from 7 ON RGCs of control and 9 ON RGCs of
DR/R animals were spatially tuned. Difference of Gaussians fitsfor control and DR cells revealed that excitatory inputs are sum-mated up to spot sizes between 40 and 100 �m for both controland DR/R and then the curves roll off, denoting presynaptic sur-round inhibition. The parameters obtained from the DOG fitsshowed that the average for center radius was 72 13 �m incontrol cells (n � 7) and 88 19 �m in DR/R cells (n � 9), valueswhich are not significantly different. The surround radius was423 108 �m in control cells (n � 7) and 369 67 �m in DR/Rcells (n � 9), not significantly different. We estimated the ratio ofthe integrated volume of the surround to the integrated volumeof the center for the excitatory input, which provides a faithfulapproximation of the impact of surround inhibition due to stim-ulation with large spots. The ratio was 0.84 0.076 for controland 0.83 0.063 for DR/R cells. These values are not significantlydifferent and they fall in the ranges reported for cat (0.73 and 0.8)(Rodieck and Stone, 1965; Linsenmeier et al., 1982, respectively)and primate ganglion cells (0.55) (Croner and Kaplan, 1995).These results indicate that the excitatory inputs are spatiallytuned and their spatial profile is not affected by dark-rearing.
In other visual areas, it has been shown that excitatory andinhibitory inputs change not only their relative strengths duringdevelopment but also their spatial distribution within the RF(Hensch and Fagiolini, 2005; Tao and Poo, 2005). To map the RFstructure of the excitatory and inhibitory inputs onto RGCs, westimulated a small area of the RF comprising the center and theimmediate surround with small spots, while voltage-clampingthe cells at �55 mV (�EGABA/Gly, to isolate direct excitatory in-put) and at 0 mV (�EGlu, to isolate direct inhibitory input). Thecenter of the stimulus was generally aligned with the strongestspike response recorded during extracellular recordings. Figure5A shows a color-coded RF map for the excitatory inputs quan-tified as the time integral of the light-evoked synaptic currents foran RGC from a control and a DR/R animal. The structure ofexcitatory RF maps looked very similar in RGCs from control andDR/R animals showing the strongest response at the center of theRF. RF maps of inhibitory inputs for the same RGCs are shown inFigure 5B. The strongest inhibitory response for the control RGCis observed in the center of the stimulus grid, matching the spatialprofile of the excitatory input. The strongest inhibitory responsein the RGC from the DR/R animal was located at the periphery ofthe grid and does not spatially coincide with the peak excitation atthe center. Moreover, the pixels producing the strongest inhibi-tory responses appeared scattered in the stimulus matrix. Excita-tory and inhibitory inputs were measured from eRF and iRFmaps, respectively, for different cells and pooled to graph themwith respect to the distance to the center of the grid. To avoidclutter, only the maximum response and the second largest re-sponse (if it reached at least 80% of the maximum value) wereplotted. Figure 5Ca shows pooled data for 7 RGCs (4 ON, 2 OFFand 1 ON-OFF) from control animals, in which all maximumexcitatory inputs overlap in the center and a second response fora cell appears in a nearby location. Pooled data for the excitatoryinputs from 18 RGCs (9 ON, 5 OFF and 4 ON-OFF) from DR/Ranimals are shown in Figure 5Cb. The maximum strength forexcitatory input is localized to the center in all RGC, with onlyone cell showing the peak response at the closest distance testedfrom the center. Figure 5D shows the spatial location of the stron-gest inhibitory inputs for the same set of RGCs from control andDR/R animals. Inhibitory inputs in control cells (Fig. 5Da) are allrestricted to the region around the center and a larger proportionof cells displayed a secondary response. Pooled data for the inhib-itory inputs of the 18 RGCs from DR/R animals are shown in
Figure 4. RGCs from DR/R animals display increased inhibitory to excitatory conductanceratio in response to stimulation of RF center. A, Examples of excitatory and inhibitory conduc-tances elicited with an 80 �m spot (top traces) and an annulus (600/1200 �m, inner diameter/outer diameter; bottom traces) in an RGC from a control animal. Step indicates the onset of lightstimulus. Vertical bar, 200 pS; horizontal bar, 100 ms. B, Examples of excitatory and inhibitoryconductances elicited with a 30 �m spot (top traces) and an annulus (200/1200 �m, innerdiameter/outer diameter; bottom traces). Step indicates the onset of light stimulus. Verticalbars, 200 pS, horizontal bars, 100 ms for spot response and annulus responses, respectively.C, Ratio of time integral of inhibitory-to-excitatory conductance elicited with optimal spotdiameter and annuli measured in RGCs from control and DR/R animals. The ratio was signifi-cantly larger ( *p�0.05) in response to stimulation with small spots for DR/R animals, whereasno difference was observed for annular stimulation. D, Mean magnitude of the time integral ofexcitatory conductance from 8 RGCs from control animals is larger than that measured from 13RGCs from DR/R animals but not significantly different. E, Mean value of the time integral ofinhibitory conductance for 8 RGCs from control animals is smaller than that recorded from 13RGCs from DR/R animals, although this difference was not significant.
Di Marco et al. • Dark Rearing Permanently Alters Retinal Circuits J. Neurosci., October 28, 2009 • 29(43):13691–13701 • 13697
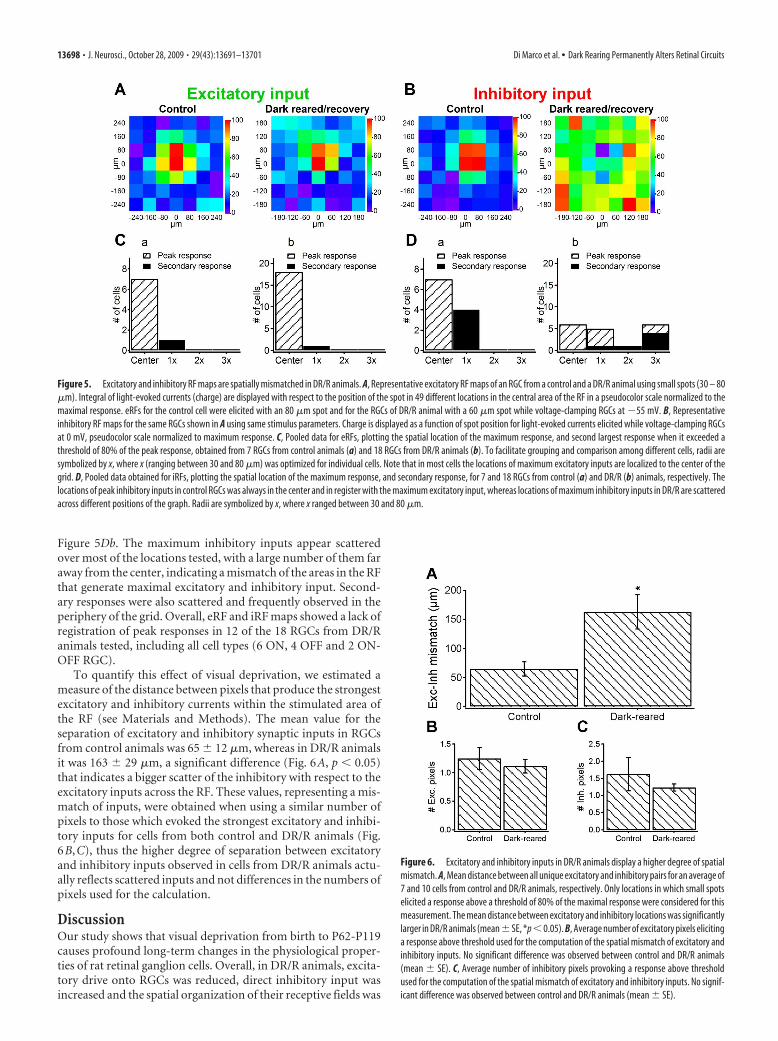
Figure 5Db. The maximum inhibitory inputs appear scatteredover most of the locations tested, with a large number of them faraway from the center, indicating a mismatch of the areas in the RFthat generate maximal excitatory and inhibitory input. Second-ary responses were also scattered and frequently observed in theperiphery of the grid. Overall, eRF and iRF maps showed a lack ofregistration of peak responses in 12 of the 18 RGCs from DR/Ranimals tested, including all cell types (6 ON, 4 OFF and 2 ON-OFF RGC).
To quantify this effect of visual deprivation, we estimated ameasure of the distance between pixels that produce the strongestexcitatory and inhibitory currents within the stimulated area ofthe RF (see Materials and Methods). The mean value for theseparation of excitatory and inhibitory synaptic inputs in RGCsfrom control animals was 65 12 �m, whereas in DR/R animalsit was 163 29 �m, a significant difference (Fig. 6A, p � 0.05)that indicates a bigger scatter of the inhibitory with respect to theexcitatory inputs across the RF. These values, representing a mis-match of inputs, were obtained when using a similar number ofpixels to those which evoked the strongest excitatory and inhibi-tory inputs for cells from both control and DR/R animals (Fig.6B,C), thus the higher degree of separation between excitatoryand inhibitory inputs observed in cells from DR/R animals actu-ally reflects scattered inputs and not differences in the numbers ofpixels used for the calculation.
DiscussionOur study shows that visual deprivation from birth to P62-P119causes profound long-term changes in the physiological proper-ties of rat retinal ganglion cells. Overall, in DR/R animals, excita-tory drive onto RGCs was reduced, direct inhibitory input wasincreased and the spatial organization of their receptive fields was
Figure 6. Excitatory and inhibitory inputs in DR/R animals display a higher degree of spatialmismatch. A, Mean distance between all unique excitatory and inhibitory pairs for an average of7 and 10 cells from control and DR/R animals, respectively. Only locations in which small spotselicited a response above a threshold of 80% of the maximal response were considered for thismeasurement. The mean distance between excitatory and inhibitory locations was significantlylarger in DR/R animals (mean SE, *p�0.05). B, Average number of excitatory pixels elicitinga response above threshold used for the computation of the spatial mismatch of excitatory andinhibitory inputs. No significant difference was observed between control and DR/R animals(mean SE). C, Average number of inhibitory pixels provoking a response above thresholdused for the computation of the spatial mismatch of excitatory and inhibitory inputs. No signif-icant difference was observed between control and DR/R animals (mean SE).
Figure 5. Excitatory and inhibitory RF maps are spatially mismatched in DR/R animals. A, Representative excitatory RF maps of an RGC from a control and a DR/R animal using small spots (30 – 80�m). Integral of light-evoked currents (charge) are displayed with respect to the position of the spot in 49 different locations in the central area of the RF in a pseudocolor scale normalized to themaximal response. eRFs for the control cell were elicited with an 80 �m spot and for the RGCs of DR/R animal with a 60 �m spot while voltage-clamping RGCs at �55 mV. B, Representativeinhibitory RF maps for the same RGCs shown in A using same stimulus parameters. Charge is displayed as a function of spot position for light-evoked currents elicited while voltage-clamping RGCsat 0 mV, pseudocolor scale normalized to maximum response. C, Pooled data for eRFs, plotting the spatial location of the maximum response, and second largest response when it exceeded athreshold of 80% of the peak response, obtained from 7 RGCs from control animals (a) and 18 RGCs from DR/R animals (b). To facilitate grouping and comparison among different cells, radii aresymbolized by x, where x (ranging between 30 and 80 �m) was optimized for individual cells. Note that in most cells the locations of maximum excitatory inputs are localized to the center of thegrid. D, Pooled data obtained for iRFs, plotting the spatial location of the maximum response, and secondary response, for 7 and 18 RGCs from control (a) and DR/R (b) animals, respectively. Thelocations of peak inhibitory inputs in control RGCs was always in the center and in register with the maximum excitatory input, whereas locations of maximum inhibitory inputs in DR/R are scatteredacross different positions of the graph. Radii are symbolized by x, where x ranged between 30 and 80 �m.
13698 • J. Neurosci., October 28, 2009 • 29(43):13691–13701 Di Marco et al. • Dark Rearing Permanently Alters Retinal Circuits
disrupted. Recovery from dark rearing from 2 to 8 months didnot to restore normal responses in RGCs.
Long-lasting effects of light deprivation on retinal and othervisual neuronsThe possibility that visual deprivation might permanently alterretinal circuitry was first suggested by evidence that APB treat-ment during the first month of postnatal life of the cat inducedpermanent modifications in RGC function, including an increasein the proportion of RGCs with ON-OFF discharges and loss ofsurround inhibition (Bisti et al., 1998) and an increase in thepercentage of multistratifying RGCs (Deplano et al., 2004). Arecent report by Giovanelli et al. (2008) showed that in Long–Evans rats, early prolonged visual deprivation reduced the spon-taneous synaptic activity recorded of RGCs. Here we describepronounced changes in RGC excitability and RF organization,following dark-rearing for periods spanning the critical periodfor ocular dominance plasticity in rats (between P23 and P50;Fagiolini et al., 1994). Our results thus highlight the importanceof early visual experience for normal retinal development.
Recovery of behaviorally measured visual acuity after visualdeprivation is only partial, whether in rodents (Prusky et al.,2000; Prusky and Douglas, 2003) or cats (Timney et al., 1978),even when long periods are allowed for recovery. Correspond-ingly, cortical visual properties, such as orientation, directionselectivity and binocularity of neurons remain impaired by darkrearing even after prolonged recovery in cat (Cynader et al., 1976)and ferret (Liao et al., 2004). Interestingly, changes in the RF sizeof superior colliculus neurons induced by dark rearing also ap-pear to be permanent, emphasizing that early visual experience iscritical for the appropriate wiring of the neuronal networks inmultiple visual regions (Carrasco et al., 2005). We suggest thatthese long-lasting changes in the RF properties of RGCs contrib-ute to altered neuronal properties in higher visual areas.
Light deprivation strongly modified RGC receptivefield propertiesEarly visual deprivation produced significant changes in the RFprofile of RGCs, consisting of a reduction in RF center and sur-round size with a concomitant increase in the surround strength.In addition, the average amplitude of the strongest responsesfrom DR/R cells was considerably smaller than those of controlcells. The effects of dark-rearing on the receptive field propertiesin turtle retina were shown not to be reversible (Merwine et al.,1998, cited by Lee et al., 2006), similar to our findings althoughdark-rearing in the turtle retina resulted in an expansion of RFsizes (Sernagor and Grzywacz, 1996) rather than a reduction. Thereduction we observed in RF size of RGCs is in contrast to theeffect of dark rearing on RF size in other visual regions; visualdeprivation has been shown to induce expansion of RFs in the ratvisual cortex (Fagiolini et al., 1994) and in the hamster superiorcolliculus (Carrasco et al., 2005). The two inhibitory mechanismsobserved at high and low-frequency stimulation (Fig. 2) suggestthat the function of narrow and wide field amacrine cells in DR/Ranimals is different from in normally reared adult animals. Con-sistent with this idea, visual deprivation has been shown to mod-ify both the physiological responses (Osswald et al., 2007) and thespatial arrangement of amacrine cells (Zhang et al., 2005).
The use of twin-stimulus protocols confirmed the frequencydependence of the strong inhibition, known as habituation, ob-served in this group of cells. In the adult retina, responses fromRGCs rarely habituate (our data; Barlow et al., 1964; Hochsteinand Shapley, 1976), whereas the weak responses present at early
developmental stages fatigue easily in the retina (Masland, 1977;Tootle, 1993) and dLGN (Daniels et al., 1978). In rat visual cor-tex, at P17 �82% of neurons habituate for interstimulus intervalsshorter than 15 s, a similar proportion to that observed in darkreared rats (Fagiolini et al., 1994). Our experiments show thathabituation persists in some RGCs of visually deprived animalseven after a long period of recovery in normal light/dark cycles.
In our study, the percentage of ON-OFF RGCs in DR/R ani-mals was similar to that in the normal adult retina and to thatobserved after reversal of dark rearing effects in the mouse retina(Tian and Copenhagen, 2003). A high proportion of ON-OFFresponses and multistratifying RGCs is characteristic of early de-velopmental stages, the proportion decreasing during develop-ment. The high neonatal percentage is preserved, however, byboth visual deprivation and pharmacological manipulation(treatment with APB). Similarly, at early developmental stages alarger proportion of ON-OFF cells is present in the ferret LGNand dark-rearing prevents both the selective loss of ON-OFF re-sponses (Akerman et al., 2002). The gross morphological charac-teristics of the RGCs we recorded from in DR/R animals seemedto be similar to those from control animals. This suggests thatafter dark rearing for a time that encompasses the critical period,there is still substantial plasticity that allows for developmentalpruning after returning to normal light/dark cycles, as previouslyshown by Tian and Copenhagen (2003). The observed changes inresponse strength, habituation, spatial profile and spatial organi-zation of the RF and relative strength of inhibitory and excitatoryinputs, however, indicate that maturational processes involved inthe refinement of synaptic connections are disrupted and alteredby visual deprivation.
It is unlikely that RGCs recorded from DR/R animals display-ing abnormal RF properties and/or enhanced inhibitory activitycorrespond to particular cell types which were not sampled incontrol animals, since we used the same selection criteria basedon soma size and on the presence of large inward voltage gatedsodium currents for DR/R and control animals. In addition, weobserved homogeneity in the type of responses from a similarnumber of cells in both DR/R and control animals and com-parison of many of the parameters quantified in these twogroups revealed statistical significance. Moreover, we neverrecorded responses with characteristics of DR/R responsesfrom control animals.
An imbalance in the ratio of inhibitory-excitatory input ontoRGCs of DR/R cells underlies their abnormal responsivenessOur study looked at the balance between excitation and inhibi-tion providing critical information about the net synaptic inputsonto RGC. The imbalance in the strength of excitatory and inhib-itory circuits is likely to be the consequence of complete earlyvisual deprivation. It has been shown that GABAergic input ontopyramidal cells in the rat visual cortex increases threefoldthrough the critical period, and this increase is prevented by darkrearing from birth (Morales et al., 2002). Moreover, genetic ma-nipulation of the levels of GABAergic inhibition in visual cortexusing GAD65 KO mice, abolishes cortical ocular dominance plas-ticity, which can be restored by enhancing inhibitory activitypharmacologically (Hensch et al., 1998). More recently, it wasalso shown that visual deprivation reduces GABAA receptors in aspecific cellular compartment (soma-proximal dendrite) but notin others (axon initial segment) in mouse visual cortex and thatreceptor density is finely regulated during development to enableplasticity (Katagiri et al., 2007). Lee et al. (2006) showed that thelevels of GABA and GAD65 (one of its synthesizing enzymes)
Di Marco et al. • Dark Rearing Permanently Alters Retinal Circuits J. Neurosci., October 28, 2009 • 29(43):13691–13701 • 13699
were reduced in the inner nuclear and ganglion cell layers of P30dark-reared animals compared with control retinas. This reduc-tion was shown to be reversed by returning the animals to anormal light/dark cycle for 15 d. Interestingly, the same study alsoshowed that despite the observed recovery of both GABA andGAD65 levels, dark-rearing produced a significant reduction(�19 �m) in the thickness of the inner nuclear layer which is notreversed by light exposure, demonstrating clearly that changes inthe structure of the inner plexiform layer are not fully reversible.In agreement with our observations of long-term changes in RFproperties due to early visual deprivation, the effects of dark-rearing on the receptive field properties in turtle retina are notreversible (Merwine et al., 1998, cited by Lee et al., 2006). Inter-estingly, dark rearing also enhances the strength of the inhibitorysurround in directionally selective RGCs in the rabbit (Chan andChiao, 2008) even when it does not disrupt the wiring of thecircuit that generates direction selectivity (Chan and Chiao, 2008;Elstrott et al., 2008).
In addition, we found that in most RGCs from DR/R animalsthe spatial location of the peak of the excitatory and inhibitorycomponents of the RF are spatially mismatched, as opposed tocontrol cells and to the classical RF model of RGCs (Rodieck,1965; Enroth-Cugell and Robson, 1966) and that on average thedegree of separation between the position of the peak of excita-tion and inhibition in DR/R animals is larger than in controls.Moreover, the lack of registration observed in eRF and iRF mapsmay lead to an underestimation of the ratio of inhibitory to exci-tatory conductance measured in response to small spots. Thesimilarities in the values obtained for the center and surroundradii and for the ratio of the integrated volume of the surround tocenter indicate that excitatory inputs onto RGCs are not affectedby dark-rearing/recovery and point out to the direct inhibitoryinputs and inner plexiform layer function as the source of thefunctional changes observed in RF properties.
It has been reported that RFs in the Xenopus optic tectumundergo developmental changes that involve a reduction in thestrength of inhibitory inputs as well as the spatial matching of theexcitatory and inhibitory components of the RF; and blockade orenhancement of GABAergic activity prevents size tuning and to-pographic mapping of excitatory and inhibitory inputs (Tao andPoo, 2005). Whether similar mechanisms may operate in theretina is unknown. Of relevance to our study, it has been estab-lished that the RF shape and size of RGCs changes during devel-opment as the proportion of RGCs with concentric RFs in boththe turtle and rabbit retina increases from only 6 –25% early indevelopment to �60% in the adult retina (Masland, 1977; Ser-nagor and Grzywacz, 1995). Although it is unknown whether ornot excitatory and inhibitory inputs undergo refinement andalignment during development and how they relate to RF size, itis likely that they experience similar modifications to those re-ported for other visual areas.
We conclude that complete visual deprivation from birththroughout the critical period of sensitivity permanently modi-fies the functional properties of RGCs. These results show for thefirst time that dark rearing causes an imbalance in the strength ofinhibitory and excitatory inputs in the retina as well as their spa-tial mismatch. The changes observed in response strength andreceptive field spatio-temporal properties suggest that alterationsat an early stage of visual processing can contribute to the changesin RF properties and loss of plasticity reported in higher visualareas after early long-term visual deprivation.
ReferencesAkerman CJ, Smyth D, Thompson ID (2002) Visual experience before eye-
opening and the development of the retinogeniculate pathway. Neuron36:869 – 879.
Balkema GW Jr, Pinto LH (1982) Electrophysiology of retinal ganglion cellsin the mouse: a study of a normally pigmented mouse and a congenichypopigmentation mutant, pearl. J Neurophysiol 48:968 –980.
Barlow HB, Hill RM, Levick WR (1964) Retinal ganglion cells respondingselectively to direction and speed of image motion in the rabbit. J Physiol173:377– 407.
Baro JA, Lehmkuhle S, Kratz KE (1990) Electroretinograms and visualevoked potentials in long-term monocularly deprived cats. Invest Oph-thalmol Vis Sci 31:1405–1409.
Bisti S, Gargini C, Chalupa LM (1998) Blockade of glutamate-mediated ac-tivity in the developing retina perturbs the functional segregation of ONand OFF pathways. J Neurosci 18:5019 –5025.
Bodnarenko SR, Chalupa LM (1993) Stratification of ON and OFF ganglioncell dendrites depends on glutamate-mediated afferent activity in the de-veloping retina. Nature 364:144 –146.
Bodnarenko SR, Jeyarasasingam G, Chalupa LM (1995) Development andregulation of dendritic stratification in retinal ganglion cells byglutamate-mediated afferent activity. J Neurosci 15:7037–7045.
Bodnarenko SR, Yeung G, Thomas L, McCarthy M (1999) The develop-ment of retinal ganglion cell dendritic stratification in ferrets. Neurore-port 10:2955–2959.
Borg-Graham LJ (2001) The computation of directional selectivity in theretina occurs presynaptic to the ganglion cell. Nat Neurosci 4:176 –183.
Carrasco MM, Razak KA, Pallas SL (2005) Visual experience is necessary formaintenance but not development of receptive fields in superior collicu-lus. J Neurophysiol 94:1962–1970.
Chan YC, Chiao CC (2008) Effect of visual experience on the maturation ofON-OFF direction selective ganglion cells in the rabbit retina. Vision Res48:2466 –2475.
Coombs J, Van Der List D, Chalupa LM (2007) Morphological properties ofmouse retinal ganglion cells during postnatal development. J Comp Neu-rol 503:803– 814.
Croner LJ, Kaplan E (1995) Receptive fields of P and M ganglion cells acrossthe primate retina. Vision Res 35:7–24.
Cynader M, Berman N, Hein A (1976) Recovery of function in cat visualcortex following prolonged deprivation. Exp Brain Res 25:139 –156.
Daniels JD, Pettigrew JD, Norman JL (1978) Development of single-neuronresponses in kitten’s lateral geniculate nucleus. J Neurophysiol41:1373–1393.
DeAngelis GC, Ghose GM, Ohzawa I, Freeman RD (1999) Functionalmicro-organization of primary visual cortex: receptive field analysis ofnearby neurons. J Neurosci 19:4046 – 4064.
Demb JB, Haarsma L, Freed MA, Sterling P (1999) Functional circuitry ofthe retinal ganglion cell’s nonlinear receptive field. J Neurosci19:9756 –9767.
Deplano S, Gargini C, Maccarone R, Chalupa LM, Bisti S (2004) Long-termtreatment of the developing retina with the metabotropic glutamate ago-nist APB induces long-term changes in the stratification of retinal gan-glion cell dendrites. Dev Neurosci 26:396 – 405.
Diao L, Sun W, Deng Q, He S (2004) Development of the mouse retina:emerging morphological diversity of the ganglion cells. J Neurobiol61:236 –249.
Elstrott J, Anishchenko A, Greschner M, Sher A, Litke AM, Chichilnisky EJ,Feller MB (2008) Direction selectivity in the retina is established inde-pendent of visual experience and cholinergic retinal waves. Neuron58:499 –506.
Enroth-Cugell C, Robson JG (1966) The contrast sensitivity of retinal gan-glion cells of the cat. J Physiol 187:517–552.
Enroth-Cugell C, Robson JG (1984) Functional characteristics and diversityof cat retinal ganglion cells. Basic characteristics and quantitative descrip-tion. Invest Ophthalmol Vis Sci 25:250 –267.
Fagiolini M, Pizzorusso T, Berardi N, Domenici L, Maffei L (1994) Func-tional postnatal development of the rat primary visual cortex and the roleof visual experience: dark rearing and monocular deprivation. Vision Res34:709 –720.
Fischer KF, Lukasiewicz PD, Wong RO (1998) Age-dependent and cellclass-specific modulation of retinal ganglion cell bursting activity byGABA. J Neurosci 18:3767–3778.
13700 • J. Neurosci., October 28, 2009 • 29(43):13691–13701 Di Marco et al. • Dark Rearing Permanently Alters Retinal Circuits
Giovannelli A, Di Marco S, Maccarone R, Bisti S (2008) Long-term darkrearing induces permanent reorganization in retinal circuitry. BiochemBiophys Res Commun 365:349 –354.
Grubb MS, Thompson ID (2004) The influence of early experience on thedevelopment of sensory systems. Curr Opin Neurobiol 14:503–512.
Hensch TK, Fagiolini M (2005) Excitatory-inhibitory balance and criticalperiod plasticity in developing visual cortex. Prog Brain Res 147:115–124.
Hensch TK, Fagiolini M, Mataga N, Stryker MP, Baekkeskov S, Kash SF(1998) Local GABA circuit control of experience-dependent plasticity indeveloping visual cortex. Science 282:1504 –1508.
Hochstein S, Shapley RM (1976) Quantitative analysis of retinal ganglioncell classifications. J Physiol 262:237–264.
Huberman AD, Feller MB, Chapman B (2008) Mechanisms underlying de-velopment of visual maps and receptive fields. Annu Rev Neurosci31:479 –509.
Katagiri H, Fagiolini M, Hensch TK (2007) Optimization of somatic inhi-bition at critical period onset in mouse visual cortex. Neuron 53:805– 812.
Kuffler SW (1953) Discharge patterns and functional organization of mam-malian retina. J Neurophysiol 16:37– 68.
Landi S, Cenni MC, Maffei L, Berardi N (2007) Environmental enrichmenteffects on development of retinal ganglion cell dendritic stratificationrequire retinal BDNF. PLoS One 2:e346.
Lee EJ, Gibo TL, Grzywacz NM (2006) Dark-rearing-induced reduction ofGABA and GAD and prevention of the effect by BDNF in the mouseretina. Eur J Neurosci 24:2118 –2134.
Leitch E, Coaker J, Young C, Mehta V, Sernagor E (2005) GABA type-Aactivity controls its own developmental polarity switch in the maturingretina. J Neurosci 25:4801– 4805.
Liao DS, Krahe TE, Prusky GT, Medina AE, Ramoa AS (2004) Recovery ofcortical binocularity and orientation selectivity after the critical period forocular dominance plasticity. J Neurophysiol 92:2113–2121.
Linsenmeier RA, Frishman LJ, Jakiela HG, Enroth-Cugell C (1982) Recep-tive field properties of X and Y cells in the cat retina derived from contrastsensitivity measurements. Vision Res 22:1173–1183.
Liu X, Grishanin RN, Tolwani RJ, Rentería RC, Xu B, Reichardt LF,Copenhagen DR (2007a) Brain-derived neurotrophic factor and TrkBmodulate visual experience-dependent refinement of neuronal pathwaysin retina. J Neurosci 27:7256 –7267.
Liu Y, Zhang LI, Tao HW (2007b) Heterosynaptic scaling of developingGABAergic synapses: dependence on glutamatergic input and develop-mental stage. J Neurosci 27:5301–5312.
Masland RH (1977) Maturation of function in the developing rabbit retina.J Comp Neurol 175:275–286.
Maslim J, Stone J (1988) Time course of stratification of the dendritic fieldsof ganglion cells in the retina of the cat. Dev Brain Res 44:87–93.
Mehta V, Sernagor E (2006a) Early neural activity and dendritic growth inturtle retinal ganglion cells. Eur J Neurosci 24:773–786.
Mehta V, Sernagor E (2006b) Receptive field structure-function correlatesin developing turtle retinal ganglion cells. Eur J Neurosci 24:787–794.
Merwine DK, Grzywacz NM, Amthor FR (1998) Persistent effects of darkrearing on the development of turtle retinal ganglion cells. Soc NeurosciAbstr 24:600.10.
Mitchell DE (1988) The extent of visual recovery from early monocular orbinocular visual deprivation in kittens. J Physiol 395:639 – 660.
Morales B, Choi SY, Kirkwood A (2002) Dark rearing alters the develop-ment of GABAergic transmission in visual cortex. J Neurosci 22:8084 –8090.
Mumm JS, Godinho L, Morgan JL, Oakley DM, Schroeter EH, Wong RO(2005) Laminar circuit formation in the vertebrate retina. Prog Brain Res147:155–169.
Osswald IK, Galan A, Bowie D (2007) Light triggers expression ofphilanthotoxin-insensitive Ca2�-permeable AMPA receptors in the de-veloping rat retina. J Physiol 582:95–111.
Prusky GT, Douglas RM (2003) Developmental plasticity of mouse visualacuity. Eur J Neurosci 17:167–173.
Prusky GT, West PW, Douglas RM (2000) Experience-dependent plasticityof visual acuity in rats. Eur J Neurosci 12:3781–3786.
Rodieck RW (1965) Quantitative analysis of cat retinal ganglion cell re-sponse to visual stimuli. Vision Res 5:583– 601.
Rodieck RW, Stone J (1965) Analysis of receptive fields of cat retinal gan-glion cells. J Neurophysiol 28:832– 849.
Sernagor E, Grzywacz NM (1995) Emergence of complex receptive fieldproperties of ganglion cells in the developing turtle retina. J Neurophysiol73:1355–1364.
Sernagor E, Grzywacz NM (1996) Influence of spontaneous activity andvisual experience on developing retinal receptive fields. Curr Biol6:1503–1508.
Sernagor E, Young C, Eglen SJ (2003) Developmental modulation of retinalwave dynamics: shedding light on the GABA saga. J Neurosci 23:7621–7629.
Stone C, Pinto LH (1993) Response properties of ganglion cells in the iso-lated mouse retina. Vis Neurosci 10:31–39.
Sun W, Li N, He S (2002) Large-scale morophological survey of rat retinalganglion cells. Vis Neurosci 19:483– 493.
Tao HW, Poo MM (2005) Activity-dependent matching of excitatory andinhibitory inputs during refinement of visual receptive fields. Neuron45:829 – 836.
Taylor WR, Vaney DI (2002) Diverse synaptic mechanisms generate direc-tion selectivity in the rabbit retina. J Neurosci 22:7712–7720.
Tian N, Copenhagen DR (2001) Visual deprivation alters development ofsynaptic function in inner retina after eye opening. Neuron 32:439 – 449.
Tian N, Copenhagen DR (2003) Visual stimulation is required for refine-ment of ON and OFF pathways in postnatal retina. Neuron 39:85–96.
Timney B, Mitchell DE, Giffin F (1978) The development of vision in catsafter extended periods of dark-rearing. Exp Brain Res 31:547–560.
Tootle JS (1993) Early postnatal development of visual function in ganglioncells of the cat retina. J Neurophysiol 69:1645–1660.
Wang CT, Blankenship AG, Anishchenko A, Elstrott J, Fikhman M, Nakan-ishi S, Feller MB (2007) GABAA receptor-mediated signaling alters thestructure of spontaneous activity in the developing retina. J Neurosci27:9130 –9140.
Wang GY, Liets LC, Chalupa LM (2001) Unique functional properties of onand off pathways in the developing mammalian retina. J Neurosci21:4310 – 4317.
Wiesel TN, Hubel DH (1963) Effects of visual deprivation on morphologyand physiology of cells in the cats lateral geniculate body. J Neurophysiol26:978 –993.
Zhang J, Yang Z, Wu SM (2005) Development of cholinergic amacrine cellsis visual activity-dependent in the postnatal mouse retina. J Comp Neurol484:331–343.
Zhang LL, Pathak HR, Coulter DA, Freed MA, Vardi N (2006) Shift of in-tracellular chloride concentration in ganglion and amacrine cells of de-veloping mouse retina. J Neurophysiol 95:2404 –2416.
Di Marco et al. • Dark Rearing Permanently Alters Retinal Circuits J. Neurosci., October 28, 2009 • 29(43):13691–13701 • 13701