Performance of Multi-City Land Use Regression Models for Nitrogen Dioxide and Fine Particles
7
Environmental Health Perspectives • VOLUME 122 | NUMBER 8 | August 2014 843 Research All EHP content is accessible to individuals with disabilities. A fully accessible (Section 508–compliant) HTML version of this article is available at http://dx.doi.org/10.1289/ehp.1307271. Introduction Many studies have documented adverse health effects associated with long-term expo- sure to air pollutants (e.g., Brunekreef and Holgate 2002). With the improvement of the accuracy of geographical data, air pollution models incorporating data from geographical information systems (GIS) are of increasing interest in exposure assessment (Hoek et al. 2008; Jerrett et al. 2005). Land use regres- sion (LUR) modeling is a popular method used for exposure assessment in health studies (Cesaroni et al. 2013; Estarlich et al. 2011; Gehring et al. 2011). LUR modeling is a GIS- and statistics-based method that exploits land use, geographic, and traffic char- acteristics (e.g., traffic intensity, road length, population density) to explain spatial concen- tration variations at monitoring sites. Land use regression models were con- structed and used mostly to predict concen- trations within metropolitan areas (Hoek et al. 2011; Madsen et al. 2007; Marshall et al. 2008) or small regions (Brauer et al. 2003; Henderson et al. 2007). Often, models have been based on measurements made at a relatively small number of sampling sites (20 to ~ 80 sites). Our recent study showed Address correspondence to M. Wang, Institute for Risk Assessment Sciences, Division Environmental Epidemiology, Utrecht University, PO Box 80178, 3508 TD Utrecht, the Netherlands. Telephone: 31 (0)6 16697117. E-mail: [email protected] Supplemental Material is available online (http:// dx.doi.org/10.1289/ehp.1307271). We thank all those who participated and were responsible for air pollution measurements, data management, model building, and project supervision in all the ESCAPE study areas. The research leading to these results has received funding from the European Community’s Seventh Framework Program (FP7/2007–2011) under grant agreement 211250. e funding source had no role in the study design; in the collection, analysis, and interpretation of data; in the writing of the report; or in the decision to submit the manuscript for publication. e authors declare they have no actual or potential competing financial interests. Received: 24 June 2013; Accepted: 30 April 2014; Advance Publication: 2 May 2014; Final Publication: 1 August 2014. Performance of Multi-City Land Use Regression Models for Nitrogen Dioxide and Fine Particles Meng Wang, 1 Rob Beelen, 1 Tom Bellander, 2 Matthias Birk, 3 Giulia Cesaroni, 4 Marta Cirach, 5 Josef Cyrys, 6,7 Kees de Hoogh, 8 Christophe Declercq, 9 Konstantina Dimakopoulou, 10 Marloes Eeftens, 1 Kirsten T. Eriksen, 11 Francesco Forastiere, 4 Claudia Galassi, 12 Georgios Grivas, 13 Joachim Heinrich, 3 Barbara Hoffmann, 14 Alex Ineichen, 15 Michal Korek, 2 Timo Lanki, 16 Sarah Lindley, 17 Lars Modig, 18 Anna Mölter, 19 Per Nafstad, 20,21 Mark J. Nieuwenhuijsen, 5 Wenche Nystad, 21 David Olsson, 18 Ole Raaschou-Nielsen, 11 Martina Ragettli, 15 Andrea Ranzi, 12 Morgane Stempfelet, 9 Dorothea Sugiri, 14 Ming-Yi Tsai, 15,22,23 Orsolya Udvardy, 24 Mihaly J. Varró, 24 Danielle Vienneau, 8,15,22 Gudrun Weinmayr, 25 Kathrin Wolf, 6 Tarja Yli-Tuomi, 16 Gerard Hoek, 1 and Bert Brunekreef 1,26 1 Institute for Risk Assessment Sciences, Utrecht University, Utrecht, the Netherlands; 2 Institute of Environmental Medicine, Karolinska Institutet, Stockholm, Sweden; 3 Institute of Epidemiology I, Helmholtz Zentrum München, German Research Center for Environmental Health, Neuherberg, Germany; 4 Epidemiology Department, Lazio Regional Health Service, Rome, Italy; 5 Center for Research in Environmental Epidemiology (CREAL), Barcelona, Spain; 6 Institute of Epidemiology II, Helmholtz Zentrum München, German Research Center for Environmental Health, Neuherberg, Germany; 7 University of Augsburg, Environmental Science Center, Augsburg, Germany; 8 MRC-PHE Centre for Environment and Health, Department of Epidemiology and Biostatistics, Imperial College London, London, United Kingdom; 9 French Institute for Public Health Surveillance, Saint- Maurice, France; 10 Department of Hygiene, Epidemiology and Medical Statistics, National and Kapodistrian University of Athens, Medical School, Athens, Greece; 11 Danish Cancer Society Research Center, Copenhagen, Denmark; 12 AOU Città della Salute e della Scienza–Center for Cancer Prevention (CPO Piedmont), Turin, Italy; 13 School of Chemical Engineering, National Technical University of Athens, Athens, Greece; 14 IUF Leibniz Research Institute for Environmental Medicine, University of Düsseldorf, Düsseldorf, Germany; 15 Department of Epidemiology and Public Health, Swiss Tropical and Public Health Institute, Basel, Switzerland; 16 Department of Environmental Health, National Institute for Health and Welfare, Kuopio, Finland; 17 School of Environment and Development (Geography), University of Manchester, Manchester, United Kingdom; 18 Department of Public Health and Clinical Medicine, Umeå University, Umeå, Sweden; 19 Centre for Occupational and Environmental Health, University of Manchester, Manchester, United Kingdom; 20 Institute of Health and Society, University of Oslo, Oslo, Norway; 21 Norwegian Institute of Public Health, Oslo, Norway; 22 University of Basel, Basel, Switzerland; 23 Department of Environmental and Occupational Health Sciences, University of Washington, Seattle, USA; 24 Department of Air Hygiene, National Institute of Environmental Health, Budapest, Hungary; 25 Institute of Epidemiology and Medical Biometry, Ulm University, Ulm, Germany; 26 Julius Center for Health Sciences and Primary Care, University Medical Center Utrecht, Utrecht, the Netherlands BACKGROUND: Land use regression (LUR) models have been developed mostly to explain intraurban variations in air pollution based on often small local monitoring campaigns. Transferability of LUR models from city to city has been investigated, but little is known about the performance of models based on large numbers of monitoring sites covering a large area. OBJECTIVES: We aimed to develop European and regional LUR models and to examine their transferability to areas not used for model development. METHODS: We evaluated LUR models for nitrogen dioxide (NO 2 ) and particulate matter (PM; PM 2.5 , PM 2.5 absorbance) by combining standardized measurement data from 17 (PM) and 23 (NO 2 ) ESCAPE (European Study of Cohorts for Air Pollution Effects) study areas across 14 European countries for PM and NO 2 . Models were evaluated with cross-validation (CV) and hold-out validation (HV). We investigated the transferability of the models by successively excluding each study area from model building. RESULTS: e European model explained 56% of the concentration variability across all sites for NO 2 , 86% for PM 2.5 , and 70% for PM 2.5 absorbance. e HV R 2 s were only slightly lower than the model R 2 (NO 2 , 54%; PM 2.5 , 80%; PM 2.5 absorbance, 70%). e European NO 2 , PM 2.5 , and PM 2.5 absorbance models explained a median of 59%, 48%, and 70% of within-area vari- ability in individual areas. e transferred models predicted a modest-to-large fraction of variability in areas that were excluded from model building (median R 2 : NO 2 , 59%; PM 2.5 , 42%; PM 2.5 absorbance, 67%). CONCLUSIONS: Using a large data set from 23 European study areas, we were able to develop LUR models for NO 2 and PM metrics that predicted measurements made at independent sites and areas reasonably well. is finding is useful for assessing exposure in health studies conducted in areas where no measurements were conducted. CITATION: Wang M, Beelen R, Bellander T, Birk M, Cesaroni G, Cirach M, Cyrys J, de Hoogh K, Declercq C, Dimakopoulou K, Eeftens M, Eriksen KT, Forastiere F, Galassi C, Grivas G, Heinrich J, Hoffmann B, Ineichen A, Korek M, Lanki T, Lindley S, Modig L, Mölter A, Nafstad P, Nieuwenhuijsen MJ, Nystad W, Olsson D, Raaschou-Nielsen O, Ragettli M, Ranzi A, Stempfelet M, Sugiri D, Tsai MY, Udvardy O, Varró MJ, Vienneau D, Weinmayr G, Wolf K, Yli-Tuomi T, Hoek G, Brunekreef B. 2014. Performance of multi-city land use regression models for nitrogen dioxide and fine particles. Environ Health Perspect 122:843–849; http://dx.doi. org/10.1289/ehp.1307271
-
Upload
independent -
Category
Documents
-
view
3 -
download
0
Transcript of Performance of Multi-City Land Use Regression Models for Nitrogen Dioxide and Fine Particles
Environmental Health Perspectives • volume 122 | number 8 | August 2014 843
ResearchAll EHP content is accessible to individuals with disabilities. A fully accessible (Section 508–compliant) HTML version of this article is available at http://dx.doi.org/10.1289/ehp.1307271.
IntroductionMany studies have documented adverse health effects associated with long-term expo-sure to air pollutants (e.g., Brunekreef and Holgate 2002). With the improvement of the accuracy of geographical data, air pollution
models incorporating data from geographical information systems (GIS) are of increasing interest in exposure assessment (Hoek et al. 2008; Jerrett et al. 2005). Land use regres-sion (LUR) modeling is a popular method used for exposure assessment in health
studies (Cesaroni et al. 2013; Estarlich et al. 2011; Gehring et al. 2011). LUR modeling is a GIS- and statistics-based method that exploits land use, geographic, and traffic char-acteristics (e.g., traffic intensity, road length, population density) to explain spatial concen-tration variations at monitoring sites.
Land use regression models were con-structed and used mostly to predict concen-trations within metropolitan areas (Hoek et al. 2011; Madsen et al. 2007; Marshall et al. 2008) or small regions (Brauer et al. 2003; Henderson et al. 2007). Often, models have been based on measurements made at a relatively small number of sampling sites (20 to ~ 80 sites). Our recent study showed
Address correspondence to M. Wang, Institute for Risk Assessment Sciences, Division Environmental Epidemiology, Utrecht University, PO Box 80178, 3508 TD Utrecht, the Netherlands. Telephone: 31 (0)6 16697117. E-mail: [email protected]
Supplemental Material is available online (http://dx.doi.org/10.1289/ehp.1307271).
We thank all those who participated and were responsible for air pollution measurements, data manage ment, model building, and project supervision in all the ESCAPE study areas.
The research leading to these results has received funding from the European Community’s Seventh Framework Program (FP7/2007–2011) under grant agreement 211250.
The funding source had no role in the study design; in the collection, analysis, and interpretation of data; in the writing of the report; or in the decision to submit the manuscript for publication.
The authors declare they have no actual or potential competing financial interests.
Received: 24 June 2013; Accepted: 30 April 2014; Advance Publication: 2 May 2014; Final Publication: 1 August 2014.
Performance of Multi-City Land Use Regression Models for Nitrogen Dioxide and Fine ParticlesMeng Wang,1 Rob Beelen,1 Tom Bellander,2 Matthias Birk,3 Giulia Cesaroni,4 Marta Cirach,5 Josef Cyrys,6,7 Kees de Hoogh,8 Christophe Declercq,9 Konstantina Dimakopoulou,10 Marloes Eeftens,1 Kirsten T. Eriksen,11 Francesco Forastiere,4 Claudia Galassi,12 Georgios Grivas,13 Joachim Heinrich,3 Barbara Hoffmann,14 Alex Ineichen,15 Michal Korek,2 Timo Lanki,16 Sarah Lindley,17 Lars Modig,18 Anna Mölter,19 Per Nafstad,20,21 Mark J. Nieuwenhuijsen,5 Wenche Nystad,21 David Olsson,18 Ole Raaschou-Nielsen,11 Martina Ragettli,15 Andrea Ranzi,12 Morgane Stempfelet,9 Dorothea Sugiri,14 Ming-Yi Tsai,15,22,23 Orsolya Udvardy,24 Mihaly J. Varró,24 Danielle Vienneau,8,15,22 Gudrun Weinmayr,25 Kathrin Wolf,6 Tarja Yli-Tuomi,16 Gerard Hoek,1 and Bert Brunekreef1,26
1Institute for Risk Assessment Sciences, Utrecht University, Utrecht, the Netherlands; 2Institute of Environmental Medicine, Karolinska Institutet, Stockholm, Sweden; 3Institute of Epidemiology I, Helmholtz Zentrum München, German Research Center for Environmental Health, Neuherberg, Germany; 4Epidemiology Department, Lazio Regional Health Service, Rome, Italy; 5Center for Research in Environmental Epidemiology (CREAL), Barcelona, Spain; 6Institute of Epidemiology II, Helmholtz Zentrum München, German Research Center for Environmental Health, Neuherberg, Germany; 7University of Augsburg, Environmental Science Center, Augsburg, Germany; 8MRC-PHE Centre for Environment and Health, Department of Epidemiology and Biostatistics, Imperial College London, London, United Kingdom; 9French Institute for Public Health Surveillance, Saint-Maurice, France; 10Department of Hygiene, Epidemiology and Medical Statistics, National and Kapodistrian University of Athens, Medical School, Athens, Greece; 11Danish Cancer Society Research Center, Copenhagen, Denmark; 12AOU Città della Salute e della Scienza–Center for Cancer Prevention (CPO Piedmont), Turin, Italy; 13School of Chemical Engineering, National Technical University of Athens, Athens, Greece; 14IUF Leibniz Research Institute for Environmental Medicine, University of Düsseldorf, Düsseldorf, Germany; 15Department of Epidemiology and Public Health, Swiss Tropical and Public Health Institute, Basel, Switzerland; 16Department of Environmental Health, National Institute for Health and Welfare, Kuopio, Finland; 17School of Environment and Development (Geography), University of Manchester, Manchester, United Kingdom; 18Department of Public Health and Clinical Medicine, Umeå University, Umeå, Sweden; 19Centre for Occupational and Environmental Health, University of Manchester, Manchester, United Kingdom; 20Institute of Health and Society, University of Oslo, Oslo, Norway; 21Norwegian Institute of Public Health, Oslo, Norway; 22University of Basel, Basel, Switzerland; 23Department of Environmental and Occupational Health Sciences, University of Washington, Seattle, USA; 24Department of Air Hygiene, National Institute of Environmental Health, Budapest, Hungary; 25Institute of Epidemiology and Medical Biometry, Ulm University, Ulm, Germany; 26Julius Center for Health Sciences and Primary Care, University Medical Center Utrecht, Utrecht, the Netherlands
Background: Land use regression (LUR) models have been developed mostly to explain intraurban variations in air pollution based on often small local monitoring campaigns. Transferability of LUR models from city to city has been investigated, but little is known about the performance of models based on large numbers of monitoring sites covering a large area.
oBjectives: We aimed to develop European and regional LUR models and to examine their transferability to areas not used for model development.
Methods: We evaluated LUR models for nitrogen dioxide (NO2) and particulate matter (PM; PM2.5, PM2.5 absorbance) by combining standardized measurement data from 17 (PM) and 23 (NO2) ESCAPE (European Study of Cohorts for Air Pollution Effects) study areas across 14 European countries for PM and NO2. Models were evaluated with cross-validation (CV) and hold-out validation (HV). We investigated the transferability of the models by successively excluding each study area from model building.
results: The European model explained 56% of the concentration variability across all sites for NO2, 86% for PM2.5, and 70% for PM2.5 absorbance. The HV R2s were only slightly lower than the model R2 (NO2, 54%; PM2.5, 80%; PM2.5 absorbance, 70%). The European NO2, PM2.5, and PM2.5 absorbance models explained a median of 59%, 48%, and 70% of within-area vari-ability in individual areas. The transferred models predicted a modest-to-large fraction of variability in areas that were excluded from model building (median R2: NO2, 59%; PM2.5, 42%; PM2.5 absorbance, 67%).
conclusions: Using a large data set from 23 European study areas, we were able to develop LUR models for NO2 and PM metrics that predicted measurements made at independent sites and areas reasonably well. This finding is useful for assessing exposure in health studies conducted in areas where no measurements were conducted.
citation: Wang M, Beelen R, Bellander T, Birk M, Cesaroni G, Cirach M, Cyrys J, de Hoogh K, Declercq C, Dimakopoulou K, Eeftens M, Eriksen KT, Forastiere F, Galassi C, Grivas G, Heinrich J, Hoffmann B, Ineichen A, Korek M, Lanki T, Lindley S, Modig L, Mölter A, Nafstad P, Nieuwenhuijsen MJ, Nystad W, Olsson D, Raaschou-Nielsen O, Ragettli M, Ranzi A, Stempfelet M, Sugiri D, Tsai MY, Udvardy O, Varró MJ, Vienneau D, Weinmayr G, Wolf K, Yli-Tuomi T, Hoek G, Brunekreef B. 2014. Performance of multi-city land use regression models for nitrogen dioxide and fine particles. Environ Health Perspect 122:843–849; http://dx.doi.org/10.1289/ehp.1307271
Wang et al.
844 volume 122 | number 8 | August 2014 • Environmental Health Perspectives
a positive association between the number of sampling sites and the prediction capability of models for NO2 based on 144 sites in the Netherlands (Wang et al. 2012), in agreement with observations for Girona, Spain (Basagaña et al. 2012). At least for some of the reported studies, there is still room to improve the model performances if more sampling sites were selected (Hoek et al. 2008). Several studies have reported the possibilities of build-ing models in large areas in Europe, United States, and Canada (Beelen et al. 2009; Hart et al. 2009; Hystad et al. 2011; Vienneau et al. 2009, 2013). With a large number of sites, these models explained large fractions of NO2 variability (61% to ~ 90%) and a mod-est fraction of the variability of PM (40% to ~ 50%) across all sites. The large-area studies were all based on routine monitoring data. National routine monitoring networks may include only a small number of sites within individual cities. Therefore it may be diffi-cult to evaluate how well a large-area model explains within-city variability. This is relevant for epidemiological studies based in individual cities. A study in Switzerland based on study-specific monitoring suggested that a country-wide model did not perform well within six of the eight geographically diverse study areas (Liu et al. 2012).
The applicability of LUR models can be increased by transferring them to adjacent areas with similar geography and GIS data-bases where no or few measurements were conducted. The transferability of models has been investigated for local and national mod-els (Allen et al. 2011; Poplawski et al. 2009; Vienneau et al. 2010). Most of the earlier studies recommended using the locally built models, even though transferred models explained variations in concentrations fairly well. This was recommended because all the transferred models were city–city or country–country transfers for which local specific variables were not available, and there was no advantage in the number of sampling sites compared with the locally developed models.
So far, few studies have attempted to explore the performance of LUR models with combined geographical areas in terms of pre-diction ability and transferability at indepen-dent sites and areas—mainly because sufficient, comparable measurement data are lacking. In the context of the European Study of Cohorts for Air Pollution Effects (ESCAPE 2013), we applied a standardized approach for measure-ments, GIS variable collection, and model development for nitrogen dioxide (NO2) and particulate matter (PM) in 36 study areas in Europe (Beelen et al. 2013; Cyrys et al. 2012; Eeftens et al. 2012a, 2012b). We recently pub-lished LUR models developed within indi-vidual study areas for NO2 and PM (Beelen et al. 2013; Eeftens et al. 2012a). The ESCAPE
database provides a unique opportunity to address important questions regarding applica-tion of LUR models developed for even larger areas. Therefore, the aims of this study are a) to develop LUR models for NO2, PM2.5 (PM with diameter ≤ 2.5 μm), and PM2.5 absor-bance based on combining the ESCAPE study areas across Europe and across four regions of Europe; b) to evaluate the model perfor-mances systematically in terms of model fitting and prediction ability; and c) to investigate the transferability of the regional and European models to monitoring sites and areas not included in the model building.
MethodsStudy areas and air pollution measurements. Details of the ESCAPE study design and the measurement campaign have been described previously (Cyrys et al. 2012; Eeftens et al. 2012b). Briefly, an intensive monitoring cam-paign was conducted in 36 European study areas between October 2008 and May 2011. ESCAPE included 20 areas with simultane-ous measurements of both PM and NO2 at 20 sites per area, and at 20 sites where only NO2 was measured. In an additional 16 areas, where PM measurements were not available, only NO2 measurements were conducted at 40 sites per area. The number of measurement sites was doubled in the large study area of the Netherlands and Belgium. In each area, we chose sampling sites at street, urban back-ground, and regional background locations. Sites were also selected to cover locally impor-tant variation—for example, presence of a port
or altitude. These sites were selected to repre-sent the spatial distribution of air pollution and residential addresses of participants of cohort studies in these areas. The background sites have been carefully selected to the locations not influenced by local traffic and other local emissions (e.g., industry and port) (Beelen et al. 2013; Eeftens et al. 2012a). Annual aver-age concentrations were calculated from three 2-week samples in the cold, warm, and inter-mediate seasons. Because the number of sam-plers was limited, five sites and the references site were measured simultaneously. The mea-sured values were adjusted for temporal trends with data from the continuous reference site in each area by calculating absolute differences between concentrations at monitoring sites and reference sites and using that as adjustment factor (Cyrys et al. 2012; Eeftens et al. 2012b).
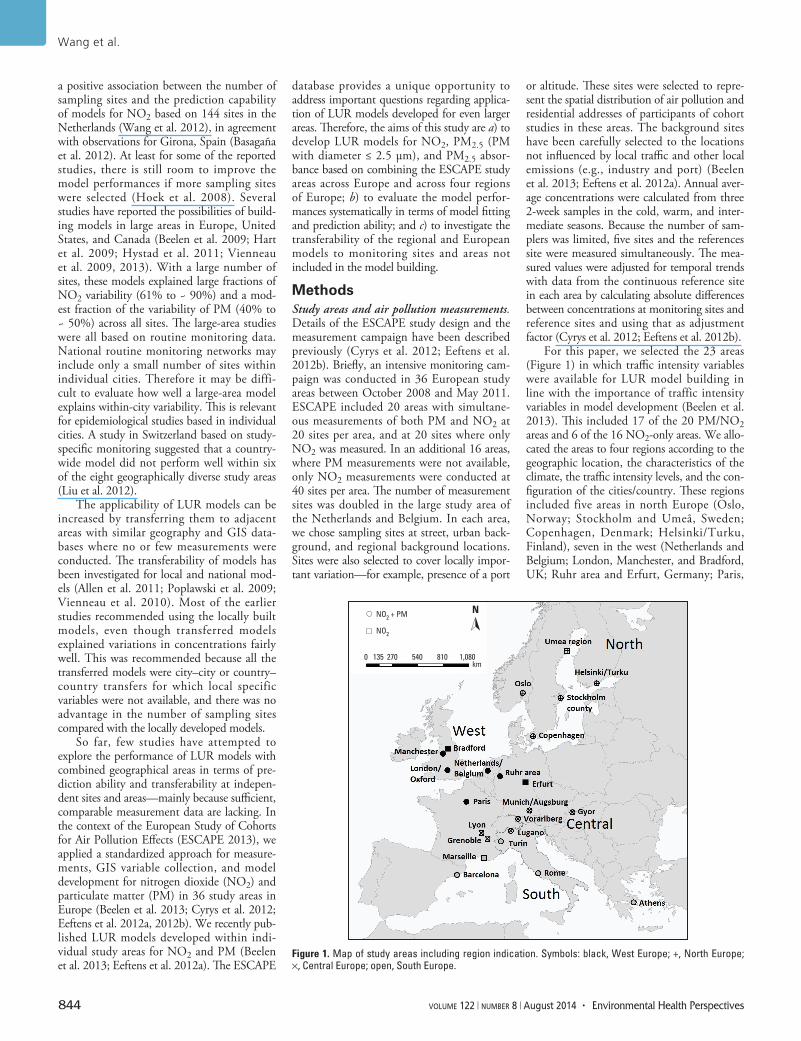
For this paper, we selected the 23 areas (Figure 1) in which traffic intensity variables were available for LUR model building in line with the importance of traffic intensity variables in model development (Beelen et al. 2013). This included 17 of the 20 PM/NO2 areas and 6 of the 16 NO2-only areas. We allo-cated the areas to four regions according to the geographic location, the characteristics of the climate, the traffic intensity levels, and the con-figuration of the cities/country. These regions included five areas in north Europe (Oslo, Norway; Stockholm and Umeå, Sweden; Copenhagen, Denmark; Helsinki/Turku, Finland), seven in the west (Netherlands and Belgium; London, Manchester, and Bradford, UK; Ruhr area and Erfurt, Germany; Paris,
Figure 1. Map of study areas including region indication. Symbols: black, West Europe; +, North Europe; ×, Central Europe; open, South Europe.
NNO2 + PM
NO2
0 135 270 540 810 1,080km
Multi-cities land use regression modeling
Environmental Health Perspectives • volume 122 | number 8 | August 2014 845
France), six in the center (Munich and Vorarlberg, Germany; Györ, Hungary; Lugano, Switzerland; Grenoble and Lyon, France), and five in the south (Turin and Rome, Italy; Athens, Greece; Barcelona, Spain; Marseille, France) (Figure 1, Table 1).
For this study we selected NO2 and PM2.5 absorbance to represent traffic-related air pol-lution, and PM2.5 for a more complex mixture of sources. NO2 was measured using Ogawa badges following the Ogawa analysis protocol (V 3.98; Ogawa & Co., Pompano Beach, FL USA). PM2.5 samples were collected on pre-weighted filters using Harvard impactors, and were then used to measure absorbance (Cyrys et al. 2012; Eeftens et al. 2012b).
Predictor variables. We extracted values for the GIS predictor variables at the locations of sampling sites using ArcGIS (ESRI, Redlands, CA, USA). Details of the predictor variables have been described in previous papers (Beelen et al. 2013; Eeftens et al. 2012a). Briefly, the predictor variables were derived from both cen-trally available Europe-wide GIS databases and GIS data collected by the local centers using standard definitions.
Central GIS predictor variables included road network, land use, population density, and altitude data. The digital road network was obtained from EuroStreets version 3.1 (EuroStreets 2013) for the year 2008. The total lengths of all roads and major roads were calculated within a buffer size of 25, 50, 100, 300, 500, or 1,000 m. Traffic intensity data were not available for this road network. Land use variables were derived from the European Corine Land Cover (European Environment Agency 2000) database for the year 2000 for the buffer sizes of 100, 300, 500, 1,000 and 5,000 m. Digital elevation data were obtained
through the Shuttle Radar Topographic Mission (SRTM) (CGIAR Consortium for Spatial Information 2013). Detailed road net-work with linked traffic intensity for all road links were obtained from local sources for all 23 areas. Local land use, population density, altitude, and other local variables were also locally extracted for modeling.
For the regional and European models, we pooled the data by including all the cen-tral GIS predictors and the local traffic vari-ables with traffic intensity. We combined the centrally available land use variables high and low residence density, and the natural and urban green variables because not all the areas contained them separately. We made efforts to incorporate more local common vari-ables for specific regions to capture regional variations. We included regional background concentrations of NO2, PM absorbance, and PM2.5 as the mean of the measured concen-trations at ESCAPE regional background sites (1–20) in each local study area to characterize the spatial differences between study areas. In the Netherlands, regional background con-centrations were interpolated from regional background sites throughout the country because background concentrations may vary at such a large scale. In total, 49 variables were evaluated at the European level and 54, 53, 54, and 64 variables in the north, west, middle, and south regions, respectively (see Supplemental Material, Table S1).
Model development. A total of 960 NO2 sites and 356 PM sites (four sites were miss-ing due to failed campaign) were available for modeling from 23 and 17 study areas, respectively. Detailed procedures of the NO2 and PM model development have been pub-lished elsewhere (Beelen et al. 2013; Eeftens et al. 2012a). The regional and European models were developed using the same strictly standardized approaches. Briefly, a supervised stepwise regression was used to develop the LUR model. We first evaluated univariate regression of the annual concentrations by entering all potential predictor variables. We forced the regional background concentration variable in the first step (for the European and regional models). Then the variable that produced the highest adjusted R2 and which had the a priori–defined direction of effect (e.g., positive for traffic intensity) was selected as the second predictor. Second, the remain-ing variables were added separately, and we assessed whether the variable with the highest increase in adjusted R2 improved the model by at least 1%. This process continued until no more variables with the a priori–specified sign could increase the model-adjusted R2 by at least 1%. In the final step, we excluded variables that had a p-value > 0.1. We checked whether the variance inflation factor was < 3 to avoid multicollinearity.
Model evaluations . We used three approaches for model evaluation:• We investigated the model fit at individual
study areas by applying the European/regional model to the sites of each area that were used for modeling. The Modelintra R2 shows the within-area variations explained by the European/regional models, which are directly comparable with the R2 of city-specific models. The Modelintra R2 is important for studies conducted within indi-vidual cities that use the European/regional model. The overall R2 is relevant for multi-city studies that exploit both within- and between-city variability of air pollution con-trasts. The Modelintra R2 is important for European studies such as ESCAPE because cohorts were located within a city or small area, and cohort-specific epidemiological analyses were conducted.
• Cross-validation (CV) is an internal valida-tion for testing the stability of model fit. We conducted leave-one-area-out-cross- validation (LOAOCV) by leaving out all observations from a complete area of n study areas (n = 23 for NO2 and 17 for PM), refitting the model based on the remaining M-1 areas, and inves-tigating the agreement between predicted and observed concentrations for each area that was left out. This was iterated M times, and the LOAOCV reflects the heterogeneity of model fit due to regional variations between study areas. We do not report LOAOCV that was almost identical to the model R2 probably because of the large training data set.
• The hold-out validation (HV) is an evalua-tion of model predictive power to indepen-dent sites not used for model building. In contrast with CV, HV reflects the predic-tion ability of models to the cohort addresses within the areas on which the models had been established. As a test, we divided the full set into two parts; the training sets were used for modeling and the remaining test sets were used for external evaluation. For NO2, we developed models using the PM/NO2 sites with 20–40 sites per area (480 sites in total) as training sets and the remaining 480 NO2-only sites as test sets. For PM2.5 and PM2.5 absorbance, a randomly selected 25% of the PM sites stratified by study area were used for validation purpose because we had fewer sites available for PM model building than for NO2 model building. The HV R2 is the squared Pearson correlation between predictions and observations at the indepen-dent sites throughout the whole study area. We calculated the HV R2 by truncating the values of predictors in the test data sets that were outside the range of the values observed in the data set for model development, to prevent unrealistic predictions based on model extrapolations (Wang et al. 2012). Prediction errors were estimated by root
Table 1. Study areas.
Code Type Region Study areaNOS PM/NO2 North Oslo, NorwaySST PM/NO2 North Stockholm, SwedenFIH PM/NO2 North Helsinki/Turku, FinlandDCO PM/NO2 North Copenhagen, DenmarkSUM NO2 North Umeå, SwedenUKM PM/NO2 West Manchester, UKUKO PM/NO2 West London, Oxford, UKBNL PM/NO2 West Netherlands and BelgiumGRU PM/NO2 West Ruhr area, GermanyGRE NO2 West Erfurt, GermanyUKB NO2 West Bradford, UKFPA PM/NO2 West Paris, FranceGMU PM/NO2 Central Munich, GermanyAUV PM/NO2 Central Vorarlberg, AustriaFLY NO2 Central Lyon, FranceHUG PM/NO2 Central Györ, HungarySWL PM/NO2 Central Lugano, SwitzerlandFGR NO2 Central Grenoble, FranceITU PM/NO2 South Turin, ItalyIRO PM/NO2 South Rome, ItalySPB PM/NO2 South Barcelona, SpainFMA NO2 South Marseille, FranceGRA PM/NO2 South Athens, Greece

Wang et al.
846 volume 122 | number 8 | August 2014 • Environmental Health Perspectives
mean squared error (RMSE). In our previ-ous study, the same NO2 training and test sets were used for the ESCAPE city-specific model evaluations individually in each study area (Wang et al. 2013). Therefore, a fair comparison of prediction ability (HV R2) between the European model and the city-specific models can be conducted using the same test sets for HV. The comparison was available only for NO2 due to relatively large number of sampling sites.
Transferability of LUR models. To evalu-ate the prediction abilities of the regional/ European models to independent individual study areas, we developed the regional and European models by excluding one area at a time and applied the transferred models directly to the sites of the area that was left out. Therefore, 23 NO2 models and 17 PM models were built until each of the study areas had been excluded once from model building.
The TRANSintra R2 is the squared Pearson correlation between observed and predicted values in each of the remaining areas that was excluded from modeling. The TRANSintra R2 is different from the Modelintra and the LOAOCV R2 because the measurements con-ducted in the respective validation areas were completely left out from model development.
ResultsNO2 and PM concentrations. Table 2 shows the concentration distributions of NO2 and PM metrics across the study areas by site types. Substantial spatial variations were found for all the pollutants across Europe. The vari-ability was larger for NO2 than for PM2.5. The spatial variability for PM2.5 absorbance was inter mediate between PM2.5 and NO2. Concentration contrasts were larger at the street sites for NO2 and PM2.5 absorbance than at the urban and regional background sites. Concentration contrasts for PM2.5 were more similar at all the site types, suggesting an influence of multiple sources in addition to traffic.
Models in combined areas. Table 2 shows the model details of NO2, PM, and PM2.5 absorbance combining all the European study areas. The NO2, PM2.5, and PM2.5 absor-bance models explained 56%, 86%, and 70%, respectively, of the variation across all sites, which includes both within and between area variations (overall model R2). The LOAOCV R2 was 5% and 6% lower than the model R2 for NO2 and PM2.5, respectively, and was identical to the model R2 for PM2.5 absor-bance. The HV R2s (50% training vs. 50% test sites for NO2, 75% training vs. 25% test sites for PM metrics) were slightly smaller than or nearly identical to the model R2s, explain-ing 54%, 80%, and 70% for NO2, PM2.5, and PM2.5 absorbance at the independent validation sites respectively (see Supplemental
Material, Table S2). The HV R2 did not change if the predictor range was not truncated because only one site for NO2 model was trun-cated. The HV RMSE values were close to the values of LOAOCV RMSE for NO2 and PM metrics. The RMSE values were relatively small compared with the range of measurements as shown in Supplemental Material, Table S2. The median HV R2 of the European NO2 model at individual study areas was identical to those of the city- specific models reported by Wang et al. (2013) (see Supplemental Material, Figure S1). In the Turin and Paris areas with a low hold-out evaluation R2, for example, the HV R2s of the European model were considerably larger than those of the city-specific models.
All the models in Table 3 included traffic intensity variables. The regional background concentration explained a large fraction (71%) of variation in PM2.5 documenting the impor-tance of between-area differences for PM2.5 compared with that for the more traffic-related pollutants NO2 and PM2.5 absorbance.
The regional models performed equally well as the European models in all regions except Southern Europe, where none of the models performed well in terms of the predictions to the independent sites (HV R2: 0–0.23) (see Supplemental Material, Table S3). Reassigning Turin from south Europe to the central Europe region only slightly changed the results.
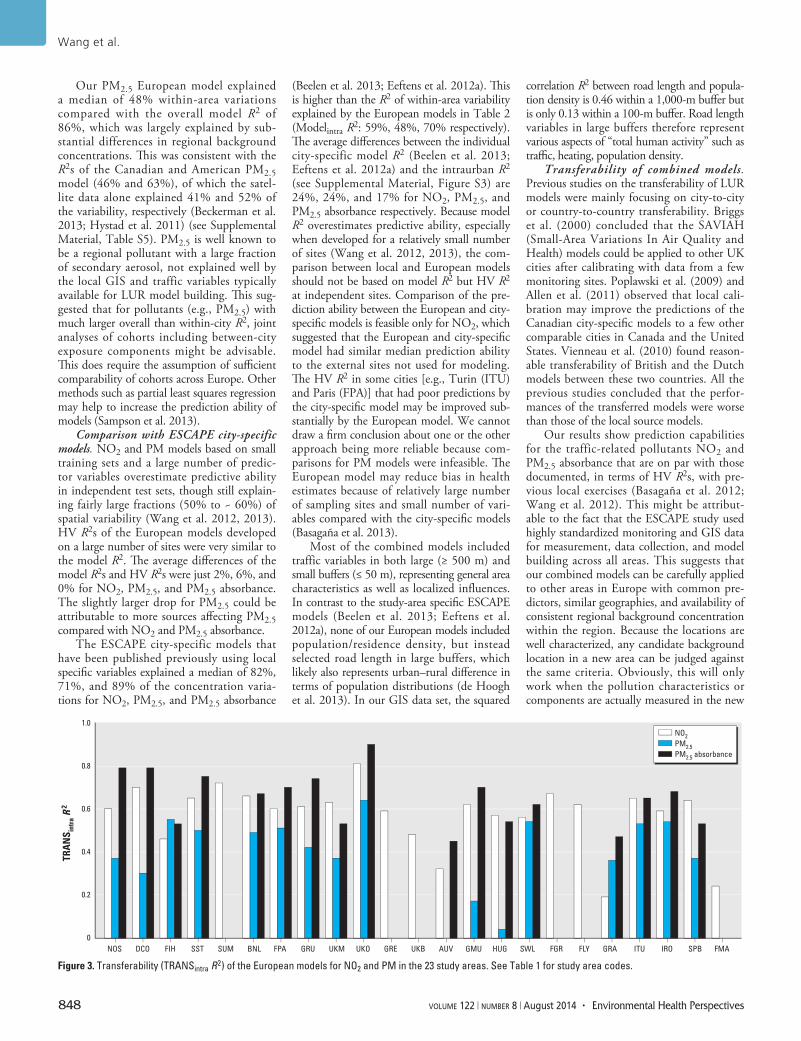
As shown in Table 3, the median within-area variability (Modelintra R2) explained by the European model for NO2 and PM2.5 absor-bance at individual study areas was similar to the overall model R2, suggesting predominant sources of local emissions. For PM2.5, the median Modelintra R2 was much lower than the overall model R2 (0.48 vs. 0.86). Figure 2 (see also Supplemental Material, Figure S2) presents the correlation between predicted and measured PM2.5, PM2.5 absorbance, and NO2 by study areas. As the figures show, the varia-tion of PM2.5 between areas was substantial compared to the within areas variation (e.g., low PM2.5 values in northern European cities
Table 2. Distributions of measured annual average NO2 and PM concentrations across Europe.
Pollutant and site type na Minimum 25th Median 75th MaximumNO2 (μg/m3)
Street sites 454 11.80 25.48 33.98 49.90 109.00Urban background 414 3.03 15.38 22.88 30.67 57.63Regional background 92 1.53 9.56 15.48 17.98 32.87
PM2.5 (μg/m3)Street sites 166 7.87 12.03 17.18 21.17 36.30Urban background 144 5.62 10.97 15.87 18.62 32.59Regional background 47 4.42 11.20 13.86 16.64 23.24
PM2.5 absorbance (10–5/m)Street sites 166 0.78 1.63 2.16 2.81 5.09Urban background 144 0.53 1.23 1.67 2.01 3.03Regional background 47 0.33 0.92 1.16 1.45 2.37
25th and 75th are percentiles.aTotal number of sites in the study areas.
Table 3. European models for NO2, PM2.5, and PM2.5 absorbance.
Predictors Partial R 2 βaModelintra
b
R 2/ IQRLOAOCV
R 2/ RMSENO2 (nc = 960, final model R2 = 0.56) 2.63E-01 0.59/0.19 0.50/8.49 (μg/m3)
Regional background concentration 0.08 2.44E-06Traffic load in 50 m 0.35 2.74E-04Road length in 1,000 m 0.50 –2.84E-07Natural and green in 5,000 m 0.55 2.21E-04Traffic intensity on the nearest road 0.56 1.38E+01Intercept 2.63E-01
PM2.5 (nc = 356, final model R2 = 0.86) 0.48/0.16 0.81/2.38 (μg/m3)Regional background concentration 0.71 9.73E-01Traffic load between 50 m and 1,000 m 0.81 4.75E-09Traffic load in 50 m 0.84 5.28E-07Road length in 100 m 0.86 2.12E-03Intercept 3.06E-01
PM2.5 absorbance (nc = 356, final model R2 = 0.70) 0.70/0.19 0.70/0.45 (10–5/m)Regional background concentration 0.28 9.06E-01Traffic load in 50 m 0.58 2.07E-07Road length in 500 m 0.67 2.90E-05Natural and green in 5,000 m 0.69 –9.63E-09Traffic load between 50 m and 1,000 m 0.70 4.20E-10Intercept 2.95E-01
aCoefficients of predictor variables in the models. bThe Modelintra R2s show the median and interquartile range (IQR) of the within-area variability explained by the European model in individual areas. cNumber of monitored sites available for model building.

Multi-cities land use regression modeling
Environmental Health Perspectives • volume 122 | number 8 | August 2014 847
such as Stockholm and high PM2.5 values in southern European cities such as Rome). On the contrary, for NO2 and PM2.5 absorbance, variation within areas was substantial com-pared with the variation between areas (see Supplemental Material, Figure S2). The obser-vations are more underpredicted within indi-vidual areas for PM metrics (median regression slope: PM2.5, 0.47; PM2.5 absorbance, 0.57; NO2, 0.56) than across the whole European study areas (regression slope: PM2.5, 0.85; PM2.5 absorbance, 0.70; NO2, 0.57).
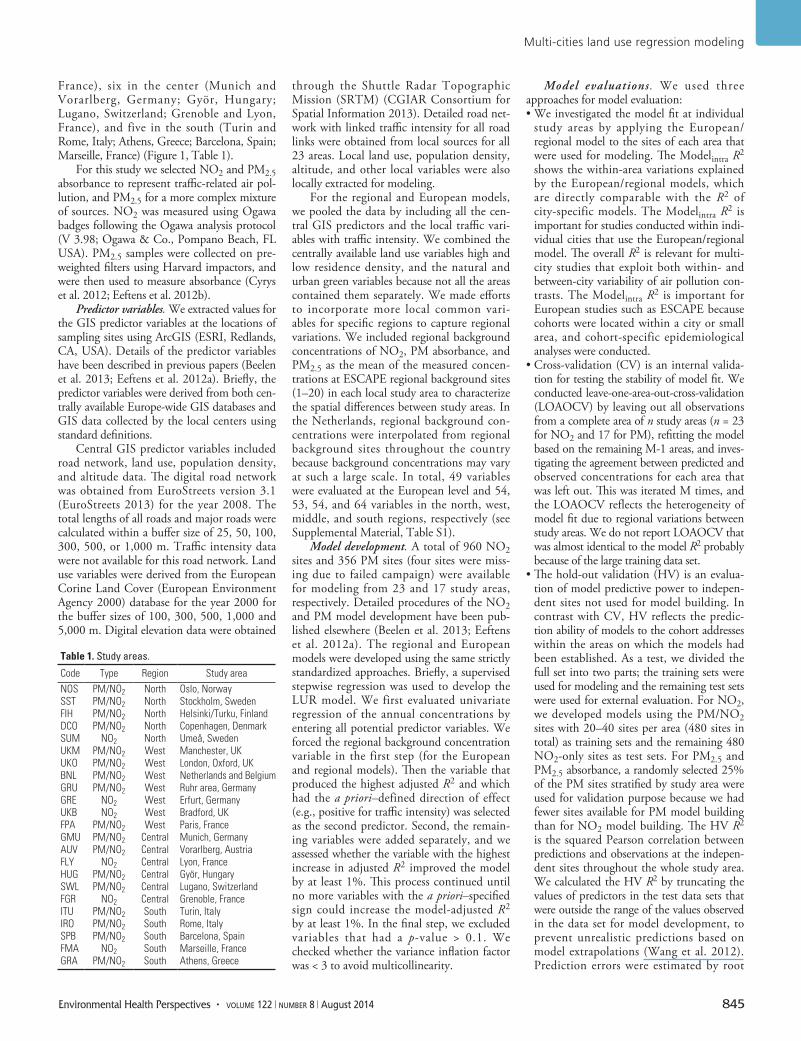
Transferability. Table 4 shows the perfor-mance of the models that used all monitor-ing data excluding one area at the time. These models explained on average 57%, 84%, and 69% variability of NO2, PM2.5, and PM2.5 absorbance respectively. The model structures and R2s were similar to the models in Table 3, which were based on all study areas. They included the same variable categories but with, to some extent, different buffer sizes. The mod-els predicted the spatial variations of NO2 and PM2.5 absorbance well in the areas not used for model building, with median TRANSintra R2s of 0.59 for NO2 and 0.67 for PM2.5 absor-bance. Transferability was less for PM2.5 with a median R2 of 0.42. The same pattern was
found for the model R2 focusing on within-area variability only (Modelintra). The varia-tion in prediction R2s was relatively small for NO2, with an interquartile range (IQR) of 0.09, but larger for PM2.5 (IQR, 0.17) and PM2.5 absorbance (IQR, 0.21), showing that predictions were less comparable for the two PM metrics. The variation is shown in Figure 3 (see also Supplemental Material, Figure S3). Interestingly, this did not depend so much on area as on the specific combination of area and component. For example, the areas in Hungary (GyÖr), Germany (Munich), and Austria (Vorarlberg) showed decent model fit and predictability for NO2 and PM2.5 absor-bance, but almost no model fit and predict-ability for PM2.5. The transferred regional models showed similar characteristics as those of the European models, whereas the median TRANSintra R2 was slightly lower (see Supplemental Material, Table S4).
DiscussionIn this study we developed LUR models for NO2, PM2.5, and PM2.5 absorbance, with combined measurement data from 23 study areas across Europe. For NO2 and PM2.5 absorbance, these models predicted spatial
variations in areas not commonly used for model building. For PM2.5, prediction R2s were moderate for intraurban variation, though in some areas in central Europe pre-diction R2s were low. The overall R2 including both between- and within-study area variabil-ity was high for PM2.5 and PM2.5 absorbance and more moderate for NO2.
Comparisons with other large area studies. Our European models performed comparable or even better in predictions of NO2 and PM2.5 than other large area studies (see Supplemental Material, Table S5) (Beckerman et al. 2013; Beelen et al. 2009; Bergen et al. 2013; Hystad et al. 2011; Novotny et al. 2011; Sampson et al. 2013; Vienneau et al. 2013). For PM2.5 absor-bance, this is the first report of LUR models in such a large geographical area. Model R2s are difficult to compare because studies differed in study area, model development strategies, scale of prediction, offered predictor variables, and number of sites. Consistent across stud-ies, the regional background predicted a small fraction of variability for NO2 and a large frac-tion for PM2.5. For intracity model R2, our NO2 European model exhibited performance (Modelintra R2 = 0.59) comparable with that of the Canadian national model in seven specific areas (Edmonton, Montreal, Sarnia, Toronto, Victoria, Vancouver, and Winnipeg), with Modelintra R2 of 0.43 (Hystad et al. 2011). We observed no heterogeneity of model fit across study areas in the European model (LOAOCV R2s were close to the model R2).
Our European and regional models have several strengths compared with previous European models that modeled concentra-tion in 1 × 1 km grids (Beelen et al. 2009; Vienneau et al. 2009) or more recently 100 × 100 m (Vienneau et al. 2013): a) We modeled small-scale variation using sampling sites that were selected according to a standard method to cover intraurban concentration contrasts. b) We included multiple pollut-ants (PM2.5, PM absorbance), which were much less available or measured with different methods from routine monitoring networks in Europe. c) We incorporated local traffic inten-sity data not available in Europe-wide data-bases (land use and road length data only). All the models included traffic intensity variables, improving prediction ability (HV R2) over models not having local traffic intensity data (but potentially road length)—for example, from 0.46 to 0.54 for NO2.
The poor performance of the south European model may be attributed to the large heterogeneity of model fit (low LOAOCV R2) across south European study areas in which the concentrations in Athens were overestimated more than those of the other study areas. More formal methods, such as hierarchical cluster analysis to define regions, could be explored to improve comparability of regions.
Figure 2. Scatter plots of predicted and measured PM2.5 with study areas color and symbol coded and two city-specific examples, Stockholm (SST) and Rome (IRO). See Table 1 for study area codes.
40
30
20
10
0
Pred
icte
d PM
2.5 (µ
g/m
3 )
Pred
icte
d PM
2.5 (µ
g/m
3 )Pr
edic
ted
PM2.
5 (µg/
m3 )
0 10 10
2 4 6 8 10 12
12
10
8
6
4
2
30
25
20
15
1020 3015 2520 30 40
Measured PM2.5 (µg/m3) Measured PM2.5 (µg/m3)
R 2 = 0.86
IRO
SST
SST R 2 = 0.50
IRO R 2 = 0.54
NorthWestCentralSouth
NOSUKMGMUITU
SSTUKOAUVIRO
FIHBNLHUGSPB
DCOGRUSWLGRA
FPA
Table 4. Transferability of European models to areas that were not used for model building [median (IQR)].
Pollutant Model R2 Modelintraa R2
TRANSintrab
R2 RMSENO2 0.57 (0.01) 0.59 (0.19) 0.59 (0.09) 5.58 (2.28)PM2.5 0.84 (0.01) 0.48 (0.16) 0.42 (0.17) 1.14 (0.58)PM2.5 absorbance 0.69 (0.01) 0.70 (0.19) 0.67 (0.21) 0.23 (0.07)
IQR, interquartile range.aModelintra R2: R2 of within-area variation explained by European model, with the same data as in Table 2. bTRANSintra: squared correlations and RMSE between the predictions and observations at independent areas.
Wang et al.
848 volume 122 | number 8 | August 2014 • Environmental Health Perspectives
Our PM2.5 European model explained a median of 48% within-area variations compared with the overall model R2 of 86%, which was largely explained by sub-stantial differences in regional background concentrations. This was consistent with the R2s of the Canadian and American PM2.5 model (46% and 63%), of which the satel-lite data alone explained 41% and 52% of the variability, respectively (Beckerman et al. 2013; Hystad et al. 2011) (see Supplemental Material, Table S5). PM2.5 is well known to be a regional pollutant with a large fraction of secondary aerosol, not explained well by the local GIS and traffic variables typically available for LUR model building. This sug-gested that for pollutants (e.g., PM2.5) with much larger overall than within-city R2, joint analyses of cohorts including between-city exposure components might be advisable. This does require the assumption of sufficient comparability of cohorts across Europe. Other methods such as partial least squares regression may help to increase the prediction ability of models (Sampson et al. 2013).
Comparison with ESCAPE city-specific models. NO2 and PM models based on small training sets and a large number of predic-tor variables overestimate predictive ability in independent test sets, though still explain-ing fairly large fractions (50% to ~ 60%) of spatial variability (Wang et al. 2012, 2013). HV R2s of the European models developed on a large number of sites were very similar to the model R2. The average differences of the model R2s and HV R2s were just 2%, 6%, and 0% for NO2, PM2.5, and PM2.5 absorbance. The slightly larger drop for PM2.5 could be attributable to more sources affecting PM2.5 compared with NO2 and PM2.5 absorbance.
The ESCAPE city-specific models that have been published previously using local specific variables explained a median of 82%, 71%, and 89% of the concentration varia-tions for NO2, PM2.5, and PM2.5 absorbance
(Beelen et al. 2013; Eeftens et al. 2012a). This is higher than the R2 of within-area variability explained by the European models in Table 2 (Modelintra R2: 59%, 48%, 70% respectively). The average differences between the individual city-specific model R2 (Beelen et al. 2013; Eeftens et al. 2012a) and the intraurban R2 (see Supplemental Material, Figure S3) are 24%, 24%, and 17% for NO2, PM2.5, and PM2.5 absorbance respectively. Because model R2 overestimates predictive ability, especially when developed for a relatively small number of sites (Wang et al. 2012, 2013), the com-parison between local and European models should not be based on model R2 but HV R2 at independent sites. Comparison of the pre-diction ability between the European and city-specific models is feasible only for NO2, which suggested that the European and city-specific model had similar median prediction ability to the external sites not used for modeling. The HV R2 in some cities [e.g., Turin (ITU) and Paris (FPA)] that had poor predictions by the city-specific model may be improved sub-stantially by the European model. We cannot draw a firm conclusion about one or the other approach being more reliable because com-parisons for PM models were infeasible. The European model may reduce bias in health estimates because of relatively large number of sampling sites and small number of vari-ables compared with the city-specific models (Basagaña et al. 2013).
Most of the combined models included traffic variables in both large (≥ 500 m) and small buffers (≤ 50 m), representing general area charac teristics as well as localized influences. In contrast to the study-area specific ESCAPE models (Beelen et al. 2013; Eeftens et al. 2012a), none of our European models included population/residence density, but instead selected road length in large buffers, which likely also represents urban–rural difference in terms of population distributions (de Hoogh et al. 2013). In our GIS data set, the squared
correlation R2 between road length and popula-tion density is 0.46 within a 1,000-m buffer but is only 0.13 within a 100-m buffer. Road length variables in large buffers therefore represent various aspects of “total human activity” such as traffic, heating, population density.
Transferability of combined models. Previous studies on the transferability of LUR models were mainly focusing on city-to-city or country-to-country transferability. Briggs et al. (2000) concluded that the SAVIAH (Small-Area Variations In Air Quality and Health) models could be applied to other UK cities after calibrating with data from a few monitoring sites. Poplawski et al. (2009) and Allen et al. (2011) observed that local cali-bration may improve the predictions of the Canadian city-specific models to a few other comparable cities in Canada and the United States. Vienneau et al. (2010) found reason-able transferability of British and the Dutch models between these two countries. All the previous studies concluded that the perfor-mances of the transferred models were worse than those of the local source models.
Our results show prediction capabilities for the traffic-related pollutants NO2 and PM2.5 absorbance that are on par with those documented, in terms of HV R2s, with pre-vious local exercises (Basagaña et al. 2012; Wang et al. 2012). This might be attribut-able to the fact that the ESCAPE study used highly standardized monitoring and GIS data for measurement, data collection, and model building across all areas. This suggests that our combined models can be carefully applied to other areas in Europe with common pre-dictors, similar geographies, and availability of consistent regional background concentration within the region. Because the locations are well characterized, any candidate background location in a new area can be judged against the same criteria. Obviously, this will only work when the pollution characteristics or components are actually measured in the new
Figure 3. Transferability (TRANSintra R2) of the European models for NO2 and PM in the 23 study areas. See Table 1 for study area codes.
1.0
0.8
0.6
0.4
0.2
0
TRA
NS in
tra R
2
NOS DCO BNL FPA GRU UKM UKO UKB AUV GMU GRA SPB FMAITU IROHUG SWL FGR FLYGRE
NO2PM2.5PM2.5 absorbance
FIH SST SUM
Multi-cities land use regression modeling
Environmental Health Perspectives • volume 122 | number 8 | August 2014 849
area. In practice, this means that modeling of new areas will in most cases be restricted to NO2/nitrogen oxides and PM10 (PM ≤ 10 μm) and, in fewer areas (in Europe), to PM2.5 and PM absorbance. Satellite data have large spatial coverage and have improved NO2 and PM10 European models based upon routine monitor data by 5% and 11% (Vienneau et al. 2013). Satellite data could be used in the future to estimate background concentrations in new locations.
In some individual areas of central Europe, the European model performed poorly for PM2.5, however, probably due to lack of an important local predictor vari-able (e.g., residential density in Munich and Vorarlberg, industry in Hungary, or altitude in Vorarlberg). Therefore, caution is needed when transferring the European models to cities for which the European model lacks predictor variables that are known to be important sources of variation locally. The poor performance in a few areas suggests that the value of the European model is especially in multicenter analyses such as ESCAPE compared with studies of individual areas.
Applications in epidemiological studies. The overall R2 of the European model was highest for PM2.5 and lowest for NO2. In contrast, for within-city variation, the model had the lowest predictive ability for PM2.5, though it was still fairly high (median R2 = 0.48). The PM2.5 absorbance model explained both large fractions of variability overall and within-city. The high overall R2 suggests that the model can be used in pooled analyses of health data, exploiting exposure contrasts between study areas. Using between-city comparisons would be especially useful to increase PM2.5 contrasts. For ESCAPE, where the health findings based on these local exposure models are currently being pub-lished (Beelen et al. 2014; Raaschou-Nielsen et al. 2013), the model offers the possibility for pooled analyses. Pooled analyses have not been conducted so far, partly because of con-cerns of comparability of the diverse cohorts across Europe. There is also the possibility to include new study populations from areas where local measurements were never con-ducted but relevant predictor variables are available. For exposure assessment with LUR models, efforts are mainly in the sampling campaign and GIS data collection.
ConclusionsEuropean LUR models for NO2, PM2.5, and PM2.5 absorbance were found to have rea-sonable power to predict spatial variations of these components in areas not used for model building.
RefeRences
Allen RW, Amram O, Wheeler AJ, Brauer M. 2011. The trans-ferability of NO and NO2 land use regression models between cities and pollutants. Atmos Environ 45:369–378.
Basagaña X, Aguilera I, Rivera M, Agis D, Foraster M, Marrugat J, et al. 2013. Measurement error in epidemio-logic studies of air pollution based on land-use regression models. Am J Epidemiol 178:1342–1346.
Basagaña X, Rivera M, Aguilera I, Agis D, Bouso L, Elosua R, et al. 2012. Effect of the number of measurement sites on land use regression models in estimating local air pollution. Atmos Environ 54:634–642.
Beckerman BS, Jerrett M, Serre M, Martin RV, Lee SJ, van Donkelaar A, et al. 2013. A hybrid approach to estimat-ing national scale spatiotemporal variability of PM in the contiguous United States. Environ Sci Technol 47:7233–7241.
Beelen R, Hoek G, Pebesma E, Vienneau D, de Hoogh K, Briggs DJ. 2009. Mapping of background air pollution at a fine spatial scale across the European Union. Sci Total Environ 407:1852–1867.
Beelen R, Hoek G, Vienneau D, Eeftens M, Dimakopoulou K, Pedeli X, et al. 2013. Development of NO2 and NOx land use regression models for estimating air pollution exposure in 36 study areas in Europe—the ESCAPE project. Atmos Environ 72:10–23.
Beelen R, Raaschou-Nielsen O, Stafoggia M, Andersen ZJ, Weinmayr G, Hoffmann B, et al. 2014. Effects of long-term exposure to air pollution on natural-cause mortality: an analysis of 22 European cohorts within the multicentre ESCAPE project. Lancet 383:785–795.
Bergen S, Sheppard L, Sampson PD, Kim SY, Richards M, Vedal S, et al. 2013. A national prediction model for pm com-ponent exposures and measurement error–corrected health effect inference. Environ Health Perspect 121:1017–1025; doi:10.1289/ehp.1206010.
Brauer M, Hoek G, van Vliet P, Meliefste K, Fischer P, Gehring U, et al. 2003. Estimating long-term average particulate air pol-lution concentrations: application of traffic indicators and geographic information systems. Epidemiology 14:228–239.
Briggs DJ, de Hoogh C, Guiliver J, Wills J, Elliott P, Kingham S, et al. 2000. A regression-based method for mapping traffic-related air pollution: application and testing in four con-trasting urban environments. Sci Total Environ 253:151–167.
Brunekreef B, Holgate ST. 2002. Air pollution and health. Lancet 360:1233–1242.
Cesaroni G, Badaloni C, Gariazzo C, Stafoggia M, Sozzi R, Davoli M, et al. 2013. Long-term exposure to urban air pollution and mortality in a cohort of more than a million adults in Rome. Environ Health Perspect 121:324–331; doi:10.1289/ehp.1205862.
CGIAR Consortium for Spatial Information. 2013. SRTM 90m Digital Elevation Data. Digital Elevation Database version 4.1. Available: http://srtm.csi.cgiar.org/ [accessed 20 May 2013].
Cyrys J, Eeftens M, Heinrich J, Ampe C, Armengaud A, Beelen R, et al. 2012. Variation of NO2 and NOx concentra-tions between and within 36 European study areas: results from the ESCAPE study. Atmos Environ 62:374–390.
de Hoogh K, Wang M, Adam M, Badaloni C, Beelen R, Birk M, et al. 2013. Development of land use regression models for particle composition in twenty study areas in Europe. Environ Sci Technol 47:5778–5786.
Eeftens M, Beelen R, de Hoogh K, Bellander T, Cesaroni G, Cirach M, et al. 2012a. Development of land use regression models for PM2.5, PM2.5 absorbance, PM10 and PMcoarse in 20 European study areas; results of the ESCAPE project. Environ Sci Technol 46:11195–11205.
Eeftens M, Tsai M, Ampe C, Anwander B, Beelen R, Cesaroni G, et al. 2012b. Spatial variation of PM2.5, PM10, PM2.5 absor-bance and PMcoarse concentrations between and within 20 European study areas and the relationship with NO2—results of the ESCAPE project. Atmos Environ 62:303–317.
ESCAPE (European Study of Cohorts for Air Pollution Effects). 2013. Manuals. Available: http://www.escapeproject.eu/manuals/ [accessed 20 May 2013].
Estarlich M, Ballester F, Aguilera I, Fernández-Somoano A, Lertxundi A, Llop S, et al. 2011. Residential exposure to outdoor air pollution during pregnancy and anthropometric measures at birth in a multicenter cohort in Spain. Environ Health Perspect 119:1333–1338; doi:10.1289/ehp.1002918.
European Environment Agency. 2000. CLC 2000 (Corine Land Cover). Raster database (version 12/2009). Available: http://www.eea.europa.eu/data-and-maps/data/corine-land-cover-2000-clc2000-100-m-version-12-2009 [accessed 20 May 2013].
EuroStreets. 2013. EuroStreets digital road network version 3.1. Available: http://www.geodan.com/products/streetmaps/ [accessed 20 May 2013].
Gehring U, Wijga AH, Fischer P, de Jongste JC, Kerkhof M, Koppelman GH, et al. 2011. Traffic-related air pollution, preterm birth and term birth weight in the PIAMA birth cohort study. Environ Res 111:125–135.
Hart JE, Yanosky JD, Puett RC, Ryan L, Dockery DW, Smith TJ, et al. 2009. Spatial modeling of PM10 and NO2 in the conti-nental United States, 1985–2000. Environ Health Perspect 117:1690–1696; doi:10.1289/ehp.0900840.
Henderson SB, Beckerman B, Jerrett M, Brauer M. 2007. Application of land use regression to estimate long-term concentrations of traffic-related nitrogen oxides and fine particulate matter. Environ Sci Technol 41:2422–2428.
Hoek G, Beelen R, de Hoogh K, Vienneau D, Gulliver J, Fischer P, et al. 2008. A review of land-use regression models to assess spatial variation of outdoor air pollution. Atmos Environ 42:7561–7578.
Hoek G, Beelen R, Kos G, Dijkema M, van der Zee SC, Fischer PH, et al. 2011. Land use regression model for ultrafine particles in Amsterdam. Environ Sci Technol 45:622–628.
Hystad P, Setton E, Cervantes A, Poplawski K, Deschenes S, Brauer M, et al. 2011. Creating national air pollution models for population exposure assessment in Canada. Environ Health Perspect 119:1123–1129; doi:10.1289/ehp.1002976.
Jerrett M, Arain A, Kanaroglou P, Beckerman B, Potoglou D, Sahsuvaroglu T, et al. 2005. A review and evaluation of intraurban air pollution exposure models. J Expo Anal Environ Epidemiol 15:185–204.
Liu LJS, Tsai MY, Keidel D, Gemperli A, Ineichen A, Hazenkamp-von Arx M, et al. 2012. Long-term exposure models for traf-fic related NO2 across geographically diverse areas over separate years. Atmos Environ 46:460–471.
Madsen C, Carlsen KCL, Hoek G, Oftedal B, Nafstad P, Meliefste K, et al. 2007. Modeling the intra-urban variabil-ity of outdoor traffic pollution in Oslo, Norway—a GA2LEN project. Atmos Environ 41:7500–7511.
Marshall JD, Nethery E, Brauer M. 2008. Within-urban vari-ability in ambient air pollution: comparison of estimation methods. Atmos Environ 42:1359–1369.
Novotny EV, Bechle MJ, Millet DB, Marshall JD. 2011. National satellite-based land-use regression: NO2 in the United States. Environ Sci Technol 45:4407–4414.
Poplawski K, Gould T, Setton E, Allen R, Su J, Larson T, et al. 2009. Intercity transferability of land use regression mod-els for estimating ambient concentrations of nitrogen dioxide. J Expo Anal Environ Epidemiol 19:107–117.
Raaschou-Nielsen O, Andersen ZJ, Beelen R, Samoli E, Stafoggia M, Weinmayr G, et al. 2013. Air pollution and lung cancer incidence in 17 European cohorts: prospec-tive analyses from the European Study of Cohorts for Air Pollution Effects (ESCAPE). Lancet Oncol 14:813–822.
Sampson PD, Richards M, Szpiro AA, Bergen S, Sheppard L, Larson TV, Kaufman JD. 2013. A regionalized national uni-versal kriging model using partial least squares regression for estimating annual PM2.5 concentrations in epidemiology. Atmos Environ 75:383–392.
Vienneau D, de Hoogh K, Bechle MJ, Beelen R, van Donkelaar A, Martin R, et al. 2013. Western European land use regression incorporating satellite- and ground-based measurements of NO2 and PM10. Environ Sci Technol 47:13555–13564.
Vienneau D, de Hoogh K, Beelen R, Fischer P, Hoek G, Briggs D. 2010. Comparison of land-use regression models between great Britain and the Netherlands. Atmos Environ 44:688–696.
Vienneau D, de Hoogh K, Briggs D. 2009. A GIS-based method for modelling air pollution exposures across Europe. Sci Total Environ 408:255–266.
Wang M, Beelen R, Basagaña X, Becker T, Cesaroni G, de Hoogh K, et al. 2013. Evaluation of land use regression models for NO2 and particulate matter in 20 European study areas: the ESCAPE project. Environ Sci Technol 47:4357–4364.
Wang M, Beelen R, Eeftens M, Meliefste K, Hoek G, Brunekreef B. 2012. Systematic evaluation of land use regression models for NO2. Environ Sci Technol 46:4481–4489.