
Composite Structural Health Monitoring Through Use of Embedded PZT Sensors
Upload
khangminh22Category
view
1download
0
Performance of distributed optical fiber sensors embedded
inside reinforced concrete structural elements
Mattia Francesco Bado
ADVERTIMENT La consulta d’aquesta tesi queda condicionada a l’acceptació de les següents condicions d'ús: La difusió d’aquesta tesi per mitjà del repositori institucional UPCommons (http://upcommons.upc.edu/tesis) i el repositori cooperatiu TDX ( h t t p : / / w w w . t d x . c a t / ) ha estat autoritzada pels titulars dels drets de propietat intel·lectual únicament per a usos privats emmarcats en activitats d’investigació i docència. No s’autoritza la seva reproducció amb finalitats de lucre ni la seva difusió i posada a disposició des d’un lloc aliè al servei UPCommons o TDX. No s’autoritza la presentació del seu contingut en una finestra o marc aliè a UPCommons (framing). Aquesta reserva de drets afecta tant al resum de presentació de la tesi com als seus continguts. En la utilització o cita de parts de la tesi és obligat indicar el nom de la persona autora. ADVERTENCIA La consulta de esta tesis queda condicionada a la aceptación de las siguientes condiciones de uso: La difusión de esta tesis por medio del repositorio institucional UPCommons (http://upcommons.upc.edu/tesis) y el repositorio cooperativo TDR (http://www.tdx.cat/?locale- attribute=es) ha sido autorizada por los titulares de los derechos de propiedad intelectual únicamente para usos privados enmarcados en actividades de investigación y docencia. No se autoriza su reproducción con finalidades de lucro ni su difusión y puesta a disposición desde un sitio ajeno al servicio UPCommons No se autoriza la presentación de su contenido en una ventana o marco ajeno a UPCommons (framing). Esta reserva de derechos afecta tanto al resumen de presentación de la tesis como a sus contenidos. En la utilización o cita de partes de la tesis es obligado indicar el nombre de la persona autora. WARNING On having consulted this thesis you’re accepting the following use conditions: Spreading this thesis by the institutional repository UPCommons (http://upcommons.upc.edu/tesis) and the cooperative repository TDX (http://www.tdx.cat/?locale- attribute=en) has been authorized by the titular of the intellectual property rights only for private uses placed in investigation and teaching activities. Reproduction with lucrative aims is not authorized neither its spreading nor availability from a site foreign to the UPCommons service. Introducing its content in a window or frame foreign to the UPCommons service is not authorized (framing). These rights affect to the presentation summary of the thesis as well as to its contents. In the using or citation of parts of the thesis it’s obliged to indicate the name of the author.

i
DEPARTAMENT D’ENGINYERIA CIVIL I AMBIENTAL
PROGRAMA DE DOCTORAT D’ENGINYERIA DE LA CONSTRUCCIÓ
DOCTORAL THESIS
PERFORMANCE OF DISTRIBUTED OPTICAL FIBER
SENSORS EMBEDDED INSIDE REINFORCED
CONCRETE STRUCTURAL ELEMENTS
Thesis by Publications
Ph.D. Candidate:
Mattia Francesco Bado
MSc, Construction Engineer
Thesis Supervisor:
Joan Ramon Casas
Prof., Ph.D., Civil Engineer
Barcelona, June 2021

ii
GENERAL INFORMATION
Title of the Thesis:
“Performance of Distributed Optical Fiber Sensors embedded inside Reinforced Concrete structural elements”
Ph.D. Student:
Name Mattia Francesco Bado
Academic Record Construction Engineer
Institution Universitat Politècnica de Catalunya (UPC)
E-mail [email protected]
Thesis Supervisor:
Name Joan Ramon Casas
Academic Record Catedrático Dr. Ingeniero de Caminos, C y P
Institution Universitat Politècnica de Catalunya (UPC)
E-mail [email protected]

iii
To my grandmother, her faith in me never faltered and her love never wavered

iv

v
Acknowledgments:
The author would like to acknowledge the crucial role that Prof. Joan Ramon Casas has covered in the creation
of this thesis, in the completion of the doctoral path and in his overall professional evolution. Prof. Casas’ guidance
went beyond a standard academic one, encouraging, supervising, advising and helping the author in a friendly and
familiar manner. The work developed in Barcelona in collaboration with Prof. Casas represented a turning point for
author’s academic career and for such he is most grateful.
The author would also like to acknowledge the fundamental role played by his family and life partner. Their
reliable presence, encouragement and affection has been the author’s driving force in these past years. A particular
thank you goes to the author’s partner without whom this whole Ph.D. would have found no grounding.
A special thank you goes to the author’s friends and work colleagues with whom both ups and downs have been
shared along this doctoral path. The shared life-long memories and experiences collected in the past years have
efficiently accompanied the long hours of intense work.
Finally, a felt thank you also goes to the academic, logistical and technological personnel of the Polytechnic
University of Catalunya BarcelonaTech whose assistance has allowed the author to complete his academic duties
and experimental work to the best of his abilities.

vi
Abstract:
The employment of a novel cutting edge strain monitoring technique named Distributed Optical Fiber Sensors
(DOFS) as Structural Health Monitoring (SHM) tools is becoming increasingly common. The main reasons for its
popularity is the possibility of performing completely spatially distributed monitorings with sampling points at
distances smaller than 1 mm. Yet, due to the inherent nature of SHM, up to now the most common DOFS application
is the superficial monitoring of already built structures in order to substantiate their suitability to continue
performing as per design. A novel way of performing DOFS monitorings consists in studying the evolution of the
strains present on the inside of Reinforced Concrete (RC) structures i.e., bonding DOFS to the surface of embedded
reinforcement bars (rebars) or embedding them directly in the concrete mass. Due to its recency, this application is
characterized by a large and untapped potential. SHM-wise, this continuous and highly sensitive embedded
monitoring system provides access to the ability of detecting deformations and damage as early as their appearance
inside the structure (versus having to wait for their appearance on the external surface). This might help shifting
today’s maintenance paradigm from corrective in nature to preventive.
Yet, when deploying DOFS inside RC structures, the fiber is more prone to suffer alteration/damage during the
pouring of concrete and to yield erroneous measurements induced by clamping and friction from the part of concrete
aggregates. Whilst the use of DOFS with several claddings and coatings could compensate for these issues, the
presence of a certain lag in the transmission of strains from the monitored surface to the DOFS’s silica core reduces
the accuracy of the extracted measurements. For such applications, the preferable DOFS would be a thin, non-
coated DOFS. In this case, though, the DOFS protective function against external Strain Reading Anomalies (SRA)-
inducing phenomena falls entirely on the adhesive layers with which the fibers are bonded.
The present thesis is aimed at improving the viability of coating-less DOFS deployments inside RC structures
for Civil and Structural Engineering SHM. This objective was tackled with both a preventive and a corrective
approach. The former was achieved by means of experimental investigation aimed at extracting DOFS deployment
methodologies and techniques that stem the factors jeopardizing extracted strain measurements. Laboratory tests
were performed on DOFS-instrumented RC prisms subjected to both concrete shrinkage-induced compression and
tension and on DOFS-instrumented RC beams tested in bending. It was established that the fiber deployment
technique that best prevented the appearance of SRAs consisted in positioning the fiber inside a groove previously
incised on the surface of a rebar before bonding it with cyanoacrylate adhesive and protecting it with an additional
layer of silicone. Nevertheless, still some measurement inaccuracy remains induced by the shear deformation of
silicone, similarly to what happens with the shear deformations of external DOFS coatings. The corrective approach,
instead, was tackled creating post-processing algorithms that cleansed DOFS-extracted data of any data distortion
and anomaly and it was demonstrated its correct performance by application to some practical cases.

vii
Resum:
Cada vegada és més freqüent l’ús d’una nova tècnica avançada per a la mesura de deformacions anomenada
Sensors de fibra òptica distribuïts (DOFS), com a eina de control de la salut estructural (SHM). Els principals motius
de la seva popularitat és la possibilitat de realitzar monitoritzacions completament distribuïdes espacialment amb
punts de mostreig a distàncies inferiors a 1 mm. Tot i això, a causa de la naturalesa inherent a SHM, fins ara
l’aplicació DOFS més comuna ha estat la monitorització superficial d’estructures ja construïdes per tal de demostrar
la seva idoneïtat per continuar funcionant segons el disseny. En el cas d´estructures de nova construcció, una forma
nova de realitzar els monitoratges DOFS consisteix en estudiar l’evolució de les deformacions presents a l’interior
de les estructures de formigó armat (RC). És a dir, unir DOFS a la superfície de les armadures interiors al formigó
o bé embegudes directament a la massa de formigó. A causa de la seva novetat, aquesta aplicació es caracteritza per
un gran potencial no explorat. En termes de SHM, aquest sistema de monitorització interior al formigó, continu i
altament sensible proporciona la capacitat de detectar deformacions i danys tan aviat com apareixen a l’interior de
l’estructura (en lloc d’haver d’esperar la seva aparició a la superfície externa). Això pot ajudar a canviar el
paradigma de manteniment actual d´estructures de formigó de correctiu a preventiu. Tot i això, quan es desplega
DOFS dins d’estructures RC, la fibra és més propensa a patir alteracions / danys durant l’abocament de formigó i a
produir mesures errònies induïdes per la subjecció i fricció per part dels àrids del formigó. Tot i que l’ús de DOFS
amb diversos revestiments i recobriments exteriors podria compensar aquest problema, la presència dels mateixos
provoca una distorsió en la transmissió de les deformacions des de la superfície monitoritzada al nucli de sílice del
DOFS, reduïnt la precisió de les mesures obtingudes. Per a aquestes aplicacions, el DOFS preferible seria un que
no tingués reocobriment, en contacte directe amb la superfície a monitoritzar. En aquest cas, però, la funció
protectora del DOFS contra fenòmens externs que provoquen anomalies de lectura de deformacions (SRA) recau
totalment sobre les capes adhesives amb les quals s’adhereixen les fibres. La present tesi té com a objectiu millorar
la viabilitat dels desplegaments DOFS sense recobriment dins el formigó per al SHM d’estructures d´enginyeria
civil. Aquest objectiu s´aborda amb un enfocament preventiu i un altre de correctiu. El primer s´aconsegueix
mitjançant una sèrie de campanyes experimentals dirigides a extreure metodologies i tècniques de col.locació de
DOFS que frenin els factors que poden disminuir la precisió de les mesures obtingudes. S´han realitzat proves de
laboratori amb prismes de RC sotmesos tant a compressió (induïts per contracció del formigó) com a tensió i amb
bigues de RC sotmeses a flexió. Dels resultats, es pot concloure que la tècnica de col.locació que millor impedeix
l’aparició de SRA consisteix a situar la fibra dins d’una petita rasa (a la superfície de l´armadura), unir-la amb
adhesiu de cianoacrilat i protegir-la amb una capa addicional de silicona. No obstant això, degut a la poca rigidesa
de la silicona, encara es produeixen petites diferéncies entre la mesura de la fibra i la deformació real a l´element,
però que són menors a les que es tenen amb un un recobriment extern de DOFS. L'enfocament correctiu, en canvi,
es va abordar creant algoritmes de post-processament que netegen les dades extretes de DOFS de qualsevol distorsió
i anomalia i que ofereixen bons resultats, com es demostra en diverses aplicacions pràctiques.

viii

ix
Acronyms:
Notation: Definition:
BOFDA Brillouin Optical Frequency Domain Analysis
BOTDA Brillouin Optical Time Domain Analysis
BOTDR Brillouin Optical Time Domain Reflectometry
CYN Cyanoacrylate
DIC Digital Image Correlation
DOFS Distributed Optical Fiber Sensor
DPP-BOTDA Differential Pulse Pair-BOTDA
DAS Distributed Acoustic Sensing
DVS Distributed Vibration Sensing
EPX Epoxy
FBG Fiber Bragg Grating
GTM Geometrical Threshold Method
HL-SRA Harmless Strain Reading Anomaly
HF-SRA Harmful Strain Reading Anomaly
LVDT Linear Variable Displacement Transformers
OBR Optical Backscattered Reflectometer
OFDR Optical Frequency Domain Reflectometry
OFS Optical Fiber Sensor
OTDR Optical Time Domain Reflectometry
PICM Polynomial Interpolation Comparison Method
PPP-BOTDA Pulse Pre Pump-BOTDA
SG Strain Gauges
SHM Structural Health Monitoring
SI Silicone
SRA Strain Reading Anomaly
SSQ Spectral Shift Quality
Φ-OTDR Phase-OTDR

x
Table of Contents:
Chapter 1. Introduction .......................................................................................................................................... 1
Chapter 1.1. Motivation for the research ........................................................................................................... 2
Chapter 1.2 – Problem Identification ................................................................................................................ 6
Chapter 1.3 – Objective of the thesis ................................................................................................................. 9
Chapter 1.4 – Structure of the thesis ............................................................................................................... 10
Chapter 2. State of the Art ................................................................................................................................... 13
Chapter 2.1 DOFS for Civil and Structural Engineering Health Monitoring .................................................. 14
Chapter 2.2. DOFS embedded inside RC structures and Strain Reading Anomalies (SRAs) ......................... 25
Chapter 3. Experimental tests: results and discussions ....................................................................................... 33
Chapter 3.1 Adhesives performance for DOFS-instrumented bare rebars ...................................................... 34
Chapter 3.2 Adhesives performance for DOFS-instrumented rebars embedded in RC structures .................. 44
Chapter 3.2.1 Concrete-shrinkage induced compression of DOFS-instrumented rebars ............................ 44
Chapter 3.2.2 Tensile tests of DOFS-instrumented rebars embedded inside RC ties ................................. 52
Chapter 3.2.3 Testing of DOFS-instrumented rebars embedded inside RC beams ..................................... 57
Chapter 4. Post-Processing Algorithms ............................................................................................................... 62
References ........................................................................................................................................................... 73
Chapter 5. Published articles ............................................................................................................................... 78
Chapter 5.1 Sensors 2021 ................................................................................................................................ 79
Chapter 5.2 Sensors 2018 .............................................................................................................................. 184
Chapter 5.3 Sensors 2020 .............................................................................................................................. 211
Chapter 5.4 Cement and Concrete Composites 2021 .................................................................................... 239
Chapter 5.5 Structural Health Monitoring 2020 ............................................................................................ 262

xi
List of Tables:
Table 3.1. Detailing of the subject of each experimental campaign and color binding of the produced
results to the subsequent chapters;
Table 3.2. Geometrical features of the tested RC ties during the concrete shrinkage campaign, the
deployed DOFS and the DOFS-rebar bonding techniques;
Table 3.3. Geometrical features of the tested RC ties during the tensile test campaign;
Table 3.4. Concrete mix proportions, in kg/m3 of the specimens tested during the tensile test campaign.

xii
List of Figures:
Figure 1.1. 3D illustration of a DOFS cross-section
Figure 1.2. Growth of OFS on the technological market (adapted from [8])
Figure 1.3. (a) DOFS fiber and (b) ODiSI-6000 model OBR interrogator manufactured by LUNA
Technologies
Figure 1.4. Free body diagram for the symmetrical section of the optical fiber and the substrates together
with their relative shear transfer (adapted from [40]).
Figure 1.5. Representation of two DOFS-extracted RC tie strain profiles (along time) in blue, a trendline
(in red) indicative of the correct strain trend and SRA peaks (pointed out by arrow
annotations).
Figure 2.1. Beam cross section showing the fiber-optic cable locations: (a) illustration and (b)
photograph (adapted from [40])
Figure 2.2. (a) DOFS deployment layout and (b) prestressed concrete beam cross sections – edge TYE7
beams (left) and internal TY7 beams (right) [41]
Figure 2.3. (a) General scheme of DOFS monitoring and (b) its photograph inside the box girder
(adapted from [16])
Figure 2.4. (a) Location of the instrumented columns and walls and (b) DOFS tied to the reinforcement
prior to concreting [43]
Figure 2.5. The total cumulative axial displacement (negative = shortening) of the instrumented
columns C8 and wall W1 measured at the mid-height of every level during the first 12
months of construction (adapted from [43])
Figure 2.6. (a) Photograph of the DOFS cables, (b) an illustration of their cross-sections and (c) of their
designed installation position and finally (d) a photography of the deployment process
(adapted from [44])
Figure 2.7. Strains measured along the sensors when the case study airplane rear landing gear was rolled
on them [44]
Figure 2.8. Installation of the DOFS and the pile [45]
Figure 2.9. Typical cross-section layout of DOFS cables attached to (a) a steel pile and to (b) a steel
cage; a photography of the latter is represented in (c) (adapted from [46])
Figure 2.10. Distribution of strains along individual DOFS (a) after the driving of a steel pile (b) during
a static load testing of the CFA pile and (c) the crack evolution inside a precast concrete pile
(adapted from [46])

xiii
Figure 2.11. Illustration of soil subsidence and DOFS vertical deployment in a borehole as performed in
[47]
Figure 2.12. Geotechnical sensors (in blue) and fiber optics cable (in red) on the western (a) and southern-
eastern (b) sides of the buttress [48]
Figure 2.13. DOFS installation inside the tunnel lining: (a) Schematic representation and (b) practical
realization [50]
Figure 2.14. Measured strain distribution at the rock-side layer in peripheral direction: (a) 12 hours after
installation at top-heading, (b) 48 hours after installation at top-heading, (c) 12 hours after
installation at invert and (d) 48 hours after installation at invert [50]
Figure 2.15. Monitored tunnel section [18]
Figure 2.16. (a) Case study offshore turbine (b) DOFS bonded with epoxy to the sample pile (adapted
from [51])
Figure 2.17. Strain values per corresponding elevation from 0 kN to 900 kN [51]
Figure 2.18. Graphical representation of different SRA theoretical definitions
Figure 2.19. (a) SRA present in a specific DOFS coordinates interval (b) compared against the
appearance of damage (cracking) in a RC element in a similarly sized DOFS coordinates
interval
Figure 2.20. Comparison of the measured values before and after interpolation of the DOFS with the
strain gauges for 15 kN—Beam 1 (left) and Beam 2 (right) [53]
Figure 2.21. Corroded beam bottom interior polyimide strain change with length along the reinforcement
and increasing applied load [54]
Figure 2.22. (a) Milling of the groove along the rebar’s longitudinal rib and its (b) resulting incision
marked with a dashed red line.
Figure 2.23. Spatial strain distribution in concrete measured by the DFOS system near the bottom rebars.
Note that the missing points are indicative of SRAs [66]
Figure 3.1. Graphical and photographical representation of the three tested bonding techniques (a)
positioning of DOFS in an incised groove and bonding it with CYN (b) bonding it with CYN
with an additional protective layer of SI (c) positioning of the DOFS in a groove, bonding
through CYN and protection through SI.
Figure 3.2. Test setup for the Universal Testing Machine (UTM)-assisted tensile test on a bare rebar
Figure 3.3. DOFS and extensometer output readings of the tensile test

xiv
Figure 3.4. Bar w/ groove and w/o groove’s strain reading differences when DOFS + cyanoacrylate
(CYN) are or are not covered by silicone (SI)
Figure 3.5 Test setup for the DOFS-instrumented rebar under cantilever beam conditions
Figure 3.6. Strain profiles of the rebars (w/and w/o groove) under bending and the difference of values
w/and w/o SI.
Figure 3.7. DOFS-instrumented bare rebars tested in bending under fixed beam conditions test setup:
(a) three-dimensional specimen detailing with vertical DOFS representation (b) three-
dimensional rebar representation showing the position of the DOFS relatively to the incised
grooves and (c) a picture of the specimen during the load application phase
Figure 3.8. DOFS strain profiles at specific time and global load instances along the test.
Figure 3.9. Comparison between the DOFS-measured strain profiles of the segments bonded to each
rebar for a global load value of 30.0 kN
Figure 3.10. Comparison between the DOFS-measured strain profile segments bonded to Bars 4, 5, 6 for
a global load value of 30.0 kN.
Figure 3.11. DOFS-measured strains along time over the whole span of the fiber bonded to the rebars
with white spots present wherever the specific measurement is an SRA
Figure 3.12. Different manners of bonding the DOFS to the rebars: (a) simply positioning the DOFS in
the concavity created by the longitudinal ridge (after removing the mill-scale and degreasing
the area with acetone) and gluing them with cyanoacrylate adhesive; (b) bonded like in (a)
with the addition of a protective layer of a one-component water-proof oxygen-free silicone
rubber; (c) positioning the DOFS in a 1.5x1.0mm superficially incised groove before
proceeding to its gluing by means of cyanoacrylate adhesive; (d) positioning of the thick
DOFS inside a 2.5x2.5mm superficially incised groove before proceeding to its gluing by
means of epoxy adhesive (the protective function is provided by the polyamide fiber
coating). Illustration not to scale.
Figure 3.13. The two different kinds of DOFS cables used in the present experimental campaign
Figure 3.14. DOFS sampled strain profiles at 5 instances during the short-term shrinkage in all six RC
ties
Figure 3.15. Strains inside the three 10D16 specimens as sample by both thin and thick DOFS
Figure 3.16. The mid-section strains of the RC ties as measured by both thin and thick DOFS embedded
inside members 10D12 and 10D16
Figure 3.17. Total percentage of anomalistic readings for every tested specimen
Figure 3.18. (a) Percentage of anomalistic readings per bonding technology and (b) average percentage
of anomalistic readings per different value of sensitivity parameter p

xv
Figure 3.19. Test setup: (a) illustration of the geometry of the tested RC ties (b) the specimens during the
tensile tests (c) the employed DOFS-rebar bonding technologies.
Figure 3.20. DOFS strain profiles extracted from member 15D20_27 with the fiber bonded by means of
groove + CYN
Figure 3.21. DOFS strain profiles extracted from faces A and B of member 15D20_24
Figure 3.22. 10D16 (left) and 8D16’s (right) DIC and DOFS outputs; The DOFS strain profiles are
reported for Face A and Face B of both members, in each of which DOFS is deployed with
different bond technologies
Figure 3.23. Total amount of anomalistic readings grouped per bonding technique used.
Figure 3.24. Geometry and reinforcement layout of the beam specimens (all measurements in mm).
Figure 3.25. Loading setup and DOFS installation configuration for the RC beam specimens
Figure 3.26. Comparison of distributed strain profiles obtained by DOFS embedded in a RC beam at two
different load levels for (a) robust DOFS and (b) thin DOFS.
Figure 4.1. Experimental campaign on RC ties: (a) an illustration of their geometry (b) DOFS-extracted
strains profiles versus DOFS coordinates and (c) versus time
Figure 4.2. (a) Illustration of the tunnel DOFS installation (b) picture of the DOFS coordinates ~45.50m
and (c) picture of DOFS coordinates from ~20-26m
Figure 4.3. (a) Multiple and (b) all tunnel strain measurements along the monitoring duration
Figure 4.4. SRAs detection and removal (a) with an SSQ tool (b) according to the GTM method
Figure 4.5. Strain measurements along time of anomalistic DOFS sections versus their polynomial
curve approximations (in red)
Figure 4.6. Strain measurements along time of anomalistic DOFS sections versus their polynomial
curve approximations (in red) of member 12x12_D12.02
Figure 4.7. SRAs detection algorithm with a PICM tool
Figure 4.8. SRA-cleaning post-processing methods comparisons for member 12x12_D12.01 (a) to (d)
and 12x12_D12.02 (e) and (f)
Figure 4.9. SRA-cleaning post-processing methods comparisons (b) SSQ, (c) GTM and (d) PICM for
the in-situ tunnel monitoring versus the original strains (a)


Chapter 1. Introduction | MATTIA FRANCESCO BADO
1
Chapter 1. Introduction
The thesis at hand is finalized to the attainment of the title of Doctor of Philosophy PhD by the Universitat
Politècnica de Catalunya (UPC) - BarcelonaTech. This chapter aims at introducing the topic at hand, namely the
use of Distributed Optical Fiber Sensors (DOFS) bonded to reinforcement bars and embedded inside reinforced
concrete structures for Structural Health Monitoring purposes. The overall motivation for the research, its
methodology and final objectives are all outlined in the following sub-sections.

Chapter 1. Introduction | Mattia Francesco Bado
2
Chapter 1.1. Motivation for the research
Civil infrastructure provides the means for a society to function. The wide range of applications that civil
engineering offers includes buildings, bridges, highways, tunnels, power plants, industrial facilities, geotechnical
and hydraulic structures among others. Throughout its service lifetime, each of these is subjected to multiple events
that deteriorate and compromise its structural integrity in a unique way, exposing its future performance to several
risks. In order to avoid the social, economic and environmental costs of deterioration and/or failure, civil structures
have different safety and durability requirements that need to be met in order to ensure an acceptable structural
performance and the wellbeing of their users. For that, a series of inspection, monitoring and maintenance protocols
have to be carried out during the structure’s service lifetime.
The effectiveness of these monitoring methods relies on their ability to rapidly detect alterations of the structure’s
performance, allowing for their identification, characterization and control. This idea is the basis of Structural
Health Management (SHM), which, according to Housner et al. [1], can be understood as the continuous or regular
measurement and analysis of key structural and environmental parameters under operating conditions, for the
purpose of warning of abnormal states or accidents at an early stage.
Yet, as stated by Cawley [2], despite the recent increasing volume of research on SHM, this enormous research
effort has yielded only a small number of routine industrial applications. Indeed, still at the present day, the most
common manner of assessing an infrastructure’s ability to carry on with its designed duties, is through the
intervention of engineers trained in structural visual inspections [3]. A non-disregardable degree of inaccuracy is
therefore automatically incorporated in these studies due to the differences in the inspector’s safety condition
assessment backgrounds. Wherever monitoring tools are additionally employed, these usually fall under the
category of “traditional monitoring techniques” such as inclinometers, accelerometers, extensometers, total station
surveys, load cells and (Global Navigation Satellite) GNS-based sensors, etc. By themselves, these can be
considered sufficiently reliable since their correct deployment has been extensively investigated and is nowadays
widely acknowledged thus ensuring reliable monitorings and structural assessments. However, as stated in Baker
[4], conventional forms of inspection and monitoring are only as good as their ability to uncover potential issues in
an accurate and timely manner. Indeed, regarding the ability of damage detection, traditional tools present several
drawbacks which are, amongst others, insufficient data management ability, the need for the infrastructure’s service
interruption during their deployment, non-automated real-time measurements and interference risk. Consequently,
it is due to a lack of reliable, scalable and affordable monitoring solutions in addition to a uniform methodology of
executing them that SHM is not yet implemented as a standard practice in most civil engineering structures [5].
Modern monitoring technologies are aimed at tackling the above mentioned limitations thus boosting the sensors’
precision, automation and data management speed. These include among others Optical Fiber Sensors (OFS),

Chapter 1. Introduction | MATTIA FRANCESCO BADO
3
Global Positioning Systems (GPS), radars, Micro Electro Mechanical Systems (MEMS) and Image Processing
Techniques such as Digital Image Correlation (DIC).
In particular, OFS (subject of the present thesis) are dielectric devices used to confine and guide light consisting
of several layers: fiber core, cladding and occasionally an external jacket aimed at providing mechanical resistance
to the fiber (see Figure 1.1).
Figure 1.1. 3D illustration of a DOFS cross-section
Their fundamental principle is the ability to measure mechanical and temperature-variation induced strains along
a fiber’s length by means of light back-scattering occurring whenever the photons of the emitted light interact with
the physical medium through which it travels (the fiber’s core itself). The majority of optical fibers used in sensing
applications have silica (SiO2) glass cores and claddings. the refractive index of the cladding is lower than that of
the core to satisfy the condition of Snell’s law for total internal reflection and thus confine the propagation of the
light along the fiber core only [6]. The constituting material of the jacket, usually made of polymeric material or
nylon, can vary in diametrical size, shape and manufacturing process.
The technology behind the OFS-powered strain sensing has recently upped its performance (in terms of accuracy,
spatial resolution, resistance and in number of possible applications), consequently increasing their potential. Such
potential was immediately picked up and tapped into by the worldwide scientific community. This evolution goes
hand in hand with the monitored and predicted growth of OFS fiber sensors technological market according to an
updated and expanded market survey report conducted by the Photonic Sensor Consortium and published by
Information Gatekeepers [7] represented in Figure 1.2. It is worth noting that, according to the graph, the combined
distributed and single point fiber optic sensor markets are projected to be over $1.3 billion in 2023. In this respect,
the present thesis is a scientific and experimental effort aimed at facilitating the use of DOFS for both the present
and prospective users of this novel technology.
Now, if to focus strictly on OFS’s application to the civil and structural engineering field, it can easily be asserted
that it has slowly but steadily increased in the past years [3,8].

Chapter 1. Introduction | Mattia Francesco Bado
4
Figure 1.2. Growth of OFS on the technological market (adapted from [7])
As clearly identified by Li et al. [6], its increased popularity for SHM applications can be attributed to the
following OFS features:
They allow for completely distributed monitorings (in the case of DOFS) with monitoring points at frequency
smaller than 1mm;
Small diameter and minimal stiffness allows for very high degrees of deployment configuration complexity,
no matter if these imply circumferential surfaces, sharp corners, surface irregularities and more. It is even
possible to embed them inside structural elements with a minimal level of intrusiveness;
Ease of deployment as it can be achieved by simply applying an adhesive over it.
Their monitoring length is very flexible and can vary from halves of millimeter to tens of kilometers;
Immunity to Electro-Magnetic Interference (EMI);
They are designed with a long life cycle in mind. Indeed, its main component, silica, is highly resistant to
corrosion and can withstand high tensile loading;
Silica core OFS are highly resistant to temperature as they can measure temperatures from -200°C to 800°C.
The great majority of photonic sensing technology applied to SHM is constituted by discrete sensors such as
Fiber Bragg Gratings (FBG)-OFS [6] as these were introduced to the market much earlier than DOFS. These are
quasi-distributed optical fiber sensors in which a characteristic wavelength is used to simultaneously provide its
address in the sensor network, and the measurement (temperature and strains) [9]. For example, applications can be
dated back as early as 1993, when Intelligent Sensing for Innovative Structures performed a fiber optic sensing

Chapter 1. Introduction | MATTIA FRANCESCO BADO
5
deployments on six bridges in Canada [10]. Another noteworthy example was 2001’s installation of four FBG
sensors across, above and under the primary arch of Como’s Cathedral for the identification of structural
deteriorations [11]. Yet, it can be easily argued that the discrete sensors (such as FBG)’s most crucial limitation lies
in their non-distributed nature. This shortcoming is quite critical in the context of SHM as it prevents the possibility
of precisely pointing out the location where a potential damage first occurs and prevents the linking of local damage
mechanisms to the global condition of the structure.
The lack of sufficient monitoring points along a fiber deployment (spatial resolution) is an issue entirely
surpassed by DOFS (Figure 1.3a).
(a) (b)
Figure 1.3. (a) DOFS fiber and (b) ODiSI-6000 model OBR interrogator manufactured by LUNA Technologies
As a matter of fact, the latest model of DOFS sampling Optical Backscatter Reflectometer (OBR) Interrogator
machines (Figure 1.3b) are able to monitor strains with a spatial resolution of 0.63mm. The distributed nature of
such fibers enables the mapping of temperature, strain and vibration distributions in two or even three dimensions
(achievable with a DOFS mesh deployment) and their identification at any point along a fiber, henceforth allowing
the painting of a clear picture of the global behavior of a structure rather than reporting the tensile state of a limited
number of points. Figure 1.3 also displays the hair-like thinness of the fiber (125μm) which makes it ideal for un-
intrusive deployments.
The introduction of DOFS on the market has led to an increasingly large number of SHM and civil/structural
engineering applications along with scientific publications on the matter. In UPC alone, DOFS has been the topic
of multiple MSc and PhD theses [12–14] along with the current one.
Still, as suggested by Barrias [3], this is still a recent and developing technology as can be perceived by the
relatively few number of DOFS applications in SHM projects published in research articles. Despite such, a discrete
variety of applications have been performed including bridges [15], dams [16], tunnels [17], pipelines [18] and
slopes [19]. In most of the above mentioned cases the analyzed backscattering by the OBR interrogators is of the

Chapter 1. Introduction | Mattia Francesco Bado
6
Brillouin kind. As a matter of fact, three different types of light back-scattering processes may occur in a DOFS,
namely Raman, Brillouin and Rayleigh. All hold particular optical features that make one more suitable than others
relative to the research objectives. As seen, Brillouin back-scattering, thanks to its extended measurement range
capability (up to several kilometers), is the most studied and used DOFS system in civil and geotechnical
engineering. While the Raman back-scattering is characterized by high dependence on temperature it can also be
used to extract physical and chemical information of a material [20] such as food quality [21] or explosive materials
[22]. The third back-scattering phenomenon is Rayleigh. Despite its 70 m sensing range limit, it provides the highest
spatial resolution of the three, going as far as being able to sample strains every 0.63mm (smaller strain resolutions
being also available). Such minute sampling spacing is ideal for strain and damage monitoring in concrete structures
especially in the context of experimental laboratory investigations [23,24]. In fact, this is the kind of back-scattering
used by the OBR employed in the present thesis’ experimental work (represented in Figure 1.3). As such, a more
in depth literature review on the latter will be developed in Chapter 2.1.
In conclusion, the present sub-chapter has illustrated the present research’s work frame. This is one of
increasingly growing popularity of OFS (mainly due to their large potential for both SHM and civil and structural
engineering laboratory applications) but simultaneously one of still largely un-tapped potential mainly due to the
lack of proper standardization on how to deploy such sensors. This last issue represents by itself the be-all and end-
all of the present work.
Chapter 1.2 – Problem Identification
Due to the inherent nature of SHM, the most common tasks performed by means of DOFS are the monitoring
of already built structures and substantiation of their suitability to continue performing as per design. Consequently,
most DOFS deployments see their bonding to the external surfaces of RC structures. Several examples of such can
be found in Chapter 2.1 and 5.1’s literature reviews on DOFS deployments for Civil and Structural Engineering
SHM. The performance, strengths and weaknesses of this particular DOFS deployment technique has been
thoroughly investigated in multiple experimental laboratory campaigns. A novel way of deploying DOFS that has
taken hold in the later years, consists in adopting DOFS to monitor the evolution of the strains present on the inside
of a RC structure i.e., in the embedded reinforcement bars (rebars) or directly in the concrete. Due to its recency,
this application is characterized by a large untapped potential. Indeed, SHM-wise, this continuous and highly
sensitive embedded monitoring system provides access to the ability of starting to detect deformations and damage
as early as their appearance inside the structure (versus having to wait for their appearance on the external surface).
This superior deformation and damage detection potential can very well help replacing the current time-based
inspection model with one based on a performance or risk-based approach. As a consequence, today’s maintenance
paradigm could shift from corrective to preventive, resulting in tremendous savings in infrastructure maintenance
and a reduction of its associated social impact.

Chapter 1. Introduction | MATTIA FRANCESCO BADO
7
From a structural point of view, embedding DOFS inside RC structures could help comprehending their inner-
workings and in particular the physics behind the bond between concrete and steel. This by itself could represent a
huge step forwards for the serviceability design of RC structure. Indeed, classical approaches attempted modeling
serviceability-related phenomena (such as deflection and cracking) considering either a perfect interaction between
steel and concrete or a simplified constant bond relation. Whilst these simplifications are reasonable in load bearing
capacity analyses, they however become unacceptable when the serviceability of RC structures is considered.
Furthermore, these classic models’ approach to the definition of their parameters usually resorted to theoretical,
empirical or numerical solutions, leading to the creation of numerous models with little to no congruence with each
other. This could be attributed to the lack of strain monitoring tools able to accurately provide a clear and detailed
picture of the inner-workings of RC structures. Differently so, modern research advocates a stress-transfer approach
for the modelling of RC structure serviceability issues. The approach acknowledges the presence of a concrete-
rebar bond resulting from frictional resistance, chemical adhesion and mechanical interlock [25] between the two
materials. The model suggests that, whenever slip is present between a rebar and its surrounding concrete, an
interaction in the form of a force transfer starts developing on their interface. Such interaction is defined as bond
stress (referred to in the fib Model Code 2010 [25] as τb and in the Euro Code 2 [26] as 𝑓𝑏𝑑) and acts against any
relative rebar-concrete movement, evolving under the external force. This approach provides a realistic reflection
of the behavioral nature of RC, of its bond-slip mechanics, of the tension stiffening effect and of the cracks
development. Yet, presently, the major drawback of this approach is the lack of an adequate bond stress-slip law or
rather, once again, the lack of strain monitoring tools able to experimentally determine their governing parameters.
Instead, with the potential provided by the embedment of DOFS inside a RC structure, such insight would finally
be acquirable.
Overall, the potential brought forwards by embedded DOFS represents a leap forwards for DOFS-based Civil
and Structural Engineering monitoring and testing.
Yet, despite the abundant number of advantages that this deployment methodology brings forth, several practical
challenges also come aboard. These are:
the non-neglectable possibility of altering and/or damaging the DOFS when pouring the concrete;
the possibility of incorrect measurements due to excessive transversal pressure caused, for example, by the
friction and/or clamping of the DOFS from the part of concrete aggregates;
the impossibility of visually checking what is reported by DOFS;
the difficulty of parallel comparative monitorings.
All of these issues need to be addressed in order to maximize the performance and reliability of DOFS whenever
it is embedded inside RC structures. The most obvious way of tackling the first two points is by correctly insulating
the DOFS from the concrete. If this were to be fully achieved, the only strains reported by DOFS would be strictly

Chapter 1. Introduction | Mattia Francesco Bado
8
the ones transmitted from the surface under monitoring with no alteration or interference. Whilst this could ideally
be attained by means of one or more DOFS protective coatings, their inclusion leads to an additional problematic.
Indeed, the presence of intermediate layers between DOFS’s core and the case study surface leads to the failure of
the complete strain transfer from the host material to the sensing fiber [27] due to some of the energy being
converted to the shear and normal deformations of such intermediate layers (as well illustrated by Her and Huang
[28] in Figure 1.4).
Figure 1.4. Free body diagram for the symmetrical section of the optical fiber and the substrates together with their relative
shear transfer (adapted from [40]).
The reader should consider that Figure 1.4, for the sake of simplicity, only represented two intermediate layers
between the fiber core and the monitored surface. In numerous real-life applications, instead, the intermediate layers
are many more i.e., DOFS claddings, reinforcement layers, diverse coatings, jackets, etc. The whole issue is
exacerbated in the presence of strain singularities zones where a high-stress concentration is accumulated over a
short length of DOFS, such as cracks in RC elements or structural discontinuities. In an attempt to quantify this
phenomenon, Alj et al. [29] indicated that the strain transfer process depended on mechanical and geometrical
properties of the different intermediate layers, i.e., their elastic modulus, their height and the initial crack opening.
Despite several analytical models were been proposed in literature (Feng et al. [30] and Henault et al. [31] for
example), whenever a monitoring campaign requires the maximum precision possible, the shear lag induced by
DOFS-surface intermediate layers should be minimal. Consequently, the preferable DOFS for such application
would be a thin, non-coated DOFS (as the one represented in Figure 1.3a). In this case, though, the DOFS protective
function against external damage is not undertaken anymore by DOFS coating layers but falls entirely on the
adhesive layers with which the fibers are bonded.

Chapter 1. Introduction | MATTIA FRANCESCO BADO
9
As previously mentioned the use of un-protected DOFS exposes the monitoring to inaccuracies and errors
induced by transversal pressures from the part of the concrete itself. From the point of view of the DOFS extracted
strain data this issue translates in the appearance of unrealistic and unreliable measurements, henceforth referred to
as Strain Reading Anomalies (SRAs) [32]. Figure 1.5 below provides an example of numerous SRAs occurring
during the strain monitoring of two separate points of a DOFS (henceforth referred to as DOFS coordinates).
Figure 1.5. Representation of two DOFS-extracted RC tensile elements strain profiles (along time) in blue, a trendline (in
red) indicative of the correct strain trend and SRA peaks (pointed out by arrow annotations).
As visible, SRAs in the shape of large strain peaks (pointed out by arrow annotations) are present in both DOFS
raw outputs. In this example, just like in any other case, the SRAs extensively increase the level of unreliability of
the measurements and distort the global and/or local strain trends. The data interpretation and extraction of
observations and conclusions are drastically hampered by the presence of SRAs, thus the importance of tackling
this issue if to consider the deployment of thin DOFS inside RC structures as a viable option.
In conclusion, it is safe to say that the potential of embedded thin DOFS can be completely unlocked once, and
only once, the extent of such SRAs is limited to the bare minimum. This last statement embodies the scope of the
present thesis.
Chapter 1.3 – Objective of the thesis
The objective of the present thesis is to improve the viability of coating-less DOFS deployments inside RC
structures for Civil and Structural Engineering SHM.
In more details, the focus of this work is establishing methodologies and techniques for the reduction of SRAs
from DOFS-extracted strain measurements whenever the fiber is embedded inside RC structures. This will be
tackled with a dual approach:
a preventive one based on experimental laboratory work;

Chapter 1. Introduction | Mattia Francesco Bado
10
a corrective one based on algorithmic data post-processing.
On the first, various experimental campaigns with DOFS-instrumented rebars embedded inside RC structures
were performed both in Universitat Politècnica de Catalunya-UPC BarcelonaTech (Barcelona, Catalonia/Spain) and
in CHALMERS University of Technology (Göteborg, Sweden). Their goal, defining a DOFS-rebar bonding
technique that not only ensures a correct and durative connection between the two but also protects the fiber from
excessive friction/clamping with the concrete (this one being the main SRAs cause). The experimental testing was
purposely performed under different conditions in order to simulate the widest array of structural applications
possible. It was therefore performed for:
different RC structures (tensile and bending members);
different testing conditions (concrete-shrinkage induced loading, tensile and bending loading)
different rebar diameters ∅𝑠;
different structural reinforcement ratios 𝜌𝑠 (intended as the ratio between the steel’s 𝐴𝑠 and the concrete’s
cross sectional areas 𝐴𝑐);
On the second approach, with the help of the computational software Matlab, different mathematical and
geometrical tools were adopted to initially diagnose the presence of SRAs and consequently correcting them. The
latter is achieved by substituting the anomalistic readings with the most probable strain value present in the
“contaminated” area. The creation of post-processing algorithms that automate the two above steps allows for the
removal of the tedious and long SRAs diagnose and elimination process, thus speeding up, streamlining and
simplifying the whole SHM process. On a practical note, these improvements can help any future DOFS based
SHM campaign by facilitating the detection of the occurrence of structural damage or serviceability debilitating
events. Furthermore, new RC structures designed on the foundation of new DOFS-powered safety and serviceability
models would reach their minimum performance requirements with more consistency and with less structural
redundancy, thus saving on costs and material consumption.
In conclusion, by the end of this thesis, the reader should be in possession of sufficient tools to tackle as
efficiently as possible the DOFS monitoring of a structure with the deployment of thin fibers directly inside a RC
structure. This would help assessing the serviceability of both existing and new structures with crucial time and
economical savings.
Chapter 1.4 – Structure of the thesis
The present thesis is sub-divided in five chapters and annexes. The following paragraphs will provide a brief
summary of the objectives and methodologies used for each chapter.

Chapter 1. Introduction | MATTIA FRANCESCO BADO
11
In the first chapter, the present research’s work frame is presented in order to inform the reader of its significance
and importance in the present-day research environment. Following up, the main problematic that this thesis tackles
is explained and the methodologies to perform such are summarized in concise research objectives. Finally, the
structure of the thesis is elucidated.
The second chapter starts with a more detailed analysis of the issues around which the present work is structured.
Various hypothesis over the origin of such issues will be made and different solutions to them will be illustrated.
An important part of any research work is the literature review of the works and articles that have preceded the
present one. As such, a sub-section is dedicated to the previous research efforts aimed at limiting/eliminating the
issue at hand.
The third chapter presents the laboratory experimental campaigns conducted as a result of the objectives outlined
in the first chapter. A summary of the performed experiments and the discussion of the obtained results is showcased
here.
The fourth chapter introduces classic and newly developed post-processing algorithms aimed at guaranteeing
the quality of already-extracted distributed sensing strain measurements. Differently than the third chapter’s
preventive approach, the current one embodies a corrective approach to the phenomena jeopardizing DOFS
monitoring campaigns.
The fifth chapter constitutes the main body of the thesis and displays the “compendium of published journal
articles”. These published journal articles delve in greater detail into the performed experimental campaigns and
their results (briefly presented in the chapters 3 and 4).
Finally, in the sixth chapter the most important conclusions obtained throughout the thesis are reported together
with possible future investigation points that could potentially further improve the presented solutions to the issue
at hand.

Chapter 1. Introduction | Mattia Francesco Bado
12

Chapter 2. State of the Art | MATTIA FRANCESCO BADO
13
Chapter 2. State of the Art
This second chapter is aimed at providing the reader with a literature review on DOFS embedment inside RC
structures for civil and structural engineering applications. Furthermore, a deeper analysis of the SRA phenomenon
will be presented with the goal of familiarizing the reader with such a crucial pillar of the present work. As a matter
of fact, in the former, a certain emphasis will be applied to the bonding technologies with which DOFS and rebars
are united (before being embedded inside the concrete) and the consequent amount of SRAs present in each of the
extracted readings.
Finally, this chapter should help the reader forming an opinion on the overall performance and quality of such
unique monitoring methodology along with highlighting its still currently present shortcomings. These takeaways
are what shaped the experimental research discussed in the following chapters of this thesis.

Chapter 2. State of the Art | Mattia Francesco Bado
14
Chapter 2.1 DOFS for Civil and Structural Engineering Health Monitoring
The most conspicuous examples of Civil Engineering structures surround us every day. These are buildings,
bridges and roads but which also power plants, dams, railroads and airports. These structures cover key roles in the
proper functioning, security and comfort of any society, thus their time-induced deterioration and serviceability-
jeopardizing issues occurring throughout their service lifetime (e.g. corrosion, fatigue, creep and shrinkage-induced
shortening and cracking) should be treated with the equivalent criticality.
Revealing data, averagely representative of the situation of most countries worldwide, is provided by the
American Society of Civil Engineers (ASCE)’s 2021 Infrastructure Report Card [33]. According to it, the U.S. has
617000 bridges, 42% of which are 50 years old or more. 7.5% of the nation’s bridges are considered structurally
deficient and, on average, there were 178 million trips across a structurally deficient bridge each day. Furthermore,
one out of every five miles of highway pavement is in poor condition. The most recent estimate puts the nation’s
backlog of bridge rehabilitation needs at $125 billion and of highways rehabilitation needs at $786 billion.
As observed by Regier and Hoult [34], it is not feasible to replace all the structures that have surpassed their
intended service lives because of the budget, logistical and environmental concerns that such wide spread demolition
and reconstruction process would bring along. The only other possible approach consists in keeping the assets that
are still fit for purpose in service. Hence the importance of determining their deterioration level, serviceability
performance and public safety. Though visual inspection is the most common assessing methodology [35], it
inherently includes a certain degree of subjectivity together with evident limitations when it comes to damage
occurring on the inside of a structure or located in unreachable locations. As such, the SHM of Civil Engineering
infrastructure proposes the definition of damage identification strategies performed through accurate quantitative
data sampling tools and followed up by their continuous and real-time monitoring.
The applicability and performance of DOFS to the built environment SHM has been tested and proved possible
in pioneering publications such as Regier and Hoult [34] Glišić et al. [36], Matta et al. [37] and more. Interestingly,
Glišić et al. [36], reported the Brillouin scattering-based DOFS monitoring of a 1000m long bridge (composed by a
concrete slab poured on nine steel girders that are then supported by more than 50 columns) which is still currently
ongoing, effectively making it, to the authors’ knowledge, the longest DOFS monitoring implementation on a real
structure.
The following paragraphs summarize the most interesting and indicative parts of a thorough literature review
article developed by the author on Civil and Structural Engineering SHM [38]. Note that the integral version of the
following literature review can be found in Chapter 5.1.
Webb et al. [39] performed a BOTDR DOFS monitoring of the Nine Wells Bridge in Cambridge (UK) carrying
a new road over the main rail line connecting Cambridge to London. The bridge, a three span, pre-tensioned,
prestressed concrete beam-and-slab bridge was monitored with the goal of observing the long-term behavior of the
structure for damage detection purposes and in order to compare the in-situ measurements to the various empirical
creep and shrinkage models used in the design phase. Six beams were instrumented with fiber-optic cables (as in
Figure 2.1) after the prestressing strands had been pre-tensioned but before that steel reinforcing stirrups had been
tied in place in the mold.

Chapter 2. State of the Art | MATTIA FRANCESCO BADO
15
(a) (b)
Figure 2.1. Beam cross section showing the fiber-optic cable locations: (a) illustration and (b) photograph (adapted from
[39])
In particular, two types of fiber-optic cables were installed in the six beams; one for the sensing of mechanical
strains (defined as total strain fibers) and one for the temperature strains (defined as temperature fibers). Interestingly,
the latter cable was filled with gel inside which the sensing fibers were suspended (this way, the shear transfer
between the concrete and the sensing core was prevented). With such dual fiber deployment, the temperature effects
on the Brillouin frequency shift could be removed, such that the true strain in the fiber (due to applied loading as well
as time-dependent effects and the thermal response of the structure) could be calculated.
Similar investigation procedures were undertaken by Cong et al. [40] whilst attempting to evaluate the prestress
loss of four 11.9m prestressed concrete beams of a newly-constructed railway bridge in Staffordshire (UK). Both
immediate prestress losses (caused by the elastic shortening of concrete) and the time-dependent prestress losses (due
to steel relaxation, concrete shrinkage and creep) were captured by means of distributed (BOTDR DOFS) and discrete
(FBG) fiber optic sensors installed during the manufacturing process (as visible in Figure 2.2). The latter sensor
measured both strains and temperature (for compensation purposes). The measured prestress losses were compared
with the predicted ones calculated according to both the European and American standards. The outcome was an
apparent underestimation from the code’s part (possibly due to the inaccurate estimations of various input parameters)
which was more pronounced in the early-age versus compared to the two to three years’ mark.
An additional bridge OFDR DOFS monitoring is reported in Barrias et al. [15]. Here, Sarajevo Bridge (Barcelona,
Spain) was monitored during some deck-enlarging construction works in order to perform a follow-up of the stresses
induced in its three prestressed concrete box girder beams. Thus, the shorter of the two bridge spans saw the
longitudinal gluing of a single 50m DOFS inside one of its beams (as visible in Figure 2.3). The authors reported the
strain evolution during the construction phase and calculated that, despite the strain variation (biggest one being
−304με), excessive stresses were not transmitted to the concrete during the construction works (maximum 11.42
MPa).

Chapter 2. State of the Art | Mattia Francesco Bado
16
Figure 2.2. (a) DOFS deployment layout and (b) prestressed concrete beam cross sections – edge TYE7 beams (left) and
internal TY7 beams (right) [40]
(a) (b)
Figure 2.3. (a) General scheme of DOFS monitoring and (b) its photograph inside the box girder (adapted from [15])
Moving on to the SHM of buildings, interesting results were reported by De Battista et al. [41,42] regarding the
long-term BOTDA DOFS monitoring of two columns and two core walls (as in Figure 2.4a) of the 163m, 50 storeys
tall Principal Tower (London, UK). The goal, assessing the combined structural shortening caused by the
superimposed load, creep and shrinkage during the construction phase. Indeed, the authors highlighted the importance
of establishing the floor-to-floor axial shortening of vertical load-bearing elements and their differential shortening
(whenever they are characterized by different stiffness) for the installation of finishes and partitions on the lower
floors. Thus the importance of integrating the designers’ empirical shortening calculations (adjusting them if
necessary) with in-situ continuous distributed measurements. DOFS was then the ideal candidate for such goal,
allowing for the calculation of the axial deformation at any time during the construction and along the whole height
of the completed elements.

Chapter 2. State of the Art | MATTIA FRANCESCO BADO
17
(a) (b)
Figure 2.4. (a) Location of the instrumented columns and walls and (b) DOFS tied to the reinforcement prior to
concreting [42]
Consequently, each monitored element was instrumented with two DOFS (measuring strains and temperature)
fixed to the reinforcement (as in Figure 2.4b) before embedding them inside concrete. The DOFS monitoring started
on 3rd September 2016 and since then measurements (with a spatial resolution of 1m) were performed at least twice
every hour. Expectedly, the authors detected that the columns shortened significantly more than the walls throughout
the construction causing a non-negligible differential shortening between the two. For example, as visible in Figure
2.5 whilst column C8 suffered a shortening of 60.3mm at level 38, simultaneously wall W2 shortened of only
10.2mm.
Figure 2.5. The total cumulative axial displacement (negative = shortening) of the instrumented columns C8 and wall W1
measured at the mid-height of every level during the first 12 months of construction (adapted from [42])

Chapter 2. State of the Art | Mattia Francesco Bado
18
This also occurred, with a smaller magnitude, between two columns with different cross-sections for example at
the end of July 2017, the maximum shortening recorded at level 31 on column C8 was 36.6mm whilst that on column
C9 was 32.6mm, approximately 11% less.
A noteworthy article on the SHM of bituminous pavements is Rabaiotti et al. [43]. Here, the authors pointed out
that the deflection-induced tensile strains in the bottom pavement layers could lead to potentially permanent
deformations under heavy traffic flow and at high temperatures. For airfield pavements the magnitude of the issue is
amplified by the considerably larger loads. The authors further elucidated that, for such particular application, the
main challenge lied in avoiding damage to DOFS during the asphalt compaction process which usually involves high
temperatures (exceeding 140°C). To tackle this issue, ad hoc strain (V3 and V9) and temperature (T) sensing cables
were developed (illustrated in Figure 2.6a and b) using armored DOFS cables, metal tubes and PA outer sheaths.
(a) (b)
(c) (d)
Figure 2.6. (a) Photograph of the DOFS cables, (b) an illustration of their cross-sections and (c) of their designed installation
position and finally (d) a photography of the deployment process (adapted from [43])
In the present project, BOTDR and Rayleigh-based Swept Wavelength Interferometry DOFS were embedded in
two pavement layers in 150m long loops. The deployment steps were performed as follows. Initially the fibers were
laid out on the substrate layer, followed by their pre-straining and fixing in place (Figure 2.6c and d). After such, for
better protection against the rolling compactor machine, the sensors were covered manually with finer asphalt, before
the overlying layer was poured. The test started when a plane was pushed backwards in a perpendicular direction to
the fiber loop resulting in sampled strains illustrated in Figure 2.7. The authors observed that the stiffer V3 cable
seemed less capable of following the pavement’s high strain gradients versus its V9 counterpart. Additionally, the
strains measured in the lowest layer (13.5cm depth) were expectedly smaller. In conclusion, this DOFS-based testing
methodology was commended for the detection of problematic zones and quality issues in the realized pavement in
addition to validating the design assumptions.

Chapter 2. State of the Art | MATTIA FRANCESCO BADO
19
Figure 2.7. Strains measured along the sensors when the case study airplane rear landing gear was rolled on them [43]
On SHM for pile foundations, the assessment of the column force distribution and base load bearing capacity is
therefore a key SHM aspect and was therefore the topic of numerous experimental campaigns. A noteworthy one
was the work of Seo [44] who instrumented the steel cages of a 25m deep CFA pile with both strain and temperature
BOTDR DOFS (as visible in Figure 2.8) in addition to standard SG and extensometers.
Figure 2.8. Installation of the DOFS and the pile [44]

Chapter 2. State of the Art | Mattia Francesco Bado
20
Interestingly, a certain prestress was applied to the strain DOFS in order to facilitate the recognition of its
frequency data location during the data analysis (its central frequency was therefore higher than the temperature
cable). The compression load was initially increased to 8 MN, it was then unloaded and finally loaded again up to 20
MN. Seo assumed that if the soil had mixed with the concrete at the bottom of the CFA pile, large strains would be
reported in that location. However, the maximum compressive strain was only 200𝜇𝜀, thus confirming the proper
functioning of the pile. Finally, Seo studied the pile’s skin friction at its bottom reporting a significant increase with
the applied load.
A similar testing methodology was presented in Kania et al. [45] who monitored, by means of OFDR DOFS, the
strains and temperature inside different kinds of piles subjected to static load testing. The authors provided a
comprehensive look on the proper way to perform a DOFS structural instrumentation. Such work is commendable
as it can provide an initial quality boost to similar future tests and, as such, some key aspects are reported in the
following. First of all, if the pile may potentially be subjected to bending, Kania et al. suggested the mounting of a
pair of strain sensors in opposite locations in order to measure both its compressive and tensile strains. Furthermore,
they recommended to always install two fibers at each location for both redundancy purposes and, in case of damage
or unexpected results, for having access to independent verification data. Then, similarly to what was done in [44],
they introduced the idea of a pre-tension of the DOFS cables to an amount larger than the expected compressive
strain in order to align its length scale. Finally, once the sensing cables are fixed to a structure, they proposed the
marking of the points of interest (e.g., pile head, specific depths, and pile toe) by pressing or heating/cooling the
cable in that specific point/s and recording the location of the signal. In [45] the piles in question were a steel pile, a
CFA pile and a precast pile which were all instrumented with different fiber deployment methodologies. For the
bonding to the steel pile, additional steel rebars were welded to its surface as a guide and protection for the DOFS
(see Figure 2.9a).
Figure 2.9. Typical cross-section layout of DOFS cables attached to (a) a steel pile and to (b) a steel cage of which a picture
is represented in (c) (adapted from [45])
The fibers were bonded to the CFA pile’s reinforcement cage with epoxy glue (see Figure 2.9b and c) and, for the
precast concrete pile, they were installed into previously incised grooves and then fixed with epoxy. The authors
studied and reported the steel pile’s strains induced by its driving in the ground (Figure 2.10a), the CFA pile’s strain
distribution during a test which included twelve incremental load steps (Figure 2.10b), the precast concrete piles’

Chapter 2. State of the Art | MATTIA FRANCESCO BADO
21
operational strains (which were influenced by the evolution of several cracks as visible in Figure 2.10c), the short
and long term influence of temperature on the sampled strains and finally the influence of lateral forces.
(a) (b) (c)
Figure 2.10. Distribution of strains along individual DOFS (a) after the driving of a steel pile (b) during a static load testing of
the CFA pile and (c) the crack evolution inside a precast concrete pile (adapted from [45])
DOFS monitorings and development of related early warning systems are also crucial for the prevention and
control of ground deformations (land subsidence, ground fissure and surface collapse amongst others) as serious
geological disasters may occur on their back. Zhang et al. [46], for example, reported the results of an in-situ
experimental campaign (Suzhou, China) aimed at acquiring data on the subsidence and strata subsurface vertical
deformations by means of a BOTDR DOFS embedded in a borehole (as in Figure 2.11).
Figure 2.11. Illustration of soil subsidence and DOFS vertical deployment in a borehole as performed in [46]
After the 200m deep borehole was excavated, the DOFS cable was attached to a cone guide and lowered into the
former. The hole was then backfilled with a mixture of sand, clay and gravel. Then, by means of direct integration,
the authors converted the DOFS strains sampled between December 2012 and November 2014 into a numerical
estimation of the compaction or rebound that occurred in that time. The results highlighted the rise of positive strains
between 60.3m and 67.9m depth indicative of an overall rebound of the pumped aquifer.

Chapter 2. State of the Art | Mattia Francesco Bado
22
Lanciano and Salvini [47], instead, presented an innovative combination of DOFS (as visible in Figure 2.12),
digital photogrammetry through Unmanned Aerial Vehicle, topographic and geotechnical monitoring systems for the
monitoring of the rock mass stability conditions in marble quarries in order to eliminate the risks of rock falls.
Figure 2.12. Geotechnical sensors (in blue) and fiber optics cable (in red) on the western (a) and southern-eastern (b) sides
of the buttress [47]
By means of a BOTDA DOFS monitoring system some displacements were successfully detected despite their
values fell within the tolerance threshold range. No other critical situations were detected.
The need of a performant tunnel SHM is particularly self-explanatory, for example, in the aftermath of a seismic
event. especially when attempting to assess its residual capacity to survive consecutive seismic aftershocks. This
withstanding, SHM is equally crucial during a tunnel’s construction and service-life. As a matter of fact, both new
and existing tunnels suffer an inherent structural risk connected to the surrounding geotechnical and hydrological
conditions (new ground level constructions and excessive rain periods amongst others) as well as to unknowns related
to design assumptions and construction materials [48]. These risks may translate in the appearance of abnormal
horizontal and vertical tunnel deformations, convergence deformations (relative displacement of two diametrically-
opposed points), cracks, joint movements, water leaks and, in the worse cases, collapse.
Monsberg et al. [49] reported a comprehensive work on the design and realization of an OFDR DOFS monitoring
system where the fiber was installed in the above mentioned shotcrete linings situated in a fault zone of the
Semmering Base railway Tunnel (Austria), at the time under construction following the NATM. The described
campaign saw the distributed monitoring of strains and temperature by means of a 230m long DOFS located on two
layers of a case study tunnel cross-section (rock-side and cavity-side as visible in Figure 2.13). The DOFS monitoring
began the moment the shotcrete started curing and lasted several weeks long until the tunnel drive construction was
completed. In order to prove the suitability of the DOFS-based monitoring system, the results were compared with
the ones coming from Vibrating Wire Sensors (VWS in Figure 2.13) and geodetic measurements. Approximately 12
hours after the construction of the top-heading, the authors reported observing compression zones at the crown and
the shoulders (as reported in Figure 2.14).

Chapter 2. State of the Art | MATTIA FRANCESCO BADO
23
Figure 2.13. DOFS installation inside the tunnel lining: (a) Schematic representation and (b) practical realization [49]
Figure 2.14. Measured strain distribution at the rock-side layer in peripheral direction: (a) 12 hours after installation at top-
heading, (b) 48 hours after installation at top-heading, (c) 12 hours after installation at invert and (d) 48 hours after installation at
invert [49]
Then, 48 hours after the construction of the bench/invert, the deformations were reported to be almost constant
along the entire supporting ring suggesting that it formed a load-bearing system capable of coping with the remaining
loads. The authors concluded remarking that DOFS allowed to precisely localize the maximum strain within the cross
section instantly (differently than conventional geodetic measurements) along with its deformation history. Yet, they
also noted that the position of the sensor versus the direction of the tunnel drive significantly influenced the results.
A DOFS tunnel monitoring under service conditions is reported in Gómez et al. [17]. This article reported the
implementation of an OFDR DOFS on the TMB L-9 metro tunnel in Barcelona in order to assess whether it was
affected by the construction of a residential building 14m above it (of which roughly 37m2 could be found right above
the tunnel). In particular, a 50m long fiber was glued to the tunnel’s cross-section expected to suffer the largest

Chapter 2. State of the Art | Mattia Francesco Bado
24
deformations (thus defined as critical section), to a segment beneath the tracks and to a segment of the linen parallel
to the tunnel (as represented in Figure 2.15).
Figure 2.15. Monitored tunnel section [17]
In this case, the asymmetrical construction-induced loading and unloading effects would not be directly translated
in a uniform pressure around the ring due to the additional presence of a bending effect. This was observed during
the in-situ monitoring which reportedly detected compression in the linen’s intrados (where the DOFS was actually
bonded) during the excavation phase and tension during the building’s construction (when the external load was
negative). For a proper analysis and visualization of the data, the authors mentioned having used complex data
treatment algorithms [32] to get rid of a significant number of anomalous readings in the raw strain data. The authors
concluded highlighting the need for general, standardized guidelines which also account for the structure’s nature,
for the temperature effects and for the adopted post-processing techniques.
The SHM of wind turbines has also been tackled by means of DOFS, especially in light of the increased size
characterizing the newly designed/produced wind turbines (for the sake of increased productivity) and thus the
increased risk of failure induced by the consequent larger forces acting on the structures.
Zhang et al. [50] used a Differential Pulse Pair Brillouin Optical Time-Domain Analysis (DPP-BOTDA) to
monitor a 69m tall offshore wind turbine pile (belonging to the Xinghua Bay Wind Farm in Fujian) in order to obtain
the bearing capacity of its foundation (see Figure 2.16).
(a) (b)
Figure 2.16. (a) Case study offshore turbine (b) DOFS bonded with epoxy to the sample pile (adapted from [50])

Chapter 2. State of the Art | MATTIA FRANCESCO BADO
25
The monitored concrete-filled/steel composite pile was a test sample mounted on the same offshore platform as
the actual case study one. The authors aim was pin-pointing the pile foundation’s maximum stress location under
horizontal loading (applied by means of a horizontal reaction frame). The test, subdivided in 15 consecutive load
stages with load increments of 60kN, yielded the maximum strain (1436με) at the last load stage at y coordinate -
19.63m (as visible in Figure 2.17).
Figure 2.17. Strain values per corresponding elevation from 0 kN to 900 kN [50]
Expectedly, the maximum displacement (0.79m) occurred at the uppermost end of the fiber and the load/maximum
strain and the load/maximum displacement profiles were both found to be linear in nature. The authors concluded
commending the proposed DPP-BOTDA for any offshore wind turbine pile foundation SHM.
Chapter 2.2. DOFS embedded inside RC structures and Strain Reading Anomalies
(SRAs)
As was previously mentioned in Chapter 1.2, a novel DOFS deployment technique sees DOFS embedded inside
RC structure i.e., bonded to the rebars or embedded directly in the concrete. The consequent ability to detect
deformations and damage in their earliest stages (versus having to wait for their appearance on the external surface)
renders it an enticing option for numerous SHM applications. The most important one is definitely the shift of
maintenance paradigm from corrective to preventive, thus allowing for tremendous savings in infrastructure
maintenance and in risk reduction. Yet, when deploying DOFS inside RC structures several phenomena may
jeopardize the extractable results. Among these the non-neglectable possibility of fiber alteration/damage during the
pouring of concrete and the possibility of erroneous measurements induced by the friction and/or clamping of the
DOFS from the part of concrete aggregates. It was previously discussed that whilst the deployment of DOFS with
several claddings and coatings could compensate for these issues, the presence of a certain lag in the transmission of
strains from the monitored surface to the DOFS’s silica core reduces the accuracy of set measurements. Being the

Chapter 2. State of the Art | Mattia Francesco Bado
26
strain transfer process dependent on both mechanical and geometrical properties of the different intermediate layers
i.e., their elastic modulus and height, for those particular applications that require the maximum precision possible
DOFS with the minimal intermediate layers should be selected. Consequently, the preferable DOFS for such
application would be a thin, simply cladded, non-coated DOFS (as the one represented in Figure 1.3a). In this case,
though, the DOFS protective function against external damage is not undertaken anymore by DOFS coating layers
but falls entirely on the adhesive layers with which the fibers are bonded.
In recent years, several publications [51–53] display various manners of attaching DOFS to rebars (before their
insertion inside concrete) and present diverse bonding techniques and adhesives. Their resulting DOFS strain profiles
quality is varying and sometimes contradictory. When it comes to the quality of their extracted data, the main constant
is the presence of evident SRAs. These were earlier defined as localized, excessively large and inaccurate strain
readings which do not present a direct physical explanation. Unfortunately, as will be visible later on, this is a very
common and undesirable occurrence plaguing almost every single DOFS monitored campaign. Bado et al. [32,54]
attempted to study these SRAs. According to them a strain peak at a general DOFS coordinate xk is usually considered
as an abnormal reading if it presents a large difference with previous reading at coordinate xk−1 (see Figure 2.18).
Figure 2.18. Graphical representation of different SRA theoretical definitions
This can be both in terms of time (two consecutive strain measurements in the same DOFS coordinate) and space
(two strain measurement performed in two neighboring DOFS coordinates at the same instance). Temporally
speaking, unless a large load is suddenly applied on the DOFS-monitored structure, two consecutive measurements
should present similar strain readings as the time interval between them (1/250th of a second), thus their load
difference, is almost negligible. Spatially wise, if to consider DOFS tests with small spatial resolutions (0.63–1.3
mm), strains simply do not peak in neighboring sections without a certain amount of lead-up gradual growth. This
last point is expressed in Figure 2.19 which compares the extension of SRA versus one of a crack inside RC within
a similar DOFS coordinate interval. As visible, the two are not comparable thus cannot be confused in the data
analysis and/or post-processing phase.

Chapter 2. State of the Art | MATTIA FRANCESCO BADO
27
(a) (b)
Figure 2.19. (a) SRA present in a specific DOFS coordinates interval (b) compared against the appearance of damage
(cracking) in a RC element in a similarly sized DOFS coordinates interval
Two types of SRAs were identified, harmless and harmful SRAs. The first, Harmless Anomalies (HL-SRAs) are
those strain peaks that, while preventing the correct reading of the strains at a specific time, still allows it in later
instances. Being the nature of this anomaly concentrated in nature (see Figure 2.18), it is easily identifiable in the
strain profile of a DOFS section as an excessively large and concentrated peak surrounded by coherent strain readings.
Harmful Anomalies (HF-SRAs), are those strain peaks that are followed strictly by additional anomalistic readings.
Hence, from their initial appearance and for the rest of the monitoring period, all the measurements are considered
unreliable. Figure 2.18 compares the looks of a DOFS reading when affected by a HF-SRA at DOFS coordinate xk
against its neighboring sections (xk-1 and xk+1). Note that this kind of anomalies might be “contagious”, meaning that
the surroundings of an identified HF anomaly might become, in posterior times, an HF-SRA itself.
In order for the reader to both grasp the motivation of the present work and acquire the necessary groundings, it
is important to now review the different experimental campaigns that have been developed embedding DOFS-
instrumented rebars inside RC structures and their resulting strain reading quality (SRA presence). Hence, the
following paragraphs constitute a concise collection of the aforementioned publications and its deducible conclusions
represent the basis on the ground of which this work is developed. As visible later on, the review is subdivided in
three general categories in which the bonding techniques can be subdivided, namely DOFS gluing without and with
a protective layer and a groove incised in the rebar. Please note that, unless otherwise specified, the DOFS fiber used
in the following experimental campaigns are constituted by a 9 μm diameter glass core (with uniform refractive
index) covered with a 125 μm diameter polyamide cladding with no external jacket.
With the intention of comparing the DOFS performance when glued with cyanoacrylate and a two-component
epoxy, Barrias et al. [55] bonded the fibers on the rebars of two small beams later tested under three-point loading.
For both adhesives the extracted strains presented reasonably good agreement among each other and with embedded
strain gauges despite a large amount of SRAs occurring as soon as the cracking starts (see Figure 2.20).

Chapter 2. State of the Art | Mattia Francesco Bado
28
Figure 2.20. Comparison of the measured values before and after interpolation of the DOFS with the strain gauges for 15
kN—Beam 1 (left) and Beam 2 (right) [55]
Nevertheless, the optical fiber glued with cyanoacrylate produced more consistent strain data whereas the epoxy-
glued sensor showed slightly higher strain peaks.
Davis et al. [52] tested multiple 2.3 m long DOFS-monitored beams under a three-point bending setup. The
polyamide cladded fibers were bonded with cyanoacrylate, more specifically Loctite 4851, resulting in very smooth
strain curves outside the cracked section. On the other hand, some disruptive SRAs are present in the strain profiles
of the beams subjected to corrosion damage (see Figure 2.21).
Figure 2.21. Corroded beam bottom interior polyimide strain change with length along the reinforcement and increasing
applied load [52]
Regier et al. [56] also used cyanoacrylate (Loctite 4851) to install a DOFS on the bottom rebar of a 1 m long RC
beam tested under four point bending load. Though the measured strains demonstrated good agreement with the
predicted strains for loads lower than 10 kN, for higher ones some large SRAs were spotted, specifically around the
mid-span.

Chapter 2. State of the Art | MATTIA FRANCESCO BADO
29
Malek et al. [57] compared polyimide and PVC (polyvinyl chloride) coated optical fibers both being glued to the
beam’s reinforcement by means of a two-part epoxy (Loctite E-20HP). The authors found this adhesive more
satisfactory with the polyimide coated fiber in terms of transferring strain to the core from its surroundings even in
the deteriorated area.
Sieńko et al. [58] described a DOFS-monitored RC tensile members (ties) test where the fiber was glued to the
degreased reinforcement bar along the longitudinal rib with an epoxy resin. The used fibers, though, differed from
the current test’s due to the presence of a protective coating that consequently increased its diameter around seven
folds (0.9 versus 0.125 mm) and led to a strain difference between the ones measured in the fiber and the one
measured in the hosting steel.
Acknowledging the fragility of the polyamide DOFS, the scientific community started investigating a bonding
technology that not only would warrant the correct bonding of the fiber to the structural surface but also a certain
amount of protection from external factors. The most recurrent protection layer is a silicon-based one.
Davis et al. [51] proceeded to monitor the impact of (accelerated) corrosion on RC tensile elements through DOFS
as a supplement to visual inspections. The nylon and polymer cladded fibers were bonded with cyanoacrylate (Loctite
4851) and an extra silicone coating. The results, though, were very jagged strain profiles including a large number of
SRAs.
Nurmi et al. [59] installed both nylon and polyamide cladded fibers on multiple rebars of an 80 mm thick slab
with the aim of assessing the impact of the support conditions on its performance. Whilst both DOFS were bonded
with cyanoacrylate (Loctite 4861), a silicon layer was positioned only on the polyamide fiber. Despite both fibers
successfully sampling the structure’s strain behavior and its cracking pattern, some SRAs were present in the output
data. The polyamide DOFS showed smoother strain curves, probably thanks to its silicone layer.
The use of a protective silicone layer was also commended by Brault and Hoult [60] after conducting an
investigation on the potential of optical fibers as a strain measuring tool as well as its damage detection ability in
differently sized beams. The authors further commended nylon cladded fibers compared to polyamide ones as the
latter, despite the extra protection layer, displayed rougher strain curves with non-overlookable SRAs. Moreover, the
former extrapolated measurements were in agreement with strain gauges’ output as well as the theoretical prediction.
Berrocal et al. [61] also used polyamide cladded fibers attached by a thin layer of cyanoacrylate further covered
by an extra silicone protection. Their primary goal was to monitor the crack formation and evolution in beams
subjected to monotonic and cyclic loading under a three-point bending setup. This bonding technologies allowed the
successful detection of the microcracks width—even as miniscule as 40 µm. Furthermore, the authors endorsed this
adhesive combination, as its strain results were in good agreement with the strain data from strain gauge sensors.
A rather novel and advanced DOFS protection technique establishes the incision of a groove on a rebar’s surface
(usually on the longitudinal rib as in Figure 2.22) which later welcomes the DOFS inside it. As will be visible in the
following publications, this is believed to provide further protection compared to simply gluing the fiber to the rebar’s
surface (Quiertant et al. [53]). Yet, it is quite surprising that, despite this technique’s non-negligible financial and
time costs, a comprehensive study on the potential improvement that it brings to the table (in terms of DOFS reading
quality) has yet to be performed. The present paper intends to perform such analysis.

Chapter 2. State of the Art | Mattia Francesco Bado
30
(a) (b)
Figure 2.22. (a) Milling of the groove along the rebar’s longitudinal rib and its (b) resulting incision marked with a dashed red
line.
The efficiency of this arrangement was commended by Michou et al. [62] who used a 1 × 1 mm groove incised
along the rebar of a 1.15 m long RC tensile element in order to study the evolution of the concrete cracking, its
transfer lengths and tension stiffening. Despite no specifications are given on the kind of adhesive used, the mere
presence of the groove led to an output characterized by smooth curves and easily recognizable strain peaks indicative
of cracks.
Haefliger et al. [63] used this technique too, engraving a longitudinal section of 1 × 1 mm along the rebar and
later gluing the optical fiber inside it with epoxy. The bars were positioned inside a 600 × 600 mm, 125 mm thick
RC square panel subjected to diagonal tension in a universal testing machine (UTM). This technique resulted in
notably smooth strain curves. The optical fiber diagnosed the correct location of the cracks which were further
validated by digital image correlation (DIC). Yet, the strains in the cracked sections within the range of the transition
zone were lower than expected.
Bado et al. [64] carried out a DOFS monitoring tensile tests on different RC tensile elements by positioning the
DOFS inside a groove milled on the bar’s surface and later glued with cyanoacrylate. Here, the extracted strain
profiles’ peaks, correctly indicated the crack locations (further corroborated by a DIC monitoring) but a significant
number of strain reading anomalies (SRAs) were found.
The groove-cyanoacrylate combination was further used in Bado et al. [32] with similar results. Indeed, the strain
profiles extracted from two more RC tensile elements presented a consistent amount of SRAs which were later
removed through a newly introduced post processing algorithm.
In their research Bassil et al. [65] studied the output of a DOFS monitoring campaign (bonded with a two
component epoxy and positioned inside a groove) inside a 1 m long RC beam subjected to a three point loading setup.
The authors witnessed noticeable SRAs immediately after micro-cracks began forming around the rebars, steeply
increasing in magnitude with every load increment (see Figure 2.23).

Chapter 2. State of the Art | MATTIA FRANCESCO BADO
31
Figure 2.23. Spatial strain distribution in concrete measured by the DFOS system near the bottom rebars. Note that the
missing points are indicative of SRAs [65]
The following conclusions can be extracted from the above literature review:
The friction between DOFS and the surrounding concrete supposedly is the main reason for the appearance of
SRAs. Therefore, the bonding techniques that seems to best insulates the former from the latter seem to yield
to the most SRA-free outputs.
Bonding adhesives aside, three main DOFS/rebar bonding techniques have been adopted up to now:
o Simply gluing the DOFS on the rebar’s surface away from the transversal ribs;
o Gluing the DOFS to the rebar’s surface and covering it with a silicone-based protection layer;
o Incising a groove on the rebar’s surface and positioning the DOFS inside it before gluing it;
The presence of silicone and of a groove seems to improve the quality of the DOFS extracted profiles;
Despite such improvement, none of these techniques seems to unequivocally guarantee the absence of SRAs;
A combination of groove and silicone has not been tested yet.
As previously mentioned, a deep study on the performance of each of these techniques has yet to be developed
as, all we have at the present moment, is essentially a conglomeration of scattered data from different experimental
campaigns with different execution conditions. This is essentially the scope of the present thesis, namely assessing
which DOFS deployment technique ensures the best strain reading quality whenever the sensor is deployed inside
RC structures thus being exposed to local friction and clamping.

Chapter 2. State of the Art | Mattia Francesco Bado
32

Chapter 3. The Experimental Campaigns | MATTIA FRANCESCO BADO
33
Chapter 3. Experimental tests: results and discussions
In this chapter, the laboratory experiments planned as a result of the initial literature review and the existing
problems still to be solved are described and their results discussed. As seen in the previous chapters, in order to
assess the quality of a DOFS-rebar deployment technique multiple aspects should be taken into consideration. These
are the cleanliness of the extracted signal (deeply related to the amount of SRAs), the resistance of the adhesives to
the external forces that would otherwise separate the sensor from its surface or damage it, and finally the invariant
behavior of the adhesives on the strains sampled by DOFS. On the latter, it should be guaranteed, to the maximum
extent possible, that what is being read are the actual strains occurring in the monitored surface rather than present
solely in the fiber core.
In order to tackle this last key point, the experimental campaigns designed by the author followed a dual
approach:
The first saw the deployment of DOFS on bare rebars followed by their monitoring whenever the bars were
subjected to specific loading conditions i.e., tension and bending. This particular approach was intended to
bring to the surface any alteration that a particular adhesive might have caused in the DOFS sampled strains.
In order to perform this analysis, the DOFS readings coming from differently bonded segments were not only
compared against each other but also against the measurements performed by classic and well established
strain monitoring tools;
The second approach saw the deployment on DOFS on rebars which were later embedded inside Concrete
specimens. These include both concrete prisms to be tested in axial tension (henceforth referred to as RC ties)
and RC beams. Note that the former were also used to study the strains present on a rebar whenever it is
embedded inside shrinking concrete.
It is worth mentioning again that the focus of the thesis is on the deployment and performance of coating-less
DOFS. The characteristics of the optical fibers are described for each particular test. Only in one experimental
campaign a fiber optic with a thick coating protection was used just for comparison of the results.
The following sub-chapters will join the experimental results pertaining to the same approach despite being
produced in different experimental campaigns. The reason behind this content structure lays in the importance of

Chapter 3. The Experimental Campaigns | Mattia Francesco Bado
34
having in mind the results extracted from bare rebar tests whenever analyzing the results coming from DOFS-
instrumented RC structures. Table 3.1 not only displays the subject of each experimental campaign but also
highlights in different colors which content will be displayed in the sub-chapter on DOFS-instrumented bare rebars
(in red) and which in the sub-chapter on DOFS-instrumented RC structures (in blue).
Table 3.1. Detailing of the subject of each experimental campaign and color binding of the produced results to the subsequent
chapters i.e., red for DOFS-instrumented bare rebars and blue for DOFS-instrumented RC structures
Experimental
Campaign Tested specimen Test setup
1
DOFS-instrumented rebars Tested in tension
Tested in bending (cantilever beam)
DOFS-instrumented RC tensile
elements
Tested under concrete shrinkage condition
Tested in tension
2 DOFS-instrumented rebars Tested in bending (fixed end beam)
3 DOFS-instrumented RC beams Tested under four point bending
The following sub-chapters will present the experimental setup and key results of the investigation campaigns.
The reader should keep in mind that the following is just a summary of all the campaign-related content carried out
in the context of the present thesis. The integral version can be read in the Journal Articles published by the author
and reported in Chapter 5.
Chapter 3.1 Adhesives performance for DOFS-instrumented bare rebars
The present sub-chapter deals with DOFS-instrumented bare rebars in an attempt to study the performance of
different DOFS deployment technologies.
Starting from the tensile test of the DOFS-instrumented bare rebars [66], the test was aimed at assessing the
potential influence that the presence of a layer of SI or a groove might have on the extrapolated DOFS readings
when no concrete is involved. The DOFS deployment techniques in use were the following ones:
DOFS positioned inside a groove (around 1mm wide and 0.5mm deep) and bonded with cyanoacrylate (CYN)
as visible in Figure 3.1a;
DOFS glued to the rebar’s surface with CYN with a protective layer of silicone (SI) on top, as visible in
Figure 3.1b;
DOFS positioned inside a groove, bonded with CYN and further covered with SI. As visible in Figure 3.1c.

Chapter 3. The Experimental Campaigns | MATTIA FRANCESCO BADO
35
(a)
(b)
(c)
Figure 3.1. Graphical and photographical representation of the three tested bonding techniques (a) positioning of DOFS in
an incised groove and bonding it with CYN (b) bonding it with CYN with an additional protective layer of SI (c) positioning of
the DOFS in a groove, bonding through CYN and protection through SI.
Note that, in Figure 3.1c the groove is hardly visible due to its small size and color similarity with the
background. Additionally, hereafter rebars with an incised groove will be referred to as (w/ groove) whilst the ones
without it as (w/o groove). On a final note the instrumented rebars were Ø20 rebars characterized by a yielding
strength of 𝑓𝑦𝑚 = 533 𝑀𝑃𝑎.
The test consisted in placing the rebars in a Universal Testing Machine (UTM), as in Figure 3.2, two times. Both
times three load cycles were performed, each reaching a third of the yielding load (the bars were intended to be
used later to form RC tensile elements, thus could not be plastically deformed at this stage). The first time the rebar
was tensioned with such program, the DOFS was simply glued with CYN whilst the second time it was further
covered by a layer of SI.

Chapter 3. The Experimental Campaigns | Mattia Francesco Bado
36
Figure 3.2. Test setup for the Universal Testing Machine (UTM)-assisted tensile test on a bare rebar
The performed measurements were later compared in an attempt to spot any potential difference caused by the
extra layer. These, obviously, need to be larger than the slight but expected difference induced by the impossibility
of repeating the same exact clamping conditions. The tested rebars were two, one w/ groove and one w/o groove
with the express purpose of comparing their results to study the influence of the groove. Note that an extensometer
gauge was additionally positioned for comparative purposes.
Figure 3.3 plots the strain measurements performed by the DOFS and by the extensometers connected to the two
rebars w/ groove and w/o groove. As visible both graphs include two pair of readings, one (in blue) representative
of the strains recorded by the DOFS glued with CYN and the other (in red) representative of the strains recorded by
the same DOFS glued with CYN and covered with SI.
A good agreement is present between the DOFS strain curves of both graphs (their difference is of averagely
15με) indicative of the small influence that a layer of SI exercises on the tensile readings of a bare bar. Such
agreement outshines the ones of the classic extensometer. Moreover, for the case of the bar w/ groove, the
extensometer even fails to detect that the zeroing of the applied load at the test’s end whilst DOFS actually does.
The extensometer’s lower readings quality is definitely a function of how/where the tool is attached on the rebar
compared to its transversal ribs but, then again, it is an uncertainty that is entirely surpassed by DOFS. Figure 3.4
plots in more detail the strain reading differences of the two rebars when SI is present and when it is not. As the
differences between the readings performed in the presence and absence of SI do not surpass 15 με in either bar (an
amount possibly induced simply by a variation of the grip position), it can be safely stated that in tension the
presence of SI does not influence the strain readings and thus it is safe to apply it for further protection of the fiber.

Chapter 3. The Experimental Campaigns | MATTIA FRANCESCO BADO
37
Figure 3.3. DOFS and extensometer output readings of the tensile test
Figure 3.4. Bar w/ groove and w/o groove’s strain reading differences when DOFS + cyanoacrylate (CYN) are or are not
covered by silicone (SI)

Chapter 3. The Experimental Campaigns | Mattia Francesco Bado
38
For the extensometer, instead, the reading variations are expectedly higher for both bars suggesting, once again,
the higher reliability of DOFS. Finally, as can be seen in Figure 3.3, the presence of a groove also does not seem to
alter the strain readings suggesting that it too, in tension, can be inserted as an extra protection for the fiber.
These results suggest that neither the addition of an extra protective layer of SI nor the positioning of the DOFS
inside a groove incised along a rebar influences the DOFS strain readings when the rebar is bare and tested in
tension. Therefore, if the testing of the same rebars embedded in concrete prisms (RC tensile elements) displays
reading alterations, they can safely be attributed to the concrete surrounding the instrumented rebar and in particular
to its friction and clamping of the DOFS. A complete description of the tests and results obtained can be found in
Chapter 5.3.
The second test [66] saw the testing of DOFS-instrumented rebars under cantilever beam conditions. This setup
allowed to investigate the performance of the DOFS deployment technology whenever a strain gradient is present
along the rebar. The test is achieved by clamping one extremity of the rebars and applying on the opposite one (at
a fixed distance) a 20 kg load (see Figure 3.5) in order to create a bending stress and a clearly distinguishable strain
profile.
Figure 3.5 Test setup for the DOFS-instrumented rebar under cantilever beam conditions
Once again, this process is done twice in order to monitor the instrumented rebars strains with a CYN-bonded
DOFS and later a CYN+SI bonded DOFS. Figure 3.6 plots the DOFS strain measured in absence (in blue) and in
presence of a SI protection layer for both bars w/and w/o groove. Note that, due to the difference of DOFS bonding
length in the two rebars, an illustration of the bars is inserted in both plots in order to help the reader better
comprehend the shape of strain profiles.

Chapter 3. The Experimental Campaigns | MATTIA FRANCESCO BADO
39
Figure 3.6. Strain profiles of the rebars (w/and w/o groove) under bending and the difference of values w/and w/o SI.
It should be kept in mind that the initial segment of the graph, oscillating around the value of 0 με, is simply
denoting the strains inside the un-bonded and loose section of the DOFS. Only once the first DOFS section of the
fiber is bonded, then the profile jumps upwards reporting the rebar’s highest strain. Once again, the presence of
silicone is hardly perceptible, as confirmed by Figure 3.6’s bottom graph, leading to quasi-identical strain profiles.
Once again, the largest recorded strain measurement difference between SI covered bars and not is around 15 με
for both rebars. The presence of the groove too, hardly influences the DOFS readings. Indeed, the difference
between the rebar w/and w/o groove is around 10 με thus completely justifying the use of a groove for warranting
extra protection to the DOFS.
Once again it can be concluded that neither the addition of an extra protective layer of SI nor the positioning of
the DOFS inside a groove incised along a rebar influences the DOFS strain readings when the rebar is bare and
tested in bending.
Finally, moving on to the DOFS-instrumented bare rebars tested in bending under fixed beam conditions [54],
the experiment saw the loading of seven parallel S500 steel reinforcement Ø20 bars (see Figure 3.7) with their
extremities welded to two C shaped steel beams (assuming a fixed beam behavior). A complete description of the
tests and results obtained can be found in Chapter 5.2.

Chapter 3. The Experimental Campaigns | Mattia Francesco Bado
40
Figure 3.7. DOFS-instrumented bare rebars tested in bending under fixed beam conditions test setup: (a) three-
dimensional specimen detailing with vertical DOFS representation (b) three-dimensional rebar representation showing the
position of the DOFS relatively to the incised grooves and (c) a picture of the specimen during the load application phase
Six of the rebars were instrumented with a single 5.21 m long DOFS (Bars 1–6) and one is instrumented with
strain gauges for comparison purposes (Bar 7). To instrument multiple bars with the same DOFS, the fiber had some
segments bonded to the lower face of each bar (providing strain measurements and drawn in red in Figure 2) and
others that functioned merely as bridges between the first ones (these do not yield any useful strain measurements,
drawn in blue). The test surveyed the DOFS performance for different bonding conditions, rebar sections and
loading speed. Indeed, two kinds of adhesives were used to bond the DOFS to the bars. CYN for Bar 2 and Bar 5;
silicone for Bar 3 and Bar 6; CYN with an extra SI layer on top for Bar 1 and Bar 4. Furthermore, Bars 4, 5, 6 were
incised along their upper face to locally reduce their sectional area in order to simulate different transmission lengths
(lt as per the fib Model Code 2010 or the Euro Code 2’s lpt) occurring in the proximity of cracks inside RC specimens.
The experimented rebars presented incisions with steep or inclined/smooth edges (as represented in Figure 3.7) to
simulate wider or smaller transmission lengths. The bars were loaded simultaneously in their mid-span with
different speeds and with two impact loads (loads applied in the fraction of a second).
The DOFS extracted strain diagrams are represented in Figure 3.8 for three increasing load levels.
(a)
(b)
(c)

Chapter 3. The Experimental Campaigns | MATTIA FRANCESCO BADO
41
Figure 3.8. DOFS strain profiles at specific time and global load instances along the test.
The graph represents the strain distribution along the whole fiber at specific instances and specific global load
values. Each of the graphs’ six visible tensile peaks represents the strains in each of the six bars that are DOFS-
instrumented. Note that on both sides of each tensile peak are compressive measurements that do not represent the
entirety of the compressive portion of the bars’ strain state as the DOFS is not glued all the way to the supports.
Finally, the strain-less horizontal segments between the compressive segments are the above-mentioned sectors of
the DOFS that act as bridges between the segments bonded to the bars.
Whilst a certain degree of unevenness between the strain distribution of the various rebars is present, a clear
similarity can be found among all the profiles. Figure 3.9 overlaps the strain profiles obtained from the DOFS
segments bonded to each rebar for a global load of 30.0 kN in addition to the singular strain readings provided by
Bar 7’s strain gauges. The similarity among Figure 3.9’s profiles is evident (except for the local increase in strain
in the location of the incisions) along with the good correspondence between the measurements of the strain gauges
and the DOFS. This conclusion demonstrates the validity of DOFS as a single sensor without the need of inserting
additional ones to compare the measurements against. Strain gauge 2 seems to be the only one reporting incorrect
values, probably due to a slight damage occurred during the positioning process. This embodies one more advantage
of the DOFS. Indeed, differently than with the strain gauges, the fiber does not require the separate fixing of every
single sensing point. The correct bonding of the fiber ensures the reading capacity of each of its point.
The above paragraphs studied the performance of the deployment adhesives in the presence of small strain
gradients. Figure 3.10, instead, compares the DOFS strain profile of Bars 4, 5, 6 (after having equalized their
maximum strains) where steeper strain gradients were simulated by means of the above mentioned incisions.
-3000
-2000
-1000
0
1000
2000
3000
4000
5000
6000
0,0 1,0 2,0 3,0 4,0 5,0
Str
ains
(με)
Fiber coordinate (m)
Test time=3889 s; Global load=43.8 kN
Test time=3089 s; Global load=30.0 kN
Test time=2015 s; Global load=10.0 kN
Bar
1
Bar
2
Bar
3
Bar
4
Bar
5
Bar
6

Chapter 3. The Experimental Campaigns | Mattia Francesco Bado
42
Figure 3.9. Comparison between the DOFS-measured strain profiles of the segments bonded to each rebar for a global
load value of 30.0 kN
Figure 3.10. Comparison between the DOFS-measured strain profile segments bonded to Bars 4, 5, 6 for a global load
value of 30.0 kN.
Note that Bar 5 and Bar 6 shared the incision layout (see Figure 3.7) whilst Bar 4 shared it in only in half of its
length (left half of Figure 3.10). It can be observed that all three strain graphs are in very good agreement in their
linear sections and in the mid-span. Additionally, Bar 5 and Bar 6 are in full agreement in Incision 2, in slightly less
but still reasonably good agreement around Incision 1 (their difference is of roughly 130με) and in disagreement in
Incision 3 (their difference is of roughly 400με). Also noteworthy is that Bar 5 and Bar 6, despite providing different
strain values, have a similar curve profiles around Incision 3 i.e., a “strain bump” is present. In the case of the DOFS
deployment including both CYN and SI, one would think that, being DOFS bonded with cyanoacrylate, it would
be this adhesive alone governing the strain lag behavior. Then again, the present experiment seems to indicate
SG1
SG2
SG3
SG4
SG5
-1700
-700
300
1300
2300
3300
0,00 0,08 0,15 0,23 0,30 0,38 0,45 0,53
Str
ain (
με)
DOFS section glued to the bars (m)
Bar 6
Bar 5
Bar 4
Bar 3
Bar 2
Bar 1
Strain Gauges
-1500
-500
500
1500
2500
3500
4500
0,03 0,11 0,18 0,26 0,33 0,41 0,48 0,56
Str
ain (
με)
DOFS coordinate (m)
Bar 6
Bar 5
Bar 4
Incision 1
Incision 2Incision 3
(CYN+SI)
(CYN)
(SI)

Chapter 3. The Experimental Campaigns | MATTIA FRANCESCO BADO
43
otherwise. Indeed, most of the above listed points can be explained by the presence of shear lag accompanying the
inclusion of SI i.e., the adhesive with the smaller Elastic Modulus.
Consequently, when the rebars deform, the fiber does not deform in an equivalent manner because of a relevant
amount of strain-redistribution allowed by silicone. This leads to a slight redistribution of the strains among the
neighboring DOFS sections thus reducing the stresses in Incision 3 and transforming the strain peak to a lesser and
wider “strain bump”. In the case of Bar 6, a similar behavior can be found. In particular, in Incisions 1 and 3 (not
in 2, though) the strains magnitude is slightly inferior whenever SI is present in addition to the strain peaks to be
less pronounced. This result could be interpreted with the following analogy. The silicone, despite being external
to the DOFS/CYN/rebar system, behaves similarly to the textile reinforcement being bonded to the surface a wall
or at the bottom of a beam i.e., absorbing some of the stresses and reducing the deformation. Whilst it does not
reduce the deformation of the rebar it relaxes some of stresses carried by the contiguous DOFS/CYN system.
On a final note, some SRAs occurred in the test (see Figure 3.8) despite the absence of concrete but only beyond
a specific moment in the test coinciding with the strain threshold of roughly 4000 με (see Figure 3.11).
Figure 3.11. DOFS-measured strains along time over the whole span of the fiber bonded to the rebars with white spots
present wherever the specific measurement is an SRA
The appearance of SRAs beyond 4000 με may suggest the existence of a strain threshold beyond which
anomalies are consistently more susceptible to be triggered. Whilst this is an interesting topic for future research it
is out of the scope of the present research considering that 4000 με is a deformation value well beyond the one
expected inside steel or concrete in the serviceability conditions of RC structures.
The main conclusions of the present chapter can be summarized as follows. The DOFS strain measurements
sampled from instrumented bare rebars strongly coincide with the ones sampled by means of other strain monitoring
tools such as extensometer and strain gauges, both in tension and in bending. Furthermore, no adhesive-induced
shear lag was found in the presence of small strain gradients no matter if the adhesives were characterized by large

Chapter 3. The Experimental Campaigns | Mattia Francesco Bado
44
or small stiffness. Oppositely, in the presence of larger strain gradient, the extracted DOFS strain profiles had clear
evidence of adhesive-induced strain lag in accordance with the shear deformability of the adhesive.
Chapter 3.2 Adhesives performance for DOFS-instrumented rebars embedded in RC
structures
The present sub-chapter deals with DOFS deployments inside RC structures. In particular, it is aimed at studying
which DOFS deployment technique using coating-less fiber optics reduces to the minimum amount possible the
SRAs-related disruption and studying whether the high strain gradient shear lag phenomenon is a relevant and
disruptive phenomenon. The author studied different loading scenarios during which the strain monitoring was
strictly performed by means of embedded DOFS:
Concrete shrinkage-induced compressive stresses transmitted to the rebars embedded in RC tensile elements
(henceforth referred to as RC tie);
Tensile tests of RC ties;
Bending tests of RC beams.
Each of these will be separately dealt in its own subchapter.
Chapter 3.2.1 Concrete-shrinkage induced compression of DOFS-instrumented rebars
The tested RC specimens were RC tensile members. This kind of element is often used to illustrate cracking,
deformation and bond behavior of RC structures thanks to its simplicity and reasonably good representation of the
distribution of internal forces and strains in the tensile zone of RC structures. As such, it was used to develop an in
depth study on the post-shrinkage residual performance of concrete along with the study of the DOFS deployment
techniques. Whilst the study of the post-shrinkage performance of RC structures is out of the scope of the present
thesis, it can be integrally read together with a complete description of the tests and results in the author’s Cement
and Concrete Composites article [67] reported in Chapter 5.4. Here only the results focusing on the deployment
techniques will be discussed.
In the present experimental campaign, the rebars of the RC ties were subjected to concrete shrinkage-induced
compression and their resulting strain profiles were monitored by means of DOFS bonded longitudinally to them.
The tested specimens in are henceforward collected in three groups, Group 1 to 3 to distinguish the separate
instances in which they were produced. Furthermore, each specimen will be referred to by means of a code of which
the first pair of digits will be indicative of its cross-sectional dimensions (in cm) and the second of the diameter of
the embedded rebar (in mm). Specimen 10D12, for example, is characterized by a 10x10cm cross section with a
12mm diameter rebar embedded inside it. The geometrical features of all the tested specimens are reported in Table

Chapter 3. The Experimental Campaigns | MATTIA FRANCESCO BADO
45
3.2 together with indications of how DOFS was deployed in each. More details on the deployment techniques are
instead provided in Figure 3.12.
Table 3.2. Geometrical features of the tested RC ties, the deployed DOFS and the DOFS-rebar bonding techniques
Group 1 (G1) Group 2 (G2) Group 3 (G3)
Specimen code 10D12 8D8 12D12 12D16 10D16
Cross section [cm] 10x10 8x8 12x12 12x12 10x10
Bar diameter [mm] 12 8 12 16 16
N. of specimens 1 1 1 1 3
Monitored time [days] 28 6 28
Specimen geometry [cm]
(a) (b) (c) (d)
Figure 3.12. Different manners of bonding the DOFS to the rebars: (a) simply positioning the DOFS in the concavity
created by the longitudinal ridge (after removing the mill-scale and degreasing the area with acetone) and gluing them with
cyanoacrylate adhesive; (b) bonded like in (a) with the addition of a protective layer of a one-component water-proof oxygen-
free silicone rubber; (c) positioning the DOFS in a 1.5x1.0mm superficially incised groove before proceeding to its gluing by
means of cyanoacrylate adhesive; (d) positioning of the thick DOFS inside a 2.5x2.5mm superficially incised groove before
proceeding to its gluing by means of epoxy adhesive (the protective function is provided by the polyamide fiber coating).
Illustration not to scale.

Chapter 3. The Experimental Campaigns | Mattia Francesco Bado
46
Note that the same acronym as above are used (CYN and SI) in addition to EPX which stands for Epoxy adhesive
with which a different kind of DOFS was bonded to the rebars pertaining to group G3. Effectively, the G3 specimens
were monitored with two different kinds of DOFS; a thin and a thickly coated one for comparison purposes. A
picture of the two kinds of fibers together with an illustration of their layering is provided in Figure 3.13.
Figure 3.13. The two different kinds of DOFS cables used in the present experimental campaign
On the test setup, after casting and demolding the specimens (1 day later), G1 and G2 were kept cured at a
controlled temperature of averagely 24°C and 59% of relative air humidity whilst G3 was kept at a temperature of
averagely 20°C and 35% of relative air humidity. G1 and G3 were continuously monitored for a 28 days time span
(as reported in Table 3.2). G2, instead, was only monitored during the first 6 days, thus it was only used for short-
term shrinkage monitoring. Furthermore, for the monitoring of G2, a single monitoring channel was connected to
each DOFS in an alternating manner. Oppositely, for G3, four monitoring channels were available, thus the three
thin and the single thick fibers were monitored in a continuous and simultaneous fashion.
The analysis of the DOFS strain profiles was be developed for two distinct frameworks. The first dealt with
short-term shrinkage and was intended to show what was the tensile state of the constitutive materials just a few
days after pouring. As a matter of fact, in practice, tight deadlines may lead to short drying times (3-4 days for high-
rise buildings) before the young concrete is loaded again. The second framework, instead, dealt with the standard-
term time span of 28 days.
Figure 3.14 represents the DOFS strain profiles of the case study specimens during five instances along the
duration of the short term shrinkage monitoring (2h, 24h, 33h, 54h, 129h). Note that the DOFS coordinates reporting
the strains inside those rebar segments embedded inside concrete are indicated in Figure 3.14 with a grey
background.

Chapter 3. The Experimental Campaigns | MATTIA FRANCESCO BADO
47
Figure 3.14. DOFS sampled strain profiles at 5 instances during the short-term shrinkage in all six RC ties
Note that in Figure 3.14’s last two frames the results of the three 10D16 specimens (extracted by means of the
thin and thick DOFS) were averaged for simplicity’s sake. Furthermore, despite one would expect the curves
pertaining to G2 after 2h to be in tension, the strain monitoring of those specimens started from a certain
compression value (approximately -80με). This was due a pre-existent (with respect to the moment that DOFS were
glued to the rebar, corresponding to the 0 strain state) rebar thermal contraction attributable to the external winter
environment in which the casting of the RC ties was performed.
Just outside of the concrete prisms, DOFS are briefly glued to the bare rebar (for example between 0.40m and
0.53m of 10D12) before being completely loose. Generally, the strains pertaining to loose fiber segments recorded
strains oscillating around 0με with some slight variations due to the free movement of the fiber (for example between

Chapter 3. The Experimental Campaigns | Mattia Francesco Bado
48
0.00m and 0.40m of 10D12). Unfortunately, member 8D8 was successfully monitored in just the first half of its
length as its second one (dashed lines) is dominated by SRAs in the form of large, unrealistic and thus unreliable
strain peaks. However, the mid-section of its largest segment was not affected by such SRAs and provided reliable
data on the member’s maximum concrete shrinkage-induced strains.
The sum of these results gives a clear picture on what is the standard shape of an increasingly compressed rebar
embedded inside shrinking concrete. Overall it can be assumed that the edges of a member are averagely less
compressed than its central portion as the stresses of the rebar tend to accumulate from the edges of the member
inwards in addition to the inferior steel/concrete bond conditions of the former. Indeed, in the opposite extremities
of the RC specimens, a certain amount of slip (and bond stresses) is present on the concrete-steel interface, leading
to an inferior concrete shrinkage restraint and, in return, to inferior compressive strains in the steel (see Figure 3.14).
These regions are defined as transmission zones and stretch inwards for a specific transmission length lt. Between
these zones a condition of perfect bond is usually assumed [68,69] leading to higher restraint and higher rebar
strains. As a consequence of the perfect bond in the central zone, the strain rate here is zero (the bond stresses too)
leading to an ideally flat profile. This is the case in Figure 3.14, in particular for the profiles of specimens with
longer central zones (10D12 and 10D16).
Moving on to the long-term monitoring, Figure 3.15 displays the strains inside the three 10D16 members as
sampled by the thin and thick DOFS. Figure 3.15’s thick fiber profiles include some data gaps indicative of SRAs
or data erroneously left out by DOFS. Notwithstanding the profiles and its trends are still clear and thus the author’s
decision of integrally plotting the actual raw data instead of an interpolated one. What is also noticeable is the
smoothness of the measurements reported by the thick fiber compared to their more rugged and somewhat
anomalistic thin fiber counterpart. Figure 3.15’s strain profiles are not only similar to each other (testament of the
quality of the test and of the performance of the two types of DOFS) but also to their short-term counterpart and,
geometrically-wise, to the profiles of member 10D12.
In an attempt to grasp the performance differences between the thin and thick fibers and compare their results to
the ones of member 10D12, Figure 3.16 plots the mid-section strains of the RC ties along with an average of all the
six 10D16 readings. As visible, the strains measured by the thin DOFS of 10D16 are very consistent among each
other with a maximal difference of 5με after 672 hours. The thick DOFS strain measurements are less consistent
(maximal difference of 15με after 672 hours) but still close together. Whilst the plots of the two kinds of fiber report
simultaneous strain variations along time, their uniformity (initially strong) slowly degrades with time reaching a
maximal difference of 44με at 672 hours. Different hypotheses could explain such difference, among which
different shrinkage ratios of the different faces of the members or the relaxation of the thick DOFS coating.
Unfortunately, none of them successfully elucidate the reason for the degradation. Further research on this issue is
warranted. Despite the slight degradation with time, the correlation between the measurements performed by the
thin and thick fiber is still quite close.

Chapter 3. The Experimental Campaigns | MATTIA FRANCESCO BADO
49
Figure 3.15. Strains inside the three 10D16 specimens as sample by both thin and thick DOFS
Figure 3.16. The mid-section strains of the RC ties as measured by both thin and thick DOFS embedded inside members
10D12 and 10D16

Chapter 3. The Experimental Campaigns | Mattia Francesco Bado
50
This last result displays the possibility of actually using thickly coated DOFS with small shear lag but with a
greater DOFS protection against friction and clamping.
Finally, as per the short-term shortening, it is clear that both 10D12 and 10D16 members stage a similar pattern
of strain development. Despite such, their difference (up to 100με at 672 hours) is evident and can be attributed
mainly to the constitutive materials and drying conditions.
Moving on to the assessment of which thin DOFS deployment technique leads to least amount of SRAs, the
selected identification method was the Geometrical Threshold Method (GTM) according to the which, the SRA
label is applied to every reading that does not satisfy the condition in Equation 3.1.
|𝜀𝑠𝑘 − 𝜀𝑠,𝑘−1| < 𝑝 (3.1)
Where 𝜀𝑠𝑘 is the steel strain measured in a specific DOFS section 𝑘, 𝜀𝑠,𝑘−1 is the strain value measured in the
DOFS section previous to 𝑘 and 𝑝 is a sensitivity parameter according to which the user can dictate how strictly the
SRA label can be attributed to any particular DOFS strain. If to assume 𝑝 = 25με, all strain measurements reported
by DOFS that would differ of more than 25με from the previous one would be considered anomalistic. Note that
the DOFS strain readings missing from the outset (see Figure 3.15) are also considered anomalistic. The subjective
choice over the value p should mirror the desired accuracy of the analysis, extension of the monitored specimen and
tolerance of SRA-related interferences. Now, considering all the strain readings performed in a single DOFS
coordinate along the entire duration of the test, the ratio between the number of these readings that can be labeled
as SRAs (i.e., that do not satisfy Equation 3.1) over the total provides a “percentage of anomalistic readings”. This
extracted value offers a clear indication of the overall reliability of the measurements performed in a single DOFS
coordinate. If to expand the calculation of the “% of anomalistic readings” to all the DOFS coordinates monitoring
a single specimen, conclusions can be drawn on the capacity of the adopted bonding technique to prevent the advent
of SRAs. Figure 3.17 collects the results of such analysis per every tested specimen. Figure 3.18a, instead,
catalogues the data of Figure 3.17 according to the employed bonding technology in order to draw general
conclusions on their performance.
Figure 3.18a not only reports the percentage of anomalistic strain readings over the total performed ones but also
averages them in order to give an idea of the overall performance of each bonding technique. Figure 3.18b, instead,
provides a general idea of the variation of the number of SRAs as a function of the selected SRA sensitivity
parameter p. At first sight the most performant technique seems to be the use of strictly CYN with no extra
protection. Yet, three things should be considered when dealing with such result. The first is the very limited
extension of the segment that was instrumented with such technique, secondly its limited application (just one case)
and finally the large variance of the results of such test (as is the case for Incision+CYN). These aspects render any
observation on the performance of strictly CYN quite inconclusive. Differently so, it can be stated with certainty
the superiority of the CYN+SI method over the Incision+CYN (in line with the findings of other authors [60]).

Chapter 3. The Experimental Campaigns | MATTIA FRANCESCO BADO
51
Figure 3.17. Total percentage of anomalistic readings for every tested specimen
(a) (b)
Figure 3.18. (a) Percentage of anomalistic readings per bonding technology and (b) average percentage of anomalistic
readings per different value of sensitivity parameter p
The latter, being the main conclusion extractable from the present section, suggests the importance of extra
protection of the thin DOFS. An extra protection that is not entirely provided by only positioning the DOFS incised
a groove incised on the surface of the rebar.

Chapter 3. The Experimental Campaigns | Mattia Francesco Bado
52
In conclusion of the present sub-chapter, when it comes to the DOFS/rebar bonding technique embedded inside
shrinking concrete the combination of cyanoacrylate and silicone consistently provided readings with the least
number of Strain Reading Anomalies, effectively qualifying itself as the most reliable technique.
Chapter 3.2.2 Tensile tests of DOFS-instrumented rebars embedded inside RC ties
The experimental campaign presented in the current chapter studied different DOFS-rebar bonding and
protection techniques for the embedment of DOFS inside RC ties. Their geometrical features were designed with
two goals in mind, namely studying the performance of DOFS bonding techniques whenever the concrete remains
whole and when it cracks. In order to produce these opposite scenarios, some RC ties were characterized by
longitudinal lengths inferior and superior, respectively, to the theoretical mean crack spacing (referred to as srm in
the fib Model Code 2010). An illustration of the resulting members can be visualized in Figure 3.19a.
Figure 3.19. Test setup: (a) illustration of the geometry of the tested RC ties (b) the specimens during the tensile tests (c)
the employed DOFS-rebar bonding technologies.
The present chapter will only be displaying the key results of the current experimental campaign instead of their
entirety. These can be found in their integral format in Bado et al. [66], annexed in Chapter 5.3. The geometrical
features of the tested RC ties whose results will be shown herein can be visualized in Table 3.3.

Chapter 3. The Experimental Campaigns | MATTIA FRANCESCO BADO
53
Table 3.3. Geometrical features of the tested RC ties
Specimen code Cross sectional
dimensions b [mm]
Longitudinal
length L [mm]
Embedded rebar
diameter [mm]
15D20_24 150x150 240 20
15D20_27 150x150 270 20
8D16 80x80 600 16
10D16 100x100 600 16
Note that some specimens are quite short. This geometrical peculiarity was the base of a study, reported in Bado
et al. [69], on the influence of the longitudinal length of a RC element on the evolution of the bond stresses and slip
present in the concrete-steel interface when subjected to tension.
The specimens were subjected to tensile load by means of a Universal Testing Machine (see Figure 3.19b). The
loading program was a displacement-controlled monotonic tensile load increased at a speed of 1.5 mm/min until
the rebar yielding. The rebars were instrumented with DOFS by means of different techniques as illustrated in
Figure 3.19c. Note, that these are the same as the previous sub-chapters (see Figure 3.12 a-c) thus please refer to
for further information on such deployment techniques
The first key result was provided by member 15D20_27 whose DOFS was deployed with a combination of
groove + CYN. The test was intended to substantiate whether the mere presence of the groove could guarantee
sufficient protection to the DOFS without requiring an extra protective layer. Figure 3.20 displays the extracted
strain profiles.
Figure 3.20. DOFS strain profiles extracted from member 15D20_27 with the fiber bonded by means of groove + CYN

Chapter 3. The Experimental Campaigns | Mattia Francesco Bado
54
As expected, in those sections embedded inside concrete, its friction against the unprotected DOFS led to the
appearance of multiple SRAs in the profile, drastically disrupting its interpretation. This results suggests the
inadequacy of the groove + CYN bonding technique. It should be mentioned, though, that a possible influencing
parameter could be the actual depth of the groove (quite shallow in the present test i.e., 0.5mm)
Moving on to members 15D20_24, Figure 3.21 displays its DOFS extracted strain profiles.
Figure 3.21. DOFS strain profiles extracted from faces A and B of member 15D20_24
These were sampled on the opposite faces of the rebar, the first of which (henceforth referred to as Face A) used
CYN and SI whilst the opposite (Face B) added a groove. Note that the grooves were not as long as the rebars
themselves (see the RC tie illustration of both Figure 3.20 and Figure 3.21). This last feature allowed to check, on
a single face, the DOFS reading performance of two separate bonding techniques i.e., with and without a groove.
In Figure 3.21 it can be observed that the measurements performed in those rebar sections that did not include a
groove were characterized by larger amount of measurement noise than the ones sampled in the presence of a
groove. The noise magnitude seemingly increased with the load. Along with higher signal noise levels, the strain
profiles coming from Face A also included a larger amount of SRAs, attributable to the lack of a protective groove.
Notably, during the monitoring of 15D20_24, the two face of the rebar provided differently shaped plots. In
particular, Face A’s profile inside the concrete, lost the central pointy tip (expected in RC tie tests) in favor of a
more curvilinear shape. Such difference can be attributed to a non-overlookable bending of the RC tie during the
test, induced by a lack of straightness of the bar itself. Whilst this issue could be accounted for with a bending
compensation study, the effect of such bending on the DOFS (or on the adhesives bonding it) is unknown and
deserving of further studies. A possible such effect could have been the additional stretching that the bending-

Chapter 3. The Experimental Campaigns | MATTIA FRANCESCO BADO
55
induced-tension of the concrete communicated to the adhesives (especially on the very deformable silicone) and
thus to the fiber. This is in line with other researchers’ results [54,70] that suggest a certain “strain relaxing” and
”strain redistributing” influence of the silicone when it is used as a DOFS protecting material. Unfortunately, this
phenomenon strongly influences the recommendability of the present bonding technique for this particular use.
Moving on to the cracking members, Figure 3.22 displays the DOFS and DIC outputs of members 10D16 and
8D16 where, just like before, Faces A used CYN + SI to bond the DOFS whilst Face B added a groove to the mix.
Figure 3.22. 10D16 (left) and 8D16’s (right) DIC and DOFS outputs; The DOFS strain profiles are reported for Face A and
Face B of both members, in each of which DOFS is deployed with different bond technologies
In Figure 3.22, despite a relevant amount of bending, a clear variation of the strain profiles can be noticed in
correspondence to the cracks. These variations took the form of single or double pointed peaks whose axes coincide
with the cracks displayed in the DIC. Indeed, as observed numerous times in literature [38], DOFS can efficiently
detect and locate the formation of cracks inside RC structures. As observable, the measurement noise is inferior
whenever the groove + CYN + SI deployment technique is used compared to just CYN + SI. Additionally, the

Chapter 3. The Experimental Campaigns | Mattia Francesco Bado
56
former technique leads to an inferior number of SRAs. Yet, 10D16 displayed a consistent amount of SRAs in both
faces, demonstrating that even the combination of groove + CYN + SI is not completely fail-proof.
Moving on to the assessment of the SRA resistance of each deployment technique, Figure 3.23 summarizes the
percentage of anomalistic readings similarly to what was performed in the previous chapter’s Figure 3.18a. In
particular, Figure 3.23 shows a clear advantage of the groove + CYN + SI technique as it averagely welcomes a
distinctly smaller amount of SRAs compared to the other two.
Figure 3.23. Total amount of anomalistic readings grouped per bonding technique used.
The main conclusions extracted from the current sub-chapter were as follows:
None of the studied bonding techniques could completely guarantee the removal of all SRAs. Yet, the
combination of a longitudinally incised groove + CYN + SI was the bonding technique that led to the smallest
amount of SRAs thus preserving the readability and reliability of the strain data;
An unexpected phenomenon, possibly connected to the under-performance of the above bonding technique,
caused an alteration of the DOFS strain readings whenever the fiber was in the presence of extra bending-
induced tension (smoothened strain profiles as in Figure 3.21, Face A);
Despite its superior performance compared with other bonding techniques, the combination of groove + CYN
+ SI suffered gravely from the above issue and thus cannot be referred to as an ideal DOFS-rebar bonding
technique but simply as the most performant among the studied ones;
Further research is then required on substituting SI with an equally protective adhesive that does not suffer
as much from shear deformation, thus leaving the transfer of the strains from the surface to the DOFS
unaltered.

Chapter 3. The Experimental Campaigns | MATTIA FRANCESCO BADO
57
Chapter 3.2.3 Testing of DOFS-instrumented rebars embedded inside RC beams
The third and last experimental campaign on DOFS-instrumented rebars embedded inside RC structures was
carried out on three large-scale RC beams. These were subjected to two load cycles under four-point bending in
order to test the adequacy of robust DOFS, deployed in a multi-layer configuration, for the identification of crack
formation and location as well as to determine beam deflections and the width of all detected cracks. As customary
at this point the research, the present sub-chapter will mainly focus on the aspects connected to study of the
performance of the DOFS deployment technologies leaving it up to reader the choice of reading on the more
structural-related results in Berrocal et al. [71]. Furthermore, note that this article will not be reported in Chapter 5
as the present thesis’ author was not the main researcher but rather a collaborator and co-author.
The case study beams had a total length of 3000 mm and a rectangular cross-section of 200×250 mm. Each beam
was reinforced with three ∅16 mm rebar at the bottom and two ∅10 mm at the top. Moreover, six ∅8 mm closed-
loop stirrups equally spaced at 200 mm were placed on either side of the beams. All reinforcement was made of
normal ductility carbon-steel (B500B). Plastic spacers were placed between the stirrups and the bottom and lateral
sides of the form to ensure a clear concrete cover of 25 mm. The ends of the bottom bars were bent upwards to
improve the anchorage and to create a safe way out for the thin DOFS. The geometry and reinforcement layout of
the beams is presented in Figure 3.24.
A concrete mix with a water-to-cement ratio (w/c) of 0.45 was used to cast all the beams. The mix included a
sulphate resistant Portland cement with low C3A content and moderate heat development.
Figure 3.24. Geometry and reinforcement layout of the beam specimens (all measurements in mm).
Moreover, the mix was designed to be self-compacting in order to remove the need of compaction and vibration,
thereby minimising the risk of accidentally damaging some of the embedded DOFS. The mix proportions are given
in Table 3.4.

Chapter 3. The Experimental Campaigns | Mattia Francesco Bado
58
Table 3.4. Concrete mix proportions, in kg/m3
Component Dosage
Cement (CEM I 42.5N SR3 MH/LA) 395
Limestone filler (Limus 40) 115
Fine aggregate (sand 0/4) 458
Fine aggregate (sand 0/8) 517
Coarse aggregate (crushed 4/8) 75
Coarse aggregate (crushed 8/16) 675
Effective water 169.9
Superplasticizer – MasterGlenium 51/18 7.3
Retarder – MasterSet R401 0.77
After casting, the beams were stored for 15 days in an indoor climate (20 ± 2 ºC and 60 ± 10% RH) covered with
a polyethylene sheet to reduce moisture evaporation until testing. The concrete compressive strength at 28 days was
68.2 MPa (CoV = 5.6%) based on tests performed in accordance with EN 12390-3:2003 [72] on three 150 mm
cubes.
The same two types of fiber optic cable displayed in Figure 3.13 were used in this study. The thin DOFS were
bonded directly onto the steel bars at the concavity created by the longitudinal ridge using cyanoacrylate adhesive
after removing the mill-scale and degreasing the area with acetone. Before embedding the instrumented rebar in the
concrete, a protective layer of a one-component water-proof oxygen-free silicone rubber was also applied on the
bonded DOFS (as in Figure 3.12b). For the robust DOFS were installed either supported along a longitudinal rebar,
bridging the stirrups or resting on the formwork using electric tape to fix them in place. The loading setup including
the DOFS configuration is schematically illustrated in Figure 3.25. The Optical Distributed Sensor Interrogator
(ODiSI) 6000 series from Luna Inc. [73] was used as interrogation unit. In all tests, the largest available spatial
resolution between measuring points provided by the interrogator was chosen, namely 2.65 mm, whereas the sample
rate was set at 1Hz. Note that DIC was also used on one of the lateral sides of the beams in order to measure the
full-field deformation and surface strains.
The strain profiles for two different load levels measured by the thin and robust DOFS for beam 2 are presented
in Figure 3.26a and Figure 3.26b, respectively. The comparison of both figures immediately reveals clear
differences in the strain output of the two DOFS. The measurements acquired by the robust DOFS feature a
continuous strain profile with smooth slope changes and distinguishable strain peaks indicating the position where
bending cracks intersect the optical fiber cable. Despite the location of the crack-induced peaks can still be identified
in Figure 3.26b, the strain measurements performed with the thin DOFS are irregular, with larger strain variations
between peaks and valleys and affected by the presence of SRAs.

Chapter 3. The Experimental Campaigns | MATTIA FRANCESCO BADO
59
Figure 3.25. Loading setup and DOFS installation configuration for the RC beam specimens
Figure 3.26. Comparison of distributed strain profiles obtained by DOFS embedded in a RC beam at two different load
levels for (a) robust DOFS and (b) thin DOFS.

Chapter 3. The Experimental Campaigns | Mattia Francesco Bado
60
Conversely, robust DOFS are less prone to suffer from SRAs since the protective cladding prevents the local
clamping of the fibers upon cracking as well as other local effects that might impair the proper measuring of the
fiber. On the other hand, the intermediate layers comprising the protective cladding produce an attenuation effect
on the strain profiles leading to a reduction of the strain peaks and strains smearing over a longer length.
Furthermore, it may be also observed that the differences between the two fibers are lower in the part of the
beam corresponding to the coordinates between 900 and 1800 mm, as in this part the uniform bending derives on a
uniform profile of strain (i.e., with small strain gradients), only disturbed by the presence of the cracks.
Interestingly, it can be observed that the magnitude of the strain profiles obtained by the two DOFS does not
differ markedly, a difference that might be even overlooked if we consider that the measurements correspond to
two different rebars.
This point is crucial and can be considered as the main conclusions of the current sub-chapter. Indeed, it
demonstrates that the use of DOFS coated with appropriate materials and thickness levels could minimize the shear
lag issue. If in the future such issue would be minimized even further, a situation could be reached where the
advantage of deploying a fiber that does not require tedious deployment technologies surpasses the disadvantage of
the coating layers-induced shear lag inaccuracies. This would mean reaching a “technological breakeven point” of
some sort.

Chapter 3. The Experimental Campaigns | MATTIA FRANCESCO BADO
61

Chapter 4. Post-Processing Algorithms | Mattia Francesco Bado
62
Chapter 4. Post-Processing Algorithms
As foreshadowed in Chapter 1.3 the issues of SRAs hampering the outputs of DOFS-powered monitoring
campaign is tackled in this thesis with a preventive approach aimed at reducing the number of SRAs appearing in
the measurement output and a corrective one. The preventive measures have been explained in chapter 3, the
corrective ones, instead, are the topic of the present chapter.
On a basic level, in order to identify all the anomalies in a specific DOFS readings output, the trend of every
sensing DOFS section should be studied and each single anomalistic peak manually corrected and/or removed. Such
a tedious analysis is not actually viable in many projects considering factors such as large dimensions of the data
sets (due to wide extensions of monitoring surfaces) or long monitoring periods, time-limitations, financial
constraints, lack of qualified personnel and more. These issues can be easily tackled with the contribution of
computing technologies or, in particular, algorithms that automatize this process to the maximum extent possible.
The author developed several post-processing methods aimed at achieving just that. Similarly to the previous
chapters, the present will also report in a concise manner the key findings relative to this topic, referring interested
readers to the integral form of the present research to the Journal article Bado et al. [32] reported in Chapter 5.5.
The newly developed post-processing algorithms construction will be detailed later and their performance
exhibited by applying them to the outputs of two different DOFS-monitored deployments. The first is a structural
laboratory experimental campaign while the second is a real-life application in a metro tunnel in Barcelona (Spain).
In both cases the monitoring was performed by means of an ODiSI-A (Optical Distributed Sensor Interrogator)
OBR (Optical Backscatter Reflectometer) manufactured by LUNA Technologies [74]. The ODiSI-A uses swept-
wavelength coherent interferometry to measure temperature and strains. It offers the possibility to test a structure
wholly or in the chosen points of interest with user-configurable sensing resolution and gauge lengths.
The laboratory experiment saw the DOFS instrumenting of two RC ties named 12x12_D12.01 and
12x12_D12.02. These were characterized by a Ø12 rebar embedded in 120x120 mm cross-section concrete prisms
with longitudinal dimensions displayed in Figure 4.1a. Whilst member 12x12_D12.01 is constituted of a single
prism, 12x12_D12.02 is constituted of two concrete prisms that act completely independently due to the tensile
nature of the test itself. Thus, by means of the resulting uniform distribution of stresses along the rebar during such
test, this layout allows the simultaneous but separate study of two RC ties.

Chapter 4. Post-Processing Algorithms | MATTIA FRANCESCO BADO
63
(a) (b) (c)
Figure 4.1. Experimental campaign on RC ties: (a) an illustration of their geometry with dimensions in cm (b) DOFS-
extracted strains profiles versus DOFS coordinates and (c) versus time
The DOFS is bonded to the steel rebars in order to constantly monitor its strains when subjected to monotonic
tensile load through a Universal Testing Machine (UTM) at a constant loading speed of 0.1mm/min. The 1.2m long
fibers measured the steel’s strains with a spatial resolution of 5mm and 7.5mm and were bonded to them with CYN
adhesive only after it was positioned in a longitudinal groove that was previously incised along the bar’s rib. As
visible in Figure 4.1b-c the DOFS strain output is characterized by evident SRAs which need addressing for a proper
interpretation of the results.
The in-situ DOFS deployment consisted in the monitoring of the strains in Barcelona’s L9 Metro Sagrera TAV-
Gorg metro tunnels’ inner surface whose structural performance could have been potentially affected by a
residential building being constructed above it at ground level and slightly covering its layout. COTCA S.A.
proposed a DOFS deployment in order to perform a continuous follow-up of the tunnel’s strain and tensional states
during the excavation and construction works happening 14.40m above the tunnel’s keystone [17].
The monitoring scheme involved the installation of a 50m long DOFS bonded to the concrete lining’s inner
surface (see Figure 4.2) by means of epoxy resin after a previous superficial preparation of the concrete lining that
consisted of, firstly, refining the surface’s existing irregularities with sandpaper and, later, applying rubbing alcohol
and special products to avoid grease, air humidity and direct moisture. Figure 4.3a presents the OBR strain
measurement of a single fiber coordinate at different instances during the construction period (from October 2018
to May 2019) in the DOFS coordinates interval between 26 and 40m (for clarity purpose this segment was chosen
as it is the most representative of the various kinds of SRA), as well as the delimitation of the structurally
differentiable segments that the fiber covers, which, helps understand why some areas present a higher amount of
anomalies than others.

Chapter 4. Post-Processing Algorithms | Mattia Francesco Bado
64
(b)
(c)
(b)
(a) (c)
Figure 4.2. (a) Illustration of the tunnel DOFS installation (b) picture of the DOFS coordinates ~45.50m and (c) picture of
DOFS coordinates from ~20-26m
As shown in figures 4.2 b and c, the DOFS deployment had to surpass several obstacles (rail track, cables, sharp
edges…) whose altered deployment method may have led to potential incorrect measurements in these localized
areas. Figure 4.3b expands on Figure 4.3a by combining in a 3D graph the un-processed DOFS strain measurements
collected in an exemplary 40-days span. This figure summarizes the above explained SRAs as it clearly displays
how HF-SRAs, after their formation, remain present for the rest of the monitoring campaign and how HL-SRAs
quickly appear and disappear. Furthermore, both anomalies can be found in both tension and compression hence
the strain peaks can be identified on both sides of the graph.
Now, the objective of a post-processing algorithm is to treat the raw strain measurements and obtain a new set
of data that is more reliable and as free as possible of any SRAs-induced distortion. Its core process is based on the
following logical sequence.
1. 𝐴𝑢𝑡𝑜𝑚𝑎𝑡𝑖𝑐 𝑑𝑒𝑡𝑒𝑐𝑡𝑖𝑜𝑛 𝑜𝑓 𝑆𝑅𝐴𝑠 → 2. 𝑅𝑒𝑚𝑜𝑣𝑎𝑙 𝑜𝑓 𝑆𝑅𝐴𝑠 → 3. 𝑆𝑢𝑏𝑠𝑡𝑖𝑡𝑢𝑡𝑖𝑜𝑛 𝑏𝑦 𝑖𝑛𝑡𝑒𝑟𝑝𝑜𝑙𝑎𝑡𝑖𝑜𝑛

Chapter 4. Post-Processing Algorithms | MATTIA FRANCESCO BADO
65
(a)
(b)
Figure 4.3. (a) Multiple and (b) all tunnel strain measurements along the monitoring duration
On the grounds of such sequence three SRA cleansing algorithms were created:
Spectral Shift Quality (SSQ)-based method
Geometrical Threshold Method (GTM)
Polynomial Interpolation Comparison Method (PICM)
Starting from the former, besides strain and temperature readings, the ODiSI-A OBR allows for the computation
of the Spectral Shift Quality (SSQ) of each reading. The SSQ is described by the provider [74], as a measure of the

Chapter 4. Post-Processing Algorithms | Mattia Francesco Bado
66
reliability of the corresponding readings by measuring the level of the correlation between the measurement and
baseline reflected spectra as in Equation 4.1 below.
𝑆𝑆𝑄 =𝑚𝑎𝑥 (𝑈𝑗(𝑣) ∗ 𝑈𝑗(𝑣 − ∆𝑣𝑗))
∑ 𝑈𝑗(𝑣)2 (4.1)
where:
𝑈𝑗(𝑣) is the baseline spectrum for a given segment of data
𝑈𝑗(𝑣 − ∆𝑣𝑗) is the measurement spectrum under a strain or temperature variation
∗ is the cross-correlation operator
In other words, it is a function that determines the quality/reliability of a strain reading by correlating the original
baseline measurement and the measurement spectra normalized by the maximum expected value. According to its
definition, the SSQ value remains between 0 and 1, where 1 translates into a perfect correlation and 0 into an
uncorrelated value. The provider states that the data sets are accurate if the SSQ is higher than 0.15 meanwhile, if
it is lower, it is very likely that the read strain or temperature has exceeded the measurable range. In this
investigation, the SSQ function is proposed and assessed as a tool for SRAs identification by establishing a
minimum SSQ value, or SSQ threshold, with which one can invalidate a percentage of SRAs. The minimum/optimal
SSQ threshold that allows for the deletion of the highest percentage of SRAs while producing a physically
interpretable set of data is a case by case and trial and error matter. Its only constraint is that it has to be above 0.15
(as recommended by the ODiSI software manufacturer). Figure 4.4 depicts the algorithm required to perform an
SSQ data post/processing.
Moving on to the second method, the Geometrical Threshold Method, in order to identify the SRAs their own
definition could be directly used. Indeed, being these strain readings sudden and overly large, they imply a
substantial variation between two consecutive readings. On the ground of such, a maximum strain variation (GT
threshold) can be defined and used to identify the appearance of an SRA. This method will be henceforth referred
to as Geometrical Threshold Method (GTM).
This SRAs identification process based on strain ‘jumps’ can be applied both temporally and spatially but is
unable to detect nor correct HF-SRA since, after the first anomalistic reading, another very similar in magnitude
follows so whilst the first might be detected as an SRA, all the following ones will not. Thus this method can only
be considered as an HL-SRAs detection method. Figure 4.4b depicts the algorithm required to perform a GTM data
post/processing.
The third and last post-processing algorithm, the Polynomial Interpolation Comparison Method is a routine based
on the very basic concept of what is an error.

Chapter 4. Post-Processing Algorithms | MATTIA FRANCESCO BADO
67
(a) (b)
Figure 4.4. SRAs detection and removal (a) with an SSQ tool (b) according to the GTM method
The core idea is based on the development of an approximated polynomial curve of the case study DOFS
section’s ε-t profile which encompasses the maximum number of reliable strain readings of the profile (effectively
representing its trend). The polynomial degree can vary to provide improved fitting even though, generally speaking,
it should be neither too low (which would lead to non-representative tendencies), nor too high (because the trend
would in return be affected by the concentrated anomalies). As example, Figure 4.5 below represents different
DOFS sections of member 12x12_D12.02 with the original data (thin blue) including clear anomalies, the selected
polynomial curve in red and finally the corrected data in green. Note that, when the strain matrix includes SRAs of
small magnitude, it is possible to automatically generate polynomial fitting curve as in Figure 4.5 for the
experimental member 12x12_D12.02. Unfortunately, this is not always the case. In those rarer occasion that the
strain matrix includes SRAs of high magnitude, developing a trend line would be meaningless since the amount of
SRAs would affect its profile preventing it from reflecting the real behavior of the section (as in Figure 4.6a). In
this case a straightforward solution would be to proceed manually to defining and plotting the trendline curve against
which the DOFS strains will be compared to (see Figure 4.6b and c). Whilst this could be considered as a short-
coming of the current version of the PICM algorithm, the reader should keep in mind that such computational
program could be integrated with an iterative procedure that would fully automate the process.

Chapter 4. Post-Processing Algorithms | Mattia Francesco Bado
68
Figure 4.5. Strain measurements along time of anomalistic DOFS sections versus their polynomial curve approximations
(in red)
(a) (b) (c)
Figure 4.6. Strain measurements along time of anomalistic DOFS sections versus their polynomial curve approximations
(in red) of member 12x12_D12.02 in DOFS sections (a) 0.8075 (b) 0.8700 (c) 0.9300
Its creation, though, would be greatly time-consuming and, considering the small frequency of un-computable
trendlines compared to automatically computable ones, out of the scope of the present thesis. The DOFS strain
curve is compared to the polynomial approximation curve resulting in a certain amount of error per measurement.
Following the definition of a maximal error between the two curves’ points, whenever the error is higher than such
established limit, the reading is considered as an SRA. This is achieved through a basic function that checks the
difference between the reading and its corresponding expected value (belonging to the ε-t curve approximation) as
in Equation 4.2:

Chapter 4. Post-Processing Algorithms | MATTIA FRANCESCO BADO
69
𝐸𝑟𝑟𝑜𝑟𝑖 = |𝜀𝐷𝑂𝐹𝑆,𝑖 − 𝜀𝐴𝑃𝑅𝑂𝑋,𝑖|
𝑖𝑓 𝐸𝑟𝑟𝑜𝑟𝑖 > 𝐸𝑟𝑟𝑜𝑟𝑚𝑎𝑥 ⇒ 𝜀𝐷𝑂𝐹𝑆,𝑖 = 𝑆𝑅𝐴
𝑖𝑓 𝐸𝑟𝑟𝑜𝑟𝑖 ≤ 𝐸𝑟𝑟𝑜𝑟𝑚𝑎𝑥 ⇒ 𝜀𝐷𝑂𝐹𝑆,𝑖 ≠ 𝑆𝑅𝐴
(4.2)
The choice of the threshold value 𝐸𝑟𝑟𝑜𝑟𝑚𝑎𝑥 has to be, as always, a result of an in-depth study of the measured
tendencies and peaks. Figure 4.7 depicts the algorithm required to perform a PICM data post/processing.
Figure 4.7. SRAs detection algorithm with a PICM tool
In the following the above explained post-processing algorithms are used to clear out the SRAs from the above
explained case studies. A comparison amongst such methods is presented by putting side to side strictly the output
of the analysis that performed best (in case of SSQ and GTM the thresholds that provided the highest amount of
SRAs correction) for each post-processing method. Figure 4.8 summarizes such by collecting the plots whose
parameters provide the best fit to the reliable points of the original DOFS extracted strain profiles for member
12x12_D12.01 and 12x12_D12.02. Their respective SSQ thresholds are 0.35 and 0.25 whilst their selected GTs’ is
50με for both.
Figure 4.8 shows how for all diagrams removing the HL-SRAs provides a relatively trust-worthy diagram but
for member 12x12_D12.01, the only method that not only takes advantage of all the reliable points to plot the graph
but also extracts a somewhat symmetrical profile is the PICM method.
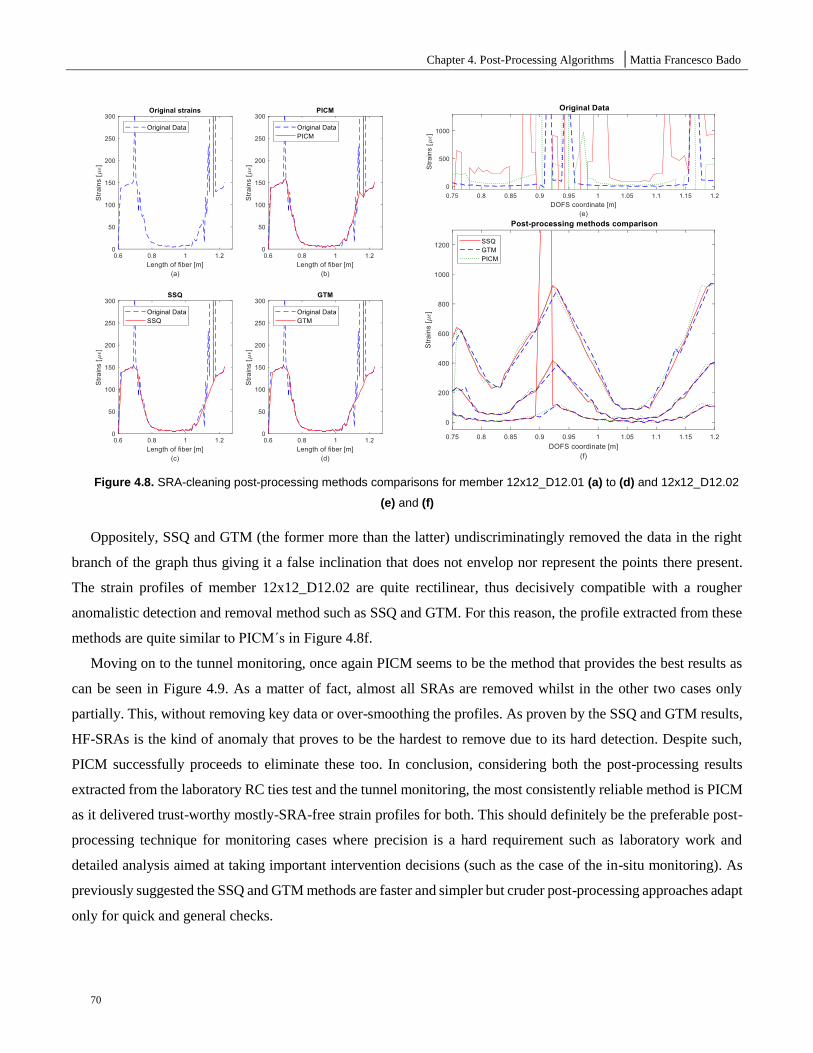
Chapter 4. Post-Processing Algorithms | Mattia Francesco Bado
70
Figure 4.8. SRA-cleaning post-processing methods comparisons for member 12x12_D12.01 (a) to (d) and 12x12_D12.02
(e) and (f)
Oppositely, SSQ and GTM (the former more than the latter) undiscriminatingly removed the data in the right
branch of the graph thus giving it a false inclination that does not envelop nor represent the points there present.
The strain profiles of member 12x12_D12.02 are quite rectilinear, thus decisively compatible with a rougher
anomalistic detection and removal method such as SSQ and GTM. For this reason, the profile extracted from these
methods are quite similar to PICM´s in Figure 4.8f.
Moving on to the tunnel monitoring, once again PICM seems to be the method that provides the best results as
can be seen in Figure 4.9. As a matter of fact, almost all SRAs are removed whilst in the other two cases only
partially. This, without removing key data or over-smoothing the profiles. As proven by the SSQ and GTM results,
HF-SRAs is the kind of anomaly that proves to be the hardest to remove due to its hard detection. Despite such,
PICM successfully proceeds to eliminate these too. In conclusion, considering both the post-processing results
extracted from the laboratory RC ties test and the tunnel monitoring, the most consistently reliable method is PICM
as it delivered trust-worthy mostly-SRA-free strain profiles for both. This should definitely be the preferable post-
processing technique for monitoring cases where precision is a hard requirement such as laboratory work and
detailed analysis aimed at taking important intervention decisions (such as the case of the in-situ monitoring). As
previously suggested the SSQ and GTM methods are faster and simpler but cruder post-processing approaches adapt
only for quick and general checks.

Chapter 4. Post-Processing Algorithms | MATTIA FRANCESCO BADO
71
12x12_12.01 12x12_D12.02
(a) (b)
(c) (d)
Figure 4.9. (a) Original DOFS-extracted strains with SRA-cleansing by means of different post-processing methods: (b)
SSQ, (c) GTM and (d) PICM

Chapter 4. Post-Processing Algorithms | Mattia Francesco Bado
72

References | MATTIA FRANCESCO BADO
73
References
1. Housner, G. W., Bergman, L. A., Caughey, T. K., Chassiakos, A. G., Claus, R. O., Masri, S. F., Skelton, R.
E., Soong, T. T., Spencer, B. F., Yao, J.T.P. Structural control: Past, present and future. J. Eng. Mech. 1997,
123, 897–971, doi:10.1061/(ASCE)0733-9399(1997)123:9(897).
2. Cawley, P. Structural health monitoring : Closing the gap between research and industrial deployment.
Struct. Heal. Monit. 2018, 17, 1225–1244, doi:10.1177/1475921717750047.
3. Barrias, A.; Casas, J.R.; Villalba, S. A Review of Distributed Optical Fiber Sensors for Civil Engineering
Applications. Sensors 2016, 16, 748, doi:10.3390/s16050748.
4. Baker, M. Sensors power next-generation SHM Available online:
https://www.sensorland.com/HowPage131.html (Accessed on 05/05/2020).
5. Glišić, B.; Hubbell, D.; Sigurdardottir, D.H.; Yao, Y. Damage detection and characterization using long-
gauge and distributed fiber optic sensors. Opt. Eng. 2013, 52, 087101, doi:10.1117/1.OE.52.8.087101.
6. Li, H.; Li, D.; Song, G. Recent applications of fiber optic sensors to health monitoring in civil engineering.
Eng. Struct. 2004, 26, 1647–1657, doi:10.1016/j.engstruct.2004.05.018.
7. InformationGatekeepers 2019 Distributed and Single Point Fiber Optic Sensing Systems Forecast Available
online: http://www.igigroup.com/st/pages/photonic_sensor_report.html (accessed on Oct 20, 2020).
8. Bao, X.; Chen, L. Recent Progress in Distributed Fiber Optic Sensors. Sensors 2012, 12, 8601–8639,
doi:10.3390/s120708601.
9. Ferdinand, P. The Evolution of Optical Fiber Sensors Technologies During the 35 Last Years and Their
Applications in Structure Health Monitoring. In Proceedings of the EWSHM-7th European Workshop on
Structural Health Monitoring; 2014.
10. Tennyson, R. C., Mufti, A. A., Rizkalla, S., Tadros, G., & Benmokrane, B. Structural health monitoring of
innovative bridges in Canada with fiber optic sensors. Smart Mater. Struct. 2001, 10, 560.
11. Whelan, M. P., Albrecht, D., & Capsoni, A. Remote structural monitoring of the Cathedral of Como using
an optical fiber Bragg sensor system. In Proceedings of the Smart Structures and Materials and
Nondestructive Evaluation for Health Monitoring and Diagnostics; San Diego, USA, 2002; Vol. 4694, pp.
242–252.
12. Rodríguez Gutiérrez, G. Monitorización de estructuras de hormigón mediante sensores de fibra óptica
distribuida, Universitat Politècnica de Catalunya, 2017.
13. Barrias, A. Development of optical fibre distributed sensing for the structural health monitoring of bridges
and large scale structures . Thesis by publications Directed by :, Universitat Politècnica de Catalunya, 2018.
14. Gomez i Esteve, J. SHM with DOFS of the TMB L-9 tunnel affected by nearby building construction,
Universitat Politècnica de Catalunya, 2018.
15. Barrias, A.; Rodriguez, G.; Casas, J.R.; Villalba, S. Application of distributed optical fiber sensors for the
health monitoring of two real structures in Barcelona. Struct. Infrastruct. Eng. 2018, 14, 967–985,
doi:10.1080/15732479.2018.1438479.
16. Thévenaz, L.; Facchini, M.; Fellay, A.; Robert, P.; Inaudi, D.; Dardel, B. Monitoring of large structure using
distributed Brillouin fibre sensing. In Proceedings of the Proceedings of the Optical Fiber Sensors OFS 13
Conference; 1999.
17. Gómez, J.; Casas, J.R.; Villalba, S. Structural Health Monitoring with Distributed Optical Fiber Sensors of

References | Mattia Francesco Bado
74
tunnel lining affected by nearby construction activity. Autom. Constr. 2020, 117, 103261,
doi:10.1016/j.autcon.2020.103261.
18. Glisic, B.; Yao, Y. Fiber optic method for health assessment of pipelines subjected to earthquake-induced
ground movement. Struct. Heal. Monit. 2012, 11, 696–711, doi:10.1177/1475921712455683.
19. Zeni, L.; Picarelli, L.; Avolio, B.; Coscetta, A.; Papa, R.; Zeni, G.; Di Maio, C.; Vassallo, R.; Minardo, A.
Brillouin optical time-domain analysis for geotechnical monitoring. J. Rock Mech. Geotech. Eng. 2015, 7,
458–462, doi:10.1016/j.jrmge.2015.01.008.
20. Cantarero, A. Raman Scattering Applied to Materials Science. Procedia Mater. Sci. 2015, 9, 113–122,
doi:10.1016/j.mspro.2015.04.014.
21. Gillibert, R.; Huang, J.Q.; Zhang, Y.; Fu, W.L.; de la Chapelle, M.L. Food quality control by Surface
Enhanced Raman Scattering1. TrAC - Trends Anal. Chem. 2018, 105, 185–190,
doi:10.1016/j.trac.2018.05.009.
22. Gillibert, R.; Huang, J.Q.; Zhang, Y.; Fu, W.L.; Lamy de la Chapelle, M. Explosive detection by Surface
Enhanced Raman Scattering. TrAC - Trends Anal. Chem. 2018, 105, 166–172,
doi:10.1016/j.trac.2018.03.018.
23. Rodríguez, G.; Casas, J.R.; Villaba, S. Cracking assessment in concrete structures by distributed optical fi
ber. Smart Mater. Struct. 24, 35005, doi:10.1088/0964-1726/24/3/035005.
24. Barrias, A.; Casas, J.R.; Villalba, S. Fatigue performance of distributed optical fiber sensors in reinforced
concrete elements. Constr. Build. Mater. 2019, 218, 214–223, doi:10.1016/j.conbuildmat.2019.05.072.
25. Fédération Internationale du Béton – International Federation for Structural Concrete (fib) fib Model Code
for concrete structures 2010; Lausanne, Switzerland, 2013; ISBN 9783433030615.
26. European Committee for Standardization CEN BS EN 1992-1-1:2004 - Design of concrete structures.
General rules and rules for buildings; 2004;
27. Wang, H.; Xiang, P.; Jiang, L. Strain transfer theory of industrialized optical fiber-based sensors in civil
engineering: A review on measurement accuracy, design and calibration. Sensors Actuators, A Phys. 2019,
285, 414–426, doi:10.1016/j.sna.2018.11.019.
28. Her, S.C.; Huang, C.Y. Effect of coating on the strain transfer of optical fiber sensors. Sensors 2011, 11,
6926–6941, doi:10.3390/s110706926.
29. Alj, I.; Quiertant, M.; Khadour, A.; Grando, Q.; Terrade, B.; Renaud, J.C.; Benzarti, K. Experimental and
numerical investigation on the strain response of distributed optical fiber sensors bonded to concrete:
Influence of the adhesive stiffness on crack monitoring performance. Sensors 2020, 20, 1–24,
doi:10.3390/s20185144.
30. Feng, X.; Zhou, J.; Sun, C.; Zhang, X.; Ansari, F. Theoretical and Experimental Investigations into Crack
Detection with BOTDR-Distributed Fiber Optic Sensors. J. Eng. Mech. 2013, 139, 1797–1807,
doi:10.1061/(asce)em.1943-7889.0000622.
31. Henault, J. M., Salin, J., Moreau, G., Quiertant, M., Taillade, F., Benzarti, K., & Delepine-Lesoille, S.
Analysis of the strain transfer mechanism between a truly distributed optical fiber sensor and the surrounding
medium. In Proceedings of the Proceedings of the the 3rd International Conference on Concrete Repair,
Rehabilitation and Retrofitting, ICCRRR 2012; Cape Town, South Africa, 2012; pp. 733–739.
32. Bado, M.F.; Casas, J.R.; Gomez, J. Post-processing algorithms for distributed optical fiber sensing in
structural health monitoring applications. Struct. Heal. Monit. 2020, doi:10.1177/1475921720921559.
33. (ASCE), A.S. of C.E. Infrastructure Report Card; 2021;
34. Regier, R.; Hoult, N.A. Distributed Strain Behavior of a Reinforced Concrete Bridge : Case Study. J. Bridg.
Eng. 2014, 19, 1–9, doi:10.1061/(ASCE)BE.1943-5592.0000637.
35. Moore, M., Phares, B. M., Graybeal, B., Rolander, D., Washer, G., & Wiss, J. Reliability of visual inspection
for highway bridges, volume I; 2001;
36. Glišic, B.; Posenato, D.; Inaudi, D. Integrity monitoring of old steel bridge using fiber optic distributed
sensors based on Brillouin scattering. In Proceedings of the Nondestructive Characterization for Composite
Materials, Aerospace Engineering, Civil Infrastructure, and Homeland Security 2007; San Diego, USA,
2007.
37. Matta, F.; Bastianini, F.; Galati, N.; Casadei, P.; Nanni, A.; Asce, F. Distributed Strain Measurement in Steel

References | MATTIA FRANCESCO BADO
75
Bridge with Fiber Optic Sensors : Validation through Diagnostic Load Test. J. Perform. Constr. Facil. 2008,
22, 264–273, doi:10.1061/(ASCE)0887-3828(2008)22.
38. Bado, M.F.; Casas, J.R. A review of recent Distributed Optical Fiber Sensors applications for Civil
Engineering Structural Health Monitoring. Sensors 2021, 21, doi:10.3390/s21051818.
39. Webb, G. T., Vardanega, P. J., Hoult, N. A., Fidler, P. R. A., Bennett, P. J., & Middleton, C.R. Analysis of
Fiber-Optic Strain-Monitoring Data from a Prestressed Concrete Bridge. J. Bridg. Eng. 2017, 22, 1–14,
doi:10.1061/(ASCE)BE.1943-5592.0000996.
40. Ye, C.; Butler, L.J.; Elshafie, M.Z.E.B.; Middleton, C.R. Evaluating prestress losses in a prestressed concrete
girder railway bridge using distributed and discrete fibre optic sensors. Constr. Build. Mater. 2020, 247,
118518, doi:10.1016/j.conbuildmat.2020.118518.
41. de Battista, N.; Harvey, R.; Cheal, N. Distributed fibre optic sensor system to measure the progressive axial
shortening of a high-rise building during construction. In Proceedings of the 39th IABSE Symposium -
Engineering the Future; Vancouver, Canada, 2017.
42. de Battista, N., Cheal, N., Harvey, R., & Kechavarzi, C. Monitoring the axial displacement of a high-rise
building under construction using embedded distributed fibre optic sensors. In Proceedings of the 8th
International Conference on Structural Health Monitoring of Intelligent Infrastructure; Brisbane, Australia,
2017.
43. Rabaiotti, C.; Hauswirth, D.; Fischli, F.; Facchini, M. Structural health monitoring of airfield pavements
using distributed fiber-optics sensing. In Proceedings of the 4th Conf. on Smart Monitoring, Assessment and
Rehabilitation of Civil Structures (SMAR 2017); Zürich, Switzerland, 2017.
44. Seo, H. Monitoring of CFA pile test using three dimensional laser scanning and distributed fiber optic
sensors. Opt. Lasers Eng. 2020, 130, 106089, doi:10.1016/j.optlaseng.2020.106089.
45. Kania, J.G.; Sorensen, K.K.; Fellenius, B.H. Application of Distributed Fibre Optic Cables in Piles
Application of Distributed Fibre Optic Cables in Piles. Geotech. Eng. J. SEAGS AGSSEA 2020, 51.
46. Zhang, C.C.; Shi, B.; Gu, K.; Liu, S.P.; Wu, J.H.; Zhang, S.; Zhang, L.; Jiang, H.T.; Wei, G.Q. Vertically
Distributed Sensing of Deformation Using Fiber Optic Sensing. Geophys. Res. Lett. 2018, 45, 11,732-
11,741, doi:10.1029/2018GL080428.
47. Lanciano, C.; Salvini, R. Monitoring of strain and temperature in an open pit using brillouin distributed
optical fiber sensors. Sensors 2020, 20, doi:10.3390/s20071924.
48. Inaudi, D.; Walder, R. Full-Length Tunnel Structural Monitoring. In Proceedings of the Structural Health
Monitoring; Stanford, USA, 2019.
49. Monsberger, C.M.; Lienhart, W.; Kluckner, A. Continuous strain measurements in a shotcrete tunnel lining
using distributed fibre optic sensing. In Proceedings of the 9th European Workshop on Structural Health
Monitoring; Manchester, United Kingdom, 2018; pp. 1–13.
50. Zhang, Z.; Guan, P.; Xu, J.; Wang, B.; Li, H. Horizontal Loading Performance of Offshore Wind Turbine
Pile Foundation Based on DPP-BOTDA. Appl. Sci. 2020, 10, 492.
51. Davis, M.; Hoult, N.A.; Scott, A. Distributed strain sensing to determine the impact of corrosion on bond
performance in reinforced concrete. Constr. Build. Mater. 2016, 114, 481–491,
doi:10.1016/j.conbuildmat.2016.03.205.
52. Davis, M.; Hoult, N.A.; Scott, A. Distributed strain sensing to assess corroded RC beams. Eng. Struct. 2017,
140, 473–482, doi:10.1016/j.engstruct.2017.03.013.
53. Quiertant, M.; Baby, F.; Khadour, A.; Marchand, P.; Toutlemonde, F.; Rivillon, P. Deformation monitoring
of reinforcement bars with a distributed fiber optic sensor for the SHM of reinforced concrete structure.
Instrum. Mes. Metrol. 2013, 13, 131–147, doi:10.3166/i2m.13.1-2.131-147.
54. Bado, M.F.; Casas, J.R.; Barrias, A. Performance of Rayleigh-Based Distributed Optical Fiber Sensors
Bonded to Reinforcing Bars in Bending. Sensors 2018, 23, doi:10.3390/s18093125.
55. Barrias, A.; Casas, J.; Villalba, S. Embedded Distributed Optical Fiber Sensors in Reinforced Concrete
Structures—A Case Study. Sensors 2018, 18, 980, doi:10.3390/s18040980.
56. Regier, R.; Hoult, N.A. Concrete deterioration detection using distributed sensors. Struct. Build. 2015, 168,
118–126.
57. Malek, A.; Scott, A.; Pampanin, S.; Hoult, N.A. Postyield Bond Deterioration and Damage Assessment of

References | Mattia Francesco Bado
76
RC Beams Using Distributed Fiber-Optic Strain Sensing System. J. Struct. Eng. 2019, 145, 1–17,
doi:10.1061/(ASCE)ST.1943-541X.0002286.
58. Sieńko, R.; Zych, M.; Bednarski, Ł.; Howiacki, T. Strain and crack analysis within concrete members using
distributed fibre optic sensors. Struct. Heal. Monit. 2018, 18, 1510–1526, doi:10.1177/1475921718804466.
59. Nurmi, S.; Mauti, G.; Hoult, N.A. Distributed Sensing to Assess the Impact of Support Conditionson Slab
Behavior. In Proceedings of the 39th IABSE Symposium-Engineering the Future; 2017; pp. 1478–1485.
60. Brault, A.; Hoult, N.A. Distributed Reinforcement Strains : Measurement and Application. ACI Struct. J.
2019, 116, doi:10.14359/51714483.
61. Berrocal, C.G.; Fernandez, I.; Rempling, R. Crack monitoring in reinforced concrete beams by distributed
optical fiber Crack monitoring in reinforced concrete beams by distributed optical fiber sensors. Struct.
Infrastruct. Eng. 2020, 17, 124–139, doi:10.1080/15732479.2020.1731558.
62. Michou, A.; Hilaire, A.; Benboudjema, F.; Nahas, G.; Wyniecki, P.; Berthaud, Y. Reinforcement-concrete
bond behavior: Experimentation in drying conditions and meso-scale modeling. Eng. Struct. 2015, 101, 570–
582, doi:10.1016/j.engstruct.2015.07.028.
63. Haefliger, S.; Mata-Falcon, J.; Kaufmann, W. Application of distributed optical measurements to structural
concrete experiments. In Proceedings of the SMAR 2017- Fourth Conference on Smart Monitoring,
Assessment and Regabilitation of Civil Structures; 2017.
64. Bado, M.F.; Kaklauskas, G.; Casas, J.R. Performance of Distributed Optical Fiber Sensors (DOFS) and
Digital Image Correlation (DIC) in the monitoring of RC structures. IOP Conf. Ser. Mater. Sci. Eng. 2019,
615, doi:10.1088/1757-899X/615/1/012101.
65. Bassil, A.; Wang, X.; Chapeleau, X.; Niederleithinger, E.; Abraham, O.; Leduc, D. Distributed fiber optics
sensing and coda wave interferometry techniques for damage monitoring in concrete structures. Sensors
2019, 19, doi:10.3390/s19020356.
66. Bado, M.F.; Casas, J.R.; Dey, A.; Berrocal, C.G. Distributed optical fiber sensing bonding techniques
performance for embedment inside reinforced concrete structures. Sensors 2020, 20,
doi:10.3390/s20205788.
67. Bado, M.F.; Casas, J.R.; Dey, A.; Berrocal, C.G.; Kaklauskas, G.; Fernandez, I.; Rempling, R.
Characterization of concrete shrinkage induced strains in internally-restrained RC structures by Distributed
Optical Fiber Sensing. Cem. Concr. Compos. 2021, 120, doi:10.1016/j.cemconcomp.2021.104058.
68. Kaklauskas, G.; Gribniak, V.; Bacinskas, D.; Vainiunas, P. Shrinkage influence on tension stiffening in
concrete members. Eng. Struct. 2009, 31, 1305–1312, doi:10.1016/j.engstruct.2008.10.007.
69. Bado, M.F.; Casas, J.R.; Kaklauskas, G. Distributed Sensing (DOFS) in Reinforced Concrete members for
reinforcement strain monitoring, crack detection and bond-slip calculation. Eng. Struct. 2021, 226, 111385,
doi:10.1016/j.engstruct.2020.111385.
70. Barrias, A.; Casas, J.R.; Villalba, S. Distributed optical fibre sensors in concrete structures: Performance of
bonding adhesives and influence of spatial resolution. Struct. Control Heal. Monit. 2019, 26, 1–16,
doi:10.1002/stc.2310.
71. Berrocal, C.G.; Fernandez, I.; Bado, M.F.; Casas, J.R.; Rempling, R. Assessment and visualization of
performance indicators of reinforced concrete beams by distributed optical fiber sensing. Struct. Heal. Monit.
2021, doi:10.1177/1475921720984431.
72. EN 12390-3:2009 Testing hardened concrete. Part 3: Compressive strength of test specimens 2009.
73. Luna Innovations Incorporated ODiSI 6000 - Optical Distributed Sensor Interrogators. Available online:
https://lunainc.com/wp-content/uploads/2017/11/LUNA-ODiSI-6000-Data-Sheet.pdf (accessed on
24/08/2020).
74. LUNA Technologies ODiSI-A Optical Distributed Sensor Interrogator (Users Guide).

References | MATTIA FRANCESCO BADO
77

Chapter 5. Published Journal Articles | Mattia Francesco Bado
78
Chapter 5. Published articles
The present chapter reports the journal articles published by the author on the topic of the dissertation. Note that,
inside the article themselves, the numbering of the sections and sub-sections are kept as in the published work.

Chapter 5. Published Journal Articles | MATTIA FRANCESCO BADO
79
Chapter 5.1 Sensors 2021
Bado MF, Casas JR. A Review of Recent Distributed Optical Fiber Sensors Applications for Civil Engineering
Structural Health Monitoring. Sensors. 2021; 21(5):1818. https://doi.org/10.3390/s21051818
A Review of Recent Distributed Optical Fiber Sensors Applications for Civil
Engineering Structural Health Monitoring
Mattia Francesco Bado 1,2,* and Joan R. Casas 1
1 Department of Civil and Environmental Engineering, Technical University of Catalonia (UPC), Jordi Girona 1–3, 08034
Barcelona, Spain; [email protected]
2 Department of Reinforced Concrete Structures and Geotechnical Engineering, Vilnius Gediminas Technical University,
Saulėtekio al. 11, 10221 Vilnius, Lithuania
* Correspondence: [email protected]
Abstract: The present work is a comprehensive collection of recently published research articles on Structural
Health Monitoring (SHM) campaigns performed by means of Distributed Optical Fiber Sensors (DOFS). The latter
are cutting-edge strain, temperature and vibration monitoring tools with a large pool of potential, namely their
minimal intrusiveness, accuracy, ease of deployment and more. Its most state-of-the-art feature, though, is the ability
to perform measurements with very small spatial resolutions (as small as 0.63 mm). This review article intends to
introduce, inform and advise the readers on various DOFS deployment methodologies for the assessment of the
residual ability of a structure to continue serving its intended purpose. By collecting in a single place these recent
efforts, advancements and findings, the authors intend to contribute to the goal of collective growth towards an
efficient SHM. The current work is structured in a manner that allows for the single consultation of any specific
DOFS application field, i.e., laboratory experimentation, the built environment (bridges, buildings, roads, etc.),
geotechnical constructions, tunnels, pipelines and wind turbines. Beforehand, a brief section was constructed around
the recent progress on the study of the strain transfer mechanisms occurring in the multi-layered sensing system
inherent to any DOFS deployment (different kinds of fiber claddings, coatings and bonding adhesives). Finally, a
section is also dedicated to ideas and concepts for those novel DOFS applications which may very well represent
the future of SHM.
Keywords: distributed optical fiber sensors; distributed optical fiber sensors; distributed sensing; distributed
monitoring; DOFS; DFOS; structural health monitoring; SHM; review

Chapter 5. Published Journal Articles | Mattia Francesco Bado
80
1. Preface
The present work reports numerous Distributed Optical Fiber Sensors (DOFS) monitoring campaigns spread over
multiple Structural and Civil Engineering fields. Whilst a sequential reading of the article’s diverse sections may
provide a global point of view on the evolution of DOFS for the Structural Health Monitoring (SHM) panorama,
the authors are intent on also providing the readers with the possibility of skipping directly to the section of interest.
Section 2. Introduction provides a very general overview on the topic of SHM and the importance of the
implementation of DOFS. Before presenting the most recently published DOFS-SHM integrations, Section 3.
DOFS Coatings and Bonding Adhesives: The Strain Transfer Process and the Optimal Bonding Technique tackles
a relevant issue which intrinsically affects any DOFS monitoring. The latter, as foreshadowed by the section’s title,
is the strain transfer process occurring in the multi-layered sensing system that characterizes a bonded DOFS. In
more detail, due to the stiffness diversity of the adhesives, cladding and coating layers that separate a DOFS’ sensing
core from a structural host surface, a certain distortion of the sampled data occurs which, in return, decreases the
reliability of the DOFS measured strain. The authors deemed mandatory reporting some recently published findings
on this crucial and intrinsic limitation before reporting any in-situ DOFS-monitoring campaign.
Finally, the reported DOFS-SHM applications are separated into the following sections:
Section 4. Laboratory Experimental Applications
Section 5. The Built Environment: Buildings, Bridges and Roads
Section 6. Geotechnical Engineering
Section 7. Tunnel
Section 8. Pipes
Section 9. Wind Turbines
Finally, Section 10. An Eye towards the Future introduces the reader to those DOFS-SHM novelties that may
very well become key DOFS applications in the future.
Acknowledging the broadness of the above-listed application fields and the readers’ engineering backgrounds
differences, for the proper understanding of all the DOFS applications, the authors started each section and
subsection with a small introduction aimed at providing a certain degree of contextualization. At the end of each
section, instead, a brief summary will be presented encapsulating the key findings and DOFS deployments tips.
Furthermore, the authors would like to remark that the hereafter reported figures will all be taken from the
referred articles and are, therefore, uniquely the product of their respective writers’ efforts. In line with the concept
of research and its goal of collective growth towards the solution of society’s biggest problems, the figures were
selected with the aim of clarifying the reported DOFS deployment techniques and their outputs in addition to sharing
any particular ingenious technique that other monitoring campaigns might draw inspiration from.

Chapter 5. Published Journal Articles | MATTIA FRANCESCO BADO
81
Finally, the present work situates itself as a spiritual successor to the work developed by Barrias et al. [1] which
studied the DOFS-SHM integrations until 2016, the year of publication. Consequently, the present review article
deals with the publications comprised in the time interval 2017–2020 additionally expanding on previously
overlooked topics.
2. Introduction
As clearly stated by Brownjohn [2], civil infrastructure provides the means for a society to function. The wide range
of applications that Civil Engineering offers includes buildings, bridges, highways, tunnels, power plants, industrial
facilities, geotechnical, hydraulic structures and more. Throughout their service lifetimes, each of these is subjected
to multiple events that deteriorate and compromise their structural integrity thus exposing their future performances
to several risks. In order to avoid the social, economic and environmental costs of their deterioration and/or failure,
civil structures have different safety and durability requirements that need to be met. In order to ensure correct
structural performance and the wellbeing of their users, a series of inspections, monitoring and maintenance
protocols have to be carried out during the structures’ service lifetimes. The effectiveness of these monitoring
methods relies on their ability to rapidly detect alterations of the structure’s performance, allowing for their
identification, characterization and control. This idea is the basis of Structural Health Monitoring (SHM). Indeed,
according to Housner et al. [3], SHM can be understood as the continuous and regular measurement and analysis of
key structural and environmental parameters under operating conditions for the purpose of warning of any early-
stage abnormal structural behaviors.
Yet, as stated by Cawley [4], despite the recently increasing volume of research on SHM, this enormous effort
has yielded only a small number of routine industrial applications. Indeed, still at the present day, the most common
manner of assessing an infrastructure’s ability to carry on with its designed duties is through the intervention of
engineers trained in structural visual inspections [1]. A non-disregardable degree of inaccuracy is therefore
automatically incorporated in these studies due to the differences in the inspectors’ safety condition assessment
backgrounds. Wherever monitoring tools are additionally employed, these usually fall under the category of
“traditional monitoring techniques” such as inclinometers, accelerometers, extensometers, total station surveys, load
cells and GNS-based sensors. By themselves, these can be considered sufficiently reliable since their correct
deployment has been extensively investigated and they are nowadays widely acknowledged, thus ensuring reliable
monitoring and structural assessments. However, as stated in Baker [5], conventional forms of inspection and
monitoring are only as good as their ability to uncover potential issues in an accurate and timely manner. Indeed,
regarding the ability of damage detection, traditional tools present several drawbacks which are, amongst others,
insufficient data management ability, the need for the infrastructure’s service interruption during their deployment,
non-automated real-time measurements and interference risk. The above deficiencies, stacked up with the lack of
reliable, scalable and affordable monitoring solutions and the absence of uniform execution methodologies [6] and

Chapter 5. Published Journal Articles | Mattia Francesco Bado
82
some degree of standardization, are the reason why SHM is not yet implemented as a standard practice in most Civil
Engineering structures.
Modern monitoring technologies are aimed at tackling the above-mentioned limitations thus boosting the
sensors’ precision, automation and data management speed. These include amongst others Optical Fiber Sensors
(OFS), Global Positioning Systems (GPS), radars, Micro Electro Mechanical Systems (MEMS) and Image
Processing Techniques such as Digital Image Correlation (DIC). As a matter of fact, as properly put by Seo [7],
Civil Engineering has recently seen a convergence with various other fields, thus slowly moving towards technology
convergence. The latter is a theory asserting the absence of a clear distinctive line between the products/applications
of different disciplines but rather a co-existence, intersection and reciprocal enhancement between the latter which,
in return, accelerates the overall technological advancement [8]. SMART monitoring is one of these developments
and the use of OFS in Civil Engineering can be considered a quintessential example as it joins Civil Engineering,
Photonics, Materials Engineering and Computer Engineering.
Focusing in particular on OFS, these are dielectric devices used to confine and guide light. They consist of
several layers: fiber core, cladding and, occasionally, an external jacket aimed at providing mechanical resistance
to the fiber (an example is provided in Figure 1).
Figure 1. 3D illustration of an optical fiber cross-section.
The majority of OFS used in sensing applications have silica (SiO2) glass cores and claddings. The refractive
index of the latter is lower than that of the core in order to satisfy the condition of Snell’s law for total internal
reflection and thus confine the propagation of the light along the fiber core only [9]. The jacket is usually made of
polymeric material or nylon and can vary in diametrical size, shape and manufacturing process. Finally, as will be
evident in this article, the external coating can be constituted by numerous kinds of materials, layering, thicknesses
and external textures.
A significant ability of OFS is the ability to measure mechanical and temperature-variation-induced strains along
the fiber length by means of light scattering and back-scattering occurring whenever the photons of the emitted light
interact with the physical medium through which it travels (the fiber’s core itself). When no strain or temperature

Chapter 5. Published Journal Articles | MATTIA FRANCESCO BADO
83
is imposed on the system, light propagates and gets reflected throughout the imperfections with a given signature.
Instead, when strain or temperature values vary, the frequency of the back scattered light is shifted. The measured
strain values are then related to the frequency shift.
As a matter of fact, three different types of light scattering and backscattering may occur in an OFS, namely
Raman, Brillouin and Rayleigh. All hold particular optical features that make one more suitable than the others
relative to the research objectives. Brillouin scattering, thanks to its extended measurement range capability (up to
several kilometers), is the most studied and used OFS system in Civil and Geotechnical Engineering. The Raman
back-scattering, instead, is characterized by a high dependence on temperature but can also be used to extract
physical and chemical information of a material [10] such as food quality [11] or presence of explosive materials
[12]. The third back-scattering phenomenon is Rayleigh. Despite its 70 m sensing range limit, it provides the highest
spatial resolution of the three (even down to 0.63 mm), which is ideal for strain and damage monitoring in the
context of environmentally controlled experimental laboratory investigation.
Whilst multiple sections of the present article could be dedicated to the explanation of the different photonic
working principles of all the commercially available kinds of OFS, this topic has been discussed innumerable times
in almost every OFS application article both new and old. Therefore, the authors believe its insertion would result
in redundancy. In its stead, Table 1 not only summarizes this article’s most commonly used acronyms but also refers
the reader to exhaustive literature on each different kind of OFS photonic working principle (marked with the
symbol * in Table 1).
Table 1. Acronyms used in the present article and literature references.
Acronym Name References
SHM Structural Health Monitoring
RC Reinforced Concrete
DIC Digital Image Correlation
SG Strain Gauges
LVDT Linear Variable Displacement Transformers
SRA Strain Reading Anomalies
DOFS-related
OFS Optical Fiber Sensors [1,13–15]
DOFS Distributed Optical Fiber Sensors [1,13–15]
OTDR Optical Time Domain Reflectometry [1,16,17]
BOTDR* Brillouin Optical Time Domain
Reflectometry [16–18]
BOTDA * Brillouin Optical Time Domain Analysis [19–21]
BOFDA * Brillouin Optical Frequency Domain
Analysis [22]
PPP-BOTDA * Pulse Pre Pump-BOTDA [23–25]
DPP-BOTDA * Differential Pulse Pair-BOTDA [26]

Chapter 5. Published Journal Articles | Mattia Francesco Bado
84
OFDR * Optical Frequency Domain Reflectometry [1]
OBR Optical Backscattered Reflectometer [27]
DAS * Distributed Acoustic Sensing [28,29]
DVS * Distributed Vibration Sensing [28,29]
Φ-OTDR * Phase-OTDR [29,30]
FBG * Fiber Bragg Grating [9,31,32]
* different kinds of OFS.
Table 2, instead, reports a concise summary of the performance of the various distributed sensing techniques
thus providing the reader with an idea of the strengths and weaknesses of each.
Table 2. Performance differences between the various distributed sensing techniques [1].
Sensing
Technology Transducer Type Sensing Range Spatial Resolution
Main Object of
Measurement
Raman OTDR Distributed 1 km–37 km 1 c–17 m Temperature
Brillouin BOTDR Distributed 20–50 km ≈1 m Temperature and
Strains
Brillouin BOTDA Distributed 150–200 km 2 cm (2 km)–2 m
(150 km)
Temperature and
Strains
Rayleigh
OFDR/DAS Distributed 50–70 m ≈1 mm
Temperature,
Strains and
Vibration
FBG Quasi-distributed ≈100 channels 2 mm (Bragg
length)
Temperature and
Strains and
displacement
Finally, for additional reading on the subject, the authors refer the readers to the comprehensive state-of-the-art
reviews on FOS, namely Udd [33], Kersey [34] and Grattan and Sun [35].
OFS sensors have recently improved their performance, drastically increasing their pool of potential. The latter
was immediately picked up and tapped into by the worldwide scientific community as evident from the increasingly
larger number of relative published research articles. Additionally, according to a market survey report conducted
by the Photonic Sensor Consortium and published by Information Gatekeepers [36], the increased OFS popularity
goes hand in hand with the monitored and predicted growth of the whole OFS fiber sensors technological market
(see Figure 2). It is worthy of note that, according to Figure 2, the combined distributed and single point fiber optic
sensor markets are projected to be over USD 1.3 billion in 2023. In this respect, the present work represents an
effort aimed at facilitating the use of OFS for both the present and prospective users of this novel technology.
Now, if to focus strictly on OFS’s application to the Civil and Structural Engineering field, it can easily be
asserted that it has slowly but steadily increased in the past years [1,37].

Chapter 5. Published Journal Articles | MATTIA FRANCESCO BADO
85
Figure 2. Growth of Optical Fiber Sensors (OFS) technological market [36].
As clearly identified by Li et al. [9], its increased popularity for SHM applications can be attributed to the
following OFS features:
They allow for completely distributed monitoring (in the case of DOFS) with monitoring points spaced less
than 1 mm;
Their small diameter and minimal stiffness allow for a very high degree of deployment configuration
complexity, no matter if these imply circumferential surfaces, sharp corners, surface irregularities and more.
It is even possible to embed them inside structural elements with a minimal level of intrusiveness;
Their ease of deployment as can be achieved by simply applying an adhesive over it.
Their monitoring length is very flexible and can vary from halves of millimeter to tens of kilometers;
Intrinsic immunity to electro-magnetic interference;
They are designed with a long life cycle in mind. Indeed, its main component, silica, is highly resistant to
corrosion and can withstand high tensile loading;
Silica core OFS are highly resistant to temperature and can measure temperatures from −200 °C to 800 °C.
The great majority of photonic sensing technology applied to SHM is constituted by discrete sensors such as
Fiber Bragg Gratings (FBG) [9] as these were introduced to the market much earlier than the undoubtedly superior
DOFS. FBG are quasi-distributed optical fiber sensors in which a characteristic wavelength is used to
simultaneously provide its address in the sensor network, and the measurement (temperature and strains) [31]. Their
applications can be dated back as early as 1993, when Intelligent Sensing for Innovative Structures performed fiber

Chapter 5. Published Journal Articles | Mattia Francesco Bado
86
optic deployments on six bridges in Canada [38] or in 2001 when four FBG sensors were installed across, above
and under the primary arch of Como’s Cathedral in order to identify any significant structural deterioration [39]. It
can be easily argued that the discrete sensors’ (such as FBG) most crucial limitation lies in their non-distributed
measurement nature. This shortcoming is quite critical in the context of SHM as it prevents the possibility of
precisely pointing out the location where a potential damage first occurs and prevents the linking of local damage
mechanisms to the global condition of the structure.
The lack of sufficient monitoring points along a fiber deployment (spatial resolution) is an issue entirely
surpassed by DOFS (Figure 3 left). As a matter of fact, the latest model of OFDR Optical Backscatter Reflectometer
(OBR) interrogator machines (such as the one on the right side of Figure 3) is able to monitor strains with a spatial
resolution of 0.63 mm.
The distributed nature of DOFS enables the mapping of temperature, strain and vibration distributions in two or
even three dimensions (achievable with a DOFS mesh deployment) and their identification at any point along a
fiber. Combined, these aspects allow for the painting of a clear picture of the global behavior of a structure rather
than reporting the tensile state of a limited number of points. Figure 3 also displays the hair-like thinness of the fiber
which makes it ideal for un-intrusive deployments. Still, as suggested by Barrias [1], this is still a recent and
developing technology as can be perceived by the relatively scarce number of DOFS applications in SHM projects
published in research articles.
(a) (b)
Figure 3. (a) Distributed OFS (DOFS) fiber and (b) ODiSI-6000 model Optical Backscatter Reflectometer (OBR)
interrogator manufactured by LUNA Technologies.
Despite such, a discrete variety of applications have been performed including bridges, dams, tunnels, pipelines
and slopes. The goal of the present article is to shine a spotlight on the most recent of such DOFS SHM applications
and help the collective growth towards an efficient SHM by collecting in a single place these recent efforts,
advancements and findings. In particular, as mentioned in Section 1, the reported DOFS SHM applications include

Chapter 5. Published Journal Articles | MATTIA FRANCESCO BADO
87
laboratory experimentation, the built environment (bridges, buildings, roads, etc.), geotechnical constructions,
tunnels, pipelines and wind turbines, all performed in the time frame 2017–2020.
3. DOFS Coatings and Bonding Adhesives: The Strain Transfer Process and the Optimal Bonding
Technique
Ideally, the strains measured by a DOFS silica core should be equivalent to the actual strains present in the host
structure on which the former is bonded. If this requirement was fully met then both DOFS structural monitoring
and laboratory structural investigation would simply boil down to analyzing the OBR’s output data, no matter how
minute the object of investigation is or how accurate the measurement requirements are. Unfortunately, this is not
always the case. Indeed, the packaging and the installation of the sensors involves intermediate layers (i.e.,
protective coatings and adhesive layers) whose presence leads to the failure of the complete strain transfer from the
host material to the sensing fiber [19]. Instead, some of the energy is converted to the shear and normal deformations
of the intermediate layers (as well illustrated by Her and Huang [40] in Figure 4) thus leading to strain transfer
errors.
The reader should consider that Figure 4, for the sake of simplicity, only represented a single coating layer
between the fiber core and the adhesive but in numerous applications, the intermediate layers are many more, i.e.,
cladding, reinforcement layers, diverse coatings, jackets, etc. The whole issue is exacerbated in the presence of
strain singularities zones where a high-stress concentration is accumulated over a short length of DOFS, such as
cracks in RC elements or structural discontinuities. Because the optical fiber bridges the cracks irrespective of
whether they are embedded or surface adhered, in order to eliminate this error and guarantee effective
measurements, investigation on the strain transfer mechanism from the substrate material (steel, concrete, etc.) to
the fiber core is required [19,41]. Alj et al. [42], for example, indicated that the strain transfer process depended on
mechanical and geometrical properties of the different intermediate layers, i.e., their elastic modulus, their height
and the initial crack opening. Alj et al. continued reporting that several analytical models had been proposed in the
literature among which the one of Feng et al. [41] who developed a theoretical approach to describe the strain
transfer process in zones containing strain singularities (cracks) and the one of Henault et al. [43] who defined a
Mechanical Transfer Function (MTF) that relates the strain profile along the DOFS core to the strain profile of the
host cracked concrete.
The above analyses become especially relevant when considering the need of adding additional protective layers
around a DOFS core. Indeed, whilst the ideal DOFS would be one with the least and thinnest cladding/coating layer
possible, in practice, considering the challenging environments where the fiber could be deployed, most commercial
DOFS cables include additional coating layers that protect the core against mechanical and chemical damage.
Furthermore, the high-stress concentration transmitted to a DOFS by a crack opening may lead to its premature
failure leading to the loss of data from that instance on.

Chapter 5. Published Journal Articles | Mattia Francesco Bado
88
Figure 4. Free body diagram for the symmetrical section of the optical fiber and the substrates together with their relative
shear transfer (adapted from [40]).
Whenever an experimental investigation requires the maximum precision possible, the shear lag induced by any
host-surface/DOFS-core intermediate layers should be minimal, thus the preferable fiber is a simply cladded non-
coated DOFS. In this case, though, the protective function against external damage falls entirely on the adhesive
layers. Numerous experimental campaigns have been performed in the latest year to assess which is the optimal
adhesive for any specific function, i.e., bonded to a structure’s surface or embedded inside the structure itself bonded
to rebar, for instance.
As can be evinced, the optimal DOFS claddings/coatings and bonding techniques are still elusive concepts and,
therefore, still under heavy investigation. The authors believe in the importance of reporting the recent discoveries
and discussions on the present topic first as it inherently influences every DOFS monitoring campaign henceforth.
Wang et al. [19] recently developed a state-of-the-art review on the strain transfer theory of optical fiber-based
sensors developed for Civil structures. In particular, the article addresses the issues of strain not entirely transferred
from the host material to the sensing fiber, resulting in a portion of strain loss in the transferring path and the Strain
Transfer Theory produced to tackle this issue. Interestingly the strain transfer theory was reported for both
embedded and surface-attached sensors. The authors concluded by mentioning that the Strain Transfer Theory could
be adopted to conduct accurate interpretations of the collected data, to analyze the influence of the installed sensors
on the structural integrity and strength and to improve the design and calibration codes of the sensors for the long-
term, effective and accurate monitoring.

Chapter 5. Published Journal Articles | MATTIA FRANCESCO BADO
89
Bassil et al. [44] studied the above-mentioned strain transfer mechanism and proposed a new analytical model
which assumes the absence of a perfect bond between the components of a multilayer system. Particularly, a general
expression of the crack-induced strain transfer from fractured concrete material to an optical fiber (see Figure 5a
and b) is established and put to the test through wedge splitting tests on concrete specimens instrumented with
multiple embedded and surface-mounted fiber optic cables.
(c)
Figure 5. Crack detection using DOFS techniques: (a) Comparison of the traditional sensors, (b) strain transferring
between layers and (c) the tested cables (adapted from [44]).
Furthermore, the authors summarized the modern-day expertise on DOFS cables:
Different types of optical cables are available on the market;
Some cables are conceived to be embedded inside the structure during construction, whilst others are more
suitable for surface installation;
The cables, constituted of different materials and shapes, lead to a different strain transfer response due to
the shear lag effect in the intermediate layers;
Little information is available on the mechanical properties of the cable and its constituent elements;

Chapter 5. Published Journal Articles | Mattia Francesco Bado
90
Little information is also available on the long-term behavior and performance of these cables.
In response to some of the above lackings, the authors used in their test multiple kinds of OFDR DOFS cables
(see Figure 5c). The experimental results reportedly estimated correctly the crack openings and led to successful
monitoring of the optical cable responses through the strain lag parameter. A final key observation worth reporting
here was the Polyimide-cladded cables’ strain lag parameters λ varying around 260 m−1 whilst the others between
20 m−1 and 60 m−1. This meant that the Polyimide fiber reported crack-induced strain distributions 5 to 15 times
higher than the other tested cables, which allowed for the accurate detection of tiny crack propagations.
Zhang et al. [45] proposed a mechanical model (further validating with experimentation) to study the effects of
multiple closely spaced cracks on the DOFS measurements and the effects of the cable properties (i.e., shear
stiffness between cable and fiber, cable radius, elastic modulus, interface cohesion) on the shape of the DOFS strain
distributions across cracks. The reported spring model was constituted by two layers, namely an inner one
(representing the fiber core and cladding) and an outer one (representing the outer coating, primary layers and a
jacket) with assigned relative stiffness. A noteworthy result was that, by independently varying the stiffnesses in
the spring model, the axial stiffness of the coating layer was reported to have a negligible influence on the shape of
strain distribution. This was the opposite for the coatings shear stiffness and shear parameter.
Alj [46] developed his doctoral thesis in the framework of the ODOBA (Observatory of the durability of
reinforced concrete structures) project launched by IRSN in 2016 in France which was aimed at studying the
concrete pathologies and their consequences for nuclear power plant structures. In particular, the thesis was redacted
with the objective of studying the effectiveness of DOFS technology to detect and monitor concrete pathologies
potentially met in nuclear power plants (Delayed Ettringite Formation, Alkali-Silica Reaction or a combination of
the two). As such, the work also undertook the interpretation of long-term strain measurements provided by OF
sensors in degrading environments.
The above project spawned a research article on the topic of the durability of DOFS [47]. Here, the authors
studied the durability of OFDR DOFS cables for the SHM of Reinforced Concrete (RC) structures through an
experimental campaign based on the accelerated aging of small concrete specimens instrumented with two
embedded optical fiber cables. The first included an external coating made of a soft elastomeric material (olefin-
type elastomer) containing two single-mode OFs and two metal rods for mechanical protection. The second one
included an outer layer, made of polyethylene with six optical fibers (single-mode and multimode) which are wound
around a central rod (reinforcement part of the cable) and embedded in an elastomeric layer. In order to simulate
the effect of alkaline pore solution of the concrete medium, the accelerated aging was achieved immerging the
specimens in an alkaline solution: c(KOH) = 0.5 mol/L + c(NaOH) = 0.1 mol/L, at three different temperatures (20
°C, 40 °C and 60 °C) for three months. Pull-out tests were consequently carried out in order to evaluate the effect
of the accelerated aging on the mechanical response of the cable/concrete interfaces. The results showed that the

Chapter 5. Published Journal Articles | MATTIA FRANCESCO BADO
91
interface between the first cable and the concrete had not been degraded, contrariwise, the second cable’s interface
was damaged and the degradation was emphasized by temperature.
The results of the previous test are a demonstration of the large experimental effort still required by the scientific
community to fully dominate the DOFS-powered SHM monitoring science.
Moving on to the second topic of the present section, specifically the research of the optimal adhesive and
bonding technique for the RC structures instrumentation with non-coated OFDR DOFS. Bado et al. [48] asserted
that despite DOF’s potential for the detection of deformations and cracking in RC structures, in numerous published
DOFS-monitored experimental campaigns, researchers reported the appearance of unrealistic strain readings,
defined as Strain Reading Anomalies (SRAs), which prevented the extraction of reliable strain data. Later, the article
outlined the results obtained through an experimental test aimed at inducing such SRAs in an isolated and controlled
environment in order to isolate and identify the physical cause of their origin. The test consisted of gradually bending
seven steel reinforcement bars with DOFS bonded to their bottom side with different adhesives, namely
cyanoacrylate, silicone, and a combination of the two. Additionally, one of the rebars was instrumented with Strain
Gauges (SG) for comparison purposes. Three of the DOFS instrumented rebars were transversally incised (as visible
in Figure 6) in order to simulate the typical post-cracking strain transmission between concrete and steel These
incisions further had varying steepness degrees in order to simulate different transmission lengths. Finally, different
loading speeds were applied (rapid/impact and slow monotonic one). The results showed the bonding adhesives
having an influence on the DOFS performance but not on the rise of anomalies. Expectedly, considering the
difference between the modulus of elasticity of silicone and cyanoacrylate, the former seemed to delay the
appearance of SRAs to the expense of the strain measurement precision in addition to redistributing the strains along
the fiber. Oppositely, the rigid but fragile nature of the cyanoacrylate reportedly provided the results with superior
precision but at the expense of the adhesive resistance and endurance. The combination of the two provided a hybrid
behavior. Finally, the reasons triggering the SRAs were narrowed down to a strain threshold and to the friction with
concrete present whenever the DOFS is embedded inside an RC structure. This last conclusion was later
demonstrated to be the main reason for the rise in SRAs in Bado et al. [49]. The article was aimed at providing a
contribution to the effort of establishing the best thin non-coated OFDR DOFS/rebar bonding technique whenever
the instrumented bar is to be embedded inside of RC structures. The investigated bonding techniques were:
DOFS positioned inside a groove and bonded with cyanoacrylate;
DOFS glued to the rebar’s surface with cyanoacrylate with a protective layer of silicone on top;
DOFS positioned inside a groove, bonded with cyanoacrylate and further covered with silicone.
The authors also indicated as a crucial requirement the absence of any influence of the bonding technique on the
DOFS sampled strains, thus, the guarantee that what is actually reported by the fiber are the actual strains occurring
in the monitored surface rather than a strain present solely in the fiber.

Chapter 5. Published Journal Articles | Mattia Francesco Bado
92
Figure 6. Test setup: three-dimensional specimen detailing and photography [48].
The first phase of the test (performed on a bare rebar) assessed that the presence of a layer of silicone and/or the
one of a groove had no influence on the extrapolated DOFS when compared to readings performed with a DOFS
simply bonded to the rebar with cyanoacrylate. This was proved to be valid both in tension and in bending. The
second phase of the test saw the embedment of the instrumented rebars inside a prism of concrete to form multiple
RC ties. These RC specimens were of two kinds, cracking and non-cracking ones designed expressly to study these
two different scenarios. Interestingly, during this second test phase, the authors were able to monitor the steel rebars’
strains well beyond the yield limit as testified by the peaks of Figure 7 which are the physical representation of the
rebar’s different sections slowly plasticizing one after the other. Additionally, as also visible in Figure 7, the
oscillations of the profiles, easily confusable with signal noise, were stated to be the influence of the transversal rib
on the tensile performance of the rebar. Additionally, it was observed on all the specimens that the magnitude of
the defined rib-induced noise became increasingly larger (see Figure 8) with the load thus increasingly disturbing
the sought-after signal, that is the strain profile. The authors continued reporting an unexpected phenomenon,
possibly connected to the under-performance of the bonding techniques, which caused an alteration of the DOFS
strain readings whenever the fiber was in the presence of extra bending-induced tension (smoothing out strain
profiles) and/or monitoring strains in cracked cross-sections (magnifying their amount).

Chapter 5. Published Journal Articles | MATTIA FRANCESCO BADO
93
Figure 7. Strain profiles of a 15 × 15 × 210 mm Ø20 Reinforced Concrete (RC) tie test with the DOFS bonded with a
combination of groove, cyanoacrylate and silicone [49].
Figure 8. Influence of the rib pattern on the steel strain profiles during the double pull-out test of the RC tie 15 × 15 × 240
mm Ø20 (top five figures). Relative average reading noise (bottom) [49].

Chapter 5. Published Journal Articles | Mattia Francesco Bado
94
Additional work on the involved transfer mechanisms could be the key to such phenomena. Finally, it was
asserted that, whilst none of the studied bonding techniques could completely guarantee the removal of all SRAs,
the combination of a longitudinally incised groove, cyanoacrylate and silicone was the bonding technique that led
to the smallest amount of SRA thus preserving the readability and reliability of the strain data (see Figure 9).
Figure 9. Total amount of anomalistic readings grouped per bonding technique [49].
Barrias et al. [50] reported the results of a laboratory test campaign on two 150 × 150 × 600 mm RC beams
whose bottom face was instrumented with four differently bonded longitudinal OFDR DOFS segments, namely
with Silicone, Polyester, Epoxy and Cyanoacrylate. The beams were subjected to three-point load tests carried out
under an elastic regime (uncracked condition) before being, in a second cycle, cracked and loaded to failure. The
influence of the spatial resolution on the data acquisition was additionally analyzed. On the latter, the spatial
resolution of 1 mm presented an undesired high spatial variability (reportedly due to the concrete’s heterogeneity
of the aggregates) which did not occur with a spatial resolution of 1 cm. On the adhesive performance, in uncracked
conditions, all adhesives compared fairly well with the data measured by parallelly installed SG with a slight edge
from the silicone’s part whose plots were smoother and more uniform. When cracks arose, whilst all the segments
were able to detect and locate the crack formation, the measurements at this location became erratic in all segments
except for the silicone. Nevertheless, for the latter, the length influenced by the crack formation is relatively and
suspiciously wider.
The last observation was very probably due to the aforesaid [48] silicone-induced stress redistribution. Alj et al.
[42] investigated the strain response of thick-coated DOFS sealed in a groove on the surface of a concrete structure
using a polymer adhesive and aimed to identify optimal conditions for crack monitoring. Initially, a Finite Element
Model was developed (see Figure 10) to understand the strain transfer process between the DOFS core and the host
structure which showed that the softer the adhesive is, the lower the strain transferred to the DOFS glass core due
to redistribution over a broader length of the sensor (similarly to what was observed in [48–50]).

Chapter 5. Published Journal Articles | MATTIA FRANCESCO BADO
95
Figure 10. Finite element mesh of (a) the 3D geometry and (b) the cross-sectional view of the system [42].
Later, mechanical tests on cylindrical concrete specimens instrumented with a polyimide coated (external
diameter 160 μm) OFDR DOFS bonded/sealed using several adhesives proved that strain measurements provided
by DOFS were consistent with those from conventional sensors. Furthermore, they confirmed that bonding DOFS
to the concrete structure using soft adhesives allowed to mitigate the amplitude of local strain peaks induced by
crack openings, which may prevent the sensor from early breakage. Unfortunately, this particular result, also
corroborated by the previous articles, cuts both ways as the strain alleviation reduces the sensitivity of bonded
DOFS and may alter specifically sought after strain readings. This was evident in the strain profiles provided by the
DOFS (see Figure 11) which was bonded to the test specimen with three polymer adhesives used in this experiment
(Bi-component epoxy, Mastic silicone and Silicone rubber) and subjected to an actuator displacement reaching 0.6
mm.
Figure 11. Strain profiles recorded by DOFS bonded to the concrete specimen with three soft adhesives (Bi-component
epoxy, Mastic silicone and Silicone rubber) [42].

Chapter 5. Published Journal Articles | Mattia Francesco Bado
96
The DOFS bonded with Bi-component epoxy revealed the development of a strain peak in the central part of the
profile from the actuator displacement of 0.2 mm. DOFS bonded with the two silicone adhesives, instead, did not
show clear peaks development but rather small triangular shaped profiles visible only from the actuator
displacement of 0.3 mm. Indeed, as already observed in [48,50], the very low stiffness of these silicone adhesives
(about 5 times lower than that of the Bi-component epoxy) favored the diffusion of the originally concentrated stress
over the entire length of the bonded DOFS. Consequently, the authors suggested that the adhesive stiffness should
be optimized to ensure a compromise between protective function and crack monitoring performance. Alj et al.
finally generalized the above FEM to describe the strain response of bonded DOFS in the presence of crack and an
analytical expression relating a DOFS peak strain to the crack opening was proposed.
In Barrias et al. [51], the authors aimed at assessing OFDR DOFS’ ability and performance to monitor bridges
on a long-term basis thus subjected to a large number of load cycles. The study also studied the magnitude of DOFS
debonding and fatigue failure risk. To this end, two similar specimens were submitted to a fatigue test up to 2
million load cycles, the amplitude of which was representative of what is expected on a standard highway bridge
under vehicular traffic. According to the authors, the first beam was fatigue loaded in an un-cracked state and its
results showed a reasonably good agreement between the DOFS measurements, the theoretical results and the ones
measured by the SG as well and for all adhesives tested. The second beam, instead, was intentionally pre-cracked
and its results showed how DOFS continued to provide strain measurements coherent with the applied load despite
some differences related to the used bonding agents. For example, the best performance was obtained for the epoxy
and cyanoacrylate, whose measurements matched perfectly with those from the SG. Larger differences were,
instead, observed against the other two bonding agents. Overall, though, neither fatigue failures nor fiber/adhesive
debonding were detected.
Conclusively, the present section introduced several recently published results and observations on the matters
of strain transfer in the multi-layered DOFS bonding systems and of the ideal bonding technology for laboratory-
targeted coating-less DOFS. The main takeaways on the former were:
Feng et al. [41] and Henault et al. [43] developed theoretical approaches to describe the strain transfer
mechanism (also defined Mechanical Transfer Function) that relates the strain profile of the host cracked
concrete with the DOFS core;
Bassil et al. [44] proposed a new analytical model formulating a general expression of the crack-induced
strain transfer from fractured concrete material to optical fibers;
Alj et al. [42] indicated that the strain transfer process depended on mechanical and geometrical properties
of the different intermediate layers, i.e., their modulus of elasticity, their height and the initial crack opening;
Articles [44,52] presented particularly varied selections of DOFS cables with equally deep studies of their
performances;

Chapter 5. Published Journal Articles | MATTIA FRANCESCO BADO
97
Whenever an experimental investigation requires the maximum precision possible, the strain shear lag
induced by any host–surface/DOFS-core intermediate layers should be minimal, thus the preferable fibers
are simply cladded non-coated DOFS;
It was experimentally assessed that polyimide-cladded cables had a strain lag parameter inferior to other
coating-including ones, thus allowing for accurate detection of tiny crack propagations;
On the durability of DOFS cables embedded inside RC structures, an experimental campaign with accelerated
aging of the RC saw a larger DOFS/concrete interface degradation for cables with an external coating made
of a polyethylene than the ones made out of soft elastomeric material (olefin-type elastomer).
On the best bonding/protection techniques of thin coating-less fibers on RC structures:
Numerous researchers reported the appearance of unrealistic strain readings, defined as Strain Reading
Anomalies (SRAs), which prevented the extraction of reliable strain data;
Whenever DOFS are embedded inside an RC structure, SRAs are mainly caused by the friction with concrete
or (in the case of externally bonded fibers too) by steep strain gradients like the ones occurring in the
proximity of surface non-linearities, such as cracks;
Whilst it could not completely guarantee the absence of SRAs, the combination of a longitudinally incised
groove, CYN and SI was reportedly the bonding technique that led to the smallest amount of SRAs;
It was observed on DOFS instrumented RC ties that load increments increased the magnitude of the influence
of the ribs on the strain profile of steel rebars;
Several DOFS-powered experimental campaigns detected a behavioral feature of silicone whenever it was
used for the protection of DOFS. That is a certain redistribution of the strains present in a specific
point/section of the DOFS along a larger segment, consequently sampling lower strains than the ones
originally present;
This is in line with the results of a performed FEM analysis stating that the softer the adhesive is (in this case
silicone can be characterized as a “soft” adhesive), the lower the strain transferred to the DOFS glass core
due to redistribution over a broader length of the sensor;
Following a test on DOFS-instrumented RC beams subjected to fatigue testing (2 million load cycles) the
most resilient bonding adhesives were reportedly epoxy and cyanoacrylate.
4. Laboratory Experimental Applications
The application of DOFS for structural monitoring is still rather young, especially when compared to classic
tools such as SG, LVDT and inclinometers. It can be stated that an “instrumental maturity” is still lacking when it
comes to optical fiber sensing, a shortcoming that numerous research groups and projects are attempting to
overcome through laboratory experimentation. Indeed, most research articles published in the latest year still

Chapter 5. Published Journal Articles | Mattia Francesco Bado
98
motivate their experimental efforts with the study of the applicability, suitability and performance of DOFS
deployments on any particular structure, under any particular testing conditions on the lookout for any particular
mechanical response. Furthermore, it is common to see a comparison between DOFS’ outputs and parallelly
sampled ones by means of common and well-established monitoring tools. The most common variables under
investigation are the following:
DOFS cladding, coating and reinforcements
Adhesives or technologies used to achieve the DOFS/structure bonding and protection
The layout of the deployment
Positioning of the DOFS: bonded to a structure’s surface versus embedded inside it
Considering all the above variables, the solution for the best DOFS deployment is branching and permuting in
nature. Consequently, over the years, multiple techniques have been proposed which will eventually “converge” in
a single one in the close future, in accordance with the objective at hand. Only under such conditions, it would be
possible to develop standards and guidelines for DOFS monitoring.
The present section is aimed at presenting and putting side to side the laboratory experimental efforts performed
in the latest years in an attempt to help to hasten the above-mentioned “instrumental converge”.
It is worth mentioning, as will be noticeable further on, the large number of laboratory experimental campaigns
that integrate DOFS monitoring with a novel technology under the name of Digital Image Correlation (DIC).
Briefly, DIC is an innovative, cheap, non-contact optical technique for measuring strains and displacements on any
primed surface. It works by comparing digital photographs of a component or test piece at different deformation
stages and, by tracking blocks of pixels of a complex stochastic pattern painted on the monitored surface, it measures
its surface displacement, building 2D and 3D deformation vector fields and strain maps [53]. As it is easily
discernible, the integration of this technique inside a DOFS monitoring campaign not only does not lead to any
interference but also allows to integrate, verify and validate the DOFS internally measured strains with externally
measured ones. Two recent studies, Mata-Falcón et al. [54] and Bado et al. [55], explicitly analyzed this DOFS-
DIC integration.
The former explored the combined use of DIC and OFDR DOFS for the strain measurements of two 600 × 600
× 125 cm reinforced panels subjected to diagonal tension. The OFDR DOFS were glued with epoxy inside 1 × 1
mm grooves carved along both legs of every stirrup, summing up to 24 measuring lines across the whole specimen.
As visible in Figure 12, the DOFS-sampled reinforcement strains correlated well with the position and opening of
the cracks (monitored by the DIC) proving the compatibility and potential of DIC and DOFS to measure phenomena
like bond, crack behavior and shear transfer.

Chapter 5. Published Journal Articles | MATTIA FRANCESCO BADO
99
Figure 12. Crack locations and openings, steel stresses and forces in front layers of stirrups for Panel 1 at (a) 80 kN and
(b) 110 kN as well as for Panel 2 at (c) 90 kN and (d) 150 kN [54].
The same conclusions were also reached in Bado et al. [55] who monitored with OFDR DOFS the strains present
inside three steel rebars embedded in differently shaped and differently behaving (cracking and non-cracking) RC
ties during testing. As already evident, this dual monitoring methodology is often employed for experimental works
on cracking RC structures.
Therefore, with this frame of mind, the following sub-sections will explore recent research articles on laboratory
experimental campaigns deploying DOFS to RC structures and more. They will be grouped in different sections
exploring DOFS deployments on RC beams, RC ties, RC slabs, corrosion tests and finally on miscellaneous
experimental campaigns such as fire resistance, concrete–textile hybrids and more.

Chapter 5. Published Journal Articles | Mattia Francesco Bado
100
Finally, additional reading on laboratory applications of DOFS can be found in Huo et al. [56], Bassil [57], and
Zhang [58].
4.1. Reinforced Concrete Beams: Cracking and Other Serviceability Analyses
The present section collects the large research effort performed throughout the last years on DOFS distributed
strain sensing for RC beams experimental campaigns.
Berrocal et al. [59], for example, aimed at assessing the suitability and accuracy of thin polyamide cladded
OFDR DOFS for the crack monitoring of RC beams subjected to three-point bending tests (monotonic and cyclic
loading) in addition to determining the crack location and width evolution over time. The latter was achieved by
means of comparison between DOFS reinforcement strain profiles and externally sampled DIC measurements.
Low-bend loss polyamide-coated DOFS (155 μm diameter) were bonded directly to the rebar’s surface, along one
of the longitudinal ridges, with cyanoacrylate adhesive before being protected by a silicone layer. The comparison
of the crack location obtained from DOFS and DIC revealed that most of them were located within an acceptable
range of ±3 cm from each other (as visible in Figure 13).
Figure 13. Multiple strain profiles from the DOFS where the red triangular makers indicate the determined crack position
based on the strain profile at maximum load and the grey shaded area correspond to position determined from the Digital
Image Correlation (DIC) [59].
This range is understandable considering the different depths at which the transversal cracks were measured and
their probable lack of perpendicularity compared to the beams’ axis. An additional takeaway was the need for a
certain amount of strain noise-removing data post-processing in order to determine the crack position. The crack
width and evolution were further calculated by integration of the strain profile over a certain length adjacent to the
crack and through the removal of the contribution of the tension stiffening between cracks. A good agreement (±20
μm) was generally observed between DOFS and DIC crack widths monitoring, as can be seen in Figure 14.

Chapter 5. Published Journal Articles | MATTIA FRANCESCO BADO
101
Figure 14. Comparison between the crack width measured by the DIC and calculated from the DOFS measurements [59].
Berrocal et al. [60] also investigated the suitability of embedded robust OFDR DOFS (featuring a protective
external rugged polyamide coating) to accurately assess the performance requirements, in terms of vertical
deflection and crack width, of three 20 × 25 × 300 cm RC beams subjected to four-point bending. The strain
measurements performed by means of the thicker fiber were additionally integrated with the ones extracted from
thin polyamide-cladded ones and from an external DIC system. The thin DOFS were bonded directly onto the steel
bars, at the concavity created by the longitudinal ridge, by means of cyanoacrylate adhesive (after removing the
mill-scale and degreasing the area with acetone) with the addition of a protective layer of a one-component water-
proof oxygen-free silicone rubber (Figure 15c). The robust DOFS were installed longitudinally along the rebars
(Figure 15f) either supported along a longitudinal rebar, bridging the stirrups or resting on the formwork using
electric tape to fix them in place (Figure 15d and e). The results revealed that a certain strain attenuation occurred
in the embedded robust DOFS compared to the commonly used thin polyamide coated DOFS. However, the
presence of the protective sheath prevented the appearance of SRAs. Performance wise, the robust DOFS were able
to provide a good estimate of the beam deflections with errors of between 12.3 and 6.5%. Similarly, crack widths
computed on the base of the DOFS strain measurements differed by as little as ±20 µm with the DIC results.

Chapter 5. Published Journal Articles | Mattia Francesco Bado
102
(f)
Figure 15. Installation of the DOFS: (a) installation of robust DOFS cable in a reinforcement bar by inserting it into a
previously milled groove; (b) comparison of thin and robust DOFS; (c) installation of thin DOFS on the surface of a
reinforcement bar by bonding it with cyanoacrylate adhesive and protecting it with silicone; (d) installation of robust DOFS on
the surface of a reinforcement bar by mechanically anchoring the cable to the reinforcement with electric tape; (e) multi-layer
configuration of embedded DOFS in the beam specimens and (f) loading setup and DOFS installation configuration for the RC
beam specimens (adapted from [60]).
Brault and Hoult [61] monitored simultaneously the deflections and crack widths of thirteen different RC beams
tested under three-point bending. The goal was to evaluate the performance of nylon-coated OFDR DOFS cables
for serviceability performance assessments and compare the latter with other monitoring technologies’, namely DIC

Chapter 5. Published Journal Articles | MATTIA FRANCESCO BADO
103
and linear potentiometers. The DIC cameras were aimed such that their field of view encompassed the middle
section of each beam’s span. The results showed that, if to use a FOS layout that avoided cracks larger than 0.15
mm and accounting for flexural deformations only, the distributed beam deflections could be accurately measured
up until load levels approaching failure. Furthermore, comparing the DOFS-based crack width calculation outputs
with DIC’s measurements, it was found that the FOS could measure crack widths with an average measurement
difference of 0.007 mm for crack widths up to 0.15 mm, 0.016 mm for crack widths between 0.15 and 0.18 mm,
and 0.031 mm for crack widths between 0.18 and 0.30 mm. The authors concluded suggesting that DOFS could be
used for the monitoring of an RC structure’s compliance with the crack width limits prescribed by the codes.
Similar RC beams were also used in Brault and Hoult [62] with the objective of reporting the development of a
practical technique to measure distributed reinforcement strains in RC members beyond cracking. For validation
purposes, OFDR DOFS outputs were further compared against those of conventional SG. Some key takeaways
were the good agreement between the DOFS and SG sampled reinforcement strains at crack locations and between
the latter. The authors observed that exaggeratedly high reinforcement strains and/or noisy strain results were
measured at crack locations (SRAs), likely due to concrete shearing or pinching of the DOFS. Furthermore, it was
noticed that mainly unreliable strains were measured once reinforcement yielding commenced. Finally, when
comparing the progression of external crack widths with the corresponding reinforcement strains at crack locations,
it was detected that certain cracks initiated gradually whilst others more abruptly.
An additional DOFS-DIC integration was reported in Poldon et al. [63]. Here, a large RC beam was designed to
fail in shear under three-point bending conditions with its flexural and shear reinforcement strains monitored with
OFDR DOFS and its superficial strains/displacements with DIC. DOFS was bonded to the longitudinal
reinforcement ribs and, notably, on 16 stirrups with a cyanoacrylate adhesive before being covered with consumer-
grade silicone. According to the authors, the presented measurement technique using FOS and DIC allowed for a
detailed study of shear failures and the quantification of the contribution of steel and concrete to the beam’s stiffness
at every stage.
Shear failure was also analyzed in Rodriguez et al. [64,65] who investigated an experimental methodology to
obtain the shear cracking pattern of RC beams. In particular, the latter suggested the formation of a 2D grid
composed of one or two OFDR DOFS bonded to the shear span of a beam. The methodology was tested on three
partially pre-stressed 8 m long I-shaped RC beams subjected to shear failure with a DOFS mesh bonded with epoxy
adhesive. During such test the peaks appearing in the sampled DOFS strain profiles were associated with the
presence of cracks (detectable even before their actual visual appearance). As the latter evolved the DOFS grid’s
horizontal and vertical segments allowed to successfully define the crack pattern despite the different inclinations
of the cracks along the web height (see Figure 16). Apart from the definition of the crack pattern, an algorithm was
also proposed to calculate the crack widths based on the strain profiles in both horizontal and vertical directions.

Chapter 5. Published Journal Articles | Mattia Francesco Bado
104
Figure 16. Real cracking pattern and obtained with DOFS in two different beams (adapted from [64]).
On the extraction of the above shear crack widths, the proposed DOFS method was compared with the more
traditional one based on the deployment of displacement rosettes in [65]. The results showed a relative similarity
between the two analyses’ results despite some mismatches attributed to the high level of measurement error
involved in the rosette method. Additionally, the authors observed the presence of high-strain DOFS points
unrelated to the cracked visible pattern. These could be potentially attributed to small premature cracks, damage in
the bonding of the fiber, presence of small cavities in the concrete surface or failures of the fibers’ backscattering
interpretation performance.
Shear failure was also studied in Fischer et al. [66] who performed a complex load test on a prestressed concrete
beam subjected to four-point bending in order to investigate the various configurations of the deployed measuring
device, OFDR DOFS/cables (see Figure 17), and application methods.
Figure 17. DOFS cables used in [66].
Chapter 5. Published Journal Articles | MATTIA FRANCESCO BADO
105
The authors suggested that in structural concrete construction, the robustness and durability of the monitoring
DOFS (in addition to their basic suitability and sensitivity) should reflect their application (glued to the concrete
surface, applied to reinforcement bars or embedded in concrete). Thus, the authors investigated both conventional
polyimide and nylon coated DOFS but also more robust measuring cables (referred to as V0, V1, and V9 and N3)
which include various plastic and metal layers (thus comprising comparatively thicker cross-sections). The formers
were bonded to the surface of the test specimen with a cyanoacrylate-based adhesive whilst the latter were embedded
inside it. During the test, all the observed flexural cracks formed peaks in the strain curve of the measuring cable.
Similarly so, the formation and opening of shear cracks close to the supports could be identified by the upwardly
guided sensors V9, V1, and N3 in those specific points where the DOFS and shear cracks cross. The robust
measuring cables V9 and V1 were reportedly more adapt to reporting the steel strains beyond the cracking stage.
Mehdi Mirzazadeh and Green [67] studied an application of OFDR DOFS and DIC for the measurement of the
crack widths, deflections, and strains in eight large-scale RC beams tested under static and fatigue loading at room
temperature (+15 °C) and at low temperature (–20 to –25 °C). Half of the 200 × 400 × 4200 mm beams had no shear
reinforcements whilst the remaining ones did. Single-mode nylon coated DOFS were bonded both at the top and
the bottom of the beams’ side surfaces which had previously been ground and cleaned with alcohol. Additionally,
in both positions two parallel rows of DOFS were deployed, one fully bonded and the other partially bonded. DOFS
reportedly measured strains with an accuracy close to the one of parallelly installed SG under both temperature
conditions. A noteworthy observation was that the sum of the strain-optic error (thermal stress-induced error when
a coating is present) and the thermo-optic error (error caused by the alteration of the fiber refractive index due to
temperature variations) was close for the two different tested fibers. The first of these was a single-mode fiber (900
μm coating diameter) whilst the second a polarization-maintaining fiber (230–260 μm coating diameter). Finally,
the article introduced a methodology to determine the thermal expansion coefficient of the optical fibers with thin
coatings.
Sawicki et al. [68] proceeded to validate the performance of DOFS (integrated with DIC and extensometers) for
the SHM of Ultra-High-Performance Fiber-Reinforced Cementitious composites (UHPFRC). In particular, a full-
scale UHPFRC beam was instrumented with three lines of OFDR DOFS positioned inside 2 × 2 mm grooves present
on each face of the beam (the fibers were glued in place with a bi-component epoxy adhesive). The displacement-
controlled four-point bending test was characterized by different loading–unloading steps. Overall, the experimental
campaign yielded a successful detection of the UHPFRC beam structural discontinuities from the DOFS’ part. Yet,
during the elastic stage of the beam’s structural response, large measurement noises caused the failed observation
of the DIC strain variations leading the authors to state that the latter still remained a highly complex and sensitive
monitoring technique. However, in the cracking stage, DIC allowed for the tracking and characterizing of the
localized fictitious cracks, i.e., localized discontinuities bridged by multiple fibers (see Figure 18).

Chapter 5. Published Journal Articles | Mattia Francesco Bado
106
Figure 18. DOFS-integrating DIC strain distributions at different load steps [68].
The authors further observed that polyimide-coated fibers allowed for the early and accurate detection and
localization of micro-cracks. Conclusively, Sawicki et al. highlighted the importance of a deep understanding of the

Chapter 5. Published Journal Articles | MATTIA FRANCESCO BADO
107
sensor properties (like crack and temperature sensitivity), durability and aging (tackled by [46,47]), long-term
fatigue (tackled by [51]) for holistic global and local strain measurements.
Broth and Hoult [69] investigated the potential of using OFDR DOFS for the monitoring of a series of slender
and deep RC beams subjected to three and four-point bending cyclic loading. In particular, the embedded distributed
sensors were used to assess the deflection growth induced by the cyclic loading (3600 loading cycles at 1 Hz).
DOFS were bonded to sanded and degreased rebars by means of a cyanoacrylate adhesive and later protected with
an additional layer of silicone. The second of the three testing phases (initial loading, cycling loading and loading
to failure) saw a deflection growth (see Figure 19) attributable to the combined result of crack formation, crack
growth, creep in the concrete and the degradation of the bond between the steel reinforcement and concrete.
Figure 19. Strain along the bottom reinforcement during cycling for four deep beam specimens [69].
Finally, the authors highlighted the fact that DOFS was able to withstand cyclic loadings all the way to failure.
However, at the present day, still few tests are available regarding the issues of DOFS-monitored fatigue and
deterioration.
Barrias et al. [70] carried out an experimental campaign on two 100 × 180 × 800 mm beams with polyimide-
coated OFDR DOFS installed both on the embedded rebars and on the specimen surfaces. The beams were tested
under three-point bending starting with an initial monotonic loading cycle, followed by an unloading stage
(triggered well beyond the cracking stage) and concluded by another loading cycle. In order to verify the reliability

Chapter 5. Published Journal Articles | Mattia Francesco Bado
108
and accuracy of the DOFS measurements, additional SG were installed along the rebar in three locations. Overall,
the optic fiber bonded to the rebar delivered good results despite disturbances in the surroundings of the crack. The
latter was also reportedly detected and located by the superficial DOFS albeit only until a certain stiffness variation
in the beam, beyond which large disruptive SRAs appeared in the proximity of the damage location.
Bassil et al. [71] proceeded to the performance assessment of Coda Wave Interferometry and OFDR DOFS
(deployment visible in Figure 20) for the damage detection of a 20 × 20 × 100 cm RC beam tested under three-point
bending.
Figure 20. Ultra Sonics (US) and DOFS sensors attached to the rebars before casting of concrete [71].
The beam was also instrumented with SG and Linear Variable Displacement Transformers (LVDT). The DOFS
was glued to the beam’s front and back surfaces, to the front bottom rebar, mid top rebar, mid bottom rebar and
back bottom rebar. The results showed that the implementation of Coda Wave Interferometry and DOFS allowed
for the detection of early subtle changes in RC structures until crack formation. On DOFS, the authors concluded
that, beyond the latter stage, their ability to quantify the crack openings permitted effective monitoring of RC
structures.
Wu et al. [72] tested an RC beam under four-point loading with OFDR DOFS both glued to its surface and
embedded inside it on three separate layers. Experimental results indicated that cracks could be detected as sharp
peaks of the measured strain distribution profiles, despite also noting that strains pertaining to neighboring cracks
could interfere with each other. Indeed, the authors pointed out that only neighboring cracks with a separation of
more than 6 cm could be discerned with a 1 cm spatial resolution. Finally, both the widening and the propagation
of cracks were successfully detected and described to have a slow initial growth followed by a linear growth stage.

Chapter 5. Published Journal Articles | MATTIA FRANCESCO BADO
109
Chen et al. [73] brought up the condition under which an RC structure might be subjected to bi-directional loads.
They then proceeded to use a (Pulse-Pre Pump) PPP-BOTDA DOFS (with a 10 cm spatial resolution) to assess the
superficial structural strains of a 10 × 15 × 150 cm RC beam subjected to bi-directional loading. The strain–
deflection relationship was established using the explicit function analysis method and the implicit function
mapping method based on the DOFS readings.
Malek et al. [74] utilized OFDR DOFS for the study of the steel/concrete bond degradation due to reinforcement
yielding in RC beams subjected to lateral loading. The performed experimental program, representing a drastic
departure from the common bond/slip determination tests (i.e., the single and double pull-out tensile tests), was
based on a pseudo-static pushover test of four 25 × 35 × 285 cm cantilever RC beams tested vertically.
Instrumentation-wise, two different types of optical fibers were used, a PVC-coated tight buffer OFS cable (for both
internal and external sensing) and a polyimide-coated fiber (bonded on the longitudinal rebars). Thus, during the
test, the strains were captured continuously at a spacing resolution of 2.6 mm and with an accuracy of 25 με both
on the outside and on the inside of the specimen. This allowed for the determination of the concrete/steel slip, steel
stress, bond stress, bond deterioration length and the locations of cracks. Finally, the authors introduced a novel
model to predict pre- and post-yield bond behavior.
Sounthararajah et al. [75] presented an experimental campaign aimed at evaluating the OFDR DOFS reliability
and accuracy when measuring the flexural strains of a Cemented Pavement Material (CPM) beam. In particular,
both static and dynamic four-point bending tests were performed on DOFS and LVDT-instrumented 50 × 50 × 200
mm CPM beams. The latter were manufactured with Holcim Road Base pavement material from the Gosnells
Quarry, Perth, Western Australia combined with a General Purpose cement as a binder substance. An acrylate-
coated single-mode fiber (SMF-28e) was bonded to the bottom and side surfaces of the beam specimens (with a
two-part epoxy adhesive) after having been properly cleaned with acetone. The experimental output showed a fair
agreement between DOFS measured and calculated flexural strains suggesting their performance for this scope
despite its taxing surface preparation. According to the authors, the test substantiated DOFS’ capability of detecting
the crack initiation and propagation in CPM beams.
4.2. Reinforced Concrete Tensile Elements: Steel/Concrete Bond Stresses, Cracking and Concrete
Shrinkage
RC ties are often used to illustrate cracking, deformation and bond behavior of RC structures thanks to their
simplicity and a reasonably good representation of the distribution of internal forces and strains in the tensile zone
of RC structures [76]. As such, a certain number of research teams have attempted to upgrade the common RC tie
test with the embedment of DOFS (bonded to the reinforcement bars).

Chapter 5. Published Journal Articles | Mattia Francesco Bado
110
Bado et al. [77], for example, performed a double pullout test on five differently sized RC ties (with OFDR
DOFS bonded to their rebars in different manners as visible in Figure 21) with the goal of studying the steel/concrete
interaction, i.e., bond and slip.
Figure 21. (a) Tested RC ties’ with their respective bonding technologies, with (c) and without (b) the addition of a
protective silicone layer. The DOFS-instrumented rebars were monitored by means of an (d) ODiSI-A OBR interrogator [77].
According to the authors, before the advent of DOFS, due to the lack of tools able to assess the rebar strains in
an accurate, completely-distributed and un-intrusive fashion, most structural analyses relying on such knowledge
(such as tension stiffening) resorted to theoretical, empirical or numerical solutions. They continued suggesting that
the introduction of DOFS allowed to finally acquire that insight. In the reported experiment, the RC ties’ crack
positions detected by DOFS were compared against the ones detected by a simultaneous DIC monitoring. Briefly,
thanks to DOFS, the authors detected some specimen’s hybrid bond/slip behavior falling between a crack formation
stage’s and stabilized cracking stage’s whenever they were characterized by a length dangerously close to
surpassing the maximum theoretical crack spacing length. The latter was translated into different bond-slip profiles.
The authors concluded by noting that for future DOFS applications a combination of gluing adhesive (cyanoacrylate
for example) with the addition of a protective layer (silicone) was the preferable DOFS/rebar bonding technique as
it removed undesired SRA-related uncertainties.

Chapter 5. Published Journal Articles | MATTIA FRANCESCO BADO
111
Cantone et al. [78] also provided a comprehensive work on the determination of the rebar–concrete interaction
by means of OFDR DOFS and DIC monitored RC structures tested under pullout, double pullout and bending
conditions. Similar to the previous article, the authors also positioned the DOFS inside 1 mm-depth grooves
performed along two or four rebar sides (see Figure 22).
Figure 22. (a) Back-scattering mechanism due to fiber core impurities, (b) view of the fiber-optic sensor glued to a steel
rebar, (c) sketch of the fiber optical cable placed in the groove and adhering to the steel due to two-component glue and (d)
description of the fiber optic cable structure with angle polished connector on one side and termination (which avoids light
reflection) on the opposite [78].
Amongst the experimental campaign conclusions, the followings are particularly relevant. The observed strain
gradients and high strain values sampled during the pullout test confirmed that this test methodology could prove
to be unsuitable to characterize the response of embedded reinforcement. During the multi-cycle double pullout
tests, by means of DOFS, the authors were successfully able to track the increasing bond degradation (see Figure
23) providing results in sound agreement with the literature. Finally, during the testing of DOFS instrumented RC
beams, lower bending-induced stress variations were detected in the longitudinal reinforcement with respect to the
theoretical values calculated with elastic-cracked analyses. This was reportedly due to imperfect closure of cracks
and negative tension-stiffening effects.
Zhang et al. [79] investigated the ability of DOFS to detect concrete cracking and large strain steel deformation
of six 120 × 120 × 1000 mm RC ties with different OFDR DOFS cable structures, coating materials and diameters
(see Figure 24) which were both embedded in the concrete and bonded to the rebar. The article reported how OFDR
successfully detected continuous rebar deformations and the evolution of the concrete–steel bond stress up until and
beyond the yielding range as well as identifying the crack-indicative strains.

Chapter 5. Published Journal Articles | Mattia Francesco Bado
112
Figure 23. Tensile tests—specimen TC04: (a) cracking pattern in the cyclic loading phase, (b) stress-strain relationship for
all cycles (in grey) and cycle #6 (in green) indicating load levels, (c) profiles of stresses, calculated on the basis of the
measured DOFS (here defined as FOM) strains and (d) bond stresses τ profiles along the steel rebar (adapted from [78]).
Figure 24. DOFS cables used in [79].
Similarly to [77], the authors highlighted the potential of DOFS combined with double pullout tests for the
evaluation of existing RC structure behavioral predictive models through the bond stress analysis. Worth noting are
the conclusions on the performance of each DOFS cable, whose different composition was shown to have a
substantial influence on the measured strain response especially beyond the onset of nonlinear behavior and into
large deformation regimes. Generally speaking, the measurement sensitivity parameter decreased with an increase
in the cable coating thickness due to both elastic and inelastic coating deformations. The sensitivity also tended to
decrease with increased loading likely due to debonding between the cable and concrete (with the exception of cable

Chapter 5. Published Journal Articles | MATTIA FRANCESCO BADO
113
NZ_Y_09). Finally, a certain influence, particularly on the bond with concrete, was reported to be exercised by the
coating stiffness and the cables’ surface properties. Another key requirement was reportedly the fiber survivability,
both in terms of measurement survivability (i.e., the deformation limit before which data can still be obtained) and
the cable survivability (i.e., limit at which the fiber is permanently damaged). On the latter, the authors pointed out
that a high sensitivity did not necessarily correlate with low survivability. For example, cable NZ_Y_09 reportedly
boasted twice the sensitivity compared with NZ_K_20 with 50% data loss occurring at comparable crack widths.
Sienko et al. [80] presented the outcome of a laboratory test designed to verify the suitability of a standard “tight
jacket” OFDR DOFS for the strain analysis of RC members. In particular, the authors deployed the optical fiber
cable inside a 77 × 110 × 1050 mm RC tie along several longitudinally drilled holes before bonding it with epoxy
resin. The same adhesive was used to bond the fiber to the degreased reinforcement bar parallelly to its longitudinal
rib. According to the authors, the results showed good measurement accuracy for micro-cracks and narrow crack
widths (range up to 0.05 mm) and only moderate accuracy in the case of wider cracks (up to 0.30 mm). This was
attributed to the slip between the DOFS core and its external jacket leading to fiber strains not corresponding fully
with the actual deformation state of the concrete member. However, it was also reported that the measurement
methodology allowed for precise crack widths determination as to the sum of fiber elongations within the sections
between the cracks.
Davis et al. [81] instrumented multiple reinforcement bars with OFDR DOFS before embedding them inside RC
prisms, thus forming RC ties. Their goal, measuring the steel rebars’ distributed strain profiles during the concrete
shrinkage period of time (3, 7, 21 and 28 days) and during subsequent axial tension tests. Davis et al. instrumented
the bars with a polyimide-cladded and a nylon-cladded DOFS bonded to the bar with a cyanoacrylate along the
longitudinal ridge. It was observed that the shrinkage at both specimens’ free edges was larger than at its center
with only small strain variations (± 20 με) between these two. Furthermore, with the passing of the days, the DOFS
bonded to the rebar and embedded in the concrete displayed progressively increasing compressive strains
(approximately 300 με at 28 days).
A proper shrinkage strain measurement is imperative for a proper assessment of the tension stiffening as it may
lead to an apparent underestimation [82]. To remove such effect, the authors used some guidelines provided in
Fields and Bischoff [83] and found a good agreement with the DOFS experimental results for the rebar 15 M
specimens and not so good agreement with the rebar 10 M specimens. In conclusion, two additional observations
are worthy of emphasis. First, the authors’ suggestion of bonding DOFS on both sides of the reinforcement bars in
order to mitigate the localized bending effects due to non-straight bars and non-symmetric crack formations.
Second, the observation of a certain amount of slip between nylon claddings and the sensing silica cores could result
in incorrect measurements.

Chapter 5. Published Journal Articles | Mattia Francesco Bado
114
4.3. Reinforced Concrete Slabs
The present sub-section starts acknowledging 2013’s pioneering work by Villalba and Casas [84] which
represented one of the first structural applications of DOFS monitoring. In particular, the publication was based on
the OFDR DOFS instrumenting of an RC slab with successful detection of both crack locations and widths as per a
subsequent publication by Rodríguez et al. [85].
More recently, in Nurmi et al. [86], a proof of concept study was undertaken that involved the measurement
through OFDR DOFS distributed strain profiles in two-way RC slabs with varying reinforcement ratios and levels
of axial restraint tested under a central point load. The goal, shedding light on the impact of partial restraint and
reinforcement ratio on two-way slab behavior and comparing the load capacity and strain assumptions to a yield-
line analysis. Two slabs were subjected to axial restraint using a welded HSS restraint frame whilst two others were
not restrained. The slabs with less reinforcement demonstrated a ductile flexural failure while the more heavily
reinforced slabs failed due to punching shear (see Figure 25).
Figure 25. Specimen failure due to punching shear and its crack pattern [86].
The DOFS sampled strain data (Figure 26) enabled the successful detection of performance differences for the
two support conditions (vertical and axial) and the capturing of the onset of reinforcement yielding. The authors
additionally observed an enhanced slab capacity and stiffness in the presence of axial restraint.
Sienko et al. [87] glued OFDR DOFS cables on the composite rods of a truck scale platform slab in order to
analyze the internal concrete strains and local nonlinearities (cracks). The monitoring was ongoing throughout the
concrete hydration process (thermal-shrinkage strains), the prestressing tendons activation (strains regarding the
transfer of compression forces from the tendons to the concrete) and the laboratory tests, when slabs were
mechanically loaded until failure.

Chapter 5. Published Journal Articles | MATTIA FRANCESCO BADO
115
Figure 26. Slab 3-C-45 DOFS strains: (a) 50 kN, (b) 100 kN, (c) 150 kN (adapted from [86]).
The reported early-age hydration-induced concrete strains reached the value of ±220 με. Later, during the first
test steps, the platform worked linearly and elastically (deflection of 10 mm) whilst later on DOFS reported the
presence of discontinuities related to the crack occurrence which continued developing during subsequent load
steps.
Liao et al. [88] instrumented an RC slab with OFDR DOFS in an attempt to monitor its thermal curling process
when subjected to external temperature fluctuations. Explicitly, a 50 × 50 × 5 cm mortar slab was instrumented with
the combined monitoring system consisting of inclinometer, DOFS, and thermocouples. During the testing, the heat
source was a light heater with a 500 W halogen bulb positioned above the slab except that the heating was not direct
but buffered by double polymer insulation (see Figure 27) positioned in order to create a relatively even temperature
field above the slab.

Chapter 5. Published Journal Articles | Mattia Francesco Bado
116
Figure 27. Test setup: (a) instrumented test slab, (b) testing with surrounding insulation [88].
According to the authors, DOFS demonstrated that the top surface of the slab had a fast reaction rate to the
heating/cooling process whilst the bottom one suffered a time-lag resulting in a top-vs-bottom temperature
difference. In conclusion, the authors stated that DOFS can provide a comprehensive picture of the longitudinal
temperature distributions, the heat flux transfer process and the consequent strain distributions thus returning an
immediate idea of the deformed shapes of the pavement slab.
Teguedy et al. [89] sustained that the study of the early-age behavior of Timber–Concrete Composite (TCC)
structures is of great interest as it provides valuable information for manufacturing specification development,
quality control, and optimization of the formwork design. As such, the authors decided to deploy BOTDA DOFS
inside two 900 × 75 × 8500 mm TCC slabs in order to continuously monitor (during 30 days) their short-term
behavior, i.e., the early-age temperature/strain variation in the fresh concrete and in the CLT slab. Additionally, the
multiplexing capabilities of the DOFS system allowed for the strain measurement at several heights of the timber
section with a single sensor (see Figure 28).
Figure 28. Fiber arrangement for the Timber–Concrete Composite (TCC) slab monitoring [89].

Chapter 5. Published Journal Articles | MATTIA FRANCESCO BADO
117
The above illustrated distributed sensing system allowed for the detection of the changes of the composite action
between timber and concrete (using indicators such as the neutral axis position and the curvature evolution within
the CLT slab) in addition to highlighting the considerable structural changes induced by mechanisms such as
concrete creep and environmental thermos-hygrometric variations.
4.4. Corrosion Tests of Reinforced Concrete Structures
The corrosion of steel reinforcement bars decreases the load-carrying capacity of RC structures by reducing the
reinforcement area and decreasing the latter’s bond with the surrounding concrete. With regards to this deterioration
phenomenon, DOFS has the potential of becoming a crucial SHM tool thanks to their immunity to corrosion and
the potential of providing an insight into the internal corrosion levels, areas of pitting corrosion, crack locations and
bond deterioration [90].
Davis et al. [90], building upon their previous work [91] on corroded RC ties, investigated the use of OFDR
DOFS for the detection of corrosion in RC beams. In particular, six RC beams were instrumented with nylon and
polyimide coated fibers installed on both the bottom 20 M bars and on the top 10 M bars (see Figure 29) with a
cyanoacrylate adhesive.
(a) (b)
Figure 29. (a) Specimen’s cross-sectional layout and (b) comparison of the nylon bottom DOFS measured strains between
a non-corroded control beam (BS-C) versus a corroded one (BS-01) for three applied load steps, 20 kN, 60 kN and 100 kN
(adapted from [90]).
The beams were subjected to varying levels of corrosion by placing them in a bath of water with 3.5% of the
weight NaCl and imposing a current to accelerate the oxidation process of the reinforcement. The beams were
finally tested under three-point bending. The authors’ conclusions were preceded by a warning on the possible
exacerbation of the corrosion effects induced by the test setup when compared to in-situ corrosion. Overall, the FOS
monitoring system was reportedly able to detect the strain distribution changes along the longitudinal reinforcement

Chapter 5. Published Journal Articles | Mattia Francesco Bado
118
due to the corrosion-induced loss of bond between the concrete and reinforcement. Furthermore, it was found that
1.1% and 4.0% corrosion levels of the bottom longitudinal reinforcement with short watertight protective sleeves
at its ends could cause a decrease in ultimate load of 13% and 39%, respectively. For the beams with long protective
sleeves, instead, 1.4% and 3.8% corrosion lead to a decrease in ultimate capacity by 38% and 37%, respectively.
Lv et al. [92] attempted to evaluate the corrosion-induced damage degree on RC structures by using BOTDA
DOFS to monitor the expansion strains of the former. The authors deployed the DOFS on the rebar in a particular
way, baptized in its complexity as “corrosion sensor”. Its production steps were as follows. First of all, a 5 mm thick
mortar layer was poured directly on the rebar and left curing for one day before demolding it. Three days later a 3
m long DOFS was tightly winded for several turns against the surface of the mortar with both its ends fixed with
acrylate adhesive. Finally, after having bilaterally led out the fiber, an additional layer of mortar was cast on top of
the latter, embedding it. Two RC 140 × 140 × 180 mm specimens (one with stirrups and one without) were subjected
to accelerated corrosion and a subsequent finite element analysis was performed. The latter’s results were consistent
with the fiber monitored strains proving the “rationality” of the analysis and confirming that the so-called “DOFS
corrosion sensor” could be used to monitor the expansion strain of the steel corrosion in real-time.
Fan et al. [93] investigated PPP-BOTDA DOFS’ ability to monitor the evolution of the corrosion of steel bars
embedded inside concrete with the sensors deployed both along the rebar and winding around it (with spacings: 0
mm, 2 mm, 5 mm and 10 mm) as visible in Figure 30.
Figure 30. Photograph of the DOFS deployment on the steel bars: (a) Reference bar (b) L4 longitudinal deployment, (c)
S0 spacing 0 mm, (d) S2 spacing 2 mm, (e) S5 spacing 5 mm and (f) S10 spacing 10 mm [93].

Chapter 5. Published Journal Articles | MATTIA FRANCESCO BADO
119
In the first place, the authors studied the potential influence of the sensing cable on the steel–concrete bond
strength through several pull-out tests. It was noticed that whilst no bond alterations were observed between a fiber-
less reference specimen and longitudinally bonded fiber specimen, the spirally bonded one led to a certain bond
reduction (for example, as the spacing is reduced from 10 mm to 5 mm, the bond strength was reduced by 18%).
Following such, electrochemical testing was carried out to assess the influence of the fiber installation method on
the corrosion resistance of the RC specimen. In particular, the measured strain distributions were used to quantify
the corrosion layer thickness and to estimate the corroded volume.
The same team published another research article [94] on the PPP-BOTDA DOFS monitoring of the corrosion
evolution of a rebar embedded inside concrete with different percentages of steel fiber reinforcement and different
depths of a superficially incised notch. The rebars were instrumented as specimen S10 in the previously illustrated
campaign. The resulting DOFS measurements allowed the authors to conclude that under identical surface
conditions (notch depth) the steel fibers reduced the corrosion of the steel bar embedded in the concrete and delayed
any corrosion-induced concrete cracking (provoked by the pressure of the corrosion products against the concrete
matrix). Indeed, when the steel fiber content increased from 0% to 1%, the strain increase rate before concrete
cracking was reduced by 49%, 50%, and 44% for the specimens with notch depths of 20 mm, 10 mm and 0 mm,
respectively.
Additional similar work from Fan et al. [23] was aimed at evaluating through PPP-BOTDA DOFS the corrosion
products volume and mass loss of steel bars in addition to predicting the cracking of the concrete cover for RC
specimens. The latter are similar to the ones in the previous articles (see Figure 31) with the exception of being
characterized by the different cover thickness (28 mm, 35 mm, and 43 mm) and water-cement ratio (0.4, 0.5, and
0.6).
Figure 31. (a) Photography of the tested specimen and (b) cut section along the steel corroded bar [23].
According to the authors, the DOFS results showed that the steel bar’s corrosion process occurred in three stages
at each of which the strains increased approximately linearly but at increasing rates. The thickness of the concrete

Chapter 5. Published Journal Articles | Mattia Francesco Bado
120
cover reportedly influenced the duration of each of the three stages. Meanwhile, the increase of the water-to-cement
ratio led to a shortening of the first stage and an increased volume of rust filling the pores near the interface between
steel and the concrete.
4.5. Miscellaneous
The present subsection is intended to collect experimental campaigns that, despite carrying significant weight in
each relative field, are characterized by more diverse traits when compared to the above reported DOFS-powered
monitoring campaigns. Therefore, the following assortment presents a high level of heterogeneity.
Bao et al. [95] discussed the importance of research on the integrity and load-carrying capacity degradation when
a structure is exposed to fire. In particular, as summarized in a comprehensive review article on the use of fiber
optic sensors for Structural Fire Engineering [96], the team published in 2017 two experimental works featuring
PPP-BOTDA monitoring campaigns on the residual performances of both steel and RC structures during a fire. In
the first [97], DOFS were installed along the top and bottom flanges of a hot-rolled S-shaped A36 mild steel beam
which was later exposed to fire. In particular, the fibers were loosely passed through steel tubes (which in turn were
attached to the steel beam) for the measurement of the temperature distributions. A yoke was attached at the mid-
span of the beam and was loaded through a pulley system (see Figure 32a).
Figure 32. Applications of DOFS in structural fire testing of: (a) Steel beam and (b) RC beams [96].

Chapter 5. Published Journal Articles | MATTIA FRANCESCO BADO
121
The resulting DOFS measurements, combined with the measured temperatures and the building code
recommended material parameters, yielded an enhanced thermomechanical analysis of simply supported steel
beams subjected to the combined action of thermal and mechanical loading. The simulated strains and deflections
were then validated using measurements from a second distributed DOFS strain sensor and two linear
potentiometers resulting in accurate predictions of the temperature-dependent material properties. Of the four
investigated strain predicting building codes, the European building code provided the best predictions.
In Bao et al. [95], instead, PPP-BOTDA DOFS were embedded inside RC beams (see Figure 32b) for condition
assessment during the exposition to fire. Here, the distributed sensor measured temperature distributions with a 2
cm spatial resolution in the beams thus detecting non-uniform temperature distributions, concrete cracks and
spalling until complete failure occurring after excessive concrete spalling.
Saidi and Gabor [98] presented an experimental study on the mechanical behavior of Textile Reinforced
Cementitious Matrix Composites subjected to direct tensile loading. The specimens were instrumented with OFDR
DOFS positioned in their core (see in Figure 33) and for the study of the local and global behavior of the matrix, of
the textile and of the textile/matrix interface.
Figure 33. Positioning of the optical fiber on the textile reinforcement [98].
Jaafari et al. [99] stated that early-age shrinkage, creep and thermal conditions or initial cracking could have a
significant impact on the dynamic behavior of RC structures. In order to quantify the impact of early-age drying
shrinkage on the latter’s dynamic behavior, the authors conducted an experimental campaign on two types of RC
portal frames subjected to pseudo-dynamic testing. The first frame was kept in endogenous conditions (it was
covered with plastic sheets at its early age to prevent any water exchange with the surrounding environment) thus
limiting the drying effects. The second one, instead, was kept in non-endogenous conditions (thus allowing all water
exchanges) similarly to any construction site conditions. The structures were both instrumented with Mono-mode
optical OFDR DOFS characterized by a silica glass core covered by a Polyurethane cladding. The distributed
sensors reported that, whilst the maximum strains were similar in both structures, the gradient of deformation was
more important in the endogenous portal frame than in the non-endogenous portal frame. As a matter of fact, in the

Chapter 5. Published Journal Articles | Mattia Francesco Bado
122
former one evident drying cracks appeared. After their early age period, both RC portal frames were subjected to
an equivalent seismic loading and certain behavioral differences between the two were observable when subjected
to a moderate intensity earthquake.
Liu et al. [100] performed an OFDR DOFS monitoring of an RC wall-beam-strut joint subjected to a monotonic
lateral load. The optical fiber sensor used in this study is a polyurethane elastomer-coated fiber with a diameter of
0.9 mm without any special protective coating in the sensing cable. The sensors were glued to a groove incised on
the steel bar and were positioned on different vertical and horizontal layers of the RC specimen. During the test, the
authors reported an excellent agreement between the visually observable cracks against the measured tensile strain
profiles. According to the authors, the initiation of cracking and its location can be identified by local spikes in the
tensile strain profile (see Figure 34).
(e)
Figure 34. (a) Damage status at 0.15% drift, (b to d) are the strain profiles measured in the top fibers A, B and C at drift
levels below 0.15% and (e) picture of the cracked specimen (adapted from [100]).
This process, though, was mentioned to be much easier at lower load levels than at higher ones due to the
overlapping of crack-induced spikes and the rise of SRAs occurring at higher loads. The extraction of data on crack
orientation and depth was possible thanks to the multiplicity of layers on which the DOFS was bonded. The authors
concluded evidencing the ability of the optical fibers inside RC members to capture its cracking pattern.
Woods et al. [101] tested an RC shear wall with externally-bonded OFDR DOFS-instrumented Fiber Reinforced
Polymer (FRP) sheets placed to improve its performance. In order to simulate the lateral drift demand along with
the kind of damage suffered by an RC shear wall during a large earthquake event, the specimen was tested under a
predetermined reverse cyclic lateral load sequence. This was achieved by fixing the tested wall to the laboratory

Chapter 5. Published Journal Articles | MATTIA FRANCESCO BADO
123
strong floor and having a hydraulic actuator (fixed on a reaction frame as visible in Figure 35) apply lateral loads
to its top.
Figure 35. Experimental test setup (adapted from [101]).
The fibers were bonded horizontally (see Figure 35) to the surface of the outer-most CFRP layer (using an epoxy
resin) and vertically on the back of the wall. This setup permitted an interesting and well-illustrated two-dimensional
spatial strain measurement analysis over the entire area of the shear wall (see Figure 36), the study of the FRP
contribution to the resistance of the shear wall and the capturing of the failure mechanisms. The authors concluded
by stating that DOFS was durable, reliable and consistently providing strain measurements under repeated large
strain reversals.
4.6. Sub-Section Conclusions
The present section was focused on the DOFS instrumentation of various structural elements subjected to
laboratory experimentation. The reported efforts were categorized as RC beams, RC ties, RC slabs, corrosion testing
and miscellaneous applications. Many of these, integrated DOFS monitoring with a novel technology named Digital
Image Correlation (DIC) for the observation of superficial strains and for the cracking patterns of RC structures.
In the former category, the main observations were:
The authors of most articles were successful in the identification of the flexural strains inside RC beams and
a Cemented Pavement Material (CPM) beam, in the detection of the cracking patterns and in the monitoring
of both the widening and the propagation of cracks;
Both thin coating-less DOFS and high-resistance coated DOFS cables were successfully used to achieve the
previous point;

Chapter 5. Published Journal Articles | Mattia Francesco Bado
124
Figure 36. 2D spatial strain distribution in the: (a) vertical and (b) horizontal directions [101].

Chapter 5. Published Journal Articles | MATTIA FRANCESCO BADO
125
Polyimide-cladded fibers allowed for the early and accurate detection and localization of micro-cracks;
For the bonding of thin coating-less DOFS on the surface of steel bars, the fibers were commonly positioned
at the concavity created by the longitudinal ridge (after removing the mill-scale and degreasing the area with
acetone) before gluing them with cyanoacrylate adhesive with the addition of a protective layer of a one-
component water-proof oxygen-free silicone rubber;
The strain of steel rebars embedded inside RC beams measured by means of DOFS and SG were found to be
in good agreement both at crack locations and between the latter;
In Berrocal et al. [59], the DOFS extracted pattern was compared against the one externally sampled by DIC
with an agreement of ±3 cm between the two; a range which is understandable considering the different depth
at which the transversal cracks were measured and their probable lack of perpendicularity compared to the
beams’ axis. A good agreement (±20 μm) was generally observed between DOFS and DIC crack width;
For the monitoring of shear failure in RC beams different but wholly valid solutions were proposed. The first
saw the bonding of DOFS not only on the longitudinal rebars but also on 16 stirrups. The second saw the
external deployment of an OFDR DOFS in a 2D grid on the shear span of a beam in order to obtain its shear
cracking pattern. The third, deployed multiple fibers both internally and externally to the beam including an
upward guided one running perpendicularly to the oblique shear cracks. All three deployment kinds
successfully reported the steel strains, crack patterns and crack widths;
OFDR DOFS bonded to longitudinal RC beams’ rebars were able to monitor their strains whilst withstanding
cyclic loadings all the way to failure;
OFDR DOFS were successfully employed for the study of the steel/concrete bond degradation due to
reinforcement yielding inside RC beams subjected to lateral loading, thus demonstrating their monitoring
potential even for high magnitude strains.
The DOFS monitoring of RC ties was mainly used to illustrate the cracking, deformation and bond behavior of
RC structures thanks to the latter simplicity and reasonably good representation of the distribution of internal forces
and strains in the tensile zone of RC structures. Indeed, most authors reported being able to extract plausible
concrete–steel bond-stress values by means of RC ties double pull-out testing. Some key observations follow here:
Zhang et al. [79] reported that the DOFS measurement sensitivity parameter decreased with an increase in
the cable coating thickness due to both elastic and inelastic coating deformations. The authors further reported
a certain influence on the DOFS-concrete bond exercised by the coating stiffness and the cables’ surface
properties;
Sienko et al. [80] raised the issue of the possible existence of an additional source of inaccuracies in thick-
coated fibers. Here, a lower crack-width assessment accuracy was attributed to the slip between the DOFS
core and its external jacket;

Chapter 5. Published Journal Articles | Mattia Francesco Bado
126
DOFS integration to RC and Timber–Concrete Composite (TCC) slabs was commended by several authors
who successfully detected the internal strains up until the onset of reinforcement yielding in addition to
obtaining a comprehensive picture of longitudinal temperature distributions, the heat flux transfer process
and the consequent strain distributions.
On DOFS-integrated corrosion testing:
DOFS has the potential of becoming a crucial SHM tool thanks to their immunity to corrosion;
DOFS monitoring was reportedly able to detect the strain distribution changes along the longitudinal
reinforcement due to the corrosion-induced loss of bond between the concrete and reinforcement;
Lv et al. [92] introduced the idea of a so-called “corrosion sensor”. It consisted first of all, of a 5 mm thick
mortar layer poured directly on the rebar around which a DOFS is tightly winded for several turns with a
final mortar layer cast on top;
The influence of a winded DOFS on the steel–concrete bond strength was studied by means of several pull-
out tests. It was noticed that whilst no bond alterations were observed between a fiber-less reference specimen
and longitudinally bonded fiber specimen, the spirally bonded one led to a certain bond reduction;
The spiraling DOFS around a steel rebar deployment technique was used for the assessment of the influence
of various parameters (concrete cover, amount of embedded reinforcement fibers) on the amount of corrosion
suffered by the rebar.
Finally, particularly noteworthy miscellaneous experimental DOFS applications included steel and RC structures
fire testing, the testing of Textile Reinforced Cementitious Matrix Composites and the shear testing of a Reinforced
Polymer (FRP) RC wall.
5. Monitoring of the Built Environment: Buildings, Bridges and Roads
The present section focuses on the built environment branch of Civil Engineering of which its most conspicuous
examples are buildings, bridges and roads but which also includes power plants, dams, railroads and airports
amongst others. These structures cover key roles in the proper functioning, security and comfort of any society, thus
their time-induced deterioration and serviceability-jeopardizing issues occurring throughout their service lifetime
(e.g., corrosion, fatigue, creep and shrinkage-induced shortening and cracking) should be treated with the equivalent
criticality. Revealing data, averagely representative of the situation of most countries worldwide, is provided by the
American Society of Civil Engineers (ASCE)’s 2017 Infrastructure Report Card [102]. According to the latter, the
U.S. has 614,387 bridges, four in 10 of which are 50 years old or more. Of the nation’s bridges, 9.1% were
structurally deficient in 2016 and, on average, there were 188 million trips across a structurally deficient bridge
each day. Furthermore, one out of every five miles of highway pavement is in poor condition. The most recent
estimate puts the nation’s backlog of bridge rehabilitation needs at USD 123 billion and of highways rehabilitation

Chapter 5. Published Journal Articles | MATTIA FRANCESCO BADO
127
needs at USD 420 billion. As observed by Regier and Hoult [103], it is not feasible to replace all the structures that
have surpassed their intended service lives because of the budget, logistical and environmental concerns that such
widespread demolition and reconstruction process would bring along. The only other possible approach consists in
keeping the assets that are still fit for purpose in service. Hence the importance of determining their deterioration
level, serviceability performance and public safety. Though visual inspection is the most common assessing
methodology [104], it inherently includes a certain degree of subjectivity together with evident limitations when it
comes to damage occurring on the inside of a structure or located in unreachable locations. As such, the SHM of
Civil Engineering infrastructure proposes the definition of damage identification strategies performed through
accurate quantitative data sampling tools and followed up by their continuous and real-time monitoring.
The applicability and performance of DOFS to the built environment SHM has been tested and proved possible
in pioneering publications such as Regier and Hoult [103] Glišić et al. [105], Matta et al. [106] and more.
Interestingly, Glišić et al. [105], reported the Brillouin scattering-based DOFS monitoring of a 1000 m long bridge
(composed by a concrete slab poured on nine steel girders that are then supported by more than 50 columns) which
is still currently ongoing, effectively making it, to the authors’ knowledge, the longest DOFS monitoring
implementation on a real structure.
Webb et al. [107] picked up on the previous concepts to perform a BOTDR DOFS monitoring of the Nine Wells
Bridge in Cambridge (UK) carrying a new road over the main rail line connecting Cambridge to London
(represented in Figure 37).
Figure 37. Nine Wells Bridge [107].
The bridge, a three-span, pre-tensioned, prestressed concrete beam-and-slab bridge was monitored with the goal
of observing the long-term behavior of the structure for damage detection purposes and in order to compare the in-
situ measurements to the various empirical creep and shrinkage models used in the design phase. Six beams were
instrumented with fiber-optic cables (as in Figure 38) after the prestressing strands had been pre-tensioned but
before that steel reinforcing stirrups had been tied in place in the mold.

Chapter 5. Published Journal Articles | Mattia Francesco Bado
128
(a) (b)
Figure 38. Beam cross section showing the fiber-optic cable locations: (a) illustration and (b) photograph (adapted from
[107]).
In particular, two types of fiber-optic cables were installed in the six beams; one for the sensing of mechanical
strains (defined as total strain fibers) and one for the temperature strains (defined as temperature fibers).
Interestingly, the latter cable was filled with the gel inside which the sensing fibers were suspended (this way, the
shear transfer between the concrete and the sensing core was prevented). With such dual fiber deployment, the
temperature effects on the Brillouin frequency shift could be removed, such that the true strain in the fiber (due to
applied loading as well as time-dependent effects and the thermal response of the structure) could be calculated.
The authors concluded by remarking that the measured creep and shrinkage-induced strains were found to be in
reasonably good agreement with both Eurocode 2 [108] and Collins and Mitchell [109]’s models.
Similar investigation procedures were undertaken by Cong et al. [110] whilst attempting to evaluate the prestress
loss of four 11.9 m prestressed concrete beams of a newly-constructed railway bridge in Staffordshire (UK). Both
immediate prestress losses (caused by the elastic shortening of concrete) and the time-dependent prestress losses
(due to steel relaxation, concrete shrinkage and creep) were captured by means of distributed (BOTDR DOFS) and
discrete (FBG) fiber optic sensors installed during the manufacturing process (as visible in Figure 39). The latter
sensors measured both strains and temperature (for compensation purposes). The measured prestress losses were
compared with the predicted ones calculated according to both the European and American standards. The outcome
was an apparent underestimation from the code’s part (possibly due to the inaccurate estimations of various input
parameters) which was more pronounced in the early-age versus compared to the two to three years’ mark.

Chapter 5. Published Journal Articles | MATTIA FRANCESCO BADO
129
Figure 39. (a) DOFS deployment layout and (b) prestressed concrete beam cross-sections—edge TYE7 beams (left) and
internal TY7 beams (right) [110].
An additional bridge OFDR DOFS monitoring is reported in Barrias et al. [111]. Here, Sarajevo Bridge
(Barcelona, Spain) was monitored during some deck-enlarging construction works in order to perform a follow-up
of the stresses induced in its three prestressed concrete box girder beams. Thus, the shorter of the two bridge spans
saw the longitudinal gluing of a single 50 m DOFS inside one of its beams (as visible in Figure 40).
(a) (b)
Figure 40. (a) General scheme of DOFS monitoring and (b) its photograph inside the box girder (adapted from [111]).

Chapter 5. Published Journal Articles | Mattia Francesco Bado
130
The authors reported the strain evolution during the construction phase and calculated that, despite the strain
variation (biggest one being −304 με), excessive stresses were not transmitted to the concrete during the construction
works (maximum 11.42 MPa).
A critical scenario during Civil Engineering works might ensue after the pouring of mass concrete structures
(such as dams, nuclear plants, massive foundations, bridge piers, thick slabs and skyscraper columns). Indeed, after
the concrete is poured, the cement hydration reaction produces a large internal temperature upsurge. Due to the poor
thermal conductivity of concrete, a huge gradient forms soon after between the extremely hot core of the pouring
and its quickly cooling outer surface. Considering the poor tensile strength of early age concrete, the rising thermal
tensile stresses at the surface might cause thermal cracking. This could potentially lead to a structure prematurely
failing to reach its serviceability requirements or even suffering a structural failure. Some solutions for the
prevention of this phenomenon are aggregates precooling, pipe cooling, superficial thermal insulation and
alternative bay construction [112]. Nevertheless, the importance of monitoring the concrete’s temperature during
the construction period (pertaining to the SHM field) cannot be understated.
On such a topic, Li et al. [20] reported a BOTDA DOFS temperature monitoring of a bearing platform of a main
pier pile cap pertaining to the 1073 m long Hezhang super-long-span bridge. The 58 m long optical fiber cable was
deployed in a planar cross-section (as sketched in Figure 41) in areas resistant to damage and tied to the rebar using
cable ties.
Figure 41. (a) A 3D sketch and (b) a cross-section of the DOFS deployment layout for temperature measurements in the
case study pile cap [20].
The concrete temperature variations were measured for four consecutive days after pouring and three extra days
in the long-term by means of both DOFS, point temperature sensors and precision thermometers for comparison
purposes. The DOFS readings (characterized by accuracy of 0.3 °C) visible in Figure 42 were reported to be in
satisfactory agreement with those extracted with conventional temperature sensors (the maximum difference being
0.23 °C).

Chapter 5. Published Journal Articles | MATTIA FRANCESCO BADO
131
Figure 42. Temperature variation as a function of the DOFS coordinates specified in Figure 41 [20].
Ouyang et al. [112] deployed a Raman-based DOFS to measure and monitor the concrete temperature during
the sequential construction of an intake tower of the Qianping reservoir project, on the Huai River (China). In
particular, the authors introduced a framework for the evaluation and control of the concrete cracking risk by
integrating the DOFS measurements with an inverse analysis method based on temperature simulation and
consequently thermal stress simulation. The DOFS was deployed on a horizontal double S layout (bonded on a steel
frame) with the peculiarity that the single cable is passed through the designed path twice. As a result, the
temperature distribution along the cable always ended up showing a mirrored profile which facilitated the mapping
of the measuring points on the cable. As previously mentioned, in order to expand the significances of the local
temperature measurements to the whole structure, numerical simulations of temperature and thermal stresses were
conducted by FEM analysis. The effectiveness of the above methodology to the construction process, was verified
when, upon the drilling out of several concrete cylinders (hydration around 90 days), their examination showed
hardly any concrete cracking.
Moving on from the bridge’s SHM, interesting results are reported by De Battista et al. [113,114] regarding the
long-term BOTDA DOFS monitoring of two columns and two core walls (as in Figure 43a) of the 163 m, 50 storeys
tall Principal Tower (London, UK). The goal, assessing the combined structural shortening caused by the
superimposed load, creep and shrinkage during the construction phase. Indeed, the authors highlighted the
importance of establishing the floor-to-floor axial shortening of vertical load-bearing elements and their differential
shortening (whenever they are characterized by different stiffness) for the installation of finishes and partitions on
the lower floors. Thus the importance of integrating the designers’ empirical shortening calculations (adjusting them
if necessary) with in-situ continuous distributed measurements. DOFS was then the ideal candidate for such goal,
allowing for the calculation of the axial deformation at any time during the construction and along the whole height
of the completed elements. Consequently, each monitored element was instrumented with two DOFS (measuring
strains and temperature) fixed to the reinforcement (as in Figure 43b) before embedding them inside concrete.

Chapter 5. Published Journal Articles | Mattia Francesco Bado
132
(a) (b)
Figure 43. (a) Location of the instrumented columns and walls and (b) DOFS tied to the reinforcement prior to concreting
[114].
The DOFS monitoring started on 3rd September 2016 and since then measurements (with a spatial resolution of
1 m) were performed at least twice every hour. Expectedly, the authors detected that the columns shortened
significantly more than the walls throughout the construction causing a non-negligible differential shortening
between the two. For example, as visible in Figure 44 whilst column C8 suffered a shortening of 60.3 mm at level
38, simultaneously wall W2 shortened by only 10.2 mm. This also occurred, with a smaller magnitude, between
two columns with different cross-sections for example at the end of July 2017, the maximum shortening recorded
at level 31 on column C8 was 36.6 mm whilst that on column C9 was 32.6 mm, approximately 11% less.
Qi et al. [115] also instrumented in a similar manner a structural wall pertaining to a deep foundation pit
supporting system for the excavation of a subway station in Suzhou (China). Here, a PPP-BOTDA DOFS integrated
more conventional monitoring methods, namely steel-bar meters, inclinometer, and water-level observation hole.
According to the authors, at each excavation stage, the strains induced on the wall by the active and passive earth
pressure were easily obtained by means of DOFS, thus leading to the assertion that the fiber could easily substitute
the other classic tools.
Broth and Hoult [116] assessed the dynamic sensing capabilities of an OFDR DOFS system by performing in-
situ monitoring of a 9.24 m cast-in-place RC T-beam located below a multi-purpose room located in the Queen’s
University campus in Kingston, Ontario, Canada. The application of the dynamic loads was achieved by having 38
students align themselves across the full span of the classroom (distributed test) and tightly gather over the midspan
of the beam (point load test) before repeatedly jumping in unison over the instrumented specimen.

Chapter 5. Published Journal Articles | MATTIA FRANCESCO BADO
133
Figure 44. The total cumulative axial displacement (negative = shortening) of the instrumented columns C8 and wall W1
measured at the mid-height of every level during the first 12 months of construction (adapted from [114]).
The DOFS output led the authors to confirm that, through the use of the OFDR DOFS system, both static and
dynamic concrete strains could be successfully measured. Furthermore, the observed trends in the data from both
the linear potentiometers and distributed sensors were in good agreement, suggesting the latter’s ability to accurately
capture a beam’s true dynamic behavior. Finally, DOFS was reported to successfully provide the dynamic response
factor of the instrumented structure, the distributed crack widths and the deflected shapes.
Brault and Hoult [117] investigated the use of OFDR DOFS to monitor three beams of a newly constructed RC
building subjected to load testing. The investigated structures were three cast-in-place RC elements, namely a beam,
a drop panel and a larger beam. The elements were first sanded along the fiber pathway, the latter was then cleaned
with water and 99% isopropyl alcohol and, on it, the fiber was bonded with a two-part adhesive. The load test was
performed as follows. For the beam and the drop, the measurements were performed prior to loading, during an
initial application of the load (using two scissor lifts), during the positioning of six scissor lifts at once and finally
once all scissor lifts had been removed. According to the authors, DOFS efficaciously captured inflection points,
moment transfer at the supports, crack locations and crack openings. Finally, the authors reported the average crack
spacings and the maximum measured crack openings.
Proceeding to the third and last topic of the present section, Wang et al. [118] used five BOTDA DOFS for the
detection of transversal and longitudinal strains inside a multilayered asphalt pavement under heavy traffic and

Chapter 5. Published Journal Articles | Mattia Francesco Bado
134
temperature loads. They pointed out that the deflection-induced tensile strains in the bottom pavement layers could
lead to potentially permanent deformations under heavy traffic flow and at high temperatures. The DOFS extracted
results revealed that the paving of the second asphalt concrete course could bring about large transversal and
longitudinal strains on the previously built bottom layer due to the compressive rolling action. Later, when the road
became operational, different tensile strain evolutions were observed in the transversal and longitudinal sections.
For example, the asphalt pavement adjacent to the intersection exhibited high strain levels induced by vehicle
turning and braking effects. It was therefore deemed prone to tensile strain-induced cracking. Large tensile strains
were also detected along the vehicle-track direction, even though at a much lesser degree than the former. The daily
temperature variations altered both transversal and longitudinal strains increasing (or decreasing) the measured
strains of around 100 με.
Rabaiotti et al. [119] acknowledged the presence of similar risks for airfield pavements, especially when taking
into consideration their considerably larger loading. The authors further elucidated that, for such a particular
application, the main challenge lied in avoiding damage to DOFS during the asphalt compaction process which
usually involves high temperatures (exceeding 140 °C). To tackle this issue, ad hoc strain (V3 and V9) and
temperature (T) sensing cables were developed (illustrated in Figure 45a,b) using armored DOFS cables, metal
tubes and PA outer sheaths.
(a) (b)
(c) (d)
Figure 45. (a) Photograph of the DOFS cables, (b) an illustration of their cross-sections and (c) of their designed
installation position and finally (d) photography of the deployment process (adapted from [119]).

Chapter 5. Published Journal Articles | MATTIA FRANCESCO BADO
135
In the present project, BOTDR and Rayleigh-based Swept Wavelength Interferometry DOFS were embedded in
two pavement layers in 150 m long loops. The deployment steps were performed as follows. Initially, the fibers
were laid out on the substrate layer, followed by their pre-straining and fixing in place (Figure 45c,d). After such,
for better protection against the rolling compactor machine, the sensors were covered manually with finer asphalt,
before the overlying layer was poured. The test started when a plane was pushed backward in a perpendicular
direction to the fiber loop resulting in sampled strains illustrated in Figure 46.
Figure 46. Strains measured along the sensors when the case study airplane rear landing gear was rolled on them [119].
The authors observed that the stiffer V3 cable seemed less capable of following the pavement’s high strain
gradients versus its V9 counterpart. Additionally, the strains measured in the lowest layer (13.5 cm depth) were
expectedly smaller. In conclusion, this DOFS-based testing methodology was commended for the detection of
problematic zones and quality issues in the realized pavement in addition to validating the design assumptions.
Finally, an additional transportation-focused SHM application is also reported in Wheeler et al. [120] where
OFDR DOFS (OBR Luna ODiSI-B model) were employed for the assessment of distributed dynamic strains of a
steel rail during the passage of rail traffic. A preliminary laboratory test was aimed at studying the difference in
monitoring performance whenever the fiber was bonded to the rail with minimal and optimal (grinding and cleaning)
surface preparation. After having observed that both yielded similar results, the authors commended the former as
the best option for rapid field installations. Additionally, the authors defended the option of bonding the fibers to
the rail foot and the railhead which, despite being prone to be affected by localized strains under heavy train wheels,
allowed for more accurate rail curvature calculations thanks to the greater distance between the two DOFS. The
following reported step was a field test performed near Kingston (Canada) where the DOFS was bonded according
to the guidelines established earlier as visible in Figure 47. Vehicular loading under low vibration conditions (hi-
rail vehicle) and high vibration conditions (in-service passenger train) was applied on the rail. Figure 48 represents
the strains measured by the upper and lower fibers for the hi-rail vehicle at three different positions along the
instrumented section of the track.

Chapter 5. Published Journal Articles | Mattia Francesco Bado
136
Figure 47. Installation of fiber on rail [120].
Figure 48. DOFS-sampled strains for three different hi-rail vehicle positions along the track (adapted from [120]).
The authors reported that it was feasible to study the variability in track support along a section of rail on the
grounds of DOFS rail curvature measurements. Yet, they also acknowledged, that despite dynamic distributed rail
strains producing low vibration could be measured, the same thing could not be said in the presence of high
vibrations. Indeed, the quality factor of the strains resulting from the transit of the passenger train was below the
DOFS manufacturer’s minimum recommended threshold.
Conclusively, the present sub-section started describing various DOFS applications for the SHM assessment of
bridges. The following key observations were reported:
DOFS can be embedded inside prestressed concrete beams, preferably combining a strain sensing fiber with
a temperature sensing one in order to remove any temperature effect on the Brillouin frequency shift, such
that the true strain in the DOFS can be calculated. Alternatively, for box girder beams, DOFS can be simply
glued inside their hollow cross-section;

Chapter 5. Published Journal Articles | MATTIA FRANCESCO BADO
137
A reported application described the temperature sensing cable to be filled with gel inside which the DOFS
was suspended in order to prevent the shear transfer between the concrete and the sensing core;
DOFS was successfully implemented inside bridge RC beams for the purpose of monitoring damage and both
immediate and time-dependent effects (prestress losses for instance).
Furthermore, the temperature monitoring during the pouring of mass concrete structures (dams, nuclear plants,
massive foundations, etc.) was successfully performed by means of both BOTDA DOFS and Raman backscattering-
based DOFS with an accuracy of 0.3 °C.
On the monitoring of buildings by means of DOFS:
The shrinkage and creep-induced shortenings (and differential shortenings) of the columns and structural
walls of high-rise buildings can be monitored with a single BOTDA DOFS stretching across all the building’s
floors. The sampled differential shortenings in such kind of structures can be very relevant such as was the
case in the reported assessment of the shortenings of the Principal Tower C8 column (60.3 mm) and W2 wall
(10.2 mm);
Following both static and dynamic testing of multiple buildings’ RC beams, the authors of the relative
publications state that, through the use of the OFDR DOFS system, both static and dynamic concrete strains
could be successfully measured;
The above mentioned DOFS-powered tests further reported an effective capturing of structural inflection
points, moment transfer at the supports, crack locations and crack openings;
In all cases, DOFS were bonded to the surface of RC elements after sanding the latter along the fiber pathway,
cleaning it with water and 99% isopropyl alcohol.
Finally, on the monitoring of roads by means of DOFS:
The strains transferred to a multilayered asphalt pavement can be monitored by means of embedded DOFS.
This fiber deployment’s main criticality is during the asphalt compaction process which further involves high
temperatures. To counteract any such adversity specific high-resistance DOFS cables were employed in
addition to manually covering the DOFS with finer asphalt, before pouring the overlying layer;
OFDR DOFS (OBR Luna ODiSI-B model) was employed to successfully assess the distributed dynamic
strains of a steel rail during the passage of low-speed and low-vibration rail traffic but were unsuccessful for
high-speed high-vibration ones;
OFDR DOFS reported very similar reading qualities between a DOFS cable bonded to a steel rail with
minimal and optimal surface preparation (grinding and cleaning);

Chapter 5. Published Journal Articles | Mattia Francesco Bado
138
A suggested DOFS deployment methodology was bonding DOFS to the rail foot and to the railhead which,
despite being prone to be affected by localized strains under heavy train wheels, allows for more accurate rail
curvature calculations thanks to the greater distance between the two DOFS.
For the readers interested in further reading on DOFS-based SHM of rails, the authors refer to two recent
comprehensive literature review articles, namely Du et al. [32] and Sasi et al. [121]. Instead, for further reading on
DOFS for Civil and Infrastructure Engineering sensing the authors recommend Soga and Luo [15].
6. Geotechnical Applications
Geotechnical Engineering covers a wide range of applications amongst which pile foundations, soil movements
(landslides and soil subsidence), stabilization anchors, mining and more. Each of these has the potential for a DOFS-
powered SHM integration and their relative literature review will receive independent scrutiny in the present
section.
6.1. Pile Foundations
Starting from pile foundations, these are commonly used whenever vertical loads are too high to be carried by
shallow foundations (like in the case of high-rise buildings) and/or when the soil’s bearing capacity is not suitable
to carry the designed loads. Now, considering the rapid urbanization process occurring nowadays all over the world,
skyscrapers and mega infrastructure are becoming commonplace solutions to the novel requirements of our modern-
day society. As such, pile foundations have seen increased use in the latest years, bringing along a stronger focus
on the methodologies for testing and monitoring their performances. In particular, large research efforts have been
dedicated to surpassing the limitations intrinsic to the traditional monitoring tools (such as SG) commonly employed
for performing the required tests. Indeed, traditional sensors are easily destroyed in complex geotechnical
environments and are prone to rust damage and electromagnetic interference [122]. Predictably though, their largest
limitation is the concentrated nature of their measurements. This is especially off-putting when compared against
the much broader global structural behavior whose knowledge is required by an engineer to draw conclusions on
the carrying capacity of the structure. Instead, as foreshadowed in Section 2, OFS are characterized by corrosion
immunity, high durability, resistance to electromagnetic interference, small size, lightweight and, most crucially,
they easily surpass the concentrated measurement limitation. In more detail, as clearly illustrated in Sienko et al.
[123] for the example of pile monitoring, traditional monitoring tools can carry out measurements only on a
concentrated scale (as visible in Figure 49a). Whilst the situation can be improved by installing several sensors
along the monitored axis (quasi-distributed sensing illustrated in Figure 49b), the resulting profile still lacks
sufficient accuracy to properly represent the actual pile strain profile. Distributed sensing, instead, provides
complete access to this data (Figure 49c).

Chapter 5. Published Journal Articles | MATTIA FRANCESCO BADO
139
Figure 49. Measurement schemes for concrete piles: (a) spot, (b) quasi-continuous, (c) distributed [123].
The two kinds of pile whose testing methodologies have received a significant performance boost from the
integration of DOFS are the Continuous Flight Auger (CFA) or Auger Cast Piling and the Rotary Bored Piling.
Research articles on their testing procedures are herein reported.
Starting from the CFA, when constructing piles under groundwater level or soft ground conditions, in order to
prevent the collapse of the soil after drilling the borehole, continuous down–up concreting is performed as the auger
drill is extracted (the concrete is pumped through a hollow shaft in the auger). The concrete hinders the penetration
of groundwater and soil in the borehole. A reinforcement steel cage is then inserted in the filled borehole as soon
as the concrete injection is terminated. Yet, as stated by Seo [7], the use of the CFA is not entirely failure-proof.
Indeed, the force distribution along a column and its base’s load-bearing capacity might be affected by issues such
as cross-sections reductions or bulge formations (soft soils), soil mining problems (loose gravel and sand can be
mixed with concrete materials at the bottom of the pile), hole stability and auger rates control problems (ground
with voids or water pockets) [123]. The assessment of the column force distribution and base load-bearing capacity
is, therefore, a key aspect of SHM and was, therefore, the topic of numerous experimental campaigns.
Seo [7] instrumented the steel cages of a 25 m deep CFA pile with both strain and temperature BOTDR DOFS
(as visible in Figure 50) in addition to standard SG and extensometers. Interestingly, a certain prestress was applied
to the strain DOFS in order to facilitate the recognition of its frequency data location during the data analysis (its
central frequency was, therefore, higher than the temperature cable). The compression load was initially increased
to 8 MN, it was then unloaded and finally loaded again up to 20 MN. Seo assumed that if the soil had mixed with
the concrete at the bottom of the CFA pile, large strains would be reported in that location. However, the maximum
compressive strain was only 200 με, thus confirming the proper functioning of the pile. Finally, Seo studied the
pile’s skin friction at its bottom reporting a significant increase with the applied load.
A similar testing methodology was presented in Kania et al. [124] who monitored, by means of OFDR DOFS,
the strains and temperature inside different kinds of piles subjected to static load testing. The authors provided a
comprehensive look at the proper way to perform a DOFS structural instrumentation.

Chapter 5. Published Journal Articles | Mattia Francesco Bado
140
Figure 50. Installation of the DOFS and the pile [7].
Such work is commendable as it can provide an initial quality boost to similar future tests and, as such, some
key aspects are reported in the following. First of all, if the pile may potentially be subjected to bending, Kania et
al. suggested the mounting of a pair of strain sensors in opposite locations in order to measure both its compressive
and tensile strains. Furthermore, they recommended to always install two fibers at each location for both redundancy
purposes and, in case of damage or unexpected results, for having access to independent verification data. Then,
similarly to what was done in [7], they introduced the idea of a pre-tension of the DOFS cables to an amount larger
than the expected compressive strain in order to align its length scale. Finally, once the sensing cables are fixed to
a structure, they proposed the marking of the points of interest (e.g., pile head, specific depths, and pile toe) by
pressing or heating/cooling the cable in that specific point/s and recording the location of the signal. In [124], the
piles in question were a steel pile, a CFA pile and a precast pile which were all instrumented with different fiber
deployment methodologies. For the bonding to the steel pile, additional steel rebars were welded to its surface as a
guide and protection for the DOFS (see Figure 51a).

Chapter 5. Published Journal Articles | MATTIA FRANCESCO BADO
141
Figure 51. Typical cross-section layout of DOFS cables attached to (a) a steel pile and to (b) a steel cage; photography of
the latter is represented in (c) (adapted from [124]).
The fibers were bonded to the CFA pile’s reinforcement cage with epoxy glue (see Figure 51b and c) and, for
the precast concrete pile, they were installed into previously incised grooves and then fixed with epoxy. The authors
studied and reported the steel pile’s strains induced by its driving in the ground (Figure 52a), the CFA pile’s strain
distribution during a test which included twelve incremental load steps (Figure 52b), the precast concrete piles’
operational strains (which were influenced by the evolution of several cracks as visible in Figure 52c), the short and
long term influence of temperature on the sampled strains and finally the influence of lateral forces.
(a) (b) (c)
Figure 52. Distribution of strains along individual DOFS (a) after the driving of a steel pile (b) during a static load testing of
the CFA pile and (c) the crack evolution inside a precast concrete pile (adapted from [124]).
Sienko et al. [123] also performed a 12 m long strain and temperature OFDR DOFS monitoring on a CFA pile.
The article reported the pile strains sampled during a multi-load steps compression test in addition to its accumulated
shortening. The strain profiles clearly showed some local extremes which were attributed to a reduction of the
column stiffness (reportedly due to the reduction of the pile’s cross-sectional area or the concrete’s modulus of
elasticity).

Chapter 5. Published Journal Articles | Mattia Francesco Bado
142
Moving on to Rotary Bored Piling, differently than CFA, after drilling these require additional ground support
such as casing or drilling fluids but can reach much deeper depths ~60 m (versus its CFA counterpart ~25 m) thus
being able to accommodate higher loads, bypass underground impediments and infiltrate the ground which could
otherwise be too hard for CFA drilling.
Cheng et al. [125] reported the outcome of a Bi-Directional Static Load Test (BDSLT) on a BOTDA DOFS
instrumented bored pile with the aim of verifying the geotechnical design parameters for the highly fractured
limestone formation on which the pile’s residential building project was located. BDSLT represents a deviation
from the classic but reportedly inferior (time, cost and risk wise) Maintained Load pile Tests (MLT) as it avoids the
latter’s massive reaction systems (i.e., dummy piles, platforms, reaction beams or concrete blocks) in favor of jacks
incorporated inside the pile shaft itself. Whilst the conventional MLT systems apply the testing load from the top,
the BDSLT’s bidirectional jacks expand separating the pile’s body into the upper pile section and lower pile section
(shafts) pushing the former upwards (mobilizing the shaft friction) and the latter downwards (mobilizing the shaft
resistance and end bearing). The case study pile was 57.3 m long with a 1.35 m diameter and the bidirectional jack
embedded at 5.8 m from the pile toe. Its axial strains were sampled with four single-core DOFS, reinforced by
several strands of steel wires and a polyethylene jacket, bonded to four sides of the reinforcement cage at 90-degrees
from each other. Figure 53a displays the continuous axial strain profile at several loading stages of the working load
(WL). The authors reported witnessing a consistent DOFS strain increment as the load increased along with
unexpected spikes (between 16 m to 43 m depth) on all four independent fibers likely due to the pile’s stiffness
variation (similarly to [123]). Despite acknowledging the strong possibility of the bored pile’s shape non-uniformity
and concrete stiffness inconsistency, due to the inaccessibility of the stiffness data, the authors assumed it constant
for the calculation of its axial forces (Figure 53b). The sampled DOFS strains successfully diagnosed an unexpected
and potentially disruptive low shaft friction, hypothized to be caused by unaccounted features of the karstic
limestone and of the inclined bedrock.
Xu et al. [126] and Pei et al. [21] presented a new bored piles BOTDA DOFS installation methodology and
reported the outcome of its application to three bored piles (20.9 m embedded depth and 3.0 m diameter) pertaining
to a retaining wall reinforcing a soil slope subjected to multi-stage excavations. Similar to [124], in order to obtain
both the axial and bending strains along an instrumented pile, two sets of DOFS sensors were installed
symmetrically with respect to their axis (as in Figure 54). The maximum lateral wall deflection was assessed to be
0.05–0.1% and the measurements obtained from the BOTDA DOFS were found to be in good agreement with the
one coming from parallelly installed inclinometers.

Chapter 5. Published Journal Articles | MATTIA FRANCESCO BADO
143
(a) (b)
Figure 53. (a) Changes in strains along the pile during Bi-Directional Static Load Test (BDSLT) and (b) the calculated load
distribution along it (adapted from [125]).
Figure 54. Fiber optic deployment layout in the case study bored pile [126].

Chapter 5. Published Journal Articles | Mattia Francesco Bado
144
Guo and Zhao [127] performed a BOFDA DOFS monitoring of two 39 m long and 1.5 m diameter bored piles
buried in a sloping terrain thus also subjected to both vertical and horizontal loading. The DOFS was bonded to the
pile’s steel cage to form a U-loop monitoring its two sides and its bottom. Once again, strain profile peaks were
present and were attributed to inhomogeneities of the pile’s material. The pile’s axial force calculated per DOFS
was compared with the ones extracted by an embedded steel stress meter with good agreement between them.
Finally, Gao et al. [18] proceeded in a very similar way instrumenting a bored pile with U-looping single-mode
GFRP-covered BOTDR DOFS fixed to its steel cage. Additionally, the results were filtered using three different
noise removal methods.
6.2. Soil and Rock Deformations
Ground deformations are key study points for Geotechnical Engineering (land subsidence, ground fissure and
surface collapse amongst others) as serious geological disasters may occur on their back. Their monitoring and the
development of related early warning systems are crucial for the prevention and control of such disasters.
Conventional technologies such as tiltmeters, inclinometers and multipoint extensometers have been adopted for
this purpose for decades but the high costs and logistical issues associated with the creation of automated systems
make them impractical for long term and massive deployments [128]. In response, the industry is slowly shifting to
alternative and more performant ground deformation monitoring technologies such as DOFS.
The first scrutinized geotechnical issue will be land subsidence, explicitly the gentle down warping and/or
sudden sinking of discrete segments of the ground surface [129]. One of its main causes is the intense extraction
and exploitation of groundwater (but also of crude oil and natural gas) which leads to the compaction and collapse
of underground aquifer systems. Soil subsidence has been the topic of an intense DOFS-powered investigation
effort spanning multiple articles concisely presented in the following paragraphs.
Liu et al. [128] performed a long-term BOTDA DOFS monitoring of subsidence-induced ground fissure
deformations of a field in Wuxi City, China. A special high-strength optical fiber was used with a measurable strain
limit of 15,000 με. The DOFS was placed in a 32 m long, 75 cm deep and 45 cm wide trench excavated at a 45
degree angle compared to the fissure direction. In order to compensate for the effect of seasonal temperature
variation, a temperature-sensing optical fiber was also inserted in the DOFS-containing tube (placed for protection
purposes). In the span of almost 5 years, nine measurements were carried out indicating a ground subsidence-
induced total cable stretch of 11.3 mm. The latter was mainly concentrated in two areas (C and D in Figure 55)
where the largest strain evolutions were reported.

Chapter 5. Published Journal Articles | MATTIA FRANCESCO BADO
145
(a) (b)
Figure 55. (a) Monitoring area plan and (b) resulting strains (adapted from [128]).
Wu et al. [130] applied DOFS technology to a laboratory experimental study on land subsidence caused by
seasonal water level fluctuations and dewatering. In particular, the specimen was a small-scale sand–clay
interbedded model box built for the purpose of carrying out consolidation and rebound tests during two drainage–
recharge cycles. In order to analyze the deformative response of each of the specimen’s layers to the water level
variations, the authors placed inside it two different sensing cables (a special tight-buffered PPP-BOTDA single-
mode DOFS and a carbon fiber tube with FBGs) with small Plexiglas disks fixed perpendicularly to the cables in
order to increase the soil/fiber bond. The PPP-BOTDA DOFS-extracted results indicated that the layers were
compressed during drainage and rebounded during recharge, with larger deformations in the clay layer than in the
sand. Furthermore, the deformation of the sand layer was synchronous with the water content variations, whilst the
clay’s lagged behind due to its lower permeability coefficient.
The same authors published in Zhang et al. [131] the results of an in-situ experimental campaign (Suzhou, China)
aimed at acquiring data on the subsidence and strata subsurface vertical deformations by means of a BOTDR DOFS
embedded in a borehole (as in Figure 56). After the 200 m deep borehole was excavated, the DOFS cable was
attached to a cone guide and lowered into the former. The hole was then backfilled with a mixture of sand, clay and
gravel. Then, by means of direct integration, the authors converted the DOFS strains sampled between December
2012 and November 2014 into a numerical estimation of the compaction or rebound that occurred in that time. The
results highlighted the rise of positive strains between 60.3 m and 67.9 m depth indicative of an overall rebound of
the pumped aquifer.

Chapter 5. Published Journal Articles | Mattia Francesco Bado
146
Figure 56. Illustration of soil subsidence and DOFS vertical deployment in a borehole as performed in [131].
Liu et al. [22] performed a very similar monitoring campaign in a 130 m deep borehole in the Yangtze River
Delta region (China) using BOFDA DOFS technology. The authors specify having backfilled the drilled borehole
in accordance with the surrounding stratum type for consistency purposes.
The monitoring, which lasted 2 years, successfully detected the occurrence of compression-rebound cycles
simultaneous to the draining–recharging one. Additionally, being the soil rebound smaller than that of compression
it was assessed that irreversible deformations had occurred. Similar to all the previous articles, the authors concluded
suggesting that DOFS provides clear advantages for the analysis and early warning of land subsidence mechanisms.
According to Cheng et al. [17], an additional purpose that DOFS could cover is the monitoring of drying-induced
shrinkage and desiccation cracking in clayey soils. In order to investigate such possibility, the authors parallelly
placed three differently coated optical fibers (thermoplastic polyester elastomer jacket, nylon jacket and acrylate
coating) in a mold before pouring the soil slurry. The authors reported BOTDR DOFS-sampled strains in the order
of several micro strains when the soil was over-saturated, their gradual increase with the drop of water content (and
the increase in the soil/fiber interfacial shear stresses) and finally their drop after the development of desiccation
cracks (reportedly due to fiber/soil decoupling). The observations on the performance of each fiber and their strong
impact on strain measurement are herein reported. The optical fiber with acrylate coating was deemed not suitable
for the test due to its fragility and the poor interfacial coupling with the soil. Oppositely, the optical fibers covered
with TPEE jackets and nylon were deemed suitable with the former being more sensitive to water content variations.
Soil shear deformations are a supplementary geotechnical parameter to closely monitor for stability assessments
and for early warnings of potential geo-hazards [132]. The following articles present DOFS-powered SHM
campaigns developed in this framework.

Chapter 5. Published Journal Articles | MATTIA FRANCESCO BADO
147
Wang et al. [133] reported the results of a BOTDA DOFS monitoring of the 408 km long Trans-Andean Pipeline
(Peru). Given that soil shear movements could lead to movements, deformations and even fracture of the pipeline,
an IEC 794-1 standard DOFS cable (capable of monitoring movements as small as 5 cm) was positioned in the
former’s trench in order to detect the appearance of any such phenomena. Early warnings would trigger a patrol’s
damage assessment and the prompt strengthening of the pipeline whether necessary. The system reportedly warned
of the occurrence of rockfall and a water seepage-induced collapse of the pipeline trench (as visible in Figure 57).
Figure 57. Monitoring chart and site map of pipeline trench collapse accident [133].
Zheng et al. [134] attempted to determine the performance of a BOTDR DOFS monitoring system for the
detection of deformations induced by shear sliding on rock slopes. An initial direct-shear laboratory experiment
was performed in order to investigate DOFS’ monitoring effectiveness in this environment, finding a high
correlation between predicted and tested results (average ratio between 0.974 to 1.081). Following such, the setup
was applied in an in-situ shallow artificial slope monitoring test whose results were, once again, reportedly similar
to the predicted ones. According to the authors, these results suggested OFSs applicability and accuracy for slope
deformation.
On the same topic, Wu et al. [132] raised the question of whether the slip between OFDR DOFS cables and soil,
that could potentially occur during soil shear deformation applications, would yield strain measurement errors. To
answer the matter, the authors performed a laboratory direct shear test with different DOFS/soil anchorage
methodologies. These included surface-mounted heat-shrinking tubes (V1 in Figure 58) whose post-shrinking local
corrugations supposedly enhanced the cable-soil interfacial bonding, aluminum block anchors (V2) and no
anchoring (V3) for reference purposes. The test results showed that for small soil shear displacement (9–15 mm),
good soil displacement estimations could be extracted even with no additional anchorage (V3). Beyond such
displacements, though, the non-anchored cables slipped from the surrounding soil (leading to smaller detected
strains) whilst the block and tube anchored ones still maintained a well-coupled state. The authors concluded by
suggesting the use of block anchors for shallowly-embedded field applications and tube anchors for high overburden
pressure scenarios.

Chapter 5. Published Journal Articles | Mattia Francesco Bado
148
Figure 58. Different kinds of anchors used in the test from top to bottom: V1 tube-anchored cable, V2 aluminum block
anchored cable, V3 smooth cable [132].
Shear deformations were also studied in Schenato et al. [135] in the framework of a laboratory large-scale
physical landslide model monitored with an OFDR DOFS deployed in the latter’s body. The shallow landslide was
triggered by artificial rainfall which was sustained until complete slope failure. The authors’ most important
takeaway was the possibility of observing through DOFS precursory failure signs well before the slope collapse
thus being able to gain insights into its failure dynamic.
Zhang et al. [136], Chen et al. [137] and Xu et al. [138] remarked that adverse phenomena decreasing the carrying
capacity of a railway subgrade soil (soil cave or karst sinkhole collapse) could severely impact the latter’s viability
and train derailment risk. Thus, the importance of a train track subgrade SHM. The articles report a common
BOTDR DOFS subgrade settlement monitoring test aimed at determining their viability for such kind of monitoring.
In this test, a 4 m long DOFS was embedded into a soil subgrade crossing the roof of a 100 cm wide pre-made soil
cave. The four stages collapse of the latter led to a 147 cm wide superficial collapse measured by means of both
DOFS and micrometer. Their comparative maximum relative error was 5.28%. The common conclusion was that
DOFS can effectively monitor a sinkhole collapse with relatively high precision.
6.3. Soil Stabilization Anchors
After discussing soil deformations and landslide DOFS monitoring, the logical next step is the monitoring of
stabilization anchors. Starting from Cola et al. [139], the authors set themselves to monitor the strains of an OFDR
DOFS embedded with the tendons inside a composite anchor. These are special hollow steel bars coupled with
tendons cemented in the inner hole to increase the global anchor tensile strength for the remediation of unstable
slopes. The installation was reportedly performed in two steps. The first saw the installation of the composite

Chapter 5. Published Journal Articles | MATTIA FRANCESCO BADO
149
anchors using a self-drilling technique whilst the second saw the insertion of one or more harmonic steel tendons
instrumented with OFDR DOFS positioned in the bar’s inner cavity as in Figure 59.
Figure 59. DOFS installation by means of plastic hooks for coupling the DOFS in an anchor’s (a) extremity bar and (b)
internal bar [139].
Once the instrumented anchors were installed the system permitted a millimetric evaluation of the axial force
distribution in the anchor, of the soil–anchor interface actions and of the stabilizing capability associated with the
specific hydrogeological conditions of the site. According to the authors, the extracted strain profiles had similar
profiles. All had their respective maximum strains sampled just behind the external plate and slowly decreasing
strain values when moving inside the ground. The strains decreased to almost zero at about 16 to 17 m from the
slope due to the activation of distributed shear stress along the soil–bar interface.
Lienhart et al. [140] proceeded in a similar way to monitor multiple Single Borehole Multiple strand Anchors
instrumented with two OFDR DOFS and subjected to a pull-out test. The fibers were positioned along the tendons
of each individual anchor along with two fiber loops in the grout material (see Figure 60).
Figure 60. Schematic representation of single borehole with multiple anchors and with two DOFS deployed along the
tendons of each individual anchor. Two fiber loops were also deployed in the grout material [140].

Chapter 5. Published Journal Articles | Mattia Francesco Bado
150
The load tests included a stepwise load increase. Initially, the authors reported almost uniform strains along the
free length of the anchor and decreasing strains in the tendons with increasing depth (due to the load transfer from
the anchor to the soil). As the load increased, the load transfer area widened suggesting a progressive failure of the
tendon/grout interface. The same article also reported a DOFS monitoring of the strain variation along the top and
bottom of soil nails placed into a slope in a road construction site (as in Figure 61).
(a) (b)
Figure 61. (a) Three fiber optic-instrumented soil nails at a construction site and (b) their cable layout [140].
On the grounds of the distance between the top and bottom fibers, curvature changes were derived from their
strain differences and a 7 mm vertical displacement at the front end of the nail was observed after roughly one
month.
6.4. Mining
The last geotechnical sub-topic under scrutiny is DOFS monitoring for mining applications. In Zhang et al. [24]
a similarity model was designed to simulate the rock overburden movement during the mining of a coal seam in
Huainan, China. The original 800 m mining depth and its 2.5 m thick panel were simulated by means of a similarity
model test (geometrically, kinematically and dynamically similar to the real-life case) carried out on a 4000 × 400
× 1607 mm plane stress model shelf instrumented with four DOFS cables connected to a PPP-BOTDA analyzer.
DOFS successfully detected peak tensile strains in the soft strata and the interface of soft and hard strata.
A similar test setup was used in Chai et al. [25] in order to establish ground surface movement law for deep and
extra-thick coal seam mining under the ultra-thick conglomerate. Similar to the previous article, the authors reported
that the PPP-BOTDA DOFS technology could successfully and effectively capture the surface movements and
deformations caused by mining.
Zhang and Sun [141] suggested that coal mining caused the movement of the overlying strata, thus leading to
advance abutment pressure and consequently to the deformation and damage of the floor rock strata. As such, the
authors developed a two-dimensional geological model of the advanced abutment pressure on the grounds of

Chapter 5. Published Journal Articles | MATTIA FRANCESCO BADO
151
BOTDR DOFS strain readings performed in a borehole situated in Inner Mongolia. Such a model was then
successfully validated by means of another borehole monitoring performed in the same mining area.
Finally, Lanciano and Salvini [142] presented an innovative combination of DOFS (as visible in Figure 62),
digital photogrammetry through Unmanned Aerial Vehicle, topographic and geotechnical monitoring systems for
the monitoring of the rock mass stability conditions in marble quarries in order to eliminate the risks of rock falls.
Figure 62. Geotechnical sensors (in blue) and fiber optics cable (in red) on the western (a) and southern-eastern (b) sides
of the buttress [142].
By means of a BOTDA DOFS monitoring system, some displacements were successfully detected despite their
values fell within the tolerance threshold range. No other critical situations were detected.
6.5. Sub-Section Conclusions
The present sub-section presented various DOFS SHM applications for the assessment of the performance of
foundation piles, for the monitoring of soil movements (i.e., subsidence, drying-induced shrinkage, soil shear
deformation, landslides), for the monitoring of soil anchors and mining-induced deformations. On the assessment
of the performance of foundation piles:

Chapter 5. Published Journal Articles | Mattia Francesco Bado
152
The most commonly employed deployment technique was bonding DOFS to a pile’s steel cage before
embedding the latter inside concrete. DOFS deployment techniques were also suggested for steel pipes
(bonding the fiber on its surface with the addition of steel rebars welded to its surface as a guide and protection
for the DOFS) and on pre-cast piles (DOFS were installed into previously incised grooves and then fixed
with epoxy);
Oppositely mounted strain sensors (or a single U-looping one) were used to measure both compressive and
tensile strains in those situations where flexural strains are expected (piles pertaining to retaining walls for
example);
The installation of two fibers at each location was recommended for both redundancy purposes and, in case
of damage or unexpected results, in order to have access to independent verification data;
In more than one article, DOFS reportedly provided crucial data on the pile stiffness reductions possibly due
to the decrease of its cross-sectional area and/or loose gravel and sand mixing with the concrete.
On the monitoring of soil movements:
For the monitoring of soil subsidence, multiple publications positioned DOFS inside previously excavated
boreholes before backfilling them (preferably in accordance with the surrounding stratum type) and assessing
through the extracted profiles the occurrence of soil rebound and compaction;
Superficial soil deformations, induced for example by soil subsidence, by a landslide or by a rockfall, were
successfully monitored positioning a high-strength DOFS inside a superficially excavated trench.
On the DOFS soil-embedment, low performance was detected for acrylate coated DOFS due to their fragility
and the poor interfacial coupling with the soil.
On the use of DOFS for the monitoring of large shear displacements, the suggested procedure was the bonding
of DOFS to the soil/rock with heat-shrinking tubes or aluminum block anchors.
On the monitoring of soil stabilization anchors and nails, the most commonly used method was the coupling of
one or more DOFS to their tendons. On one occasion, two fiber loops were additionally deployed in the
grout material surrounding the anchors. Overall the reported articles testified to a good DOFS strain
monitoring performance and the extraction of crucial data on the anchor load-carrying capacity.
Finally, PPP-BOTDA and BOTDR DOFS were successful in the monitoring of movements in the overlying
strata and of the advanced abutment pressure during coal seam mining. DOFS was also successfully
employed for the monitoring of the rock mass stability conditions in a marble quarry.
For the readers interested in further reading, the authors refer them to the following comprehensive literature
review articles on geotechnical [143], geophysical [13] and geo-hydrological [14] DOFS-based SHM.

Chapter 5. Published Journal Articles | MATTIA FRANCESCO BADO
153
7. Tunnels
There is no doubt that Geotechnical Engineering and Tunnel Engineering go hand in hand. This statement can
be even stretched as far as asserting that they are one and the same especially considering that proper geotechnical
monitoring systems are crucial for safe underground construction and operations. Nevertheless, keeping in mind
the difference in boundary conditions and vast application diversity, for simplicity’s sake the present article
distinguishes their DOFS monitoring in two different sections, the previous and the present one.
The ever-growing urbanization throughout the world has been the catalyst for congestion, air pollution and
surface scarceness issues. The accompanying awareness that this situation could be alleviated by means of an
underground placement of some key facilities (rapid transit, parking, utilities, storage, etc.) has led to an increased
tunneling activity. The amount of tunnels is not the only growth factor, though. Their design complexity is rising
too, encompassing longer and wider tunnels, excavations through increasingly difficult ground conditions, under
densely populated zones (thus requiring very high safety standards) and in highly seismic areas [144].
The need for a performant tunnel SHM is particularly self-explanatory, for example, in the aftermath of a seismic
event. especially when attempting to assess its residual capacity to survive consecutive seismic aftershocks. This
withstanding, SHM is equally crucial during a tunnel’s construction and service-life. As a matter of fact, both new
and existing tunnels suffer an inherent structural risk connected to the surrounding geotechnical and hydrological
conditions (new ground level constructions and excessive rain periods amongst others) as well as to unknowns
related to design assumptions and construction materials [145]. These risks may translate into the appearance of
abnormal horizontal and vertical tunnel deformations, convergence deformations (relative displacement of two
diametrically-opposed points), cracks, joint movements, water leaks and, in the worse cases, collapse. The SHM of
tunnels and underground structures is not only a key aspect for their correct functioning and safety of use but also
for the security and integrity of its surroundings. Indeed, the latter can potentially experience geotechnical condition
alterations due to tunneling (especially in the case of shallow tunneling) such as settlement troughs and holes at
ground level, groundwater level disruption, urbanizations’ drainage system jeopardizing and more [146].
Whilst the common practice for the detection of the above-mentioned tunnel structural issues (or of their
precursor signs) are regular visual inspections, these have very logical performance limitations and often require to
stop the tunnel traffic, thus strongly limiting their frequency. Alternatively, geodetic target points can be mounted
to a tunnel linings’ surface in order to measure their displacements by means of total stations. However, these
measurements also miss out on the internal strain distribution data in addition to being taken averagely only once
per day [147]. Finally, discrete and concentrated sensors also pack a very limited performance being the location
where the structural failures might appear unknown a priori thus impossible to accurately instrument. Distributed
sensing, instead, surpasses all the above limitations and positions itself as a permanent and autonomous monitoring
solution capable of measuring physical parameters along the whole length of the tunnel with a single transducer.

Chapter 5. Published Journal Articles | Mattia Francesco Bado
154
DOFS’ potential application to tunneling was proved feasible and satisfactory in a few pioneering publications
such as 2010’s Shi et al. [148] (who monitored with a BOTDR DOFS the deformations of the extra-long Taiwan
Strait Tunnel running over 150 km of seafloor geologic body) and 2015’s Gue et al. [16] (who monitored through
BOTDR DOFS London’s Royal Mail tunnel during the construction of the large cross-rail platform tunnel located
below it).
Starting the present discussion from the tunnel monitoring during their construction phase, a common building
methodology is the New Austrian Tunneling Method (NATM) which is executed through excavation sequences
that allow for the surrounding ground/rock to support itself [147]. The method’s first phase consists of the
excavation of the top-heading area of the tunnel, later supported by bolts, lattice girders and a reinforced shotcrete
(concrete spraying) lining. The second phase consists of the excavation of the bench/invert area which is later
supported by more reinforced shotcrete to form a load-bearing ring system.
Monsberg et al. [147] reported a comprehensive work on the design and realization of an OFDR DOFS
monitoring system where the fiber was installed in the above-mentioned shotcrete linings situated in a fault zone of
the Semmering Base railway Tunnel (Austria), at the time under construction following the NATM. The described
campaign saw the distributed monitoring of strains and temperature by means of a 230 m long DOFS located on
two layers of a case study tunnel cross-section (rock-side and cavity-side as visible in Figure 63).
Figure 63. DOFS installation system inside the tunnel lining: (a) Schematic representation and (b) practical realization
[147].
The several weeks-long measurements began from the moment the shotcrete started curing and continued over
the advancement of the tunnel drive construction. In order to prove the suitability of the DOFS-based monitoring
system, the results were compared with the ones coming from Vibrating Wire Sensors (VWS in Figure 63) and
geodetic measurements. Approximately 12 hours after the construction of the top-heading, the authors reported
observing compression zones at the crown and the shoulders (as reported in Figure 64).

Chapter 5. Published Journal Articles | MATTIA FRANCESCO BADO
155
Figure 64. Measured strain distribution at the rock-side layer in peripheral direction: (a) 12 hours after installation at top-
heading, (b) 48 hours after installation at top-heading, (c) 12 hours after installation at invert and (d) 48 hours after installation
at invert [147].
Then, 48 hours after the construction of the bench/invert, the deformations were reported to be almost constant
along the entire supporting ring suggesting that it formed a load-bearing system capable of coping with the
remaining loads. The authors concluded by remarking that DOFS allowed to precisely localize the maximum strain
within the cross-section instantly (differently than conventional geodetic measurements) along with its deformation
history. Yet, they also noted that the position of the sensor versus the direction of the tunnel drive significantly
influenced the results.
Whilst the presence of temporary shorings ensure the stabilization of large cross-section tunnels excavated
according to the NATM, their consequent dismantling during the secondary lining’s construction process is amongst
the most dangerous steps of the whole construction development due to alteration of the tunnel lining’s original
structural equilibrium. As such, Li et al. [149] performed a BOTDR DOFS monitoring in order to determine the
Beijing Rail Transit airport line tunnel’s deformation behavior during such shoring dismantling stage. A DOFS was
used in combination with a metal-reinforced strain-sensing optical cable (purposefully designed for harsh

Chapter 5. Published Journal Articles | Mattia Francesco Bado
156
environments). Three DOFS were positioned in three 1 cm deep longitudinal grooves incised in the tunnel primary
lining which were later sealed with quick setting high-strength mortar. The sampled measurements showed large
settlement variations during all the dismantling steps, the largest of which was 5.7 mm corresponding to a tensile
strain variation of 50 με in the crown. Furthermore, the authors were faced with the limitation of being unable to
measure directly the tunnel’s horizontal deformation due to the axial DOFS deployment along the tunnel. The
limitation was surpassed by extracting an inversion model of the vault settlement curve based on a numerical
simulation and the strains obtained using DOFS. In conclusion, the authors estimated a 0.9 mm maximum deviation
of the tunnel’s settlement.
BOTDR was also employed by Fajkus et al. [146] in order to perform a security monitoring of the structural
loads carried by an 867 m long highway tunnel under construction in Žilina (Slovakia) also following the NATM.
In this case, too, the DOFS was placed on a tunnel’s braced girder which would later be incorporated in the first of
two linings by means of concrete spraying (see Figure 65).
(a) (b)
Figure 65. (a) Tunnel and distributed temperature and strain system layout and (b) optical fiber implementation on iron
bars of the braced girder of the primary lining [146].
The authors reported the load changes (referred to in the article as changes of the Brillouin frequency) occurring
over a period of time of 5 months and hypothesize their origin to be a combination of the temperature variation (of
the concrete and the surrounding rocks) and concrete shrinkage.
As mentioned beforehand, the monitoring of tunnels under service is as important as the one during their
construction phase. A recent example of the former is reported in Gómez et al. [150]. This article reported the
implementation of an OFDR DOFS on the TMB L-9 metro tunnel in Barcelona in order to assess whether it was
affected by the construction of a residential building 14 m above it (of which roughly 37 m2 could be found right

Chapter 5. Published Journal Articles | MATTIA FRANCESCO BADO
157
above the tunnel). In particular, a 50 m long fiber was glued to the tunnel’s cross-section expected to suffer the
largest deformations (thus defined as critical section), to a segment beneath the tracks and to a segment of the linen
parallel to the tunnel (as represented in Figure 66).
Figure 66. Monitored tunnel section [150].
In this case, the asymmetrical construction-induced loading and unloading effects would not be directly
translated in a uniform pressure around the ring due to the additional presence of a bending effect. This was observed
during the in-situ monitoring which reportedly detected compression in the linen’s intrados (where the DOFS was
actually bonded) during the excavation phase and tension during the building’s construction (when the external load
was negative). For proper analysis and visualization of the data, the authors mentioned having used complex data
treatment algorithms [151] to get rid of a significant number of anomalous readings in the raw strain data. The
authors concluded by highlighting the need for general, standardized guidelines which also account for the
structure’s nature, for the temperature effects and for the adopted post-processing techniques.
Minardo et al. [152] employed distributed sensing for the long-term monitoring of a railway tunnel (originally
built in 1880 and reconstructed in 1992) in the accumulation zone of an active earthflow in the Southern Italian
Apennines. The 1 cm/year displacing landslide had caused the opening of the joints and the appearance of some
thin cracks in the tunnel. The latter had been monitored in recent years by means of a 200 m long BOTDA DOFS
hand-glued to its walls. The paper presented the results of such monitoring and in particular the increase in joint
opening/misalignment.
Further examples are provided by Inaudi and Walder [145] who reported two distributed sensing-powered tunnel
monitoring. The first was deployed in 1968’s San Salvatore Tunnel (Italy) where water accumulation behind a
concrete lining had caused its collapse. To prevent this from reoccurring, two Brillouin scattering-based DOFS were
bonded to the tunnel linings allowing for the detection and localization (with a 1 m spatial resolution) of any
hydrostatic pressure-induced deformation and cracking. The effects of temperature variations (in the order of

Chapter 5. Published Journal Articles | Mattia Francesco Bado
158
magnitude of 100–200 με) were accounted for and compensated by means of an extra temperature sensing cable. In
the second case study, the average strain distributions along five longitudinal lines of a high-speed rail tunnel in
Barcelona (Spain) were monitored. Here, two DOFS were deployed on the side walls and one on its floor, between
the two rail lines (summing up to a total monitored length of 12 km).
As seen before in [149,150] the tunnel monitoring is often accompanied by a certain amount of computational
and algorithmic work whether this is for validation, inverse-calculation or forecasting purposes.
In Zhao et al. [153] the authors performed a BOTDR DOFS monitoring system of 1984’s Dalian Baiyun Tunnel.
Here, nine 6.6 m long optical-fiber stretches were bonded to the tunnel vault with polyimide adhesive and covered
with fiber cloth. The authors used the DOFS-extracted strains to study the vault displacement which, in combination
with the surrounding rock structure’s data, yielded a Differential Evolution Algorithm capable of carrying out
inverse analyses on the major mechanical impact parameters of a tunnel’s lining structure.
Piccolo et al. [154], instead, proposed a DOFS-based methodology for convergence measurements over time of
existing tunnels. In particular, starting from experimental orthoradial PPP-BOTDA and Tunable Wavelength
Coherent Optical Time Domain Reflectometry (TW-COTDR) DOFS strain measurements, an inverse analysis
associated with a finite element model would allow gaining insight into a tunnel’s deformed geometry. In order to
understand the practicability of this procedure, the authors performed a laboratory test on a 762 mm diameter steel
ring, horizontally fixed at different points to an external reaction frame. The orthoradial strain values were sampled
by means of the two DOFS along with displacement sensors. The authors concluded by stating that the DOFS
seemed to be sufficiently performant to obtain convergence measurement. They also noticed that, as the testing
force grew, DOFS soldered to the steel ring’s surface provided better agreement with reference values compared to
the simply glued ones.
The present sub-section saw the DOFS SHM monitoring of both new and older tunnels. In the first scenario most
applications were aimed at establishing the deformations of a case study cross section by means of DOFS positioned
inside the steel lattice girders during the various stages of NATM construction. The monitoring system allowed to
instantly and precisely localize the maximum cross-sectional strains along with its deformation history (over
multiple months-long in one of the reported cases). The orientation of the sensors compared to the direction of the
tunnel drive was seen to have a large influence. For instance, in one of the reported campaigns, due to the DOFS
longitudinal deployment, the use of an inversion model of the vault settlement curve based on a numerical
simulation was necessary to establish the tunnel’s horizontal displacements occurring during the removal of
temporary shoring. Furthermore, the use of expressly designed resistant DOFS was necessary for a successful sensor
embedment inside concrete. This precaution was not necessary for externally bonded DOFS, as was the case for
most monitoring of already existent tunnels where the fibers were simply glued to the linens’ intrados. For the latter,
the main takeaway was the successful monitoring of minute but relevant deformations induced, for example, by the

Chapter 5. Published Journal Articles | MATTIA FRANCESCO BADO
159
construction above the tunnel of a residential building or by water accumulating behind a tunnel’s concrete linings
or even by the continuous effect of an earthflow occurring above the tunnel.
8. Pipelines
Pipelines, whether underground, above ground or subsea, are one of the most important ways to transport across
extensive distances key resources such as water, oil, natural gases and telecommunication cables. Furthermore,
pipeline transportation is substantially more efficient (financially, environmentally and labor-intensely wise)
compared to other ground transportation alternatives such as trucks and trains. Yet, the economic importance of
laying and maintaining pipelines is absolutely non-neglectable and should be pondered seriously. Maintenance, in
particular, is crucial in those common situations where the pipelines are located in complex and hazardous
environments (exposed, for instance, to biological and/or chemical hazards, landslides, soil subsidence and third
party interference) which might lead to issues such as pitting and patch corrosion, cracking and to an overall
degradation of a pipeline’s structural integrity. The above could even represent a great safety hazard and risk of
environmental pollution in case of pipe leaks and bursts. Thus, the constant monitoring of a pipeline’s structural
health is crucial to guaranteeing its safe functioning and to averting the substantial economic, environmental and
social consequences of its failure.
Generally, the SHM for pipelines demands the observation of their deformation, curvature, eventual leaks and
the movements of their surrounding ground. Yet, considering their kilometric lengths and beforehand-unknown
failure location, accurate structural monitoring of their entire extension is challenging for discrete sensors. This is
not the case for DOFS which completely bypasses the need to install thousands of discrete sensors (with their
complex cabling) in order to cover all the potential failure locations. This by itself makes DOFS the ideal pick for
a pipeline’s SHM.
This was clearly established by pioneering publications such as Glisic and Yao [155] (who developed a novel
Brillouin scattering-based DOFS-based method for real-time, automatic or on-demand assessment of the health
condition of buried pipelines after an earthquake) and Inaudi and Glisic [156] (who monitored a 35 years old gas
pipeline near Rimini, Italy through a Brillouin scattering-based DOFS).
More recently, Wong et al. [157] attempted to experimentally demonstrate the ability of an OFDR DOFS to
monitor the growth of fatigue cracks along a cast-iron pipeline. A case study pipe was subjected to internal cyclic
water pressure loadings after its thickness was artificially reduced in a small elliptical patch (leaving a minimum
final wall thickness of 3.5 mm) to simulate a severely corroded area. DOFS was deployed on the surface of such a
patch from the center of which a longitudinal crack appeared and started to propagate. DOFS effectively detected
the latter two phenomena but only when the distance between the sensor and the damage was less than 40 mm. The
authors concluded by stressing the importance of the orientation of DOFS and suggesting that it hinges on the
minimal critical patch and crack length that is intended to detect.

Chapter 5. Published Journal Articles | Mattia Francesco Bado
160
Ren et al. [158] also attempted to monitor both corrosion and leakage by means of OFDR. In the corrosion test,
several optical fiber sensors were bonded to a pipe’s surface in order to form a sensor array capable of monitoring
and reporting any corrosion-induced variation in the hoop strains, explicitly strains along the circumferential
direction. In the leakage test, instead, the bonded DOFS were intended to detect any leakage-induced internal
pressure drop along the pipe. According to the authors, the successful detection of both corrosion (see Figure 67)
and leaks implies OFDR’s high efficiency and accuracy for pipeline SHM.
(a) (b)
(c) (d)
Figure 67. Hoop strain nephogram when the pipe was corroded at 200 h (a) 2D and (b) 3D and wall thickness nephogram
when the pipe was corroded at 200 h. (c) 2D and (d) 3D. [158].
In recent years, pipeline leak detection has also been investigated by means of Distributed optical fiber base
Acoustic Sensing (DAS). The latter, also referred to as Distributed Vibration Sensing (DVS), belongs to the latest
developments of DOFS technologies and are part of the Rayleigh-based DOFS family. DAS is an ideal fit for
pipeline SHM as their base principle, heterodyne coherent optical time-domain reflectometry (Φ-OTDR), grants
them the ability to detect highly-dynamic vibration signals up to the kHz range. Here, the elastic waves phase change
produced by perturbing objects in the fiber’s proximity is detected by an Acoustic Optic Modulator. Thus, the phase-
sensitive OTDR can be used for real-time vibration monitoring of extended objects, e.g., bridges, dams, highways,
railway tracks, pipelines, paved paths, and many others.

Chapter 5. Published Journal Articles | MATTIA FRANCESCO BADO
161
In 2018, Stajanca et al. [159] performed a helical DAS wrapping around four segments of a 38m long DN100
pipe and simulated leaks using holey adapter caps (with circular holes of different diameters) inserted in the pipe’s
side adapter (as in Figure 68).
Figure 68. (a) Schematic illustration of the fiber helical wrapping around the pipe segments and (b) photo of one of the
pipe’s side adapters [159].
The goal, studying DAS’ potential to detect a pipe’s weak pinhole leak-induced vibrations for various
combinations of leak sizes and pipeline internal pressures. The results revealed that the DAS deployment was
capable of detecting the pipeline’s vibration modes induced by the broadband leak-noise excitation. In particular,
according to the authors, leaking through increasingly larger hole sizes led to excitation of higher frequencies
vibrational modes.
A different DAS deployment methodology is proposed in Zuo et al. [29]. In particular, the authors freely
suspended the fiber outside a 12.9 m long Ø0.3 m gas pipeline with the goal of studying the former’s leak detection
performance. As a consequence of the deployment methodology, the experiment had to be carried out in a fully
muffled chamber with a background noise of less than 40 dB. The authors reported a successful leak detection and
localization by means of detailed algorithms based on frequency domain cumulative averaging.
As previously mentioned, along with a pipes’ leak monitoring, its deformation monitoring is also of crucial
importance. As such, Feng et al. [160] reported a methodology for monitoring the upheaval buckling of subsea
buried pipelines by means of BOTDA DOFS. The authors were faced with the challenge of separately detecting a
pipe’s buckling-related bending-induced strains and axial force-induced strains instead of their compound strain.
The proposed solution was the longitudinal deployment of three DOFS sensors along a pipe at a radial distance of
2π/3 from each other in addition to a proposed mathematical process. An experimental test was then designed in
order to check the performance of such a monitoring scheme. A DOFS-instrumented 5.71 m polyvinyl chloride

Chapter 5. Published Journal Articles | Mattia Francesco Bado
162
(PVC) pipe was buried inside standard compacted sand with one of its extremities axially loaded by means of a
hydraulic jack. According to the authors, the preliminary results demonstrated the efficiency of the proposed
monitoring method despite noting that further research should be dedicated to its performance analysis when
including the complex thermomechanical circumstances of buried pipelines.
The deformation of pipelines was also studied by Zhang et al. [161] who instrumented a 4 m long PVC pipeline
with two opposite longitudinal runs of BOTDA DOFS and multiple electrical resistance SG in order to verify the
former’s monitoring performance superiority for long-distance pipelines. The pipe was gradually subjected to five
different loads in its midspan and its displacements were calculated on the grounds of the DOFS-extracted and SG-
extracted strains by means of the Conjugate Beam Method. The results led the authors to the conclusion that the
measurement accuracy of a pipeline’s displacement is correlated to the number of monitored points thus proving
the superiority of DOFS over SG-based for such applications.
Conclusively, multiple DOFS SHM studies were dedicated to the detection of pipeline leaks. This was performed
both by means of standard DOFS and DAS. When a standard strain sensing DOFS was bonded locally, in the
proximity of a corrosion-damaged patch, the results showed the need of the fiber to be close no more than 40 mm
from the damage to actually be able to detect it. Alternatively, DOFS or DAS could be wrapped along the entire
extension of the pipe to detect any potential peaking of hoop strains and vibration, respectively, indicative of
corrosion and/or leaking. The authors reported successfully detecting and localizing leaks by means of this
technique. Alternatively, DAS could be suspended outside of the pipe in order to detect any leak-induced vibrations
(if the requirement of low environmental noise can be met). Finally, in order to monitor the occurrence of pipeline
deformation, DOFS was deployed on the latter’s surface by means of a double and opposite fiber run or by means
of a triple fiber run at a radial distance of 2π/3 from each other. Tests performed with these methodologies both
yielded key deformation data.
For further reading, the author suggests the following recently published review article, Inaudi [162].
9. Wind Turbines
The popularity of wind turbines as an additional/alternative renewable source of power is steadily increasing
over the years, contributing to the reduction of fossil fuel reliance. According to a report from the World Wind
Energy Association [163] the wind power capacity worldwide has reached a total energetic value of 597 GW in
2018 with a growth of 9,1%, compared to the previous year and 10,8% versus the one before that. Worth noting is
the potential brought forwards by offshore wind power plants. These have the advantages of high wind speed, low
wind edge cutting, low turbulence, and high output [164] despite requiring considerable engineering efforts for their
design. In addition to these, novel engineering challenges are arising in the past few years as a consequence of the
increased size characterizing the newly designed/produced wind turbines (for the sake of increased productivity).

Chapter 5. Published Journal Articles | MATTIA FRANCESCO BADO
163
Thus, in order to reduce the risk of failure induced by the consequent greater forces acting on the wind turbines’
structures, a comprehensive SHM has become of paramount importance.
Coscetta et al. [164], for example, reported the results of two BOTDA DOFS powered tests aimed at
demonstrating the possibility of performing a static and dynamic strain and vibration monitoring of a 14 m long
composite wind turbine blade. In the first test, the blade was stressed as a cantilever beam (the load was applied in
the flap-wise direction) and it was monitored by a fiber attached along the middle of the blade’s upper and lower
surfaces. The resulting non-linear strain profiles were explained to be the fruit of the combined effect of the
cantilever configuration and the varying geometry of the blade itself. This aside, the authors reported a high level
of linearity between the applied load and the measured strains. In the dynamic test, a 100 kg load was applied on
the blade’s free end and the latter was put into vibration by means of an electrical motor positioned on it. Expectedly,
the amplitude of the extracted strains was larger on the clamped end of the blade than on its free one.
In Raman et al. [165], the authors stated the importance of performing a real-time SHM of the adhesives present
in a blade’s trailing edges (joining the upper and lower composite structures), a common failure location. The
article’s research efforts were focused on establishing the optimal DOFS positioning technique for multi-direction
strain monitoring within the carbon composite plies. In particular, the multi-linear placement was discouraged due
to its limited strain sensing direction (only the lateral one) and, in its stead, a dual sinusoidal placement was
commended. Indeed, the latter is reportedly able to detect strain signals both in the longitudinal and in the lateral
directions allowing the simultaneous characterization of a blade’s bending and torsional loads.
The above-mentioned wind turbine blade’s size surge has the additional side effect of increasing the overturning
moment withstood by a pile’s foundation. Zhang et al. [26] used a Differential Pulse Pair Brillouin Optical Time-
Domain Analysis (DPP-BOTDA) to monitor a 69 m tall offshore wind turbine pile (belonging to the Xinghua Bay
Wind Farm in Fujian) in order to obtain the bearing capacity of its foundation (see Figure 69).
(a) (b)
Figure 69. (a) Case study offshore turbine (b) DOFS bonded with epoxy to the sample pile (adapted from [26]).

Chapter 5. Published Journal Articles | Mattia Francesco Bado
164
The monitored concrete-filled/steel composite pile was a test sample mounted on the same offshore platform as
the actual case study one. The author’s aim was pin-pointing the pile foundation’s maximum stress location under
horizontal loading (applied by means of a horizontal reaction frame). The test, subdivided into 15 consecutive load
stages with load increments of 60 kN, yielded the maximum strain (1436 με) at the last load stage at y coordinate
−19.63 m (as visible in Figure 70).
Figure 70. Strain values per corresponding elevation from 0 kN to 900 kN [26].
Expectedly, the maximum displacement (0.79 m) occurred at the uppermost end of the fiber and the
load/maximum strain and the load/maximum displacement profiles were both found to be linear in nature. The
authors concluded commending the proposed DPP-BOTDA for any offshore wind turbine pile foundation SHM.
Conclusively, it can be stated that few DOFS wind turbines SHM were performed in the latest years. The reported
research efforts saw three different DOFS bonding conditions, one on the surface of turbine blades, one inside them
(through an innovative deployment technique named dual sinusoidal placement) and one more on the pile.
Throughout the articles, both static and dynamic tests were performed, all successfully yielding the sought-after
results. As such, all the authors commended DOFS for the SHM of wind turbines.
10. An Eye towards the Future
The present section intends to concisely report novel DOFS applications/studies that may very well pioneer new
ways of performing SHM. Whilst not all the following applications can be tagged as strictly Civil Engineering-
focused, the potential that they bring forth could definitely benefit the field in the near future.

Chapter 5. Published Journal Articles | MATTIA FRANCESCO BADO
165
For example, Fernandez-Ruiz et al. [28] introduced the idea of using the already-existing world-wide
telecommunication fiber optic network (Chesnoy [166] provides a good illustration of the latter as visible in Figure
71) for continuous, real-time monitoring of the global surface on the lookout for any seismic activity.
Figure 71. Submarine cable map in 2015 [166].
By means of the optical fibers’ ubiquity and ability to perform distributed and highly sensitive DAS vibration
monitoring, it would be possible to recognize patterns of potentially hazardous seismic activity. In particular, the
authors tested the feasibility of such a plan by monitoring a simulated seismic wave with both a seismometer and
DAS sensing fibers. The comparison of the extracted seismometer spectrogram and DAS’s output (combined with
a linear 2D bandpass filtering technique and a 1D adaptive LMS filter) showed an encouraging time–frequency
dynamics similarity (as visible in Figure 72).
(a) (b) (c)
Figure 72. (a) Spectrogram of the seismic signal measured by a reference seismograph (b) Spectrogram of the DAS data
denoised with a 2D linear bandpass filter and a (c) Spectrogram of the DAS data denoised with a 1D adaptive LMS filter
(adapted from [28])
The potential of cabled seafloor observatory networks was also discussed in Hartog et al. [167]. Here, the authors
debated the potential role of DOFS technology in evolving the traditional single-point isolated oceanographic
measurements (performed on the seafloor or on the surface with moorings, landers and arrays of surface floats) by

Chapter 5. Published Journal Articles | Mattia Francesco Bado
166
finally filling in the extensive spatial and information gaps existing between the latter. This way, DOFS could help
improve the modern understanding of the world’s oceans and of the role they play on issues such as climate
regulation, global food supply and energy production. Additionally, DOFS could permit a vaster-deep seafloor
monitoring for the detection of hazards such as earthquakes, seafloor remobilizations, slope instability that may
trigger tsunamis, turbidity currents and seafloor expulsion of fluids which all pose a threat to critical seafloor
infrastructure including telecommunication networks, offshore infrastructure, oil and gas pipelines and umbilicals,
wind farm interarray cables and coastal communities.
DAS was also the focus of Huang et al. [168] who proposed a DOFS-based acoustic environmental safety
monitoring scheme for the security of a building’s exterior glass walls/windows. In order to improve the accuracy
of the disturbing event recognition, the authors suggested the use of the Wigner bispectrum analysis combined with
an extreme gradient boosting tree algorithm. The recognition of eight different 25.3 ms long vibration events was
then tested (no disturbance, wind blowing, knocking, window opening, watering, beating, dog barking and aircraft
sound) resulting in a recognition rate of 93.3%.
Amongst the many potential applications of DAS, Merlo et al. [30] proposed a unique Φ-OTDR monitoring
system buried under different tracks and runways of an airport for the positioning and trajectory calculation of
airplanes and other vehicular transportation. This system was intended to integrate the current radar surveillance
systems operating in the so-called Precision Runway Monitoring. The gist was that the intensity and spatial
extension of an externally-induced fiber scattering perturbation phenomenon could allow distinguishing the
originating cause (plane, bus, car and human) and its trajectory. With such purpose, the authors reported the design,
development, and characterization of a narrow-linewidth solid-state laser with extra-low-noise properties. The latter
feature was aimed at preventing any confusion from the processing algorithm’s part between the laser phase noise
and an event occurring along the fiber.
Zhang et al. [52] and Liu et al. [169]’s scope was very similar in nature to the above article. This time, though,
for vehicular traffic flow monitoring. In the former, multi-scale Distributed Optical Fiber Vibration Sensors,
essentially DAS, and FBG were installed on a road pavement to form a load identification system (as in Figure 73).
(a) (b)
Figure 73. (a) Fiber Bragg Grating (FBG)-based acceleration sensor and (b) Distributed Optical Fiber Vibration Sensor
[52].

Chapter 5. Published Journal Articles | MATTIA FRANCESCO BADO
167
The authors reported that the test, carried out for four vibration loads (rockfall impact, motorcycle, automobile
and concrete tanker), showed that both the DAS and the FBG-based acceleration sensors could successfully identify
the different loads.
In Liu et al. [169], instead, the authors suggested the use of DOFS for the detection of traffic vibration signals
combined with novel wavelet threshold and dual-threshold algorithms. The efficiency of such a method was later
tested with a DAS-powered vehicle-counting and vehicle-speed determination test in the Nanshan Iron Mine
(China) where the optical fiber was located on the road shoulder closest to the traffic lane. The test results were
reportedly encouraging with an accuracy error of less than 6%.
Moving on from macroscale DOFS applications, Li et al. [170] collected the base concepts behind several novel
optical fibers for distributed sensing. Among these, worth mentioning is the idea (originally introduced by Bao et
al. [171]) of using sensing cables with two embedded fibers with different Brillouin frequency shifts. This would
permit the separation of the temperature and strain effects on the Brillouin frequency shift thus preventing their
stacking in the output analysis phase.
You et al. [172] also brought forth a very interesting proposal for a novel OFDR-DOF sensing tape aimed at
guaranteeing the survival of the DOFS in harsh construction and service environments. In particular, the authors
suggested a packaging technique that traps DOFS between two fiberglass tapes glued with an adhesive. The strain
transfer mechanism was analyzed in detail followed by a calibration test and a real-life test that saw its application
to the surface of an RC beam subjected to three-point bending. The extracted results reportedly showed the correct
functioning of the sensing tape on concrete and its ability to localize cracks.
When it comes to modern-day OBR interrogators and BOTDA, the use of post-processing algorithms is an
important step for the proper study of the extracted strain data. Three examples of these are provided by Bado et al.
[151], Heinze and Echtermeyer [27] and Song et al. [174]. In the former, the authors put into practice two previously
established algorithms and a novel one for the elimination of SRAs risen in two different monitoring campaigns.
The first of these was a laboratory experimental campaign performed on two RC ties whilst the second was in-situ
monitoring of a tunnel deformation. The authors reported the presence of large performance discrepancies between
the three analyzed algorithms. Indeed, the classic methods (Spectral Shift Quality and Geometrical Threshold
Method) provided results with questionable quality despite their quick and small computational taxing analysis.
Instead, the novel but more computationally taxing one (Polynomial Interpolation Comparison Method) provided
much smoother and reliable output plots as evident in Figure 74.
In Heinze and Echtermeyer [27], a novel post-processing methodology was introduced as a solution to the issue
of “meaningless results” (SRAs) being reported by OBR analyses whenever OFDR DOFS pinching or micro-
bending occurred. The latter reportedly is the typical case for DOFS embedded inside hardening and shrinking
materials.

Chapter 5. Published Journal Articles | Mattia Francesco Bado
168
(a) (b)
Figure 74. DOFS extracted strain evolution in time: (a) before post-processing and (b) after post-processing with PICM—
Polynomial Interpolation Comparison Method.
In particular, the new data analysis method baptized “running reference analysis method”, suggested that each
measurement should be compared to their previous one and that their strain differences should be added up to the
absolute strain value (the original 0 load reference measurement).
Finally, Song et al. [174] argued that whenever BOTDA DOFS are employed for the detection of large cracks
inside any study material, these lead by definition to large Crack Opening Displacements which can be easily
detected in the fiber’s output as strain peaks or singularities. Yet, when it comes to microcracks, their formation
does not bring along any pronounced or even visible peak. On the contrary, a microcrack-induced peak could be
easily lost in the midst of measurement noise due to its low signal-to-noise ratio. In order to prevent this from
happening and in return improve the crack detection, the authors proposed a novel deep learning method trained
and validated by means of an experimental campaign performed on a 15 m-long wide-flange steel beam with
artificial defects. The authors concluded by reporting that Crack Opening Displacements as small as 23 microns
were successfully detected with the proposed method.
10. Conclusions
The present work was intended to introduce, inform and advise the readers on various Distributed Optical Fiber
Sensors (DOFS) deployment methodologies for Structural Health Monitoring (SHM) purposes, i.e., the assessment
of the residual ability of a structure to continue serving its intended purpose. By collecting in a single article the
most recent efforts, advancements and findings on such DOFS SHM integrations the authors intend to contribute to
the goal of collective growth towards an efficient SHM.

Chapter 5. Published Journal Articles | MATTIA FRANCESCO BADO
169
The current work analyzed numerous DOFS applications such as laboratory experimentation, the built
environment (bridges, buildings, roads, etc.), geotechnical constructions, tunnels, pipelines and wind turbines.
Relevant specific conclusions are reported at the end of each application section. A common conclusion shared by
the largest portion of the reported articles is the efficiency and performance of DOFS for the monitoring of the
structures under both serviceability and ultimate conditions. To a certain extent, this shows the instrumental maturity
already achieved in some Civil Engineering areas. For instance, in the case of concrete structures, it was shown how
the technique is fully operative in the field of crack monitoring both in the controlled environment of a laboratory
and in-situ. Crack detection, mapping and width quantification was achieved both in bending and shear. The
technique’s efficiency was also fully demonstrated for the calculation of deflections by the integration of measured
curvatures and for the distribution of temperatures inside the concrete. Furthermore, DOFS deployments were also
shown to provide relevant results in the monitoring of corrosion in the reinforcing steel. Overall, DOFS were
commendable SHM tools for the monitoring of geotechnical and underground structures too (foundation piles, soil
anchors and tunnels amongst others).
Multiple deployments techniques were described for each kind of structure and for the varied sought-after results.
For example, different deployment techniques were suggested for the monitoring of cast-in-situ RC piles versus
prefabricated ones or for the cross-sectional versus longitudinal monitoring of a tunnel linen’s intrados or even for
the detection of steel pipe leaks versus axial deformations. Furthermore, the increasingly numerous types of
commercially available DOFS cables allowed for the surpassing of the problem of fiber fragility and the need of
protecting it during the concrete pouring operations as well as increasing their resistance to the high temperatures
that may appear during the concrete hardening process or in the case of their embedding into hot asphalt pavements.
The increasingly larger number of applications in each of the reported fields showed a growing interest and
recognition of DOFS’ potential, yet, a large number of such publications called for a deeper understanding of the
mechanical performance (short-term and long-term) of the multi-layered system with which the fibers are bonded
to a structure. Indeed, the strain transfer from a host structure to a DOFS core was seen to depend on the mechanical
and geometrical properties of the different intermediate layers, i.e., coating, jacket, reinforcements, adhesives, etc.
Therefore, whilst extensive recommendations are now available on optimal bonding/protective materials and on
embedding procedures, further work is required for the interpretation of the extracted strain profiles. Additionally,
more research is still needed on the DOFS long-term applicability. Indeed, few studies have addressed their
performance to fatigue and under cyclic loading, a condition that may affect the behavior of the bonding agents and
of the fiber itself. Durability aspects are also under current investigation branching in two main directions: (1) the
ability to monitor material degradation (2) the degradation of the fiber and bonding agents themselves when subject
to harsh and aggressive environments (chloride and alkaline contamination, etc.).
Overall, though, with the already existent potential of DOFS, their number of routine industrial applications for
SHM is certain to increase.

Chapter 5. Published Journal Articles | Mattia Francesco Bado
170
Author Contributions: For research articles with several authors, a short paragraph specifying their individual
contributions must be provided. The following statements should be used “Conceptualization, M.F.B. and J.R.C.;
Methodology, M.F.B. and J.R.C.; Writing-Original Draft Preparation, M.F.B.; Writing—Review and Editing,
M.F.B. and J.R.C. All authors have read and agreed to the published version of the manuscript.
References:
1. Barrias, A.; Casas, J.R.; Villalba, S. A Review of Distributed Optical Fiber Sensors for Civil Engineering
Applications. Sensors 2016, 16, 748, doi:10.3390/s16050748.
2. Brownjohn, J.M.W. Structural health monitoring of civil infrastructure. J. Philosofical Trans. A Math. Phys.
Eng. Sci. 2006, 365, 589–622, doi:10.1098/rsta.2006.1925.
3. Housner, G.W.; Bergman, L.A.; Caughey, T.K.; Chassiakos, A.G.; Claus, R.O.; Masri, S.F.; Skelton, R.E.;
Soong, T.T.; Spencer, B.F.; Yao, J.T.P. Structural control: Past, present and future. J. Eng. Mech. 1997, 123,
897–971, doi:10.1061/(ASCE)0733-9399(1997)123:9(897).
4. Cawley, P. Structural health monitoring : Closing the gap between research and industrial deployment. Struct.
Health Monit. 2018, 17, 1225–1244, doi:10.1177/1475921717750047.
5. Baker, M. Sensors Power Next-Generation SHM. Available online:
https://www.sensorland.com/HowPage131.html (accessed on 20 October 2020).
6. Glišić, B.; Hubbell, D.; Sigurdardottir, D.H.; Yao, Y. Damage detection and characterization using long-gauge
and distributed fiber optic sensors. Opt. Eng. 2013, 52, 087101, doi:10.1117/1.OE.52.8.087101.
7. Seo, H. Monitoring of CFA pile test using three dimensional laser scanning and distributed fiber optic sensors.
Opt. Lasers Eng. 2020, 130, 106089, doi:10.1016/j.optlaseng.2020.106089.
8. Kurzweil, R. The Singularity Is Near; Palgrave Macmillan, London (United Kingdom)2014.
9. Li, H.; Li, D.; Song, G. Recent applications of fiber optic sensors to health monitoring in civil engineering.
Eng. Struct. 2004, 26, 1647–1657, doi:10.1016/j.engstruct.2004.05.018.
10. Cantarero, A. Raman Scattering Applied to Materials Science. Procedia Mater. Sci. 2015, 9, 113–122,
doi:10.1016/j.mspro.2015.04.014.
11. Gillibert, R.; Huang, J.Q.; Zhang, Y.; Fu, W.L.; de la Chapelle, M.L. Food quality control by Surface Enhanced
Raman Scattering. TrAC Trends Anal. Chem. 2018, 105, 185–190, doi:10.1016/j.trac.2018.05.009.
12. Gillibert, R.; Huang, J.Q.; Zhang, Y.; Fu, W.L.; Lamy de la Chapelle, M. Explosive detection by Surface
Enhanced Raman Scattering. TrAC Trends Anal. Chem. 2018, 105, 166–172, doi:10.1016/j.trac.2018.03.018.
13. Miah, K.; Potter, D.K. A review of hybrid fiber-optic distributed simultaneous vibration and temperature
sensing technology and its geophysical applications. Sensors 2017, 17, 2511, doi:10.3390/s17112511.

Chapter 5. Published Journal Articles | MATTIA FRANCESCO BADO
171
14. Schenato, L. A Review of Distributed Fibre Optic Sensors for Geo-Hydrological Applications. Appl. Sci. 2017,
7, 896, doi:10.3390/app7090896.
15. Soga, K.; Luo, L. Distributed fiber optics sensors for civil engineering infrastructure sensing. J. Struct. Integr.
Maint. 2018, 3, 1–21, doi:10.1080/24705314.2018.1426138.
16. Gue, C.Y.; Wilcock, M.; Alhaddad, M.M.; Elshafie, M.Z.E.B.; Soga, K.; Mair, R.J. The monitoring of an
existing cast iron tunnel with distributed fibre optic sensing (DFOS). J. Civ. Struct. Health Monit. 2015, 5,
573–586, doi:10.1007/s13349-015-0109-8.
17. Cheng, Q.; Tang, C.S.; Zhu, C.; Li, K.; Shi, B. Drying-induced soil shrinkage and desiccation cracking
monitoring with distributed optical fiber sensing technique. Bull. Eng. Geol. Environ. 2020, 79, 3959–3970,
doi:10.1007/s10064-020-01809-8.
18. Gao, L.; Han, C.; Xu, Z.; Jin, Y.; Yan, J. Experimental Study on Deformation Monitoring of Bored Pile Based
on BOTDR. Appl. Sci. 2019, 9, 2435.
19. Wang, H.; Xiang, P.; Jiang, L. Strain transfer theory of industrialized optical fiber-based sensors in civil
engineering: A review on measurement accuracy, design and calibration. Sens. Actuators A Phys. 2019, 285,
414–426, doi:10.1016/j.sna.2018.11.019.
20. Li, C.; He, W.; Luo, Y.; Zou, Y. Temperature Control Measurement of Bridge Foundation Concrete based on
the Optical Fiber Sensing Technology. J. Phys. Conf. Ser. 2019, 1288, 012082, doi:10.1088/1742-
6596/1288/1/012082.
21. Pei, H.; Yin, J.; Wang, Z. Monitoring and analysis of cast-in-place concrete bored piles adjacent to deep
excavation by using BOTDA sensing technology. J. Mod. Opt. 2019, 66, 703–709,
doi:10.1080/09500340.2018.1559948.
22. Liu, J.; Song, Z.; Lu, Y.; Bai, Y.; Qian, W.; Kanungo, D.P.; Chen, Z.; Wang, Y. Monitoring of vertical
deformation response to water draining–recharging conditions using BOFDA-based distributed optical fiber
sensors. Environ. Earth Sci. 2019, 78, doi:10.1007/s12665-019-8409-7.
23. Fan, L.; Tan, X.; Zhang, Q.; Meng, W.; Chen, G.; Bao, Y. Monitoring corrosion of steel bars in reinforced
concrete based on helix strains measured from a distributed fiber optic sensor. Eng. Struct. 2020, 204, 110039,
doi:10.1016/j.engstruct.2019.110039.
24. Zhang, D.; Wang, J.; Zhang, P.; Shi, B. Internal strain monitoring for coal mining similarity model based on
distributed fiber optical sensing. Measurement 2017, 97, 234–241, doi:10.1016/j.measurement.2016.11.017.
25. Chai, J.; Lei, W.; Du, W.; Yuan, Q.; Zhu, L.; Zhang, D.; Li, H. Experimental study on distributed optical fiber
sensing monitoring for ground surface deformation in extra-thick coal seam mining under ultra-thick
conglomerate. Opt. Fiber Technol. 2019, 53, 102006, doi:10.1016/j.yofte.2019.102006.
26. Zhang, Z.; Guan, P.; Xu, J.; Wang, B.; Li, H. Horizontal Loading Performance of Offshore Wind Turbine Pile
Foundation Based on DPP-BOTDA. Appl. Sci. 2020, 10, 492.

Chapter 5. Published Journal Articles | Mattia Francesco Bado
172
27. Heinze, S.; Echtermeyer, A.T. A Running Reference Analysis Method to Greatly Improve Optical Backscatter
Reflectometry Strain Data from the Inside of Hardening and Shrinking Materials. Appl. Sci. 2018, 8, 1137,
doi:10.3390/app8071137.
28. Fernández-Ruiz, M.R.; Soto, M.A.; Williams, E.F.; Martin-Lopez, S.; Zhan, Z.; Gonzalez-Herraez, M.;
Martins, H.F. Distributed acoustic sensing for seismic activity monitoring. APL Photonics 2020, 5, 030901,
doi:10.1063/1.5139602.
29. Zuo, J.; Zhang, Y.; Zhao, Z.; Wei, X.; Wang, X.U. Pipeline Leak Detection Technology Based on Distributed
Optical Fiber Acoustic Sensing System. IEEE Access 2020, 8, 30789–30796,
doi:10.1109/ACCESS.2020.2973229.
30. Merlo, S.; Malcovati, P.; Pavia, U.; Ferrata, V.; Norgia, M.; Pesatori, A.; Svelto, C.; Pniov, A.; Zhirnov, A.;
Nesterov, E. Runways Ground Monitoring System by Phase-Sensitive Optical-Fiber OTDR. In Proceedings of
the 2017 IEEE International Workshop on Metrology for AeroSpace (MetroAeroSpace), Padua, Italy, 21–23
June 2017; IEEE: Padova, Italy, 2017; pp. 523–529.
31. Ferdinand, P. The Evolution of Optical Fiber Sensors Technologies During the 35 Last Years and Their
Applications in Structure Health Monitoring. In Proceedings of the EWSHM-7th European Workshop on
Structural Health Monitoring, Nantes, Frances, 8–11 July 2014.
32. Du, C.; Dutta, S.; Kurup, P.; Yu, T.; Wang, X. A review of railway infrastructure monitoring using fiber optic
sensors. Sensors Actuators A. Phys. 2020, 303, 111728, doi:10.1016/j.sna.2019.111728.
33. Udd, E. An overview of fiber‐optic sensors. Rev. Sci. Instrum. 1995, 66, 4015–4030.
34. Kersey, A.D. A review of recent developments in fiber optic sensor technology. Opt. Fiber Technol. 1996, 2,
291–317.
35. Grattan, K.T.V.; Sun, T. Fiber optic sensor technology: An overview. Sensors Actuators A Phys. 2000, 82, 40–
61, doi:10.1016/S0924-4247(99)00368-4.
36. InformationGatekeepers 2019 Distributed and Single Point Fiber Optic Sensing Systems Forecast. Available
online: http://www.igigroup.com/st/pages/photonic_sensor_report.html (accessed on 20 October 2020).
37. Bao, X.; Chen, L. Recent Progress in Distributed Fiber Optic Sensors. Sensors 2012, 12, 8601–8639,
doi:10.3390/s120708601.
38. Tennyson, R.C.; Mufti, A.A.; Rizkalla, S.; Tadros, G.; Benmokrane, B. Structural health monitoring of
innovative bridges in Canada with fiber optic sensors. Smart Mater. Struct. 2001, 10, 560.
39. Whelan, M.P.; Albrecht, D.; Capsoni, A. Remote structural monitoring of the Cathedral of Como using an
optical fiber Bragg sensor system. In Proceedings of the Smart Structures and Materials and Nondestructive
Evaluation for Health Monitoring and Diagnostics, San Diego, CA, USA, 18–21 March 2002; Volume 4694,
pp. 242–252.

Chapter 5. Published Journal Articles | MATTIA FRANCESCO BADO
173
40. Her, S.C.; Huang, C.Y. Effect of coating on the strain transfer of optical fiber sensors. Sensors 2011, 11, 6926–
6941, doi:10.3390/s110706926.
41. Feng, X.; Zhou, J.; Sun, C.; Zhang, X.; Ansari, F. Theoretical and Experimental Investigations into Crack
Detection with BOTDR-Distributed Fiber Optic Sensors. J. Eng. Mech. 2013, 139, 1797–1807,
doi:10.1061/(asce)em.1943-7889.0000622.
42. Alj, I.; Quiertant, M.; Khadour, A.; Grando, Q.; Terrade, B.; Renaud, J.C.; Benzarti, K. Experimental and
numerical investigation on the strain response of distributed optical fiber sensors bonded to concrete: Influence
of the adhesive stiffness on crack monitoring performance. Sensors 2020, 20, 5144, doi:10.3390/s20185144.
43. Henault, J.M.; Salin, J.; Moreau, G.; Quiertant, M.; Taillade, F.; Benzarti, K.; Delepine-Lesoille, S. Analysis
of the strain transfer mechanism between a truly distributed optical fiber sensor and the surrounding medium.
In Proceedings of the Proceedings of the the 3rd International Conference on Concrete Repair, Rehabilitation
and Retrofitting, ICCRRR 2012, Cape Town, South Africa, 3–5 September 2012; pp. 733–739.
44. Bassil, A.; Chapeleau, X.; Leduc, D.; Abraham, O. Concrete Crack Monitoring Using a Novel Strain Transfer
Model for Distributed Fiber Optics Sensors. Sensors 2020, 20, 2220, doi:10.3390/s20082220.
45. Zhang, S.; Liu, H.; Cheng, J.; DeJong, M.J. A mechanical model to interpret distributed fiber optic strain
measurement at displacement discontinuities. Struct. Health Monit. 2020, doi:10.1177/1475921720964183.
46. Alj, I. Durability of Truly Distributed Optical Fiber Sensor in Cementitious Environment; Université Gustave
Eiffel (Marne de la Vallée, France): 2020.
47. Alj, I.; Quiertant, M.; Khadour, A.; Grando, Q.; Benzarti, K. Durability of distributed optical fiber sensors used
for SHM of reinforced concrete structures. In Proceedings of the 12th International Workshop on Structural
Health Monitoring 2019: Enabling Intelligent Life-Cycle Health Management for Industry Internet of Things
(IIOT), Stanford, CA, USA, 10–12 September 2019; pp. 1696–1703.
48. Bado, M.F.; Casas, J.R.; Barrias, A. Performance of Rayleigh-Based Distributed Optical Fiber Sensors Bonded
to Reinforcing Bars in Bending. Sensors 2018, 20, 3125, doi:10.3390/s18093125.
49. Bado, M.F.; Casas, J.R.; Dey, A.; Berrocal, C.G. Distributed optical fiber sensing bonding techniques
performance for embedment inside reinforced concrete structures. Sensors 2020, 20, 5788,
doi:10.3390/s20205788.
50. Barrias, A.; Casas, J.R.; Villalba, S. Distributed optical fibre sensors in concrete structures: Performance of
bonding adhesives and influence of spatial resolution. Struct. Control Health Monit. 2019, 26, 1–16,
doi:10.1002/stc.2310.
51. Barrias, A.; Casas, J.R.; Villalba, S. Fatigue performance of distributed optical fiber sensors in reinforced
concrete elements. Constr. Build. Mater. 2019, 218, 214–223, doi:10.1016/j.conbuildmat.2019.05.072.
52. Zhang, S.; He, J.; Yu, Q.; Wu, X. Multi-scale load identi fi cation system based on distributed optical fi ber
and local FBG-based vibration sensors. Optik 2020, 219, 165159, doi:10.1016/j.ijleo.2020.165159.

Chapter 5. Published Journal Articles | Mattia Francesco Bado
174
53. McCormick, N.; Lord, J. Digital image correlation. Mater. Today 2010, 13, 52–54, doi:10.1016/S1369-
7021(10)70235-2.
54. Mata-Falcón, J.; Haefliger, S.; Lee, M.; Galkovski, T.; Gehri, N. Combined application of distributed fibre
optical and digital image correlation measurements to structural concrete experiments. Eng. Struct. 2020, 225,
doi:10.1016/j.engstruct.2020.111309.
55. Bado, M.F.; Kaklauskas, G.; Casas, J.R. Performance of Distributed Optical Fiber Sensors (DOFS) and Digital
Image Correlation (DIC) in the monitoring of RC structures. IOP Conf. Ser. Mater. Sci. Eng. 2019, 615,
doi:10.1088/1757-899X/615/1/012101.
56. Huo, L.; Cheng, H.; Kong, Q.; Chen, X. Bond-slip monitoring of concrete structures using smart sensors—A
review. Sensors 2019, 19, 1231, doi:10.3390/s19051231.
57. Bassil, A. Distributed Fiber Optics Sensing for Crack Monitoring of Concrete Structures; Université de Nantes
(Nantes, France): 2020.
58. Zhang, J. Distributed Sensing to Assess the Shear Behaviour of Reinforced Concrete Beams; Queen’s
University (Kingston, Canada): 2017.
59. Berrocal, C.G.; Fernandez, I.; Rempling, R. Crack monitoring in reinforced concrete beams by distributed
optical fiber sensors. Struct. Infrastruct. Eng. 2020, doi:10.1080/15732479.2020.1731558.
60. Berrocal, C.G.; Fernandez, I.; Bado, M.F.; Casas, J.R.; Rempling, R. Assessment and visualization of
performance indicators of reinforced concrete beams by distributed optical fiber sensing. Struct. Health Monit.
2021, doi:10.1177/1475921720984431.
61. Brault, A.; Hoult, N.A. Monitoring reinforced concrete serviceability performance using fiber-optic sensors.
ACI Struct. J. 2019, 116, 57–70, doi:10.14359/51710870.
62. Brault, A.; Hoult, N.A. Distributed Reinforcement Strains: Measurement and Application. ACI Struct. J. 2019,
116, doi:10.14359/51714483.
63. Poldon, J.J.; Hoult, N.A.; Bentz, E.C. Distributed Sensing in Large Reinforced Concrete Shear Test. ACI
Struct. J. 2019, 116, 235–245, doi:10.14359/51716765.
64. Rodriguez, G.; Casas, J.R.; Villalba, S. Shear crack pattern identification in concrete elements via distributed
optical fibre grid. Struct. Infrastruct. Eng. 2019, 15, 1630–1648, doi:10.1080/15732479.2019.1640256.
65. Rodriguez, G.; Casas, J.R.; Villalba, S. Shear crack width assessment in concrete structures by 2D distributed
optical fiber. Eng. Struct. 2019, 195, 508–523, doi:10.1016/j.engstruct.2019.05.079.
66. Fischer, O.; Thoma, S.; Crepaz, S. Distributed fiber optic sensing for crack detection in concrete structures.
Civ. Eng. Des. 2019, 1, 97–105, doi:10.1002/cend.201900008.
67. Mehdi Mirzazadeh, M.; Green, M.F. Fiber Optic Sensors and Digital Image Correlation for Measuring
Deformations in Reinforced Concrete Beams. J. Bridg. Eng. 2018, 23, 04017144, doi:10.1061/(asce)be.1943-
5592.0001189.

Chapter 5. Published Journal Articles | MATTIA FRANCESCO BADO
175
68. Sawicki, B.; Bassil, A.; Brühwiler, E.; Chapeleau, X.; Leduc, D. Detection and measurement of matrix
discontinuities in uhpfrc by means of distributed fiber optics sensing. Sensors 2020, 20, 3883,
doi:10.3390/s20143883.
69. Broth, Z.; Hoult, N.A. Dynamic distributed strain sensing to assess reinforced concrete behaviour. Eng. Struct.
2020, 204, 110036, doi:10.1016/j.engstruct.2019.110036.
70. Barrias, A.; Casas, J.; Villalba, S. Embedded Distributed Optical Fiber Sensors in Reinforced Concrete
Structures—A Case Study. Sensors 2018, 18, 980, doi:10.3390/s18040980.
71. Bassil, A.; Wang, X.; Chapeleau, X.; Niederleithinger, E.; Abraham, O.; Leduc, D. Distributed fiber optics
sensing and coda wave interferometry techniques for damage monitoring in concrete structures. Sensors 2019,
19, 356, doi:10.3390/s19020356.
72. Wu, J.; Liu, H.; Yang, P.; Tang, B.; Wei, G. Quantitative strain measurement and crack opening estimate in
concrete structures based on OFDR technology. Opt. Fiber Technol. 2020, 60, 102354,
doi:10.1016/j.yofte.2020.102354.
73. Chen, Z.; Zheng, D.; Shen, J.; Qiu, J.; Liu, Y. Research on distributed optical-fiber monitoring of biaxial-
bending structural deformations. Measurement 2019, 140, 462–471, doi:10.1016/j.measurement.2019.04.031.
74. Malek, A.; Scott, A.; Pampanin, S.; Hoult, N.A. Postyield Bond Deterioration and Damage Assessment of RC
Beams Using Distributed Fiber-Optic Strain Sensing System. J. Struct. Eng. 2019, 145, 1–17,
doi:10.1061/(ASCE)ST.1943-541X.0002286.
75. Sounthararajah, A.; Wong, L.; Nguyen, N.; Bui, H.H.; Kodikara, J. Evaluation of flexural behaviour of
cemented pavement material beams using distributed fibre optic sensors. Constr. Build. Mater. 2017, 156, 965–
975, doi:10.1016/j.conbuildmat.2017.09.027.
76. Ruiz, M.F.; Muttoni, A.; Gambarova, P.G. Analytical modeling of the pre- and postyield behavior of bond in
reinforced concrete. J. Struct. Eng. 2007, 133, 1364–1372, doi:10.1061/(ASCE)0733-
9445(2007)133:10(1364).
77. Bado, M.F.; Casas, J.R.; Kaklauskas, G. Distributed Sensing ( DOFS ) in Reinforced Concrete members for
reinforcement strain monitoring , crack detection and bond-slip calculation. Eng. Struct. 2021, 226, 111385,
doi:10.1016/j.engstruct.2020.111385.
78. Cantone, R.; Fernández Ruiz, M.; Muttoni, A. A detailed view on the rebar–to–concrete interaction based on
refined measurement techniques. Eng. Struct. 2021, 226, 111332, doi:10.1016/j.engstruct.2020.111332.
79. Zhang, S.; Liu, H.; Coulibaly, A.A.S.; DeJong, M. Fiber optic sensing of concrete cracking and rebar
deformation using several types of cable. Struct. Control Health Monit. 2020, 1–23, doi:10.1002/stc.2664.
80. Sieńko, R.; Zych, M.; Bednarski, Ł.; Howiacki, T. Strain and crack analysis within concrete members using
distributed fibre optic sensors. Struct. Health Monit. 2018, 18, 1510–1526, doi:10.1177/1475921718804466.

Chapter 5. Published Journal Articles | Mattia Francesco Bado
176
81. Davis, M.B.; Hoult, N.A.; Bajaj, S.; Bentz, E.C. Distributed Sensing for Shrinkage and Tension Stiffening
Measurement. ACI Struct. J. 2017, 114, doi:10.14359/51689463.
82. Dey, A.; Vastrad, A.V.; Bado, M.F.; Sokolov, A.; Kaklauskas, G. Long-Term Concrete Shrinkage Influence
on the Performance of Reinforced Concrete Structures. Materials 2021, 14, 254, doi:10.3390/ma14020254.
83. Fields, K.; Bischoff, P.H. Tension Stiffening and Cracking of High-Strength Reinforced Concrete Tension
Members. ACI Mater. J. 2004, 101, 447–456.
84. Villalba, S.; Casas, J.R. Application of optical fiber distributed sensing to health monitoring of concrete
structures. Mech. Syst. Signal Process. 2013, 39, 441–451, doi:10.1016/j.ymssp.2012.01.027.
85. Rodríguez, G.; Casas, J.R.; Villaba, S. Cracking assessment in concrete structures by distributed optical fiber.
Smart Mater. Struct. 2015, 24, doi:10.1088/0964-1726/24/3/035005.
86. Nurmi, S.; Hoult, N.A.; Howell, S.D. Distributed strain monitoring of two-way slabs. Eng. Struct. 2019, 189,
580–588, doi:10.1016/j.engstruct.2019.04.002.
87. Sienko, R.; Bednarski, L.; Howiacki, T. About Distributed Internal and Surface Strain Measurements within
Prestressed Concrete Truck Scale Platforms. IOP Conf. Ser. Mater. Sci. Eng. 2019, 471, doi:10.1088/1757-
899X/471/5/052074.
88. Liao, W.; Zhuang, Y.; Zeng, C.; Deng, W.; Huang, J.; Ma, H. Fiber optic sensors enabled monitoring of thermal
curling of concrete pavement slab: Temperature, strain and inclination. Meas. J. Int. Meas. Confed. 2020, 165,
108203, doi:10.1016/j.measurement.2020.108203.
89. Teguedy, M.C.; Joly-Lapalice, C.; Sorelli, L.; Conciatori, D. Optical fiber sensors implementation for
monitoring the early-age behavior of full-scale Timber-Concrete Composite slabs. Constr. Build. Mater. 2019,
226, 564–578, doi:10.1016/j.conbuildmat.2019.07.294.
90. Davis, M.; Hoult, N.A.; Scott, A. Distributed strain sensing to assess corroded RC beams. Eng. Struct. 2017,
140, 473–482, doi:10.1016/j.engstruct.2017.03.013.
91. Davis, M.; Hoult, N.A.; Scott, A. Distributed strain sensing to determine the impact of corrosion on bond
performance in reinforced concrete. Constr. Build. Mater. 2016, 114, 481–491,
doi:10.1016/j.conbuildmat.2016.03.205.
92. Lv, H.; Zhao, X.; Zhan, Y.; Gong, P. Damage evaluation of concrete based on Brillouin corrosion expansion
sensor. Constr. Build. Mater. 2017, 143, 387–394, doi:10.1016/j.conbuildmat.2017.03.122.
93. Fan, L.; Bao, Y.; Chen, G. Feasibility of distributed fiber optic sensor for corrosion monitoring of steel bars in
reinforced concrete. Sensors 2018, 18, 722, doi:10.3390/s18113722.
94. Fan, L.; Bao, Y.; Meng, W.; Chen, G. In-situ monitoring of corrosion-induced expansion and mass loss of steel
bar in steel fiber reinforced concrete using a distributed fiber optic sensor. Compos. Part B Eng. 2019, 165,
679–689, doi:10.1016/j.compositesb.2019.02.051.

Chapter 5. Published Journal Articles | MATTIA FRANCESCO BADO
177
95. Bao, Y.; Hoehler, M.S.; Smith, C.M.; Bundy, M.; Chen, G. Temperature measurement and damage detection
in concrete beams exposed to fire using PPP-BOTDA based fiber optic sensors. Smart Mater. Struct. 2017, 26,
doi:10.1088/1361-665X/aa89a9.
96. Bao, Y.; Huang, Y.; Hoehler, M.S.; Chen, G. Review of fiber optic sensors for structural fire engineering.
Sensors 2019, 19, 877, doi:10.3390/s19040877.
97. Bao, Y.; Chen, Y.; Hoehler, M.S.; Smith, C.M.; Bundy, M.; Chen, G. Experimental Analysis of Steel Beams
Subjected to Fire Enhanced by Brillouin Scattering-Based Fiber Optic Sensor Data. J. Struct. Eng. 2017, 143,
04016143, doi:10.1061/(asce)st.1943-541x.0001617.
98. Saidi, M.; Gabor, A. Experimental analysis of the tensile behaviour of textile reinforced cementitious matrix
composites using distributed fibre optic sensing (DFOS) technology. Constr. Build. Mater. 2020, 230, 117027,
doi:10.1016/j.conbuildmat.2019.117027.
99. Jaafari, C.; Bertrand, D.; Guillot, T.; Prudhomme, E.; Tardif, N.; Georgin, J.F.; Delhomme, F.; Trunfio, R.;
Chateur, N.; Bruyere, E.; et al. Effect of early age drying shrinkage on the seismic response of RC structures.
Mater. Struct. 2020, 53, doi:10.1617/s11527-020-01552-2.
100. Liu, T.; Huang, H.; Yang, Y. Crack Detection of Reinforced Concrete Member Using Rayleigh-Based
Distributed Optic Fiber Strain Sensing System. Adv. Civ. Eng. 2020, 2020, doi:10.1155/2020/8312487.
101. Woods, J.E.; Lau, D.T.; Bao, X.; Li, W. Measuring strain fields in FRP strengthened RC shear walls using
a distributed fiber optic sensor. Eng. Struct. 2017, 152, 359–369, doi:10.1016/j.engstruct.2017.09.034.
102. (ASCE), A.S. of C.E. Infrastructure Report Card; 2017;
103. Regier, R.; Hoult, N.A. Distributed Strain Behavior of a Reinforced Concrete Bridge : Case Study. J. Bridg.
Eng. 2014, 19, 1–9, doi:10.1061/(ASCE)BE.1943-5592.0000637.
104. Moore, M.; Phares, B.M.; Graybeal, B.; Rolander, D.; Washer, G.; Wiss, J. Reliability of Visual Inspection
for Highway Bridges; 2001; Volume I.
105. Glišic, B.; Posenato, D.; Inaudi, D. Integrity monitoring of old steel bridge using fiber optic distributed
sensors based on Brillouin scattering. In Proceedings of the Nondestructive Characterization for Composite
Materials, Aerospace Engineering, Civil Infrastructure, and Homeland Security 2007, San Diego, CA, USA,
20–22 March 2007.
106. Matta, F.; Bastianini, F.; Galati, N.; Casadei, P.; Nanni, A.; Asce, F. Distributed Strain Measurement in
Steel Bridge with Fiber Optic Sensors : Validation through Diagnostic Load Test. J. Perform. Constr. Facil.
2008, 22, 264–273, doi:10.1061/(ASCE)0887-3828(2008)22.
107. Webb, G.T.; Vardanega, P.J.; Hoult, N.A.; Fidler, P.R.A.; Bennett, P.J.; Middleton, C.R. Analysis of Fiber-
Optic Strain-Monitoring Data from a Prestressed Concrete Bridge. J. Bridg. Eng. 2017, 22, 1–14,
doi:10.1061/(ASCE)BE.1943-5592.0000996.
108. CEN. (European Committee for Standardization), Eurocode 2: Design of Concrete Structures; 2004.

Chapter 5. Published Journal Articles | Mattia Francesco Bado
178
109. Collins, M.P.; Mitchell, D. Prestressed Concrete Structures; 1997.
110. Ye, C.; Butler, L.J.; Elshafie, M.Z.E.B.; Middleton, C.R. Evaluating prestress losses in a prestressed
concrete girder railway bridge using distributed and discrete fibre optic sensors. Constr. Build. Mater. 2020,
247, 118518, doi:10.1016/j.conbuildmat.2020.118518.
111. Barrias, A.; Rodriguez, G.; Casas, J.R.; Villalba, S. Application of distributed optical fiber sensors for the
health monitoring of two real structures in Barcelona. Struct. Infrastruct. Eng. 2018, 14, 967–985,
doi:10.1080/15732479.2018.1438479.
112. Ouyang, J.; Chen, X.; Huangfu, Z.; Lu, C.; Huang, D.; Li, Y. Application of distributed temperature sensing
for cracking control of mass concrete. Constr. Build. Mater. 2019, 197, 778–791,
doi:10.1016/j.conbuildmat.2018.11.221.
113. de Battista, N.; Harvey, R.; Cheal, N. Distributed fibre optic sensor system to measure the progressive axial
shortening of a high-rise building during construction. In Proceedings of the 39th IABSE Symposium-
Engineering the Future, Vancouver, BC, Canada, 19–23 September 2017.
114. de Battista, N.; Cheal, N.; Harvey, R.; Kechavarzi, C. Monitoring the axial displacement of a high-rise
building under construction using embedded distributed fibre optic sensors. In Proceedings of the 8th
International Conference on Structural Health Monitoring of Intelligent Infrastructure, Brisbane, Australia, 5–
8 December 2017.
115. Qi, J.; Wang, B.; Wang, X.; Song, Z.; Cui, Z. Application of optical-fiber sensing to concrete support and
continuous wall strain monitoring. In Proceedings of the The Second International Workshop on Environment
and Geoscience, Hangzhou, China, 17–19 July 2021.
116. Broth, Z.E.; Hoult, N.A. Field Monitoring of RC-Structures under Dynamic Loading Using Distributed
Fiber-Optic Sensors. J. Perform. Constr. Facil. 2020, 34, 04020070, doi:10.1061/(asce)cf.1943-5509.0001488.
117. Brault, A.; Hoult, N.A.; Greenough, T.; Trudeau, I. Monitoring of Beams in an RC Building during a Load
Test Using Distributed Sensors. J. Perform. Constr. Facil. 2019, 33, 04018096, doi:10.1061/(asce)cf.1943-
5509.0001250.
118. Wang, H.; Xiang, P.; Jiang, L. Optical Fiber Sensor Based In-Field Structural Performance Monitoring of
Multilayered Asphalt Pavement. J. Light. Technol. 2018, 36, 3624–3632.
119. Rabaiotti, C.; Hauswirth, D.; Fischli, F.; Facchini, M. Structural health monitoring of airfield pavements
using distributed fiber-optics sensing. In Proceedings of the 4th Conf. on Smart Monitoring, Assessment and
Rehabilitation of Civil Structures (SMAR 2017), Zürich, Switzerland, 13–15 September 2017.
120. Wheeler, L.N.; Pannese, E.; Hoult, N.A.; Take, W.A.; Le, H. Transportation Geotechnics Measurement of
distributed dy-namic rail strains using a Rayleigh backscatter based fiber optic sensor : Lab and field
evaluation. Transp. Geotech. 2018, 14, 70–80, doi:10.1016/j.trgeo.2017.10.002.

Chapter 5. Published Journal Articles | MATTIA FRANCESCO BADO
179
121. Sasi, D.; Philip, S.; David, R.; Swathi, J. A review on structural health monitoring of railroad track structures
using fiber optic sensors. Mater. Today Proc. 2020, doi:10.1016/j.matpr.2020.06.217.
122. Zhu, H.; Shi, B.; Zhang, C. FBG-Based Monitoring of Geohazards : Current. Sensors 2017, 17, 452,
doi:10.3390/s17030452.
123. Sienko, R.; Bednarski, L.; Kanty, P.; Howiacki, T. Application of Distributed Optical Fibre Sensor for
Strain and Temperature Monitoring within Continuous Flight Auger Columns. IOP Conf. Ser. Earth Environ.
Sci. 2019, 221, 012006, doi:10.1088/1755-1315/221/1/012006.
124. Kania, J.G.; Sorensen, K.K.; Fellenius, B.H. Application of Distributed Fibre Optic Cables in Piles
Application of Distributed Fibre Optic Cables in Piles. Geotech. Eng. J. Seags Agssea 2020, 51.
125. Cheng, L.S.; Pin, T.B.; Fai, C.M.; Mohamad, H.; An, A.K.; Rahardjo, P.P. Application of Distributed Fibre
Optic Sensor (DFOS) in Bi-directional Static Pile Load Tests. Geotech. Eng. J. Seagc 2018.
126. Xu, D.; Yin, J.; Liu, H. A new measurement approach for deflection monitoring of large-scale bored piles
using distributed fiber sensing technology. Measurement 2018, 117, 444–454,
doi:10.1016/j.measurement.2017.12.032.
127. Guo, Z.; Zhao, Z. Application of distributed optical fiber sensing technique in pile foundation monitoring
Application of distributed optical fiber sensing technique in pile foundation monitoring. IOP Conf. Ser. Earth
Environ. Sci. 2018, 189, 052074.
128. Liu, J.; Wang, Y.; Lu, Y.; Wei, J.; Kanungo, D.P. Application of distributed optical fiber sensing technique
in monitoring the ground deformation. J. Sensors 2017, 2017, doi:10.1155/2017/6310197.
129. Galloway, D.L.; Burbey, T.J. Review: Regional land subsidence accompanying groundwater extraction.
Hydrogeol. J. 2011, 19, 1459–1486, doi:10.1007/s10040-011-0775-5.
130. Wu, J.; Shi, B.; Cao, D.; Jiang, H.; Wang, X.; Gu, K. Model test of soil deformation response to draining-
recharging conditions based on DFOS. Eng. Geol. 2017, 226, 107–121, doi:10.1016/j.enggeo.2017.04.025.
131. Zhang, C.C.; Shi, B.; Gu, K.; Liu, S.P.; Wu, J.H.; Zhang, S.; Zhang, L.; Jiang, H.T.; Wei, G.Q. Vertically
Distributed Sensing of Deformation Using Fiber Optic Sensing. Geophys. Res. Lett. 2018, 45, 11,732-11,741,
doi:10.1029/2018GL080428.
132. Wu, H.; Zhu, H.H.; Zhang, C.C.; Zhou, G.Y.; Zhu, B.; Zhang, W.; Azarafza, M. Strain integration-based
soil shear displacement measurement using high-resolution strain sensing technology. Measurement 2020, 166,
108210, doi:10.1016/j.measurement.2020.108210.
133. Wang, T.; Xu, B.; He, B.; Du, M. Research on Application of Distributed Optical Fiber Sensing Technology
in the Safety Monitoring of Pipeline Transportation. In Proceedings of the 7th International Conference on
Energy, Environment and Sustainable Development (ICEESD 2018), Shenzhen, China, 30–31 March 2018.

Chapter 5. Published Journal Articles | Mattia Francesco Bado
180
134. Zheng, Y.; Zhu, Z.W.; Li, W.J.; Gu, D.M.; Xiao, W. Experimental research on a novel optic fiber sensor
based on OTDR for landslide monitoring. Meas. J. Int. Meas. Confed. 2019, 148, 106926,
doi:10.1016/j.measurement.2019.106926.
135. Schenato, L.; Camporese, M.; Bersan, S.; Cola, S.; Galtarossa, A.; Pasuto, A.; Simonini, P.; Salandin, P.;
Palmieri, L. High density distributed strain sensing of landslide in large scale physical model. In Proceedings
of the 25th International Conference on Optical Fiber Sensors, Jeju, Korea, 24–28 April 2017.
136. Zhang, D.; He, J.; Xue, Y.; Xu, J.; Xu, X. Investigation of settlement monitoring method based on
distributed Brillouin fiber optical sensor. Measurement 2019, 134, 118–122,
doi:10.1016/j.measurement.2018.10.081.
137. Chen, H.; He, J.; Xue, Y.; Zhang, S. Experimental study on sinkhole collapse monitoring based on
distributed Brillouin optical fiber sensor. Optik 2020, 216, 164825, doi:10.1016/j.ijleo.2020.164825.
138. Xu, J.; He, J.; Zhang, L. Collapse prediction of karst sinkhole via distributed Brillouin optical fiber sensor.
Measurement 2017, 100, 68–71, doi:10.1016/j.measurement.2016.12.046.
139. Cola, S.; Schenato, L.; Brezzi, L.; Pangop, F.C.T.; Palmieri, L.; Bisson, A. Composite anchors for slope
stabilisation: Monitoring of their in-situ behaviour with optical fibre. Geosciences 2019, 9, 240,
doi:10.3390/geosciences9050240.
140. Lienhart, W.; Monsberger, C.M.; Kalenjuk, S.; Woschitz, H. High Resolution Monitoring of Retaining
Walls with Distributed Fibre Optic Sensors and Mobile Mapping Systems 2 . New Monitoring Approaches. In
Proceedings of the Asian Pacific Workshop Structural health Monitoring APWSHM 2018, Hong Kong, China,
12–15 November 2018.
141. Zhang, P.; Sun, B. Distribution characteristics of the advance abutment pressure in a deep stope. J. Geophys.
Eng. 2020, 686–699, doi:10.1093/jge/gxaa022.
142. Lanciano, C.; Salvini, R. Monitoring of strain and temperature in an open pit using brillouin distributed
optical fiber sensors. Sensors 2020, 20, 1924, doi:10.3390/s20071924.
143. Cheng-yu, H.; Yi-fan, Z.; Guo-wei, L.; Meng-xi, Z.; Zi-xiong, L. Physical Recent progress of using
Brillouin distributed fiber optic sensors for geotechnical health monitoring. Sensors Actuators A Phys. 2017,
258, 131–145, doi:10.1016/j.sna.2017.03.017.
144. Loupos, K.; Kanellos, G.; Bimpas, M.; Amditis, A.; Bursi, O.; Orfanoudakis, A. Fiber Sensors Based
System for Tunnel Linings ’ Structural Health Monitoring. In Proceedings of the 2nd Conference On Smart
Monitoring, Assessment And Rehabilitation of Civil Structures, Istanbul, Turkey, 9–11 September 2013; pp.
9–11.
145. Inaudi, D.; Walder, R. Full-Length Tunnel Structural Monitoring. In Proceedings of the Structural Health
Monitoring, Stanford, CA, USA, 10–12 September 2019.

Chapter 5. Published Journal Articles | MATTIA FRANCESCO BADO
181
146. Fajkus, M.; Nedoma, J.; Mec, P.; Hrubesova, E.; Martinek, R.; Vasinek, V. Analysis of the highway tunnels
monitoring using an optical fiber implemented into primary lining. J. Electr. Eng. 2017, 68, 364–370,
doi:10.1515/jee-2017-0068.
147. Monsberger, C.M.; Lienhart, W.; Kluckner, A. Continuous strain measurements in a shotcrete tunnel lining
using distributed fibre optic sensing. In Proceedings of the 9th European Workshop on Structural Health
Monitoring, Manchester, UK, 10–13 July 2018; pp. 1–13.
148. Shi, B.I.N.; Xu, H.; Chen, B.I.N.; Zhang, D.A.N.; Ding, Y.; Gao, J.; Shi, B.I.N. A Feasibility Study on the
Application of Fiber- Optic Distributed Sensors for Strain Measurement in the Taiwan Strait Tunnel Project.
Mar. Georesources Geotechnol. 2010, 25, 575–586, doi:10.1080/713773406.
149. Li, Z.; Hou, G.; Hu, T.; Zhou, T.; Xiao, H. A study on the application of the distributed optical fiber sensing
monitoring technology in the process of dismantling temporary tunnel shoring. Arab. J. Geosci. 2020, 13, 1–
11.
150. Gómez, J.; Casas, J.R.; Villalba, S. Structural Health Monitoring with Distributed Optical Fiber Sensors of
tunnel lining affected by nearby construction activity. Autom. Constr. 2020, 117, 103261,
doi:10.1016/j.autcon.2020.103261.
151. Bado, M.F.; Casas, J.R.; Gómez, J. Post-processing algorithms for distributed optical fiber sensing in
structural health monitoring applications. Struct. Health Monit. 2020, doi:10.1177/1475921720921559.
152. Minardo, A.; Catalano, E.; Coscetta, A.; Zeni, G.; Zhang, L.; Di Maio, C.; Vassallo, R.; Coviello, R.;
Macchia, G.; Picarelli, L.; et al. Distributed Fiber Optic Sensors for the Monitoring of a Tunnel Crossing a
Landslide. Remote Sens. 2018, 10, 1291, doi:10.3390/rs10081291.
153. Zhao, J.; Feng, J.; Ren, L. Inversion Calculation Analysis of Operational Tunnel Structure Based on the
Distributed Optical-Fiber Sensing System. Adv. Civ. Eng. 2017, 2017, doi:10.1155/2017/6159095.
154. Piccolo, A.; Lecieux, Y.; Delepine-Lesoille, S.; Leduc, D.; Bumbieler, F.; Teixeira, P.; Zghondi, J. Tunnel
convergence analysis by distributed optical fiber strain sensing with means of finite element—Inverse analysis
method. In Proceedings of the EWSHM-European Workshop on Structural Health Monitoring, Manchester,
UK, 10–13 July 2018; pp. 1–12.
155. Glisic, B.; Yao, Y. Fiber optic method for health assessment of pipelines subjected to earthquake-induced
ground movement. Struct. Health Monit. 2012, 11, 696–711, doi:10.1177/1475921712455683.
156. Inaudi, D.; Glisic, B. Distributed Fiber optic Strain and Temperature Sensing for Structural Health
Monitoring. In Proceedings of the Proceedings of the 3rd International Conference on Bridge Maintenance,
Safety and Management—Bridge Maintenance, Safety, Management, Life-Cycle Performance and Cost, Porto,
Portugal, 16–19 July 2006; p. 964.

Chapter 5. Published Journal Articles | Mattia Francesco Bado
182
157. Wong, L.; Rathnayaka, S.; Chiu, W.K.; Kodikara, J. Fatigue Damage Monitoring of a Cast Iron Pipeline
Using Distributed Optical Fibre Sensors. Procedia Eng. 2017, 188, 293–300,
doi:10.1016/j.proeng.2017.04.487.
158. Ren, L.; Jiang, T.; Jia, Z.; Li, D.; Yuan, C.; Li, H. Pipeline corrosion and leakage monitoring based on the
distributed optical fi ber sensing technology. Measurement 2018, 122, 57–65,
doi:10.1016/j.measurement.2018.03.018.
159. Stajanca, P.; Chruscicki, S.; Homann, T.; Seifert, S.; Schmidt, D. Detection of Leak-Induced Pipeline
Vibrations Using Fiber—Optic Distributed Acoustic Sensing. Sensors 2018, 18, 2841, doi:10.3390/s18092841.
160. Feng, X.; Wu, W.; Meng, D.; Ansari, F.; Zhou, J. Distributed monitoring method for upheaval buckling in
subsea pipelines with Brillouin optical time-domain analysis sensors. Adv. Struct. Eng. 2017, 20, 180–190,
doi:10.1177/1369433216659990.
161. Zhang, S.; Liu, B.; He, J. Pipeline deformation monitoring using distributed fiber optical sensor.
Measurement 2019, 133, 208–213, doi:10.1016/j.measurement.2018.10.021.
162. Inaudi, D. Distributed optical fiber sensors for strain and deformation monitoring of pipelines and
penstocks. Geotech. Eng. 2019, 50, 64–70.
163. WWEA. Wind Power Capacity Worldwide Reaches 597 GW, 50,1 GW Added in 2018. Available online:
https://wwindea.org/blog/2019/02/25/wind-power-capacity-worldwide-reaches-600-gw-539-gw-added-in-
2018/(accessed on 18 November 2020).
164. Coscetta, A.; Minardo, A.; Olivares, L.; Mirabile, M.; Longo, M.; Damiano, M.; Zeni, L. Wind Turbine
Blade Monitoring with Brillouin-Based Fiber-Optic Sensors. J. Sensors 2017, 2017,
doi:10.1155/2017/9175342.
165. Raman, V.; Drissi-habti, M.; Limje, P.; Khadour, A. Finer SHM-Coverage of Inter-Plies and Bondings in
Smart Composite by Dual Sinusoidal Placed Distributed Optical Fiber Sensors. Sensors 2019, 19, 742,
doi:10.3390/s19030742.
166. Chesnoy, J. Undersea Fiber Communication Systems; Academic Press: Cambridge, MA, USA, 2015;
167. Hartog, A.H.; Belal, M.; Clare, M.A. Advances in Distributed Fiber-Optic Sensing for Monitoring Marine
Infrastructure, Measuring the Deep Ocean, and Quantifying the Risks Posed by Sea fl oor Hazards. Mar.
Technol. Soc. J. 2018, 52, 58–73.
168. Huang, L.; Li, Y.; Chen, S.; Zhang, Q.; Song, Y.; Zhang, J.; Wang, M. Optical Fiber Technology Building
safety monitoring based on extreme gradient boosting in distributed optical fi ber sensing. Opt. Fiber Technol.
2020, 55, 102149, doi:10.1016/j.yofte.2020.102149.
169. Liu, H.; Ma, J.; Yan, W.; Liu, W. Traffic Flow Detection Using Distributed Fiber Optic Acoustic Sensing.
IEEE Access 2018, 6, 68968–68980, doi:10.1109/ACCESS.2018.2868418.

Chapter 5. Published Journal Articles | MATTIA FRANCESCO BADO
183
170. Li, M.; Li, S.; Stone, J.S. Novel Optical Fibers for Distributed Sensor Applications. In Proceedings of the
25th Optical Fiber Sensors Conference (OFS), Jeju, Korea, 24–28 April 2017; pp. 1–4.
171. Bao, X.; Webb, D.J.; Jackson, D.A. Combined distributed temperature and strain sensor based on Brillouin
loss in an optical fiber. Opt. Lett. 1994, 19, 141–143.
172. You, R.; Ren, L.; Song, G. A novel OFDR-based distributed optical fiber sensing tape: Design,
optimization, calibration and application. Smart Mater. Struct. 2020, 29, doi:10.1088/1361-665X/ab939a.
173. Song, Q.; Zhang, C.; Tang, G.; Ansari, F. Deep learning method for detection of structural microcracks by
brillouin scattering based distributed optical fiber sensors. Smart Mater. Struct. 2020, 29, doi:10.1088/1361-
665X/ab874e.

Chapter 5. Published Journal Articles | Mattia Francesco Bado
184
Chapter 5.2 Sensors 2018
Bado MF, Casas JR, Barrias A. Performance of Rayleigh-Based Distributed Optical Fiber Sensors Bonded to
Reinforcing Bars in Bending. Sensors. 2018; 18(9):3125. https://doi.org/10.3390/s18093125
Performance of Rayleigh-Based Distributed Optical Fiber Sensors Bonded to
Reinforcing Bars in Bending
Mattia Francesco Bado 1,*, Joan Ramon Casas 1 and António Barrias 1
1 Department of Civil and Environmental Engineering, Technical University of Catalonia (UPC),
c/Jordi Girona 1-3, 08034 Barcelona, Spain.
Abstract: Distributed Optical Fiber Sensors (DOFSs), thanks to their multiple sensing points, are ideal tools for the
detection of deformations and cracking in reinforced concrete (RC) structures, crucial as a means to ensure the
safety of infrastructures. Yet, beyond a certain point of most DOFS-monitored experimental tests, researchers have
come across unrealistic readings of strain which prevent the extraction of further reliable data. The present paper
outlines the results obtained through an experimental test aimed at inducing such anomalies to isolate and identify
the physical cause of their origin. The understanding of such a phenomenon would enable DOFS to become a truly
performant strain sensing technique. The test consists of gradually bending seven steel reinforcement bars with a
bonded DOFS under different conditions such as different load types, bonding adhesives, bar sections and more.
The results show the bonding adhesives having an influence on the DOFS performance but not on the rise of
anomalies while the reasons triggering the latter are narrowed down from six to two, reaching a strain threshold and
a change in structure’s deformative behavior. Further planned research will allow identification of the cause behind
the rise of strain-reading anomalies.
Keywords: structural health monitoring; damage identification; distributed optical fiber sensors; Rayleigh
backscattering; reinforced concrete members; steel reinforcement bars; strain-reading anomalies; spectral shift
quality

Chapter 5. Published Journal Articles | MATTIA FRANCESCO BADO
185
1. Introduction
1.1. Distributed Optical Fiber Sensors (DOFS) as a Tool for Structural Health Monitoring (SHM)
Structural Health Monitoring (SHM) techniques are finalized to the detection of deformation and cracking in
concrete structures to ensure the safety of the infrastructure [1] by identifying early signs of excessive damage and
giving feedback on the structure’s ability to continue serving its intended purpose. Henceforth, it crucially helps
preventing the adverse social, economic, ecological, and aesthetic impacts that may occur in the case of structural
deficiency. In the modern age, the most commonly used tools for capturing information on the structure’s health
and efficiency are electrical strain sensors, accelerometers, inclinometers, GPS-based sensors, acoustic emission,
wave propagation, etc. Yet, these methods have serious deficiencies among which the most significant are their
sensibility-insufficient sensitivity to damage of applied methods, or to environmental disturbances [2]. More
sophisticated optical fiber sensing techniques such as Fiber Bragg Grating (FBG) sensors [3-5] also have evident
shortcomings among which are limited strain location range monitoring. These shortcomings prevent the possibility
of precisely pointing out the location where the damage first occurs and prevents the linking of local damage
mechanisms to the global condition of the structure [6]. This limitation is surpassed by Distributed Optic Fiber
Sensors (DOFS). The fundamental principle of DOFS is the ability to measure strain and/or temperature along the
fiber’s length by means of light scattering whenever the photons of the emitted light interact with the physical
medium where this occurs (the fiber itself) and with local material characteristic features such as density,
temperature and strain [7,8]. Three different types of scattering processes may occur in a DOF sensor, Raman,
Brillouin and Rayleigh scattering, but all hold particular optical features that make one more suitable than others
relative to the research objectives. While the Raman scattering is characterized by high dependence on temperature
it can also be used to extract physical and chemical information of a material [9] such as food quality [10] or
explosive materials [11]. Brillouin backscattering, thanks to its extended measurement range capability (up to
several kilometers) is the most studied and used DOFS system in civil [12] and geotechnical [13,14] engineering.
The third scattering phenomenon is Rayleigh scattering. Despite its 70 m sensing range limit, it can provide a high
spatial resolution (up to 1 mm), which is ideal for strain and damage monitoring in concrete structures. The latter is
often used in experimental laboratory investigations having the DOFS bonded either to its surface, to monitor its
strains and damage [7,15], and/or on the reinforcement bars that will later be embedded in the concrete [7,16-18].
The distributed nature of such fibers enables the mapping of temperature, strain and vibration distributions in
two or even three dimensions and their identification at any point along a fiber, henceforth allowing the painting of
a clear picture of the global behavior of a structure rather than reporting the tensile state of a limited number of
points [19]. This, in addition to its high accuracy, long-term stability, durability, and insensitivity to electromagnetic
influences, corrosion, and humidity represents the great potential of the DOFS technique. Despite such, at the

Chapter 5. Published Journal Articles | Mattia Francesco Bado
186
present moment the technique is still undergoing studying and research and therefore has not been standardized yet
nor are there clear guidelines on how to ensure every deployment’s success.
1.2. Strains Reading Anomalies (SRAs)
Two of the main points holding back the DOFS technique from becoming a truly universal and trustworthy
strain-reading method are the frequent appearances of anomalies in the DOFS measurements and the absence of a
reliable DOFS/structural support bonding technique. Multiple publications based on DOFS-monitored experimental
campaigns report coming across strain-reading anomalies (SRA) in the form of localized and excessively large
strain peaks [16-18,20] which have seemingly little to no physical meaning or explanation. For instance, the DOFS
may report in a single point of the fiber large tensile strain peaks followed by equally large compressive strain peaks
in the span of a few seconds. These anomalies do not seem to be restricted to a particular model of Optical
Backscatter Reflectometer (OBR) as they seem to rise up in both ODiSI-A model [15,16] and OBR 4600 [17,18,20],
both manufactured by LUNA Technologies (Roanoke, VA, USA). This situation occurs also in the experimental
test described in this paper as shown in Figure 1.
Figure 1. Three-dimensional representation of the strains measured by the DOFS over time along the fiber.
Such readings can be considered abnormal for the following reasons:
their sheer size;
Ba
r 1
Ba
r 2
Ba
r 3
Ba
r 4
Ba
r 5
Ba
r 6

Chapter 5. Published Journal Articles | MATTIA FRANCESCO BADO
187
the large difference with the previous readings despite the load difference between the two being almost
negligible;
the occurrence of large compressive peaks in a homogenously tense area of the structure.
This acute proximity among tensile and compressive strain peaks can also be present geometrically speaking.
Indeed, such opposite strain peaks may be reported in neighboring sections of the monitored structure even a few
millimeters distant. This is abnormal considering that usually both sections are entirely and homogenously in tension
or compression and further illogical considering their co-existence at a very short distance from one another. The
phenomenon here described has little to no physical meaning suggesting that it might simply be an erroneous DOFS
strain-reading. This assumption is confirmed when comparing the monitored structure’s behavior under loading
with theoretical models and simultaneous strain gauges monitoring. In the present case, none of the above methods
concurs with the DOFS’s reported strain peaks suggesting that these are in fact SRAs. These anomalies should
obviously be avoided as they prevent the possibility of getting reliable measurements in the single location of the
anomaly (time-wise and geometrical-wise anomalies) and extensively increase the level of unreliability of the
surrounding measurements.
Despite the frequent occurrence of such phenomenon in DOFS-monitored civil engineering-oriented
experimental campaigns, it has been the topic of little research and hardly any data is available on its possible origin.
Among it, the authors of [21] offer an essential take on the subject. Indeed, according to the latter, the DOFS reading
anomalies are mainly determined by local failure of the algorithm that tracks the beating between the local oscillator
point of the range under analysis in the OBR software and the light from the fiber during the wavelength sweep.
This may further be due to the un-altering of factors such as the sensor gauge length and spacing. Yet, this is the
case for homogeneous materials subjected to low strain values; however, when dealing with substrates of more
heterogeneous composition (such as concrete) or/and with strong discontinuities (cracked RC members), it may be
different as these physical elements and mechanisms may affect the fiber’s readings.
The present paper discusses the results of an experimental campaign exploring strictly the so-called physical
causes of these anomalies in the case of DOFS subjected to high levels of strains or bridging local discontinuities
of the substrate material, with the objective of removing the consequent physical-induced anomalies from the
extracted data. Oppositely, issues connected to the OBR’s intrinsic algorithms and quality of the collected Rayleigh
shift later used for the correlation, are not contemplated in the present publication. Lastly, the paper aims at drawing
some conclusions regarding the efficient use of DOFS in the case of civil engineering structures monitored by means
of commercially available OBR systems as the one used in the tests herein reported.
2. Experimental Investigation of the Strain-Reading Anomalies
2.1. Test Motivation and Setup

Chapter 5. Published Journal Articles | Mattia Francesco Bado
188
The authors have conceived an experimental test aimed at pin-pointing the motive behind the SRAs. The test
intends on inducing these in a controlled environment under different conditions to isolate and identify the cause of
their origin. As presented in Figure 2 the experiment, carried out in UPC-BarcelonaTech’s laboratory, sees the
loading of seven parallel S500 steel reinforcement Ø20 bars with their extremities welded to two C shaped steel
beams (assuming a fixed beam behavior).
Figure 2. Test setup and three-dimensional specimen detailing with vertical DOFS representation.
Six of the rebars are instrumented with a single 5 m long DOFS (Bars 1–6) and one is instrumented with strain
gauges for comparison purposes (Bar 7). Please note that, while the current DOFS is commercially considered as a
5 m long fiber, its sensing length is slightly longer (5.21 m) as visible in all the extrapolated data. To instrument
multiple bars with the same DOFS, the latter has some segments bonded to the lower face of each bar (providing
strain measurements and drawn in red in Figure 2) and others that function merely as bridges between the first ones
(these do not yield any useful strain measurements, drawn in blue). Figure 2 indicates in the three-dimensional
model of the specimen what are the segments of each bar instrumented with the DOFS as explained in the following;
two white triangles on every bar indicate the first and last point that the fiber is bonded to the rebars signifying that
all those in between are being monitored. Table 1 indicates which points along the 5 m long fiber correspond to

Chapter 5. Published Journal Articles | MATTIA FRANCESCO BADO
189
these triangles, in other words, providing their DOFS coordinate. The table and Figure 2 also include the DOFS
coordinates of those points where the INSTRON actuator is in contact with the rebars, loading them.
Table 1. DOFS coordinate of the first and last point bonded to each steel rebar and of load application.
Bars First DOFS Coordinate
Bonded to the Bar (m)
DOFS Coordinate of the Load
Application Point of Each Bar
(m)
Last DOFS Coordinate
Bonded to the Bar (m)
1 1.36 1.57 1.85
2 1.99 2.28 2.56
3 2.67 2.96 3.24
4 3.37 3.63 3.88
5 4.00 4.28 4.57
6 4.65 4.94 5.21
For example, the strain readings extrapolated by the DOFS coordinate 1.42 m refers a particular section in Bar
1. Oppositely, the readings from the DOFS coordinate 1.89 m can be disregarded as they report the strains from a
section of the DOFS that is not glued to any rebar.
The current research uses the Optical Distributed Sensor Interrogator (ODiSI-A) which analyzes the Rayleigh
backscatter from a standard single-mode DOFS set to measure strains and temperature. The test surveys the DOFS
performance for different bonding conditions, rebar sections and loading speed. Indeed, two kinds of adhesives
were used to bond the DOFS to the bars. Cyanoacrylate for Bar 2 and Bar 5; silicone for Bar 3 and Bar 6;
cyanoacrylate with an extra silicone layer on top for Bar 1 and Bar 4. Furthermore, Bars 4, 5, 6 were incised along
their upper face to locally reduce their sectional area. The dimension of such incisions can be read in Figure 2. Some
incisions are very sharp meanwhile others are smoother. The bars are loaded simultaneously in their mid-span with
different speeds and with two impact loads. The latter stands for loads applied on the specimen in the fraction of a
second and are designed to be included in the loading plan between steps of monotonic loading.
As mentioned earlier, the test studies multiple scenarios that could be the physical cause of the strain-reading
failures SRAs. These scenarios will henceforth be called Disruption Mechanisms. Below are listed seven of these,
each followed by the experiment’s attempt at simulating them.
(DM-SB1) The bending of the bar (the fiber’s support) beyond a certain point may be too high for the tensile
and shear strength of the fiber’s constituting material therefore causing SRAs in the produced readings. The
existence of a strain value beyond which anomalies are consistently more susceptible to be triggered is herein
defined as Anomalistic strain threshold (AST). The veracity/influence of such disruption mechanism will be
examined by applying an increasingly larger bending load on the rebars while constantly monitoring the strain
profiles provided by the DOFS on the lookout for the appearance of SRAs.
(DM-SB2) When the first crack appears in a bending RC member, the stress that the tensile rebar suffers in the
cracked section increases exponentially (the strains could be even 20 times larger than its previous value). Indeed,

Chapter 5. Published Journal Articles | Mattia Francesco Bado
190
the steel suddenly passes from simply contributing to resisting the local tensile stress concurrently with the concrete
(when the section is whole) to bearing it alone (having the concrete cracked). The resulting abrupt peaking of
stresses in the steel rebar will automatically be transferred to the bonded DOFS which could potentially lead to the
disruption of its reading capacity. To simulate such, two impact loads are applied on the bars during the test. If the
fiber can deliver reliable readings after having suffered these impacts, then it can be assumed that DM-SB2 does
not affect the DOFS’s performance. It should be noted that, if the increase in stresses in the rebar when concrete
cracks were to be entirely simulated in the present test, it would lead to a very large bending of the rebars and of
the DOFS. In a RC member, being the rebars restrained by the surrounding concrete, such hefty bending would not
occur making the latter excessive and unrealistic. Furthermore, if SRAs would spring up after such impact, it would
be unclear whether they were caused by the sudden rise of strains in the fiber or by the sudden increase in curvature
making the test inconclusive. The impact loads are, therefore, limited to 0.1 kN and 1.0 kN causing in each bar an
increase of respectively 1.6 MPa and 16.0 MPa.
(DM-SB3) In the aftermath of the cracking of a bending RC member, a redistribution of stresses and strains
occurs inside it. According to the stress-transfer laws for cracking RC members [22], the steel rebar’s new strain
profile boasts a peaking of stresses in correspondence of the cracked sections while it stays unaltered in the sections
most distant from the cracks. This is due to stresses being transferred from concrete to steel the closer the case-
study section is to the cracked section. How quickly such stresses are transferred is a function of the transmission
length lt. An excessively quick transfer (corresponding to a short lt on either side of the cracked section) may cause
errors in the DOFS readings. To simulate different transmission lengths, the experimented rebars present incisions
with steep or inclined/smooth edges. The reduced area of the rebars leads to increased carried stresses in the incised
sections, similarly to what happens in RC beam sections that have cracked compared to those that have not. A steep
edge of the incision (Block 1) can be compared to a short transmission length lt while a sloping one (Block 2, 3)
can be compared to a long lt. The strains in these three rebars are closely monitored to verify whether a drastic
section gradient (Block 1) causes SRAs first compared to softer incision edges.
(DM-AD1) According to some publications on DOFS-based research [14,18], SRAs seem to spring up soon
after the appearance of the first concrete damage sign suggesting that there might be a connection between the two.
Taking in consideration a RC member with DOFS-instrumented rebars, if the adhesive positioned on top of the
fiber is not protective enough (not thick enough or composed of excessively deformable material), then the cracking
concrete friction against the fiber may cause alterations in it leading to SRAs. While DM-AD1 cannot be checked
with the present test, being it deprived of concrete, it is nonetheless possible to check the difference in the strain-
reading capacity of the DOFS when it is covered by a single layer of adhesive or double (having respectively a
bonding and protective function). This is the reason cyanoacrylate and an extra silicone layer on top are deployed
in Bars 1 and 4.

Chapter 5. Published Journal Articles | MATTIA FRANCESCO BADO
191
(DM-AD2) To a certain extent, being completely embedded in adhesive, the DOFS reports as much latter’s
strains as the supporting structure’s. Under the hypothesis of perfect bond between adhesive and supporting
structure the strains are identical, but this may not always be true. When adhesives harden, they deliver their top
stiffness performance ensuring the strongest bond with the structural element, but they may also acquire deformative
features (fragility, segmented behavior, etc.) that could lead, when under stress, to their delamination and cracking
altering the performance of the embedded fiber. During the loading phase the adhesives are monitored to spot
eventual deterioration.
(DM-AD3) An incorrect DOFS confinement design may lead to altered strain readings. The use of an adhesive
with poor confining strength properties or the application of an insufficiently thick layer may cause the fiber to
delaminate from its support, therefore losing the hypothesis of perfect bond with its support. As before, the
adhesives are monitored during the test to spot any delamination.
(DM-AD4) It is possible that the viscosity of the adhesive (significant when using silicone) influences the fiber’s
performance ensuring a minimum amount of slip between the fiber and the adhesive. This allows a minor stress
redistribution among the neighboring fiber sections that could be the key in avoiding premature SRAs despite being
detrimental to the precision of strains measurement. A comparison between the readings provided by the portion of
DOFS bonded with cyanoacrylate is compared to that coming from the portion bonded with silicone.
2.2. Test Procedure and Outputs
The results reported by the DOFS are studied keeping in consideration the following aspects:
The specimen’s rebars were not exactly on the same plane due to slight deformations occurring during the
welding process. As a result, the applied load, herein defined as global load, is not evenly distributed among
the rebars. Automatically some of them suffer more strains than others.
As a consequence of the point above, the bars suffering larger strains are the ones reaching first the yielding
stress. In that instance, only some bars have yielded while the others have not. Later in the test, with the
increase of the global load, every bar eventually reaches its yielding point.
Bar 1 behaves differently than the other six. Indeed, notwithstanding the other rebars do not precisely behave
as end-fixed beams, as seen later, their behavior gets rather close. On the other hand, Bar 1 seems to have
hardly any stiffness at its extremities and, because of such, does not seem to participate to the structure’s
rigidity.
As mentioned above, during the test the specimen is subjected to two loading speeds and two impact loads.
Initially the specimen is loaded at a speed of 0.35 kN/min. At 880 s an impact load of 0.1 kN is applied followed
by a 60 s hold. At its conclusion, the specimen is again loaded at 0.35 kN/min until, at 1835 s, a second impact load
(1.0 kN) is applied. As before, a 60 s hold follows, at the end of which the specimen is loaded at a quicker speed of

Chapter 5. Published Journal Articles | Mattia Francesco Bado
192
1.12 kN/min until the specimen’s plasticity is reached. The load-displacement curve, as obtained by the INSTRON
hydraulic actuator, is presented in Figure 3. With this in mind, the DOFS global strain diagram is represented in
Figure 4 for three increasing load levels.
(a) (b)
Figure 3. (a) Test load curve over time and (b) over the load actuator’s-measured displacements.
Figure 4. DOFS strain profiles at specific time and global load instances along the test.
Figure 4 represents the strain distribution along the whole 5.21 m long fiber at specific instances and specific
global load values. Each of the graphs’ six visible tensile peaks represents the strains in each of the six bars that are
DOFS-instrumented. As example, in the strain profile extracted at 2989 s, corresponding to a global load of 28.18
kN, it can be stated that the mid-span of Bar 1 is characterized by a strain state of 3165 με. On both sides of each
tensile peak are compressive measurements that do not represent the entirety of the compressive portion of the bars’
strain state as the DOFS is not glued all the way to the supports. Finally, the strain-less horizontal segments between
3864 s; 43.8 kN
0
10
20
30
40
50
60
0 1500 3000 4500 6000
Glo
bal
l l
oad
(kN
)
Test time (s)
0.1 kN impact load
1.00 kN impact load
Loading speed
0.35 kN/min
Loading speed 1.12 kN/min
18.5 mm; 43.8 kN
0
10
20
30
40
50
60
70
0 5 10 15 20 25 30
Glo
bal
lo
ad (
kN
)
Displacement (mm)
Load-Displacement curve
Linear (trendline)
1.00 kN impact
load
-3000
-2000
-1000
0
1000
2000
3000
4000
5000
6000
0,0 1,0 2,0 3,0 4,0 5,0
Str
ains
(με)
Fiber coordinate (m)
t=3889 s; Global load=43.8 kN
t=3089 s; Global load=30.0 kN
t=2015 s; Global load=10.0 kN
Bar
1
Bar
2
Bar
3
Bar
4
Bar
5
Bar
6

Chapter 5. Published Journal Articles | MATTIA FRANCESCO BADO
193
the compressive segments are the above-mentioned sectors of the DOFS that act as bridges between the segments
bonded to the bars. The uneven distribution of the global load among the seven bars is clear when comparing the
maximum strain suffered by each. Finally, if to consider the strain profile at 3889 s, at an applied global load of
43.82 kN, some SRAs are visible (mid-span of Bar 2 and Bar 3) making the readings impossible in those areas.
If to focus on the strain profile of an individual rebar at different global load levels the result would resemble
Figure 5 for Bar 2.
Figure 5. DOFS strain profiles at specific time and global load instances along the test in a specific segment of the DOFS
bonded to Bar 2.
As noticeable its profile seems to grow in a very reasonable and reliable fashion up until the appearance of the
first SRA (in this case between 40 and 45 kN), after which some values are un-readable. On both extremities, the
strain profile in compression is plotted until the support following the strain’s trend-line and assuming the continuity
of linearity. By plotting these, it is evident how, as represented in Figure 6 (for a global load of 20.0 kN), the
behavior of the rebar does not perfectly reflect the behavior of a fixed beam (represented in grey).
Truly, the supports are not perfectly rigid in front of rotation, leading therefore to higher strains in the mid-span
and lower at the extremities if compared to a perfectly clamped beam. This leads to the mid-span section to reach
the yielding stress earlier than the supports. Figure 7 plots the strain profile of a singular rebar (Bar 5) except in this
case some incisions are present along its length. The strain profile’s loss of linearity in the specific segments is
congruous with the rebars’ sections that have been incised making them easily recognizable on the measured DOFS
strain profile. Before and after the incision’s profile variations, the linearity is re-acquired. This figure also
demonstrates the DOFS ability to read strains all along Bar 5 free of SRAs (until later in the test when many sections
acquire SRAs) despite the presence of incisions with and without steep edges. This discards (DM-SB2) from the
possible disruption mechanisms.
-2500
-1000
500
2000
3500
5000
6500
1,93 2,03 2,13 2,23 2,33 2,43 2,53 2,63
Str
ain (
με)
Fiber coordinate (m)
Load 45 kNLoad 40 kNLoad 30 kNLoad 20 kNLoad 10 kN
Ass
um
ed
tren
d-l
ine
val
ues
Assumed
trend-line values

Chapter 5. Published Journal Articles | Mattia Francesco Bado
194
Figure 6. Comparison between the strain profile corresponding to a global load of 20 kN of a theoretical end-fixed
specimen and the DOFS measured one in the segment corresponding to Bar 2.
Figure 7. DOFS strain profiles at specific time and global load instances along the test in a specific segment of the DOFS
bonded to Bar 5.
Comparing the strain profile of all the seven rebars at a global load of 30.0 kN (3089 s), as in Figure 8, the
similarity among them is evident (except for the local increase in strain in the location of the incisions) along with
the correspondence between the strain gauge’s and the DOFS’s measurements. Strain gauge 2 seems to be the only
one not reporting correct values, probably due to a slight damage occurred during the positioning process. This
embodies one more advantage of the DOFS. Indeed, differently with the strain gauges, the latter does not require
fixing of every single sensing point, making it so that the correct positioning of the fiber is enough to ensure the
reading capacity and reliability of each point. The comparisons among each bar’s DOFS strain profile along with
their coherence with the strain gauges’ measurements is a testament to the performance and the reliability of the
DOFS strain sensing technique.
-2500
-1750
-1000
-250
500
1250
2000
2750
1,93 2,03 2,13 2,23 2,33 2,43 2,53 2,63
Str
ain (
με)
DOFS coordinate (m)
Load 20 kN
Extension of the strain diagram
Strain diagram for fixed beam
𝑙
2
𝑙
27𝑙
20
13𝑙
20
-2500
-1500
-500
500
1500
2500
3500
4500
3,95 4,05 4,15 4,25 4,35 4,45 4,55
Str
ain (
με)
Fiber coordinate (m)
Load 40kN
Load 30kN
Load 20kN
Load 10kN
Block 1 (BK1)
Block 2
(BK2)Block 3
(BK3)

Chapter 5. Published Journal Articles | MATTIA FRANCESCO BADO
195
Figure 8. Comparison between the DOFS-measured strain profile segments bonded to each rebar for a global load value
of 30.0 kN.
3. Discussion of the Results Regarding SRAs
3.1. Analytical Definition of an SRA
According to the DOFS provider’s user guide [23] (LUNA Technologies), the reliability of all strain readings
can be assessed through their associated Spectral Shift Quality (SSQ) value. The SSQ is a qualitative measure of
the correlation strength between the conducted measurement (at any point and time) and the original baseline
reflected spectra as in Equation 1 below.
SSQ = 𝑚𝑎𝑥 (𝑈𝑗(𝑣)∗𝑈𝑗(𝑣−∆𝑣𝑗))
∑ 𝑈𝑗(𝑣)2 , (1)
with:
Uj(v) the baseline spectrum for a given segment of data
Uj(v − ∆vj) the measurement spectrum under a strain or temperature change
* the symbol is used to represent the cross-correlation operator
Theoretically, the Spectral Shift Quality should be a value between 0 and 1, where 1 is a perfect correlation and
zero is uncorrelated. Practically speaking though, the calculated value can exceed 1 due to small variations in the
laser power. The data sets will be accurate if the Spectral Shift Quality is above 0.15. Instead, if the SSQ is less, it
is likely that the strain or temperature change has exceeded the measurable range. Please note that, as strain or
temperature variation increases, the Spectral Shift Quality will decrease. The SSQ automatically qualifies as a tool
to gain insight on the accuracy of every strain-reading and identification of SRAs [18]. Figure 9 provides a graphical
depiction of the values of SSQ corresponding to each strain measurement performed by the DOFS in the test.
SG1
SG2
SG3
SG4
SG5
-1700
-700
300
1300
2300
3300
0,00 0,08 0,15 0,23 0,30 0,38 0,45 0,53
Str
ain (
με)
DOFS section glued to the bars (m)
Bar 6
Bar 5
Bar 4
Bar 3
Bar 2
Bar 1
Strain Gauges

Chapter 5. Published Journal Articles | Mattia Francesco Bado
196
Figure 9. Two-dimensional representation of DOFS-measured strain along time over the whole span of the fiber bonded to
the rebars (above) and their relative SSQ values (below).
Yet, according to the latter, the more the fiber is under stress the less the SSQ seems adapt to the identification
of anomalies. Figure 10 provides a good example of such. In its upper part is shows the strain evolution in time of
the DOFS coordinate 4.15 m with below its corresponding SSQ values. Every X marker along the plotted line
represents a single measurement developed in time while the peaks are the graphical expressions of SRAs. Below
are the corresponding SSQ values of those same DOFS readings. Evidently, between 3500 and 3620 s no strain
measurements should be considered anomalistic as they all clearly plot the evolution of strains in the DOFS
coordinate. Yet, the associated SSQ value of these readings drops multiple times below the threshold of 0.15
suggesting that at least half of such measurements are indeed anomalistic. This is obviously false. The SSQ value
seems to start faulting in its SRAs identification function the closer the measurements get to the first anomaly. The
same can be said for the segments in between SRAs. Indeed, in between 3790 s and 3850 s the corresponding SSQ
value of the strain measurements is never above 0.15 despite its profile indicates the presence of very realistic and
reliable measurements. Furthermore, the point of this interval with the highest SSQ value actually corresponds to
the SRA itself (it should have the lowest SSQ value).

Chapter 5. Published Journal Articles | MATTIA FRANCESCO BADO
197
Figure 10. DOFS-measured strain of the fiber coordinate 4.15 m along time (above) and the corresponding SSQ value of
each measurement (below).
In conclusion, while the SSQ can prove to be a good preliminary tool for identifying anomalies, it is does not
meet the accuracy requirement for identifying the SRAs present in the current test. To compensate for such, the
authors suggest a simpler and more efficient way of identifying SRAs. Given that, by definition of SRA, they
correspond to geometrical discontinuities of the Strains/Time or Strains/DOFS coordinate diagrams it is sufficient
to set a specific value of strain increment that, when compared to the difference of strains values between two
consecutive measurements, if surpassed it indicates the presence of an anomaly. In the present research such value
was set to 200 με. In continuation, Figure 11 plots the total calculated number of SRAs per each DOFS coordinate
calculated both by means of the SSQ and with the above-mentioned methodology (SM).
Figure 11. Sum of total number of SRAs for every DOFS coordinate for the duration of the test.
1000
1500
2000
2500
3000
3500
4000
3500 3550 3600 3650 3700 3750 3800 3850 3900
Str
ain (
με)
Test time (s)
DOFS strain reading at fiber coordinate
4.15 mtrendline of strain increase
0,05
0,10
0,15
0,20
3500 3550 3600 3650 3700 3750 3800 3850 3900
SS
Q v
alue
0
50
100
150
200
250
300
1,30 1,65 2,00 2,35 2,70 3,05 3,40 3,75 4,10 4,45 4,80 5,15
To
tal
nu
mb
er o
f S
RA
s p
er D
OF
S
coo
rdin
ate
DOFS coordinate (m)
Suggested method (SM) SSQ
Bar 1 (SI)
SM: 637 SRAs
SSQ: 884 SRAs
Bar 2 (CYN)
SM: 1026 SRAs
SSQ: 1310 SRAs
Bar 3 (CYN+SI)
SM:1304 SRAs
SSQ: 1824 SRAs
Bar 4 (SI)
SM: 737 SRAs
SSQ: 1073 SRAs
Bar 5 (CYN)
SM: 1339 SRAs
SSQ: 2203 SRAs Bar 6
(CYN+SI)
SM: 858 SRAsSSQ: 1483 SRAs

Chapter 5. Published Journal Articles | Mattia Francesco Bado
198
The method that uses SSQ over-estimates by 30% the number of SRAs henceforth discarding 23% of strain
readings that would be completely readable and able to provide consistent insight in the strains of the support
structure.
3.2. SRAs Mechanics
Figure 12 represents the measured strain in six points of the fiber, corresponding to the mid-spans of the six bars,
from the first moment the bars were loaded (point O) until the end of the test including the instances at which the
impact loads were applied (I1 and I2).
(a) (b)
Figure 12. (a) DOFS-measured strains of the mid-span of every bar along time and (b) zoom on Bar
3’s anomalies.
After around 3800 s (Point B) the profiles are completely dominated by SRAs making it impossible to extract
any reliable strain values.
Several considerations can be developed regarding Figure 12:
The strain profiles until point B and measured strains lower than 4000 με are clear and SRA-free.
All segments of the DOFS have successfully recorded both impact loads demonstrating their ability to
correctly withstand and record a sudden stress growth of 1.6 MPa and 16.0 MPa, as designed by (DM-SB2).
The strain profiles do not report a change of linearity beyond the steel yielding strain, occurring in the mid-
span, as it would be expected. εs,y for an S500 steel corresponds to 2500 με (reached at around 2800 s
according to the above Figure 12, point A). This agrees with Figure 3 which also does not seem to report any
curvature at around 2800 s.
The strain profiles report correctly and precisely the variation of loading speed, both before and after the
yielding of the steel rebars.
,0
1,250
2,500
3,750
5,000
6,250
7,500
8,750
10,000
11,250
12,500
0 2000 4000
Str
ain (
με)
Test time (s)
Bar 1Bar 2Bar 3Bar 4Bar 5Bar 6
1 kN impact load
I1O
B
I2
A
-9,000
-4,000
1,000
6,000
11,000
3500 4000 4500 5000 5500
Str
ain (
με)
Test time (s)
4000
9000

Chapter 5. Published Journal Articles | MATTIA FRANCESCO BADO
199
The strain profiles correspond well with the applied load despite them being slightly offset compared to one
another. The reason behind it is the difference among the heights of the bars when the specimen is unloaded
and the consequent uneven distribution of the global load among them.
Figure 13, clears out the SRAs from Figure 12. The different bars seem to start curving at point B which,
once again, agrees with Figure 3.
As pointed out above, despite all rebars having yielded in the mid-span, the DOFS strain profiles of Figure 13
do not exhibit any evident curving until point B.
Figure 13. DOFS-measured strains of the mid-span of every bar along time without depiction of SRAs.
Here is when the fixed end of the rebars also yield turning into plastic hinges herein the definition of point B as
Plasticity point. The latter does not happen simultaneously for all the bars due to the uneven load distribution among
them. It is, instead, scattered in time. Only once the last of the six bars acquires plastic hinges (Bar 4 at 3864 s), the
load/displacement and load/strain diagrams begin to clearly deviate from linearity. It is noticeable in Figure 4 how
the fixed edges of Bar 1 are strangely less stressed than all the others and hence far from yielding during all the
duration of the test. This inconsistency suggests the failure of Bar 1 in acting as a proper end-fixed beam therefore
not contributing to the rigidity of the structure. So much so that the load-displacement curve deviates from its linear
trend when the extremities of Bars 2–6 yield, completely unaffected by the fact that Bar 1 is, oppositely, far from
it. On another note, Figure 13 is unclear about the instance/strain at which the steel yielding occurred. To visualize
it, Figure 14 plots the strain increment ∆ strain at each DOFS measurement in the mid-spans of Bar 1 and Bar 2 as
examples of the behavior in all bars. The graphs plot only the ∆ strain from 0 s to 3750 s as, beyond such, the
anomalistic values would make it impossible to calculate a realistic trend-line. Up until the yielding point (point A)
the trend-line of the strain increments are mostly linear (excluding the parts straight after the beginning of the test
and straight after the impact load when the DOFS must “settle”). Beyond this point, the linearity is lost therefore
confirming the yielding of the bars in the mid-span occurring around 2500 με.
0
2000
4000
6000
8000
0 1000 2000 3000 4000 5000
Str
ain (
με)
Test time (s)
Bar 1
Bar 2
Bar 3
Bar 4
Bar 5
Bar 6
Curving
point
B

Chapter 5. Published Journal Articles | Mattia Francesco Bado
200
Figure 14. Strain increment ∆ for the mid-span of Bar 1 and Bar 2 along time.
Back to Figure 12, the SRAs seem to be triggered after point B which sees the change in deformative behavior
of the specimen and therefore its loss in linearity of the load-displacement diagram. On the other hand, the anomalies
seem to be initiated in the proximity of a value (around 4000 με) that could represent the anomalistic strain value
AST. The points in defense of the latter option will be discussed later.
SRAs do not rise strictly in the mid-span of the rebars and do not necessarily rise there first either. Figure 1 and
Figure 15 are a 3-dimensional and 2-dimensional graph representing the DOFS-measured strains in the six bars
versus the test time.
Figure 15. Two-dimensional representation of DOFS-measured strain along time over the whole span of the fiber bonded
to the rebars and of the SRAs.
0,00
5,00
10,00
15,00
20,00
∆ s
trai
ns
(με)
Midspan of Bar 1Yielding point: 2800 s
A
0,00
5,00
10,00
15,00
20,00
0 500 1000 1500 2000 2500 3000 3500
∆ s
trai
ns
(με)
Test time (s)
Midspan of Bar 2 Yielding point: 2800 s
A
Specimen’s plasticity point 3800 s
Ba
r 1
Ba
r 2
Ba
r 3
Ba
r 4
Ba
r 5
Ba
r 6

Chapter 5. Published Journal Articles | MATTIA FRANCESCO BADO
201
In Figure 1 the SRAs can be identified as perpendicular peaks coming out of the graphed surface while in Figure
15 they can be identified as black bars. Both graphs allow not only the location of the SRAs in time but also the
geometric correlation with the section of the rebars. Figure 16 zooms in Figure 15 to focus strictly on Bar 5 and
reports the strain values at which the SRAs occur.
Figure 16. Two-dimensional representation of DOFS-measured strain along time over the span of the fiber bonded to the
rebar 5 and example of distinction between harmless and harmful SRAs.
A quick glance of it shows the existence of SRAs that are followed by additional anomalies for all the remaining
duration of the test while others that, despite preventing the correct reading of the strains at a specific instance, still
allow it later. Other SRAs instead are followed by additional anomalies for all the remaining duration of the test. It
is worth distinguishing the two as one represents the end of any reliable strain measurements in a specific section
Harmful Anomalies (HF-SRA) while the other Harmless Anomalies (HL-SRA) do not. Figure 17 plots, for
anomalistic DOFS coordinates, the strain values at which the first HL-SRA and HF-SRA spring up therefore giving
a graphical representation of the SRAs/strains correlation.
Some interesting observations can be developed based on such graphs:
Except for a few DOFS coordinates, the SRAs start beyond the specimen’s plasticity point reached around
3800 s.
SRAs are often concentrated in specific areas where all neighboring sections give evidence of anomalistic
behavior. Such areas can be defined as Anomalistic areas.
Averagely SRAs seem to spring up from the mid-span of the rebars first which, not coincidentally, are the
most stressed points of the seven rebars. The anomalies later spread outwards towards the neighboring section
(clear in Bars 2, 3, 6) forming an anomalistic area.
HL-SRAs
v
v
HF-SRAs
v

Chapter 5. Published Journal Articles | Mattia Francesco Bado
202
Figure 17. Plotting of DOFS-measured strain values at which the first HL-SRA and HF-SRA are recorded in each DOFS
coordinate with anomalies.
In Bars 4, 5, 6, the SRAs also rise in the incised sections concurrently or soon after having appeared in the
mid-span (particularly evident in Bar 5). This further confirms the hypothesis of SRAs springing up from
highly stressed rebar sections.
HF-SRAs are usually proceeded by HL-SRAs.
In some rebars HL-SRAs seem to start slightly before the specimen’s plasticity point while all HF-SRAs after
that. In particular, Bar 3 starts having HL-SRAs as soon as 3000 s at DOFS coordinate 2.97 m.
In some cases, a DOFS coordinate can be characterized strictly by HL-SRAs, always guaranteeing intervals
of strain readability such as DOFS coordinate 4.16 m in bonded to Bar 4.
As evident from Figures 16 and 17, on the edges of the anomalistic areas, the SRAs spring up at lower and lower
strains the more the DOFS coordinates are distant from the mid-span of the rebar. This could debunk the possibility
of the existence of an AST. On the other hand, it can still be plausible considering the presence of the following
phenomena. Assuming the existence of a contagious influence that an anomalistic fiber section could pass on to
neighboring ones, then it would be sufficient that any DOFS coordinate suffered of the first SRA to start a chain
reaction that would lead to the creation of anomalistic areas. This would prevent the sections included in such area
to reach the AST being their SRAs triggered prematurely.
0
2000
4000
6000
8000
1,4 1,5 1,6 1,7
Str
ain (
με)
DOFS coordinate (m)
HL-SRAs HF-SRAs
2,2 2,25 2,3 2,35
HL-SRAs HF-SRAs
0
2000
4000
6000
8000
2,9 2,95 3 3,05
DOFS coordinate (m)
HL-SRAs HF-SRAs
0
2000
4000
6000
8000
3,37 3,52 3,67 3,82
Str
ain (
με)
DOFS coordinate (m)
HL-SRAs HF-SRAs
4 4,2 4,4 4,6
HL-SRAs HF-SRAs
0
2000
4000
6000
8000
4,8 4,9 5 5,1 5,2
DOFS coordinate (m)
HL-SRAs HF-SRAs

Chapter 5. Published Journal Articles | MATTIA FRANCESCO BADO
203
Another point in favor of the existence of an AST is suggested by the location of most HF-SRAs in Figure 17.
Indeed, 83% of HF-SRAs are triggered at a strain level beyond 4000 με while the other 17% are HF-SRAs that have
sprung up on the edges of anomalistic areas. As explained above, the smaller portion of HF-SRAs are probably
triggered prematurely by the influence exercised by the anomalistic behavior of neighboring sections which already
have SRAs. Table 2 attempts to extrapolate the value of AST differently. It takes in consideration all the SRAs
along the whole DOFS and calculates their total number beyond a specific value of strain.
Table 2. Percentage of SRAs over the total number of strain measurements below specific strain values.
Strain
Level
(με)
Total
Number of
Strain
Readings
Total Number
of SRA-Free
Strain
Readings
Percentage of
Readings with
SRAs
500 169,070 151,913 10.15%
1000 131,553 114,411 13.03%
1500 108,452 91,361 15.76%
1750 98,605 81,560 17.29%
2000 89,367 72,389 20.22%
2250 81,819 64,878 21.95%
2500 74,560 57,675 23.90%
2750 67,725 50,906 26.08%
3000 60,820 44,047 28.78%
3250 55,015 38,262 31.52%
3500 49,346 32,631 34.75%
3750 43,330 26,748 38.82%
4000 38,731 22,259 42.71%
4250 33,891 17,609 47.68%
4500 29,560 13,496 53.23%
4750 27,523 11,698 55.93%
5000 26,156 10,557 57.73%
5250 25,210 9697 59.31%
5500 24,303 8899 60.85%
5750 23,965 8622 61.37%
6000 23,639 8375 61.87%
In the presence of an AST it should be possible to see in Table 2 an increase of total anomalies beyond a specific
strain value. As a matter of facts, around 4500 με the curve suddenly becomes steeper suggesting that the latter is
the AST. Between the two ways of calculating the AST, the first is not only more conservative but also tackles the
issue of HF-SRAs which represent the biggest threat to the monitoring of an experimental campaign.
In conclusion, the SRAs seem to proliferate on all six DOFS-instrumented bars in the most stressed sections
(mid-span or/and incisions). This occurred late in the test both in full and incised sections and despite the early
application of two impact loads. Consequently, DM-SB2 (for small impact loads) and DM-SB3 can be discarded as
potential triggers of the SRAs. Harmless anomalies HL-SRAs rise earlier than Harmful ones HF-SRAs but, being
0
1000
2000
3000
4000
5000
6000
7000
0% 20% 40% 60%
Str
ain (με)
Total SRAs / Total strain readings
beyond specific strain values

Chapter 5. Published Journal Articles | Mattia Francesco Bado
204
the proliferation of the latter more troublesome in experimental tests, they are the focus for the determination of an
AST. The value of the latter is 4000 με (DM-SB1) which, unfortunately, coincided time-wise (3800 s) in the test
with the specimen’s change in deformative behavior. The coincidence of these two phenomena prevents the pin-
pointing of which of these two factors is the actual SRA trigger. Further experimental investigation is therefore
required.
3.3. Adhesives Performance
In the present section the performance of the different adhesives used in the test is analyzed to extract conclusions
over which is most suitable for DOFS-monitored rebars embedded in RC members. To bond the DOFS to the rebar
silicone (SI), cyanoacrylate (CYN) and a combination of the two (CYN+SI) have been used respectively in Bars 1,
4 and Bars 2, 5 and Bars 3, 6. Figure 8 compares the strain profiles obtained by all of them at a specific global load
with an evident good agreement. The same cannot be said in the incised sections for Bars 4, 5, 6. Figure 18 compares
the DOFS strain profile of these three bars after having equalized the maximum strain (3700 με).
Figure 18. Comparison between the DOFS-measured strain profile segments bonded to Bars 4, 5, 6 for a global load
value of 30.0 kN.
Bar 5 and Bar 6 share the incision layout (as evident in the specimen dimensions in Figure 2) while Bar 4 shares
the layout of the other two only on half of its length (left half of Figure 18). The decision behind this different layout
was taken to check whether a steep-edged incision in proximity of the point that supposedly suffers the harshest
stresses (the mid-span), would be the birth-place of the DOFS’s first SRAs. The following observations can be
listed following an analysis of Figure 18:
All three strain graphs are in very good agreement in their linear sections and in the mid-span.
-1500
-500
500
1500
2500
3500
4500
0,03 0,11 0,18 0,26 0,33 0,41 0,48 0,56
Str
ain (
με)
DOFS coordinate (m)
Bar 6
Bar 5
Bar 4
Block 1 (BK1)
Block 2 (BK2)Block 3 (BK3)
(CYN+SI)
(CYN)
(SI)

Chapter 5. Published Journal Articles | MATTIA FRANCESCO BADO
205
Bar 5 and Bar 6 are in excellent agreement on the strain distribution around Block 2, slightly less but still
reasonably around Block 1 and differently in Block 3.
Around Block 3 similar strain values are reported by Bar 4 and Bar 6 (despite their curve profile is not
matching). Both include silicone while Bar 5, the only bar providing a different strain value, includes
cyanoacrylate.
Bar 5 and Bar 6, despite providing different strain values, have a similar curve profile especially around
Block 3 where a “strain bump” is present. Differently, on the left side of the graph, Bar 4’s profile is almost
linear.
The above listed points can all be explained taking in consideration the constitutional property of the silicone
and its easily deformable and elastic nature even after curing. When the DOFS support (the rebars) deforms, the
fiber does not deform in an equivalent manner because of a quantity of slip allowed by silicone. This slightly
redistributes it among the neighboring sections reducing the stresses on the fiber in Block 3 and leading to the
transformation from a strain peak to a lesser and wider “strain bump”. In the case of Bar 6, the two adhesives act as
a composite material displaying some behavioral features of one and the other. Indeed, in Block 3 its strain profile
shows a peak which, despite being of smaller quantity than Bar 5’s, is still evidence of the cyanoacrylate behavior.
The reduced entity of Bar 6’s peak can be explained by a redistribution of stresses that the silicone intrinsically
performs when receiving the stresses from its contact surface with cyanoacrylate. If there were not any slip between
the supporting structure and the adhesive and between the adhesive and the DOFS, for a continuous fiber the strain
in the latter would equal the strain in the supporting structure. For silicone, though, the slip is present, slightly
altering the strain readings on the bar oppositely to the cyanoacrylate that, without slip, accurately reports its strains.
From a strain fidelity point of view, the cyanoacrylate is the best adhesive. On the other hand, whenever using
silicone for DOFS bonding, the correct position of the incisions on the rebar (which in real RC members would be
the cracks) is correctly detected. On the other hand, Bar 5 and Bar 6’s behavior is perfectly equivalent in Block 2
and Block 1 suggesting that the redistribution of silicone is a function of the transmission length lt If the latter is
short enough, hardly any redistribution occurs while for larger ones, such as Block 3, the redistribution can fully
develop.
Figure 11 plotted the total amount of SRAs that occur in all DOFS coordinate for the duration of the test up until
a global load of 49.8 kN (end test is at 50.5 kN) and indicated what was the total number of SRAs in each segment
of the fiber bonded to each bar. The rebars having the least number of anomalies are Bar 1 and Bar 4 both having
the DOFS bonded with silicone. Bar 3 and Bar 6, despite sharing the same DOFS-bonding adhesives, they share a
total number of SRAs which are similar to respectively Bar 5 (1304 vs. 1339 SRAs) and to Bar 4 (858 vs. 737
SRAs). Such is a demonstration that the performance of combined adhesives has a substantial level of sporadicity

Chapter 5. Published Journal Articles | Mattia Francesco Bado
206
that oscillates between the behavior of their constituents, in this case between cyanoacrylate and silicone. These are
the only conclusions possible on (DM-AD1).
Analyzing now the SRAs amount per bar section it is evident that Bar 1 and Bar 4 (Silicone) have lower peaks
than the rest suggesting that, per single DOFS coordinate, the number of anomalies are inferior compared to the
others therefore guaranteeing more strain readability. When comparing Bar 4, 5 and 6 the ones that include silicone
hardly present any SRAs in two of the three incision while Bar 5 clearly has a large number of them around the
incisions and the mid-span. This was possible thanks the intrinsic ability of the silicone to redistribute stresses
therefore preventing their concentration in particular DOFS coordinates (as suggested by DM-AD4) that could lead
up to the SRAs. Therefore, from a resistance point of view (intended as absence of anomalies), the silicone is the
best adhesive. So much so that, among all the DOFS-instrumented rebars, the ones using silicone present an inferior
number of total SRAs both in singular DOFS-coordinated and on the whole bar segment. The stress redistribution
mechanism, despite slightly altering the strain readings, also delays the rise of anomalies (as evident in Figure 15)
to higher strain levels. In addition, the silicone does not run the risk of cracking as other non-elastic adhesives [24].
This represents an advantage of the silicone over cyanoacrylate, not a limitation of the latter as reliable
measurements can be taken also with cyanoacrylate until high strain levels, removing DM-AD4 form the possible
causes of the rise of SRAs.
Summing up the points extracted above, it can be stated that there is not a better adhesive for any DOFS-
instrumented test in RC members but rather a better one according to the objectives of the test itself. If high levels
of precision in strain calculation are required, then the best bonding adhesive is cyanoacrylate, even though its
fragility makes it more predisposed to having SRAs earlier on in experimental tests. On the other hand, if the main
concern of the investigator lies in extending the anomaly-free monitoring duration time, then the optimal adhesive
is silicone. While the strain measurements will be less precise, the number of anomalies will be inferior and the
SRAs will start appearing later compared to other adhesives. Finally, if the main concern of the researcher is the
protection of the DOFS from concrete friction, then the use of two layers of adhesives (cyanoacrylate and silicone)
provides such with a hybrid behavior of its two base components.
Concerning disruption mechanisms DM-AD2 and DM-AD3 no apparent debonding was evident while only a
small crack in cyanoacrylate was spotted. Yet, no anomalistic correlation can be found corresponding to the cracked
section suggesting that only the most superficial layer of the adhesive had cracked, leaving intact the one below in
direct contact with the DOFS. As a consequence of such, assuming a correct positioning of the adhesives these two
disruption mechanisms can be discarded from the possible causes for the rise of SRAs.
4. Conclusions
The experimental test, topic of the present paper, demonstrated once again the large potential of DOFS for strain
measurements on/inside civil engineering structures. The strains measured were indeed congruent both with the

Chapter 5. Published Journal Articles | MATTIA FRANCESCO BADO
207
expected theoretical response and with the strains measured in parallel by the strain gauges, at stress levels of small
and large entity (more than double of the yielding stress) and in a completely distributed manner. The Strain-
Reading Anomalies, above defined as SRAs, are DOFS-produced strain readings glitches that prevent the
extrapolation of useful data. The paper has given an interpretation of their possible causes focusing strictly on the
physical aspect of the substrate on which the fiber is bonded. The results of such research, combined with studies
on SRAs from a computational and optical point of view, can provide the groundings for a global and complete
understanding of the SRA phenomenon. To study such physical-induced anomalies, an experimental campaign was
designed to trigger them in an isolated environment to identify their real origin. The test consisted of gradually
bending seven rebars (presenting different adhesives, varying transversal section, etc.) monitored by an ODiSI-A
OBR machine manufactured by LUNA. The test results therefore have absolute validity only for the present OBR
despite providing results pertinent to an issue occurring similarly for other commercial OBRs. Of the seven possible
hypothesized physical causes for the rise of SRAs, named Disruption Mechanisms (DM), the only ones that were
not excluded by the present test are the following:
(DM-SB1) The surpassing of a Strain Anomaly Threshold (AST) beyond which the constitutive material of
the fiber cannot bear any more stresses without showing anomalies in the readings. On the other hand, it also
possible that, when the fibers are already under stress, they may display a high sensibility to variations in the
mechanical behavior of its support that could lead up to SRAs.
(DM-SB2) The present test was designed in such a way that only minor impact loads could be applied.
Therefore, to correctly simulate the peaking of stresses that rebars experience whenever a crack opens in a
RC member, further experimentation is required with higher impact loads or actual cracking concrete.
(DM-AD1) The absence of concrete in the test prevented from checking the role that the friction of cracking
concrete against the DOFS has in the rise of SRAs.
An experimental campaign will follow up the present one by studying the influence of the remaining
disruption mechanisms on RC tie members. The paper’s experiment helped shedding light on the anomalistic
behavior of DOFS. The following conclusions were extrapolated:
The SRAs tend to rise in multiple neighboring DOFS coordinates forming Anomalistic areas.
The anomalistic areas focus around sections of the rebar that are heavily stressed or that present a high strain
gradient (such as the mid-span and the incised sections).
The SRAs can be distinguished between Harmless SRAs (HL-SRAs) and Harmful SRAs (HM-SRAs) of
which only the latter represents a serious threat for the investigators. Indeed, in the case of the first type of
anomalies, following some anomalistic measurements are still multiple reliable ones making the HL-SRAs
more of a nuisance than limit.

Chapter 5. Published Journal Articles | Mattia Francesco Bado
208
Even though some HL-SRAs seem to appear earlier, most SRAs and all the HF-SRAs occur beyond a specific
moment in the test which sees simultaneously the reaching of the strain value of roughly 4000 με (possible
AST) in all the bars of the specimen and the yielding of the fixed ends of the bars causing a variation in the
specimen’s load-deformation behavior. Only one or both these elements seem to have triggered the rise of
SRAs.
Different adhesives for the bonding of the fiber to the structural element were studied to evaluate their
performance during the test. In particular, the adhesives used were cyanoacrylate, silicone and a combination
of the two. The outcome of the test sees silicone to be the most resistant adhesive therefore ensuring a delayed
appearance if SRAs and in smaller number to the expense of the precision of the strain measurements.
Oppositely, the rigid but fragile nature of the cyanoacrylate provides the results with highest precision to the
expense of resistance and endurance. In fact, the SRAs seem to spring up earlier and in bigger quantity in the
latter. Meanwhile the combination of the two gives birth to a hybrid behavior. Regarding the adhesives, it
was concluded that there was not a particularly better one, but it was rather a function of the objectives of the
researcher.
Author Contributions: M.F.B. and J.R.C. conceived and designed the experiment; M.F.B. performed the
experiment with the aid of A.B. in the bonding of the DOFS to its structural support and the interrogator software
configuration; M.F.B. and J.R.C. analyzed the data and wrote the paper.
References
1. Barrias, A.; Casas, J.; Villalba, S. A Review of Distributed Optical Fiber Sensors for Civil Engineering
Applications. Sensors 2016, 16, 748.
2. Glišić, B.; Hubbell, D.; Sigurdardottir, D.H.; Yao, Y. Damage detection and characterization using long-gauge
and distributed fiber optic sensors. Opt. Eng. 2013, 52, 087101.
3. Ferdinand, P. The Evolution of Optical Fiber Sensors Technologies During the 35 Last Years and Their
Applications in Structure Health Monitoring. In Proceedings of the EWSHM-7th European Workshop on
Structural Health Monitoring, Nantes, France, 8–11 July 2014.
4. di Sante, R. Fibre Optic Sensors for Structural Health Monitoring of Aircraft Composite Structures: Recent
Advances and Applications. Sensors 2015, 15, 18666–18713.
5. He, J.; Yang, J.; Wang, Y.; Waisman, H.; Zhang, W. Probabilistic Model Updating for Sizing of Hole-Edge
Crack Using Fiber Bragg Grating Sensors and the High-Order Extended Finite Element Method. Sensors 2016,
16, 1956.
6. Deif, A.; Martín-Pérez, B.; Cousin, B.; Zhang, C.; Bao, X.; Li, W. Detection of cracks in a reinforced concrete
beam using distributed Brillouin fibre sensors. Smart Mater. Struct. 2010, 19, 055014.

Chapter 5. Published Journal Articles | MATTIA FRANCESCO BADO
209
7. Barrias, A.; Casas, J.; Villalba, S. Embedded Distributed Optical Fiber Sensors in Reinforced Concrete
Structures—A Case Study. Sensors 2018, 18, 980.
8. Bao, X.; Chen, L. Recent Progress in Distributed Fiber Optic Sensors. Sensors 2012, 12, 8601–8639.
9. Cantarero, A. Raman Scattering Applied to Materials Science. Procedia Mater. Sci. 2015, 9, 113–122.
10. Gillibert, R.; Huang, J.Q.; Zhang, Y.; Fu, W.L.; de la Chapelle, M.L. Food quality control by Surface Enhanced
Raman Scattering. TrAC Trends Anal. Chem. 2018, 105, 185–190.
11. Gillibert, R.; Huang, J.Q.; Zhang, Y.; Fu, W.L.; de la Chapelle, M.L. Explosive detection by Surface Enhanced
Raman Scattering. TrAC Trends Anal. Chem. 2018, 105, 166–172.
12. Yoon, H.J.; Song, K.Y.; Kim, H.M.; Kim, J.S. Strain monitoring of composite steel girder bridge using
distributed optical fibre sensor system. Procedia Eng. 2011, 10, 2544–2547.
13. Zeni, L.; Picarelli,L.; Avolio, B.; Coscetta, A.; Papa, P.; Zeni, G.; Di Maio, C.; Vassallo, R.; Minardo, A.
Brillouin optical time-domain analysis for geotechnical monitoring. J. Rock Mech. Geotech. Eng. 2015, 7,
458–462.
14. Hong, C.Y.; Zhang, Y.F.; Li, G.W.; Zhang, M.X.; Liu, Z.X. Recent progress of using Brillouin distributed
fiber optic sensors for geotechnical health monitoring. Sens. Actuators A Phys. 2017, 258, 131–145.
15. Villalba, S.; Casas, J.R. Application of optical fiber distributed sensing to health monitoring of concrete
structures. Mech. Syst. Signal Process. 2013, 39, 441–451.
16. Barrias, A.; Casas, J.R.; Villalba, S. Application study of embedded Rayleigh based Distributed Optical Fiber
Sensors in concrete beams. Procedia Eng. 2017, 199, 2014–2019.
17. Davis, M.; Hoult, N.A.; Scott, A. Distributed strain sensing to determine the impact of corrosion on bond
performance in reinforced concrete. Constr. Build. Mater. 2016, 114, 481–491.
18. Davis, M.; Hoult, N.A.; Scott, A. Distributed strain sensing to assess corroded RC beams. Eng. Struct. 2017,
140, 473–482.
19. Measures, R.M. Structural Monitoring with Fibre Optic Technology. Meas. Sci. Technol. 2001, 12, 1609–
1610.
20. Brault, A.; Nurmi, S.; Hoult, N.A. Distributed Deflection Measurement of Reinforced Concrete Elements
Using Fibre Optic Sensors. In Proceedings of the International Association for Bridge and Structural
Engineering (IABSE) Symposium, Vancouver, BC, Canada, 19–23 September 2017; pp. 1469–1477.
21. Ding, Z.; Wang, C.; Liu, K.; Jiang, J.; Yang, D.; Pan, G.; Pu, Z.; Liu, T. Distributed Optical Fiber Sensors
Based on Optical Frequency Domain Reflectometry: A review. Sensors 2018, 18, 1072.
22. Kaklauskas, G. Crack Model for RC Members Based on Compatibility of Stress-Transfer and Mean-Strain
Approaches. J. Struct. Eng. 2017, 143, 1–12.
23. ODiSI-A Optical Distributed Sensor Interrogator Users Guide. Available online: http://lunainc.com/wp-
content/uploads/2014/05/ODiSI-A-Users-Guidev1.2.pdf (accessed 30 July 2018).

Chapter 5. Published Journal Articles | Mattia Francesco Bado
210
24. Barrias, A.; Casas, J.R.; Villalba, S. On the bonding performance of distributed optical fiber sensors (DOFS)
in structural concrete. In Proceedings of the Sixth International Symposium on Life-Cycle Civil Engineering
(IALCCE’18), Ghent, Belgium, 28–31 October 2018, (accepted).

Chapter 5. Published Journal Articles | MATTIA FRANCESCO BADO
211
Chapter 5.3 Sensors 2020
Bado MF, Casas JR, Dey A, Berrocal CG. Distributed Optical Fiber Sensing Bonding Techniques Performance
for Embedment inside Reinforced Concrete Structures. Sensors. 2020; 20(20):5788.
https://doi.org/10.3390/s20205788
Distributed Optical Fiber Sensing Bonding Techniques Performance for
Embedment inside Reinforced Concrete Structures
Mattia Francesco Bado 1,*, Joan R. Casas 1, Alinda Dey 2 and Carlos Gil Berrocal 3
1 Department of Civil and Environmental Engineering, Technical University of Catalonia (UPC), c/Jordi Girona 1-
3, 08034 Barcelona, Spain.
2 Department of Reinforced Concrete Structures and Geotechnical Engineering (Vilnius Gediminas Technical
University), Saulėtekio al. 11, 10221 Vilnius, Lithuania.
3 Department of Architecture and Civil Engineering, Division of Structural Engineering (Chalmers University of
Technology, Sven Hultins gata 6, 41258 Göteborg.
Abstract: Distributed optical fiber sensors (DOFS) are modern-day cutting-edge monitoring tools that are quickly
acquiring relevance in structural health monitoring engineering. Their most ambitious use is embedded inside plain
or reinforced concrete (RC) structures with the scope of comprehending their inner-workings and the functioning
of the concrete-reinforcement interaction. Yet, multiple studies have shown that the bonding technique with which
the DOFS are bonded to the reinforcement bars has a significant role on the quality of the extracted strain data.
Whilst this influence has been studied for externally bonded DOFS, it has not been done for embedded ones. The
present article is set on performing such study by monitoring the strain measurement quality as sampled by DOFS
bonded to multiple rebars with different techniques and adhesives. These instrumented rebars are used to produce
differently sized RC ties later tested in tension. The discussion of the test outputs highlights the quasi-optimal
performance of a DOFS/rebar bonding technique consisting of incising a groove in the rebar, positioning the DOFS
inside it, bonding it with cyanoacrylate and later adding a protective layer of silicone. The resulting data is mostly
noise-free and anomalies-free, yet still presents a newly diagnosed hitch that needs addressing in future research.
Keywords: distributed sensing; optical fibers; reinforced concrete; steel strains; structural health monitoring.

Chapter 5. Published Journal Articles | Mattia Francesco Bado
212
1. Introduction
Structural health monitoring (SHM) is becoming an increasingly relevant branch of civil and structural
engineering. Its key principles are the continuous assessment of newly built or pre-existent structures. This is
translated into the monitoring of their serviceability health condition, risk mitigation, disaster prevention through
well-organized and regularly updated maintenance [1] plans and, in the worst case scenarios, damage containment
through quick emergency alarm. In order to prevent the adverse social, economic, environmental, and aesthetic
impacts that may occur in case of structural and/or operational deficiency, it is important to have access to
monitoring tools that encompass the features of reliability, quasi or entirely distributed measurement capacity, ease
of application and cost-efficiency. The most commonly used sensors are electrical strain sensors, accelerometers,
inclinometers, GPS based sensors, acoustic emission, wave propagation and more. Worth of mention are also in-
situ triboluminescent optical fiber (ITOF) capable of yielding multifunctional smart structures with in-situ failure
detection capabilities [2].
Distributed optical fiber sensors (DOFS) are modern-day cutting-edge monitoring tools that are quickly
acquiring relevance in the structural and civil engineering field [3]. These are very thin glass wires able to accurately
measure strains (down to 1µε), temperature and vibration in 2 or even 3 dimension [4]. This can be achieved in a
completely-distributed manner (modern interrogation units can attain a spatial resolution of 0.63 mm) and with
measurement frequencies of 250 Hz [5]. Thus, direct detection and characterization (including recognition,
localization, and quantification or rating) of local strain changes generated by structural damage are intrinsic
properties of such sensors. Furthermore, optical fiber sensors have some inherent advantages such as corrosion
immunity, high durability, resistance to electromagnetic interference, small size and light weight that elevate them
beyond the classic monitoring tools [6]. The functioning of these sensors is based on the fact that, assuming the
characteristics of the light transmission within a fiber well known and the latter properly calibrated, any alteration
(due to temperature and strain) are detected through back-scattered light by the optical backscatter reflectometer
(OBR) (see Figure 1) and are finally translated to strain variation in each of the DOFS’ points [7].
Figure 1. LUNA’s ODiSI 6000 Optical Backscatter Reflectometer.

Chapter 5. Published Journal Articles | MATTIA FRANCESCO BADO
213
The simplest DOFS sensor is a polyamide cladded glass wire which boasts a 125 μm diameter (see Figure 2).
Multiple commercially available variations cover the latter with differently sized coating layers which span from
rigid and deformed polymeric coatings (blue thick fiber in Figure 2) to thin fabric-like covers that consent a large
amount of fiber winding.
Figure 2. Thin polyamide cladded distributed optical fiber sensors (DOFS) (yellow) and thick polymer coated DOFS (blue).
The present work focuses on the thinnest form of DOFS which, despite its renowned fragility, it is also widely
accepted as the most accurate of DOFS thanks to its direct bonding to the host material. Indeed, with the presence
of a coating layer, the fibers’ measured results cannot be directly assumed to be equivalent to the substrate’s, because
of the finite value of the coating’s shear modulus.
Embedding these sensors inside plain or reinforced concrete (RC) structures is also an increasingly popular trend
in modern research, with the scope of comprehending their inner-workings and the physics of the bonding effects
between concrete and steel. In most cases the DOFS are attached directly to the surface of the reinforcement-bars
(rebars) before the latter are embedded inside concrete. Multiple studies [4,8–11] have demonstrated that the
technique with which this bonding is achieved has a prominent role in the quality of the extracted data. Indeed, the
highly sensitive nature of these hair-like fibers intrinsically exacerbates the probability of its malfunctioning and/or
rupture during the concrete casting, maneuvering and testing phase. With this in mind, the optimal bonding
technique is one that, not only ensures a continuous contact between DOFS and the structural surface to monitor
(preventing their relative movement during the test), but also one that protects the former from accidental damage
and testing-induced frictions with the concrete. Whilst thickly coated DOFS allow to bypass the issue completely,
the strain reading precision is usually affected by the presence of the coating. In contrast, thinner coated DOFS,
despite being more fragile, are much more effective in transferring strains thus leading to accurate readings that are

Chapter 5. Published Journal Articles | Mattia Francesco Bado
214
much closer to the ones truly occurring in the RC structures. Yet again, its use demands abundant knowledge and
acquaintance regarding the selection of the optimal bonding technique.
The importance of this issue has only lately been recognized as all the produced publications date back to last
decade [12–15]. Worthy of mention, are two extensive studies analyzing the influence of different bonding
adhesives on the strain output of polyamide cladded DOFS attached to bare rebars [11] and concrete surfaces [16].
Yet, no definitive comparative study has been developed for the case of DOFS bonded to rebars when embedded
inside RC structures. The present work sets itself this exact goal.
Multiple publications display various manners of attaching the DOFS to the rebars (before their insertion inside
concrete) and present diverse bonding techniques and adhesives. Their resulting DOFS strain profiles quality is
varying and sometimes contradictory. The main parameter of such quality is the presence of strain reading anomalies
(SRAs). These are localized, excessively large and inaccurate strain readings which do not present a direct physical
explanation. Unfortunately, as will be visible later on, this is a very common and undesirable occurrence plaguing
almost every single DOFS monitored campaign. Bado et al. [11,17] attempted to study these SRAs. According to
them a strain peak at a general DOFS coordinate xk is usually considered as an abnormal reading if it presents a
large difference with previous reading at coordinate xk−1. This can be both in terms of time (two consecutive strain
measurements in the same DOFS coordinate) and space (two strain measurement performed in two neighboring
DOFS coordinates at the same instance). Temporally speaking, unless a large load is suddenly applied on the DOFS-
monitored structure, two consecutive measurements should present similar strain readings as the time interval
between them (1/250th of a second), thus their load difference, is almost negligible. Spatially wise, if to consider
DOFS tests with small spatial resolutions (0.63–1.3 mm), strains simply do not peak in neighboring sections without
a certain amount of lead-up gradual growth [17]. Consequently, these anomalies can be considered DOFS reading
errors or SRAs.
2. Literature Review
In order for the reader to both grasp the motivation of the present work and acquire the necessary groundings, it
is important to first review the different experimental campaigns that have been developed embedding DOFS-
instrumented rebars inside RC structures. The focus, here, are the used bonding techniques and their resulting strain
reading quality (SRA presence). Hence, the following paragraphs constitute a concise collection of the
aforementioned publications and its deducible conclusions represent the basis on the ground of which this work is
developed. As visible later on, the review is subdivided in three general categories in which the bonding techniques
can be subdivided, namely DOFS gluing without and with a protective layer and a groove incised in the rebar.
Please note that, unless otherwise specified, the DOFS fiber used in the following experimental campaigns are
constituted by a 9 μm diameter glass core (with uniform refractive index) covered with a 125 μm diameter
polyamide cladding with no external jacket.

Chapter 5. Published Journal Articles | MATTIA FRANCESCO BADO
215
With the intention of comparing the DOFS performance when glued with cyanoacrylate and a two-component
epoxy, Barrias et al. [8] bonded the fibers on the rebars of two small beams later tested under three-point loading.
For both adhesives the extracted strains presented reasonably good agreement among each other and with embedded
strain gauges despite a large amount of SRAs occurring as soon as the cracking starts. Nevertheless, the optical
fiber glued with cyanoacrylate produced more consistent strain data whereas the epoxy-glued sensor showed slightly
higher strain peaks.
Davis et al. [18] tested multiple 2.3 m long DOFS-monitored beams under a three-point bending setup. The
polyamide cladded fibers were bonded with cyanoacrylate, more specifically Loctite 4851, resulting in very smooth
strain curves outside the cracked section. On the other hand, some disruptive SRAs are present in the strain profiles
of the beams subjected to corrosion damage.
Regier et al. [19] also used cyanoacrylate (Loctite 4851) to install a DOFS on the bottom rebar of a 1 m long RC
beam tested under four point bending load. Though the measured strains demonstrated good agreement with the
predicted strains for loads lower than 10 kN, for higher ones some large SRAs were spotted, specifically around the
mid-span.
Malek et al. [20] compared polyimide and PVC (polyvinyl chloride) coated optical fibers both being glued to
the beam’s reinforcement by means of a two-part epoxy (Loctite E-20HP). The authors found this adhesive more
satisfactory with the polyimide coated fiber in terms of transferring strain to the core from its surroundings even in
the deteriorated area.
Sieńko et al. [4] described a DOFS-monitored RC tensile members (ties) test where the fiber was glued to the
degreased reinforcement bar along the longitudinal rib with an epoxy resin. The used fibers, though, differed from
the current test’s due to the presence of a protective coating that consequently increased its diameter around seven
folds (0.9 versus 0.125 mm) and led to a strain difference between the ones measured in the fiber and the one
measured in the hosting steel.
Acknowledging the fragility of the polyamide DOFS, the scientific community started investigating a bonding
technology that not only would warrant the correct bonding of the fiber to the structural surface but also a certain
amount of protection from external factors. The most recurrent protection layer is a silicon-based one.
Davis et al. [10] proceeded to monitor the impact of (accelerated) corrosion on RC ties through DOFS as a
supplement to visual inspections. The nylon and polymer cladded fibers were bonded with cyanoacrylate (Loctite
4851) and an extra silicone coating. The results, though, were very jagged strain profiles including a large number
of SRAs.
Nurmi et al. [21] installed both nylon and polyamide cladded fibers on multiple rebars of an 80 mm thick slab
with the aim of assessing the impact of the support conditions on its performance. Whilst both DOFS were bonded
with cyanoacrylate (Loctite 4861), a silicon layer was positioned only on the polyamide fiber. Despite both fibers

Chapter 5. Published Journal Articles | Mattia Francesco Bado
216
successfully sampling the structure’s strain behavior and its cracking pattern, some SRAs were present in the output
data. The polyamide DOFS showed smoother strain curves, probably thanks to its silicone layer.
The use of a protective silicone layer was also commended by Brault and Hoult [22] after conducting an
investigation on the potential of optical fibers as a strain measuring tool as well as its damage detection ability in
differently sized beams. The authors further commended nylon cladded fibers compared to polyimide ones as the
latter, despite the extra protection layer, displayed rougher strain curves with non-overlookable SRAs. Moreover,
the former extrapolated measurements were in agreement with strain gauges’ output as well as the theoretical
prediction.
Berrocal et al. [23] also used polyamide cladded fibers attached by a thin layer of cyanoacrylate further covered
by an extra silicone protection. Their primary goal was to monitor the crack formation and evolution in beams
subjected to monotonic and cyclic loading under a three-point bending setup. This bonding technologies allowed
the successful detection of the microcracks width—even as miniscule as 40 µm. Furthermore, the authors endorsed
this adhesive combination, as its strain results were in excellent agreement with the strain data from strain gauge
sensors.
A rather novel and advanced DOFS protection technique establishes the incision of a groove on a rebar’s surface
(usually on the longitudinal rib as in Figure 3) which later welcomes the DOFS inside it.
(a) (b)
Figure 3. (a) Milling of the groove along the rebar’s longitudinal rib and (b) its resulting incision marked with a dashed red
line.
As will be visible in the following publications, this is believed to provide further protection compared to simply
gluing the fiber to the rebar’s surface (Quiertant et al. [24]). Yet, it is quite surprising that, despite this technique’s
non-negligible financial and time costs, a comprehensive study on the potential improvement that it brings to the
table (in terms of DOFS reading quality) has yet to be performed. The present paper intends to perform such
analysis.

Chapter 5. Published Journal Articles | MATTIA FRANCESCO BADO
217
The efficiency of this arrangement was commended by Michou et al. [25] who used a 1 × 1 mm groove incised
along the rebar of a 1.15 m long RC tie in order to study the evolution of the concrete cracking, its transfer lengths
and tension stiffening. Despite no specifications are given on the kind of adhesive used, the mere presence of the
groove led to an output characterized by smooth curves and easily recognizable strain peaks indicative of cracks.
Haefliger et al. [26] used this technique too, engraving a longitudinal section of 1 × 1 mm along the rebar and
later gluing the optical fiber inside it with epoxy. The bars were positioned inside a 600 × 600 mm, 125 mm thick
RC square panel subjected to diagonal tension in a universal testing machine (UTM). This technique resulted in
notably smooth strain curves. The optical fiber diagnosed the correct location of the cracks which were further
validated by digital image correlation (DIC). Yet, the strains in the cracked sections within the range of the transition
zone were lower than expected.
Bado et al. [27] carried out a DOFS monitoring tensile tests on different RC ties by positioning the DOFS inside
a groove milled on the bar’s surface and later glued with cyanoacrylate. Here, the extracted strain profiles’ peaks,
correctly indicated the crack locations (further corroborated by a DIC monitoring) but a significant number of strain
reading anomalies (SRAs) were found.
The groove-cyanoacrylate combination was further used in Bado et al. [17] with similar results. Indeed, the strain
profiles extracted from two more RC ties presented a consistent amount of SRAs which were later removed through
a newly introduced post processing algorithm.
In their research Bassil et al. [28] studied the output of a DOFS monitoring campaign (bonded with a two
component epoxy and positioned inside a groove) inside a 1 m long RC beam subjected to a three point loading
setup. The authors witnessed noticeable SRAs immediately after micro-cracks began forming around the rebars,
steeply increasing in magnitude with every load increment.
The following conclusions can be extracted from the above literature review:
The friction between DOFS and the surrounding concrete is the main reason for the appearance of SRAs.
Therefore, the bonding techniques that seems to best insulates the former from the latter seem to yield to the
most SRA-free outputs.
Bonding adhesives aside, three main DOFS/rebar bonding techniques have been adopted up to now:
o Simply gluing the DOFS on the rebar’s surface away from the transversal ribs;
o Gluing the DOFS to the rebar’s surface and covering it with a silicone-based protection layer;
o Incising a groove on the rebar’s surface and positioning the DOFS inside it before gluing it;
The presence of silicone and of a groove seems to improve the quality of the DOFS extracted profiles;
Despite such improvement, none of these techniques seems to unequivocally guarantee the absence of SRAs;
A combination of groove and silicone has not been tested yet.

Chapter 5. Published Journal Articles | Mattia Francesco Bado
218
As previously mentioned, a deep study on the performance of each of these techniques has yet to be developed
as, all we have at the present moment, is essentially a conglomeration of scattered data from different experimental
campaigns with different execution conditions. To tackle this issue, the present paper will display the results of a
single DOFS-monitored experimental campaign on multiple RC ties which include all the above mentioned
DOFS/rebar bonding techniques. A strain reading quality analysis will follow up in order to extract conclusions on
which is the most performant one.
3. Experimental Setup
3.1. RC Specimen Description
The present paper displays the results of an experimental campaign developed on multiple squared RC ties with
DOFS-instrumented rebars. Each of the RC members will be indicated with a code such as 15D20_24 that should
be interpreted in combination with Figure 4, which provides indications on the geometrical features of each RC
member.
Figure 4. Reinforced concrete (RC) ties’ general geometrical dimensions.
The first digits of the code are representative of the concrete prism’s cross sectional size (h in Figure 4), the
digits that follow the letter D are representative of the diameter of the rebars (D in Figure 4) whilst the digits
following the underscore symbol (_) are representative of the length of the concrete prism (L in Figure 4). The
geometrical design of these RC members satisfies the conditions necessary to perform a double pullout test-powered
study [29] on the influence of the longitudinal dimensions of a RC tie on the bond stress/slip present in the interface
between rebar and concrete; topic of future publications.
For the abovementioned example code, the member in question would be a 15 × 15 × 24 cm concrete prism
pierced by a Ø20 rebar. From Figure 4 it is possible to see how the rebars are monitored on both of their sides
through a single DOFS twisted backwards whenever the latter runs outside the concrete prism. As visible later on,
two members were monitored by a single fiber run due to its original short extension whilst another one has three

Chapter 5. Published Journal Articles | MATTIA FRANCESCO BADO
219
DOFS runs (two on one side and one on the opposite). The key advantage of monitoring multiple times the same
rebar with a single DOFS is the possibility of using multiple bonding techniques inside a single member (to verify
their performance). Thus, the uncertainties connected to the potential difference among different samples is
removed. The bonding technologies in use, illustrated in Figure 5, are the following ones:
DOFS positioned inside a groove and bonded with cyanoacrylate (CYN) as visible in Figure 5a;
DOFS glued to the rebar’s surface with CYN with a protective layer of silicone (SI) on top, as visible in
Figure 5b;
DOFS positioned inside a groove, bonded with CYN and further covered with SI. As visible in Figure 5c.
(a)
(b)
(c)
Figure 5. Graphical and photographical representation of the three tested bonding techniques (a) positioning of DOFS in
an incised groove and bonding it with CYN (b) bonding it with CYN with an additional protective layer of SI (c) positioning of
the DOFS in a groove, bonding through CYN and protection through SI.

Chapter 5. Published Journal Articles | Mattia Francesco Bado
220
It is worth mentioning that, in Figure 5c, the groove is hardly visible due to its small size (as evident in Figure
3b) and color similarity with the background. Additionally, hereafter rebars with an incised groove will be referred
to as (w/ groove) whilst the ones without it as (w/o groove).
The concrete’s mean compressive strength was equal to fcm=47.89 MPa, its modulus of elasticity to Ecm=28159
MPa and finally its tensile strength to fct=2.89 MPa; all of them measured at 28 days. The steel rebars were instead
characterized by a yielding strength of fym=533.31 MPa.
3.2. The Experimental Campaign: The Concept and Its Phases
In order to assess the quality of a DOFS/rebar bonding technique multiple aspects should be taken into
consideration. As seen, first among these, is the cleanliness of the extracted signal (deeply related to the amount of
SRAs) but also the adhesives’ resistance to the external forces that would otherwise separate the sensor from its
surface.
Finally, it is a crucial requirement that the bonding technique does not influence the strains being read by the
DOFS. It should be guaranteed, to the maximum extent possible, that what is being read are the actual strains
occurring in the monitored surface rather than a strain present solely in the fiber.
In order to tackle this last key point, the experimental campaign is subdivided in two distinct phases. The first
one will make use of DOFS-instrumented bare rebars whilst the second will test these same rebars this time
embedded inside concrete prisms.
This first phase, is aimed at assessing the potential influence that the presence of a layer of SI or a groove might
have on the extrapolated DOFS readings when no concrete is involved (bare rebar). This is assessed both in tension
and in bending. The first is achieved by placing the rebar in a Universal Testing Machine (UTM), as in Figure 6a
(with an extensometer gauge for comparative purposes) two times. Both times three load cycles were performed,
each reaching a third of the yielding load. The first time the rebar is tensioned with such program, the DOFS is
simply glued with CYN whilst the second time it is further covered by a layer of SI. The performed measurements
are later compared in an attempt to spot any potential difference caused by the extra layer. These, obviously, need
to be larger than the slight but expected difference induced by the impossibility of repeating the same exact clamping
conditions. The tested rebars are two, one w/ groove and one w/o groove with the express purpose of comparing
their results to study the influence of the groove.
The bending test is instead achieved by clamping one extremity of the rebars and applying on the opposite one
(at a fixed distance) a 20 kg load (Figure 6b) in order to create a bending stress and a clearly distinguishable strain
profile. Once again, this process is done twice in order to monitor the instrumented rebars strains with a CYN-
bonded DOFS and later a CYN+SI bonded DOFS.

Chapter 5. Published Journal Articles | MATTIA FRANCESCO BADO
221
(a) (b) (c)
Figure 6. Test setup for the (a) universal testing machine (UTM)-assisted tensile test on a bare rebar (b) bending test and
(c) UTM and digital image correlation (DIC)-assisted tensile test on a RC tie.
The second phase is aimed at studying the DOFS/rebar bonding techniques performance (in terms of quality of
the extracted readings) when the latter is embedded inside a concrete prism. Therefore, it includes the embedding
of the instrumented rebars inside concrete forming RC ties and later their testing by means of the UTM (as visible
in Figure 6c). This last test is integrated with a DIC monitoring of the RC ties’ surfaces aimed at studying the crack
formation, evolution and relation with the interiorly sampled rebar strains. The loading program is a displacement-
controlled monotonic tensile load increased at a speed of 1.5 mm/min until yielding of the rebar.
4. Test Results
4.1. Phase 1: Bare Rebar Testing in Tension and Bending
Figure 7 plots the strain measurements performed by the DOFS and by the extensometers connected to the two
rebars w/ groove and w/o groove. As visible both graphs include two pair of readings, one (in blue) representative
of the strains recorded by the DOFS glued with CYN and the other (in red) representative of the strains recorded by
the same DOFS glued with CYN and covered with SI. An excellent agreement is present between the DOFS strain
curves of both graphs indicative of the small influence that a layer of SI exercises on the tensile readings of a bare
bar. Such agreement outshines the ones of the classic extensometer. Moreover, for the case of the bar w/ groove,
the extensometer even fails to detect that the zeroing of the applied load at the test’s end whilst DOFS actually does.
The extensometer’s lower readings quality is definitely a function of how/where the tool is attached on the rebar
compared to its transversal ribs but, then again, it is an uncertainty that is entirely surpassed by DOFS. Figure 8
plots in more detail the strain reading differences of the two rebars when SI is present and when it is not. As DOFS’
does not surpass 15 με in either bar (an amount possibly induced simply by a variation of the grip position), it can

Chapter 5. Published Journal Articles | Mattia Francesco Bado
222
be safely stated that in tension the presence of SI does not influence the strain readings and thus it is safe to apply
it for further protection of the fiber. For the extensometer, instead, the reading variations are expectedly higher for
both bars suggesting, once again, the greater reliability of DOFS. Finally, as can be seen in Figure 7, the presence
of a groove also does not seem to alter the strain readings suggesting that it too, in tension, can be inserted sans
souci as an extra protection for the fiber.
Figure 7. DOFS and extensometer output readings of the tensile test.
Figure 8. Bar w/ groove and w/o groove’s strain reading differences when DOFS + cyanoacrylate (CYN) are or are not
covered by silicone (SI).

Chapter 5. Published Journal Articles | MATTIA FRANCESCO BADO
223
Moving on to the bending test, Figure 9 plots the DOFS strain measured in absence (in blue) and in presence of
a SI protection layer for both bars w/and w/o groove. Due to the difference of DOFS bonding length in the two
rebars, an illustration of the latter is inserted in both plots in order to help the reader better comprehend the shape
of strain profiles.
Figure 9. Strain profiles of the rebars (w/and w/o groove) under bending and the difference of values w/and w/o SI.
It should be kept in mind that the initial segment of the graph, oscillating around the value of 0 με, is simply
denoting the strains inside the un-bonded and loose section of the DOFS. Only once the first DOFS section of the
fiber is bonded, then the profile jumps upwards reporting the rebar’s highest strain. Once again, the presence of
silicone is hardly perceptible, as confirmed by Figure 9’s bottom graph, leading to quasi-identical strain profiles.
Once again, the largest recorded strain measurement difference between SI covered bars and not is around 15 με
for both rebars. The presence of the groove too, hardly influences the DOFS readings. Indeed, the difference
between the rebar w/and w/o groove is around 10 με thus completely justifying the use of a groove for warranting
extra protection to the DOFS.
The unequivocal conclusion of the first sub-section is that neither the addition of an extra protective layer of SI
nor the positioning of the DOFS inside a groove incised along a rebar influences the DOFS strain readings when
the rebar is bare and tested in tension and bending. Therefore, if the test’s seconds phase (RC ties) will display

Chapter 5. Published Journal Articles | Mattia Francesco Bado
224
reading alterations, they can safely be attributed to the concrete surrounding the instrumented rebar and its friction
with the latter.
4.2. Phase 2: RC Ties Testing
The present sub-section is further divided into two parts. The first is interested in studying the performance of
various DOFS/rebar bonding techniques whenever the instrumented bar is embedded inside concrete without the
possible interferences brought on by the latter cracking. The second instead, embraces exactly this; it being a crucial
part of any RC structure testing.
4.2.1. Non-Cracking RC Ties
The first tested RC tie was a 15D20_27 member with its DOFS positioned in a groove and bonded with strictly
CYN (no protection layer was placed). The test was intended to substantiate whether the mere presence of the
groove could guarantee sufficient protection to the DOFS without requiring an extra protective layer. Figure 10
displays some of the strain profiles extracted from the aforementioned test along with an illustration of the member’s
geometry in order to properly correlate the plot data with the actual physical surface/surrounding in which the DOFS
is located. As visible, the profiles’ sections corresponding to the segment of the instrumented rebar embedded inside
the concrete is full of SRAs (induced by the concrete’s friction on the unprotected DOFS) making the actual profile
barely readable. This is in line with multiple results reported in the literature review, thus leading to the conclusion
that this technique most definitely is not recommended for this kind of DOFS-monitored testing. Yet, it should be
mentioned that a possible influencing parameter could be the actual depth of the groove (quite shallow in the present
test i.e., 0.5mm). It is possible that the deeper it is the better protection it provides to the rebar.
Figure 10. Strain profiles of a 15D20_27 RC tie test with the DOFS bonded with a combination of groove and CYN.

Chapter 5. Published Journal Articles | MATTIA FRANCESCO BADO
225
Then again one of the greatest advantages of DOFS is its quasi-disregardable intrusiveness which is in strong
contrast with the idea of having to incise a deep groove in order to ensure its correct functioning. Furthermore, for
smaller rebar diameters such as Ø8 a deep incision is inadmissible as it could significantly alter its mechanical
behavior. Figure 11 displays the strain profiles of a 15D20_21 RC tie where the DOFS is first positioned in a groove
and then bonded with CYN and SI.
Figure 11. Strain profiles of a 15D20_21 RC tie test with the DOFS bonded with a combination of groove, CYN and SI.
As can be seen in Figure 11 the profiles are much better than Figure 10’s as a testament to the higher performance
of its bonding technique. Indeed, hardly any SRAs are visible and the strains are monitored all the way to the
yielding load (around 167.5 kN) and beyond. The peaks present at the higher loads are not SRAs (as was the case
in Figure 10) but rather the physical representation of the rebar’s different sections slowly plasticizing one after the
other and therefore giving way to drastically higher strains than the non-plasticizing sections.
Figure 12 provides a three-dimensional representation of member 15D20_21’s strains displaying a smooth
increase up until the yielding strain εsy beyond which it is visible how little by little all the rebar’s cross sections
progressively plasticize (indicated by a sudden peaking of the strains). This by itself is a significant step forward
from many literature’s DOFS embedded tests which stop producing reliable results at loading stages numerous folds
inferior to the present one. This is, furthermore, very encouraging when it comes to the DOFS/rebar bonding
technique performance.
Moving back to Figure 11, a small zoom is provided on its left of the rebar’s strains profile outside of the concrete
as reported by DOFS. An oscillation of the profile is visible which could easily be confused with signal noise. Yet,
it is not noise but rather the influence of the transversal rib on the performance of the rebar.

Chapter 5. Published Journal Articles | Mattia Francesco Bado
226
Figure 12. Three-dimensional representation of the strain evolution of member 15D20_21 with a zoom of the higher strains
showing the progressive yielding of the different cross-sections of the rebar.
As a matter of fact, whenever a rib is present, the cross-section of the bar is automatically larger therefore the
carried stress (and consequent steel strains) is inferior. Oppositely, whenever the rib is absent the carried stress is
higher. The reiteration of this pattern leads to the abovementioned oscillating profiles. Yet, unless a researcher is
interested specifically in the rib’s influence on the bar’s performance, the latter can be considered signal noise as
the useful information signal that is usually pursued is strictly the global profile of the strain curve. As will be
visible later on, this particular noise is also a function of the bonding technique in use, thus it is automatically elected
as a study parameter for establishing the most performant bonding technique. In order to separate the noise from its
original signal (as in Figure 13) a Fourier filtering solution can be used, thus relating a signal sampled in time or
space to the same signal sampled in frequency, or a moving-average filter, thus sliding a window of customizable
length along the data and computing the averages of the data contained in each window. For the scope of the current
work the latter is deemed to be sufficiently performant, hence it is the used methodology. What is also noticeable
in Figure 11, is that the magnitude of such newly defined rib-induced noise becomes increasingly larger with the
load thus increasingly disturbing the sought-after signal. Figure 13 shows its occurrence for member 15D20_21’s
six case study stages along its test. The latest of these stages has average noise peaks of height 27.5 με which,
considering its corresponding load of 154 kN, is still very reasonable. As per the bottom graph of Figure 13, the
average strain reading noise seems to be increasing at a regular pace with the load suggesting a correlation between
the two. This was expected since, being the oscillations caused by the presence of the transverse ribs, the absorbed
stress taken by the latter should also increase linearly with the load while in the elastic range. The only moment
when the latter is broken is when the steel’s yielding stress is reached. Beyond this point, as seen in Figure 12, large
peaks start forming wherever the rebar’s cross-sections start yielding.

Chapter 5. Published Journal Articles | MATTIA FRANCESCO BADO
227
Figure 13. Distinction of signal and noise for an example curve (top) and evolution of the rib-induced noise with the load of
member 15D20_21.
Moving on to the following RC tie, Figure 14 displays the DOFS strain readings of the first of two 15D20_24
members (henceforth referred to as 15D20_24_1) with its DOFS being bonded on its opposite faces. One face
(henceforth referred to as Face A) uses CYN and SI whilst the opposite (Face B) adds a groove. The latter, though,
is not as long as the rebar itself (see Figure 14’s Face B RC tie illustration) therefore allowing to check, on a single
face, the DOFS reading performance of two separate bonding techniques. What can be quickly spotted is the larger
amount of noise that characterizes Face B’s readings when performed outside of the groove versus inside it.
Furthermore, along with a higher noise level of the signal, Face A’s plots seem to include more SRAs. This is
potentially due to the lack of a protective groove on its side.

Chapter 5. Published Journal Articles | Mattia Francesco Bado
228
Figure 14. Strain profiles of 15D20_24_1 RC tie test with the DOFS bonded on both sides of the rebar by means of CYN
and SI on one side (Face A - left) and a groove + CYN + SI on the other (Face B - right).
Figure 15 dwells deeper in the DOFS’ signal noise, displaying its values under three load levels. A discrete noise
magnitude difference is noticeable according to the difference of DOFS/rebar bonding technique and according to
the presence or absence of concrete. Figure 15’s lower plot summarizes the increasing noise magnitude as a function
of the load. Both faces of the rebar report similar high noise levels whenever the DOFS is bonded outside of the
groove whilst lower levels are consistently reported (both outside and inside the concrete) whenever the DOFS is
positioned inside it. Once again it seems that the presence of the groove translates in an improved signal quality
both from a noise and anomalistic point of view.
What is also on view is that, just like in Figure 13, the noise magnitude increases linearly up until the yielding
load. Therefore, henceforward the noise level magnitude can be studied simply by means of a fitted straight line’s
slope coefficient. For example, Face A’s versus Face B’s average strain reading noise slope coefficient when inside
the concrete is 0.3636 versus 0.0360, indicating the latter’s higher quality. Now that the basic concepts of the rib-
induced noise and its way of quantifying it have been introduced, the other members’ analysis will be performed
jointly at the end of this section. Figure 16. Strain profiles of 15D20_24_2 RC tie test with the DOFS bonded on
both sides of the rebar by means of CYN and SI on one side (Face A - left) and a groove + CYN + SI on the other
(Face B - right).
The reason behind the testing of such member was the idea of attempting the replication of the previous
member’s results in order to consolidate them. While most of the above conclusions still apply to the present
member (the presence of the groove providing the least noisy and anomalistic results both inside and outside the
concrete), an unforeseen phenomenon also came up.

Chapter 5. Published Journal Articles | MATTIA FRANCESCO BADO
229
Figure 15. (Top five subplots) Rib-induced noise analysis of the outputs of member’s 15D20_24’s test and (bottom
subplot) of their relative average reading noises.
Figure 16. displays the DOFS strain measurement of an identical member, 15D20_24_2, with also identical bonding
techniques.

Chapter 5. Published Journal Articles | Mattia Francesco Bado
230
Indeed, whilst in Figure 14 both faces provide similarly shaped plots, Figure 16’s are quite different. Face A’s
profile inside the concrete loses the central pointy tip (expected in RC tie tests) and appears more curvilinear (instead
of the expected pair of crossing linear profiles). Such difference can be attributed to a non-overlookable bending of
the RC tie during the test, induced by a lack of straightness of the bar itself. Unfortunately, discrete amounts of
bending occur in numerous RC tie tests due to the impossibility of having perfectly straight rebars. Whilst this is an
accountable phenomenon, the effect of such bending on the DOFS (or on the adhesives bonding it) is unseen and
deserving of further studies. A possible explanation to Face A’s profiles could lay in the additional stretching that
the bending-induced-tension of the concrete communicates to the adhesives (especially on the very deformable
silicone) and thus to the fiber. Additionally, further studying should also be dedicated to assessing the effect of
bending-induced-compression. This is in line with other researchers’ results11,16 that suggest a certain “strain
relaxing” and “strain redistributing” influence of the silicone when it is used as a DOFS protecting material.
Unfortunately, this phenomenon strongly influences the recommendability of the present bonding technique for this
particular use. Furthermore, it should be kept in mind that such alteration is truly revealed only when monitoring
multiple facets of the same rebar. Indeed, if only a single DOFS deployment is performed, all that is extracted from
the test is such altered data is with no way of assessing its correctness.
Now that all the non-cracking members’ DOFS readings have been presented, Table 1 summarizes all their rib-
induced noise by means of their slope coefficient in an attempt to establish which bonding technique produces the
least amount. It should be mentioned that for member 15D20_27 it is nonsensical to calculate the amount of noise
when the full graph is predominantly SRAs, therefore an ∞ noise value is given. Table 1 clearly indicates the groove
combined with a protective SI layer as the bonding technology that leads to the smallest rib-induced noise growth
with load ensuring the clearest DOFS signal even at the end of the tensile test.
Table 1. Slope coefficient of the average strain reading noise growth with load for the presented RC ties and subdivided
per bonding technology and presence/absence of concrete.
Groove and CYN CYN and SI Groove and CYN and SI
Inside Concrete: No Yes No Yes No Yes
15D20_27 0.2539 ∞ - - - -
15D20_21 - - - - 0.2084 0.1538
15D20_24_1 - - A: 0.2298
B: 0.1815
A: 0.3636
-
-
B: 0.1041
-
B: 0.0360
15D20_24_2 - - A: 0.3247
B: 0.0906
A: 0.2015
-
-
B: 0.0698
-
B: 0.0531

Chapter 5. Published Journal Articles | MATTIA FRANCESCO BADO
231
4.2.2. Cracking RC Ties
The first RC cracking tie under scrutiny is 12D16_60. The member has the peculiarity of being monitored by
three runs of the same fiber (possible thanks to its extended length) twisting across them, as shown in Figure 5a.
Two DOFS runs are performed on Face A, where both bondings are achieved with CYN and SI w/o groove, and
one on Face B w/ groove (with CYN and SI). Their outputs are plotted in Figure 17 which includes a DIC illustration
(on top) of the position of the crack in order to correlate it to the member’s rebar strains.
Figure 17. DOFS extracted profiles of member 12D16_60 as monitored by three runs of the same fiber, two on Face A and
one on Face B.
Despite a relevant amount of bending is evident in each of three plots, a clear variation of the strain profile can
be noticed in correspondence to the formed crack. Indeed, this variation takes the form of a single (Face B) or
double pointed (Face A) peak whose axes coincides with the crack displayed in the DIC. Multiple SRAs can be

Chapter 5. Published Journal Articles | Mattia Francesco Bado
232
seen in both of Face A’s plots whilst only a small un-intrusive one can be spotted in Face B’s suggesting the
superiority of the latter’s bonding technique. In line with what was concluded in the previous sub-section, also the
noise produced by the combination of groove, CYN and SI is inferior to the bonding technique using just the last
two elements.
Figure 18 expands on the previous one showing the DOFS and DIC outputs of members 10D16_60 and
8D16_60.
Figure 18. (left) Member 10D16_60 and (right) 8D16_60’s rebar DOFS strain profiles for the latter’s opposite faces, each
welcoming different bonding techniques, and their DIC monitoring.
Just like before, the members’ Faces A use simply CYN and SI whilst Face B adds a groove to the mix. Similar
observations to the previous figure’s can be performed. Indeed, strain peaks correspond well to DIC’s cracks
location and the signal noise level is inferior for DOFS positioned inside a groove versus outside one. Interestingly,
though, member 10D16_60 displays a consistent amount of SRAs in both faces demonstrating that even the

Chapter 5. Published Journal Articles | MATTIA FRANCESCO BADO
233
combination of groove, CYN and SI is not completely fail-proof. Ideally, the steel rebar’s strains in the cracked
section (where concrete is absent) should be equivalent to the steel strains present on the bare rebar outside of the
concrete prism. Yet, due to the presence of bending in the rebar, this assumption cannot be made. Furthermore,
member 10D16_60’s two plots display two different crack-induced peak heights, Face A’s smaller than Face B’s.
As mentioned above, it is only through a double DOFS monitoring of member’s 10D16_60 rebar that we are able
to diagnose this difference. If only Face B had been monitored, its profile would automatically be considered
representative of the rebar’s strain state. With this in mind, extreme care should be adopted whenever extracting
and reporting such results.
Member’s 10D16_60 crack-induced strain peak height difference between Faces A and B, could potentially be
attributed to the two following issues; the above mentioned extra-stretching communicated to the DOFS by the
bending-induced-tension inside the concrete and/or to the under-performance of SI which fails to properly isolate
the DOFS from the concrete’s pull whenever the latter’s cracks open. Differently so, this issue was less pronounced
for both fibers deployed in member 8D16_60 probably due to either a positioning of the DOFS half way between
the bending-induced tensile and compressive area or to a thicker and more protective layer of SI. Further research
is necessary to comprehend this phenomenon as no sufficient data is available at the present moment.
Nevertheless, three potential ways of preventing this phenomenon from happening are:
A preparatory study of the rebars’ minute bending (could be achieved through 3D scanning technique for
example) and the bonding of the DOFS strictly in those areas where the straightening of rebar will cause
compression;
Use of a different protective agent than SI;
Application of a thicker layer of SI than the one applied to further insulate the DOFS.
The following section will finally draw some conclusions on the SRA-preventing power of each DOFS/rebar
bonding technique, accounting both cracking and not-cracking RC ties.
5. SRA Analysis per Every DOFS/Rebar Bonding Technique
In order to properly diagnose an SRA and clearly distinguish it from the signal’s noise, a unique method is here
presented. Taking as example member 15D20_24_2, Figure 19 analyses its DOFS signal noise level for four distinct
loads. For clarity purposes, being the noise increasingly larger with the load, only the latter will be studied on the
lookout for SRAs. Then, if to assume a customizable threshold of ±50 με, any noise level higher than the latter can
be considered anomalistic. The selected threshold may vary according to the researchers’ objectives, desired
strictness and subjective sensibility on what should be labeled as anomalistic.

Chapter 5. Published Journal Articles | Mattia Francesco Bado
234
Figure 19. Member 15D20_24_2 (top) Face A’s and (bottom) B’s noise level study for SRA analysis.
Figure 19 adds an extra axis to each of the graphs where the amount of this newly-labeled “anomalistic noise”
is represented providing a graphical representation of the location and gravity of the anomalies. Some anomalistic
sections can be detected in both faces (despite the largest amount being on Face A) where most of the SRAs tend
to concentrate. Whenever data is absent it can also be considered an anomaly as the viewer is also missing out on
relevant information just like with an SRA. Except that, whilst with small SRAs a trend can still be distinguishable,
with absent data no such thing can be done. Therefore, the used SRA detection code was tweaked to attribute an
anomalistic noise of 200 με to any DOFS section with missing data (as visible in Figure 20).
With these observations in mind a final calculation of the total amount of SRAs can be performed per every
bonding technique. Its outcome, represented in Figure 21, shows a clear advantage of the groove, CYN and SI
technique as it averagely welcomes a distinctly smaller amount of SRAs compared to the other two.
6. Conclusions
The present article provided a contribution to the effort of establishing the best DOFS/rebar bonding technique
whenever the instrumented bar is to be placed on the inside of RC structures. To this end, a first step was taken by
looking into the state of the art on the bonding techniques used so far by several researchers.

Chapter 5. Published Journal Articles | MATTIA FRANCESCO BADO
235
Figure 20. (top) Member 8D16’s strain profiles and (bottom) noise level study for strain reading anomalies (SRA)
analysis.
Figure 21. Total amount of anomalistic readings grouped per bonding technique used.
Despite some scattered data was provided, no clear indication could be extracted on the most performant
technique to both glue and protect the DOFS. Thus, the experimental campaign, core subject of the paper, took on
itself the challenge of testing multiple bonding techniques on multiple rebars, non-cracking and cracking RC ties
tested in tension in order to check their performance.
The following conclusion can be extracted:

Chapter 5. Published Journal Articles | Mattia Francesco Bado
236
The presence of a longitudinally incised groove and silicone (SI) as extra protection for the DOFS against
external factors is un-influential on bare rebars subjected to pure tension or bending;
The combination of a groove, cyanoacrylate (CYN) and SI is the bonding technique that leads to the smallest
increase of noise magnitude of the DOFS profiles with increasing load;
None of the studied bonding techniques could completely guarantee the removal of all SRAs. Yet, the
combination of a longitudinally incised groove, CYN and SI is the bonding technique that leads to the smallest
amount of strain reading anomalies (SRAs) thus preserving the readability and reliability of the strain data;
An unexpected phenomenon, possibly connected to the under-performance of the above bonding technique,
causes an alteration of the DOFS strain readings whenever the fiber is in the presence of extra bending-
induced tension (smoothened strain profiles as in Figure 16, Face A) and/or monitoring strains in cracked
cross-sections (magnifying their amount as in Figure 18);
Despite its superior performance compared with other bonding techniques, the combination of groove, CYN
and SI suffers gravely of the above issue and thus cannot be referred to as an ideal DOFS/rebar bonding
technique but simply as the most performant among the modern-day ones;
Further research is then required on substituting SI with an equally protective adhesive that does not transfer
any internal extra stretches to the DOFS, allowing it to sample strictly the rebar’s strains. Furthermore, the
bonding performances should be studied with different testing conditions such as dynamic (cyclic) and impact
testing.
Author Contributions: M.F.B. and J.R.C. conceived and designed the experiment; M.F.B. performed the
experiment with the aid of C.G.B.; M.F.B. analyzed and post-processed the data and, together with A.D., wrote the
present article; writing—review and editing was performed by J.R.C. and C.G.B. All authors have read and agreed
to the published version of the manuscript.
References:
1. Bona, G. Di; Forcina, A.; Falcone, D.; Silvestri, L. Critical Risks Method ( CRM ): A New Safety Allocation
Approach for a Critical Infrastructure. 2020.
2. Olawale, D.O.; Kliewer, K.; Okoye, A.; Dickens, T.J.; Uddin, J.; Okoli, O.I. Real time failure detection in
unreinforced cementitious composites with triboluminescent sensor. J. Lumin. 2014, 147, 235–241,
doi:10.1016/j.jlumin.2013.11.050.
3. Barrias, A.; Casas, J.R.; Villalba, S. A Review of Distributed Optical Fiber Sensors for Civil Engineering
Applications. Sensors 2016, 16, 748, doi:10.3390/s16050748.
4. Sieńko, R.; Zych, M.; Bednarski, Ł.; Howiacki, T. Strain and crack analysis within concrete members using
distributed fibre optic sensors. Struct. Heal. Monit. 2018, doi:10.1177/1475921718804466.

Chapter 5. Published Journal Articles | MATTIA FRANCESCO BADO
237
5. Luna Innovations Incorporated ODiSI 6000 - Optical Distributed Sensor Interrogators. Available online:
https://lunainc.com/wp-content/uploads/2017/11/LUNA-ODiSI-6000-Data-Sheet.pdf (accessed on
24/08/2020).
6. Bao, X.; Chen, L. Recent Progress in Distributed Fiber Optic Sensors. Sensors 2012, 12, 8601–8639,
doi:10.3390/s120708601.
7. Rodríguez, G.; Casas, J.R.; Villaba, S. Cracking assessment in concrete structures by distributed optical fi ber.
Smart Mater. Struct. 24, 35005, doi:10.1088/0964-1726/24/3/035005.
8. Barrias, A.; Casas, J.R.; Villalba, S. Embedded Distributed Optical Fiber Sensors in Reinforced Concrete
Structures. Sensors 2018, 18, 1–22, doi:10.3390/s18040980.
9. Barrias, A.; Casas, J.R.; Villalba, S. Application study of embedded Rayleigh based Distributed Optical Fiber
Sensors in concrete beams. Procedia Eng. 2017, 199, 2014–2019, doi:10.1016/j.proeng.2017.09.466.
10. Davis, M.; Hoult, N.A.; Scott, A. Distributed strain sensing to determine the impact of corrosion on bond
performance in reinforced concrete. Constr. Build. Mater. 2016, 114, 481–491,
doi:10.1016/j.conbuildmat.2016.03.205.
11. Bado, M.F.; Casas, J.R.; Barrias, A. Performance of rayleigh-based distributed optical fiber sensors bonded to
reinforcing bars in bending. Sensors (Switzerland) 2018, 18, doi:10.3390/s18093125.
12. Ansari, F.; Libo, Y. Mechanics of Bond and Interface Shear Transfer in Optical Fiber Sensors. J. Eng. Mech.
1998, 124, 385–394.
13. Wan, K.T.; Leung, C.K.Y.; Olson, N.G. Investigation of the strain transfer for surface-attached optical fiber
strain sensors. Smart Mater. Struct. 2008, 17, doi:10.1088/0964-1726/17/3/035037.
14. Henault, J.M.; Salin, J.; Moreau, G.; Quiertant, M.; Taillade, F. Analysis of the strain transfer mechanism
between a truly distributed optical fiber sensor and the surrounding medium. In Proceedings of the Concrete
Repair, Rehabilitation and Retrofitting III; Cape Town, South Africa, 2012; pp. 733–739.
15. Bassil, A.; Chapeleau, X.; Leduc, D.; Abraham, O. Concrete Crack Monitoring Using a Novel Strain Transfer
Model for Distributed Fiber Optics Sensors. 2020, 1–17, doi:10.3390/s20082220.
16. Barrias, A.; Casas, J.R.; Villalba, S. Distributed optical fibre sensors in concrete structures: Performance of
bonding adhesives and influence of spatial resolution. Struct. Control Heal. Monit. 2019, 26, 1–16,
doi:10.1002/stc.2310.
17. Bado, M.F.; Casas, J.R.; Gomez, J. Post-processing algorithms for distributed optical fiber sensing in structural
health monitoring applications. Struct. Heal. Monit. 2020, doi:10.1177/1475921720921559.
18. Davis, M.; Hoult, N.A.; Scott, A. Distributed strain sensing to assess corroded RC beams. Eng. Struct. 2017,
140, 473–482, doi:10.1016/j.engstruct.2017.03.013.
19. Regier, R.; Hoult, N.A. Concrete deterioration detection using distributed sensors. Struct. Build. 2015, 168,
118–126.

Chapter 5. Published Journal Articles | Mattia Francesco Bado
238
20. Malek, A.; Scott, A.; Pampanin, S.; Hoult, N.A. Postyield Bond Deterioration and Damage Assessment of RC
Beams Using Distributed Fiber-Optic Strain Sensing System. J. Struct. Eng. 2019, 145, 1–17,
doi:10.1061/(ASCE)ST.1943-541X.0002286.
21. Nurmi, S.; Mauti, G.; Hoult, N.A. Distributed Sensing to Assess the Impact of Support Conditionson Slab
Behavior. In Proceedings of the 39th IABSE Symposium-Engineering the Future; 2017; pp. 1478–1485.
22. Brault, A.; Hoult, N. Distributed Reinforcement Strains: Measurement and Application. ACI Struct. J. 2019,
116, 115–127, doi:10.14359/51714483.
23. Berrocal, C.G.; Fernandez, I.; Rempling, R. Crack monitoring in reinforced concrete beams by distributed
optical fiber Crack monitoring in reinforced concrete beams by distributed optical fiber sensors. Struct.
Infrastruct. Eng. 2020, 0, 1–16, doi:10.1080/15732479.2020.1731558.
24. Quiertant, M.; Baby, F.; Khadour, A.; Marchand, P.; Toutlemonde, F.; Rivillon, P. Deformation monitoring of
reinforcement bars with a distributed fiber optic sensor for the SHM of reinforced concrete structure. Instrum.
Mes. Metrol. 2013, 13, 131–147, doi:10.3166/i2m.13.1-2.131-147.
25. Michou, A.; Hilaire, A.; Benboudjema, F.; Nahas, G.; Wyniecki, P.; Berthaud, Y. Reinforcement-concrete
bond behavior: Experimentation in drying conditions and meso-scale modeling. Eng. Struct. 2015, 101, 570–
582, doi:10.1016/j.engstruct.2015.07.028.
26. Haefliger, S.; Mata-Falcon, J.; Kaufmann, W. Application of distributed optical measurements to structural
concrete experiments. In Proceedings of the SMAR 2017- Fourth Conference on Smart Monitoring,
Assessment and Regabilitation of Civil Structures; 2017.
27. Bado, M.F.; Kaklauskas, G.; Casas, J.R. Performance of Distributed Optical Fiber Sensors (DOFS) and Digital
Image Correlation (DIC) in the monitoring of RC structures. In Proceedings of the IOP Conference Series:
Materials Science and Engineering; 2019; Vol. 615.
28. Bassil, A.; Wang, X.; Chapeleau, X.; Niederleithinger, E.; Abraham, O.; Leduc, D. Distributed fiber optics
sensing and coda wave interferometry techniques for damage monitoring in concrete structures. Sensors
(Switzerland) 2019, 19, doi:10.3390/s19020356.
29. Bado, M.F.; Casas, J.R.; Kaklauskas, G. Distributed Sensing (DOFS) in Reinforced Concrete members for
reinforcement strain monitoring, crack detection and bond-slip calculation. Eng. Struct. 2020.

Chapter 5. Published Journal Articles | MATTIA FRANCESCO BADO
239
Chapter 5.4 Cement and Concrete Composites 2021
Bado MF, Casas JR, Dey A, C. Berrocal G, Kaklauskas G, Fernandez I, Rampling R. Characterization of concrete
shrinkage strains in internally-restrained members by Distributed Optical Fiber Sensing. Cement and Concrete
Composites. April 2021. https://doi.org/10.1016/j.cemconcomp.2021.104058
Characterization of concrete shrinkage induced strains in internally-restrained
RC structures by Distributed Optical Fiber Sensing
Mattia Francesco Bado1,*, Joan R. Casas1, Alinda Dey2, Carlos G. Berrocal3, Gintaris Kaklauskas2, Ignasi
Fernandez3, Rasmus Rempling3
1 Department of Civil and Environmental Engineering (Technical University of Catalunya. UPC-BarcelonaTech), Campus
Nord, Calle Jordi Girona 1-3, 08034 Barcelona, Spain 2 Department of Reinforced Concrete Structures and Geotechnical Engineering (Vilnius Gediminas Technical University),
Saulėtekio al. 11, 10221 Vilnius, Lithuania 3 Department of Architecture and Civil Engineering, Division of Structural Engineering (Chalmers University of Technology,
Sven Hultins gata 6, 41258 Göteborg, Sweden
Abstract:
The present paper reports the result of an inter-university experimental investigation on concrete shrinkage induced
strains on embedded rebars instrumented with Distributed Optical Fiber Sensors (DOFS). The monitoring was
performed for a standard 28 days drying time and for a shorter 6 days time span (reflecting realistic constructions
schedules accelerations to meet set deadlines). The tested specimens were Reinforced Concrete (RC) tensile
members differing in their geometry, DOFS employed and fiber/rebar bonding techniques. Regarding the latter, a
combination of cyanoacrylate (for gluing) and silicone (protection) was found to be the optimal one for deployments
inside RC structures. The DOFS-reported combined effect of concrete shrinkage and creep on the embedded rebars
is compared with the Model Code 2010’s predictions and employed to extract conclusions on the residual
performance of the RC members at the end of their drying phase.
Keywords: Concrete; Concrete shrinkage; Shrinkage; Distributed Optical Fiber Sensors; DOFS; DFOS.

Chapter 5. Published Journal Articles | Mattia Francesco Bado
240
1. Introduction
The constant consumption growth of concrete across the globe has steadily increased the awareness over its
behavior in both early and later stages. Indeed, its time dependent deformations can lead to serious issues such as
malformation and member shortening when the concrete is still unloaded, excessive deflection in its service life and
early cracking in both stages. These can be responsible for structural safety and serviceability concerns of
Reinforced Concrete (RC) structures even when designed according to design codes. With the increasing application
of high-strength materials resulting in longer spans and smaller sections, the above mentioned issues are more
relevant than ever as they literally affect the governing criterion used to design such structures. To include these
time effects in structural design and analyses, reliable data and accurate prediction of shrinkage and creep are
essential. Among the concrete time dependent behavior of concern for durable structures, shrinkage plays a crucial
role1–4.
Generally, shrinkage of concrete is considered as the alteration in its volume in unloaded and unrestrained
conditions at a constant temperature. It manifests itself as a compressive deformation whose magnitude, even in its
earlier stages, can be larger than the cracking load of concrete structures5. Literature suggests that shrinkage of
concrete occurs in two different stages: early (within the first 24h) and later stage. Shrinkage at both stages is an
overlapping of the effects of autogenous, drying and thermal shrinkage. In standard term, the carbonation shrinkage
is also added which leads to an accumulated effect6. The first kind of shrinkage is the autogenous shrinkage. It is
the result of chemical shrinkage affiliated with the hydration of cement particles (withdrawal of water from the
capillary pores due to the hydration of the previously un-hydrated cement), a process known as self-desiccation7. It
occurs in the early days after concrete casting and is predominantly responsible for the volume change8 (in particular
for high strength concrete9). Significantly, it occurs in absence of moisture exchange (it is measured with sealed
concrete specimens in order to prevent any moisture exchange with the surrounding environment10) and it is mainly
a function of temperature and the water/cement ratio8,11–14. The second kind of shrinkage, defined as drying
shrinkage, is a volume reduction of concrete which occurs due to the evaporation of moisture stored in gel pores of
the concrete in unsaturated air environments with no applied stress15. It is a function of the structural element
thickness, exposed surface, porosity, free water content and fineness of the binder16. In addition to drying and
autogenous shrinkage, the concrete is also subjected to volume reductions due to chemical and thermal changes
(deemed as driving force to the autogenous shrinkage17) in addition to carbonation reactions.
Among several external factors influencing the concrete shrinkage, ambient relative humidity and water-cement
ratio are the most predominant. As a matter of fact, Havlasek18 and Gribniak19 expressed shrinkage strain as non-
linear function of relative humidity while Jasiczak3 & J.J. Brooks20 showed that shrinkage is directly proportional
to the water-cement ratio. A lesser but still relevant influence on shrinkage is attributed to improper curing of
concrete in a dry environment21–23, to intrinsic properties of the concrete mix (self-compacting concrete exhibits

Chapter 5. Published Journal Articles | MATTIA FRANCESCO BADO
241
higher shrinkage due to its higher amount of fines compared to conventional vibrated concrete13 or presence of fly
ash and silica fumes reduce the pore size in concrete thus lowering its permeability24), aggregate properties and
structural geometry (development rate of shrinkage is higher in thinner or smaller elements).
Whenever studying the effects of shrinkage on the performance of a RC structure, it should be kept in mind that,
if to consider an isolated plain concrete element, shrinkage alone would simply shorten it without causing any
stresses. Instead, inside RC structures the presence of embedded reinforcement, effectively restrains the concrete
shrinkage deformation, leading to the rise of a compressive state in the reinforcement and tensile stresses in the
surrounding concrete. This last statement represents the core of what makes shrinkage such a harmful phenomenon
for RC structures. Indeed, if the tensile stresses surpass the concrete tensile strength, cracking would start occurring
and its development, if left uncontrolled, could affect the structural serviceability and durability25,26. Additionally,
cracks may allow the ingress of chlorides towards the reinforcement which results in corrosion and the potentially
premature rupture of the steel reinforcement6,26,27. Even when early age cracking does not occur, the residual stresses
due to restrained early-age deformation can substantially reduce the remaining tensile-carrying capacity of
concrete28 in addition to influencing the tension-stiffening phenomenon5,29,30. As a matter of fact, the authors of the
present article31 and Bischoff32 have attempted to establish the notable effect of shrinkage on the tension stiffening
in both an empirical and numerical manner. It was assessed that neglecting the effects of shrinkage in the structural
response of a RC member leads to a perceived influence of the reinforcement ratio on tension stiffening. According
to Bischoff29, these issues grow proportionally with the reinforcement ratio. Indeed, for the same amount of
shrinkage, the apparent loss of tension stiffening becomes worse, as the reinforcement percentage increases
(becoming unneglectable beyond 1%). Instead, as observed as well by other authors31,33, once the shrinkage effect
is removed, the tension stiffening appears to be independent from the reinforcement ratio.
The effects of shrinkage on the performance of RC structures may not be limited to long drying periods of time.
Indeed, in many applications freshly poured concrete is loaded after only three to four days later, making it essential
to study the extent of shrinkage-induced strains present in the constitutive materials at this stage34. For example,
“urban verticalization” is steadily expanding all over the world thus seeing an increased erection of high-rise
buildings whose construction process, often referred to as high-speed construction, sees a 2-3 floors casting per
week35. Also, individual structural elements may not be allowed to fully develop their characteristic strength before
being loaded in order to meet project time targets. For example, a slab may be used to support the formwork for
another floor or other structural elements, or it may be prematurely loaded with masonry blocks36.
Accurate and reliable experimental data on the concrete shrinkage-induced strains on steel reinforcement would
enable researchers to not only verify the correctness of the modern serviceability models but also to create new
empiricism-free ones.
In the past, strain measurements of a rebar inside a RC member were achieved by Kankman37, Houde38 and Scott
and Gill39 who first sawed the bar in two longitudinally and later milled their core to provide channels wide enough

Chapter 5. Published Journal Articles | Mattia Francesco Bado
242
to install multiple strain gauges. Despite the revolutionary aspect of such test at the time, the technique is time-
consuming, labor-intensive, and rather invasive in addition to allowing only very limited spatial resolution (25 to
38mm). Another tool often employed for that purpose is Fiber Bragg Gratings (FBGs)40,41. These are quasi-
distributed optical fiber sensors in which a characteristic wavelength is used to simultaneously provide its address
in the sensor network, and the measurement (temperature and strains). Despite the instrumenting of a rebar with
FBGs is less straining (it still requires the incision of a groove on the rebar surface in order to achieve the best bond
possible), the achievable spatial resolution is still limited (around 20mm).
In the present paper, the authors opted, instead, to study the strain distribution along the rebar with a different
technique, namely Distributed Optical Fiber Sensors (DOFS). These are very thin glass wires (125μm of diameter,
similar to thickness of a hair) which, when used in combination with Optical Frequency Domain Reflectometry
(OFDR), are able to accurately measure strains (with 1µε accuracy), temperature and vibration in a completely-
distributed manner (measurements every 0.65mm) with flexible spatial resolution and desired frequency42. In order
to obtain a high spatial resolution with OFDR-based sensors, a very narrow light pulse is originated by an Optical
Backscatter Reflectometer (OBR), resulting in a proportionally lower level of the backscattering signal and, at the
same time, an increased receiver bandwidth, essential requirement in order to detect such signals43. In more detail,
Rayleigh scattering originates from the interaction between the electromagnetic pulse propagating in the fiber silica
core and the latter’s inherently random silica impurities. A sampled Rayleigh backscattering, measured whenever a
DOFS is in an unstrained state, constitutes a “fingerprint” against which any later backscattering measurements are
compared against in order to determine the strains that the fiber has been subjected to. Indeed, whenever a DOFS
is subjected to an external stimulus (like strain), the backscatter pattern presents a spectral shift that the OBR can
convert into a strain variation value.
A fiber silica (SiO2) glass core is usually encapsulated in a cladding made of polymeric material or nylon which
can vary in diametrical size, shape and manufacturing process. The external coating can be constituted by a
numerous kinds of materials, layering, thicknesses and external textures. Figure 1 displays the two kinds of fiber
used in the present study. In particular, the first (yellow) has a chemical polyamide cladding whilst the second (blue)
has a central metal tube and a thicker polyamide outer sheath adding up to a nominal diameter of 3.2 mm.
The instrumenting of structural elements with DOFS is simple, rapid and very little invasive as it consists only
of covering the fiber with adhesive while correctly positioned on the element to monitor. Yet, since Distributed
Sensing is such a young technique when it comes to its application to the civil and structural engineering field, very
limited guidelines are provided on which is the best fiber/structural surface bonding technique. The optimal
technique should include adhesives with similar stiffness to the one of the monitored structural surface and should
allow for the extraction of data with the least amount of Strain Reading Anomalies (SRA)44,45 and unreliable
measurements possible; all whilst leaving unaltered the measured strain readings.

Chapter 5. Published Journal Articles | MATTIA FRANCESCO BADO
243
Figure 1. The two different kinds of DOFS cables used in the present experimental campaign
Despite up to now DOFS has been scarcely adopted for the measurement of the time-dependent behavior of
concrete, those few applications have yielded interesting results. Some of these monitoring efforts are listed in the
following. Glisic et al.46 used a fiber optic long-gauge strain monitoring system based on low coherence
interferometry to evaluate the long-term behavior of a high-rise building throughout every stage of its life. A similar
work was also reported in de Battista et al.47. Davis et al.48 instrumented multiple rebars with OFDR DOFS and
embedded them inside several RC prisms with the goal of measuring their distributed strain profiles during a 28
days monitoring time interval and during subsequent axial tension tests. Finally, Webb et al.49 monitored a three
span, pre-tensioned, prestressed concrete beam-and-slab bridge by means of BOTDR DOFS with the goal of
observing its long-term behavior in order to compare the in-situ measurements to the various empirical creep and
shrinkage models used in the design phase.
DOFS’ great advantages as a monitoring tool are acknowledged by the authors and the experimental campaign
object of the present paper takes full advantage of these. The objective of the campaign is dual in nature. The first
is the continuous monitoring of the strains of several rebars when embedded inside concrete from the moment the
latter is poured onwards. This should provide a clear picture of the strains that shrinking concrete transfers to the
embedded rebar due to the its restraint. These strains will be further studied under two frameworks; short-term and
standard-term shrinkage. Whilst the former tackles the issue of strains in the constitutive materials in a potential
real-life construction time span, the latter confronts this matter for a 28 days drying/hardening period of time.
Indeed, as mentioned above, it is crucial to evaluate the possibility of short-term concrete cracking and its reduction
of tensile-carrying capacity in both stages. The second objective is the establishing which, among the suggested
ones, is the best DOFS/rebar bonding technique whenever the instrumented rebar is embedded inside a RC structure.
The present paper is the result of a collaborative effort between research teams of Universitat Politècnica de
Catalunya (UPC), CHALMERS University of Technology and Vilnius Gediminas Technical University (VGTU).
Thus, the presented experimental campaigns, despite being conceptually identical, differ in materials and setup.

Chapter 5. Published Journal Articles | Mattia Francesco Bado
244
2.1 Specimen geometry and DOFS deployment techniques
The tested RC specimens were RC tensile members, henceforth referred to as RC ties. This kind of element is
often used to illustrate cracking, deformation and bond behavior of RC structures thanks to its simplicity and
reasonably good representation of the distribution of internal forces and strains in the tensile zone of RC structures51.
In the present experimental campaigns, the rebars of the RC ties were subjected to concrete shrinkage-induced
compression and their resulting strain profiles were monitored by means of DOFS bonded longitudinally to them.
The specimens tested in each of the three experimental campaigns will be henceforward collected in three groups,
Group 1 to 3. Furthermore, each specimen will be referred to by means of a code of which the first pair of digits
will be indicative of its cross-sectional dimensions (in cm) and the second of the diameter of the embedded rebar
(in mm). Specimen 10D12, for example, is characterized by a 10x10cm cross section with a 12mm diameter rebar
embedded inside it. The geometrical features of all the tested specimens are reported in Table I.
Table I. Geometrical features of the tested RC ties, the deployed DOFS and the DOFS-rebar bonding techniques
Group 1
(G1) Group 2 (G2) Group 3 (G3)
Specimen code 10D12 8D8 12D12 12D16 10D16
Cross section
[cm] 10x10 8x8 12x12 12x12 10x10
Bar diameter
[mm] 12 8 12 16 16
N. of specimens 1 1 1 1 3
Monitored time
[days] 28 6 28
Specimen
geometry
[cm]
Note that specimens 8D8 and 12D16 were composed of two separate concrete prisms whereas the rest were
prepared integrally, with no interruption. This geometrical peculiarity allowed for the studying of the strains inside
two differently sized RC ties (one short and one long) by means of a single rebar and of a single DOFS. This

Chapter 5. Published Journal Articles | MATTIA FRANCESCO BADO
245
difference was the base of a study, reported in Bado et al.69, on the influence of the longitudinal length of a RC
element on the evolution of the bond stresses and slip present in the concrete-steel interface when subjected to
tension. Additionally, as explained further on, this dual configuration allowed for the exploration of different DOFS
deployment techniques on RC prisms with identical cross-sections and constitutive materials.
Also note that the G3 specimens were monitored with two different kinds of DOFS; a thin and a thickly coated
one (displayed in Figure 1). Indeed, despite the measurements performed with the thick fibers may potentially
include a certain shear lag due the slip71,131 between its different constitutive layers, this kind of DOFS has the great
advantage of not requiring any extra protection, which made it an excellent candidate for the planned monitoring
efforts. The parallel use of thin and thick DOFS allowed for the extraction of conclusions that accounted for both
their measuring performance and the simplicity/complexity of their bonding techniques.
Finally, according to the authors’ previous research52,67 , the friction between concrete and DOFS is the most
disruptive phenomenon for the extraction of measurements that are both reliable and with the fewest SRA possible.
The issue is further exacerbated by the presence of large magnitude strains such as the ones occurring during the
concrete cracking phase. In order to pin-point the bonding/protection technique that best avoids such issue, different
adhesives were used i.e., cyanoacrylate (CYN), epoxy (EPX) and silicone (SI) in addition to different deployment
techniques i.e., positioning the DOFS in a longitudinally milled groove before bonding it or directly gluing it to the
rebar surface. The consequent performance analysis of each different bonding technique is intended to contribute
to the common goal of establishing the most performant method of deploying DOFS inside a RC structure67. The
adopted deployment, bonding and protection techniques are represented in Table I, respectively to each studied
specimen, and illustrated in more depth in Figure 2.
(a) (b) (c) (d)
Figure 2. Different manners of bonding the DOFS to the rebars: (a) simply positioning the DOFS in the concavity created
by the longitudinal ridge (after removing the mill-scale and degreasing the area with acetone) and gluing them with
cyanoacrylate adhesive; (b) bonded like in (a) with the addition of a protective layer of a one-component water-proof oxygen-
free silicone rubber; (c) positioning the DOFS in a 1.5x1.0mm superficially incised groove before proceeding to its gluing by
means of cyanoacrylate adhesive; (d) positioning of the thick DOFS inside a 2.5x2.5mm superficially incised groove before
proceeding to its gluing by means of epoxy adhesive (the protective function is provided by the polyamide fiber coating).
Illustration not to scale.

Chapter 5. Published Journal Articles | Mattia Francesco Bado
246
2.2 Materials and mix design
The concrete used to produce batches G1 and G3 were a mixture of 350 kg/m3 of Portland cement type II/A-
L42,5R, 935 kg/m3 of fine and coarse aggregate each and 175 kg/m3 of water. The coarse aggregate was of 12mm
and down. Instead, G2 was a mixture of 353 kg/m3 of Portland cement type II/A-L42,5R, 950 kg/m3 of fine and
coarse aggregate each and 148 kg/m3 of water. Table II below displays the mechanical characteristic of the
constitutive materials of each specimen.
Table II. Mechanical characteristics of steel and concrete
Group Member
Steel Concrete
Yielding
strength
fsy(MPa)
Ultimate
strength
fsu(MPa)
Modulus of
elasticity
Es(MPa)
Compressive
strength
fc(MPa)
Tensile
strength
fct(MPa)
Modulus of
elasticity
Ec(MPa)
1 10D12 541.22 593.65 204953 37.65 2.96 34939
2
8D8 561.50 645.53 192800
39.52 3.07 32789 12D12 541.22 593.65 204953
12D16 551.51 650.81 192271
3 10D16 533.31 599.76 200000 47.89 2.89 28159
The average concrete mechanical characteristics were established at 28 days in accordance with BS EN 12390.
The characteristics of G1 and G2 were assessed with 150mm sided cubic samples (fc) and with 150x300mm cylinder
samples (fct, Ec) whilst G3’s with 100mm sided cubic sample (fc), 150mm sided cubic sample (fct) and 100x200mm
cylinder samples (Ec). The noticeable difference in compressive strength between G1 and G3 (produced with the
same formula) is mostly attributable to the difference in specimen size (the measured strength of a specimen
decreases with an increase in its size111), but also to possible differences in the aggregate properties (G1 and G3
were produced in different laboratories). The reinforcement mechanical characteristics (fsy, fsu and Es) were instead
obtained in accordance with ISO 6892-1:2009 (specified in the standard BS EN 10025).
2.3 Test setup
In order to ensure an easy member demolding process, polyester and plywood sections were chosen to cast the
different prisms. The use of these materials was advantageous as it secured the correct positioning of the rebars on
each specimen centroid axis through the simple drilling of symmetrical holes for the passage of the rebar. After
casting and demolding the specimens (1 day later), G1 and G2 were kept cured at a controlled temperature of
averagely 24°C and 59% of relative air humidity whilst G3 was kept at a temperature of averagely 20°C and 35%

Chapter 5. Published Journal Articles | MATTIA FRANCESCO BADO
247
of relative air humidity. In order to ensure that the water evaporation occurred on all longitudinal faces, rollers were
placed beneath the specimens for a proper ventilation of the bottom face (as illustrated in Figure 3).
Their presence also served the purpose of minimizing the friction between the specimens and their support. G1
and G3 were continuously monitored for a 28 days time span (as reported in Table I). G2, instead, was only
monitored during the first 6 days, thus it was only used for short-term shrinkage monitoring. Furthermore, for the
monitoring of G2, a single monitoring channel was connected to each DOFS in an alternating manner.
(a) (b)
Figure 3. Photos of the drying specimens pertaining to (a) Group 2 and (b) Group 3 with their respective DOFS extending
outwards
Oppositely, for G3, four monitoring channels were available, thus the three thin and the single thick fibers were
monitored in a continuous and simultaneous fashion.
3. Test results
As mentioned earlier, the analysis of the DOFS strain profiles will be developed for two distinct frameworks.
The first will deal with short-term shrinkage and is intended to show what is the tensile state of the constitutive
materials just a few days after pouring. As a matter of fact, in practice, tight deadlines may lead to short drying
times (3-4 days for high-rise buildings) before the young concrete is loaded again. It is consequently paramount to
study the short-term strains caused by restraint concrete shrinkage. The second framework, instead, will deal with
the standard-term time span of 28 days. This one will allow to study the tensile state of concrete and steel after a
standard hardening time, to verify the presence of early concrete cracks and to quantify the concrete’s tensile-
carrying capacity reduction. All these aspects are crucial for the serviceability and fatigue performance of a RC
structure.

Chapter 5. Published Journal Articles | Mattia Francesco Bado
248
3.1 Short term shrinkage
The DOFS strain profiles that will be reported hereinafter are for a period of time of approximately 6 days but
before proceeding to the results, the following aspects should be kept in mind:
When analyzing early-age shrinkage results, it is necessary to have a consistent reference point for its start.
Yet, this is a very aleatory choice as it is close to impossible to guess the precise starting time. The task is
rendered even harder by the thermal reactions occurring in the first 24h. For uniformity purposes, especially
when comparing the shrinkage measurements of various mixtures, it was assumed that any shrinkage
occurring prior to the initial monitoring time was insignificant because of the fluid nature of the concrete;
The strains measured by DOFS during the cement hydration were a combination of strains induced by both
mechanical-tension and positive temperature variation. A possible way of separating the two would have
been the monitoring of the temperature inside the concrete. Whilst the extracted data could have been
interesting regarding the influence of the exothermic reactions on the tensional state of the structure in the
first 24h, this was deemed out of scope in the context of an experimental campaign designed to study the
strains inside reinforced concrete structures after 6 and 28 days. It can be assumed that at such age the
temperature in concrete is equivalent to the surrounding air temperature.
The strain measurements were performed by two different OBRs. Consequently, the output plots of the Group
3 are composed of many more points thanks to the higher spatial resolution of the ODiSI 6000;
Figure 4 represents the DOFS strain profiles of the case study specimens during five instances along the duration
of the short term shrinkage monitoring (2h, 24h, 33h, 54h, 129h). Note that the DOFS coordinates reporting the
strains inside those rebar segments embedded inside concrete are indicated in Figure 4 with a grey background. Just
outside of the concrete prisms, DOFS are briefly glued to the bare rebar (for example between 0.40m and 0.53m of
10D12) before being completely loose. Generally, the strains pertaining to loose fiber segments recorded strains
oscillating around 0με with some slight variations due to the free movement of the fiber (for example between
0.00m and 0.40m of 10D12).
Unfortunately, member 8D8 was successfully monitored in just the first half of its length as its second one
(dashed lines) is dominated by SRAs in the form of large, unrealistic and thus unreliable strain peaks. However, the
mid-section of its largest segment was not affected by such SRAs and provided reliable data on the member’s
maximum concrete shrinkage-induced strains.
The sum of these results gives a clear picture on what is the standard shape of an increasingly compressed rebar
embedded inside shrinking concrete. Figure 4 shows different strain values being recorded in the center and on the
edges of the profiles. For example, the strain profile of member 12D12 at 24 hours has a strain value of
approximately 150µε at DOFS coordinate 0.9225m (mid-section) and 90µε at DOFS coordinate 0.7050m (edges).

Chapter 5. Published Journal Articles | MATTIA FRANCESCO BADO
249
Figure 4. DOFS sampled strain profiles at 5 instances during the short-term shrinkage in all six RC ties
Similarly, at 129 hours, the respective strains are approximately -50µε and -70µε. Overall it can be assumed that
the edges of the member are averagely having inferior strains than its central portion as the stresses of the rebar tend
to accumulate from the edges of the member inwards in addition to the inferior steel/concrete bond conditions of
the former. Indeed, in the opposite extremities of the RC specimens, a certain amount of slip (and bond stresses) is
present on the concrete-steel interface, leading to an inferior concrete shrinkage restraint and, in return, to inferior
compressive strains in the steel (see Figure 4). These regions are defined as transmission zones and stretch inwards
for a specific transmission length lt. Between these zones a condition of perfect bond is usually assumed52,56 leading
to higher restraint and higher rebar strains. As a consequence of the perfect bond in the central zone, the strain rate
here is zero (the bond stresses too) leading to an ideally flat profile. This is the case in Figure 4, in particular for the
profiles of specimens with longer central zones (10D12 and 10D16).

Chapter 5. Published Journal Articles | Mattia Francesco Bado
250
Furthermore, it can be noticed that the specimens pertaining to G2 are still in tension at 24h whilst the others
have already passed this initial tension phase. The reason for such will be discussed later on.
Finally, in Figure 4’s last two frames, the results of the three 10D16 specimens (extracted by means of the thin
and thick DOFS) were averaged for simplicity’s sake. As a matter of fact, reporting strictly their averaged value is
conceptually correct thanks to the small difference between their readings. This can clearly be evinced from Figure
5 which displays the strain evolution in the mid-span of each 10D16 specimens and in Figure 6 which reports the
strain evolution in the mid-span of all the specimens in order to detect similarities, differences and common trends.
Please note that in Figure 6, whenever the specimens are constituted by multiple segments (8D8 and 12D16), only
their largest one is considered in light of their longitudinal length being superior to 2lt which, in turn, ensures the
presence of strain compatibility in the mid-section, similarly to the other specimens.
Figure 5. Rebar strain profiles extracted from the mid-span of the three 10D16 members (G3) through the thin and thick
DOFS

Chapter 5. Published Journal Articles | MATTIA FRANCESCO BADO
251
Figure 6. Concrete shrinkage-induced strains on the RC tie rebars over a 130 hours monitoring time span
In Figure 6 the dots are representative of the measured data scatter whilst the dashed lines connecting them are
the result of an algorithmic curve fitting interpolation. Furthermore, it is noticeable that the curves pertaining to G2
do not start from 0με but from a certain compression value (approximately -80με). This was due a pre-existent (with
respect to the moment that DOFS were glued to the rebar, corresponding to the 0 strain state) rebar thermal
contraction attributable to the external winter environment in which the casting of the RC ties was performed.
When comparing the curves of all the specimens, it is distinctly seen that they all stage a similar strain
development pattern. In the initial hours of concrete shrinkage, the heat expelled by the exothermic cement
hydration reaction causes local tension in the embedded rebar i.e., the initial lump. As previously mentioned the
DOFS strains reported in this stage are a combination of the local tension in the rebar and the temperature positive
variation induced by the occurring exothermic reactions. This positive strain growth slows down after some hours
with the reduction in un-hydrated cement particles, leading to a decrease of profile inclination (particularly evident
for the G2 profiles but entirely lacking for the G3 ones). Subsequently, the profiles flatten before quickly reversing
their trend whenever the cement hydration heat dissipation is superior to the produced one. The amount of time
required for these three steps to occur varies among the three groups due to the difference in their constitutive
materials, such as cement type and amount of fines. Specimen 10D16 stands out for its rapid rise in strains and
equally fast trend inversion whilst specimen 10D12 stands out for its minor and rather blunt strain peak. Beyond
this initial lump drying shrinkage acquires an increasingly larger role in the concrete total shrinkage which is
restrained by the embedded rebars. As visible in the experimental data, such restraining effort from the part of the
rebars causes the latter to enter a compressive state (negative increase in strains). Interestingly, Figure 6 displays
how the profile trends during early shrinkage (130h) seem to be influenced almost exclusively by the constitutive

Chapter 5. Published Journal Articles | Mattia Francesco Bado
252
materials versus the almost trivial influence of the rebar diameters and cross-sectional dimensions. Indeed, after the
initial lump, profiles 8D8, 12D12 and 12D16 are almost equivalent to one another in addition to slowly approaching
10D12.
3.2. Standard term shrinkage
In the present section the standard-term (28 days) shrinkage monitoring of members 10D12 and the three 10D16
will be displayed. Starting from the former, Figure 7 displays its longitudinal strain evolution at multiple instances
along the 28 days.
Figure 7. Concrete shrinkage-induced strain inside member 10D12 over a 28 days monitoring time span
As observable, the standard-term shrinkage induced strain profiles do not significantly change in shape compared
to the short term drying. The main difference is the average strain of the central compatibiltiy zone which
corresponds to approximately 225με in the final stage of the standard term versus 150με in the short term. Similarly,
Figure 8 below displays the strains inside the three 10D16 members as sampled by the thin and thick DOFS. Figure
8’s thick fiber profiles include some data gaps indicative of SRAs or data erroneously left out by DOFS.
Notwithstanding the profiles and its trends are still clear and thus the authors’ decision of integrally plotting the
actual raw data instead of an interpolated one. What is also noticeable is the smoothness of the measurements
reported by the thick fiber compared to their more rugged and somewhat anomalistic thin fiber counterpart. Figure
8’s strain profiles are not only similar to each other (testament of the quality of the test and of the performance of
the two types of DOFS) but also to their short-term counterpart and, geometrically-wise, to the profiles of member
10D12 (see Figure 7).

Chapter 5. Published Journal Articles | MATTIA FRANCESCO BADO
253
Figure 8. Strains inside the three 10D16 specimens as sample by both thin and thick DOFS
In an attempt to grasp the performance differences between the thin and thick fibers and compare their results to
the ones of member 10D12, Figure 9 plots the mid-section strains of the RC ties along with an average of all the six
10D16 readings. As visible, the strains measured by the thin DOFS of 10D16 are very consistent among each other
with a maximal difference of 5με after 672 hours. The thick DOFS strain measurements are less consistent (maximal
difference of 15με after 672 hours) but still close together. Whilst the plots of the two kinds of fiber report
simultaneous strain variations along time, their uniformity (initially strong) slowly degrades with time reaching a
maximal difference of 44με at 672 hours. Different hypotheses could explain such difference, among which
different shrinkage ratios of the different faces of the members or the relaxation of the thick DOFS coating.
Unfortunately, none of them successfully elucidate the reason for the degradation. Further research on this issue is
warranted. Despite the slight degradation with time, the correlation between the measurements performed by the
thin and thick fiber is still quite close. This is encouraging considering the potential of the thickly coated fiber of
being embedded inside concrete without any extra support or protection.

Chapter 5. Published Journal Articles | Mattia Francesco Bado
254
Figure 9. The mid-section strains of the RC ties as measured by both thin and thick DOFS embedded inside members
10D12 and 10D16
Finally, as per the short-term shortening, it is clear that both 10D12 and 10D16 members stage a similar pattern
of strain development. Despite such, their difference (up to 100με at 672 hours) is evident and can be attributed
mainly to the constitutive materials and drying conditions since, as seen before, the difference in rebar diameter
covers very little influence.
4. Comparison with the Model Code 2010 predictions
In the present section the authors intend to compare the experimental results with theoretical ones extracted from
the Model Code 2010. By means of such comparison it will be possible to assess the code’s prediction power of the
shrinkage-induced RC member inner-workings.
In order to achieve such objective, the following theoretical approach is considered. The shrinkage induced axial
strain on the steel rebar 𝜀𝑠,𝑠ℎ𝑘(𝑡, 𝑡0) (as a function of the concrete age 𝑡 and the concrete age at the beginning of
drying 𝑡0) is modelled as the result of a fictitious force 𝑃𝑠ℎ𝑘 that tends to compress the case study RC member as in
Equation 1:
𝜀𝑠,𝑠ℎ𝑘(𝑡, 𝑡0) = 𝑃𝑠ℎ𝑘(𝑡, 𝑡0)
𝐴𝑐𝐸𝑐 + 𝐴𝑠𝐸𝑠=
𝜀𝑠ℎ𝑘(𝑡, 𝑡0)𝐴𝑐𝐸𝑐
𝐴𝑐𝐸𝑐 + 𝐴𝑠𝐸𝑠 (1)
Where 𝐴𝑐 and 𝐴𝑠 are the transversal area of concrete and steel respectively, 𝜀𝑠ℎ𝑘(𝑡, 𝑡0) is the concrete free
shrinkage strain (calculated according to the MC2010) and 𝐸𝑐 and 𝐸𝑠 are the modulus of elasticity of concrete and
steel relatively. In the current analysis, 𝑡 = 0 coincides with the time of pouring (or rather the first moment that
DOFS measurements were performed as soon as technically possible after pouring) and 𝑡𝑠 = 1. According to this
assumption, shrinkage started after 1 day, when the RC ties were demolded and drying shrinkage begun. As

Chapter 5. Published Journal Articles | MATTIA FRANCESCO BADO
255
previously mentioned, the determination of the specific instance in which concrete shrinkage starts and commences
putting in compression the embedded rebars, is close to impossible. Then again, if to slightly vary the value of 𝑡𝑠 in
the analysis, the prediction alterations are hardly perceptible and definitely not altering the shape of the profile at
28 days. In order to take in consideration the strain relieving effect of tensile creep, 𝐸𝑐 should be replaced with the
Age Adjusted Modulus of Elasticity (AAEM) 𝐸𝑐𝑎(𝑡, 𝑡0) as in Equation 2.
𝜀𝑠,𝑠ℎ𝑘(𝑡, 𝑡0) =𝜀𝑠ℎ𝑘(𝑡, 𝑡0)𝐴𝑐𝐸𝑐𝑎(𝑡, 𝑡0)
𝐴𝑐𝐸𝑐𝑎(𝑡, 𝑡0), +𝐴𝑠𝐸𝑠 (2)
This is a product of a method developed by Trost-Bazant57 in order to study the standard term strains under
varying stresses and can be calculated as in Equation 3:
𝐸𝑐𝑎(𝑡, 𝑡0) = 𝐸𝑐(𝑡)
1 + 𝜑(𝑡, 𝑡0) 𝜒(𝑡, 𝑡0) (3)
Where 𝜑(𝑡, 𝑡0) is the related creep factor as calculated from the MC2010 and 𝜒(𝑡, 𝑡0) the aging coefficient. It
should be kept in mind that, as suggested by the model itself, after short durations of loading or drying, the prediction
error is higher than after long durations.
Figure 10 plots the strains resulting from the combined effects of shrinkage and creep (as calculated from the
above method) together with the 10D12 experimental curve and the 10D16 averaged one.
Figure 10. Concrete shrinkage and creep-induced steel strains on 10D12 and 10D16 rebars
A good correlation between the predicted and experimental results can be deduced from Figure 10. Yet, whilst
on the one hand the 10D12 DOFS plot coincides with the theoretical curve that includes the relaxing effect of tensile
creep, on the other hand member the 10D16 one is closer to the predicted curve that excludes the latter effect. This
issue should be the topic of further research since, through the creation of a large database of DOFS monitored
shrinkage campaigns, it would be possible to accurately establish if the MC2010 predictions of shrinkage and creep
effectively averagely underestimate, overestimate or are on a par with the real strains inside the RC member.

Chapter 5. Published Journal Articles | Mattia Francesco Bado
256
By means of the DOFS extracted steel strain profiles and the MC2010 free shrinkage strain predictions, it is also
possible to calculate the stresses in the concrete surrounding the rebar and check if its tensile strength has already
been exceeded. In the absence of external forces, the equilibrium of the internal forces sees the concrete’s and the
reinforcement’s equal in magnitude and opposite in sign, therefore, the resulting concrete stress at 28 days can be
calculated by means of the Model Code 2010 𝜎𝑐,28_𝑀𝐶2010 as per Equation 4 or directly from the DOFS fibers
𝜎𝑐,28_𝐷𝑂𝐹𝑆 as per Equation 5.
𝜎𝑐,28_𝑀𝐶2010 = − 𝜀𝑠ℎ𝑘(𝑡, 𝑡0) 𝐸𝑠𝜌
1 +𝐸𝑠
𝐸𝑐𝑎(𝑡, 𝑡0)𝜌
(4)
𝜎𝑐,28_𝐷𝑂𝐹𝑆 = − 𝜀𝑠,28_𝐷𝑂𝐹𝑆 𝐸𝑠𝐴𝑠
𝐴𝑐 (5)
Being 𝜌 the reinforcement ratio of the element. According to Figure 10, the values of 𝜀𝑠ℎ𝑘(𝑡, 𝑡0) for members
10D12 and 10D16 are respectively -280με and -380με whilst the ones of 𝜀𝑠,28_𝐷𝑂𝐹𝑆 are -217με and -321με. The
corresponding 𝜎𝑐,28_𝑀𝐶2010 for the two members is 0.59MPa and 1.40MPa respectively whilst 𝜎𝑐,28_𝐷𝑂𝐹𝑆 is
0.49MPa and 1.36MPa. If to compare these values to Table II’s 𝑓𝑐𝑡, it is clear that the present members’ concrete
tensile strength is not surpassed in the entire shrinkage phase.
Concluding the present section, overall it can be stated that an evident congruence was found between the
experimental data extracted with DOFS both during the hardening and testing phase of RC ties and the theoretical
predictions developed by the Model Code 2010. Further congruence can be found in the prediction of the stress
suffered by the concrete surrounding the rebar which, in both cases, is smaller than its tensile strength. This stands
as testament of the performance of the predictive model in calculating the shrinkage induced strains in a RC member
steel rebar.
5. Comparison of bonding techniques
The goal of the present section is to briefly expose which of the DOFS bonding techniques displayed in Figure
2 fulfilled best its double function of bonding the fibers and protecting them from the appearance of SRAs. This
last requirement is crucial to the reliability and fast interpretation of the results (key aspects of Structural Health
Monitoring). Please note that this section is strictly referred to the thin fiber as the thicker one bypasses the
protection issue with its intrinsic layering. When viewing the following results some aspects should be kept in mind:
The conclusions of this section are only applicable to DOFS-embedded shrinkage monitoring tests. This is
so due to the relatively low strains recorded in the current structural phase. For example, the maximum strain
level recorded in the current test is of -321με whilst for tensile tests it is common practice to reach the steel
yielding level (around 2750με for an S500 steel);

Chapter 5. Published Journal Articles | MATTIA FRANCESCO BADO
257
In order to have a coherent comparison parameter the number of SRAs is calculated for all specimen strain
profiles that are fully included in a -200με +200με interval.
The selected method for identifying Strain Reading Anomalies is the Geometrical Threshold Method (GTM)45.
According to the latter, the SRA label is applied to every reading that does not satisfy the condition in Equation 6.
|εsk − εs,k−1| < p (6)
Where εsk is the steel strain measured in a specific DOFS section k, εs,k−1 is the strain value measured in the
DOFS section previous to k and p is a sensitivity parameter according to which the user can dictate how strictly the
SRA label can be attributed to any particular DOFS strain. If to assume p = 25με, all strain measurements reported
by DOFS that would differ of more than 25με from the previous one would be considered anomalistic. The
subjective choice over the value p should mirror the desired accuracy of the analysis, extension of the monitored
specimen and tolerance of SRA-related interferences. Now, considering all the strain readings performed in a single
DOFS coordinate along the entire duration of the test, the ratio between the number of these readings that can be
labeled as SRAs (i.e., that do not satisfy Equation 6) over the total provides a “percentage of anomalistic readings”.
The latter offers a clear indication of the overall reliability of the measurements performed in a single DOFS
coordinate. If to expand the calculation of the “% of anomalistic readings” to all the DOFS coordinates monitoring
a single specimen, conclusions can be drawn on the capacity of the adopted bonding technique to prevent the advent
of SRAs. Figure 11 collects the results of such analysis per every tested specimen. Figure 12a, instead, catalogues
the data of Figure 11 according to the employed bonding technology in order to draw general conclusions on their
performance.
Figure 11. Total percentage of anomalistic readings for every tested specimen

Chapter 5. Published Journal Articles | Mattia Francesco Bado
258
(a) (b)
Figure 12. (a) Percentage of anomalistic readings per bonding technology and (b) average percentage of anomalistic
readings per different value of sensitivity parameter p
Figure 12a not only reports the percentage of anomalistic strain readings over the total performed ones but also
averages them in order to give an idea of the overall performance of each bonding technique. Figure 12b, instead,
provides a general idea of the variation of the number of SRAs as a function of the selected SRA sensitivity
parameter p. At first sight the most performant technique seems to be the use of strictly CYN with no extra
protection. Yet, three things should be considered when dealing with such result. The first is the very limited
extension of the segment that was instrumented with such technique, secondly its limited application (just one case)
and finally the large variance of the results of such test (as is the case for Incision+CYN). These aspects render any
observation on the performance of strictly CYN quite inconclusive. Differently so, it can be stated with certainty
the superiority of the CYN+SI method over the Incision+CYN (in line with the findings of other authors58). The
latter, being the main conclusion extractable from the present section, suggests the importance of extra protection
of the thin DOFS. An extra protection that is not provided by simply positioning the DOFS incised a groove incised
on the surface of the rebar.
6. Conclusions
Acknowledging the importance of concrete shrinkage on the serviceability of buildings (especially modern ones
with longer structural spans and elements with small cross-sections), the present paper set itself the goal of studying
the effects of concrete shrinkage on rebars embedded inside RC structures. The tool used to achieve such objective
are Distributed Optical Fiber Sensors (DOFS) which, in the case study experimental campaigns, were bonded to the
rebars in different ways before the latter were embedded inside RC tensile members (ties). The performance of the
different DOFS/rebar bonding techniques complemented the research. The concrete shrinkage-induced strains were
studied under two frameworks; short-term and standard-term shrinkage in order to tackle both the cases of a real-
life short construction steps (typical in high rise building construction) and of a full 28 days drying/hardening time

Chapter 5. Published Journal Articles | MATTIA FRANCESCO BADO
259
span. The DOFS-reported strains inside the RC ties all displayed a similar behavior. In agreement with the literature,
an initial rise in strains was detected (caused by the heat released by the hydration of cement), quickly followed by
a trend inversion that saw the rebar compressed for the rest of the monitoring duration. The difference between the
curves was attributable mainly to the concrete constitutive material such as cement and amount of fines rather than
to the embedded rebar diameter. In the short-term the largest rebar compression strain measured by DOFS was of
198με whilst in the standard term 321με. When comparing these experimentally extracted curve with their Model
Code 2010 prediction counterpart a good compatibility was found as a testament of the performance of such
prediction model. Both the DOFS extracted data and the model predictions agreed that the concrete tensile strength
of the RC ties was not surpassed during the entirety of the shrinkage phase. Finally, on the topic of DOFS/rebar
bonding technique the combination of cyanoacrylate and silicone consistently provided readings with the least
number of Strain Reading Anomalies, effectively qualifying itself as the most reliable technique.
References
1. Al-Saleh, S. A. Comparison of theoretical and experimental shrinkage in concrete. Constr. Build. Mater. 72,
326–332 (2014).
2. Goel, R., Kumar, R. & Paul, D. K. Comparative study of various creep and shrinkage prediction models for
concrete. J. Mater. Civ. Eng. 19, 249–260 (2007).
3. Jasiczak, J., Szymański, P. & Nowotarski, P. Computerised evaluation of the early age of shrinkage in concrete.
Autom. Constr. 49, 40–50 (2015).
4. Yazdizadeh, Z., Marzouk, H. & Hadianfard, M. A. Monitoring of concrete shrinkage and creep using Fiber
Bragg Grating sensors. Constr. Build. Mater. 137, 505–512 (2017).
5. Kaklauskas, G. & Gribniak, V. Eliminating Shrinkage Effect from Moment Curvature and Tension Stiffening
Relationships of Reinforced Concrete Members. J. Struct. Eng. 137, 1460–1469 (2011).
6. Wu, L., Farzadnia, N., Shi, C., Zhang, Z. & Wang, H. Autogenous shrinkage of high performance concrete: A
review. Constr. Build. Mater. 149, 62–75 (2017).
7. Barcelo, L., Moranville, M. & Clavaud, B. Autogenous shrinkage of concrete: A balance between autogenous
swelling and self-desiccation. Cem. Concr. Res. 35, 177–183 (2005).
8. Lura, P. Autogenous Deformation and Internal Curing of Concrete. (2003).
9. Holt, E. Contribution of mixture design to chemical and autogenous shrinkage of concrete at early ages. Cem.
Concr. Res. 35, 464–472 (2005).
10. Liu, J., Yan, K. Z., Zhao, X. & Hu, Y. Prediction of autogenous shrinkage of concretes by support vector
machine. Int. J. Pavement Res. Technol. 9, 169–177 (2016).
11. Loukili, A., Khelidj, A. & Richard, P. Hydration kinetics, change of relative humidity, and autogenous
shrinkage of ultra-high-strength concrete. Cem. Concr. Res. 29, 577–584 (1999).
12. Jensen, O. M. & Hansen, P. F. Autogeneous deformation and RH-change in perspective. Cem. Concr. Res. 75,
1045 (2001).
13. Oliveira, M. J., Ribeiro, A. B. & Branco, F. G. Shrinkage of self-compacting concrete. A comparative analysis.
J. Build. Eng. 9, 117–124 (2017).
14. Zhang, M. H., Tam, C. T. & Leow, M. P. Effect of water-to-cementitious materials ratio and silica fume on the
autogenous shrinkage of concrete. Cem. Concr. Res. 33, 1687–1694 (2003).
15. Collins, F. & Sanjayan, J. G. Effect of pore size distribution on drying shrinkage of alkali-activated slag
concrete. Cem. Concr. Res. 30, 1401–1406 (2000).

Chapter 5. Published Journal Articles | Mattia Francesco Bado
260
16. Acker, P. & Ulm, F. J. Creep and shrinkage of concrete: Physical origins and practical measurements. Nucl.
Eng. Des. 203, 143–158 (2001).
17. Bullard, J. W. et al. Mechanisms of cement hydration. Cem. Concr. Res. 41, 1208–1223 (2011).
18. Havlásek, P. & Jirásek, M. Multiscale modeling of drying shrinkage and creep of concrete. Cem. Concr. Res.
85, 55–74 (2016).
19. Gribniak, V., Kaklauskas, G. & Bacinskas, D. State-of-art Review on Shrinkage Effect on Cracking and
Deformations of Concrete Bridge Elements. Balt. J. Road Bridg. Eng. 2, (2007).
20. Brooks, J. J. Shrinkage of Concrete. in Concrete and Masonry Movements c, 137–185 (2015).
21. Henkensiefken, R., Bentz, D., Nantung, T. & Weiss, J. Volume change and cracking in internally cured
mixtures made with saturated lightweight aggregate under sealed and unsealed conditions. Cem. Concr.
Compos. 31, 427–437 (2009).
22. Collepardi, M., Borsoi, A., Collepardi, S., Ogoumah Olagot, J. J. & Troli, R. Effects of shrinkage reducing
admixture in shrinkage compensating concrete under non-wet curing conditions. Cem. Concr. Compos. 27,
704–708 (2005).
23. Folliard, K. J. & Berke, N. S. Properties of high-performance concrete containing shrinkage-reducing
admixture. Cem. Concr. Res. 27, 1357–1364 (1997).
24. Neville, A. Properties of concrete. Computational Modelling of Concrete Structures (2011).
doi:10.1201/b10546-17
25. Hong, C. Y., Zhang, Y. F. & Liu, L. Q. Application of distributed optical fiber sensor for monitoring the
mechanical performance of a driven pile. Meas. J. Int. Meas. Confed. 88, 186–193 (2016).
26. Craeye, B., Geirnaert, M. & Schutter, G. De. Super absorbing polymers as an internal curing agent for
mitigation of early-age cracking of high-performance concrete bridge decks. Constr. Build. Mater. 25, 1–13
(2011).
27. Ghourchian, S., Wyrzykowski, M., Lura, P., Shekarchi, M. & Ahmadi, B. An investigation on the use of zeolite
aggregates for internal curing of concrete. Constr. Build. Mater. 40, 135–144 (2013).
28. Nguyen, D. H., Dao, V. T. N. & Lura, P. Tensile properties of concrete at very early ages. Constr. Build. Mater.
134, 563–573 (2017).
29. Gilbert, R. I. Tension stiffening in lightly reinforced concrete slabs. J. Struct. Eng. 133, 899–903 (2007).
30. Gilbert, R. I. Shrinkage, cracking and deflection - The serviceability of concrete structures. Electron. J. Struct.
Eng. 1, 15–37 (2001).
31. Kaklauskas, G., Tamulenas, V., Bado, M. F. & Bacinskas, D. Shrinkage-free tension stiffening law for various
concrete grades. Constr. Build. Mater. 189, 736–744 (2018).
32. Bischoff, P. H. Effects of shrinkage on tension stiffening and cracking in reinforced concrete. Can. J. Civ. Eng.
28, 363–374 (2001).
33. Dey, A., Vastrad, A. V., Bado, M. F., Sokolov, A. & Kaklauskas, G. Long-Term Concrete Shrinkage Influence
on the Performance of Reinforced Concrete Structures. Materials (Basel). 14, 1–16 (2021).
34. Claisse, P. & Dean, C. Compressive strength of concrete after early loading. Proc. Inst. Civ. Eng. Mater. 166,
152–157 (2016).
35. Bester, N. & Nicholas, B. Concrete for high-rise buildings: Performance requirements, mix design and
construction considerations design and construction considerations. Struct. Concr. Prop. Pract. 1–4 (2013).
36. Shema, M. A. & Abejide, O. S. Safety of Premature Loading on Reinforced Concrete Slabs. Niger. J. Technol.
28, 5–15 (2009).
37. Kankam, C. K. Relationship of Bond Stress, Steel Stress, and Slip in Reinforced Concrete. J. Struct. Eng. 123,
79–85 (1997).
38. Houde, J. Study of Force-Displacement Relationships for the Finite-Element Analysis of Reinforced Concrete.
(McGill University, Montreal, Quebec, Canada, 1974).

Chapter 5. Published Journal Articles | MATTIA FRANCESCO BADO
261
39. Scott, R. H. & Gill, P. A. T. Short-term distributions of strain and bond stress along tension reinforcement.
Struct. Eng. 65B 65, 39-43,48 (1987).
40. Kaklauskas, G., Sokolov, A., Ramanauskas, R. & Jakubovskis, R. Reinforcement Strains in Reinforced
Concrete Tensile Members Recorded by Strain Gauges and FBG Sensors: Experimental and Numerical
Analysis. Sensors 1–13 (2019). doi:10.3390/s19010200
41. Glišić, B., Hubbell, D., Sigurdardottir, D. H. & Yao, Y. Damage detection and characterization using long-
gauge and distributed fiber optic sensors. Opt. Eng. 52, 087101 (2013).
42. Luna Innovations Incorporated. ODiSI 6000 - Optical Distributed Sensor Interrogators. (2020). Available at:
https://lunainc.com/wp-content/uploads/2017/11/LUNA-ODiSI-6000-Data-Sheet.pdf (accessed on
24/08/2020).
43. Barrias, A., Casas, J. R. & Villalba, S. A Review of Distributed Optical Fiber Sensors for Civil Engineering
Applications. Sensors 16, 748 (2016).
44. Bado, M. F., Casas, J. R. & Barrias, A. Performance of Rayleigh-Based Distributed Optical Fiber Sensors
Bonded to Reinforcing Bars in Bending. Sensors 23 (2018). doi:10.3390/s18093125
45. Bado, M. F., Casas, J. R. & Gomez, J. Post-processing algorithms for distributed optical fiber sensing in
structural health monitoring applications. Struct. Heal. Monit. (2020). doi:10.1177/1475921720921559
46. Glisic, B., Inaudi, D., Lau, J. M. & Fong, C. C. Ten-year monitoring of high-rise building columns using long-
gauge fiber optic sensors. Smart Mater. Struct. 22, (2013).
47. de Battista, N., Cheal, N., Harvey, R., & Kechavarzi, C. Monitoring the axial displacement of a high-rise
building under construction using embedded distributed fibre optic sensors. in 8th International Conference on
Structural Health Monitoring of Intelligent Infrastructure (2017).
48. Davis, M. B., Hoult, N. A., Bajaj, S. & Bentz, E. C. Distributed Sensing for Shrinkage and Tension Stiffening
Measurement. ACI Struct. J. 114, (2017).
49. Webb, G. T., Vardanega, P. J., Hoult, N. A., Fidler, P. R. A., Bennett, P. J., & Middleton, C. R. Analysis of
Fiber-Optic Strain-Monitoring Data from a Prestressed Concrete Bridge. J. Bridg. Eng. 22, 1–14 (2017).
50. LUNA Technologies. ODiSI-A Optical Distributed Sensor Interrogator (Users Guide). (2013).
51. Ruiz, M. F., Muttoni, A. & Gambarova, P. G. Analytical modeling of the pre- and postyield behavior of bond
in reinforced concrete. J. Struct. Eng. 133, 1364–1372 (2007).
52. Bado, M. F., Casas, J. R. & Kaklauskas, G. Distributed Sensing (DOFS) in Reinforced Concrete members for
reinforcement strain monitoring, crack detection and bond-slip calculation. Eng. Struct. 226, 111385 (2021).
53. Berrocal, C. G., Fernandez, I., Bado, M. F., Casas, J. R. & Rempling, R. Assessment and visualization of
performance indicators of reinforced concrete beams by distributed optical fiber sensing. Struct. Heal. Monit.
(2021). doi:10.1177/1475921720984431
54. Berrocal, C. G., Fernandez, I. & Rempling, R. Crack monitoring in reinforced concrete beams by distributed
optical fiber sensors. Struct. Infrastruct. Eng. 0, 1–16 (2020).
55. Bado, M. F., Casas, J. R., Dey, A. & Berrocal, C. G. Distributed optical fiber sensing bonding techniques
performance for embedment inside reinforced concrete structures. Sensors 20, (2020).
56. Kaklauskas, G., Gribniak, V., Bacinskas, D. & Vainiunas, P. Shrinkage influence on tension stiffening in
concrete members. Eng. Struct. 31, 1305–1312 (2009).
57. Bazant, Z. P. Prediction of concrete creep effects using age-adjusted effective modulus method. Aci J. 69, 212–
217 (1972).
58. Brault, A. & Hoult, N. A. Distributed Reinforcement Strains: Measurement and Application. ACI Struct. J.
116, (2019).

Chapter 5. Published Journal Articles | Mattia Francesco Bado
262
Chapter 5.5 Structural Health Monitoring 2020
Bado MF, Casas JR, Gómez J. Post-processing algorithms for distributed optical fiber sensing in structural health
monitoring applications. Structural Health Monitoring. 2020;20(2):661-680. doi:10.1177/1475921720921559
Post processing algorithms for distributed optical fiber sensing in SHM applications
Mattia Francesco Bado 1,*, Joan Ramon Casas1, Judit Gómez 1
1 Department of Civil and Environmental Engineering (Technical University of Catalunya. UPC-BarcelonaTech),
Campus Nord, Calle Jordi Girona 1-3, 08034 Barcelona, Spain
Abstract:
Distributed Optical Fiber Sensors (DOFS) are measuring tools whose potential related to the civil engineering field
has been discovered in the latest years only (reduced dimensions, easy installation process, lower installation costs,
elevated reading accuracy and distributed monitoring). Yet, what appears clear from numerous in-situ DOFS
monitoring campaigns (bridges and historical structures among others) and laboratory confined experiments, is that
OFS monitorings have a tendency of including in their outputs a certain amount of anomalistic readings (out of
scale and unreliable measurements). These can be both concentrated in nature and spread over all the monitoring
duration. Their presence strongly affects the results both altering the data in its affected sections and distorting the
overall trend of the strain evolution profiles; thus the importance of detecting, eliminating and substituting them
with correct values. Being this issue intrinsic in the raw output data of the monitoring tool itself, its only solution is
a computer-aided post-processing of the strain data. The present paper discusses different simple algorithms for
getting rid of such disruptive anomalies by means of two methods previously used in literature and a novel
polynomial based one with different levels of sophistication and accuracy. The viability and performance of each
is tested on two case study scenarios; an experimental laboratory test on two reinforced concrete tensile elements
and an in-situ tunnel monitoring campaign. The outcome of such analysis will provide the reader with both clear
indications on how to purge a DOFS-extracted data set of all anomalies and on which is the best suited method
according to their needs. This marriage of computer technology and cutting edge Structural Health Monitoring tool
not only elevates the DOFS viability but provides civil and infrastructures engineers a reliable tool to perform
previously unreachable levels of accuracy and extension monitoring coverage.
Keywords: Structural health monitoring; distributed optical fiber sensor; concrete structures; tunnel monitoring;
structural integrity.

Chapter 5. Published Journal Articles | MATTIA FRANCESCO BADO
263
1. INTRODUCTION
As clearly stated by Brownjohn1, civil infrastructure provides the means for a society to function. The wide range
of applications that civil engineering offers includes buildings, bridges, highways, tunnels, power plants, industrial
facilities, geotechnical and hydraulic structures among others. Each of these is subjected to multiple events that
deteriorate and compromise its structural integrity in a unique way throughout its service lifetime exposing its future
performance to several risks. In order to avoid the social, economic and environmental costs of deterioration and/or
failure, civil structures have different safety and durability requirements that need to be met and that ensure a correct
structural performance and the wellbeing of their users. For that, a series of inspection, monitoring and maintenance
protocols have to be carried out during the structure’s service lifetime.
The effectiveness of these monitoring methods relies in their ability to rapidly detect alterations on the structure’s
performance, allowing for its identification, characterization and control. This idea is the basis of Structural Health
Management (SHM), which, according to Housner et al.2, can be understood as the continuous or regular
measurement and analysis of key structural and environmental parameters under operating conditions, for the
purpose of warning of abnormal states or accidents at an early stage.
Traditional structural monitoring techniques involve the use of inclinometers, accelerometers, extensometers,
total station surveys, load cells and GNS-based sensors, among many others. These tools have a wide applicability
and are quite reliable since their correct deployment is widely acknowledged, easily ensuring reliable monitoring
and, consequently, structural assessment. However, as stated in Baker3, conventional forms of inspection and
monitoring are only as good as their ability to uncover potential issues in a timely manner. Regarding the ability of
damage detection, traditional tools present several drawbacks such as insufficient data management ability, the need
for the infrastructure’s service interruption during their deployment, non-automated real-time measures and non-
distributed sensing and more.
Among the most modern monitoring technologies adopted in the structural engineering field, Optical Fiber
Sensors (OFS), SOFO deformation sensors4, Global Positioning Systems (GPS), radars, Micro Electro Mechanical
Systems (MEMS) and Image Processing Techniques are increasingly gaining in popularity. As a matter of fact,
these have opened the doors to the extraction of structural information that could not be acquired before5,6.
Generally speaking, the structural assessments through monitoring tools rely essentially on the precision of the
sensors, on its automation level and data management speed. OFS sensors have recently upped their performance
to embrace these requirements and are the main subject of the present paper. These sensing tools provide several
advantages regarding SHM given its reduced dimensions, easy installation process, lower maintenance, lower
installation costs, reading accuracy, immunity to electromagnetic influences and aggressive environments. The
fundamental principle behind OFS is the propagation of light through an optical fiber cable (diameter of 125μm)
whose core is usually composed by silica (SiO2) and is protected by an external polymer-type cladding. These can

Chapter 5. Published Journal Articles | Mattia Francesco Bado
264
further be protected by an extra coating layer despite the present paper displays results extracted with strictly bare
OFSs. The light travelling through the core is a monochromatic laser and moves forwards in the fiber thanks to
internal reflections. When light is travelling in the optically dense medium that is the core and strikes a boundary at
a particular angle (larger than the critical angle of the boundary), the light experiences total internal reflection and
is, therefore, confined in the core. Any variation that the structural surface is subject to is reproduced in the fiber
(bonded on it) causing a physical modification/perturbation in its optical core. These perturbations can be detected
thanks to light scattering; a phenomenon that naturally occurs whenever the light beams’ photons interact with the
core’s inhomogenities generating a second magnetic wave (scattering or return) that heads back towards the light
source (backscattering)7. The main back-scattered spectral components include Raman, Brillouin and Rayleigh.
These are measured to identify strain and temperature variations.
OFS can be categorized into three different groups: grating-based sensors, interferometric sensors and distributed
sensors. Most OFSs, such as Fiber Bragg Grating sensors (FBG)8 or Fabry-Perot sensors9, are discrete and can only
provide local measurements thus potentially omitting important information in structural areas that are not explicitly
instrumented. Furthermore, analyzing a structure’s global behavior by means of discrete sensors would require the
installation of a high number of sensors producing a dense system of monitored points, which translates into a
difficult and expensive deployment and complex data acquisition. Distributed Optical Fiber Sensors (DOFS) were
developed to deal with these limitations allowing for a distributed monitoring of strain and temperature along the
entire optical fiber length by means of a single cable between the sensing fiber and the reading device. There are
several sensing technologies based on DOFS: Raman Optical Time-Domain Reflectometer (OTDR), Brillouin
Optical Time Domain Reflectometer (BOTDR), Brillouin Optical Time Domain Analysis (BOTDA), Optical
Frequency Domain Reflectometry (OFDR), Optical Backscatter Reflectometer (OBR), among others. These are
characterized by different sensing ranges and spatial resolutions which makes them suitable for different
deployments. In particular, the OBR technique used in the applications presented in this paper is a Rayleigh
Backscattering based Optical Backscatter Reflectometer (OBR). It provides a good cost-efficiency balance granting
millimetric spatial resolutions at the expense of low sensing range (only up to 70m10).
DOFS have been implemented in both laboratory structural engineering experimental campaigns7,11,12 and in real
structural applications such as dams7,8, high rise buildings13, bridges10,14, slopes15, piles16 and pipelines17 among
others. However, given it is a new/under research technology it still presents some limitations. To start its elevated
initial investment cost makes it a very selective monitoring technique, the frequent appearance of anomalies in the
readings, the lack of reliable fiber-structure bonding techniques and the lack of standardized guidelines that ensure
success in every deployment.
The frequent appearance of anomalies in the strain measurements in the form of abnormally high peaks that
distort the strain profiles is the topic of the present article. In our case, the article is aimed at proposing various
numerical-computing assisted methods for the identification and treatment of such anomalous readings both novel

Chapter 5. Published Journal Articles | MATTIA FRANCESCO BADO
265
and from the literature. The Spectral Shift Quality method and Geometrical Threshold Method are part of the latter
category while the Polynomial Interpolation Comparison Method is introduced for the first time in the present
article. Their efficiency is tested on two case study scenarios; an experimental laboratory campaign on two
Reinforced Concrete (RC) tensile elements (ties) and a real life in-situ monitoring campaign of the inner surface of
a lining-formed metro tunnel in Barcelona. The results will testify the efficiency of the novel methodology over the
more commonly used ones despite confirming the viability of the latter for a fast preliminary analysis.
2. STRAIN READING ANOMALIES
Figure 1 below exemplifies the possible outputs of a strain monitoring experimental campaign performed with
the use of DOFS. On the one hand, in Figure 1a the red plot displays the deformation state of a 1.2m long DOFS
over its multiple points in the single instance in which the measurement is performed. Such strain readings are
assumed equivalent to the one of the monitored surface on which it is bonded but in reality it is a function of the
ratio between the stiffness of the latter and the used adhesive. On the other hand, Figure 1b displays the evolution
of strains of a single monitoring point of the fiber versus the test time. As visible, the gathered output is provided
to the tester as a raw data set with the following components:
Length vector: representing each sensing point along the fiber (henceforth defined as DOFS coordinates)
where the measurements have taken place as a function of the selected gauge length and gauge spacing or
spatial resolution;
Strain matrix: comprising the strain readings along the whole fiber for a particular time in each row;
Time vector: specifying the date and time of the performed measurement.
What is also evident in Figure 1a is the great clarity difference between the red dashed and blue continuous plots.
This is due to the post-processing process that the blue curve received in order to remove the visible large strain
peaks present in the DOFS raw output. These strain peaks, also present in Figure 1b, are unexpectedly high,
concentrated in nature and of doubtful meaning henceforth referred to as Strain Reading Anomalies (SRAs).
Many DOFS monitored campaign report such anomalies. In Villalba et al.7 the external face of a RC slab was
instrumented with DOFS in ordered to explore the fiber’s crack detection ability. Here, large peaks are detected
early in the test and are attributed to points of strain concentration due to cracks. As the load increases such peaks
degenerates into quasi-infinite peaks, clear SRA identifier. A DOFS monitoring of another RC slab18 also reports
SRAs. In Davis et al.11 the strains inside different RC ties are monitored with the goal of gaining insights into the
concrete-reinforcement bond performance of corroded specimens and the detection of pitting corrosion. During the
tension of the ties numerous large peaks appear sometimes even deeply in compressive domain which is improbable
considering the nature of the tensile test. Another RC tie test developed by the authors also displayed the rise of
SRAs with load12.

Chapter 5. Published Journal Articles | Mattia Francesco Bado
266
In Barrias et al.19 the DOFS sensors were, instead, used to monitor the deformations of a RC bending element
unloaded and reloaded again to assess the performance of the sensor when applied to a real loading scenarios in
concrete structures. Here too, after the development of cracks, high magnitude peaks are observed and later
substituted through interpolation with the surrounding values. These issues are also present in other RC beams strain
monitoring campaigns20,21,22. Reported in-situ SHM campaigns are also not SRA free23. These issues do not seem
to be isolated to cases with RC though. Indeed, in Bado et al.24 a DOFS monitoring campaign was performed on
bending rebars finalized to the analysis on the possible causes of the rise of SRAs. Anomalistic readings were
recorded beyond 4000με and the authors concluded that, for strains inferior to such level, the most probable cause
of such anomalistic behavior is the concrete’s friction (especially when cracked) against the fiber.
(a) (b)
Figure 1. DOFS-extracted strains profiles versus (a) DOFS coordinates and (b) versus time
Another possible reason for the appearance of such anomalies is offered in Ding et al.25, suggesting that they are
caused by a localized failure of the algorithm that tracks the light impulses through the range length under analysis
and during a particular wavelength sweep. Finally, it should be noted that some deployments of DOFS sees the fiber
being bonded to or with highly heterogeneous materials (for example, concrete), whose structural discontinuities
(joints, cracks, corners, etc.) may significantly affect the readings.
Generally speaking, a strain peak at a DOFS coordinate xk is usually considered as an abnormal reading if it
presents a large difference with previous reading at coordinate xk-1. This is valid both in terms of time and space
(time vector and length vector). Temporally speaking, two consecutive measurements should present similar strain
readings when the time interval between them, and thus their load difference, is almost negligible. Spatially wise,
if to consider that the resolution of both experimental tests ranges between 5 and 10mm, strains simply hardly peak
in neighboring sections without a certain amount of lead-up gradual growth. In some cases, opposite strain peaks in
tension and compression are reported in two neighboring readings which is once again illogical given the short
distances between the two consecutive and theoretically similarly behaving sections. A reading can be considered

Chapter 5. Published Journal Articles | MATTIA FRANCESCO BADO
267
abnormal if large tensile peaks appear in theoretically fully compressed area of the structure or the other way around.
All these reasons suggest that these anomalies are reading errors from the DOFS, fact that is confirmed in various
experimental campaigns19,24 that complemented the DOFS-monitoring with other monitoring tools (strain gauges)
and theoretical models, which did not explain nor present the peaks read by the DOFS.
In Bado et al.24 two types of strain-reading anomalies are identified, harmful and harmless SRAs. The first,
Harmless Anomalies (HL-SRAs) are those strain peaks that, while preventing the correct reading of the strains at a
specific time, still allows it in later instances. Being the nature of this anomaly concentrated in nature (see Figure
2), it is easily identifiable in the strain profile of a section as an excessively large and concentrated peak surrounded
by coherent strain readings. Harmful Anomalies (HF-SRAs), are those strain peaks that are followed strictly by
additional anomalistic readings.
Figure 2. Graphical representation of different SRAs’ theoretical definitions
Hence, from their initial appearance and for the rest of the monitoring period, all the measurements are
considered unreliable. Figure 2 compares the looks of a DOFS reading when affected by a HF-SRA at DOFS
coordinate xk against its neighboring sections (xk-1 and xk+1). Note that this kind of anomalies might be “contagious”,
meaning that the surroundings of an identified HF anomaly might become, in posterior times, an HF-SRA itself.
SRAs, combined with a lack of a universal reliable DOFS/structural support bonding technique, limit DOFS
from becoming a reliable universal strain-reading tool. As a result, SRAs prevent accurate and reliable readings (in
a specific location or along time), extensively increase the level of unreliability of the surrounding measurements
and distort the global and/or local strain trends. In any DOFS-monitored campaign these are crucial undermining
factors which may lead to the actual discarding of such technique. Thus SRAs should be avoided entirely and, if
that is not possible, deleted in the data post-processing phase.

Chapter 5. Published Journal Articles | Mattia Francesco Bado
268
In order to identify all the anomalies in the readings, the trend of every sensing DOFS section has to be studied
and each single anomalistic peak manually corrected and/or removed. Such a tedious analysis may not actually be
viable in many projects considering factors such as large dimensions of the data sets due to wide extensions of
monitoring surfaces or long monitoring periods, time-limitations, financial constraints, lack of qualified personnel
and more.
With an essential contribution from computer technology these issues can be tackled finally making DOFS a
viable performant option for any Structural Health Monitoring campaign. Consequently, the need to develop an
algorithm that automatizes this process to the maximum extent possible. The present paper proposes a post-
processing method aimed at achieving just that. In the following chapters the logical process of the algorithm will
first be explained and later tested on the readings obtained in two case study scenarios.
3. CASE STUDY SCENARIOS
This paper analyses the results of two different DOFS-monitored deployments. The first is a structural laboratory
experimental campaign while the second is a real-life application in a metro tunnel in Barcelona (Spain). In both
cases the monitoring was performed by means of an ODiSI-A (Optical Distributed Sensor Interrogator) OBR
(Optical Backscatter Reflectometer) manufactured by LUNA Technologies26. The ODiSI-A uses swept-wavelength
coherent interferometry to measure temperature and strains. It offers the possibility to test a structure wholly or in
the chosen points of interest with user-configurable sensing resolution and gauge lengths.
The laboratory experiment saw the DOFS instrumenting of two RC ties named 12x12_D12.01 and
12x12_D12.02. The first part is indicative of the cross-sectional dimension of the RC tie (in our case 12cm tall and
12cm wide) whilst the digits following the letter D are representative of the rebar diameter (12mm). Their
longitudinal dimensions are, instead, displayed in Figure 3a. Whilst member 12x12_D12.01 is constituted of a single
prism, 12x12_D12.02 is constituted of two concrete prisms that act completely independently due to the tensile
nature of the test itself. Thus, by means of the resulting uniform distribution of stresses along the rebar during such
test, this layout allows the simultaneous but separate study of two RC ties. The averaged concrete’s compressive
strength is equals to fcm= 39.5MPa, its tensile strength to fctm= 3.1MPa whilst the two modulus of elasticity are
Ecm=32.8GPa for concrete and Esm=200.4GPa for steel. The DOFS is bonded to the steel rebars in order to constantly
monitor its strains when subjected to monotonic tensile load through a Universal Testing Machine (UTM) at a
constant loading speed of 0.1mm/min. The 1.2m long fibers measured the steel’s strains with a spatial resolution of
5mm and 7.5mm and were bonded to them with cyanoacrylate (CYN) adhesive only after it was positioned in a
longitudinal groove that was previously incised along the bar’s rib as in Figure 3b.
Figure 1 above displayed two DOFS strain measurements extracted by the first of these two RC ties. As visible,
despite considering just one strain-DOFS coordinates and one strain-time plot, numerous anomalies are already
visible requiring a hefty hand of post-processing.

Chapter 5. Published Journal Articles | MATTIA FRANCESCO BADO
269
(a) (b)
Figure 3. Illustrations of (a) the geometrical features of the case study RC ties and (b) of the DOFS deployment technique
The in-situ DOFS deployment consisted in the monitoring of the strains in Barcelona’s L9 Metro Sagrera TAV-
Gorg metro tunnels’ inner surface whose structural performance could have been potentially affected by a
residential building being constructed above it at ground level and slightly covering its layout. COTCA S.A.
proposed a DOFS deployment in order to perform a continuous follow-up of the tunnel’s strain and tensional states
during the excavation and construction works happening 14.40m above the tunnel’s keystone.
(b)
(c)
(b)
(a) (c)
Figure 4. (a) Illustration of the tunnel DOFS installation (b) picture of the DOFS coordinates ~45.50m and (c) picture of
DOFS coordinates from ~20-26m

Chapter 5. Published Journal Articles | Mattia Francesco Bado
270
The monitoring scheme involved the installation of a 50m long DOFS bonded to the concrete lining’s inner
surface (Figure 4) by means of epoxy resin after a previous superficial preparation of the concrete lining that
consisted of, firstly, refining the surface’s existing irregularities with sandpaper and, later, applying rubbing alcohol
and special products to avoid grease, air humidity and direct moisture.
Obviously, as with any real world application scenario the installation conditions weren’t the best and the
presence of physical discontinuities could not be avoided. These limitations might lead to a wide range of anomalies
in the readings which emphasizes the need for an appropriate post-processing technique. The DOFS setup provided
strain readings with a spatial resolution of 10mm and was installed along the supposedly most affected tunnel
section, i.e. the one found right below the construction site. Figure 4 shows how, starting from the end, the fiber
covers a complete transversal section (coordinates 50.00m-23.00m), followed by a longitudinal monitoring segment
(23.00m-14.24m) and ending in a partial transversal section coverage (14.24m-10.00m). The remaining 10m are
not bonded to any structural surface and their main goal is aimed at providing sufficient data to perform a
temperature compensation of the strain readings in case of variations during the monitoring period.
Figure 5a presents the OBR strain measurement of a single fiber coordinate at different instances during the
construction period (from October 2018 to May 2019) in the DOFS coordinates interval between 26 and 40m (for
clarity purpose the latter was chosen as it is the most representative of the various kinds of SRA), as well as the
delimitation of the structurally differentiable segments that the fiber covers, which, helps understand why some
areas present a higher amount of anomalies than others. Figure 5b expands on Figure 5a by combining in a 3D
graph the un-processed DOFS strain measurements collected in an exemplary 40-days span. This figure
summarizes the above explained SRAs as it clearly displays how HF-SRAs, after their formation, remain present
for the rest of the monitoring campaign and how HL-SRAs quickly appear and disappear. Furthermore, both
anomalies can be found in both tension and compression hence the strain peaks can be identified on both sides of
the graph.
Figure 5c zooms in Figure 5b in order to display, in combination with Figure 5d, the difference between a HF-
SRA and a damage-induced peak where a crack appears (both figures display the strain profiles of a 0.5m long
DOFS segment). As mentioned earlier, it is crucial not to confuse the two as the unintentional deletion of the
latter would go against the purpose of the test itself. Granted HF-SRAs are a consistent discontinuity against
neighboring data, their appearance due to damage in a RC structure is never perfectly concentrated. Oppositely,
the presence of a certain amount of strain build-up on both sides of a crack can always be detected. This is evident
in Figure 5d which displays a three dimensional view of a DOFS strain monitoring campaign (originally reported
in Bado et al.12) of a Ø12 steel rebar embedded inside a 100x100mm cross-sectional, 600mm long concrete prism
and later tested in tension. In the present figure it is possible to see two successive cracks opening respectively at
time 110s around DOFS coordinate 0.755m and time 217s in DOFS coordinate 0.94m.

Chapter 5. Published Journal Articles | MATTIA FRANCESCO BADO
271
(a)
(b)
(c) (d)
Figure 5. (a) Multiple and (b) all tunnel strain measurements along the monitoring duration (c) with a zoomed section
showing the appearance of a HF-SRA compared against (d) the appearance of damage (cracking) in a RC element

Chapter 5. Published Journal Articles | Mattia Francesco Bado
272
Figure 5d’s results are similar to other DOFS monitoring campaigns’ performed both on the external surface of
a RC member7,27 and inside it (DOFS bonded to rebars)28,29. As a matter of fact, in these campaigns the adjacent
build-ups can assume the aspect of an inverted nosecone cross-section whose base is as small as 20cm and as large
as half a meter. This non-abrupt but relatively gradual rise in strains allows to clearly distinguish the insurgence of
a damage in the structure against a HF-SRA.
The significantly different nature of this paper’s case study deployments allows for the development of a general
and widely applicable post-processing technique on the basis of their collected readings.
4. THE SRAS POST-PROCESSING STEPS
The objective of a post-processing algorithm is to treat the raw strain measurements and obtain a new set of data
that is more reliable and as free as possible of any SRAs-induced distortion. Its core process is based on the
following logical sequence.
1. Automatic detection of SRAs → 2. Removal of SRAs → 3. Substitution by interpolation
The automatic detection of the SRAs is the most crucial part of the process. Being HL-SRAs effectively data
outliers, commonly one would label a data as a potential outlier when the latter’s standard deviation surpasses by a
certain number of folds (usually 2) the mean. Yet, the presence of outliers is likely to have a strong effect on the
mean and the standard deviation themselves thus making this technique pragmatically defective. Elsewise, an outlier
reading can be considered as any value that is more than three scaled median absolute deviation (MAD) away from
the median value within a sliding window. Still this method wouldn’t meet the necessary requirements for detecting
an SRA as it wouldn’t be able to distinguish an SRA from a strain peak caused by a sudden opening of a crack,
impact or load increase effectively removing the data indiscriminately. Furthermore, this method would be unable
to detect HF-SRAs due to the proximity of erroneous strain values subsequent to the first anomalistic reading. As a
matter of fact, no post-processing should be run without a previous thoughtful review of the loading and structural
conditions of the case study one is working on. Indeed, being the objective the deletion of unreliable readings that
do not reflect the real behavior of the monitored structure, care should be taken in the coherence of the peaks
elimination. It should be neither excessive (which would imply a loss of reliable data) nor insufficient (which
wouldn’t allow for interpretation of readings).
For example, as mentioned earlier, if a laboratory experiment involves the evaluation of a structure under impact
loading or up until crack formation, a correct post-processing would have to account for a sudden and high strain
variation between consecutive readings. Thus, the tendency of the raw data should be first identified and only later
can the peaks elimination pattern be defined.

Chapter 5. Published Journal Articles | MATTIA FRANCESCO BADO
273
Just as the strain matrix can be referred to the length vector or the time vector so can the detection of SRAs be
performed along space or time. SRAs in space and time are exemplified in Figure 6.
Figure 6. Strain anomalies detection versus DOFS coordinates (space) and time
Notice that the HL and HF-SRAs displayed in Figure 2 are actually jumps in time. Anomalies in space are
usually of the HL kind hence only appear as a single large peak. An abrupt increase of strain magnitude which
remains constant thereafter (looking like a HF anomaly) could happen, for example, if a single fiber is used to
continuously monitor differently stressed structural surfaces (a beam in bending with the fiber bonded sequentially
on the upper and lower surfaces for instance). In the current case studys, though, such condition is not met as the
fiber is uniquely and continuously bonded to a rebar (for the RC tie case) and the inner tunnel’s ring surface.
The present paper intends to outline two SRAs identification methods used in literature and a novel polynomial
based method. Their algorithms will be displayed in later chapters, for the present moment the elimination and
substitution steps will be dealt with (and their algorithm displayed) with a conforming simplification.
Once the SRAs have been detected the next step is their elimination. Hence, all the detected anomalies are
substituted with a NaN value (which stands for “Not a Number”) as in the flowchart in Figure 7.
Figure 7. Idea behind the detection of SRAs
NaN (or #N/A) is a numeric data type used by a computing software that represents an undefined or
unrepresentative value. As visible later, according to different SRAs detection techniques, specific algorithms are
developed for such eliminations. In order to replace the NaN values with correct interpolation substitutes, there are

Chapter 5. Published Journal Articles | Mattia Francesco Bado
274
two distinct kinds of interpolation; time and space interpolation which correct their respectively located SRAs. Once
again, space interpolation is the only way to delete HF-SRAs. In the strain matrix organization, rows represent the
strains along the fiber at particular times, and columns the strain evolution in time of each monitored point. The
interpolation algorithm goes through each row or each column looking for the NaN readings and substituting them
with an interpolation of the first surrounding reliable strain readings. In order to achieve such when there are
multiple NaN readings in a row, the algorithm uses an auxiliary variable k (see algorithm in Figure 8) which starts
counting how many anomalies follow it.
Figure 8. General SRA substitution algorithm
When the first non-anomalous reading appears, the counter k stops indicating the index distance at which the
algorithm should pick the strain value to interpolate the first one with (the one before the NaN). Together these two
enable the computation of the interpolated values between them (Figure 8).
Indeed, the algorithm is constituted of two parts of which the first actively “looks” for NaN value in the matrix
and the second “looks” for the correct values to achieve the interpolation. If the SRA detection algorithm is
performant enough, through the correct substitution of all NaN values, a fully improved and SRA free strain matrix
is finally achieved.

Chapter 5. Published Journal Articles | MATTIA FRANCESCO BADO
275
5. POST-PROCESSING METHODS
With the logical steps of the algorithm in mind the present paper intends to outline two SRAs identification (and
consequent cleaning) methods used in literature with different levels of sophistication (thus leading to results of
variable quality) and a novel polynomial based method.
5.1 Strain Shift Quality (SSQ) method
Besides strain and temperature readings, the ODiSI-A OBR allows for the computation of the Spectral Shift
Quality (SSQ) of each reading. The SSQ is described by the provider26, as a measure of the reliability of the
corresponding readings by measuring the level of the correlation between the measurement and baseline reflected
spectra as in Equation 1 below.
SSQ =max (Uj(v) ∗ Uj(v − ∆vj))
∑ Uj(v)2 (1)
where:
Uj(v) is the baseline spectrum for a given segment of data
Uj(v − ∆vj) is the measurement spectrum under a strain or temperature variation
∗ is the cross-correlation operator
In other words, it is a function that determines the quality/reliability of a strain reading by correlating the original
baseline measurement and the measurement spectra normalized by the maximum expected value.
According to its definition, the SSQ value remains between 0 and 1, where 1 translates into a perfect correlation
and 0 into an uncorrelated value. The provider states that the data sets are accurate if the SSQ is higher than 0.15
meanwhile, if it is lower, it is very likely that the read strain or temperature has exceeded the measurable range.
In this investigation, the SSQ function is proposed and assessed as a tool for SRAs identification by establishing
a minimum SSQ value, or SSQ threshold, with which one can invalidate a percentage of SRAs. The
minimum/optimal SSQ threshold that allows for the deletion of the highest percentage of SRAs while producing a
physically interpretable set of data is a case by case and trial and error matter. Its only constraint is that it has to be
above 0.15 (as recommended by the ODiSI software manufacturer). Figure 9 depicts the algorithm required to
perform an SSQ data post/processing.
This algorithm requires as input data the strain and SSQ matrices provided directly by the sensing software and
an SSQ threshold below which the respective strain readings will be considered as anomalistic and removed. As
explained above, the output is a new strain matrix with missing data (NaN) replacing the identified anomalies.

Chapter 5. Published Journal Articles | Mattia Francesco Bado
276
Figure 9. SRAs detection and removal with an SSQ tool
Figure 10 illustrates the strains measured in DOFS section 1.0425m of the laboratory test’s member
12x12_D12.01 at different time steps (not seconds) along with each measurement’s relative SSQ value.
Figure 10. DOFS strain measurements compared to their SSQ
What is visible is, first of all, that no clear variation of the SSQ value is present in correspondence to the abnormal
strain peaks (HL-SRAs). Secondly, that it is not uncommon that the SSQ value instead of decreasing in
correspondence to the SRAs, it actually increases thus misleading the reader into thinking that those are of the same
if not higher quality measurements.
Lastly the value of the SSQ seems to oscillate in quality even in intervals where only good strain measurements
are being recorded. This complicates the task of setting an SSQ threshold that distinguishes reliable and unreliable
readings thus increasing the risk of indiscriminately removing reliable data along with unreliable ones.

Chapter 5. Published Journal Articles | MATTIA FRANCESCO BADO
277
This is evident in Figure 11 which illustrates the outcome of an SRA elimination according to different SSQ
threshold values (0.15, 0.25, 0.35 and 0.45) for the laboratory members 12x12_D12.01 and 12x12_D12.02. The
latter is presented in three points in time or loading level differently colored for clarity purposes.
(a)
Figure 11. (a) 12x12_D12.01’s (b to e) and 12x12_D12.02’s SSQ processed strain profiles through different SSQ
thresholds
The gradual decrease of the SRA peaks with the increase of the SSQ threshold is clear but at the same time it is
also noticeable how, for higher ones the trend of originally SRA-heavy segments (such as segment 1.087-1.185m
for 12x12_D12.01 and 0.89-0.97m for 12x12_D12.02) is distorted due to an excessively undiscerning points
deletion. Figure 11e exemplifies the case where the SSQ threshold is so high that almost no point is considered
reliable hence they were all removed. In Figure 11a the SSQ method seems more performant than in Figure 11b to
d which is in line with what was suggested above concerning the variability of the results from case to case.
Additionally, the SSQ threshold that seems to work best for member 12x12_D12.01, SSQ=0.35, is far from
acceptable for member 12x12_D12.02 and vice versa. A universally efficient SRA cleaning method should not
perform in such aleatory way.
In conclusion despite the SSQ is a good tool to clear the largest SRAs and clarifying the profile trend, it is an
excessively rough post-processing tool, unable to consistently provide clean and reliable strain profiles whenever
medium/high levels of accuracy and precision would be required.
5.2. Geometrical Threshold Method (GTM)
In order to identify the SRAs, their own definition could be directly used. Indeed, being these strain readings
sudden and overly large, they imply a great variation between two consecutive readings. On the ground of such, a

Chapter 5. Published Journal Articles | Mattia Francesco Bado
278
maximum strain variation (GT threshold) can be defined and used to identify the appearance of an SRA. This
method will be henceforth referred to as Geometrical Threshold Method (GTM). This SRAs identification process
based on strain ‘jumps’ can be applied both temporally and spatially but is unable to detect nor correct HF-SRA
since, after the first anomalistic reading, another very similar in magnitude follows so whilst the first might be
detected as an SRA, all the following ones will not. Thus this method can only be considered as an HL-SRAs
detection method. Figure 12 depicts the algorithm required to perform a GTM data post/processing.
Figure 12. SRAs detection algorithm with a GTM tool
The presented algorithm shows the detection process of strain jumps between consecutive readings (in time). As
mentioned before, the detection of jumps between nearby readings might also be required, for that, an exchange of
all i and j in the routine would be enough. The possible presence of missing readings in the input strain matrix is
taken into consideration to allow for the combination of different SRAs removal routines. The strain increment
(maxΔ) that identifies the SRA has to be carefully chosen so as to avoid deleting correct jumps (related to cracks or
sudden load increments) and focus only on the anomalistic jumps. Figure 13 below illustrates the outcome of an
SRA elimination according to different thresholds (50, 150, 500 and 1000με). Figure 13b to e should be compared
with the original strains plotted in Figure 11b.

Chapter 5. Published Journal Articles | MATTIA FRANCESCO BADO
279
(a)
Figure 13. (a) Member 12x12_D12.01’s (b to e) and 12x12_D12.02’s strain profiles processed with the GTM method and
different maximum strain thresholds
Once again the removal of the largest SRAs is immediate and the optimal geometrical threshold is for both
members 50με. Once again though, the anomalies that were corrected were strictly HL-SRAs in addition to a certain
amount of profile distortion in the SRAs heavy segments.
5.3. Polynomial Interpolation Comparison Method (PICM)
The Polynomial Interpolation Comparison Method is a routine based on the very simple concept of what is an
error. The core idea is based on the development of an approximated polynomial curve of the case study DOFS
section’s ε-t profile which encompasses the maximum number of reliable strain readings of the profile (effectively
representing its trend). The polynomial degree can vary to provide improved fitting even though, generally speaking,
it should be neither too low (which would lead to non-representative tendencies), nor too high (because the trend
would in return be affected by the concentrated anomalies).
As example, Figure 14 below represents different DOFS sections of member 12x12_D12.02 with the original
data (thin blue) including clear anomalies, the selected polynomial curve in red and finally the corrected data in
green. When the strain matrix includes SRAs of small magnitude it is possible to automatically generate polynomial
fitting curve as in Figure 15a for the experimental member 12x12_D12.01 and Figure 15b for the DOFS tunnel
deployment (approximation ε-t curve in red and pink for two measuring points in critical locations). Instead, when
the strain matrix includes SRAs of high magnitude, developing a trend line would be meaningless since the amount
of SRAs would affect its profile preventing it from reflecting the real behavior of the section (as in Figure 14a).

Chapter 5. Published Journal Articles | Mattia Francesco Bado
280
Figure 14. Strain measurements along time of anomalistic DOFS sections versus their polynomial curve approximations
(in red) of member 12x12_D12.02
(a) (b)
Figure 15. SRAs detection with PICM of (a) laboratory tests and (b) tunnel readings when the SRAs’ magnitude is small
In this case a manual defining and plotting of the curve is possible. The DOFS strain curve is compared to the
polynomial approximation curve resulting in a certain amount of error per measurement.
Following the definition of a maximal error between the two curves’ points, whenever the error is higher than
such established limit, the reading is considered as an SRA. This is achieved through a very simple function that
checks the difference between the reading and its corresponding expected value (belonging to the ε-t curve
approximation) as in Equation 2:
Errori = |εDOFS,i − εAPROX,i|
if Errori > Errormax ⇒ εDOFS,i = SRA
if Errori ≤ Errormax ⇒ εDOFS,i ≠ SRA
(2)

Chapter 5. Published Journal Articles | MATTIA FRANCESCO BADO
281
The choice of the threshold value Errormax has to be, as always, a result of an in-depth study of the measured
tendencies and peaks. Figure 16 depicts the algorithm required to perform a PICM data post/processing.
Figure 16. SRAs detection algorithm with a PICM tool
The latter requires as input data the raw strain matrix, its previously developed polynomial fit and a maximum
error that is accepted between them (maxError). The difference between the matrices is computed and, when it
exceeds the maximum error, the polynomial fit matrix element substitutes the strain matrix one. As mentioned for
the GTM routine, the maximum error has to be carefully defined to avoid the removal of correct strain
measurements. Figure 1 displayed in red the outcome of a PICM post-processing of one of the 12x12_D12.01
member’s DOFS strain profiles. Expectedly all the peaks were removed providing us with a clear and
distinguishable outline. Similarly, Figure 17 displays respectively the raw strain profiles as extracted by the OBR
from member 12x12_D12.02 at three points in time or loading level, a representation of the stitching job performed
by the post-processing algorithm versus the original data and finally the much improved SRA-free output.
It should be noted though that, as per the other methods, in the presence of too many consecutive SRAs, their
removal and interpolation might lead to segments of the graph with a higher degree of uncertainty. This is the case
of the profile corresponding to the bare segment of the rebar between the two concrete blocks (0.89-0.97m). The
same could be stated for member 12x12_D12.01 for DOFS coordinates 1.095-1.178m. Yet, thanks to this method’s
ability to recognize reliable values in between SRAs, the overall unreliability of the PICM extracted profile is clearly
inferior to the SSQ’s and GTM’s.

Chapter 5. Published Journal Articles | Mattia Francesco Bado
282
(a) (b) (c)
Figure 17. Member 12x12_D12.02’s (a) original strain profiles (b) processed with the PICM method and (c) finally the
output
6. POST-PROCESSING RESULTS OF REAL-LIFE CASE STUDY SCENARIO
In the present chapter the above explained post-processing algorithms are used to clear out the SRAs from the
strain matrix originated by the in-situ tunnel monitoring along 300 days.
The first adopted method is the SSQ. As can be seen in the Figure 18b to d, different SSQ thresholds provide
different outcomes compared to the original strain data represented in Figure 18a. An obvious aspect of this figure
is that the total amount of SRAs decreases as the SSQ threshold increases. Despite still presenting a significant
amount of anomalies (in particular HF-SRAs), the best fit (surrounded in red) can be achieved after the removal of
the measurements with associated SSQ values lower than 0.30.A lower threshold, presents an uninterpretable set of
data due to an excessive amount of SRAs, whilst a higher one translates into too many measurements being deleted.
Despite the global trend can be distinguished, the graphs are still plagued by enough SRAs to lead to
interpretation confusion which is detrimental when monitoring the need for emergency maintenance into the tunnel.
Thus, SSQ cannot be considered a reliable post-processing method.
Passing on to GTM, when approaching an SHM monitoring of a real case scenario with this post-processing
analysis, a lot of care should be taken when deciding the threshold. Indeed, when the structure’s future behavior is
completely unknown to the engineer, it may suffer large strains peaks (for example due to the appearance of cracks
or impacts) which might but should never be confused with SRAs. This is particularly valid when DOFS are bonded
to the structure’s external structural surface (as seen in literature19,23) as is the case for the present study scenario.
In this case a GTM analysis should be performed in the direction where there are the least expected sudden strain
jumps; along space (along the DOFS coordinates). Thus, assuming that in the present case the strains do not vary
more than 250με in less than 10mm (not even when cracking is considered) the resulting GTM post-processing is
represented in Figure 19a.

Chapter 5. Published Journal Articles | MATTIA FRANCESCO BADO
283
(a)
(b) (c) (d)
Figure 18. (a) DOFS-extracted strain measurements of segment 10-50m and (b to d) the result of SSQ post-processing
for different SSQ thresholds
(a) (b)
Figure 19. GTM post-processed DOFS-extracted strain measurements for a geometrical threshold of (a) 250με and (b)
50με
Despite the actual size of the SRAs is not excessive, their disproportionate amount still present in the post-
processed surface plot implies the poor performance of GTM as a post-processing tool for an in-situ superficial

Chapter 5. Published Journal Articles | Mattia Francesco Bado
284
monitoring. Even when lowering the Geometrical Threshold to 50με (Figure 19b) a large number of anomalies
would still be present. Moving on to the PICM analysis, given the original data matrix (plotted in Figure 20a), the
best polynomial fit is calculated for the evolution of the strains in each DOFS coordinate along time (as exemplified
by Figure 15b) which, combined together, provide the polynomial fit represented in Figure 20b.
(a) (b)
(c)
Figure 20. (a) Original DOFS extracted strain evolution in time which, when combined with (b) a polynomial fit, results in
(c) PICM processed output
Despite not being composed of actual measured points, Figure 20b already provides a good feeling of the strain
evolution in each segment of the tunnel.
When finally developing a PICM comparative fit between the original data (Figure 20a) and its extracted trend-
lines (surface in Figure 20b), the post-processed output of the strain matrix (Figure 20c) is a much improved surface
plot compared to its original state. Indeed, having been the largest amount of SRAs successfully eliminated, the
layout is immediately clearer and strictly composed by actual DOFS reliable measurements.

Chapter 5. Published Journal Articles | MATTIA FRANCESCO BADO
285
7. POST-PROCESSING METHODS COMPARISON
In the previous sections the inner workings of each post-processing algorithm were discussed along with a look
at their performance. A final comparison amongst these is presented in the following by putting side to side strictly
the output of the analysis that performed best (in case of SSQ and GTM the thresholds that provided the highest
amount of SRAs correction) for each post-processing method. Figure 21 below summarizes the latter by collecting
the plots whose parameters provide the best fit to the reliable points of the original DOFS extracted strain profiles
for member 12x12_D12.01 and 12x12_D12.02.
12x12_12.01 12x12_D12.02
Figure 21. SRA-cleaning post-processing methods comparisons for member (a to d) 12x12_D12.01 and (e to f)
12x12_D12.02
For members 12x12_D12.01 and 12x12_D12.02 their respective SSQ thresholds are 0.35 and 0.25 whilst
their selected GTs’ is 50με for both. Figure 21 shows how for all diagrams removing the HL-SRAs provides
a relatively trust-worthy diagram. For member 12x12_D12.01, the only method that not only takes advantage
of all the reliable points to plot the graph but also extracts a somewhat symmetrical profile is the PICM
method. Oppositely, SSQ and GTM (the former more than the latter) undiscriminatingly removed the data in
the right branch of the graph thus giving it a false inclination that does not envelop nor represent the points
there present. The strain profiles of member 12x12_D12.02 are quite rectilinear, thus decisively compatible

Chapter 5. Published Journal Articles | Mattia Francesco Bado
286
with a rougher anomalistic detection and removal method such as SSQ and GTM. For this reason, the profile
extracted from these methods are quite similar to PICM´s in Figure 21f.
Moving on to the tunnel monitoring, once again PICM seems to be the method that provides the best results
as can be seen in Figure 22.
(a) (b) (c) (d)
Figure 22. SRA-cleaning post-processing methods comparisons (b) SSQ, (c) GTM and (d) PICM for the in-situ tunnel
monitoring versus (a) the original strains
As a matter of fact, almost all SRAs are removed whilst in the other two cases only partially. As proven by the
SSQ and GTM results, HF-SRAs is the kind of anomaly that proves to be the hardest to remove due to its hard
detection. Despite such, PICM successfully proceeds to eliminate these too.
In conclusion, considering both the post-processing results extracted from the laboratory RC ties test and the
tunnel monitoring, the most consistently reliable method is PICM as it delivered trust-worthy mostly-SRA-free
strain profiles for both. This should definitely be the preferable post-processing technique for monitoring cases
where precision is a hard requirement such as laboratory work and detailed analysis aimed at taking important
intervention decisions (such as the case of the in-situ monitoring). As previously suggested the SSQ and GTM
methods are faster and simpler but cruder post-processing approaches adapt only for quick and general checks.
A Strengths Weaknesses Opportunities Threats (SWOT) graph encapsulating all of the previous points is
suggested in Table I. It summarizes the advantages and disadvantages of each post-processing method thus helping
in the choice of most fitting method for different applications.
Table I. Strengths Weaknesses Opportunities Threats (SWOT) graph
STRENGTHS WEAKNESSES
SSQ
- Low computational cost thus speed
- largest SRAs treatment
- Roughly clarifies global trend
- No consistent correlation between anomalies
and SSQ values
- Complicated SSQ threshold setting
- High risk of indiscriminately removing reliable
data along with SRAs
GTM
- Medium computational cost thus speed
- Based on anomalies’ definition
- Able to detect HL SRAs
- Unable to detect HF SRAs
- Complicated jump threshold setting
- Profile distorts in SRAs heavy segments

Chapter 5. Published Journal Articles | MATTIA FRANCESCO BADO
287
PICM
- Based on simple error concept
- Able to detect both HL & HF SRAs
- Provides clear, distinguishable and
physically interpretable outline
- High computational cost
- Not fully automatized as it requires manual
fitting in SRAs heavy segments.
OPPORTUNITIES THREATS
SSQ - SSQ values are computed by the OBR
itself thus providing quick results
- More performant post-processing techniques
with same speed and higher quality results
GTM
- Especially performant with
linear/monotonic loading processes and
strain profiles
- It is neither the fastest nor the most performant
thus alienating a large chunk of potential users
- Non-linear loading processes and strain
profiles
PICM
- Efficiency does not depend on loading
processes nor strain profile shape
- Works well both for a controlled and
monitored environment (lab test) and
uncertainly behaving structures (real-life
applications).
- High computational and time cost may lead to
its discarding
- Hard requirement of being performed by an
expert
8. CONCLUSIONS
Despite Distributed Optical Fiber Sensors (DOFS) hold huge advantages over classic civil engineering strain
monitoring tools, their applicability is limited by sudden disruptive strain reading anomalies (SRAs) that seem to
be inherent to the measuring principle of backscattering taking place in DOFS. These unreliable points usually take
the form of large, out of scale strain peaks or isolated drastic upsurge of strain order of magnitude. These anomalies
are not necessarily deal breaking as the DOFS extracted data can be treated with a process of SRA detection,
elimination and finally substitution. The present paper discussed different ways of performing these tasks. The core
algorithm of two methods previously used in literature (Spectral Shift Quality and Geometrical Threshold Method)
and of a novel polynomial based one (Polynomial Interpolation Comparison Method) was shown and applied to
two case study scenarios in order to test their performance. These two scenarios were an experimental laboratory
test on two Reinforced Concrete (RC) tensile elements (ties) and an in-situ metro tunnel monitoring campaign. The
resulting outputs showed the ability of each of these methods to remove the erroneous and damaging strain readings
despite large performance discrepancies. Indeed, despite providing a quick and small computational taxing analysis,
the classic methods (SSQ and GTM) were not able to clear out all SRAs in the case of the tunnel monitoring and
provided relatively distorted strain profiles in the case of the two RC ties. The novel polynomial based strain
interpolation method (PICM), instead, provided output plots free of any strain peak and with the minimum amount
of distortion for both. As a result, the latter is identified as the best SRA cleaning post-processing method when
accurate and reliable measurement are required.
REFERENCES

Chapter 5. Published Journal Articles | Mattia Francesco Bado
288
1. Brownjohn, J. M. W. Structural health monitoring of civil infrastructure. J. Philosofical Trans. A Math. Phys.
Eng. Sci. 365, 589–622 (2006).
2. Housner, G. W., Bergman, L. A., Caughey, T. K., Chassiakos, A. G., Claus, R. O., Masri, S. F., Skelton, R. E.,
Soong, T. T., Spencer, B. F., Yao, J. T. P. Structural control: Past, present and future. J. Eng. Mech. 123, 897–
971 (1997).
3. Baker, M. Sensors power next-generation SHM. Sherbone Sensors (2014).
4. Inaudi, D. et al. Monitoring of a concrete arch bridge during construction. Proc. SPIE - Int. Soc. Opt. Eng.
4696, 146--153 (2002).
5. Rodríguez Guitiérrez, G. Concrete structrues monitoring by means of Distributed Optical Fiber Sensors. (Ph.D.
Thesis, Universitat Politècnica de Catalunya, 2017).
6. Inaudi, D. & Glisic, B. Distributed Fiber optic Strain and Temperature Sensing for Structural Health
Monitoring. in Proceedings of the 3rd International Conference on Bridge Maintenance, Safety and
Management - Bridge Maintenance, Safety, Management, Life-Cycle Performance and Cost 964 (2006).
7. Villalba, S. & Casas, J. R. Application of optical fiber distributed sensing to health monitoring of concrete
structures. Mech. Syst. Signal Process. 39, 441–451 (2013).
8. Todd, M. D., Johnson, G. A. & Vohra, S. T. Deployment of a fiber bragg grating-based measurement system
in a structural health monitoring application. Smart Mater. Struct. 10, 534–539 (2001).
9. Ye, X. W., Su, Y. H. & Han, J. P. Structural health monitoring of civil infrastructure using optical fiber sensing
technology: A comprehensive review. Sci. World J. 2014, (2014).
10. Barrias, A., Casas, J. R. & Villalba, S. A Review of Distributed Optical Fiber Sensors for Civil Engineering
Applications. Sensors 16, 748 (2016).
11. Davis, M., Hoult, N. A. & Scott, A. Distributed strain sensing to determine the impact of corrosion on bond
performance in reinforced concrete. Constr. Build. Mater. 114, 481–491 (2016).
12. Bado, M. F., Kaklauskas, G. & Casas, J. R. Performance of Distributed Optical Fiber Sensors (DOFS) and
Digital Image Correlation (DIC) in the monitoring of RC structures. IOP Conf. Ser. Mater. Sci. Eng. 615,
12101 (2019).
13. de Battista, N., Harvey, R. & Cheal, N. Distributed fibre optic sensor system to measure the progressive axial
shortening of a high-rise building during construction. in 39th IABSE Symposium - Engineering the Future
(2017).
14. Inaudi, D. & Glisic, B. Application of distributed Fiber Optic Sensory for SHM. in 2nd International
Conference on SHMII 163–172 (2006).
15. Shi, B. I. N., Sui, H., Liu, J. I. E. & Zhang, D. A. N. The BOTDR-based distributed monitoring system for
slope engineering engineering. in Proceedings of the 10th IAEG International Congress, Nottingham, UK 6–
10 (2006).
16. Iten, M. Novel Applications of Distributed Fiber-optic Sensing in Geotechnical Engineering. ETH Zurich
Research Collection (Ph.D. Thesis, ETH Zurich, 2011). doi:https://doi.org/10.3929/ethz-a-6559858
17. Casas, J. R., Villalba, S. & Villalba, V. Management and Safety of Existing Concrete Structures via Optical
Fiber Distributed Sensing. in Maintenance and Safety of Aging Infrastructure. Structures and Infrastructures
Book Series, Vol. 10 (ed. CRC Press Taylor & Francis Group) 217–245 (2014). doi:10.1201/b17073-9
18. Nurmi, S., Mauti, G. & Hoult, N. A. Distributed Sensing to Assess the Impact of Support Conditions on Slab
Behavior. in Proceedings of the International Association for Bridge and Structural Engineering (IABSE)
Symposium 1478–1485 (2017).
19. Barrias, A., Casas, J. R. & Villalba, S. Embedded Distributed Optical Fiber Sensors in Reinforced Concrete
Structures—A Case Study. Sensors 18, 980 (2018).
20. Brault, A., Nurmi, S. & Hoult, N. A. Distributed Deflection Measurement of Reinforced Concrete Elements
Using Fibre Optic Sensors. in Proceedings of the International Association for Bridge and Structural
Engineering (IABSE) Symposium 1469–1477 (2017).

Chapter 5. Published Journal Articles | MATTIA FRANCESCO BADO
289
21. Brault, A. & Hoult, N. Distributed Reinforcement Strains: Measurement and Application. ACI Struct. J. 116,
115–127 (2019).
22. Brault, A. & Hoult, N. A. Monitoring reinforced concrete serviceability performance using fiber-optic sensors.
ACI Struct. J. 116, 57–70 (2019).
23. Barrias, A., Rodriguez, G., Casas, J. R. & Villalba, S. Application of distributed optical fiber sensors for the
health monitoring of two real structures in Barcelona. Struct. Infrastruct. Eng. 2479, 1–19 (2018).
24. Bado, M. F., Casas, J. R. & Barrias, A. Performance of Rayleigh-Based Distributed Optical Fiber Sensors
Bonded to Reinforcing Bars in Bending. Sensors 23 (2018). doi:10.3390/s18093125
25. Ding, Z. et al. Distributed Optical Fiber Sensors Based on Optical Frequency Domain Reflectometry : A
review. Sensors 1–31 (2018). doi:10.3390/s18041072
26. LUNA Technologies. ODiSI-A Optical Distributed Sensor Interrogator (Users Guide). (2013).
27. Davis, M., Hoult, N. A. & Scott, A. Distributed strain sensing to assess corroded RC beams. Eng. Struct. 140,
473–482 (2017).
28. Bassil, A. et al. Distributed fiber optics sensing and coda wave interferometry techniques for damage
monitoring in concrete structures. Sensors (Switzerland) 19, (2019).
29. Berrocal, C. G., Fernandez, I. & Rempling, R. Crack monitoring in reinforced concrete beams by distributed
optical fiber Crack monitoring in reinforced concrete beams by distributed optical fiber sensors. Struct.
Infrastruct. Eng. 0, 1–16 (2020).

Chapter 5. Published Journal Articles | Mattia Francesco Bado
290

Chapter 6. Conclusions | MATTIA FRANCESCO BADO
291
Chapter 6. Conclusions
Chapter 6.1 General conclusions
Structural Health Monitoring (SHM) can be understood as the continuous or regular measurement and analysis
of key structural and environmental parameters under operating conditions, for the purpose of warning of abnormal
states or accidents at an early stage. The employment of a novel cutting edge strain monitoring tool named
Distributed Optical Fiber Sensors (DOFS) as SHM tool is becoming increasingly common. Its popularity can be
attributed to multiple reasons, the most important of which are the possibility of performing completely spatially
distributed monitoring with sampling points at distances smaller than 1 mm, the high degrees of deployment
configuration complexity thanks to DOFS’ size and minimal stiffness, ease of deployment and resistance to electro-
magnetic interference, corrosion and extreme temperatures.
Due to the inherent nature of SHM, though, up to now, the most common DOFS applications are the monitoring
of already built structures and substantiation of their suitability to continue performing as per design. Consequently,
most DOFS deployments see their bonding to the external surfaces of RC structures. Yet, a novel way of deploying
DOFS that has taken hold in the later years consists in adopting DOFS to monitor the evolution of the strains present
on the inside of a Reinforced Concrete (RC) structure i.e., bonding DOFS to the surface of embedded reinforcement
bars (rebars) or directly in the concrete mass. Due to its recency, this application is characterized by a large untapped
potential. Indeed, SHM-wise, this continuous and highly sensitive embedded monitoring system provides access to
the ability of starting to detect deformations and damage as early as their appearance inside the structure (versus
having to wait for their appearance on the external surface). It can be also used to derive the deflections in selected
points of the structure by wise-integration of the obtained strain profiles. This superior deformation and damage
detection potential can very well help replacing the current time-based inspection model with one based on a
performance or risk-based approach. As a consequence, today’s maintenance paradigm could shift from corrective
to preventive, resulting in tremendous savings in infrastructure maintenance and a reduction of its associated social
impact.

Chapter 6. Conclusions | Mattia Francesco Bado
292
Yet, when deploying DOFS inside RC structures several phenomena may jeopardize the extractable results.
Among these the non-neglectable possibility of fiber alteration/damage during the pouring of concrete and the
possibility of erroneous measurements induced by the friction and/or clamping of the DOFS from the part of
concrete aggregates. Whilst the deployment of DOFS with several claddings and coatings could compensate for
these issues, the presence of a certain lag in the transmission of strains from the monitored surface to the DOFS’s
silica core reduces the accuracy of the measurements and corrections are necessary to account for the strain lag
between the fiber core and the substrate. Being the strain transfer process dependent on both mechanical and
geometrical properties of the different intermediate layers i.e., their elastic modulus and height, for those particular
applications that require the maximum precision possible, DOFS with the minimal intermediate layers should be
selected. Consequently, the preferable DOFS for such application would be a thin, simply cladded, non-coated
DOFS. In this case, though, the DOFS protective function against external damage is not undertaken anymore by
DOFS coating layers but falls entirely on the adhesive layers with which the fibers are bonded.
Consequently, the objective of the present thesis was to improve the viability of coating-less DOFS deployments
inside RC structures for Civil and Structural Engineering SHM. This objective was translated as extracting
methodologies and techniques for the reduction of Strain Reading Anomalies (SRAs) in DOFS-extracted strain
measurements caused by damage/friction/clamping in the DOFS-concrete interface. This was tackled both with a
preventive approach based on experimental laboratory work (where the optimum bonding techniques are
investigated) and with a corrective one based on algorithmic data post-processing.
Starting from the former, the following experimental observations were collected:
The DOFS strain profiles sampled from instrumented bare rebars strongly coincided with the ones sampled
by means of other strain monitoring tools such as extensometer and strain gauges, both in tension and in
bending. This speaks volume about the potential of DOFS to fully substitute classic strain monitoring tools;
No SRAs were present in the DOFS strain outputs extracted from bare rebars confirming that their origin is
related to the damage/friction/clamping occurring in the presence of concrete;
When testing DOFS-instrumented bare rebars both in tension and bending, no adhesive-induced shear lag
was found in the presence of small strain gradients no matter if the adhesives were characterized by large or
small shear stiffness;
Oppositely, in the presence of larger strain gradient, the extracted DOFS strain profiles had clear evidence of
adhesive-induced strain lag which seemingly redistributed the strains from zones with high concentration to
neighboring ones. This was found to be true both in the presence and absence of concrete around the
reinforcing bars;

Chapter 6. Conclusions | MATTIA FRANCESCO BADO
293
The shear lag hampering the accuracy of DOFS-extracted strain measurements increases in the presence of
bonding adhesives with smaller stiffness. The largest amount of strain lag and strain redistribution was found
in the presence of Silicone which is characterized by a small shear modulus;
The SRA-preventing potential of different DOFS deployment techniques was tested. These were (a) simply
positioning the DOFS in the concavity created by the longitudinal ridge (after removing the mill-scale and
degreasing the area with acetone) and gluing them with cyanoacrylate (CYN) adhesive; (b) bonded like in
(a) with the addition of a protective layer of a one-component water-proof oxygen-free silicone (SI) rubber;
(c) positioning the DOFS in a 1.5x1.0mm superficially incised groove before proceeding to its gluing by
means of cyanoacrylate adhesive. Whilst none of the studied bonding techniques could completely guarantee
the removal of all SRAs, the combination of a longitudinally incised groove + CYN + SI was the one that led
to the smallest amount of SRAs, thus preserving the readability and reliability of the strain data;
This conclusion was confirmed to be valid both for RC members tested under concrete-shrinkage induced
compression, tension and bending;
An unexpected phenomenon, possibly connected to the under-performance of the groove + CYN + SI
deployment technique, caused an alteration of the DOFS strain readings whenever the fiber was in the
presence of extra bending-induced tension and concrete cracking. This could be once again attributed to the
shear lag and strain redistributing properties of SI. Therefore, despite its superior performance compared with
other bonding techniques, the combination of groove + CYN + SI suffers gravely from such issue and thus
cannot be referred to as an ideal DOFS-rebar bonding technique but simply as the most performant among
the studied ones;
Despite the combination of groove + CYN + SI represents a step forward for SHM campaigns performed
with un-coated DOFS, the presence of shear lag even for very low shear thickness of the bonding agent when
the shear modulus is low (SI), and the strain measurement alteration goes against the original idea of finding
a substitute to coated DOFS due to the latter’s tendency to suffer shear lag issues. The inconclusiveness of
this result is further deepened by the results of a monitoring campaign on several RC beams with DOFS
embedded inside them. In particular, the latter deployed inside the RC beam both coated and non-coated
DOFS. Note that former had a rather stiff coating. Despite a certain lag was present between the
measurements performed by the two, was quite small and of similar magnitude to the silicone induced lag
possibly present whenever deploying DOFS with the groove + CYN + SI technique.
If to summarize all of the above points the following statement can be reported. Whilst the groove + CYN + SI
DOFS deployment succeeds in minimizing the number of SRAs occurring due to friction/clamping of the fiber from
the part of the surrounding concrete, the measurement altering shear lag issue is here equally as present and
hampering as in the case of coated DOFS due to the low shear stiffness of the silicone. In the end, a correct balance

Chapter 6. Conclusions | Mattia Francesco Bado
294
between the stemming of SRAs and the insurance of measurement accuracy in areas characterized by high strain
gradients (close to discontinuities) has to be achieved. This balance lays on two aspects to be decided when planning
monitoring campaigns with DOFS: the shear stiffness of the bonding material and the ability to effectively remove
SRAs from the recorded strain profiles, a posteriori. In this sense the following conclusions were obtained:
Unless future developments come up with a methodology to reduce the strain shear lag caused by the presence
of fiber coatings, the inaccuracy magnitude spawned by the presence of set coating is similar to the one
spawned by the shear deformation of SI in the groove + CYN + SI deployment method. Thus, being the
deployment of coated DOFS less labor-intensive than the deployment of non-coated DOFS by means of the
groove + CYN + SI technique, the former automatically qualify as the superior DOFS monitoring technology
for embedment inside RC structures. Note, that this conclusion is valid only for fiber coatings with elevated
shear stiffness. This conclusion is particularly valid for the SHM of novel RC structures and in general for
the Civil Engineering field;
For the Structural Engineering field and in particular for laboratory experimentation, commonly elevated
DOFS measurement accuracy levels are required and no amount of shear lag should be contemplated. Thus,
the SRA elimination heavy lifting should be entirely performed entirely by post-processing algorithms.
Among the examined algorithms the one guaranteeing the best performance was the newly introduced
Polynomial Interpolation Comparison Method (PICM);
Note that, as delved into later, changing the geometrical characteristics of the groove could be the solution
for accurate shear-lag free non-coated DOFS strain measurements when embedded inside RC structures.
Chapter 6.2 Future developments
Further research is required to determine the influence of the depth and shape of the groove (in which the
DOFS is positioned before being bonded) on the shear lag effect. It is entirely possible that the shear
deformations of the silicone are focused in just its superficial layers whilst deeper ones remain unaltered. If
this were correct, deeper grooves would help minimizing the shear lag effect thus making groove + CYN +SI
the definitive DOFS deployment technique when using coated-less fibers;
If this were incorrect further research would be required on substituting SI with an equally protective adhesive
that does not suffer as much from shear deformation, thus leaving the transfer of the strains from the
monitored surface to the DOFS unaltered;
Finally, future research should be dedicated to the engineering of a DOFS coating material that would allow
simultaneous high level of protection from any friction, clamping and damage occurring on the DOFS-
concrete interface, smallest shear lag possible, minimal intrusiveness and relatively high sensor flexibility.

295

296
Mattia Francesco BADO PERFORMANCE OF DISTRIBUTED OPTICAL FIBER SENSORS EMBEDDED INSIDE REINFORCED CONCRETE STRUCTURAL ELEMENTS
Departament d’Enginyeria Civil i Ambiental
Programa de Doctorat d’Enginyeria de la Construcció
Copyright © 2022 FDOKUMEN